Article

Screening and Identification of Drought-Sensitive and Drought-Tolerant Poplar Germplasm Based on Short-Term Physiological and Biochemical Differences

1
Henan Academy of Forestry, Zhengzhou 450008, China
2
Henan Yanyang Old-Yellow-River Sand-Dune Ecosystem National Positioning Observation and Research Station, Zhengzhou 450002, China
3
College of Forestry, Nanjing Forestry University, Nanjing 210037, China
4
Co-Innovation Center of Sustainable Forestry in Southern China, Nanjing Forestry University, Nanjing 210037, China
5
College of Environmental Ecology, Jiangsu Open University, Nanjing 210036, China
6
College of Landscape Architecture, Nanjing Forestry University, Nanjing 210037, China
*
Authors to whom correspondence should be addressed.
Forests 2025, 16(11), 1750; https://doi.org/10.3390/f16111750
Submission received: 30 October 2025 / Revised: 15 November 2025 / Accepted: 18 November 2025 / Published: 20 November 2025

Abstract

Drought responses in poplar are genotype-dependent, yet standardized metrics for quantifying drought tolerance remain scarce. Here, we employed logistic modeling of relative electrolyte leakage (REC) for the first time in poplar to derive clone-specific semi-lethal polyethylene glycol (PEG) concentrations (LC50), transforming a traditional descriptive assay into a quantitative, high-throughput drought-injury metric. Six elite Populus cultivars were exposed to increasing PEG concentrations, and their REC curves were fitted using a logistic function (R2 = 0.885−0.981). The derived semi-lethal PEG concentration (LC50) ranged from 7.99% in ‘PZ1’ (drought-sensitive, SS) to 13.44% in ‘YX2’ (drought-tolerant, ST), enabling clear classification. Under 10% PEG stress, ST maintained leaf water content (LWC) at 73%, while SS dropped to 63%. Malondialdehyde (MDA) content doubled in SS (44.7 nmol·g−1 FW) but increased by only 25% in ST (33.5 nmol·g−1 FW). Gas exchange analysis revealed that SS exhibited approximately twice the reduction in net photosynthetic rate (Pn), transpiration rate (Tr), and stomatal conductance (Gs) compared to ST, with intercellular CO2 accumulation (Ci) occurring only in SS—indicating both stomatal and non-stomatal limitations. Osmolyte profiling showed that SS accumulated large amounts of soluble sugars (Ss) (+128%) and proline (Pro) (+230%), whereas ST maintained stable soluble protein (Sp) levels and only moderately increased proline (+120%). Antioxidant capacity differed markedly: catalase (CAT), superoxide dismutase (SOD), and peroxidase (POD) activities increased by 5.6-, 1.8-, and 2.0-fold in ST, respectively, compared to 3.4-, 1.3-, and 1.7-fold in SS. Principal component analysis (PCA) and orthogonal partial least squares discriminant analysis (OPLS-DA) of ten physiological traits explained 89% of the total variance (R2X = 0.954, Q2 = 0.973), identifying POD, SOD, CAT, and Pro as the most discriminative variables (VIP > 1). This four-marker signature converts a conventional dose–response assay into a rapid, low-cost screening module that can be deployed in robotic phenotyping platforms. Specifically, the high-ranking genotype ‘YX2’ is recommended for immediate use in water-limited plantations and as a robust parent for next-generation dryland breeding programs.

1. Introduction

Drought, as a natural stress prevalent across climatic zones, affects nearly all terrestrial ecosystems worldwide [1]. Its severity is dictated by the frequency, duration and intensity of the water deficit [2]. Global warming is markedly increasing both the frequency and intensity of drought episodes, elevating drought to one of the primary environmental threats facing agriculture and forestry in the 21st century [3]. As a major abiotic stressor, drought primarily restricts plant growth and development by disrupting cellular and whole-plant water status [4]. This perturbation propagates to all key physiological processes, impairing stomatal function and gas exchange, accelerating the generation of reactive oxygen species (ROS) and promoting membrane lipid peroxidation (measured as MDA) [5]. Ultimately, drought reduces growth and productivity; prolonged exposure can be lethal to sensitive genotypes [6]. To cope with water deficit and attendant oxidative stress, plants activate two inter-related protective modules. First, osmotic adjustment: accumulation of proline, soluble sugars and proteins that sustain cell turgor and preserve sub-cellular architecture [7]. Second, antioxidant defense: up-regulation of ROS-scavenging enzymes—superoxide dismutase (SOD), catalase (CAT) and peroxidase (POD)—that mitigate oxidative damage [8]. Plant drought research often reports antioxidants, osmolytes, and membrane injury separately. The causal link among ROS burst, lipid peroxidation, and osmotic protection is still unclear. Reliable markers for breeding are scarce. Prior drought exposure has been shown to modulate antioxidant and osmolyte responses in a woody perennial [9]. Systematic analysis of physiological responses across a drought gradient is therefore a prerequisite for screening drought-tolerant germplasm and for developing resilient cultivars [10].
Poplar (Populus spp.) is a pivotal forestry and bioenergy crop. Its rapid growth, high productivity and broad ecological adaptability have made it the most important short-rotation species in temperate and semi-arid regions [11]. Prior drought exposure has been shown to modulate antioxidant and osmolyte responses in a woody perennial [9]. Nevertheless, survival and yield differ markedly among clones under water-limited conditions, severely constraining the deployment of superior genotypes [12]. Current research has focused on a limited number of varieties, and systematic comparisons of drought tolerance across multiple cultivars and traits remain scarce [13]. The electrical conductivity method provides a sensitive and stable proxy for stress-induced injury, exhibiting a negative correlation with plant survival [14]. Fitting a logistic function to the leaf relative electrolyte conductivity (REC) response across stress gradients yields the half-lethal concentration (LC50), enabling rapid, quantitative estimation of stress resistance. Establishing a REC–LC50-based drought-tolerance evaluation framework for poplar should therefore enhance high-throughput screening efficiency.
Polyethylene glycol (PEG)-6000 is routinely used to impose a rapid, repeatable osmotic gradient that minimizes soil-matrix heterogeneity and enables millimetre-scale control of the root-zone [15]. PEG thus provides a powerful high-throughput screen, but it cannot reproduce the gradual soil drying that generates pulsatile root-to-shoot ABA signals, hydraulic failure or the rhizosphere microbial dynamics characteristic of field drought [16]. Accordingly, data obtained with PEG are interpreted here as a proxy for osmotic tolerance; verification in soil columns and multi-site field trials will precede any breeding deployment. Here, six poplar cultivars were subjected to PEG-6000–simulated drought gradients. A logistic function fitted to REC data furnished cultivar-specific LC50 values, thereby quantifying physiological drought-tolerance thresholds and allowing cultivars to be categorized as sensitive or tolerant. Representative cultivars from each group were then used to dissect differential patterns of oxidative damage, photosynthetic performance, osmolyte accumulation and antioxidant enzyme activity. We specifically examined whether tolerant genotypes accumulate more osmolytes, show superior ROS detoxification and suffer lower membrane injury. Orthogonal projections to latent structures discriminant analysis (OPLS-DA) identified the core physiological indicators most strongly associated with drought tolerance. The study aims to identify elite varieties suitable for afforestation in arid regions and to establish a diagnostic platform for poplar drought tolerance, providing both theoretical insights and practical tools for precision breeding.
We hypothesized that (i) LC50 positively correlates with drought tolerance, (ii) tolerant clones sustain water content and photosynthesis via moderate osmolytes and tight stomata, and (iii) POD+SOD+CAT+Pro constitute the core antioxidant signature discriminating sensitivity.

2. Results

2.1. Changes in REC in Different Poplar Varieties Under PEG-Induced Drought Stress

Logistic functions fitted the relative electrolyte conductivity (REC) response curves of six poplar cultivars under PEG-6000 stress with coefficients of determination (R2) ranging from 0.8848 to 0.9807, confirming that the model accurately captured the stress-response dynamics of each genotype (Figure 1). The derived half-lethal PEG concentration (LC50) differed significantly among cultivars: ‘YX2’ exhibited the highest LC50 (13.44%), followed by ‘YX3’ (12.29%) and ‘YX1’ (11.15%), whereas ‘PZ1’ displayed the lowest LC50 (7.99%). ‘ZX1’ and ‘PZ2’ occupied an intermediate position, with LC50 values of 9.67% and 9.25%, respectively.
These data establish that ‘YX2’, ‘YX3’ and ‘YX1’ possess superior tolerance to PEG-simulated drought, whereas ‘PZ1’ is the most sensitive. Consequently, ‘YX2’ (stress-tolerant, ST) and ‘PZ1’ (stress-sensitive, SS) were selected as contrasting genotypes for mechanistic studies. Cuttings of both cultivars were exposed to a 10% PEG-6000 gradient to dissect the physiological and biochemical bases underlying differential drought tolerance.

2.2. Changes in MDA and LWC of Poplar Under PEG-Induced Drought Stress

Malondialdehyde (MDA) accumulation was employed as a proxy for drought-induced lipid peroxidation (Figure 2a). Under control conditions, baseline MDA concentrations did not differ between the SS and ST genotypes (22.20 vs. 26.83 nmol g−1 FW, p > 0.05). Exposure to 10% PEG-6000 elicited a marked genotype-specific response: SS leaves exhibited a 2.0-fold surge to 44.67 nmol g−1 FW, whereas ST leaves showed a significantly attenuated increase (33.47 nmol g−1 FW, corresponding to only a 25% rise above control), indicating superior membrane stability in the tolerant cultivar. Leaf relative water content (LWC) mirrored the oxidative trends (Figure 2b). Control LWC was statistically equivalent between genotypes (SS 0.89, ST 0.90). Drought reduced LWC in both, but the magnitude of loss was genotype-dependent: SS declined by 29.2% (to 0.63), whereas ST maintained a significantly higher LWC of 0.73, representing an 18.4% reduction.

2.3. Changes in Photosynthetic Parameters of Poplar Under PEG-Induced Drought Stress

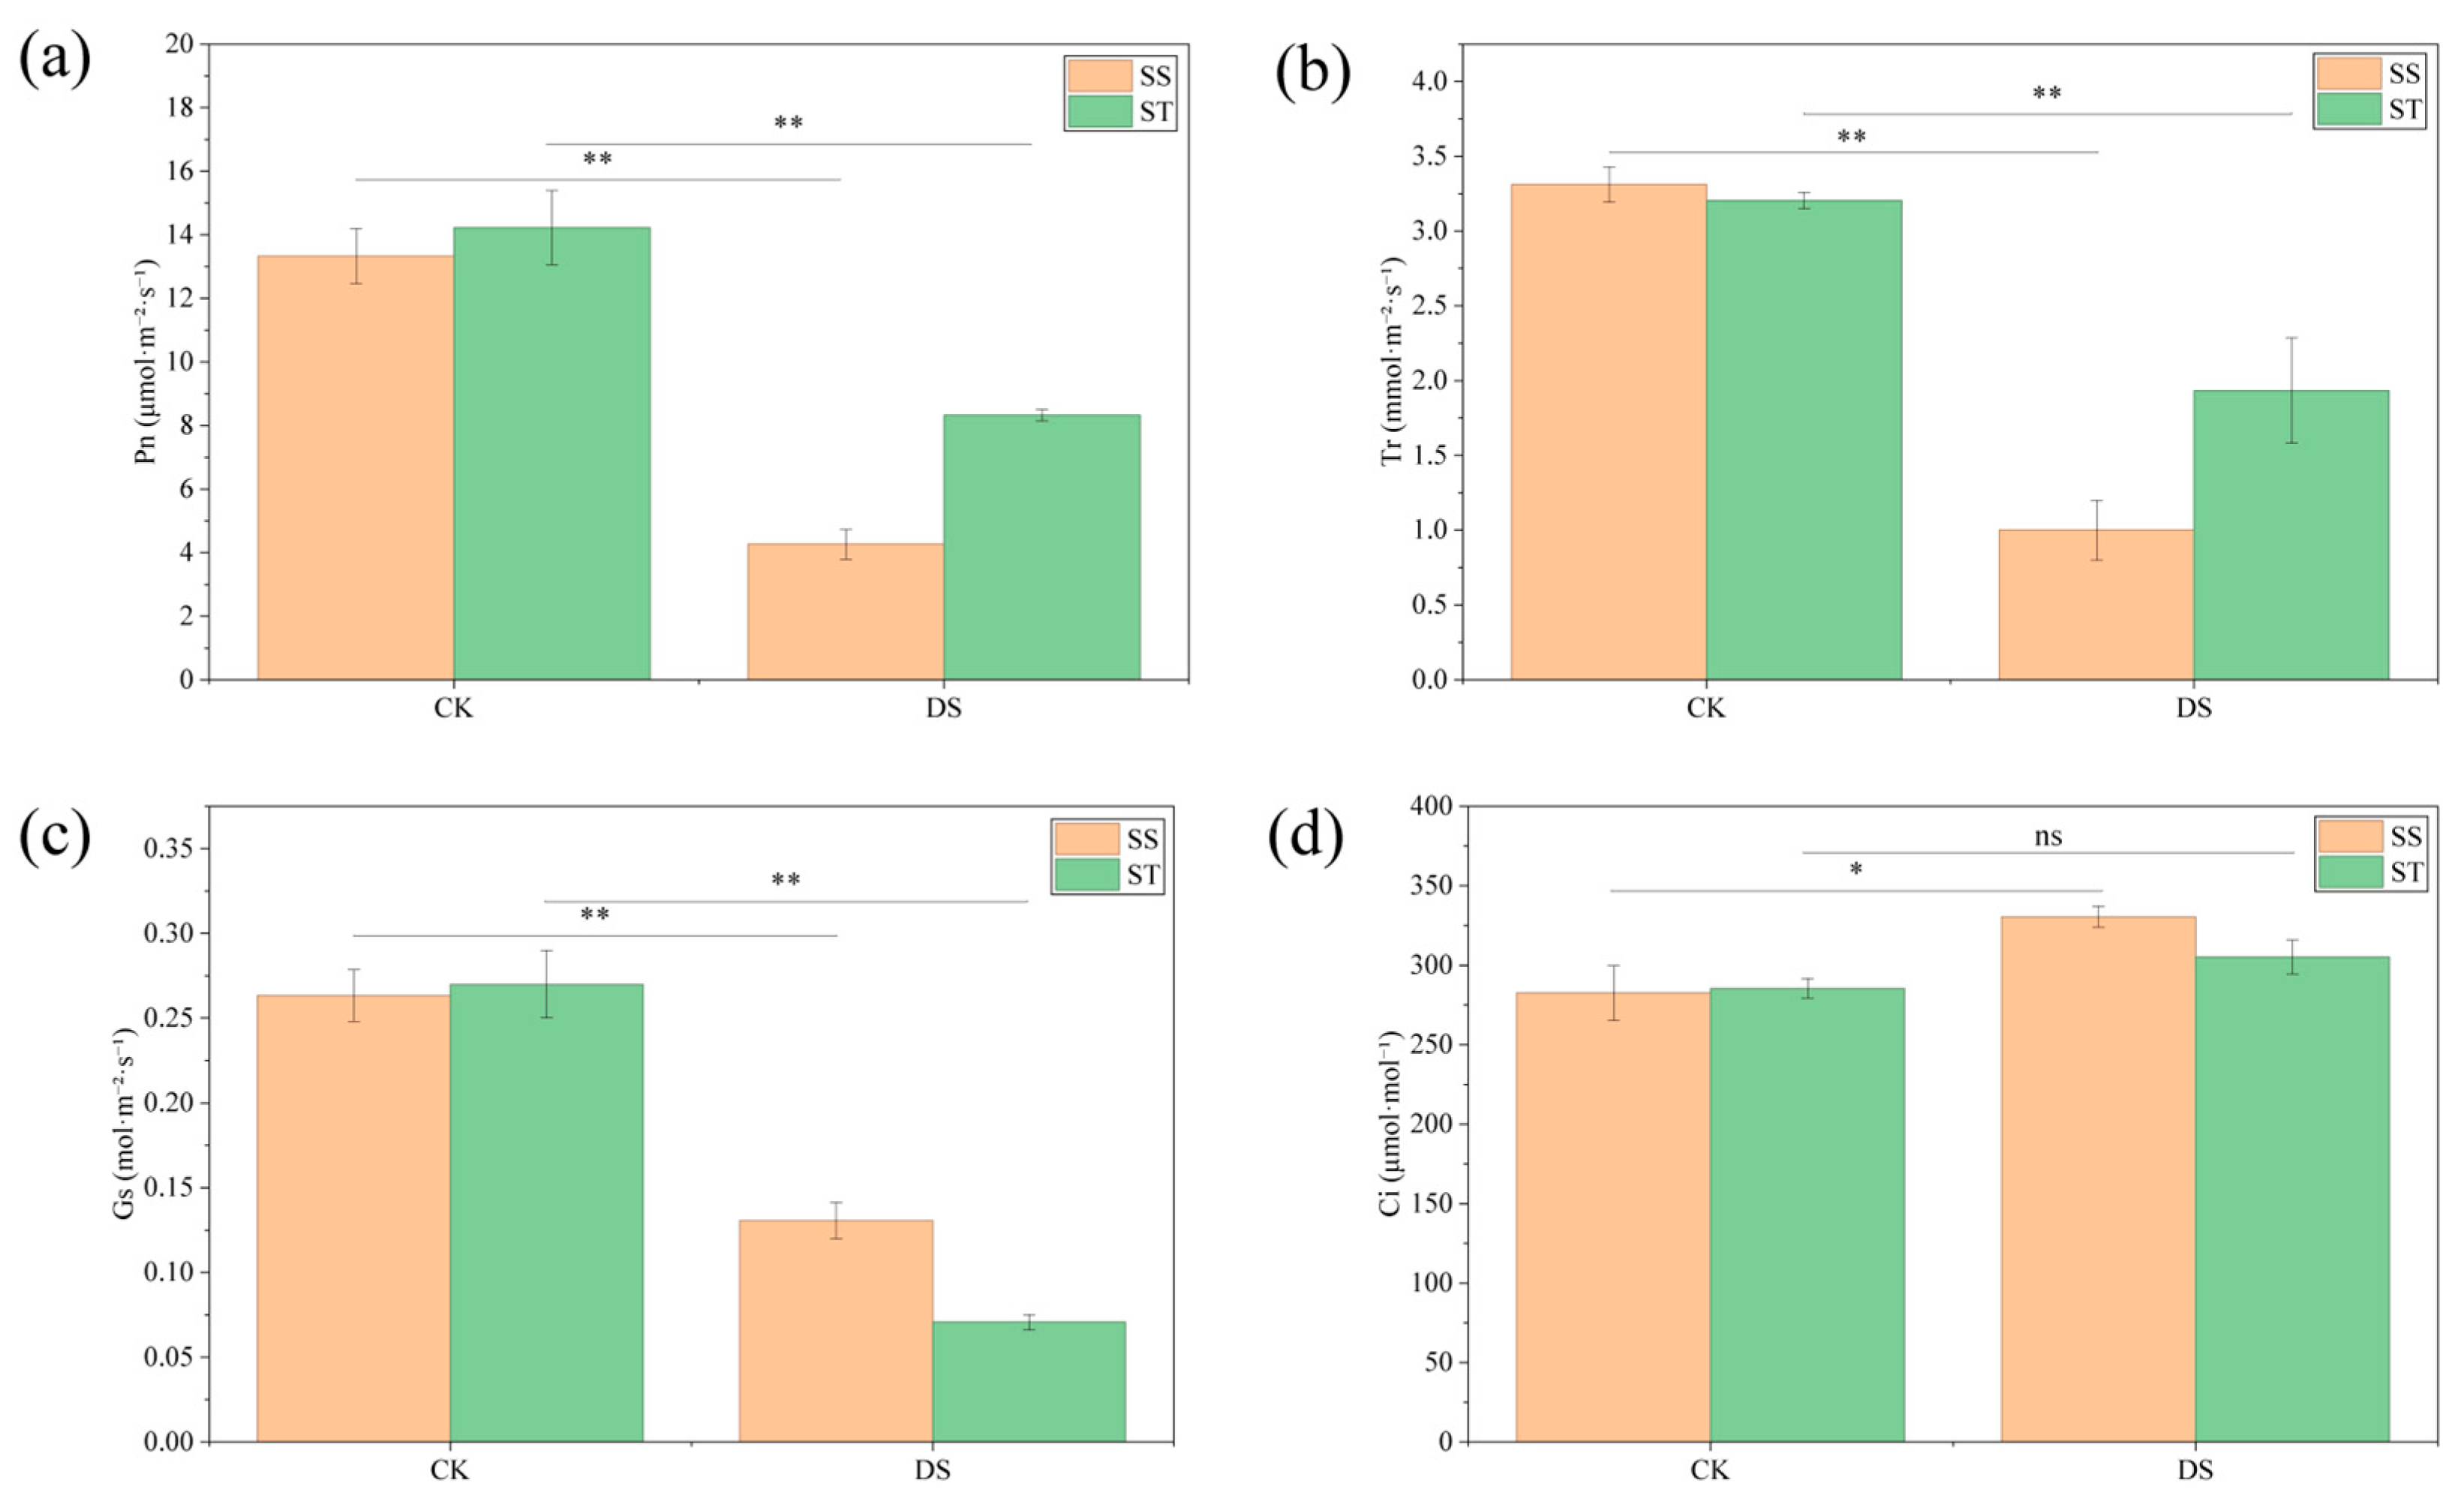
Photosynthetic performance was resolved through four instantaneous gas-exchange parameters—net photosynthetic rate (Pn), transpiration rate (Tr), stomatal conductance (Gs) and intercellular CO2 concentration (Ci) (Figure 3). Under control conditions, Pn did not differ statistically between the sensitive (SS) and tolerant (ST) genotypes (13.33 vs. 14.22 μmol·m−2·s−1); likewise, Tr, Gs and Ci were statistically equivalent. Drought (10% PEG-6000) elicited strong but genotype-specific depressions. In SS, Pn collapsed by 67.7% to 4.27 μmol·m−2·s−1, whereas ST retained a significantly higher Pn of 8.32 μmol·m−2·s−1 (41.6% reduction). Tr paralleled Pn: SS declined from 3.31 to 1.00 mmol·m−2·s−1 (−70.1%), while ST fell only to 1.93 mmol·m−2·s−1 (−40.6%). Gs under drought dropped to 0.13 mol·m−2·s−1 in SS, but ST maintained a significantly higher conductance of 0.20 mol·m−2·s−1. Conversely, Ci rose sharply in SS (282 to 330 μmol·mol−1), whereas the increase in ST was marginal and non-significant (285 to 305 μmol·mol−1).

2.4. Changes in Osmolyte Content of Poplar Under PEG-Induced Drought Stress

The changes in soluble sugars (Ss), sucrose (Sp), and proline (Pro) under drought stress were investigated (Figure 4). Under the control conditions, leaf Ss concentrations were equivalent between the SS and ST genotypes (16.8 vs. 19.9 mg g−1 FW). Drought triggered a sharp, but genotype-dependent, accumulation: SS rose to 38.2 mg g−1 FW (+128%), whereas ST reached only 28.1 mg g−1 FW (+41%). Sp content was likewise similar in the controls (SS 11.8, ST 12.5 mg·g−1 FW). Following water withdrawal, Sp declined significantly in SS (8.4 mg·g−1 FW; −29%), but remained statistically unchanged in ST (13.2 mg·g−1 FW), resulting in a 57% higher content in the tolerant genotype under stress. Baseline Pro levels did not differ between cultivars (SS 46.9, ST 42.3 µg·g−1 FW). Upon drought imposition, both genotypes accumulated Pro, but the magnitude was again genotype-specific: SS attained 155.7 µg·g−1 FW (3.3-fold increase), while ST reached 91.5 µg·g−1 FW (2.2-fold increase).

2.5. Changes in Antioxidant Enzyme Activities of Poplar Under PEG-Induced Drought Stress

Antioxidant enzyme responses to drought were quantified for catalase (CAT), superoxide dismutase (SOD) and peroxidase (POD) (Figure 5). Under control conditions, CAT activities were statistically equivalent between the drought-sensitive (SS) and drought-tolerant (ST) genotypes (12.50 and 14.16 U·g−1 FW). Drought triggered a sharp up-regulation in both cultivars, but the increment was significantly greater in ST (93.33 U·g−1 FW, 5.6-fold) than in SS (55.00 U·g−1 FW, 3.4-fold). Baseline SOD activities were comparable (SS 73.86, ST 78.20 U·g−1 FW). Following water withdrawal, SS exhibited a modest rise to 95.40 U·g−1 FW (+29%), whereas ST attained 139.10 U·g−1 FW (+78%), outperforming the sensitive genotype by 46%. POD activity in the controls was already higher in ST (172.50 U·g−1 FW) than in SS (135.83 U·g−1 FW). Drought amplified this difference: SS reached 234.17·U g−1 FW (+73%), while ST surged to 350.83 U·g−1 FW (+103%), maintaining a 50% advantage. Collectively, the superior induction of CAT, SOD and POD in ST indicates a more robust enzymatic ROS-scavenging capacity that parallels its higher drought tolerance.

2.6. Principal Component Analysis of Indicators

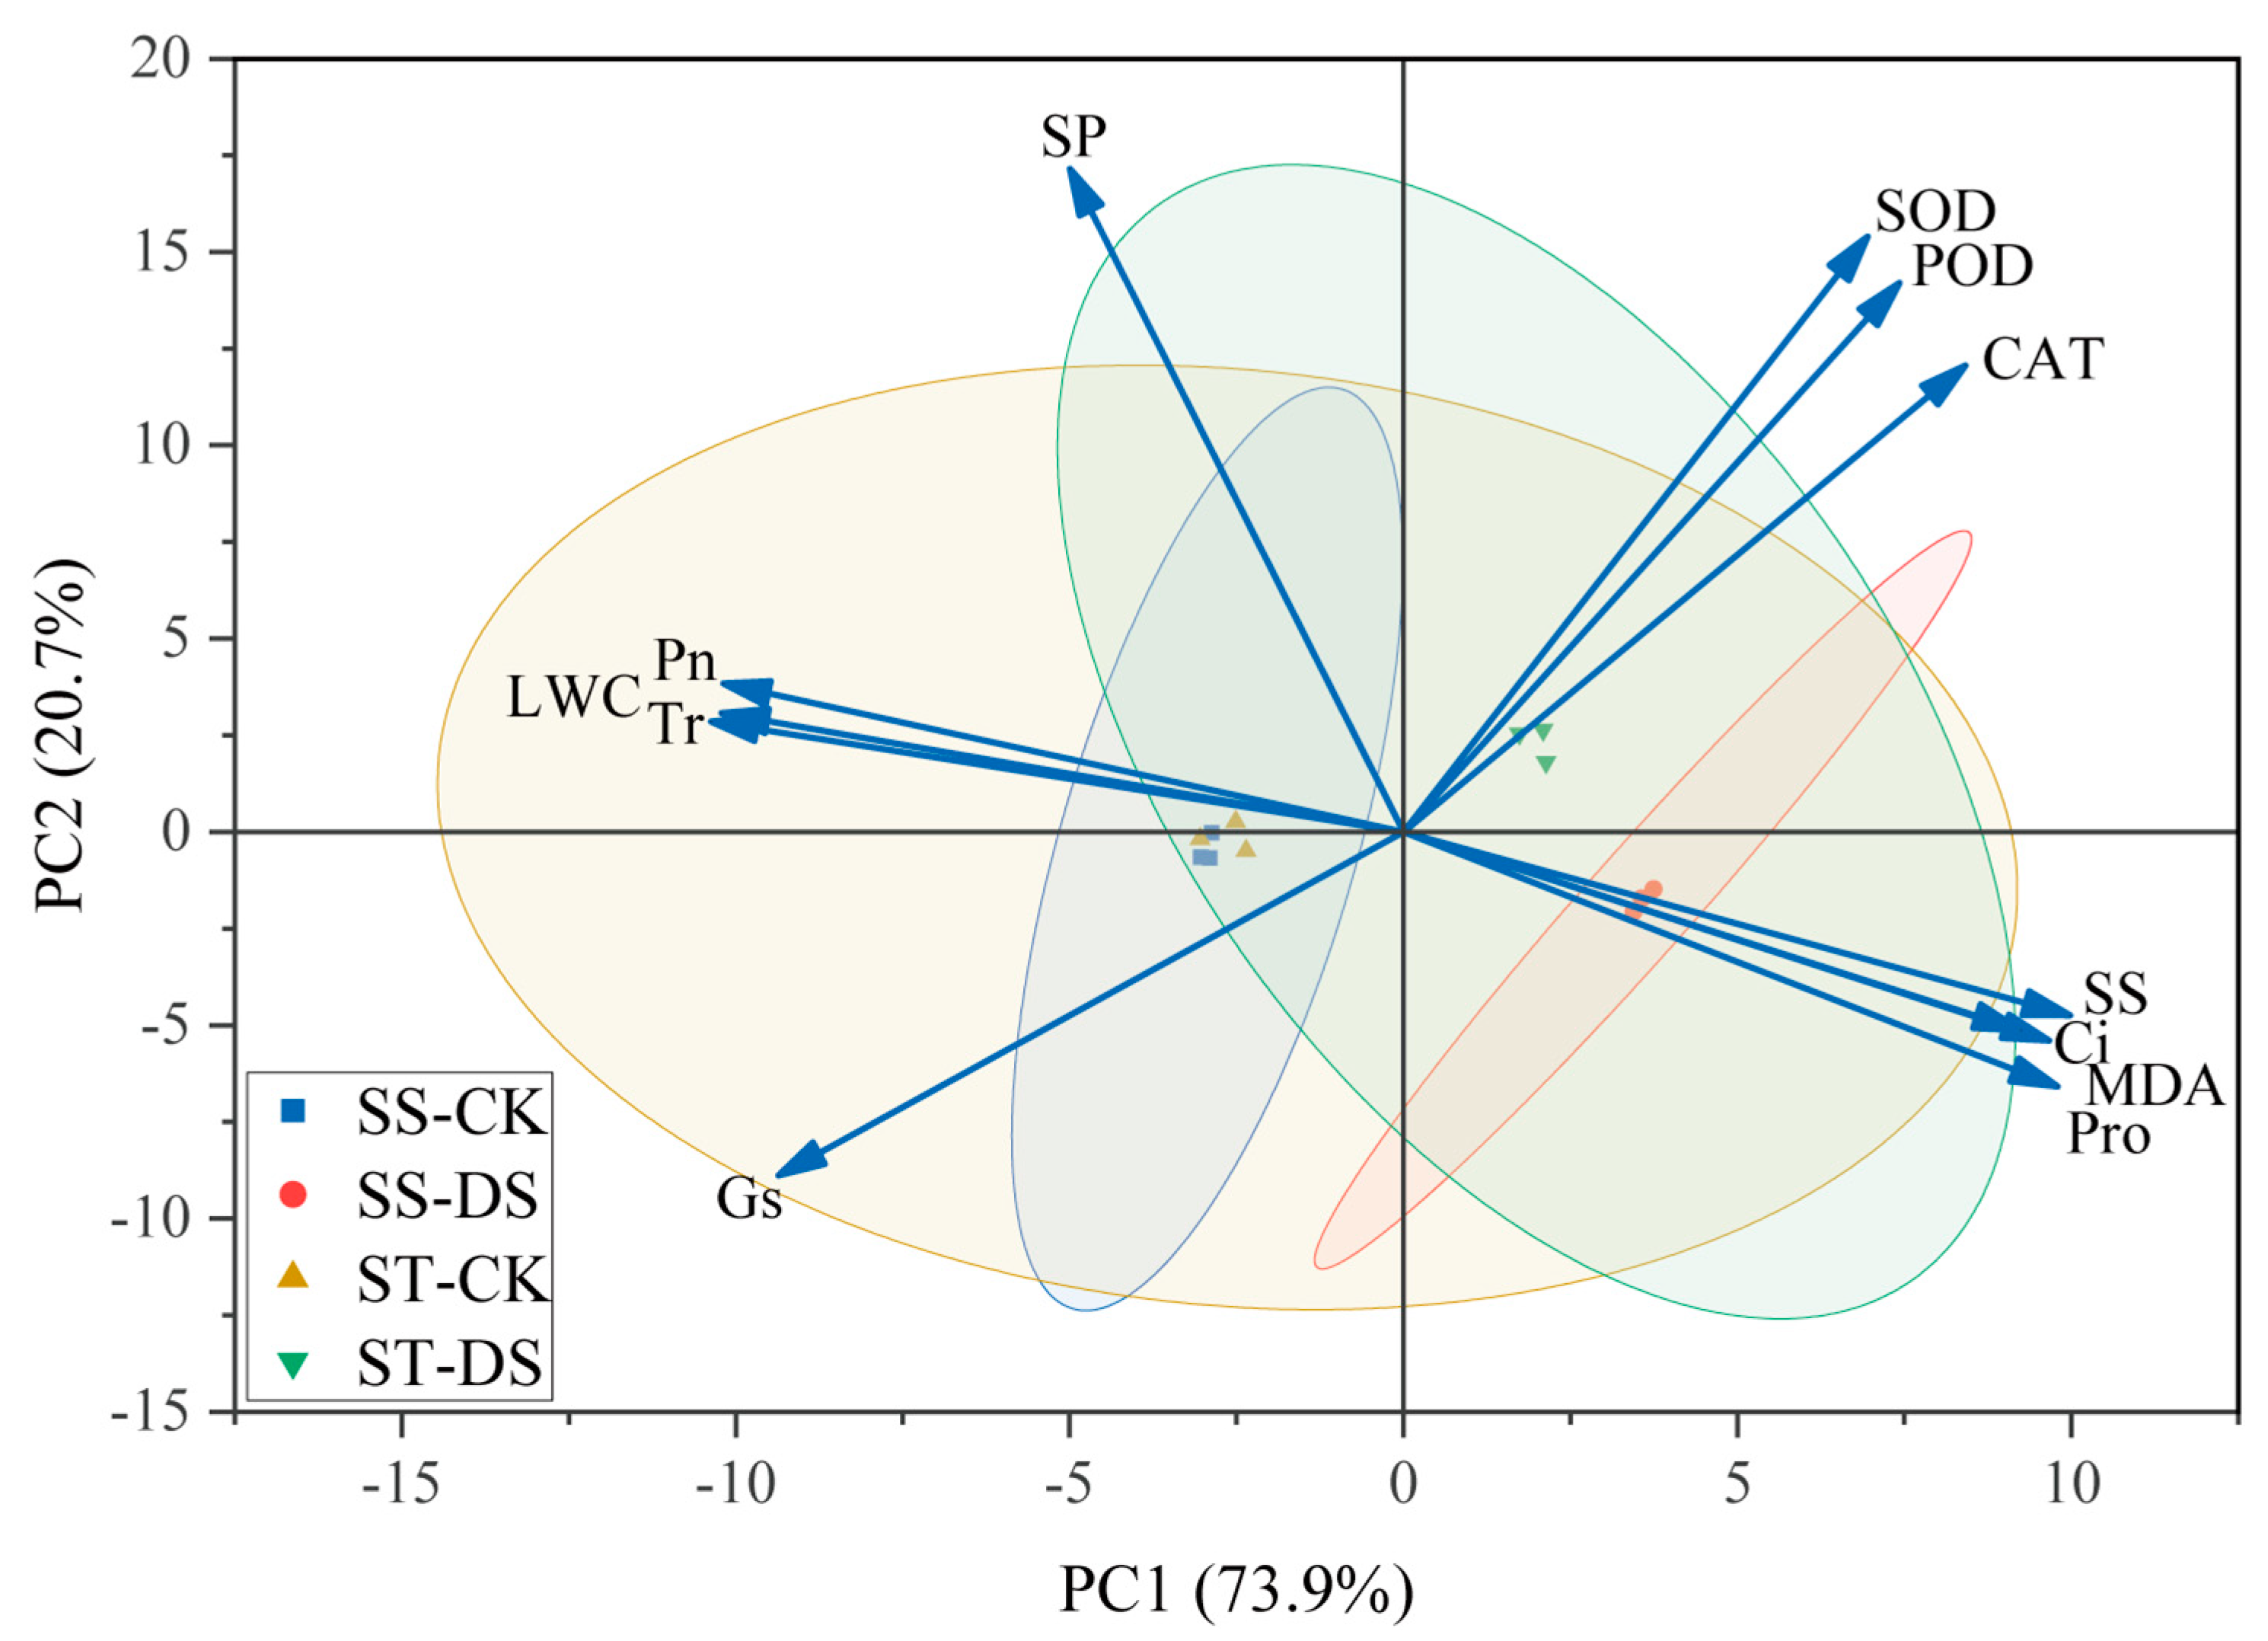
Principal component analysis (PCA) was applied to ten physiological and biochemical variables to visualize genotype- and treatment-specific response patterns (Figure 6). The first two components accounted for 89.1% of the total variance (PC1 = 73.9%, PC2 = 15.2%). PC1 was dominated by Pro, MDA, Ci, Ss, Pn, LWC, Tr and Gs, collectively representing oxidative damage and photosynthetic capacity; PC2 was primarily defined by Sp, SOD, POD and CAT, reflecting antioxidant potential.
Score plots revealed that control samples (SS-CK and ST-CK) formed a single, tight cluster. Under drought, both stressed groups shifted toward positive PC1 scores, but their trajectories diverged along PC2. ST-DS moved further along the positive PC2 axis, coinciding with its superior antioxidant enzyme induction. By contrast, SS-DS displayed a negative PC2 coordinate, driven by markedly higher MDA, proline and soluble sugar loadings—evidence of severe oxidative damage requiring extensive osmotic compensation. Clear separation of genotypes along PC1 and a treatment gradient along PC2 corroborate the comparatively integrated drought tolerance of ST.

2.7. OPLS-DA Profiling of Indicators

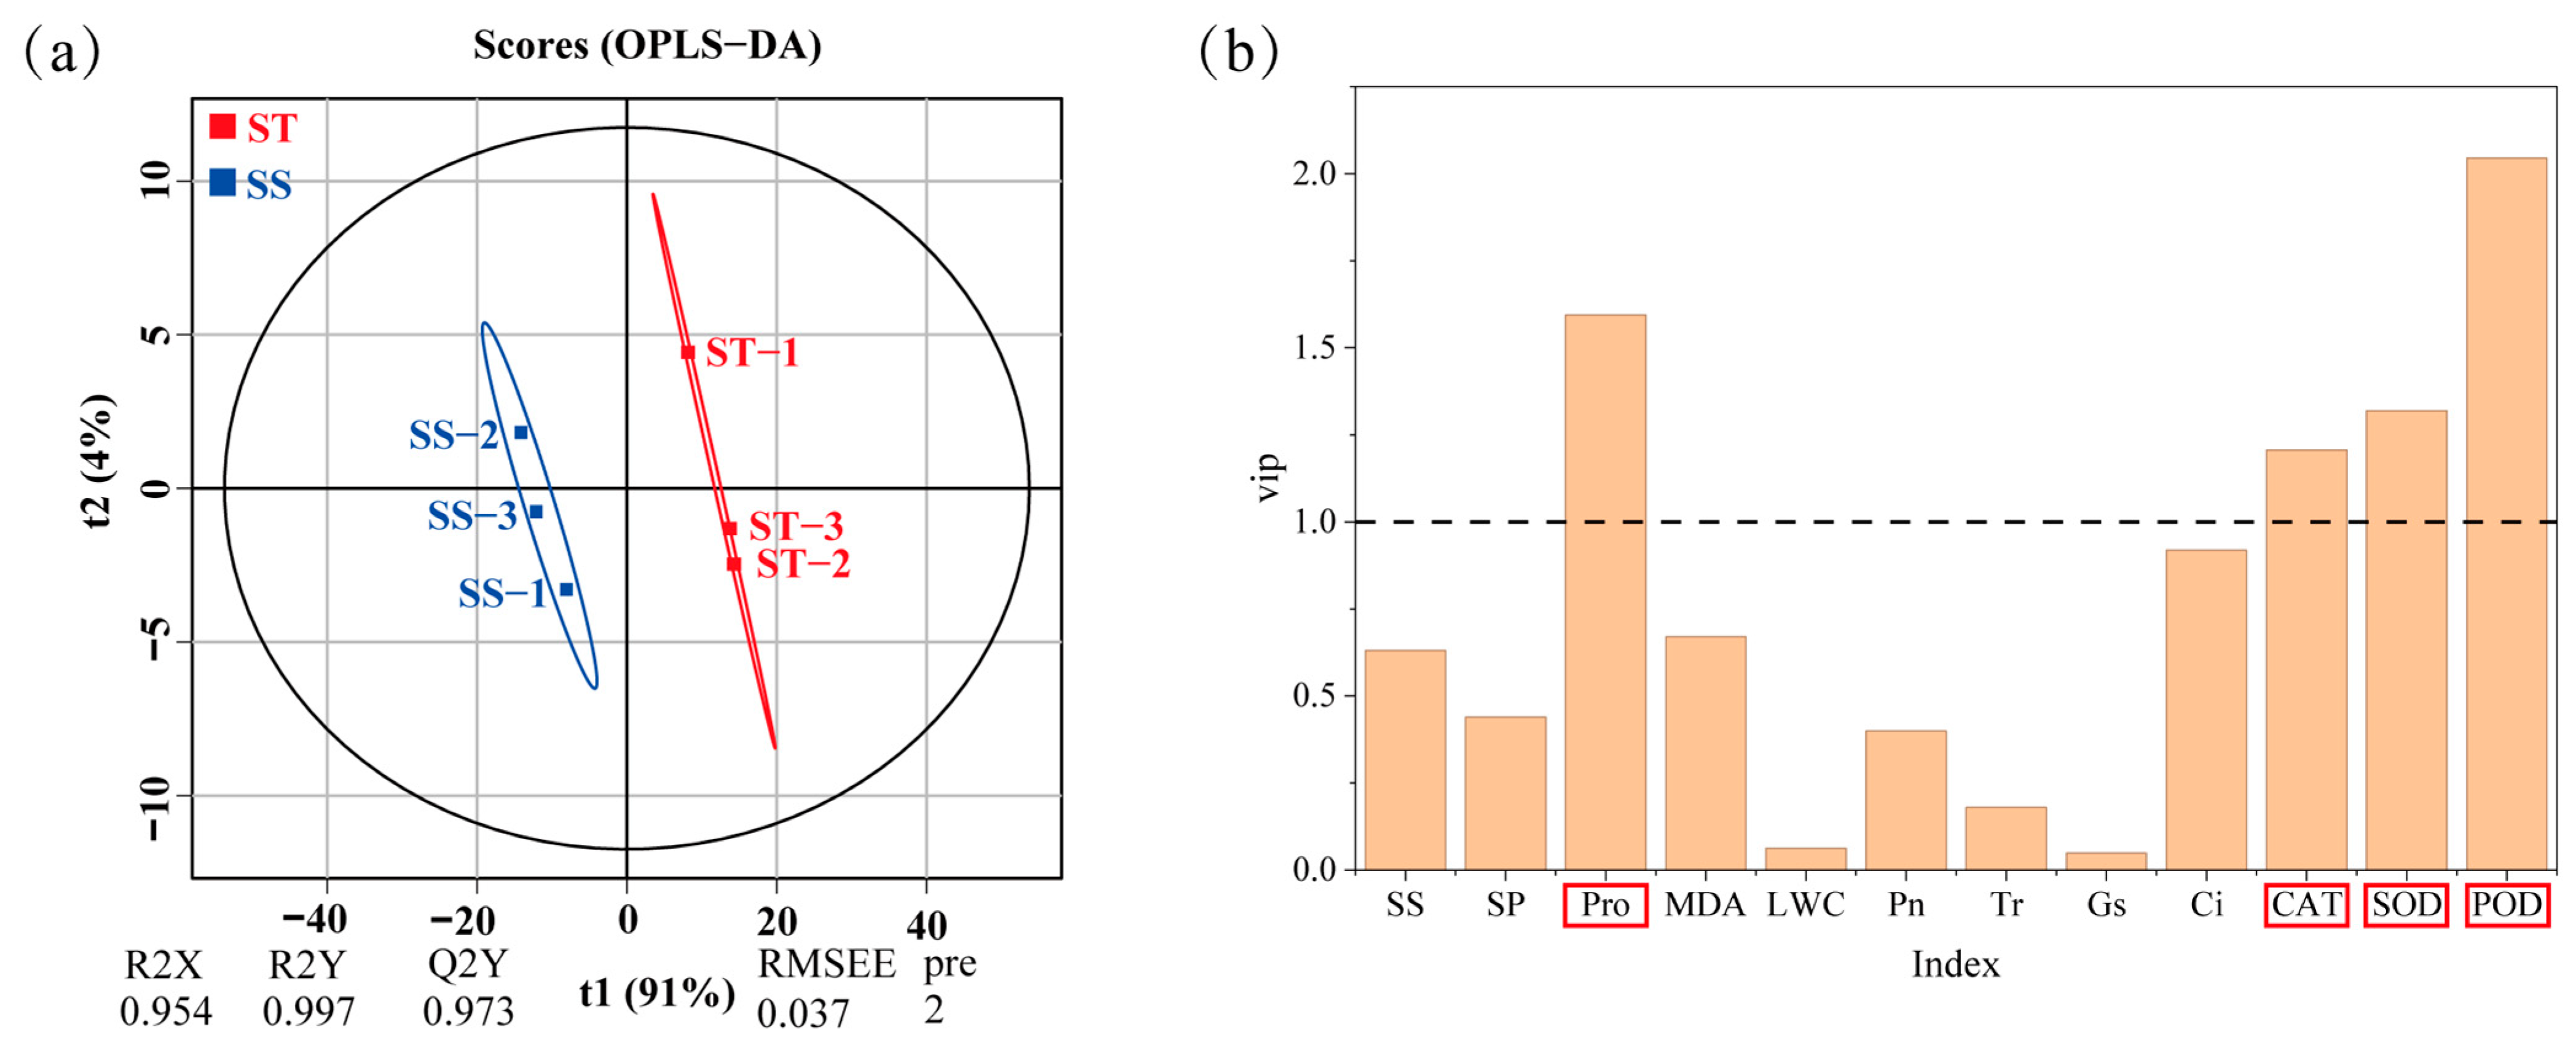
Orthogonal partial least-squares discriminant analysis (OPLS-DA) was applied to ten physiological indicators to sharpen the contrast between SS and ST under drought. The model exhibited high quality: R2X = 0.954, R2Y = 0.997, Q2 = 0.973, RMSEE = 0.037 (Figure 7a). The predictive component (t1) captured 91% of the variance and achieved complete separation of the two genotypes along the t1 axis, with ST projecting positively and SS negatively, confirming distinct metabolic phenotypes under water deficit.
Variable importance in projection (VIP) scores ranked the contributors as POD (2.08) > Pro (1.56) > SOD (1.35) > CAT (1.17) > Ci (0.92) > SS (0.63) > MDA (0.66) > Pn (0.40) > SP (0.43) > Tr (0.19) > LWC (0.06) > Gs (0.05). Only POD, SOD, CAT and Pro exceeded the threshold of 1.0, identifying these four traits as the core physiological determinants discriminating drought-tolerant from drought-sensitive poplar under PEG-induced stress. High positive loadings for POD, SOD and CAT in the tolerant group indicate that superior ROS detoxification, rather than excessive proline accumulation, is the key signature separating ST from SS.

3. Discussion

3.1. Differential Responses of Relative Water Content and Photosynthesis Between SS and ST Poplar Cultivars Under Drought Stress

Leaves, the primary sites of assimilation and transpiration, directly reflect the severity of water deficit [17]. As soil moisture declines, leaf fresh mass typically falls sharply [18]; after drought stress (DS), RWC decreased significantly in both cultivars, but the reduction was markedly smaller in the drought-tolerant (ST) than in the sensitive (SS) cultivars, indicating stronger water retention in ST and more severe dehydration in SS—consistent with its drought sensitivity.
Under well-watered conditions, ROS production and scavenging remain balanced; drought disrupts this equilibrium [19], leading to elevated ROS and increased MDA [20]. Here, MDA rose significantly in both cultivars under DS, yet the increment in ST was only one-quarter of that in SS, demonstrating that ST suffers less oxidative damage and maintains greater membrane stability.
Photosynthesis is among the first processes inhibited by water deficit. Consistent with previous reports [18,21,22], Pn and Tr declined in both cultivars, but the reduction was approximately twice as great in SS. Gs decreased more sharply in ST, reflecting tighter stomatal closure that limits water loss while still sustaining higher Pn. The concurrent rise in Ci and sharp drop in Pn in SS indicate non-stomatal limitation of photosynthesis, whereas ST maintains relatively high Pn despite low Gs, underscoring its drought-resilient photosynthetic system [23]. Although the present 48 h assay captured only acute responses, recovery dynamics after re-watering will be examined in a subsequent experiment using the same tolerant and sensitive clones identified here.

3.2. Differentia Responses of Osmolyte Accumulation Between SS and ST Poplar Cultivars Under Drought Stress

Osmotic adjustment is a front-line defense against drought, sustaining cell water content and turgor by lowering the free energy of bound water and preserving a favourable water-potential gradient between cell and environment [24,25]. Soluble sugars (SS) and soluble proteins (SP) serve as readily available energy and C/N sources, while SS accumulation decreases cellular water potential and enhances water uptake and retention [17]. Proline (Pro) contributes an additional osmotic cushion, raising cytosolic solute concentration and permitting water influx under low external potentials [26]. In the present study, drought triggered a sharp rise in SS and Pro in both varieties, confirming that poplar relies on these metabolites to stabilize the cytoplasm and balance external osmotic pressure. The sensitive variety (SS) accumulated significantly more SS and Pro than the tolerant variety (ST), but concurrently lost soluble protein, implying a high metabolic cost for emergency osmotic adjustment. In contrast, ST retained stable SP levels while only moderately elevating SS and Pro, indicating superior cellular structural integrity and a more efficient osmotic strategy.

3.3. Differential Antioxidant Enzyme Activities Between SS and ST Poplar Cultivars Under Drought Stress

To limit ROS injury, antioxidant enzymes act in concert to scavenge excess radicals, alleviate damage and sustain plant function under drought [17]. CAT, localized in peroxisomes, detoxifies H2O2 generated within these organelles [27], whereas SOD and POD constitute a first-line defense that converts O2 to H2O2 and subsequently to water; their activity correlates positively with drought tolerance [28]. After drought imposition, CAT, POD and SOD activities surged in both varieties, but the increments were significantly higher in the tolerant (ST) than in the sensitive (SS) variety. This stronger up-regulation of the antioxidant triad in ST effectively quenched the ROS burst, whereas the modest enzyme response in SS coincided with aggravated lipid peroxidation.

3.4. Screening of Key Physiological Indicators in Poplar Responding to Drought Stress

OPLS-DA separates Y-orthogonal variation in the X-matrix, thereby de-noising the model and enhancing component interpretability and predictive power [18,29]. VIP scores identified POD, SOD, CAT and Pro as the four indicators exceeding the threshold of 1.0. POD attained the highest VIP, followed by SOD and CAT, together defining the antioxidant module that governs ROS removal, while Pro was the only osmolyte with VIP > 1, reflecting the need for extensive proline accumulation to offset oxidative damage.
We therefore propose that poplar drought tolerance is achieved primarily through the integrated action of POD, SOD, CAT and Pro. SOD dismutates O2 to H2O2, which is then reduced to water by CAT and POD [30], while Pro chelates singlet oxygen and hydroxyl radicals, directly diminishing oxidative injury. Additionally, Pro enhances the activities of POD, CAT and SOD, further reinforcing the ROS-scavenging network [17]. By jointly lowering lipid peroxidation and stabilizing membrane proteins, this antioxidant–osmolyte module minimizes electrolyte leakage without the excessive carbon cost seen in sensitive cultivars. Transcript-level surveys in Populus have likewise linked drought-hardy clones to higher expression of PIP2 aquaporins and of the Cu/Zn-SOD, POD and CAT gene families [31,32], corroborating the enzyme patterns we report and suggesting that the four-trait signature has a transcriptional basis worth exploring in future work. Clones with high LC50 and steep antioxidant induction (e.g., ‘YX2’) can be directly deployed as drought-safe rootstocks in water-limited plantations, or used as parents in controlled crosses to introgress the POD/SOD/CAT/Pro module into elite cultivars, accelerating the development of climate-resilient poplar varieties for marginal lands. PEG solutions raise viscosity, reduce oxygen availability and lack soil–root interactions, so they simulate osmotic shock rather than natural drought; results should therefore be viewed as a proxy for osmotic tolerance rather than absolute field performance.

4. Materials and Methods

4.1. Experimental Materials and Pre-Treatment

Experimental plant material was derived from six elite Populus cultivars: ‘74/76’ (PZ1), ‘Zhonglin 2025’ (PZ2), ‘YUXIONG 1’ (YX1), ‘YUXIONG 2’ (YX2), ‘YUXIONG 3’ (YX3) and ‘ZHOUXIONG 1’ (ZX1). Hardwood cuttings, 20 ± 2 cm in length and 8–10 mm in diameter, were collected in late February 2022 from 10- to 12-year-old clonal mother trees growing at the Henan Academy of Forestry Sciences, Zhengzhou, Henan, China (34°46′ N, 113°40′ E). The ortets were phenotypically uniform, free of visible pathogens and cultivated under identical edaphic and climatic conditions. Cuttings were soaked in tap water for 24 h, planted in a 1:1 (v/v) peat: perlite mixture and propagated under intermittent mist (25 °C, 75% relative humidity) without exogenous hormones; all genotypes root readily under these conditions.
Several weeks later, morphologically uniform plantlets were selected: 18–22 cm tall, bearing 6–7 fully expanded leaves and at least three adventitious roots ≥ 5 cm in length. The rooted cuttings were carefully lifted from the substrate, and their root systems were gently rinsed under running tap water for 5 min, disinfected in 0.1% (v/v) sodium hypochlorite for 15 min, and finally rinsed three times with sterile deionized water. Plants were transferred to 30 L PVC tanks (60 × 40 × 15 cm) filled with quarter-strength Hoagland solution (pH 6.0 ± 0.2) and acclimated for 7 d under continuous aeration. During acclimation, the solution was renewed every 48 h; plants exhibiting root damage or infection were excluded from the experiment. Thereafter, 360 uniform plants (60 per cultivar) were selected for the experiment.

4.2. Experimental Design and Sampling

The hydroponic system consisted of the same 30 L tanks fitted with closed-cell foam lids that carried multiple 5-cm planting holes. Individual plants were supported with soft polyurethane collars so that root systems were fully submerged while crowns remained aerial. The growth chamber was maintained at 28 °C/25 °C day/night, 75% relative humidity and a 12 h photoperiod (200 ± 20 μmol·m−2·s−1 PPFD, LED panels).
Drought stress was imposed with polyethylene glycol 6000 (PEG-6000; Solarbio, Beijing, China) at 0% (control), 10%, 15% or 20% (w/v). Solutions were prepared by dissolving PEG in half-strength Hoagland medium under continuous stirring and adjusting volume to obtain the target osmotic potential (−0.05, −0.35, −0.55 and −0.78 MPa, respectively) was selected following the gradient used for drought screening in plant studies [33,34]. The duration of PEG exposure was set at 48 h with reference to Li et al. [35], ensuring acute but non-lethal drought stress. Each treatment consisted of three biological replicates, with five plants per replicate, totaling 15 plants per treatment per cultivar, arranged in a completely randomized design.
The second to fourth fully expanded leaf from the apex was harvested at 0 h and 48 h after the onset of stress. Different individuals were used for each assay to avoid cross-contamination. Leaves were rinsed with deionized water, blotted dry and processed immediately for physiological measurements or snap-frozen in liquid nitrogen and stored at −80 °C for biochemical analyses.

4.3. Experimental Indicators and Measurement Methods

4.3.1. REC and LC50 Determination

Relative electrolyte leakage (REC) was measured with a DDS-310 conductivity meter (Kangyi Instrument Co., Ltd., Shanghai, China) following a modified version of the method described by Dexter [36]. Fresh leaf discs (0.2 g) were incubated in 25 mL distilled water at 25 °C on an orbital shaker for 6 h, and initial conductivity (R1) was recorded. The solution was then boiled for 30 min, cooled to 25 °C, and final conductivity (R2) measured; REC was calculated as
R E C = R 1 R 2 × 100 %
A logistic model was fitted to the REC data as described by Yang et al. [14]:
y = K ( 1 + a e b x )
where y is the REC at a given PEG concentration, K is the asymptotic maximum (fixed at 100), x is the PEG concentration (%, w/v), and a, b are regression coefficients. Logistic slope b reflects injury speed; higher LC50 and lower b indicate tolerance. Linearisation of the equation yielded a and b, from which the semi-lethal PEG concentration (LC50) was calculated as:
L C 50 = l n a b

4.3.2. Physiochemical Factors

Photosynthetic parameters: After 48 h of PEG-induced drought stress, fully expanded functional leaves (positions 2–3 from the shoot apex) were selected. Net photosynthetic rate (Pn), transpiration rate (Tr), intercellular CO2 concentration (Ci) and stomatal conductance (Gs) were measured with a portable photosynthesis system (Hansatech Instruments, Pentney, UK).
Malondialdehyde (MDA): The MDA content was quantified spectrophotometrically after reaction with thiobarbituric acid, following the protocol of [37].
Leaf water content (LWC): The LWC was obtained gravimetrically [18]: fresh mass (L1) was recorded immediately after excision, leaves were then oven-dried at 80 °C to constant mass (L2), and LWC was calculated as:
L W C = L 1 L 2 L 1 × 100 %
Osmolyte: Soluble sugar (Ss) was quantified by the anthrone colorimetric assay [38]; soluble protein (Sp) by the Coomassie Brilliant Blue G-250 method [39]; and free proline (Pro) according to Bates et al. [40].
Enzymatic activities: Antioxidant enzyme assays were conducted according to the unified protocol of Ali et al. [41]: SOD activity was estimated by inhibition of nitro-blue tetrazolium (NBT) photoreduction; POD activity by guaiacol oxidation at 470 nm; CAT activity by H2O2 depletion at 240 nm; and APX activity by monitoring ascorbate oxidation at 290 nm.

4.3.3. Key Physiological Indicators Screening

Following the approach of Gao et al. [18], a principal component analysis (PCA) was first performed on 12 physiological variables. The variable influence on projection (VIP) scores of these indicators were then calculated with the OPLS model embedded in the Gene Denovo Cloud Tools platform (https://cloud.omicsmart.com) accessed on 1 October 2025. Traits whose VIP exceeded 1.0 were considered to exert a strong effect on genotype performance under drought.

4.4. Statistical Analysis

Normality and homoscedasticity test, variance analysis, t-test, and principal component analysis of various indicators were conducted using Origin 2025 b and SPSS 27.0 statistical software. Statistical data analyses were performed with Excel 2023.

5. Conclusions

While PEG-6000 provides a rapid and reproducible osmotic stress, it cannot mimic the kinetic and hydraulic complexities of soil water deficit, root-to-shoot signalling, or the co-occurring thermal and oxidative stresses typical of field drought. The present study therefore aims to establish a controlled-condition physiological screen rather than to predict absolute field performance. The logistic model of PEG-induced electrolyte leakage furnishes a rapid, quantitative metric for ranking poplar drought tolerance. Cultivar ‘YX2’ sustains photosynthesis under drought by integrating superior water retention, a conservative osmotic investment and potent antioxidant activation, whereas ‘YX2’ suffers oxidative damage coupled with irreversible stomatal dysfunction. Peroxidase, catalase, superoxide dismutase and proline together constitute a minimal yet powerful physiological signature that can accelerate identification of resilient poplar genotypes for dry-land forestry and breeding programs. In subsequent research, coupling these biomarkers with high-throughput phenomics and genome-wide association studies will clarify the allelic architecture of drought resistance, while transcriptomics and gene editing targeting antioxidant and proline metabolic modules should expedite development of next-generation poplars capable of maintaining biomass production under increasingly water-scarce conditions.

Author Contributions

Conceptualization, L.F. and H.Y.; methodology, L.T.; software, L.F.; validation, L.F. and L.T.; formal analysis, L.F.; investigation, Z.Z.; resources, W.F.; data curation, Z.Z.; writing—original draft preparation, L.F.; writing—review and editing, W.F.; visualization, Q.Z.; supervision, Q.Z.; project administration, L.T.; funding acquisition, H.Y. All authors have read and agreed to the published version of the manuscript.

Funding

This research was funded by Autonomous Innovation Project of Henan Academy of Agricultural Sciences, grant number 2025ZC138; Henan Science and Technology Forest Project, grant number YLK202503; Natural Science Foundation of Jiangsu Province, grant number BK20240218.

Data Availability Statement

The data used to support the findings of this study are available from the corresponding author upon request.

Conflicts of Interest

The authors declare no conflicts of interest.

References

  1. Zhang, X.; Lu, G.; Long, W.; Zou, X.; Li, F.; Nishio, T. Recent progress in drought and salt tolerance studies in Brassica crops. Breed. Sci. 2014, 64, 60–73. [Google Scholar] [CrossRef]
  2. Basu, S.; Ramegowda, V.; Kumar, A.; Pereira, A. Plant adaptation to drought stress. F1000Research 2016, 5, 1554. [Google Scholar] [CrossRef] [PubMed]
  3. Song, F.; Zhou, J.; Quan, M.; Xiao, L.; Lu, W.; Qin, S.; Fang, Y.; Wang, D.; Li, P.; Du, Q.; et al. Transcriptome and association mapping revealed functional genes respond to drought stress in Populus. Front. Plant Sci. 2022, 13, 829888. [Google Scholar] [CrossRef]
  4. Gao, X.; Zhao, X.; Li, H.; Guo, L.; Lv, T.; Wu, P. Exotic shrub species (Caragana korshinskii) is more resistant to extreme natural drought than native species (Artemisia gmelinii) in a semiarid revegetated ecosystem. Agric. For. Meteorol. 2018, 263, 207–216. [Google Scholar] [CrossRef]
  5. Kar, R.K. Plant responses to water stress: Role of reactive oxygen species. Plant Signal. Behav. 2011, 6, 1741–1745. [Google Scholar] [CrossRef]
  6. Gill, S.S.; Tuteja, N. Reactive oxygen species and antioxidant machinery in abiotic stress tolerance in crop plants. Plant Physiol. Biochem. 2010, 48, 909–930. [Google Scholar] [CrossRef]
  7. Wang, X.; Ge, J.; He, M.; Li, Q.; Cai, J.; Zhou, Q.; Zhong, Y.; Wollenweber, B.; Jiang, D. Enhancing crop resilience: Understanding the role of drought priming in wheat stress response. Field Crops Res. 2023, 302, 109083. [Google Scholar] [CrossRef]
  8. Emami Bistgani, Z.; Barker, A.V.; Hashemi, M. Physiology of medicinal and aromatic plants under drought stress. Crop J. 2024, 12, 330–339. [Google Scholar] [CrossRef]
  9. Aalam, F.; Rezaei Nejad, A.; Mousavi-Fard, S.; Raji, M.; Nikoloudakis, N.; Goumenaki, E.; Fanourakis, D. Water Deficit Severity during the Preceding Year Determines Plant Tolerance to Subsequent Year Drought Stress Challenges: A Case Study in Damask Rose. Horticulturae 2024, 10, 462. [Google Scholar] [CrossRef]
  10. Sajad, A.; Rakeeb, A.M.; Md Azizul, H.; Danishuddin; Mohammed, A.A.; Mohammad, A.; Ashraf, K.; Henda, M.; Mohammad, S.; Anshika, T.; et al. Exploring physiological and molecular dynamics of drought stress responses in plants: Challenges and future directions. Front. Plant Sci. 2025, 16, 1565635. [Google Scholar] [CrossRef] [PubMed]
  11. Kim, T.L.; Lim, H.; Denison, M.I.J.; Oh, C. Transcriptomic and Physiological Analysis Reveals Genes Associated with Drought Stress Responses in Populus alba × Populus glandulosa. Plants 2023, 12, 3238. [Google Scholar] [CrossRef] [PubMed]
  12. Ali, S.; Tahir, S.; Hassan, S.S.; Lu, M.; Wang, X.; Quyen, L.T.Q.; Zhang, W.; Chen, S. The Role of Phytohormones in Mediating Drought Stress Responses in Populus Species. Int. J. Mol. Sci. 2025, 26, 3884. [Google Scholar] [CrossRef]
  13. Wang, X.C.; Zhao, Q.Y.; Ma, C.L.; Zhang, Z.H.; Cao, H.L.; Kong, Y.M.; Yue, C.; Hao, X.Y.; Chen, L.; Ma, J.Q.; et al. Global transcriptome profiles of Camellia sinensis during cold acclimation. BMC Genom. 2013, 14, 415. [Google Scholar] [CrossRef]
  14. Yang, W.-H.; Yong, S.-H.; Park, D.-J.; Ahn, S.-J.; Kim, D.-H.; Park, K.-B.; Jin, E.-J.; Choi, M.-S. Efficient Cold Tolerance Evaluation of Four Species of Liliaceae Plants through Cell Death Measurement and Lethal Temperature Prediction. Horticulturae 2023, 9, 751. [Google Scholar] [CrossRef]
  15. Shreyas, R.; Narasimhan, S. PEG-induced Drought Stress in Plants: A Review. Res. J. Pharm. Technol. 2021, 14, 6173–6178. [Google Scholar] [CrossRef]
  16. Tang, D.F.; Wei, F.; Qin, S.X.; Khan, A.; Kashif, M.H.; Zhou, R.Y. Polyethylene glycol induced drought stress strongly influences seed germination, root morphology and cytoplasm of different kenaf genotypes. Ind. Crops Prod. 2019, 137, 180–186. [Google Scholar] [CrossRef]
  17. Yang, X.; Lu, M.; Wang, Y.; Wang, Y.; Liu, Z.; Chen, S. Response Mechanism of Plants to Drought Stress. Horticulturae 2021, 7, 50. [Google Scholar] [CrossRef]
  18. Gao, Q.; Liu, Y.; Liu, Y.; Dai, C.; Zhang, Y.; Zhou, F.; Zhu, Y. Salicylic Acid Modulates the Osmotic System and Photosynthesis Rate to Enhance the Drought Tolerance of Toona ciliata. Plants 2023, 12, 4187. [Google Scholar] [CrossRef]
  19. Mignolet-Spruyt, L.; Xu, E.; Idänheimo, N.; Hoeberichts, F.A.; Mühlenbock, P.; Brosché, M.; Van Breusegem, F.; Kangasjärvi, J. Spreading the news: Subcellular and organellar reactive oxygen species production and signalling. J. Exp. Bot. 2016, 67, 3831–3844. [Google Scholar] [CrossRef]
  20. Zhang, Y.; Luan, Q.; Jiang, J.; Li, Y. Prediction and Utilization of Malondialdehyde in Exotic Pine Under Drought Stress Using Near-Infrared Spectroscopy. Front. Plant Sci. 2021, 12, 735275. [Google Scholar] [CrossRef] [PubMed]
  21. Ahmed, M.; Stockle, C. Quantification of Climate Variability, Adaptation and Mitigation for Agricultural Sustainability; Springer: Singapore, 2017; ISBN 978-981-10-8247-8. [Google Scholar]
  22. Ma, P.; Bai, T.-H.; Ma, F.-W. Effects of progressive drought on photosynthesis and partitioning of absorbed light in apple trees. J. Integr. Agric. 2015, 14, 681–690. [Google Scholar] [CrossRef]
  23. Flexas, J.; Bota, J.; Loreto, F.; Cornic, G.; Sharkey, T.D. Diffusive and metabolic limitations to photosynthesis under drought and salinity in C(3) plants. Plant Biol. 2004, 6, 269–279. [Google Scholar] [CrossRef] [PubMed]
  24. Ali, V.; Ali, Y.; Mehdi, Y. The salicylic acid effect on the tomato (Lycopersicum esculentum Mill.) sugar, protein and proline contents under salinity stress (NaCl). J. Biophys. Struct. Biol. 2010, 6, 4–16. [Google Scholar]
  25. Osakabe, Y.; Osakabe, K.; Shinozaki, K.; Tran, L.-S.P. Response of plants to water stress. Front. Plant Sci. 2014, 5, 86. [Google Scholar] [CrossRef] [PubMed]
  26. Szabados, L.; Savouré, A. Proline: A multifunctional amino acid. Trends Plant Sci. 2010, 15, 89–97. [Google Scholar] [CrossRef]
  27. Willekens, H.; Chamnongpol, S.; Davey, M.; Schraudner, M.; Langebartels, C.; Van Montagu, M.; Inzé, D.; Van Camp, W. Catalase is a sink for H2O2 and is indispensable for stress defence in C3 plants. EMBO J. 1997, 16, 4806–4816. [Google Scholar] [CrossRef]
  28. Zhang, A.; Liu, M.; Gu, W.; Chen, Z.; Gu, Y.; Pei, L.; Tian, R. Effect of drought on photosynthesis, total antioxidant capacity, bioactive component accumulation, and the transcriptome of Atractylodes lancea. BMC Plant Biol. 2021, 21, 293. [Google Scholar] [CrossRef]
  29. Galindo-Prieto, B.; Eriksson, L.; Trygg, J. Variable influence on projection (VIP) for OPLS models and its applicability in multivariate time series analysis. Chemom. Intell. Lab. Syst. 2015, 146, 297–304. [Google Scholar] [CrossRef]
  30. Wu, H.; Yang, Z. Effects of Drought Stress and Postdrought Rewatering on Winter Wheat: A Meta-Analysis. Agronomy 2024, 14, 298. [Google Scholar] [CrossRef]
  31. Secchi, F.; Pagliarani, C.; Zwieniecki, M. The functional role of xylem parenchyma cells and aquaporins during recovery from severe water stress. Plant Cell Environ. 2017, 40, 858–871. [Google Scholar] [CrossRef]
  32. Rosso, L.; Cantamessa, S.; Bergante, S.; Biselli, C.; Fricano, A.; Chiarabaglio, P.M.; Gennaro, M.; Nervo, G.; Secchi, F.; Carra, A. Responses to drought stress in poplar: What do we know and what can we learn? Life 2023, 13, 533. [Google Scholar] [CrossRef]
  33. Masud, M.; Matin, M.; Mst, F.; Ahamed, M.; Chowdhury, M.R.; Paul, S.; Karmakar, S.; Kang, S.G.; Hossain, M. Screening for drought tolerance and diversity analysis of Bangladeshi rice germplasms using morphophysiology and molecular markers. Biologia 2021, 77, 21–37. [Google Scholar] [CrossRef]
  34. Li, P.; Lin, P.P.; Zhao, Z.L.; Li, Z.H.; Liu, Y.M.; Huang, C.H.; Huang, G.Q.; Xu, L.N.; Deng, Z.H.; Zhang, Y.; et al. Gene Co-Expression Analysis Reveals Transcriptome Divergence between Wild and Cultivated Sugarcane under Drought Stress. Int. J. Mol. Sci. 2022, 23, 569. [Google Scholar] [CrossRef]
  35. Li, W.L.; Liu, Z.W.; Feng, H.; Yang, J.L.; Li, C.H. Characterization of the Gene Expression Profile Response to Drought Stress in Populus ussuriensis Using PacBio SMRT and Illumina Sequencing. Int. J. Mol. Sci. 2022, 23, 3840. [Google Scholar] [CrossRef]
  36. Dexter, S.T.; Tottingham, W.E.; Graber, L.F. Preliminary Results in Measuring the Hardiness of Plants. Plant Physiol. 1930, 5, 215–223. [Google Scholar] [CrossRef]
  37. Zhu, Z.; Liu, Y.; Wang, Y.; Jiang, A.; Meng, F.; Wang, B.; Chen, M. Integrated physio-biochemical and transcriptomic analyses reveal the mechanism underlying ABA-mediated alleviation of salt stress in Limonium bicolor seedlings. Environ. Exp. Bot. 2024, 220, 105707. [Google Scholar] [CrossRef]
  38. Yemm, E.W.; Willis, A.J. The estimation of carbohydrates in plant extracts by anthrone. Biochem. J. 1954, 57, 508–514. [Google Scholar] [CrossRef]
  39. Bradford, M.M. A rapid and sensitive method for the quantitation of microgram quantities of protein utilizing the principle of protein-dye binding. Anal. Biochem. 1976, 72, 248–254. [Google Scholar] [CrossRef]
  40. Bates, L.S.; Waldren, R.P.; Teare, I.D. Rapid determination of free proline for water-stress studies. Plant Soil 1973, 39, 205–207. [Google Scholar] [CrossRef]
  41. Ali, M.; Afzal, S.; Parveen, A.; Kamran, M.; Javed, M.R.; Abbasi, G.H.; Malik, Z.; Riaz, M.; Ahmad, S.; Chattha, M.S.; et al. Silicon mediated improvement in the growth and ion homeostasis by decreasing Na(+) uptake in maize (Zea mays L.) cultivars exposed to salinity stress. Plant Physiol. Biochem. 2021, 158, 208–218. [Google Scholar] [CrossRef] [PubMed]
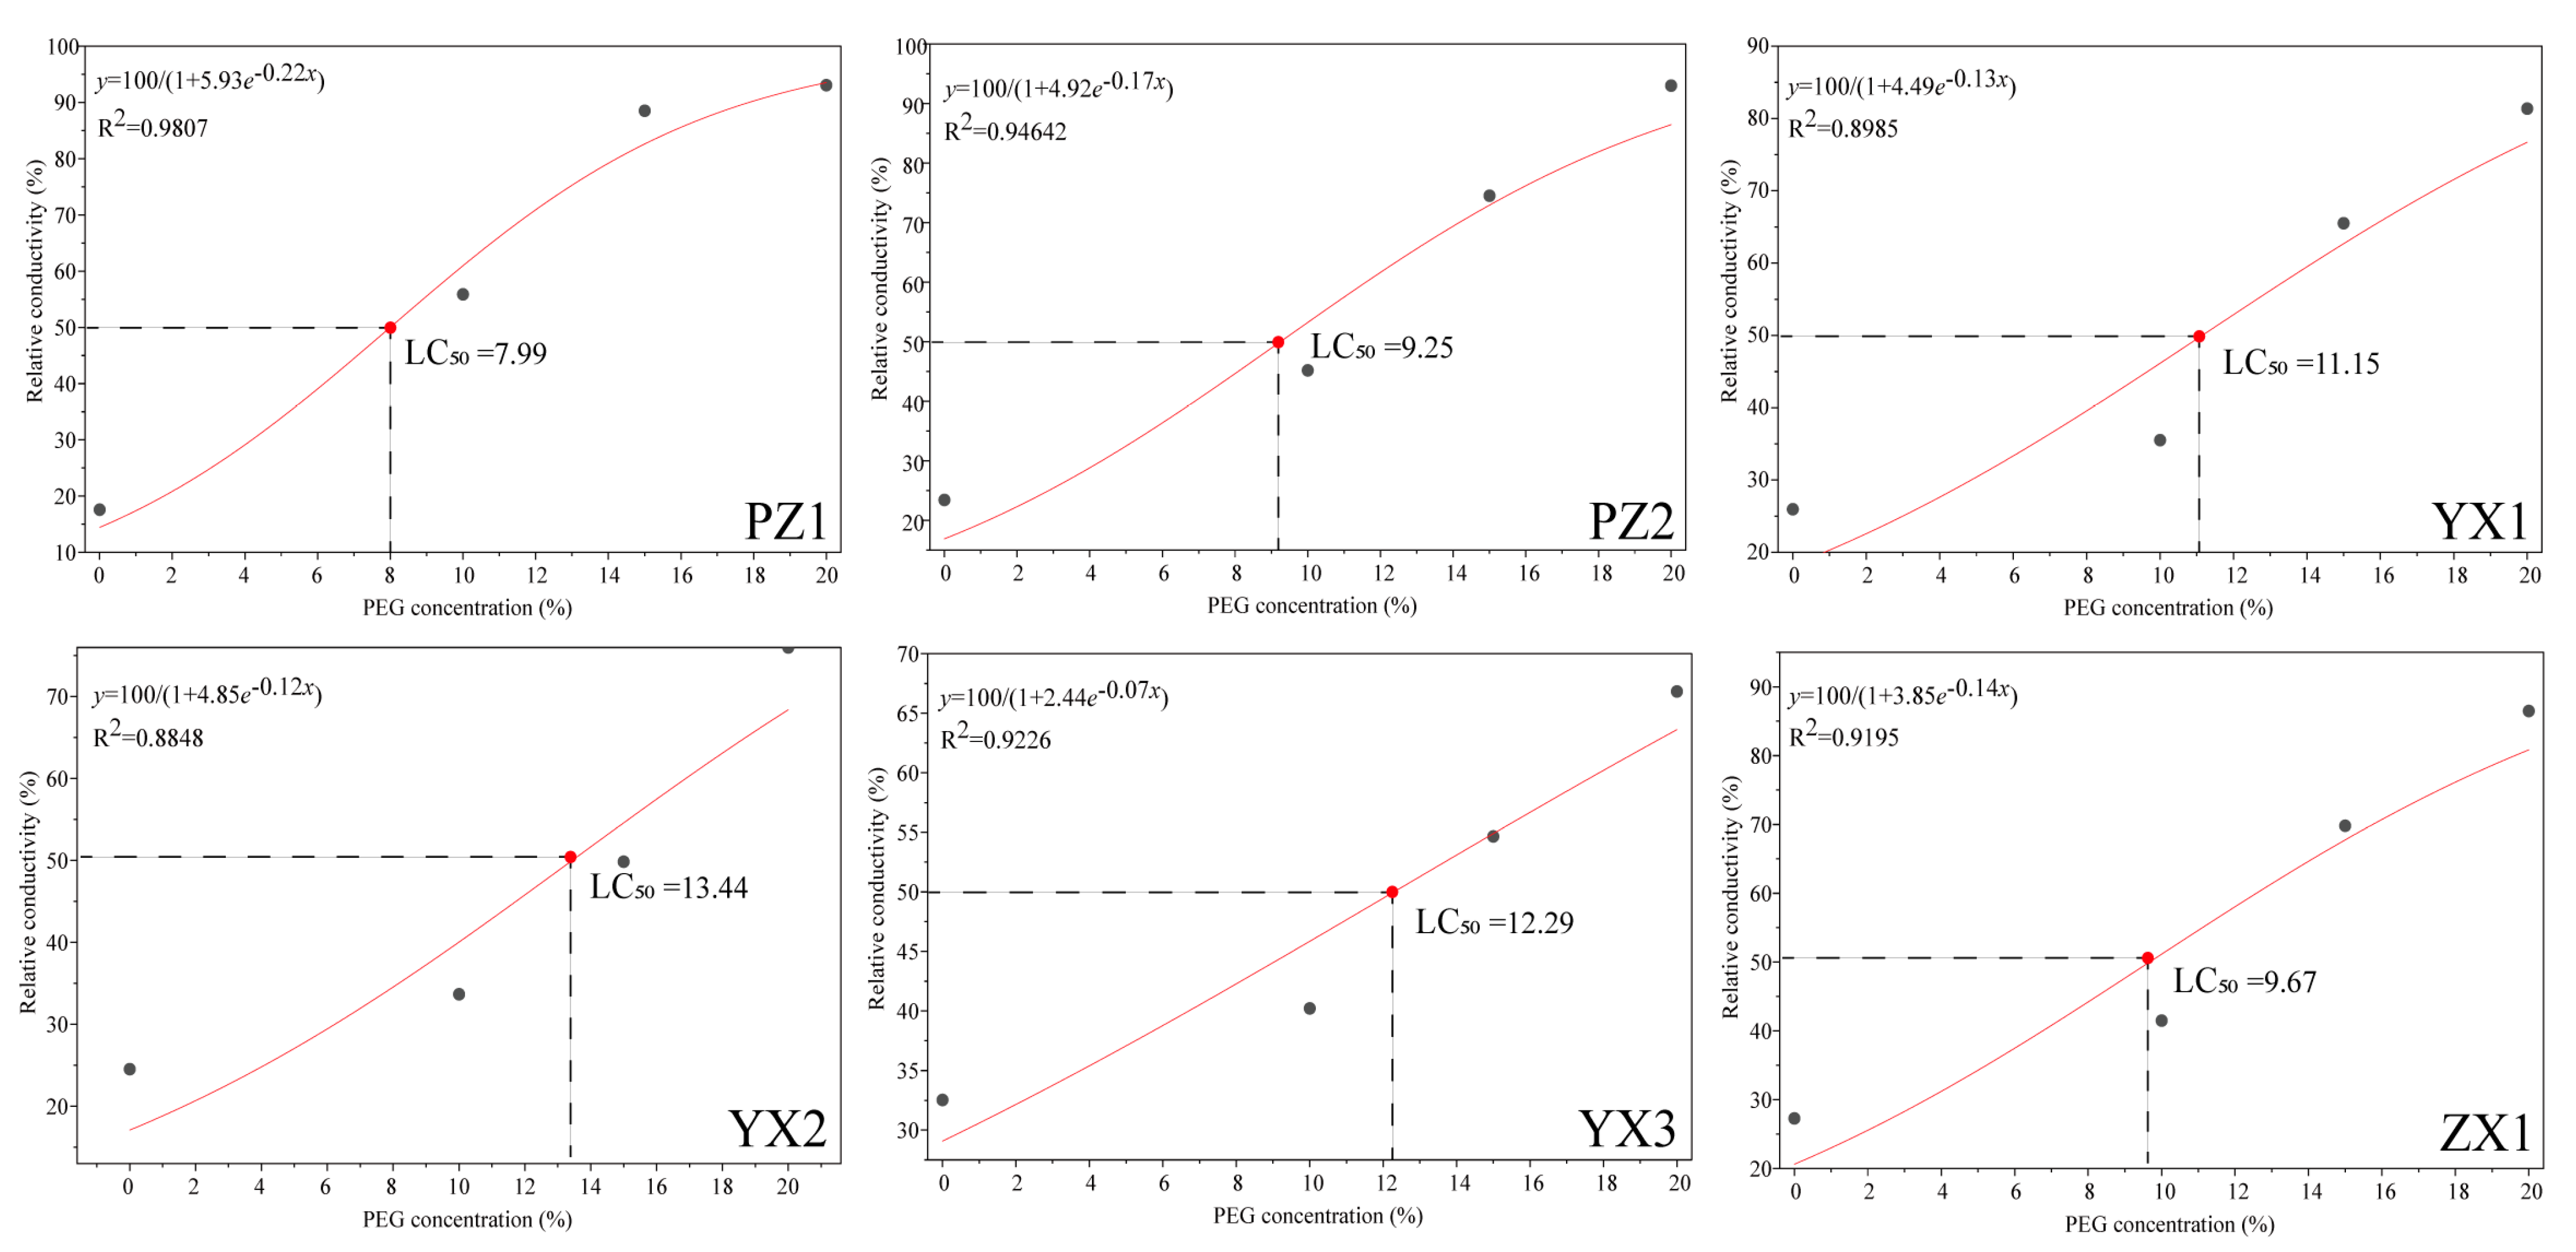
Figure 1. Response curves of relative electrical conductivity for six poplar varieties fitted using a logistic function as a function of PEG stress concentration.
Forests 16 01750 g001
Figure 2. Changes in (a) MDA content and (b) RWC of SS and ST varieties under drought stress. CK indicates the control treatment; DS indicates drought stress simulated by 10% PEG. The values are presented as the mean ± SE values of three independent biological replicates per treatment. Different symbols above the bar graphs indicate significant differences (p < 0.01) between treatment groups. FW indicates fresh weight. ** indicates p < 0.01.
Forests 16 01750 g002
Figure 3. Changes in Leaf Gas Exchange Parameters of SS and ST varieties under drought stress. (a) Pn, (b) Tr, (c) Gs, (d) Ci. CK indicates the control treatment; DS indicates drought stress simulated by 10% PEG. The values are presented as the mean ± SE values of three independent biological replicates per treatment. Different symbols above the bar graphs indicate significant differences between treatment groups. ns indicates p > 0.05; * indicates p < 0.05; ** indicates p < 0.01.
Forests 16 01750 g003
Figure 4. Changes in osmolyte content of SS and ST varieties under drought stress. (a) SS, (b) SP, (c) Pro. CK indicates the control treatment; DS indicates drought stress simulated by 10% PEG. The values are presented as the mean ± SE values of three independent biological replicates per treatment. Different symbols above the bar graphs indicate significant differences between treatment groups. ns indicates p > 0.05; * indicates p < 0.05; ** indicates p < 0.01. FW indicates fresh weight.
Forests 16 01750 g004
Figure 5. Changes in antioxidant enzyme activities of SS and ST varieties under drought stress. (a) CAT, (b) SOD, (c) POD. CK indicates the control treatment; DS indicates drought stress simulated by 10%PEG. The values are presented as the mean ± SE values of three independent biological replicates per treatment. Different symbols above the bar graphs indicate significant differences between treatment groups. ns indicates p > 0.05; * indicates p < 0.05; ** indicates p < 0.01. FW indicates fresh weight.
Forests 16 01750 g005
Figure 6. Principal Component Analysis (PCA) plot based on ten physiological and biochemical indicators.
Forests 16 01750 g006
Figure 7. Orthogonal Partial Least Squares Discriminant Analysis (OPLS-DA) revealed physiological marker differences. (a) OPLS-DA score plot; (b) Variable Importance Projection (VIP) value ranking. The dashed line indicates the VIP = 1.0 threshold; red boxes denote key physiological indicators.
Forests 16 01750 g007
Disclaimer/Publisher’s Note: The statements, opinions and data contained in all publications are solely those of the individual author(s) and contributor(s) and not of MDPI and/or the editor(s). MDPI and/or the editor(s) disclaim responsibility for any injury to people or property resulting from any ideas, methods, instructions or products referred to in the content.