Article

Multi-Indicator Drought Variability in Europe (1766–2018)

1
Alfred Wegener Institute for Polar and Marine Research, 27570 Bremerhaven, Germany
2
Forest Biometrics Laboratory, Faculty of Forestry, “Stefan cel Mare” University of Suceava, 720229 Suceava, Romania
*
Author to whom correspondence should be addressed.
Forests 2025, 16(11), 1739; https://doi.org/10.3390/f16111739
Submission received: 7 October 2025 / Revised: 3 November 2025 / Accepted: 10 November 2025 / Published: 18 November 2025
(This article belongs to the Section Forest Meteorology and Climate Change)

Abstract

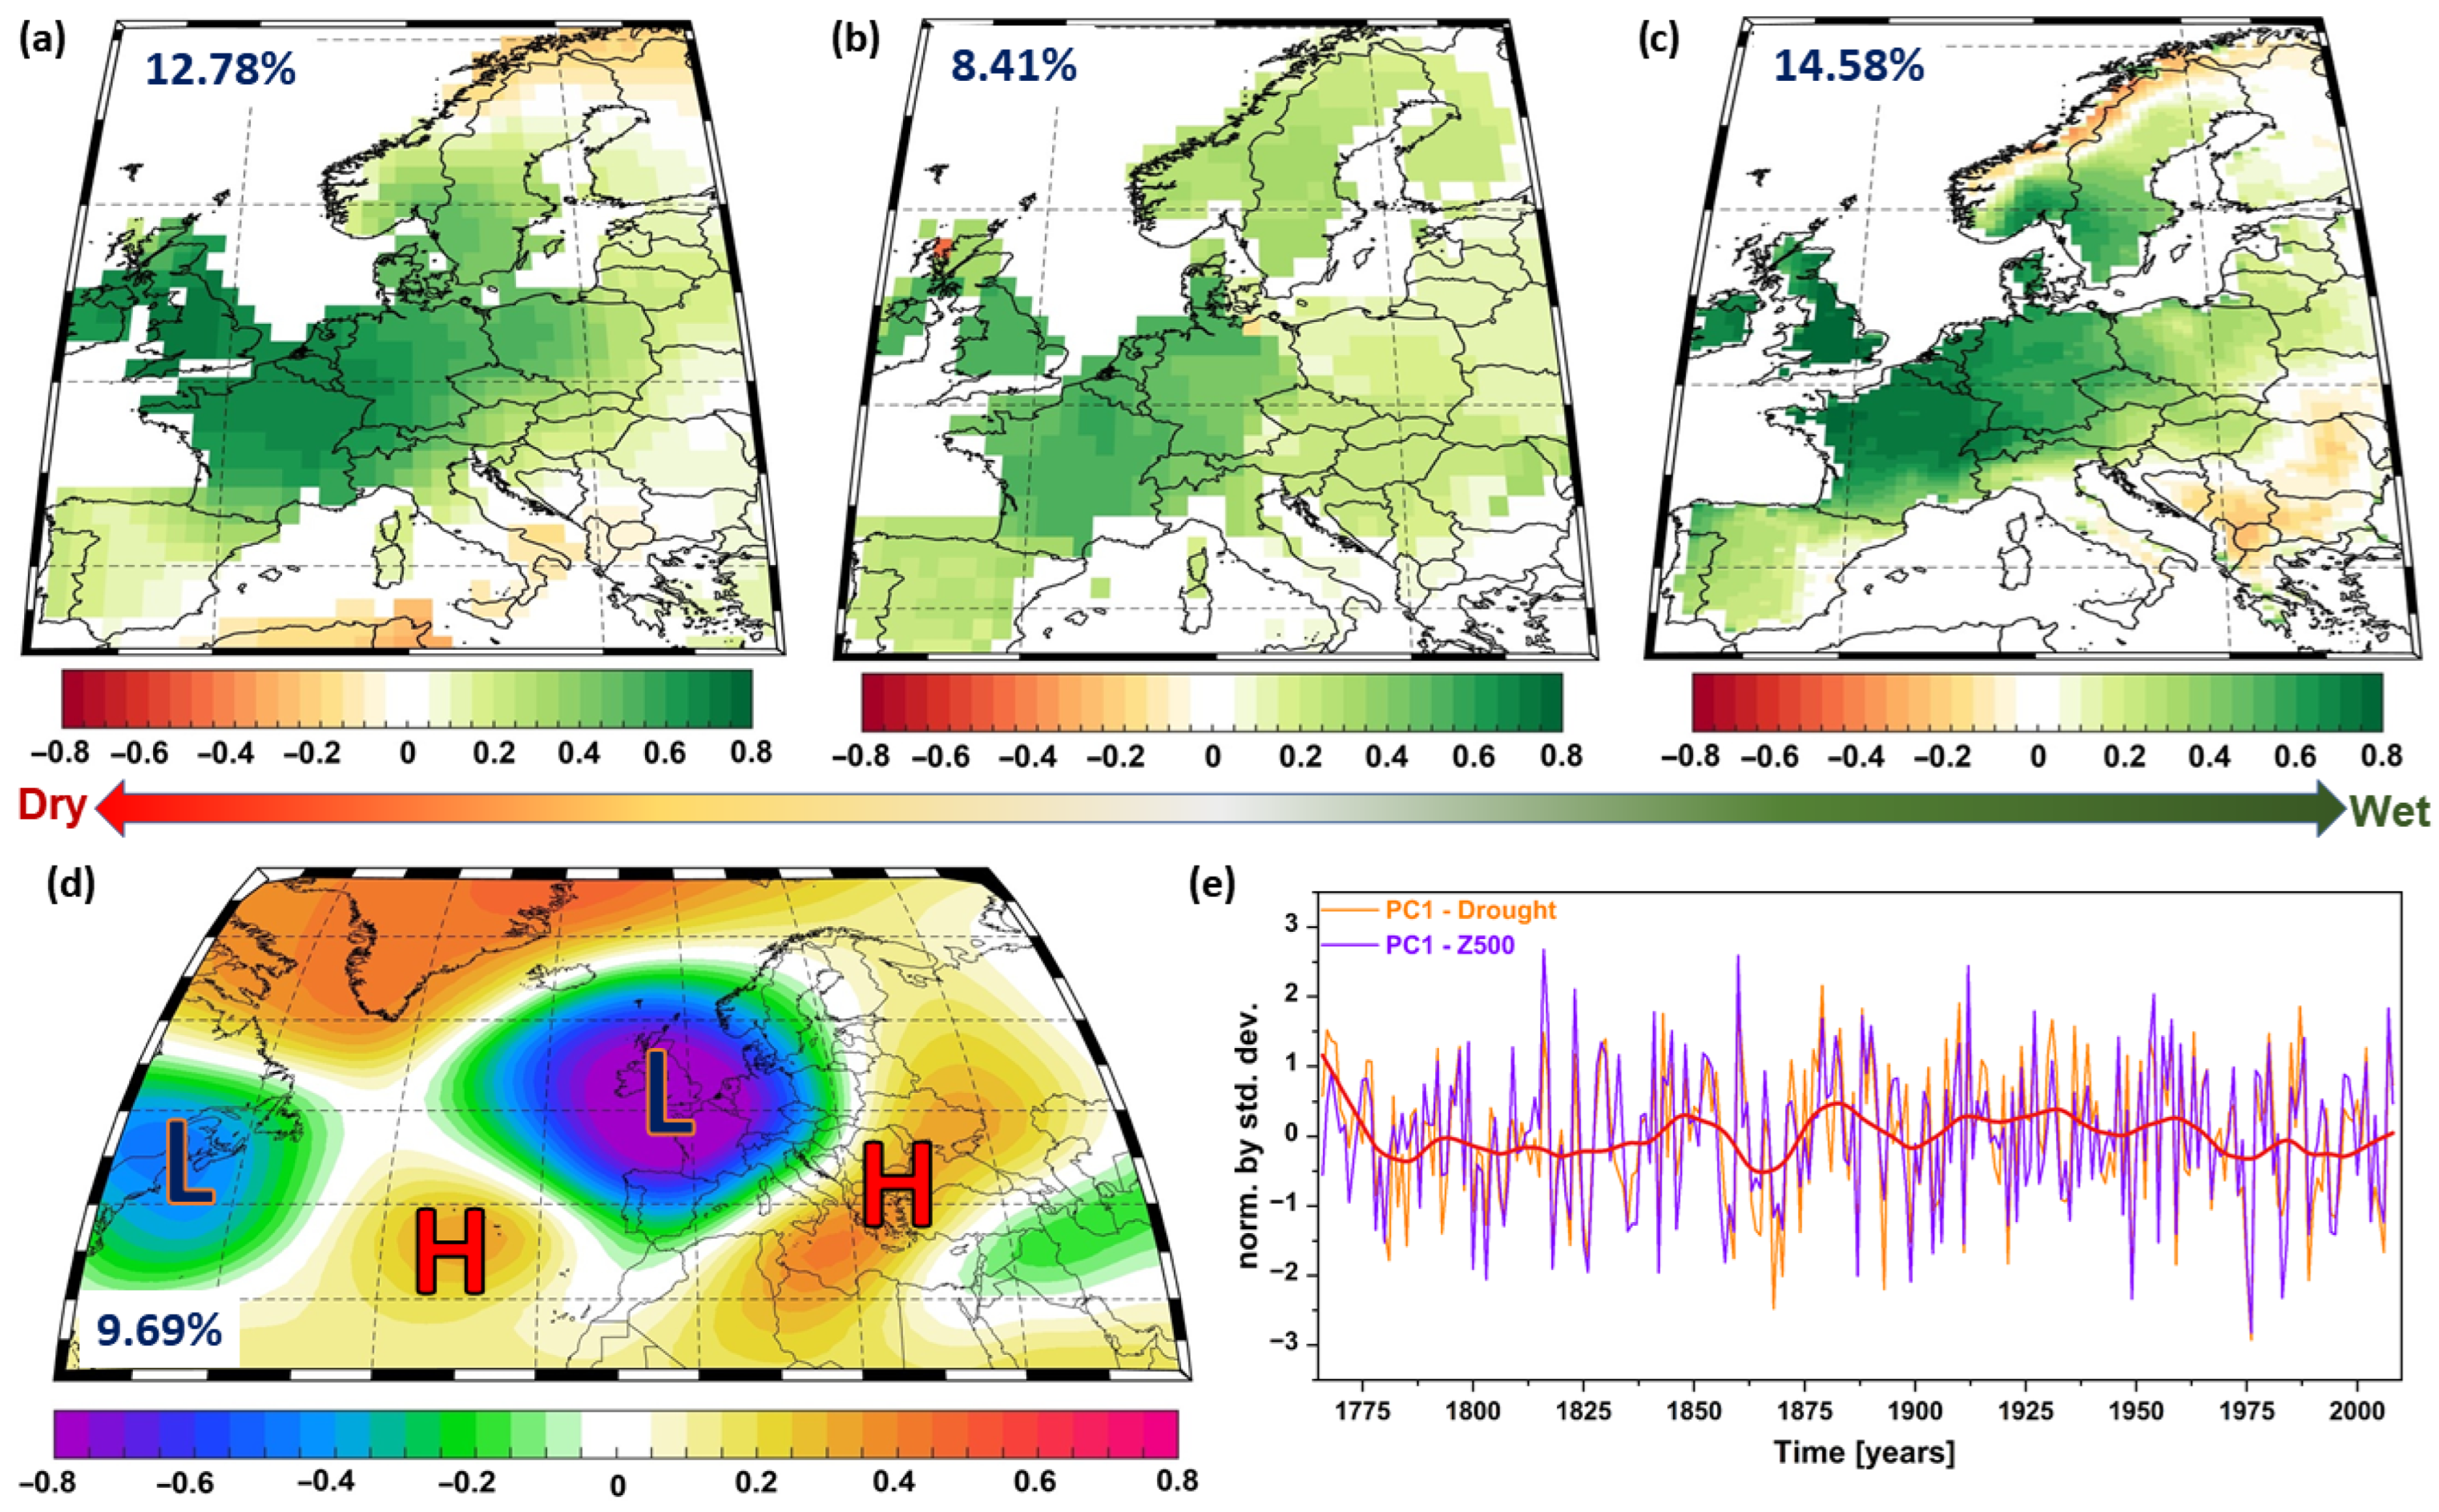
Accurately characterizing historical drought events is critical for understanding their spatial and temporal variability and for improving future drought projections. This study investigates extreme drought years across Europe using three complementary drought indicators: the Palmer drought severity index (PDSI, based on tree-ring width), the standardized precipitation evapotranspiration index (SPEI, based on stable oxygen isotopes in tree rings), and the soil moisture index (SMI, based on high-resolution climate modeling). We analyze the common period 1766–2018 simultaneously across all three reconstructions to enable direct cross-indicator comparisons, a scope not typical of prior single-indicator studies. When analyzing year-to-year variability, the driest European years differ by indicator (PDSI—1874, SPEI—2003, and SMI—1868). Quantitatively, the values exhibited are as follows: PDSI 1874 (M = −1.97; A = 64.4%), SPEI 2003 (M = −1.16; A = 90.1%), and SMI 1868 (M = 0.21; A = 83.4%). Multi-year extremes also diverge: while PDSI identifies 1941–1950 as the driest years (M = −0.82; A = 42.1%), SPEI highlights 2011–2018 (M = −0.36; A = 46.6%), and SMI points to 1781–1790 as the driest years, followed by 2011–2018. Trends in drought-covered areas show a significant European-scale increase for SMI (+0.52%/decade, p < 0.05) and regional increases for MED in SMI (~+1.1%/decade, p < 0.001) and for CEU in SPEI (+0.42%/decade, p < 0.05) and SMI (+0.6%/decade, p < 0.001). At the regional scale (Mediterranean—MED, central Europe—CEU, and northern Europe—NEU), the driest years/decades and spatial footprints vary by indicator, yet all the indicators consistently identify drought hotspots such as the MED. We also found that drought is significantly influenced by large-scale atmospheric drivers. A canonical correlation analysis (CCA) between summer geopotential height at 500 mb (Z500) and drought reconstructions indicates that drought-affected regions are, in general, associated with atmospheric blocking. The canonical series are significantly correlated at r = 0.82 (p < 0.001), with explained variances of 12.78% (PDSI), 8.41% (SPEI), and 14.58% (SMI). Overall, our study underscores the value of multi-indicator approaches: individual indicators provide distinct but complementary perspectives on European drought dynamics, improving the historical context for assessing future risk.

1. Introduction

Europe has experienced several protracted droughts in the 21st century with wide-ranging impacts [1,2,3,4,5,6,7,8], with events such as those in the years of 2015, 2018, and 2022 highlighting regional vulnerabilities to prolonged water scarcity, crop failure, forest dieback, and ecosystem damage [4,8,9,10,11]. During prolonged drought periods, agriculture faces yield losses and heightened irrigation demands, ecosystems endure wetland deterioration, reduced river flows, and higher wildfire risks [4,12,13], and domestic, industrial, and recreational water supplies are disrupted [1,14,15]. Crucially, despite this heightened attention, comparative assessments are constrained above all by data limitations—the absence of long-term, spatially consistent, and indicator-comparable datasets across Europe remains the primary obstacle to diagnosing drought severity, extent, and persistence.
Long-lasting European droughts reflect both natural variability and anthropogenic forcing [16,17,18,19,20]. As climate change continues to unfold, there is a pressing need to understand the causes, dynamics, and consequences of these long-lasting droughts in order to develop effective strategies for mitigation and adaptation [21,22,23]. Climate models and observational data have indicated a potential increase in the frequency and intensity of drought events across various regions in Europe [2,7]. Rising temperatures, altered precipitation patterns, and shifts in atmospheric circulation patterns are among the factors that contribute to the prolonged dry spells experienced in recent years [21,24,25]. Nevertheless, assessing projections against observational data is challenging due to the limited availability of instrumental records. Specifically, trends derived from short records are highly influenced by the chosen starting and ending dates and generally fail to capture long-term climate trends [15,16,21,26,27]. Thus, gaining a detailed understanding of the changes in the frequencies and intensities of extreme events at a regional and local scale is difficult, especially when considering long-term climate variations. The central barrier is the absence of long-term, spatially consistent (and indicator-comparable) datasets for Europe. Without such records, low-frequency variability is poorly resolved, regional disparities are obscured, and cross-indicator validation is infeasible. Accordingly, this study is motivated by—and explicitly addresses—this data limitation gap by assembling and jointly analyzing long-term, spatially explicit reconstructions to provide a coherent, continent-wide benchmark.
In this quest for knowledge, tree rings emerge as a valuable tool for reconstructing past drought variability [26,28,29], providing a long-term perspective beyond the limitations of instrumental records. The numerous drought reconstructions based on tree rings allowed for the identification of historical drought patterns, revealed the frequency, intensity, and duration of past droughts, helped improve understandings of climate teleconnections and the mechanisms driving droughts, and potentially enhance long-term forecasts. Even so, due to the complex characteristics (and features) of drought events and the multitude of available drought indices, there is a strong debate regarding the occurrence of the different drought events, and their intensities or frequencies from a long-term perspective.
The extremity of the events depends strongly on the drought indicator, the studied area, as well as on the magnitude of the event. Thus, determining the “unprecedented” nature of current droughts requires a comprehensive analysis of climate records and a comparison with historical drought events. In this respect, the main aim of this study is to perform a detailed analysis of short-term and multi-year drought events in Europe, employing three different long-term reconstructions for three different drought indicators in order to identify potential similarities/discrepancies between different drought indicators and their ability to capture the magnitude of extreme drought events, and to shed a light on the extremity of the recent drought events in Europe (Figure 1).
The specific objectives were (i) to analyze the magnitude and rank of the recent European drought events (e.g., 2015–2018) within a long-term perspective; (ii) to investigate the temporal evolution of the percentage of area affected by droughts; (iii) to provide a cross-validated analytical characterization of extremes by mapping the spatial patterns and extremities of the driest years and assessing the spatio-temporal evolution of decadal drought episodes across three independent reconstructions/indicators—the Palmer drought severity index (PDSI) [30], the standardized precipitation evapotranspiration index (SPEI) for the summer months [31], and the soil moisture index (SMI) [32], and (iv) to identify the large-scale atmospheric circulation patterns associated with dry/wet events over the common analyzed period (i.e., 1766–2008).

2. Data and Methods

2.1. Datasets

For the current study, we chose three complementary summer drought indicators: the Palmer drought severity index (PDSI, based on tree-ring width) [30], the standardized precipitation evapotranspiration index (SPEI, based on stable oxygen isotopes in tree rings) [31], and the soil moisture index (SMI, based on high-resolution climate modeling) [32], since all three reconstructions are open-source, and the tree-ring-based reconstructions reflect the summer (JJA) variability.
The reconstructed self-calibrated Palmer drought severity index (PDSI) used in the study is based on the Old World Atlas (OWDA) reconstruction of Cook [30]. The PDSI reconstruction captures the summer season history of droughts and pluvials reconstructed from tree rings spanning the past two millennia from Europe up to the Middle East. The PDSI reconstruction is based on a network of 106 annual tree-ring chronologies and it has been calibrated against the gridded monthly PDSI dataset from the CRU-TS 3.21 data [33]. At each 0.5° grid point of the JJA-observed scPDSI field (i.e., CRU-TS 3.21), tree-ring predictors and targets were pre-whitened with AR models to equalize persistence; after calibration, the instrumental persistence was added back to the reconstructions (“whiten-then-redden”). Calibration was used for the years 1928–1978, and validation was withheld for 1901–1927. Skill was assessed using CRSQ/CVRE in calibration and VRSQ, VRE, and VCE in validation. For each grid cell, a principal-components regression (PCR) model was fitted to the local pool of chronologies found within an initial 1000 km search radius, expanded in 50 km steps where needed to ensure ≥20 chronologies per model. The result is a year-by-year JJA scPDSI map series on a 0.5° grid over the OWDA domain, suitable for direct analysis of drought/pluvial history. PDSI [34,35] is a widely used metric to measure the duration and intensity of long-term drought. In Palmer’s water-balance framework, the monthly moisture departure is as follows: d t = P ^ t P t , with P ^ t = α P E T + β P R + γ P R O   δ P L , where PET is potential evapotranspiration, PR—potential recharge, PRO—potential runoff, and PL—potential loss, and α ,   β ,   γ ,   δ are calibration coefficients. The Palmer Z-index is Z t = K t d t , where K t is a local, month-specific calibration factor. scPDSI then forms a weighted accumulation of Z t with empirically determined persistence (duration) factors to yield the monthly index value; the self-calibration adjusts these factors so that standardized categories have consistent frequencies at each location.
The PDSI provides a physically interpretable, cumulative water-balance metric based on widely available precipitation and temperature data—and its self-calibrating variant enhances temporal comparability at a site—but it suffers from limited spatial comparability, a fixed intrinsic time scale with strong autocorrelation, sensitivity to the chosen potential evapotranspiration formulation (e.g., Thornthwaite vs. Penman–Monteith), and a simplified soil-bucket scheme that omits processes such as snow accumulation/melt, which can bias assessments across climates.
In general, PDSI is beneficial for tracking long-term drought trends over months or years, which is particularly useful for monitoring climate change and planning water resources, since it considers both weather conditions and soil moisture, which are important in understanding the overall water balance and the effect of drought on agriculture. Moreover, because of its long-standing use, it is widely recognized and utilized in policy and planning, impacting decisions in agriculture, water management, and climate adaptation strategies [36,37,38]. Nevertheless, due to its lack of short-term sensitivity, it is less effective for tracking short-term or flash droughts because it is primarily designed to monitor longer-term drought conditions. Furthermore, it can sometimes provide an inaccurate representation of drought severity in regions with non-standard climates, such as very cold or very wet regions. Two of the main disadvantages of the PDSI are as follows: (i) in its computation, it does not account for other variables that can affect droughts, such as snowpack, groundwater levels, and evapotranspiration rates, and (ii) it typically uses a fixed time scale of months to years, which may not accurately capture the onset and end of drought conditions, particularly in regions with volatile weather climates [5,34].
The reconstructed standardized precipitation evapotranspiration index (SPEI) is based on a recently published reconstruction by Freund [31], who used tree-ring isotope records to reconstruct SPEI (JA) from 1600 to 2018. The reconstruction uses 26 annually resolved δ18O and δ13C series from well-distributed European sites (oaks in lowlands; conifers at high latitudes/elevations). Seasonal screening showed the strongest and most spatially coherent proxy–climate association with summer SPEI, motivating a July–August target. The calibration target is JA SPEI-02 from SPEIbase v2.6 (1901–2018), computed from CRU T [39] precipitation and potential evapotranspiration. For each grid point, a point-by-point regression (PPR) was fit using principal components of nearby proxy series within an 800 km radius; predictors were correlation-weighted by the 0.5 power of their correlation with the target. Predictand and predictors were pre-whitened to remove serial autocorrelation for calibration; the instrumental persistence was added back to the reconstruction afterward. Models were built in nests to maximize length, and lost variance was rescaled to the instrumental mean/SD, yielding a seamless extension to 2018. The calibration and verification periods were 1914–1963 and 1964–1998, respectively. Overall, SPEI has been developed to address some of the PDSI limitations (e.g., fixed time scales and the incorporation of potential evapotranspiration) [40]. SPEI is a multiscalar drought index, meaning that it can be calculated over different time scales. It incorporates both precipitation and potential evapotranspiration (PET) in its calculation, allowing it to account for the effect that temperature has on drought through its influence on the demand for water (evapotranspiration). This is an important added value, especially when studying recent and future droughts, where the effect of potential evapotranspiration plays a crucial role in the development of drought conditions [5,24,25,40]. SPEI quantifies standardized climatic water balance over a chosen time scale by combining precipitation (P) and potential evapotranspiration (PET). First, the k-month accumulated water balance is computed: D t ( k ) = i = 0 k 1 ( P t i P E T t i ). After that, a three-parameter log-logistic distribution to D t ( k ) is fitted, and finally, the data is transformed to a standard normal variate S P E I t =   Φ 1 F D t k .
SPEI can be used to characterize drought in terms of intensity, duration, and frequency, making it a valuable drought indicator for risk assessments and mitigation planning. Like other drought indices (e.g., the standardized precipitation index, PDSI), SPEI may not detect the onset of drought immediately due to the accumulation of data over time scales and is more useful when studying drought features over longer time scales. One of the most important drawbacks of SPEI is that, in its estimations, it requires the use of potential evapotranspiration, which is a complex measure and can be computed using various methods, potentially leading to different values and interpretations of the SPEI. The SPEI reconstruction used in this study was constructed for an accumulation period of two months (SPEI2 JA) and averaged over the months July–August (see [31] for more details about the choice of this accumulation period and the statistics of the reconstruction).
For the soil moisture indicator, we made use of the soil moisture index (SMI) reconstruction at the European level, recently published by Rakovec [32]. This indicator aims to measure the duration and intensity of drought events. The SMI reconstruction is based on the mesoscale hydrologic model (mHM) forced with long-term paleoreconstructions (e.g., precipitation and near-surface air temperature datasets for the period of 1766–2015 [41]) and observations (e.g., daily gridded observational dataset for precipitation and temperature for the period of 1950–2020) based on the E-OBS v21 dataset [42]. The root-zone soil moisture is simulated with mHM, forced by observation-based and reconstructed meteorology, and monthly soil-moisture anomalies are converted to a percentile-type index (0 = driest, 1 = wettest) via a non-parametric estimation of the month-specific conditional CDF. For grid cell i and calendar month m, let {x1, …, xn} be the monthly soil-moisture fractions; the kernel density is estimated as f ^ x = 1 n h k = 1 n K x   x k h ,   K() Gaussian, and SMI is then defined as S M I i , m x = 0 x f ^ u d u . The reconstructed SMI has a 0.5° × 0.5° spatial resolution. A detailed description of the mHM model can be found in Kumar [43], while details about the calibration and validation of the SMI reconstruction can be found in Rakovec [32].
The observed PDSI and SPEI2 JA datasets used in this study are based on the CRU TS v. 4.07 dataset [39]. Both indices have a 0.5° × 0.5° spatial resolution and cover the period of 1901–2021. For the current study, only the period of 1901–2018 has been used in order to overlay it with the reconstructed datasets. The calculation of the standardized precipitation evapotranspiration index (SPEI) relies on the probability distribution of the difference between precipitation (PP) and potential evapotranspiration (PET), referred to as PP-PET (precipitation minus potential evapotranspiration). To obtain the SPEI, the data was normalized using a log-logistic probability distribution, as described by [44]. The estimation of potential evapotranspiration data was carried out using the Penman–Monteith equation, as outlined by Vanderlinden [45]. For the current study, we used SPEI for an accumulation period of 2 months (i.e., SPEI2 JA), averaged over the months of June and August, to be able to properly compare the observational data with the reconstructed SPEI field [31].
To study the long-term drivers of summer drought variability, we utilize a monthly paleoclimate reanalysis dataset spanning the period of 1766 to 2008 (i.e., EKF400v2) [46]. This dataset was created using data assimilation techniques, combining observational data and model simulations to reconstruct past climate conditions. It incorporates early instrumental measurements, documentary evidence, tree-ring data, and atmospheric general circulation model simulations.

2.2. Methods

Trend analysis. Trend analysis was used to detect monotonic changes in drought-related time series, including European and subregional percentage areas under drought and domain-mean values of PDSI, SPEI2 JA, and SMI. We applied the Mann–Kendall (MK) test [47], widely used in hydrometeorology [48,49], and accounted for serial dependence through the variance correction proposed by Hamed and Rao [50], with additional treatment of ties and autocorrelation following Hamed and Rao [50]. Statistical significance was evaluated from the two-sided MK Z statistic with the mean zero and unit variance at α = 0.05, where positive values denote upward trends and negative values denote downward trends. We adopted the modified MK rather than the original because hydroclimatic series commonly exhibit serial correlation and ties, which violate the independence assumption and inflate Type-I error. Following Hamed and Rao [50], we adjust the MK variance for autocorrelation without pre-whitening, and apply the tie correction of Hamed and Rao [50]. This yields more reliable significance assessments while preserving the underlying trend signal. Trend magnitude was estimated with the non-parametric Sen’s slope [51], providing a robust rate of change per unit of time. In this study, the trend framework establishes whether drought area and regional- and European-scale drought indicators exhibit significant long-term tendencies and enables the comparison of trend signs and magnitudes across indicators and regions.
Canonical correlation analysis. Canonical correlation analysis (CCA) was employed to investigate the relationship between the reconstructed drought variability and large-scale atmospheric circulation [27]. We first reduced dimensionality by projecting both summer (JJA) 500 hPa geopotential height (Z500) and each drought field (OWDA-PDSI, SPEI2 JA, and SMI) onto their first ten empirical orthogonal functions (EOFs), which explained approximately 85% of the variance in Z500 and 81% in the drought fields. After area-weighting, CCA extracted spatial patterns and canonical variates that maximize cross-correlation between the atmospheric circulation and drought fields, yielding canonical correlations, spatial loadings, and explained variance. These diagnostics allowed us to identify physically coherent links between atmospheric circulation and drought variability, and to evaluate the consistency of circulation drivers across the three drought indicators.
Regional and European mean indices. All analyses in the main manuscript use the common period of 1766–2018 on the native 0.5° grid of each reconstruction (JJA scPDSI; JA SPEI-02; and SMI) to enable direct cross-indicator comparison. For each domain R (EURO—the entire European grid, MED—the Mediterranean region, CEU—the central European region, and NEU—the northern European region, see Figure 1a for locations), the regional index (i.e., time series) is defined as the grid-cell mean over land cells in R over time: M R t =   1 R i R X i ( t ) , with X denoting the relevant indicator field (PDSI, SPEI, or SMI). Decadal indices are obtained by averaging the gridded fields over 10 consecutive years (e.g., 1941–1950), then computing M R from the decadal-mean field.
Percent area under drought (A). For each indicator and region R, we define a fixed drought threshold τ X , R as the 10th percentile (Q10) of the regional time series (see definition above for the time series and thresholds in Table 1). The annual percentage area under drought is then defined: A R t = 100 ×   # { i R : X i t <   τ X , R } R (%). At the decadal scale, we first computed the decadal-mean gridded field and then computed A R using the same τ X , R .

3. Results

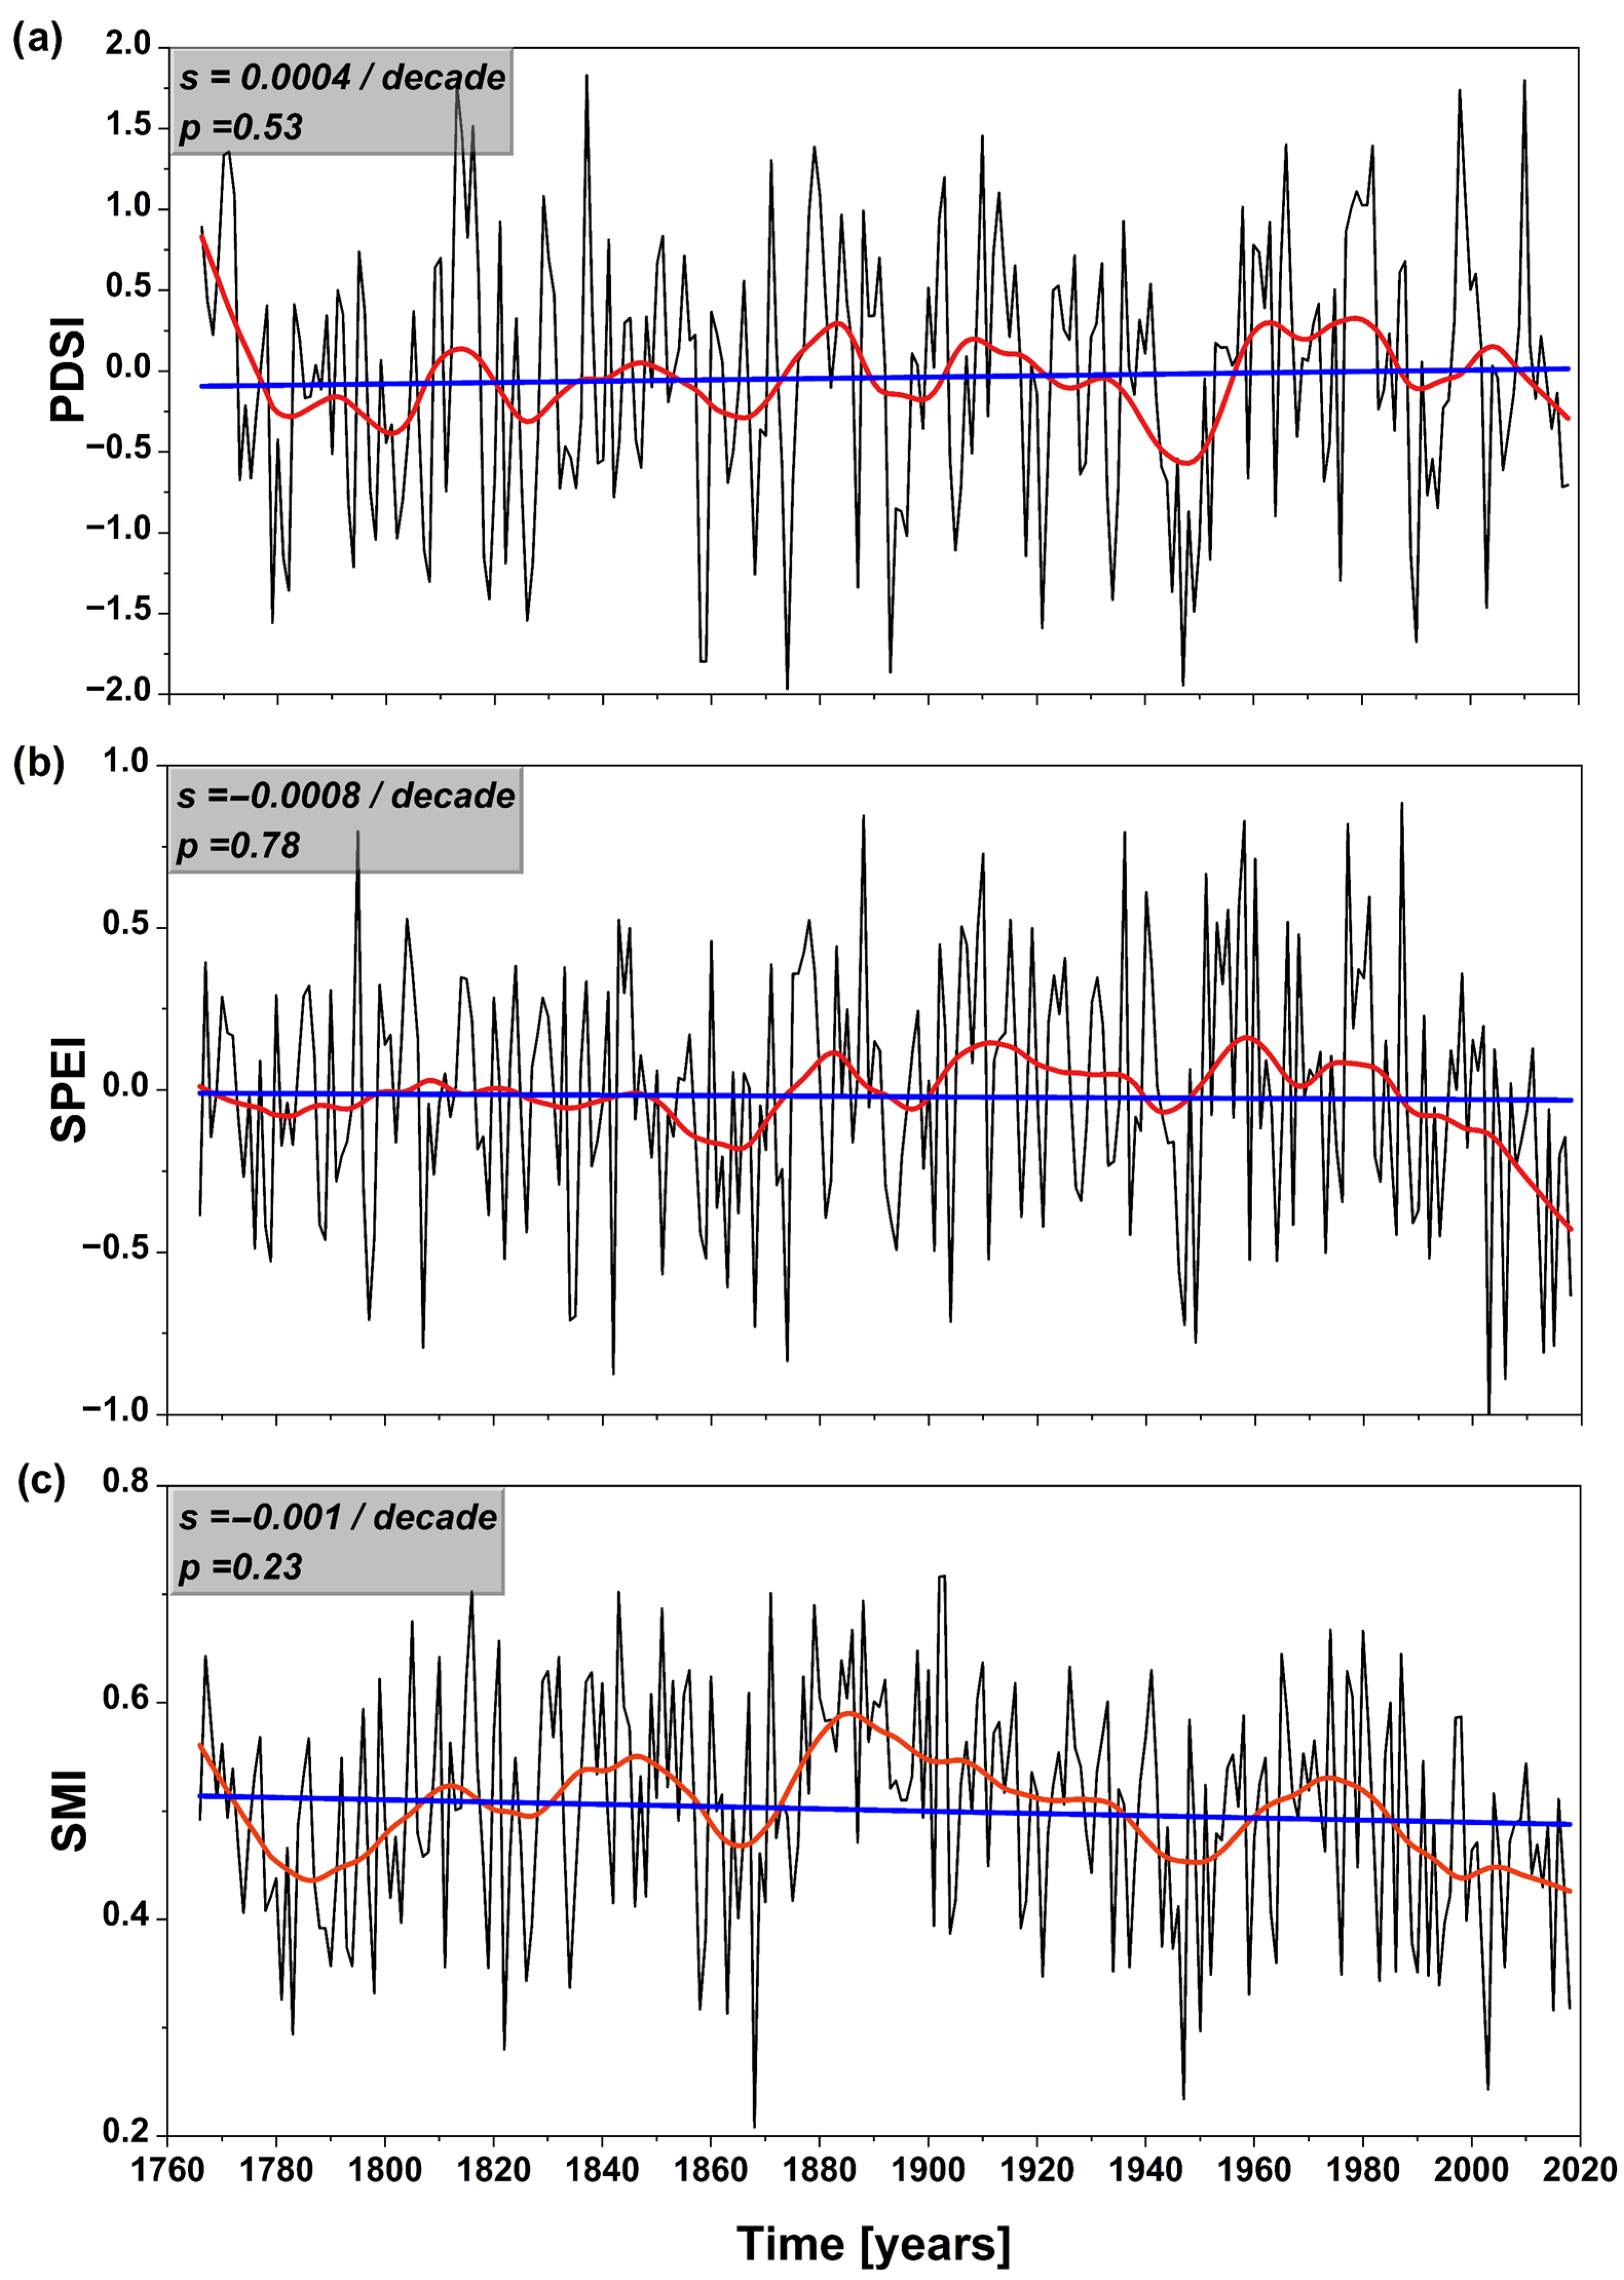
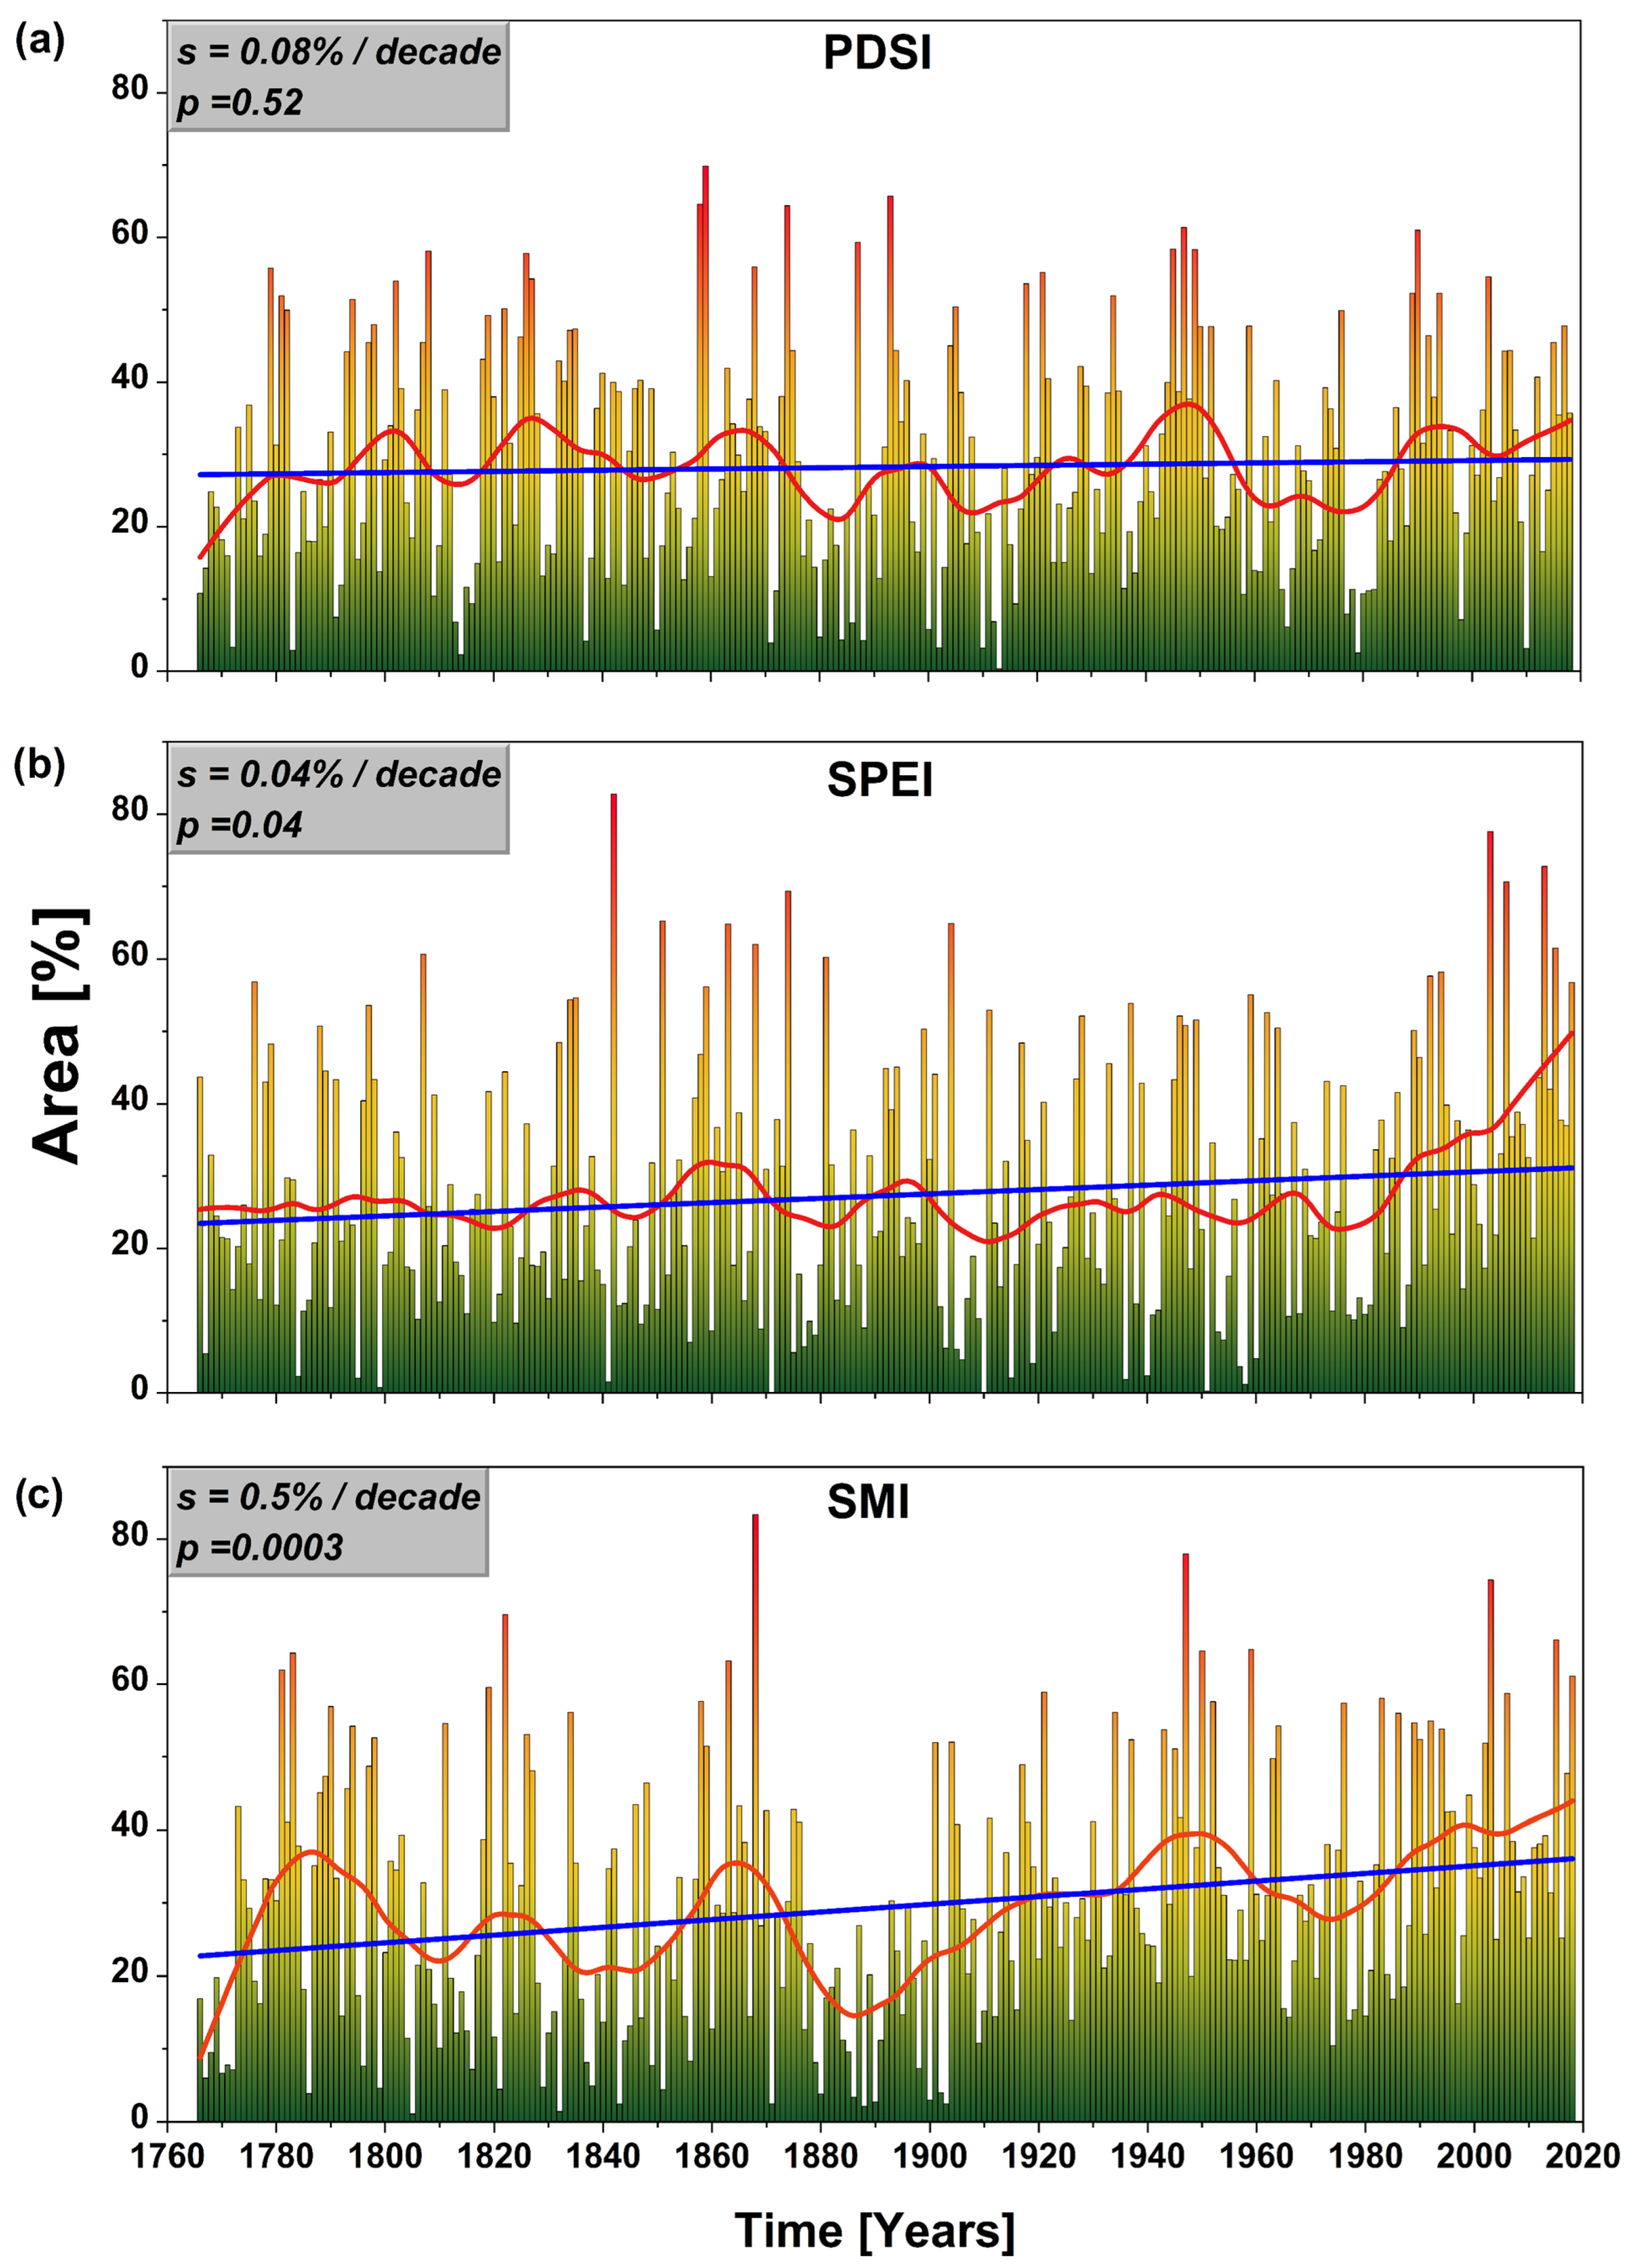
In the past ten years, Europe has experienced several notably arid summers, such as the ones in 2015, 2018, 2019, and 2022, which have already been extensively examined in prior research [10,24,32,52]. To gain a broader understanding of the drought events over the last decade and put them in a long-term context, we have calculated the magnitude (M) and the extent (A) of drought-affected regions at the European level (Figure 2 and Figure 3), as well as over the Mediterranean (MED, Figures S5 and S6), central Europe (CEU, Figures S8 and S9), and northeastern Europe (NEU, Figures S11 and S12) separately. The drought-covered area is computed over the grid points where the values of each drought indicator fall below the threshold defined by the 10th (Q10) percentile of the whole time series. The times series for the definition of Q90 have been computed for each separate region (i.e., MED, CEU, and NEU) as well as for the whole of Europe (i.e., EURO). The time series used to compute Q10 are shown in Figure 2 (EURO), Figure S1 (MED), Figure S4 (CEU), and Figure S7 (NEU), and the threshold for each indicator is shown in Table 1.

3.1. The Extremities of Individual Years

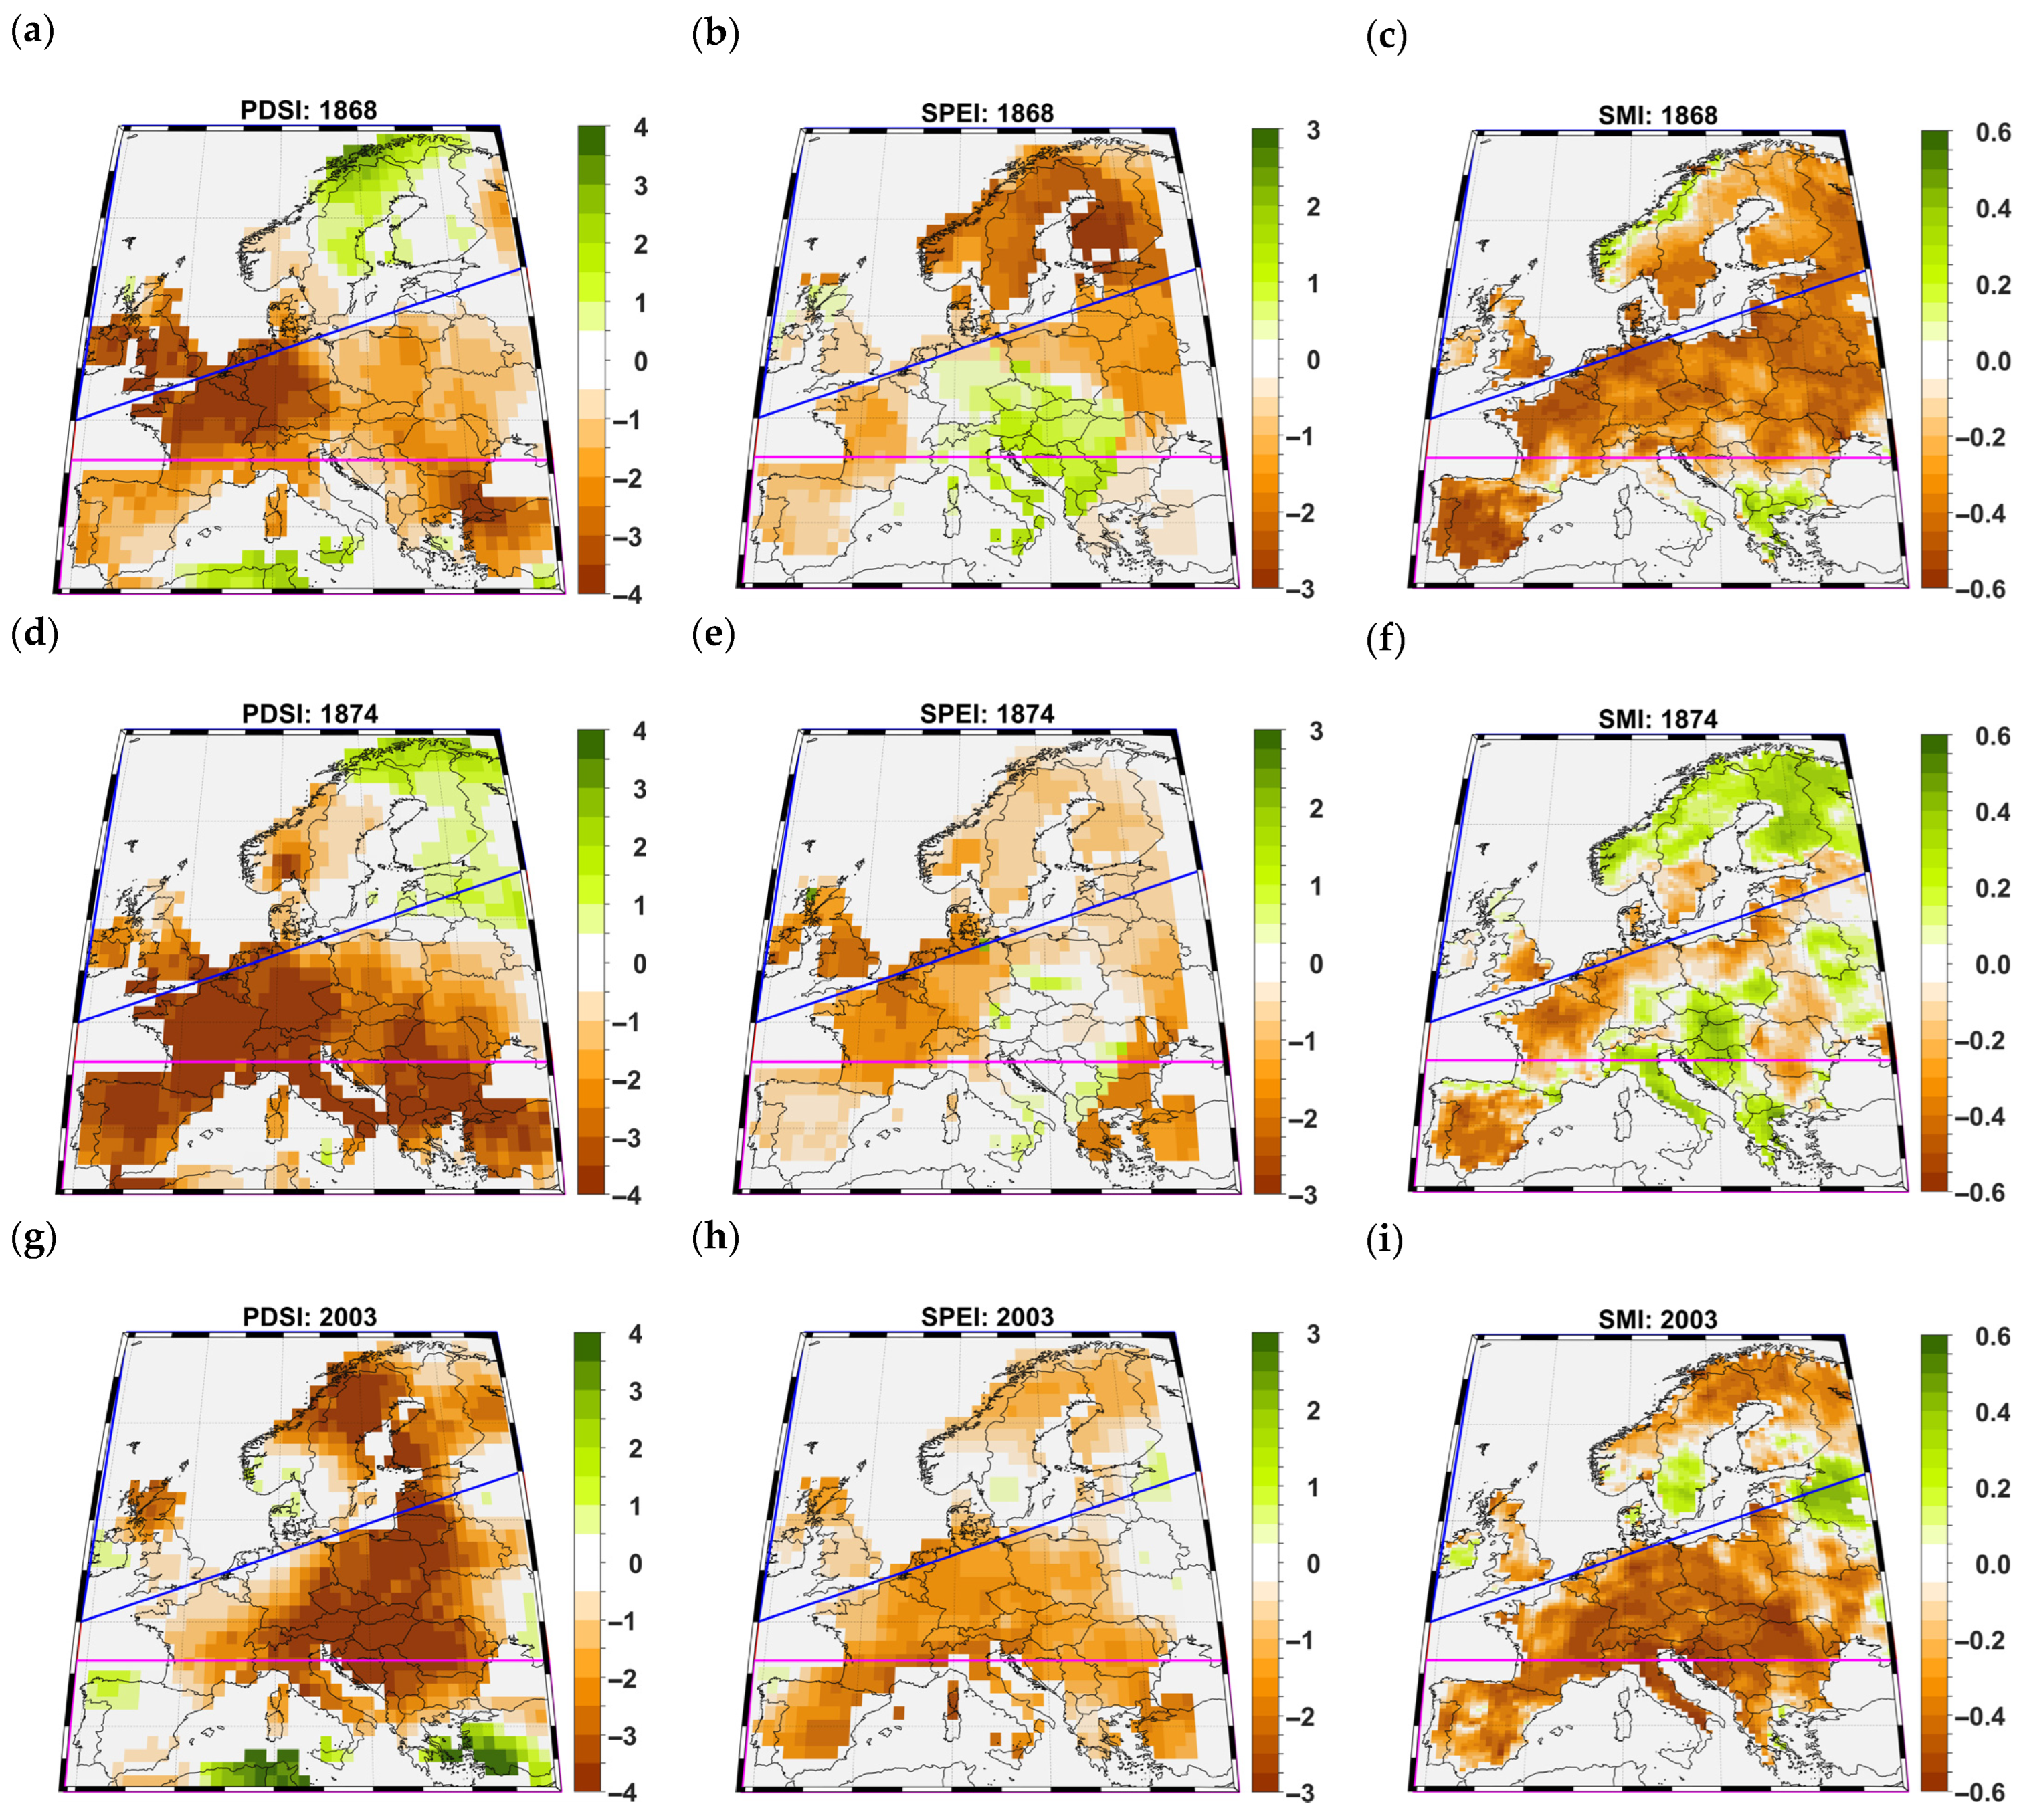
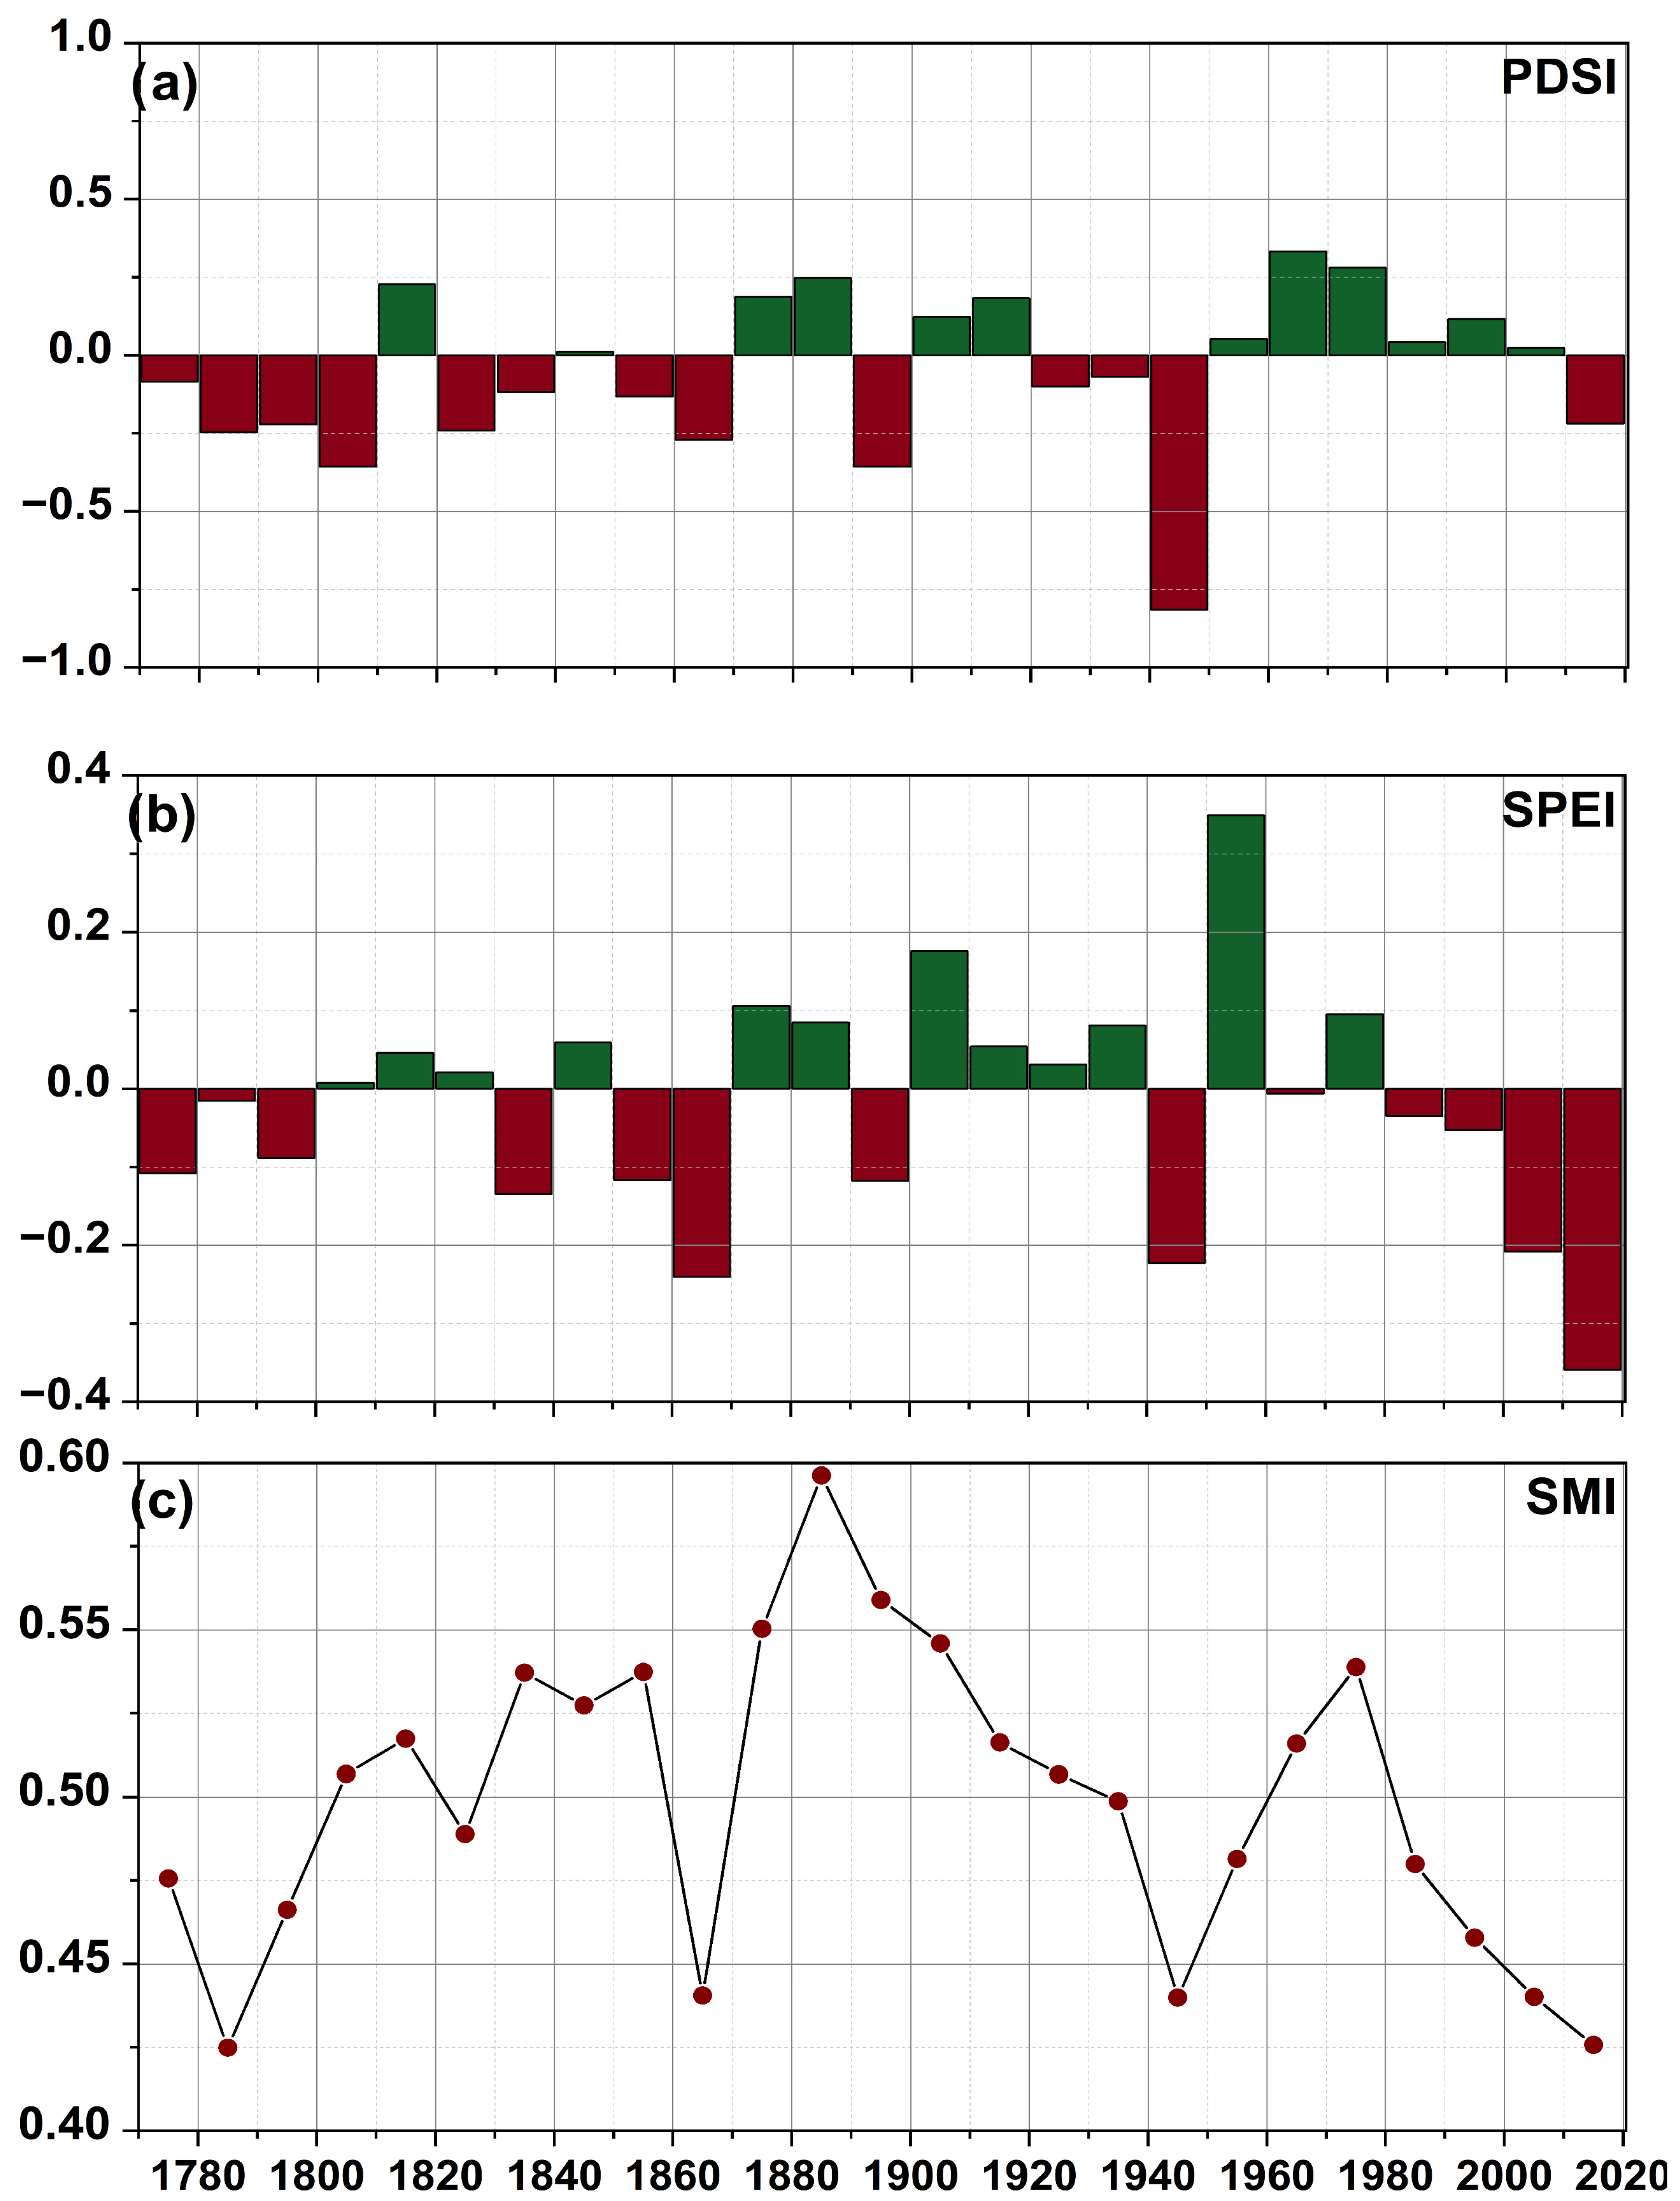
For Europe as a whole (EURO), none of the indices show a significant trend in drought magnitude or area (Figure 2 and Figure 3). The exception to this is SMI, which exhibits a significant increase in drought-covered area of 0.52% per decade (p < 0.05) over the period of 1766–2018 (Figure 3c). Unlike PDSI and SPEI, SMI indicates an expanding drought extent despite stable long-term water-balance and temperature trends, suggesting that soil moisture—as a direct indicator—may be more sensitive to changes in evapotranspiration or soil retention. The driest year over the period of 1766–2018 differs by index: 1874 for PDSI (M = −1.97, A = 64.4%), 2003 for SPEI (M = −1.16, A = 90.1%), and 1868 for SMI (M = 0.21, A = 83.4%) (Table 2; Figure 4).
The extreme years in Figure 4 (1868, 1874, and 2003) display spatial patterns whose magnitudes and extents vary by index (SMI, PDSI, and SPEI), but the broad geography of drought-prone regions is similar. In 1868, PDSI and SPEI show widespread drought across central and southern Europe, while SMI captures extensive soil-moisture deficits with regionally varying intensity. In 1874, PDSI and SPEI highlight pronounced drought over southern Europe, whereas SMI shows contrasting soil-moisture anomalies, especially in northern areas. In 2003, a severe event, PDSI and SPEI indicate extensive central European drought, with SMI emphasizing more localized impacts in southern and southeastern Europe.
In the Mediterranean (MED), only SMI shows a drying trend (~0.025 per decade, p > 0.05; Figure S5c) and a significant rise in drought-covered area (~1.1% per decade, p < 0.001; Figure S6c), whereas PDSI and SPEI show no significant trends over the period of 1766–2018 or over their full periods (PDSI: 1401–2018; SPEI: 1601–2018). The driest MED year—by a joint assessment of magnitude (M) and area (A)—is 1945 for PDSI (M = −3.60, A = 96.6%) and SMI (M = 0.07, A = 96.5%), and 2012 for SPEI (M = −1.78, A = 98.3%) (Figure S7; Table 2 and Table S1).
In central Europe (CEU), no index shows a significant trend in event magnitude (Figure S8), but drought-covered area increases significantly for SPEI (0.42% per decade, p < 0.05) and SMI (0.6% per decade, p < 0.001) during the period of 1766–2018 (Figure S9). The driest CEU year is 1921 for PDSI (M = −3.77, A = 94.6%), 2015 for SPEI (M = −1.52, A = 97.8%), and 1868 for SMI (M = 0.15, A = 92.7%) (Figure S10; Table 2 and Table S1).
Northern Europe (NEU) shows a different picture: PDSI and SPEI indicate a small, non-significant wetting trend (Figure S11), and no index shows a significant change in drought-covered area (Figure S12). The driest NEU year—by a joint assessment of M and A—is 1826 for PDSI (M = −3.19, A = 89.2%) and SMI (M = 0.06, A = 98.1%), and 1868 for SPEI (M = −1.69, A = 75.4%) (Figure S12; Table 2 and Table S1). PDSI and SMI identify the same most extreme years in MED (1945) and NEU (1826), whereas in CEU and EURO the indices select different extreme dry years. Detailed descriptions of each event by index are provided in the Supplementary Materials.

3.2. European Droughts: A Decadal Perspective

So far, we have focused our analysis on the extremities of individual years, but the impact of a drought depends on how long it lasts, and this aspect must be taken into account when assessing the spatio-temporal evolution of drought events. While single-year events might also have a high impact on forestry, agriculture, water management, and ecosystems, among others, multi-year droughts are the ones with the most extensive impacts [9,53,54]. For example, while ecosystems like forests can endure single-year droughts, the repeated stress of multi-year droughts may have significant consequences on their functioning [4]. To address this, in the following section we will analyze the extremities and changes in multi-year droughts in Europe by averaging the gridded fields (i.e., PDSI, SPEI, and SMI) over 10 consecutive years. The choice for a 10-year average was motivated by previous studies, which have shown that multi-year droughts mostly occur in clusters of 4 to 10 consecutive years [31,32,53,55] and it also allows us to make a proper comparison between the different drought indicators at decadal time scales. Only the events that show extremity, both in terms of magnitude and spatial extent, are discussed in the current study. For the sake of simplicity, we categorize only the first five extreme drought events based on their magnitude and spatial coverage (see Table 3 and Table S2).
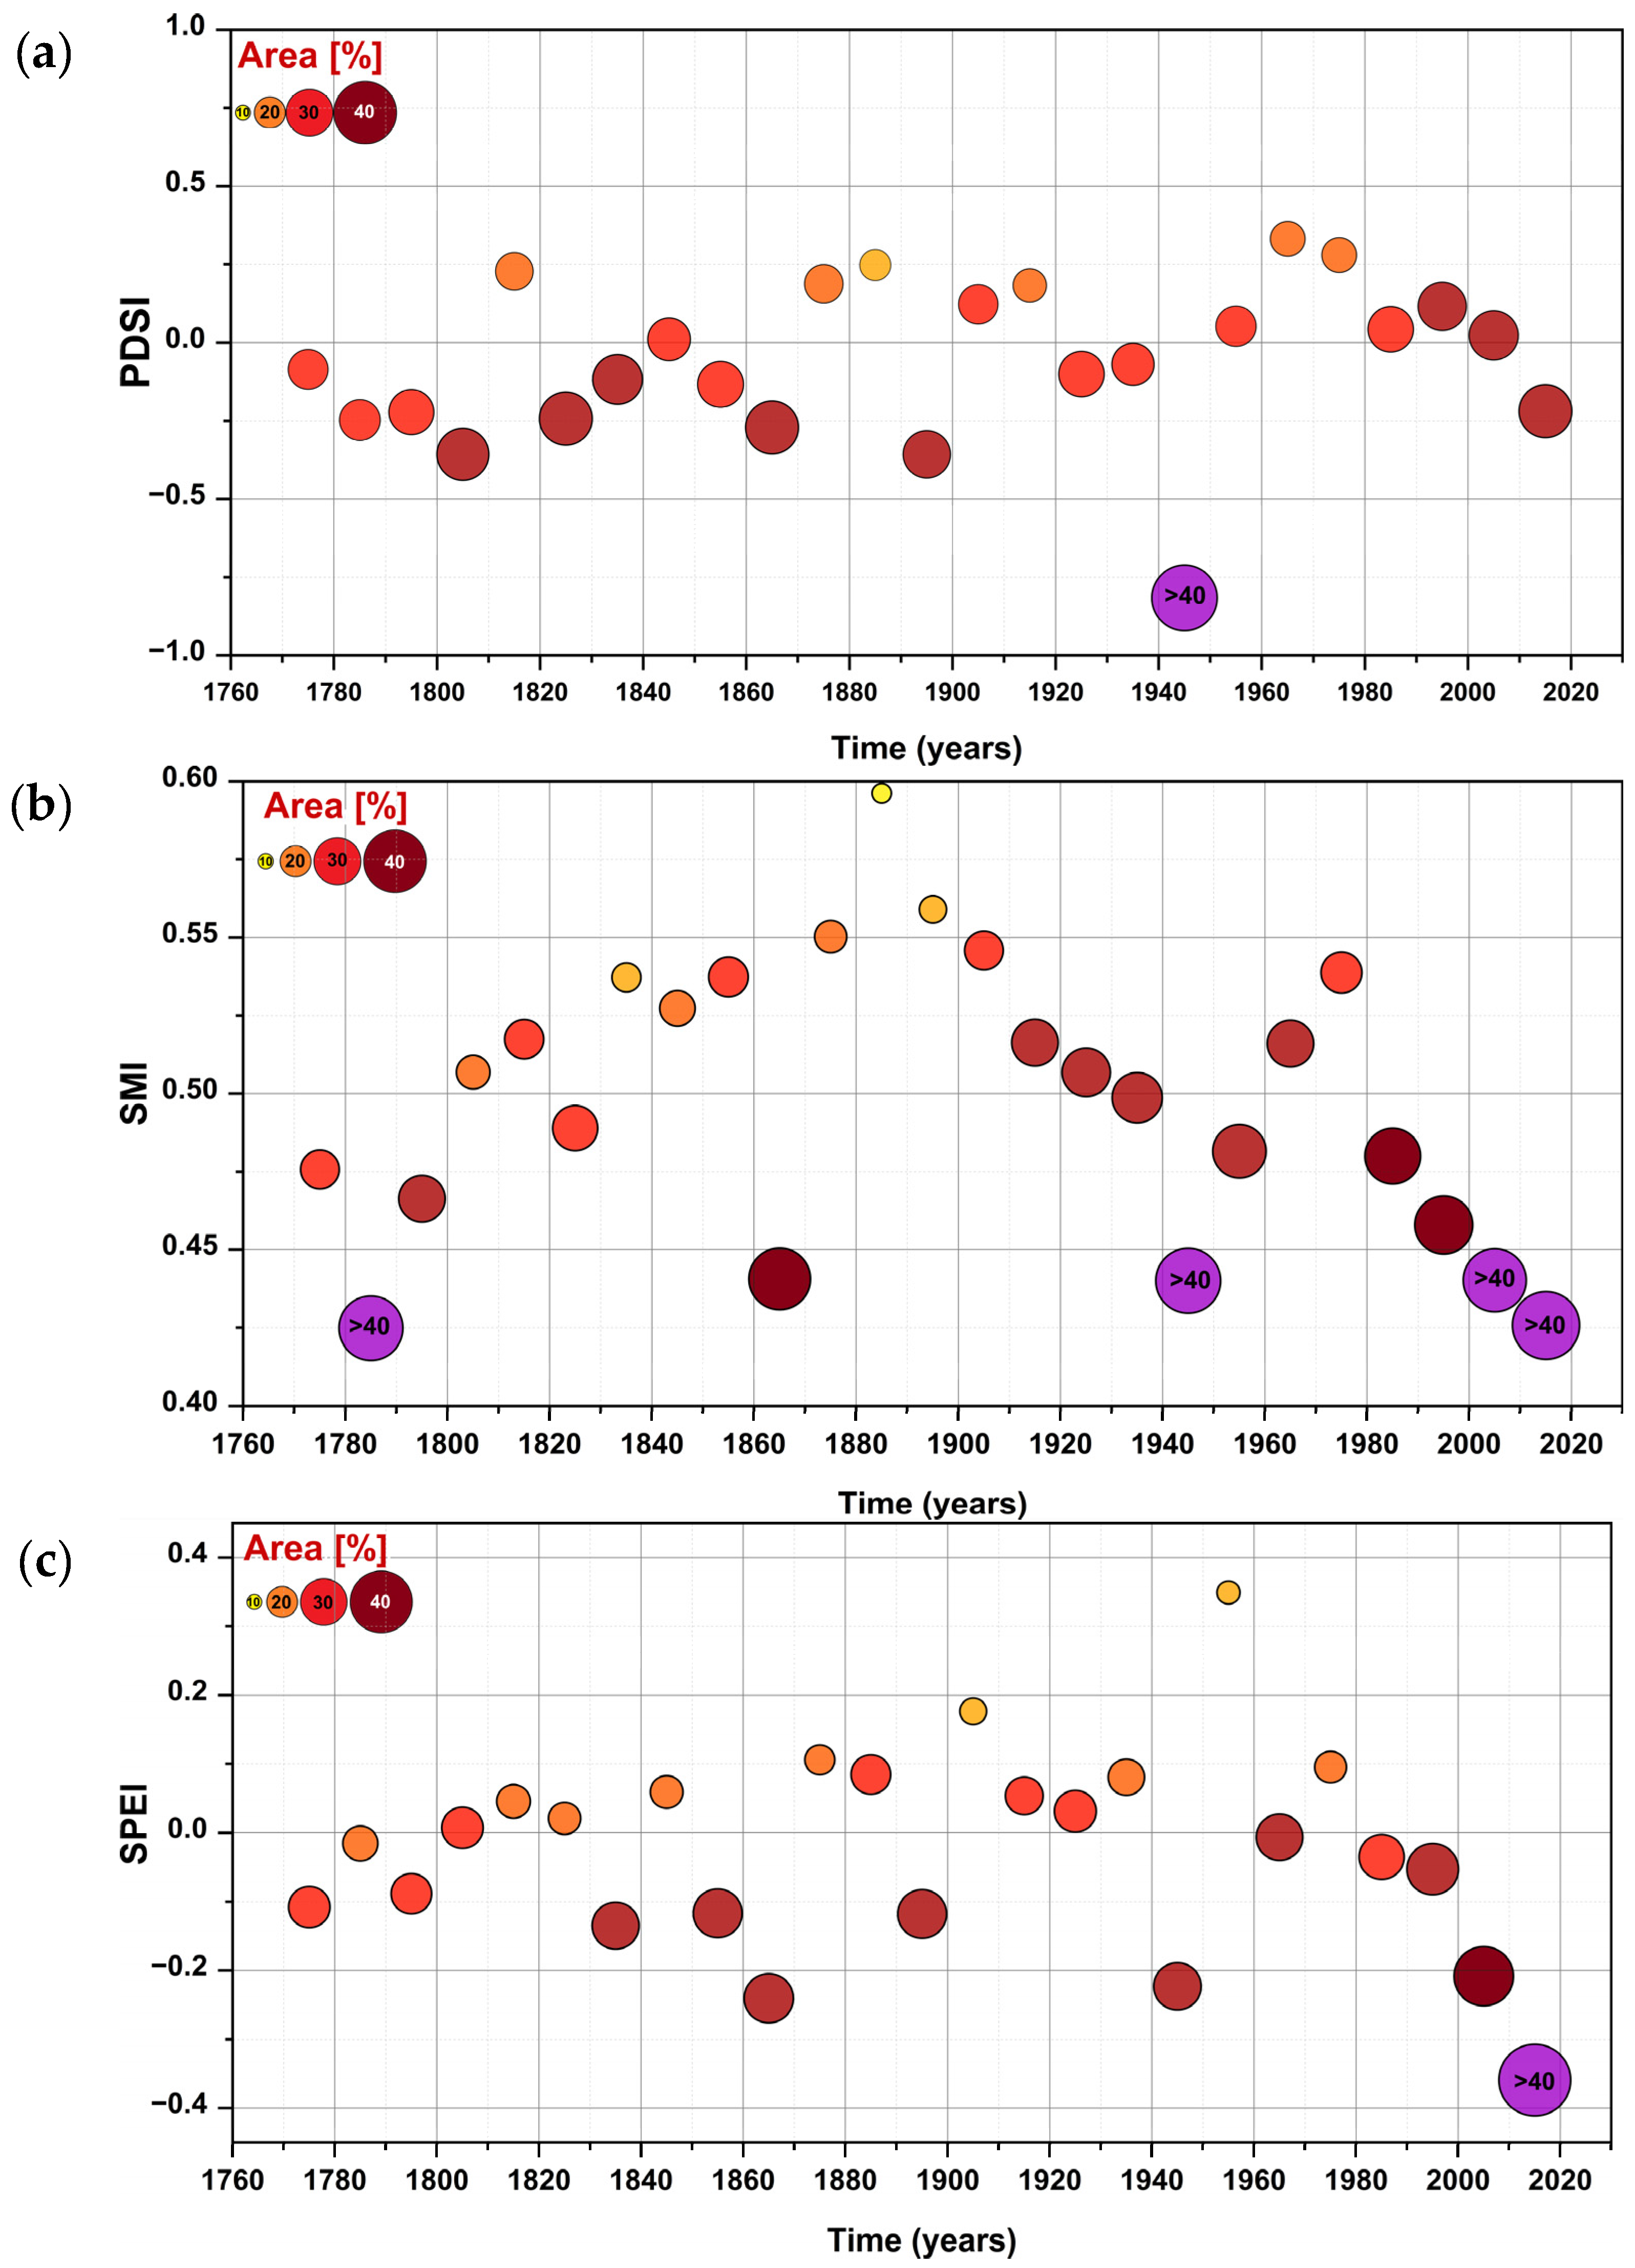
The spatio-temporal analysis of the largest drought events in Europe at decadal time scales are summarized in Figure 5 and Figure 6, respectively. At decadal time scales, the strongest drought events in terms of magnitude, as captured by PDSI, are in the period of 1941–1950 (M = −0.82), followed by 1801–1810 (M = −0.36). In terms of spatial extent, the strongest drought event was over the decade of 1941–1950 (A = 42.1%), followed by 2011–2018 (A = 34.4%) (Figure 5a and Figure 6a and Table 3). During 1941–1950, a drought event occurred over the central and southern parts of Europe (Figure 7), which is visible in all three drought indicators. When looking at each analyzed region separately, there are clear divergences in terms of the driest and most extensive drought events at the decadal time scales. In the case of MED, PDSI indicates the same multi-year event as in the case of the whole of Europe, namely, that in the period of 1941–1950 (Table 3).
This is consistent with the spatial extent of the 1941–1950 decade, which indicates that this decade was the driest one over the central and southern parts of Europe, including the Mediterranean region (Figure 7). The same decade, namely, 1941–1950, is the driest both in terms of magnitude (M = −0.95) and spatial extent (A = 34.2%) over CEU (Table 2). The second-driest decade in terms of extent over CEU was 2011–2018 (M = −0.87 and A = 29.4%, Table 3). For NEU, the driest decade both in terms of magnitude and coverage was 1851–1860 (M = −0.49 and A = 37.8%), followed by 1821–1830 (M = −0.42 and A = 35.2%, Table 3).
In the case of SPEI, the strongest drought events, at decadal time scales, in terms of magnitude and spatial extent are 2011–2018 (M = −0.36 and A = 46.6%), followed by 2001–2010 (M = −0.21 and A = 38.8%), respectively (Table 3). This aligns with Freund [31], who showed that the period of 2015–2018 was an unusually dry period in the last 400 years across large parts of central and western Europe. In the case of SPEI, similar results are observed for the MED and CEU regions, with the period of 2011–2018 being the driest (MED: M = −0.65, CEU: M = −0.44) and having the largest spatial extent for both regions (MED: A = 49.4%, CEU: A = 44.6%) (Table 3).
In both central Europe (CEU) and the Mediterranean (MED), the second-driest decade occurred during 2011–2018 (MED: M = −0.61, A = 45.3%; CEU: M = −0.17, A = 30.2%). In northern Europe (NEU), the driest decade was 1851–1860 (M = −0.41, A = 31.6%); the second-driest by magnitude was 1861–1870 (M = −0.34, A = 22.1%), whereas by spatial coverage it was 1891–1900 (M = −0.26, A = 30.5%) (Table 3). As in the cases of the interannual time scales, there are also discrepancies at decadal time scales regarding the extremity of different decades, based on the drought indicator used. This further indicates that indicator choice must be treated with caution when assessing long-term drought evolutions across continental and regional scales. SPEI, which incorporates both temperature and potential evapotranspiration, plays a crucial role [5,25,44] and is more prone to identifying the recent decades, especially 2011–2018, as the driest and most spatially extended decade, while PDSI tends to identify periods with extreme drought conditions even when rainfall deficit is the primary driver, compared to time spans that focus solely on precipitation. Because SPEI standardizes the climatic water balance (precipitation minus potential evapotranspiration), sustained recent warming raises evapotranspirative demand and shifts SPEI toward more negative values even without concurrent precipitation declines, thereby increasing the detected frequency and severity of dryness in recent decades relative to precipitation-only indices. This temperature sensitivity—robust across PET formulations—also helps to explain the observed divergences between SPI- and SPEI-based drought trends.
The analysis was repeated for extended periods constrained by data availability: 1401–2018 for PDSI and 1601–2018 for SPEI. At interannual time scales, results vary slightly—some PDSI extreme years shift due to the extended analysis period—whereas at decadal scales the driest decades remain largely unchanged: 1941–1950 (PDSI), 2011–2018 (SPEI), and 1781–1790 (SMI) (Tables S1 and S2). For example, for the European region, the driest year for PDSI, both in terms of magnitude (M) and drought-covered area (A), has been recorded to be 1659 (PDSI, M = −2.07, A = 75.1%) and the second-driest decade was identified as the period of 1551–1560 (M = −0.80, A = 44.5%).

3.3. Large-Scale Drivers of Summer Droughts

The first coupled mode of variability between summer Z500 and the three summer drought reconstructions reveals that positive loadings (i.e., wetness) over most of Europe, with the highest amplitude over the western part, are associated with a low-pressure system centered over the British Isles and the western part of Europe, flanked by a high-pressure system over the central North Atlantic basin and a high-pressure system over the Black Sea and the eastern part of Europe (Figure 8). The spatial distribution of positive loadings is consistent across all drought reconstructions, but their magnitudes are greater for PDSI (Figure 8a) and SMI (Figure 8b) compared to SPEI (Figure 8b). This difference in sensitivity between PDSI, SMI, and SPEI is also reflected in the explained variance: 12.78% (PDSI), 8.41% (SPEI), and 14.58% (SMI). SMI’s higher explained variance (14.58%) compared to PDSI (12.78%) and SPEI (8.41%) suggests that soil moisture, as represented by SMI, exhibits a stronger coupling with the large-scale atmospheric circulation patterns represented by Z500. This likely reflects SMI’s direct measurement of soil moisture, which responds more rapidly to atmospheric circulation anomalies than the integrated water-balance signal in PDSI or the temperature-sensitive anomalies emphasized by SPEI.
The direct link between atmospheric circulation and soil moisture dynamics, particularly in summer, could explain SMI’s higher explained variance. Furthermore, SMI, being directly related to soil moisture, might be more sensitive to the immediate impact of the atmospheric circulation on the land surface, leading to a stronger signal in the coupled mode. The anomalies in the drought reconstructions align with those in the Z500 field: positive anomalies (wet conditions) are associated with cyclonic circulation, while negative anomalies (dry conditions) are linked to anticyclonic circulation. The interannual variability of the normalized temporal components of the first CCA pairs for Z500 and drought reconstructions (Figure 8e) shows a strong and statistically significant correlation (r = 0.82, p < 0.001). This robust positive correlation between the canonical amplitudes of Z500 CCA1 and Drought CCA1 (Figure 8e) underscores the close relationship between summer drought variability across Europe and the prevailing large-scale atmospheric circulation. Over the period of 1766–2008, the canonical time series exhibited pronounced interannual variability without a discernible long-term trend. The driest interval, as identified by the coupled modes of variability, occurred between 1850 and 1880 (red line in Figure 8e).
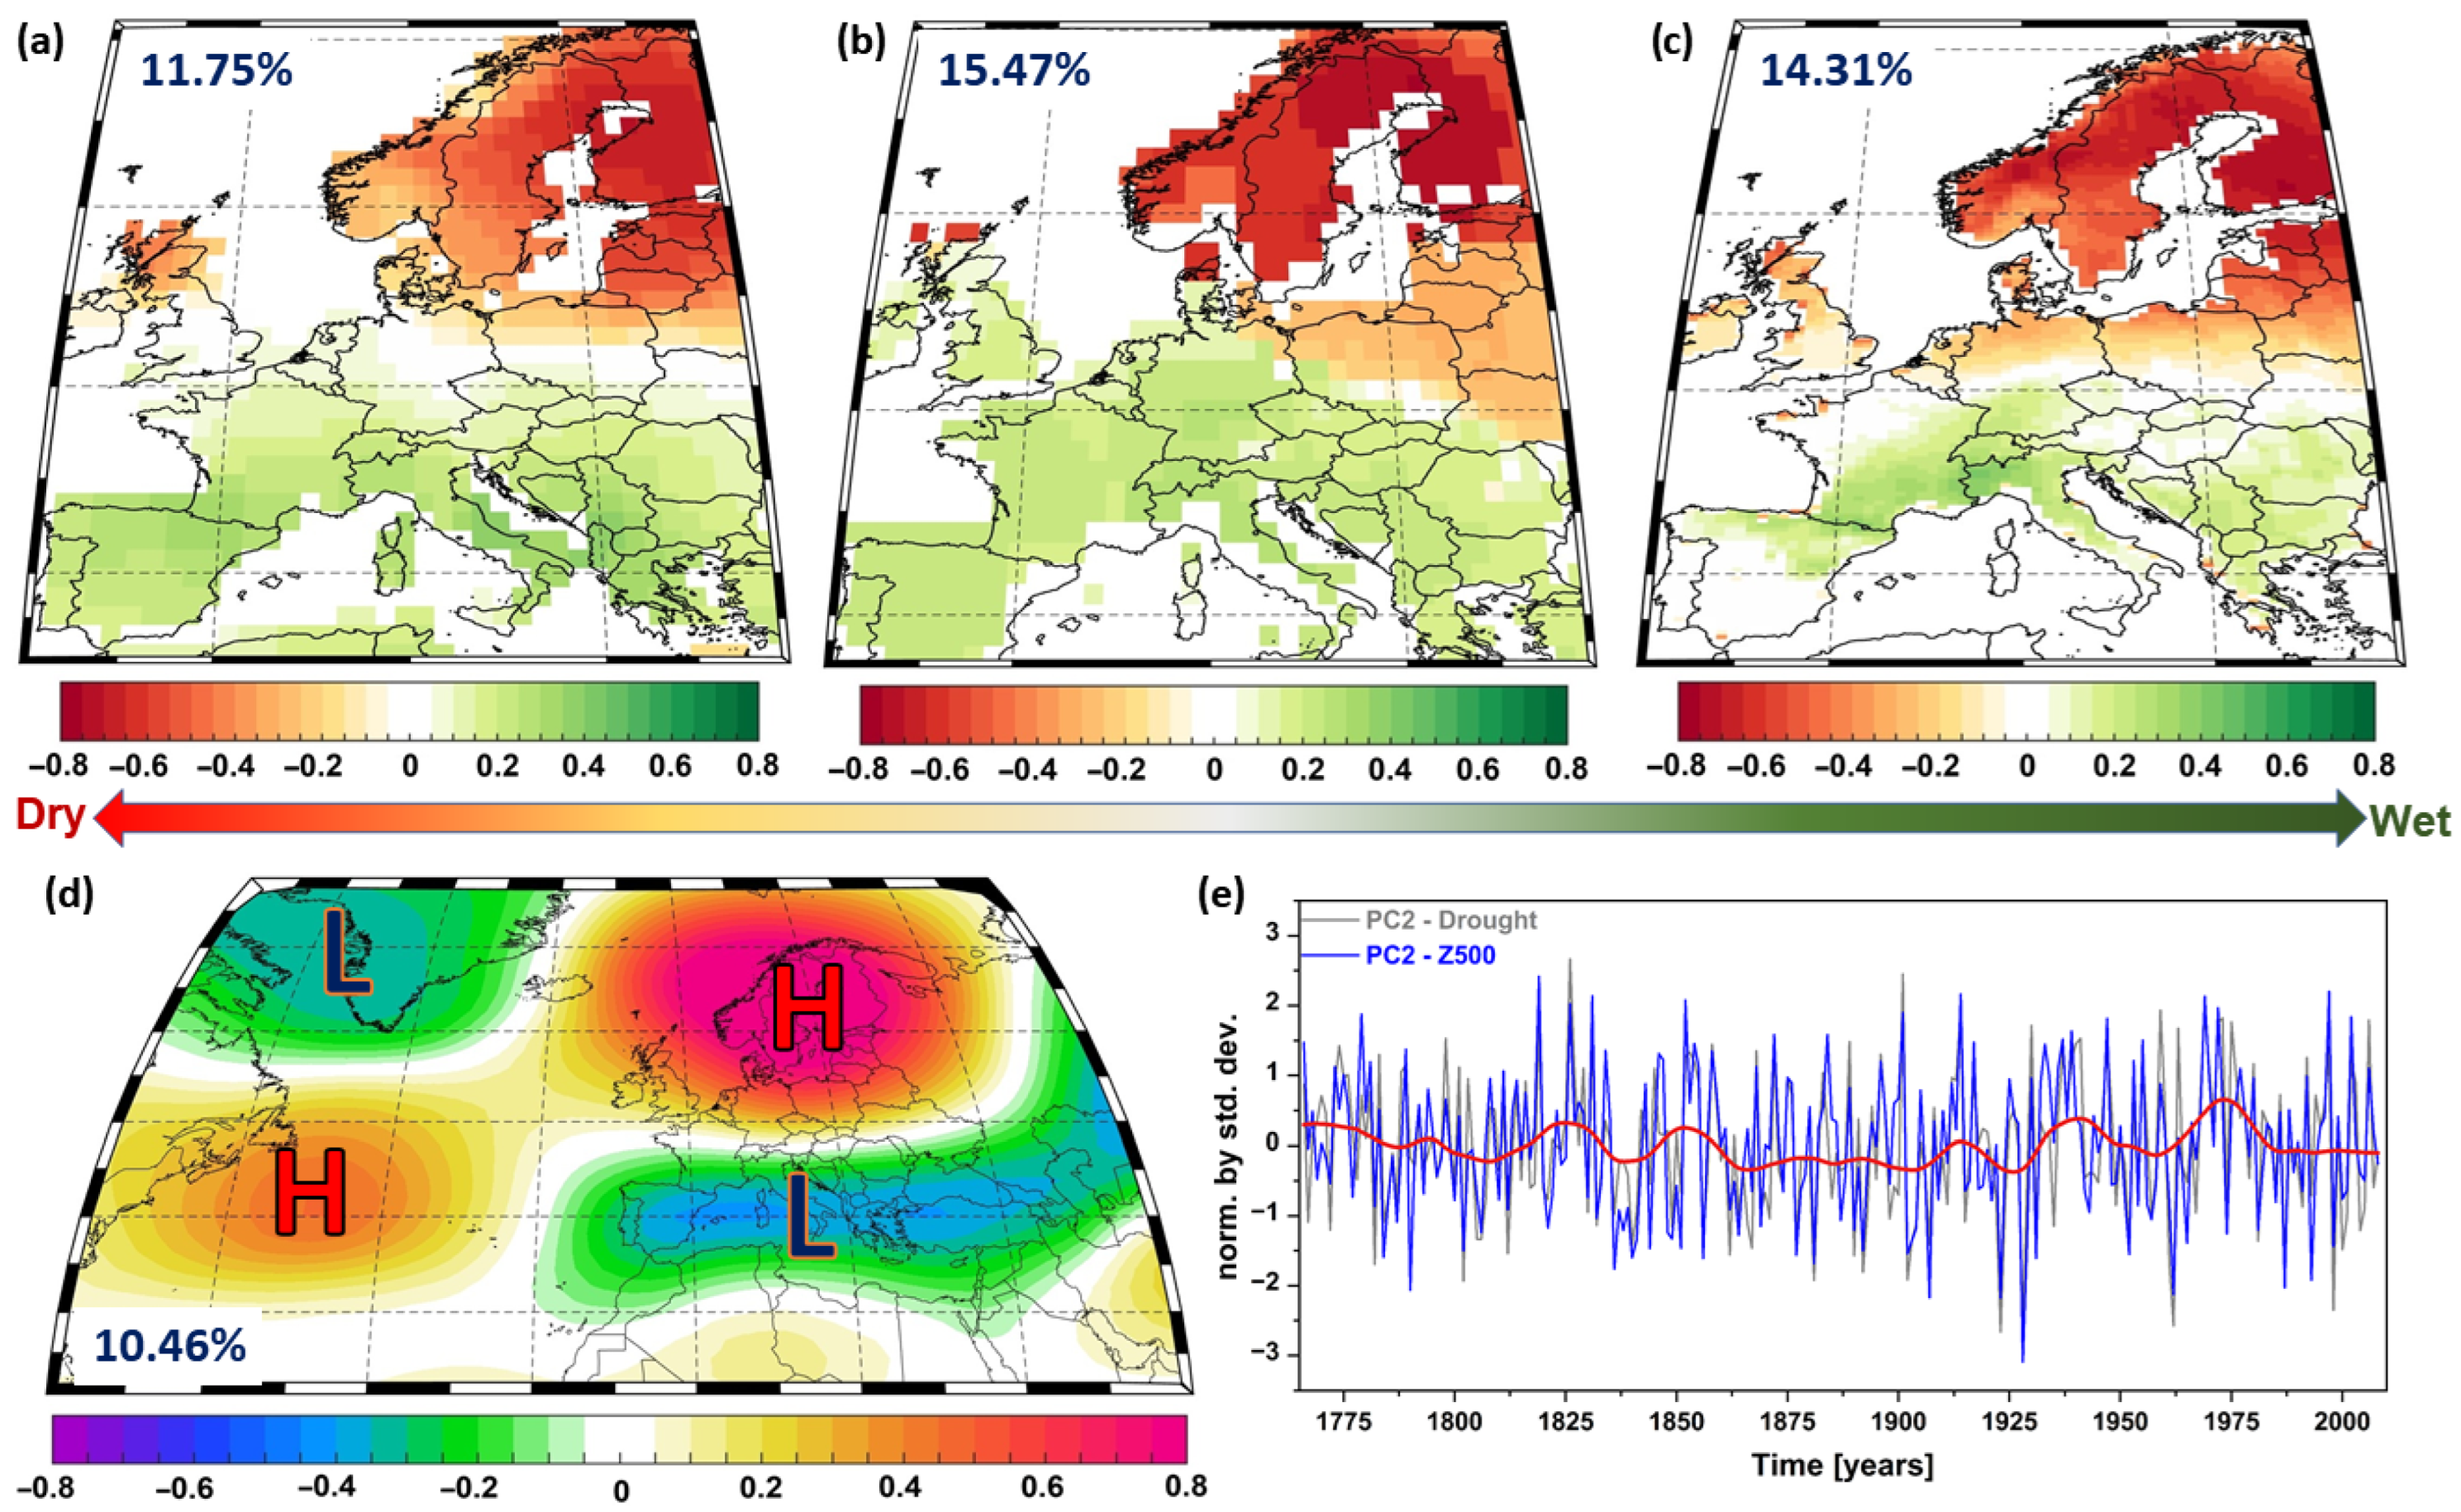
The second coupled mode of variability between summer Z500 and summer drought reconstructions reveals a dipole pattern, with positive loadings (wet conditions) in southern Europe and negative loadings (dry conditions) in northern Europe. This dipole is associated with a high-pressure system centered over Fennoscandia and a low-pressure system stretching from the Iberian Peninsula to eastern Europe (Figure 9). Similarly to the first coupled mode, the spatial structure of the drought reconstructions consistently captures this south–north dipole in drought variability across Europe. PDSI explains 11.75% of the total variance for this mode, SPEI explains 15.47%, and SMI explains 14.41%.
This dipole-like pattern is a well-known mode of variability influenced by large-scale atmospheric circulation and the state of the Atlantic Ocean [56]. Figure 9b shows that wet (dry) conditions in southern Europe and dry (wet) conditions in northern Europe are typically linked to cyclonic (anticyclonic) circulation over southern Europe and anticyclonic (cyclonic) circulation centered over Fennoscandia. The second principal component of drought variability (PC2 Drought, gray line in Figure 9e) is significantly correlated with the second principal component of Z500 variability (r = 0.75, p < 0.001). Both time series exhibit interannual and decadal variability, as illustrated in Figure 9e.
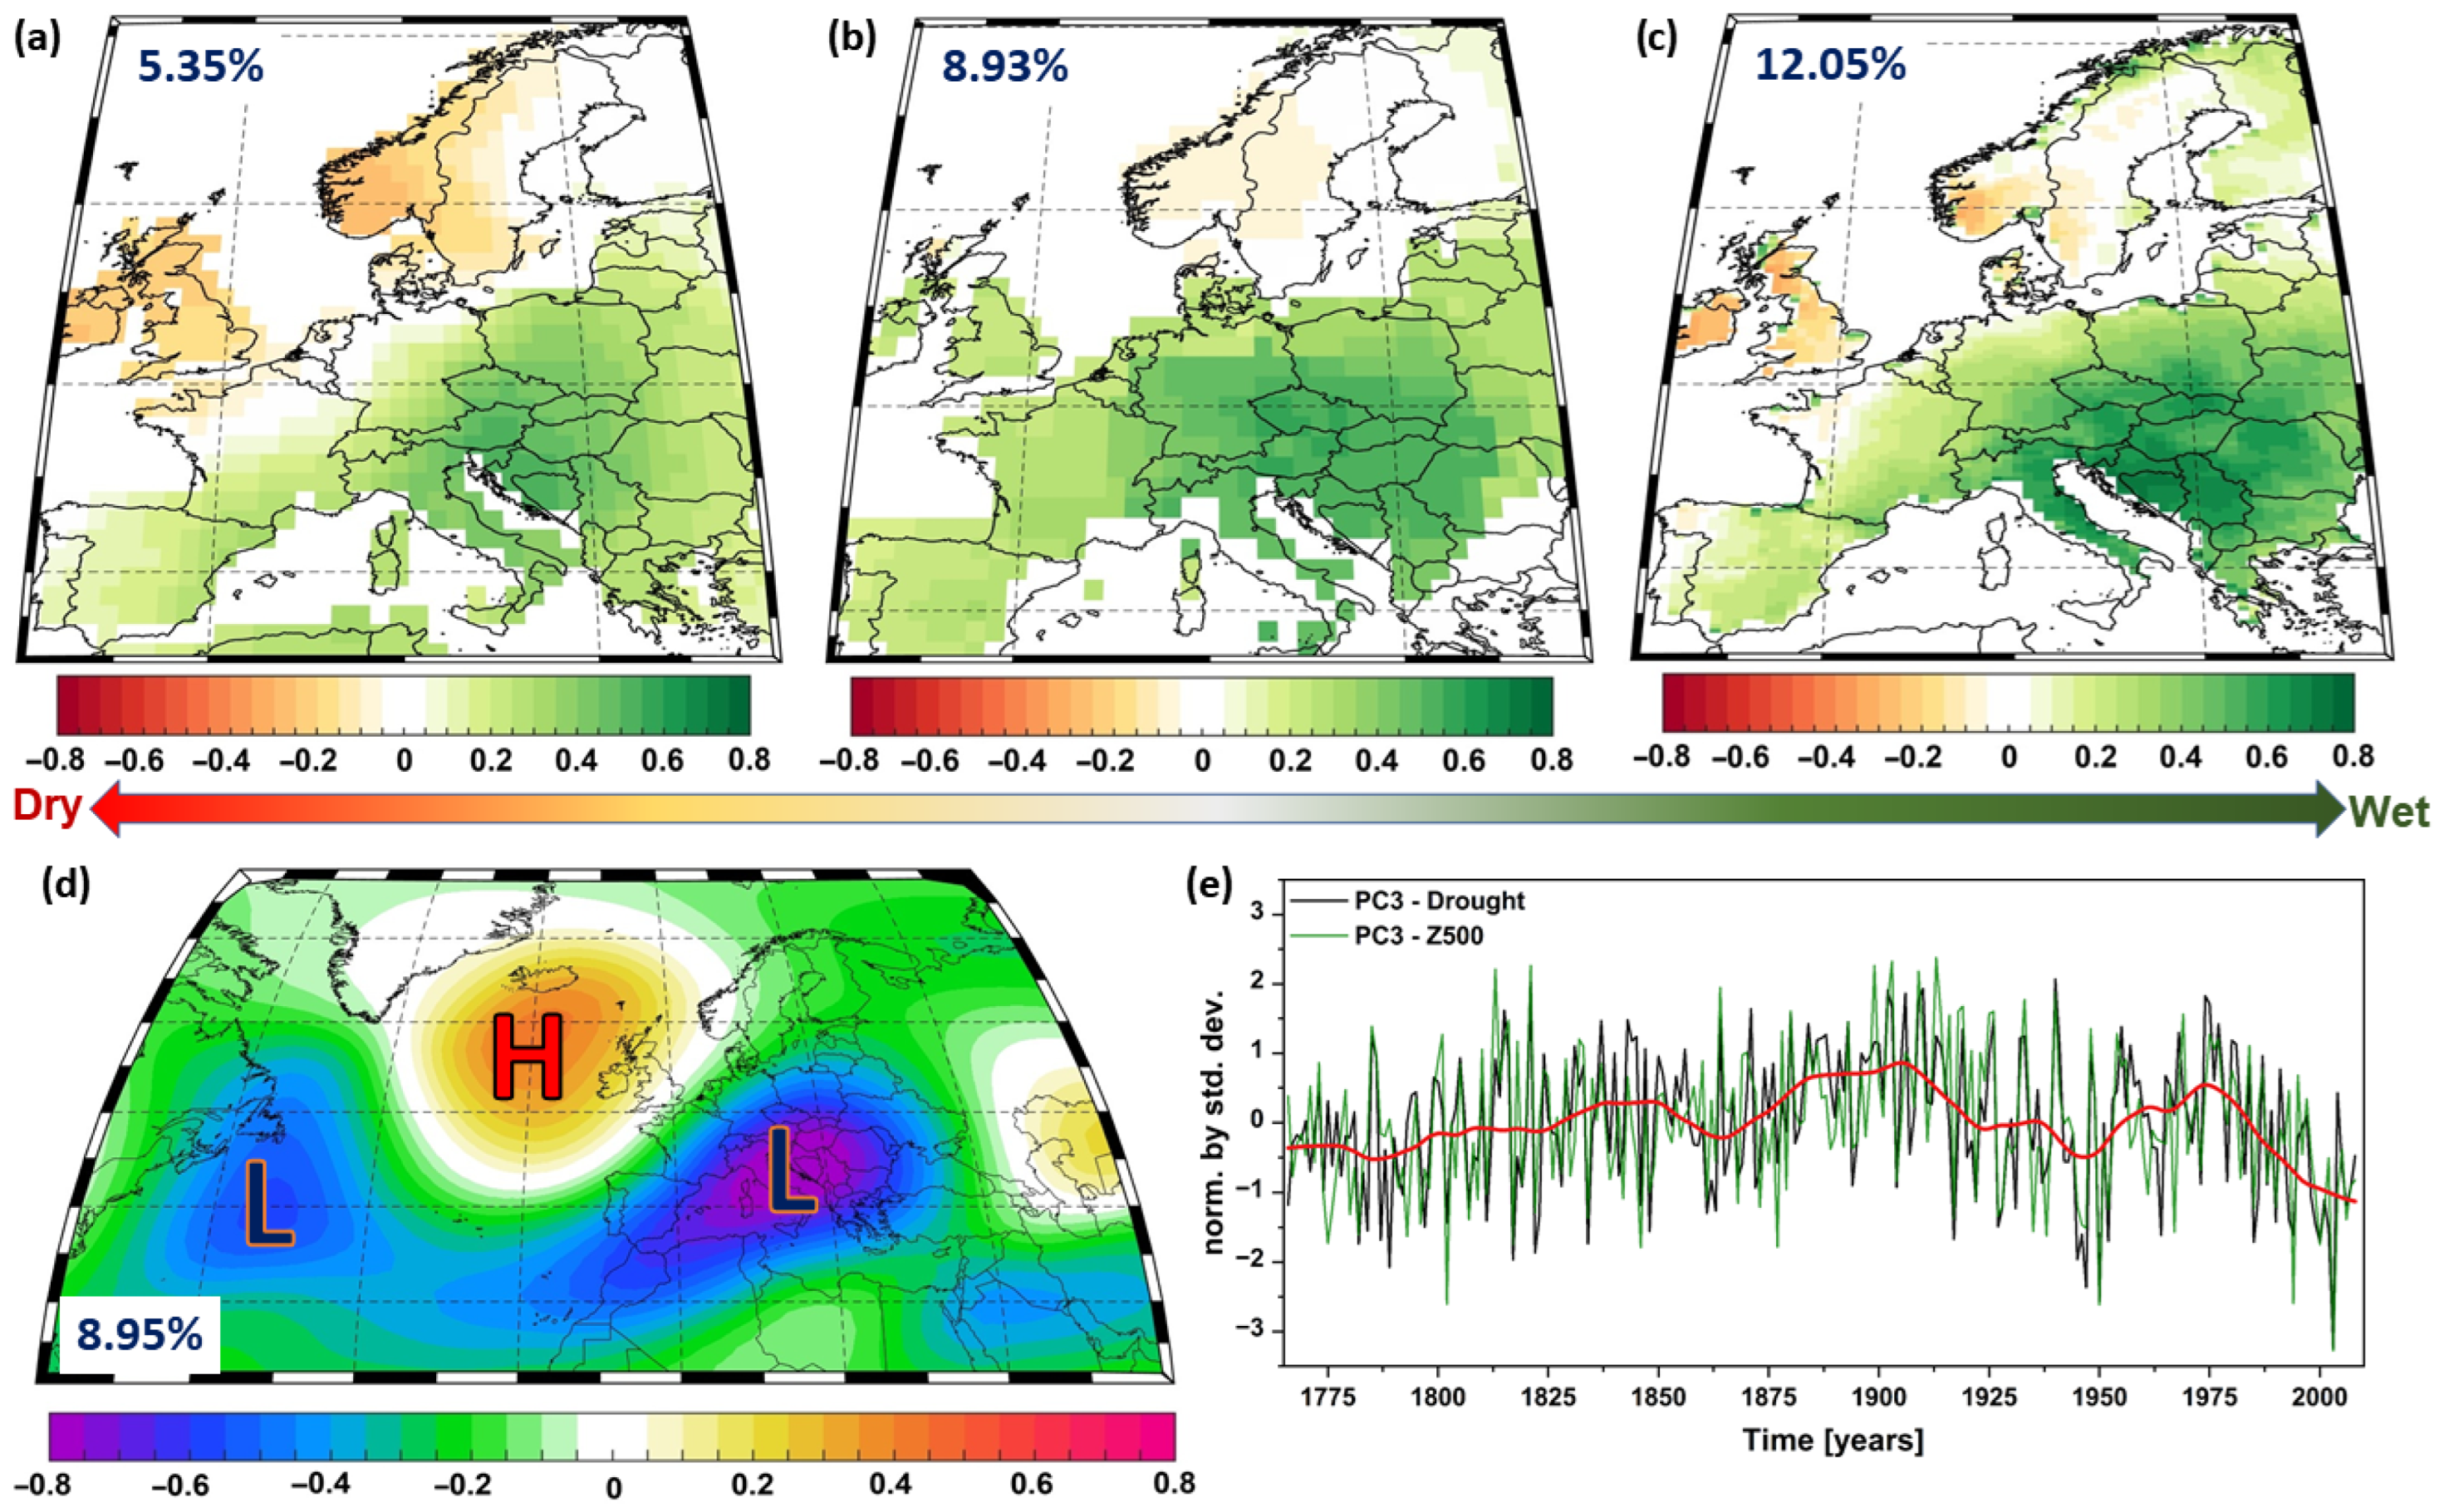
The third coupled mode of variability (Figure 10) is characterized, for the drought indicators, by positive loadings centered over eastern Europe (Figure 10a–c) and weaker positive loadings over the British Isles and Fennoscandia. This southeast–northwest dipole structure is most prominent in the PDSI and SMI reconstructions (Figure 10a,c), while SPEI lacks the negative loadings over the British Isles and Fennoscandia. Among the drought reconstructions, SMI explains the highest variance for this mode (12.05%), followed by SPEI (8.93%) and PDSI (5.35%).
The analysis indicates that wet conditions in southeastern Europe and dry conditions in northwestern Europe are associated with a high-pressure system south of Greenland and a low-pressure system over central and eastern Europe. The temporal evolution of PC3 Drought and PC3 Z500 (Figure 10e) reveals strong multidecadal variability and a significant drying trend over southeastern Europe since the 1970s. This trend is consistent with previous studies [5,57]. The two time series are significantly correlated (r = 0.72, p < 0.001), and three prolonged dry periods in southeastern Europe are identified: around the 1860s, the 1950s, and from 1995 onwards. Conversely, positive PC3 Drought values prevailed during the early 20th century and around 1975. The significant correlation between PC3 Drought and PC3 Z500 confirms the strong link between European summer drought variability and large-scale atmospheric circulation. Overall, the three main coupled modes of variability demonstrate substantial agreement among the drought reconstructions (PDSI, SPEI, and SMI) in terms of both spatial and temporal patterns. They underscore the critical role of large-scale atmospheric circulation in shaping drought variability. Notably, this analysis extends beyond the shorter observational record typically used in such studies, allowing for an assessment of the temporal stability of the relationship between drought variability and atmospheric circulation over longer time scales.

4. Discussion and Limitations of the Study

This study investigated the spatio-temporal dynamics of European droughts using PDSI [30], SPEI [31], and SMI [32], revealing significant interannual and decadal variability. The analysis revealed significant variability in drought patterns across Europe, both interannually and decadal, highlighting the importance of considering multiple indices to fully capture drought dynamics.
An important debate started in the scientific community regarding the recent (i.e., 2015 to 2018) long-lasting drought in Europe and its classification in terms of magnitude and extent, and also the extremity of this event, which led to different contradictory studies [31,54,58,59]. In their study, Ionita [59] has shown that the 2003 and 2015 drought events in central Europe were within the range of natural variability, while Büntgen [58], using a long tree-ring isotope record from the Czech Republic, has indicated that the recent drought was unprecedented at the European level over the last two millennia. In a recent study, Freund [31] has concluded that the recent European summer drought (i.e., 2015–2018) was “highly unusual in a multi-century context and unprecedented for large parts of central and western Europe”. By using a long-term reconstruction of soil moisture, Moravec [54] has shown that “the multi-year 2014–2018 soil moisture drought severity is exceptional in a 253-year period, especially for Central Europe”. While some of the aforementioned studies indicated that the 2015–2018 drought event was unprecedented, they either do not agree on the region or they use different drought indicators (e.g., soil moisture, standardized precipitation evapotranspiration index for different accumulation periods, or the Palmer drought severity index (PDSI)). These discrepancies arise because different indicators target distinct drought processes: meteorological (SPEI) vs. agricultural (PDSI) vs. hydrological (SMI), use different temporal windows and seasons, and have different “memories” (soil moisture integrates multi-season deficits). Reconstructions also differ in proxy/method (tree-ring width, isotopes, model-based soil moisture), calibration periods, and standardization baselines, and they rely on uneven, spatially non-uniform datasets. Together, these factors yield non-coincident hotspots and contrasting rankings of “unprecedented” events across domains and regions [24,27,59,60]. This is emphasized also in Figure 1, where the left (right) column indicates the magnitude (rank) of the 2015–2018 drought event based on three different drought indicators, namely, PDSI (Figure 1a,b), SPEI2 July–August (2-month accumulation, JA) (Figure 1c,d), and SMI (Figure 1e,f). According to PDSI, the magnitude of the 2015–2018 event was the highest over small regions in the eastern part of Europe and Italy (Figure 1b), while SPEI indicates that the highest magnitude of this event was over the central part of Europe (Figure 1d). SMI reflects a similar pattern as PDSI, namely, the driest event on record over some regions in the eastern part of Europe and some small regions in Italy and France (Figure 1f). By comparing the results from the aforementioned studies and Figure 1, it is very difficult to answer the following questions: are the recent drought events (e.g., 2015–2018) unprecedented over the last centuries, and which regions were the most affected ones?
At the interannual scale, the study revealed notable differences in the identification of extreme dry years based on the chosen drought index (Table 2, Figure 4). For the European region as a whole, most indices showed no significant trends in drought magnitude or area, except for SMI, which indicated a significant increase in drought-covered areas (Figure 2 and Figure 3). The driest years were 1874 (PDSI), 1783 (SPEI), and 1868 (SMI), exhibiting distinct spatial patterns (Figure 4). While these years shared common drought-prone regions, the magnitudes and extents differed considerably across indices. For example, for 1868, PDSI and SPEI showed extensive drought in central and southern Europe, while SMI highlighted broader but varying soil moisture deficits. Similarly, the 2003 drought manifested differently: PDSI and SPEI emphasized central Europe, and SMI highlighted localized impacts in southern and southeastern Europe.
Regional analyses further highlighted region-specific contrasts. In the Mediterranean (MED) region, only SMI indicated a significant drying trend and increased drought-covered areas (Figures S5 and S6). The identified driest years also varied: 1945 (PDSI and SMI) and 2012 (SPEI) (Figure S7, Table 2 and Table S1). Central Europe (CEU) exhibited increasing trends in drought-covered areas for SPEI and SMI, but no significant trends in drought magnitude (Figures S8 and S9). The driest years for CEU were 1921 (PDSI), 2015 (SPEI), and 1868 (SMI) (Figure S10, Table 2 and Table S1). In contrast, northern Europe (NEU) showed a non-significant wetting trend for PDSI and SPEI and no significant changes in drought-covered areas (Figures S11 and S12). The driest years for NEU were 1826 (PDSI and SMI) and 1868 (SPEI) (Figure S12, Table 2 and Table S1). These regional variations underscore the importance of accounting for local hydroclimate dynamics and the distinct sensitivities and temporal scales of the drought indices.
Moving to decadal events (Table 3 and Table S2), the strongest European-scale decadal droughts were 1941–1950 (PDSI) and 2011–2018 (SPEI). The 1941–1950 event showed extensive drought in central and southern Europe across all three indices (Figure 5, Figure 6 and Figure 7). Regionally, in MED and CEU, PDSI identified 1941–1950 as the driest decade, while SPEI highlighted 2011–2018. In NEU, the driest decade was 1851–1860 for all indices. These decadal differences reinforce the need for careful consideration when assessing long-term drought evolution. SPEI tended to identify recent decades as more extreme, likely reflecting climate warming, while PDSI captured periods of extreme drought driven primarily by precipitation deficits. Extended analyses (1401–2018 for PDSI and 1601–2018 for SPEI) showed minor changes in extreme years but consistent driest decades (Tables S1 and S2), indicating the robustness of the decadal analysis.
Strong correlations between large-scale atmospheric drivers of summer droughts and the drought indices (Figure 8e, Figure 9e and Figure 10e) highlight the critical role of atmospheric circulation in shaping European drought variability. The consistency of spatial and temporal patterns across the indices demonstrates the robustness of the analysis and the long-term stability of the relationship between drought and atmospheric circulation, providing valuable historical context.
This study employs multiple datasets to examine European drought variability over centuries, offering unique temporal depth and spatial resolution. Integrating tree-ring stable isotopes, tree-ring widths, and soil moisture data provides a comprehensive perspective on historical and contemporary hydroclimatic conditions. The Old World Drought Atlas (OWDA) [30] offers extensive spatial coverage over the Common Era, enabling detailed reconstructions of long-term variability. Stable isotope records excel at reconstructing low-frequency climate variability, particularly in lowland regions since 1601 CE. Modern soil moisture data provide high-resolution insights into recent drought phenomena and future projections. Integrating these datasets allows for the identification of three distinct phases of European hydroclimate variability, potentially linked to solar activity and the Little Ice Age, alongside a long-term drying trend since the mid-20th century. Soil moisture data further enable detailed assessment of recent events, such as the exceptional 2018–2020 drought. This underscores the potential influence of anthropogenic warming on European summer droughts and highlights significant regional differences. The complementary nature of these datasets is evident: tree-ring data provide long-term context, while soil moisture data capture recent severity.
However, integrating these datasets presents challenges. Methodological differences between OWDA (derived from tree-ring widths and based on PDSI) and SPEI (based on stable isotopes) can lead to inconsistencies in temporal resolution and low-frequency variability as well as target seasonality. While OWDA has broad spatial coverage, SPEI lacks the same extent and relies on sampling techniques and proxy availability, which thins backwards in time, reducing spatial representativeness and inflating uncertainties in earlier periods. The SMI dataset offers high-resolution modern drought assessments but limited pre-20th century data, and its long-term reconstructions depend on model forcing, whose quality degrades temporally and regionally. Despite these differences, it is important to note that PDSI incorporates a modeled soil moisture component, although indirectly, in contrast to the direct measurement of SMI. This distinction necessitates careful consideration in comparative analyses. Crucially, differing calibration periods across products (e.g., twentieth-century instrumental windows for OWDA and site-level isotope series, and modern-era calibration/validation for SMI) can imprint period-dependent biases and hamper cross-century comparability; hence, apparent discrepancies among indicators may partly reflect calibration-window choices and evolving proxy densities rather than true hydroclimatic divergence, a caveat we address explicitly in our comparative analyses.
The study synthesizes long-term reconstructions to contextualize recent European drought events, such as in 2015–2018, and to explore similarities and discrepancies among indicators. These findings align with previous studies [5,25,61] reporting divergences among drought indicators in recent decades, potentially due to the differing roles of temperature and evapotranspiration in their calculations. Notably, PDSI and SMI often record extremes during the same years, suggesting a stronger consistency between these indicators compared to SPEI. Correlation analyses further support this: PDSI and SMI exhibit the highest correlations across Europe and within regional subdivisions (e.g., MED, CEU, and NEU) over the common period (1766–2018), whereas SPEI correlations with observed drought indices are weaker (Tables S3 and S4).
The reconstruction skill of SPEI may be limited by the smaller number of tree-ring chronologies compared to PDSI. Additionally, PDSI relies on tree-ring widths (primarily influenced by water availability), while SPEI incorporates stable oxygen isotopes (reflecting complex climate interactions) processes [62,63]. Uneven proxy dataset distribution also impacts reconstructions, with SPEI lacking coverage in drought-sensitive eastern Europe. This geographical gap limits SPEI’s ability to fully capture European drought variability.
A key observation is that long-lasting European droughts have historically coincided with colder periods (“cold droughts”) [16,59], whereas current multi-year droughts are exacerbated by anthropogenic warming [16,32,64]. While all the analyzed indicators identify the 2015–2018 drought as unprecedented, their spatial manifestations differ. This divergence highlights the complexities in reconstructing past drought events compared to temperature reconstructions. Methodological differences among the drought indicators further complicate direct comparisons.
Paleoclimate reconstruction poses inherent challenges related to resolution, dating errors, and the spatial coverage of natural archives. Different dendrochronological proxies respond to distinct climatic drivers, varying by site [30,62,63,65,66,67]. This heterogeneity necessitates caution in interpreting paleo-drought reconstructions, especially given the amplified global warming signal in the calibration period. Despite these limitations, integrating diverse datasets remains critical for disentangling natural variability from anthropogenic impacts and advancing our understanding of European hydroclimatic dynamics.

5. Conclusions

This study delivers an integrated assessment of European drought by simultaneously analyzing three long-term drought reconstructions—PDSI (OWDA) [30], summer SPEI2 [31], and SMI [32]—over their common period, with explicit tests of temporal consistency and cross-validation among indicators. This design moves beyond single-index studies and enables outcome-focused comparisons of magnitude, persistence, and spatial footprint. The major findings are threefold. First, indicator agreement is strongest for multi-year water-balance deficits, with PDSI and SMI aligning on hotspot regions and decadal severity, whereas the temperature-sensitive SPEI diverges in recent decades, producing distinct spatial rankings; reconstruction skill differences and uneven proxy density (SPEI) further modulate consistency. Second, at the European scale, the driest individual years and decadal episodes are indicator-dependent—e.g., PDSI identifies 1874 (year) and 1941–1950 (decade), SPEI highlights 2003 and 2011–2018, and SMI emphasizes 1868 and 1781–1790—with additional regional contrasts across MED, CEU, and NEU. Third, trends in drought-affected areas are modest at the continental scale except for a significant SMI increase (+0.52% decade−1 since 1766), with notable regional growth in SMI-based drought areas over MED (~+1.1% decade−1) and increasing SPEI/SMI drought areas over CEU.
Placed within the full historical context provided by the combined reconstructions, the 2015–2018 event is exceptional in several metrics and hotspots but is not categorically unprecedented across indicators and regions—our key contribution that reconciles disagreements arising from single-index or region-specific assessments. This conclusion reflects both physical sensitivities (e.g., SPEI’s sensitivity to PET) and structural differences among reconstructions (proxy availability, target seasonality, and calibration windows), emphasizing that no single metric can capture all drought dimensions. Large-scale circulation provides a coherent backdrop: coupled modes between summer Z500 and drought reconstructions show a strong leading relationship (CCA1 r = 0.82, p < 0.001) and robust dipole structures, with variance shares of ~8%–15% across indicators, supporting a physically consistent link between atmospheric dynamics and reconstructed drought severity and extent.
Operational implications follow directly. Single-indicator evaluations can mischaracterize hazard magnitude and persistence; monitoring, early warning, and reconstruction should adopt a multi-indicator framework that (i) quantifies temporal consistency, (ii) cross-validates indicators, and (iii) propagates uncertainties from proxy density and calibration choices. Future work should expand and homogenize proxy networks in data-sparse regions, standardize calibration/validation across products, and develop multi-proxy ensembles benchmarked against independent observations and circulation-linked predictors. Embedding these advances in practice will directly support climate-resilient water management through multi-indicator drought triggers, adaptive allocation rules, ecological-flow safeguards, and teleconnection-informed seasonal outlooks.

Supplementary Materials

The following supporting information can be downloaded at: https://www.mdpi.com/article/10.3390/f16111739/s1, Figure S1: Temporal evolution of the regional (i.e., MED) mean of: (a) PDSI, (b) SPEI, and (c) SMI. The red line in (a–c) indicate the linear trend over the analyzed period. The values of the slope (S) and the p-value for each indicator (p) are shown on each figure in the grey shaded area. Analyzed period: PDSI: 1401–2018; SPEI: 1601–2018, and SMI: 1776–2018; Figure S2: Temporal evolution of the percentage area affected by droughts over MED for: (a) PDSI, (b) SPEI, and (c) SMI. The thresholds used to define a drought event, for each indicator, are given in Table 1. The blue line in (a–c) indicate the linear trend over the analyzed period. The values of the slope (S) and the p-value for each indicator (p) are shown on each figure in the grey shaded area. Analyzed period: PDSI: 1401–2018; SPEI: 1601–2018, and SMI: 1776–2018; Figure S3: Spatial patterns the driest years identified for each drought indicators for MED (see Table S1 for a detailed overview): (a) PDSI (1945); (b) SPEI (2012) and (c) SMI (1945); Figure S4: Temporal evolution of the regional (i.e., CEU) mean of: (a) PDSI, (b) SPEI, and (c) SMI. The red line in (a–c) indicate the linear trend over the analyzed period. The values of the slope (S) and the p-value for each indicator (p) are shown on each figure in the gray shaded area. Analyzed period: PDSI: 1401–2018; SPEI: 1601–2018 and SMI: 1776–2018; Figure S5: Temporal evolution of the percentage area affected by droughts over CEU for: (a) PDSI, (b) SPEI, and (c) SMI. The thresholds used to define a drought event, for each indicator, are given in Table 1. The blue line in (a–c) indicate the linear trend over the analyzed period. The values of the slope (S) and the p-value for each indicator (p) are shown on each figure in the gray shaded area. Analyzed period: PDSI: 1401–2018; SPEI: 1601–2018 and SMI: 1776–2018; Figure S6: Spatial patterns the driest years identified for each drought indicators for CEU (see Table S1 for a detailed overview): (a) PDSI (1921); (b) SPEI (2015) and (c) SMI (1868); Figure S7: Temporal evolution of the regional (i.e., NEU) mean of: (a) PDSI, (b) SPEI, and (c) SMI. The red line in (a–c) indicate the linear trend over the analyzed period. The values of the slope (S) and the p-value for each indicator (p) are shown on each figure in the gray shaded area. Analyzed period: PDSI: 1401–2018; SPEI: 1601–2018 and SMI: 1776–2018; Figure S8: Temporal evolution of the percentage area affected by droughts over EURO for: (a) PDSI, (b) SPEI, and (c) SMI. The thresholds used to define a drought event, for each indicator, are given in Table 1. The blue line in (a–c) indicate the linear trend over the analyzed period. The values of the slope (S) and the p-value for each indicator (p) are shown on each figure in the gray shaded area. Analyzed period: PDSI: 1401–2018; SPEI: 1601–2018 and SMI: 1776–2018; Figure S9: Spatial patterns the driest years identified for each drought indicators for NEU (see Table S1 for a detailed overview): (a) PDSI (1826); (b) SPEI (1868) and (c) SMI (1826); Figure S10: Scatter plot of the MED time series and total area affected by drought, at decadal time scales, for: (a) PDSI; (b) SPEI and (c) SMI. The bubble size corresponds to the total drought area. Analyzed period: PDSI: 1401–2018; SPEI: 1601–2018 and SMI: 1776–2018; Figure S11: Scatter plot of the CEU time series and total area affected by drought, at decadal time scales, for: (a) PDSI; (b) SPEI and (c) SMI. The bubble size corresponds to the total drought area. Analyzed period: PDSI: 1401–2018; SPEI: 1601–2018 and SMI: 1776–2018; Figure S12: Scatter plot of the NEU time series and total area affected by drought, at decadal time scales, for: (a) PDSI; (b) SPEI and (c) SMI. The bubble size corresponds to the total drought area. Analyzed period: PDSI: 1401–2018; SPEI: 1601–2018 and SMI: 1776–2018; Table S1: The driest years in terms of magnitude (M) and spatial extent (A) at interannual time scales; Table S2: The driest years in terms of magnitude (M) and spatial extent (A) at decadal time scales; Table S3: Correlation coefficients between the different drought indicators over the common period 1766–2018 and for different regions (i.e., EURO, MED, CEU and NEU); Table S4: Correlation coefficients between the observed (Obs.) and reconstructed (Recon.) time series of the different drought indicators over the common period 1901–2018 and for different regions (i.e., EURO, MED, CEU and NEU). For PDSI we have sued the observed summer (JJA) PDSI, while for the observed SPEI we used the SPEI2 averaged over June and August, as in the original paper of the SPERI reconstruction; Table S5: The driest years in terms of magnitude (M) and spatial extent (A) at interannual time scales over the common period 1766–2018; Table S6: The driest years in terms of magnitude (M) and spatial extent (A) at decadal time scales over the common period 1766–2018. References [5,19,26,52,57,68,69,70,71,72,73,74,75,76,77,78,79,80,81,82] are cited in the Supplementary Materials file.

Author Contributions

M.I. and V.N. designed the study and wrote the paper. P.S. helped with the writing of the paper and interpretation of the results. All authors have read and agreed to the published version of the manuscript.

Funding

V.N. and M.I. were partially supported by a grant from the Ministry of Research, Innovation and Digitization, under the “Romania’s National Recovery and Resilience Plan—Founded by EU-NextGenerationEU” program, project “Compound extreme events from a long-term perspective and their impact on forest growth dynamics (CExForD)” number 760074/23.05.2023, code 287/30.11.2022, within Pillar III, Component C9, Investment 8. Monica Ionita was also supported by the Helmholtz Association through the joint program “Changing Earth—Sustaining our Future” (PoF IV) program of the AWI. and the Helmholtz Climate Initiative REKLIM.

Data Availability Statement

No datasets were generated during this study. All data used in this study are publicly available from the sources cited in the Section 2.

Conflicts of Interest

The authors declare no conflicts of interest.

References

  1. Ionita, M.; Nagavciuc, V. Forecasting Low Flow Conditions Months in Advance through Teleconnection Patterns, with a Special Focus on Summer 2018. Sci. Rep. 2020, 10, 13258. [Google Scholar] [CrossRef]
  2. Hari, V.; Rakovec, O.; Markonis, Y.; Hanel, M.; Kumar, R. Increased Future Occurrences of the Exceptional 2018–2019 Central European Drought under Global Warming. Sci. Rep. 2020, 10, 12207. [Google Scholar] [CrossRef]
  3. Ramonet, M.; Ciais, P.; Apadula, F.; Bartyzel, J.; Bastos, A.; Bergamaschi, P.; Blanc, P.E.; Brunner, D.; di Torchiarolo, L.C.; Calzolari, F.; et al. The Fingerprint of the Summer 2018 Drought in Europe on Ground-Based Atmospheric CO2 Measurements. Philos. Trans. R. Soc. Lond. Ser. B Biol. Sci. 2020, 375, 20190513. [Google Scholar] [CrossRef]
  4. Bastos, A.; Ciais, P.; Friedlingstein, P.; Sitch, S.; Pongratz, J.; Fan, L.; Wigneron, J.P.; Weber, U.; Reichstein, M.; Fu, Z.; et al. Direct and Seasonal Legacy Effects of the 2018 Heat Wave and Drought on European Ecosystem Productivity. Sci. Adv. 2020, 6, eaba2724. [Google Scholar] [CrossRef] [PubMed]
  5. Ionita, M.; Nagavciuc, V. Changes in Drought Features at the European Level over the Last 120 Years. Nat. Hazards Earth Syst. Sci. 2021, 21, 1685–1701. [Google Scholar] [CrossRef]
  6. Ionita, M.; Antonescu, B.; Roibu, C.; Nagavciuc, V. Drought’s Grip on Romania: A Tale of Two Indices. Int. J. Climatol. 2025, 45, e8876. [Google Scholar] [CrossRef]
  7. Ghazi, B.; Przybylak, R.; Pospieszyńska, A. Projection of Climate Change Impacts on Extreme Temperature and Precipitation in Central Poland. Sci. Rep. 2023, 13, 18772. [Google Scholar] [CrossRef]
  8. Knutzen, F.; Averbeck, P.; Barrasso, C.; Bouwer, L.M.; Gardiner, B.; Grünzweig, J.M.; Hänel, S.; Haustein, K.; Johannessen, M.R.; Kollet, S.; et al. Impacts and Damages of the European Multi-Year Drought and Heat Event 2018–2022 on Forests, a Review. Nat. Hazards Earth Syst. Sci. 2025, 25, 77–117. [Google Scholar] [CrossRef]
  9. Blauhut, V.; Stoelzle, M.; Ahopelto, L.; Brunner, M.I.; Teutschbein, C.; Wendt, D.E.; Akstinas, V.; Bakke, S.J.; Barker, L.J.; Bartošová, L.; et al. Lessons from the 2018–2019 European Droughts: A Collective Need for Unifying Drought Risk Management. Nat. Hazards Earth Syst. Sci. 2022, 22, 2201–2217. [Google Scholar] [CrossRef]
  10. Rousi, E.; Fink, A.H.; Andersen, L.S.; Becker, F.N.; Beobide-Arsuaga, G.; Breil, M.; Cozzi, G.; Heinke, J.; Jach, L.; Niermann, D.; et al. The Extremely Hot and Dry 2018 Summer in Central and Northern Europe from a Multi-Faceted Weather and Climate Perspective. Nat. Hazards Earth Syst. Sci. 2023, 23, 1699–1718. [Google Scholar] [CrossRef]
  11. Sinclair, V.A.; Mikkola, J.; Rantanen, M.; Räisänen, J. The Summer 2018 Heatwave in Finland. Weather 2019, 74, 403–409. [Google Scholar] [CrossRef]
  12. Naumann, G.; Cammalleri, C.; Mentaschi, L.; Feyen, L. Increased Economic Drought Impacts in Europe with Anthropogenic Warming. Nat. Clim. Change 2021, 11, 485–491. [Google Scholar] [CrossRef]
  13. Rosenzweig, C.; Elliott, J.; Deryng, D.; Ruane, A.C.; Müller, C.; Arneth, A.; Boote, K.J.; Folberth, C.; Glotter, M.; Khabarov, N.; et al. Assessing Agricultural Risks of Climate Change in the 21st Century in a Global Gridded Crop Model Intercomparison. Proc. Natl. Acad. Sci. USA 2014, 111, 3268–3273. [Google Scholar] [CrossRef] [PubMed]
  14. Estrela, T.; Menéndez, M.; Dimas, M.; Marcuello, C.C.; Rees, G.; Cole, G.; Weber, K.; Grath, J.; Leonard, J.; Ovesen, N.B.; et al. Sustainable Water Use in Europe Part 3: Extreme Hydrological Events: Floods and Droughts; Environmental issue report; European Environment Agency: Copenhagen, Denmark, 2001; pp. 1–84. [Google Scholar]
  15. IDMP. Drought and Water Scarcity; Global Water Partnership and World Meteorological Organization: Stockholm, Sweden; Geneva, Switzerland, 2022; pp. 1–24. [Google Scholar]
  16. Cook, B.I.; Smerdon, J.E.; Cook, E.R.; Williams, A.P.; Anchukaitis, K.J.; Mankin, J.S.; Allen, K.; Andreu-Hayles, L.; Ault, T.R.; Belmecheri, S.; et al. Megadroughts in the Common Era and the Anthropocene. Nat. Rev. Earth Environ. 2022, 3, 741–757. [Google Scholar] [CrossRef]
  17. Ionita, M.; Nagavciuc, V.; Scholz, P.; Dima, M. Long-Term Drought Intensification over Europe Driven by the Weakening Trend of the Atlantic Meridional Overturning Circulation. J. Hydrol. Reg. Stud. 2022, 42, 101176. [Google Scholar] [CrossRef]
  18. Kingston, D.G.; Lawler, D.M.; McGregor, G.R. Linkages between Atmospheric Circulation, Climate and Streamflow in the Northern North Atlantic: Research Prospects. Prog. Phys. Geogr. 2006, 30, 143–174. [Google Scholar] [CrossRef]
  19. Schubert, S.D.; Wang, H.; Koster, R.D.; Suarez, M.J.; Groisman, P.Y. Northern Eurasian Heat Waves and Droughts. J. Clim. 2014, 27, 3169–3207. [Google Scholar] [CrossRef]
  20. Kingston, D.G.; Stagge, J.H.; Tallaksen, L.M.; Hannah, D.M. European-Scale Drought: Understanding Connections between Atmospheric Circulation and Meteorological Drought Indices. J. Clim. 2015, 28, 505–516. [Google Scholar] [CrossRef]
  21. Intergovernmental Panel on Climate Change (IPCC). Climate Change 2021: The Physical Science Basis. Contribution of Working Group I to the Sixth Assessment Report of the Intergovernmental Panel on Climate Change; Masson-Delmotte, V., Zhai, P., Pirani, A., Connors, S.L., Péan, C., Berger, S., Caud, N., Chen, Y., Goldfarb, L., Gomis, M.I., et al., Eds.; Cambridge University Press: Cambridge, UK, 2021. [Google Scholar]
  22. Naumann, G.; Alfieri, L.; Wyser, K.; Mentaschi, L.; Betts, R.A.; Carrao, H.; Spinoni, J.; Vogt, J.; Feyen, L. Global Changes in Drought Conditions Under Different Levels of Warming. Geophys. Res. Lett. 2018, 45, 3285–3296. [Google Scholar] [CrossRef]
  23. Spinoni, J.; Naumann, G.; Vogt, J.V.; Barbosa, P. Meteorological Droughts in Europe: Events and Impacts—Past Trends and Future Projections; Publications Office of the European Union: Luxembourg, 2016; p. 134. [Google Scholar]
  24. Kreibich, H.; Loon, A.F.V.; Schröter, K.; Ward, P.J.; Mazzoleni, M.; Sairam, N.; Abeshu, G.W.; Agafonova, S.; AghaKouchak, A.; Aksoy, H.; et al. The Challenge of Unprecedented Floods and Droughts in Risk Management. Nature 2022, 608, 80–86. [Google Scholar] [CrossRef]
  25. Stagge, J.H.; Kingston, D.G.; Tallaksen, L.M.; Hannah, D.M. Observed Drought Indices Show Increasing Divergence across Europe. Sci. Rep. 2017, 7, 14045. [Google Scholar] [CrossRef] [PubMed]
  26. Nagavciuc, V.; Ionita, M.; Kern, Z.; McCarroll, D.; Popa, I. A ~700 Years Perspective on the 21st Century Drying in the Eastern Part of Europe Based on δ18O in Tree Ring Cellulose. Commun. Earth Environ. 2022, 3, 277. [Google Scholar] [CrossRef]
  27. von Storch, H.; Zwiers, F.W. Statistical Analysis in Climate Research; Cambridge University Press: Cambridge, UK, 1999. [Google Scholar]
  28. Tejedor, E.; de Luis, M.; Cuadrat, J.M.; Esper, J.; Saz, M.Á. Tree-Ring-Based Drought Reconstruction in the Iberian Range (East of Spain) since 1694. Int. J. Biometeorol. 2016, 60, 361–372. [Google Scholar] [CrossRef] [PubMed]
  29. Labuhn, I.; Daux, V.; Girardclos, O.; Stievenard, M.; Pierre, M.; Masson-Delmotte, V. French Summer Droughts since 1326 CE: A Reconstruction Based on Tree Ring Cellulose δ18O. Clim. Past 2016, 12, 1101–1117. [Google Scholar] [CrossRef]
  30. Cook, E.R.; Seager, R.; Kushnir, Y.; Briffa, K.R.; Büntgen, U.; Frank, D.; Krusic, P.J.; Tegel, W.; van der Schrier, G.; Andreu-Hayles, L.; et al. Old World Megadroughts and Pluvials during the Common Era. Sci. Adv. 2015, 1, e1500561. [Google Scholar] [CrossRef]
  31. Freund, M.B.; Helle, G.; Balting, D.F.; Ballis, N.; Schleser, G.H.; Cubasch, U. European Tree-Ring Isotopes Indicate Unusual Recent Hydroclimate. Commun. Earth Environ. 2023, 4, 26. [Google Scholar] [CrossRef]
  32. Rakovec, O.; Samaniego, L.; Hari, V.; Markonis, Y.; Moravec, V.; Thober, S.; Hanel, M.; Kumar, R. The 2018–2020 Multi-Year Drought Sets a New Benchmark in Europe. Earth’s Future 2022, 10, e2021EF002394. [Google Scholar] [CrossRef]
  33. Harris, I.; Jones, P.D.; Osborn, T.J.; Lister, D.H. Updated High-Resolution Grids of Monthly Climatic Observations—The CRU TS3.10 Dataset. Int. J. Climatol. 2014, 34, 623–642. [Google Scholar] [CrossRef]
  34. Wells, N.; Goddard, S.; Hayes, M. A Self-Calibrating Palmer Drought Severity Index. J. Clim. 2004, 17, 2335–2351. [Google Scholar] [CrossRef]
  35. Palmer, W. Meteorological Drought; Weather Bureau: Washington, DC, USA, 1965; Volume 45. [Google Scholar]
  36. Yan, D.; Shi, X.; Yang, Z.; Li, Y.; Zhao, K.; Yuan, Y. Modified Palmer Drought Severity Index Based on Distributed Hydrological Simulation. Math. Probl. Eng. 2013, 2013, 327374. [Google Scholar] [CrossRef]
  37. Zhu, Y.; Liu, Y.; Ma, X.; Ren, L.; Singh, V.P. Drought Analysis in the Yellow River Basin Based on a Short-Scalar Palmer Drought Severity Index. Water 2018, 10, 1526. [Google Scholar] [CrossRef]
  38. Heim, R. Computing the Monthly Palmer Drought Index on a Weekly Basis: A Case Study Comparing Data Estimation Techniques. Geophys. Res. Lett. 2005, 32, L06401. [Google Scholar] [CrossRef]
  39. Harris, I.; Osborn, T.J.; Jones, P.; Lister, D. Version 4 of the CRU TS Monthly High-Resolution Gridded Multivariate Climate Dataset. Sci. Data 2020, 7, 109. [Google Scholar] [CrossRef]
  40. Vicente-Serrano, S.M.; Beguería, S.; López-Moreno, J.I.; Angulo, M.; Kenawy, A.E. A New Global 0.5° Gridded Dataset (1901–2006) of a Multiscalar Drought Index: Comparison with Current Drought Index Datasets Based on the Palmer Drought Severity Index. J. Hydrometeorol. 2010, 11, 1033–1043. [Google Scholar] [CrossRef]
  41. Casty, C.; Raible, C.C.; Stocker, T.F.; Wanner, H.; Luterbacher, J. A European Pattern Climatology 1766–2000. Clim. Dyn. 2007, 29, 791–805. [Google Scholar] [CrossRef]
  42. Hofstra, N.; Haylock, M.; New, M.; Jones, P.D. Testing E-OBS European High-Resolution Gridded Data Set of Daily Precipitation and Surface Temperature. J. Geophys. Res. Atmos. 2009, 114, D21101. [Google Scholar] [CrossRef]
  43. Kumar, R.; Samaniego, L.; Attinger, S. Implications of Distributed Hydrologic Model Parameterization on Water Fluxes at Multiple Scales and Locations. Water Resour. Res. 2013, 49, 360–379. [Google Scholar] [CrossRef]
  44. Vicente-Serrano, S.M.; Beguería, S.; López-Moreno, J.I. A Multiscalar Drought Index Sensitive to Global Warming: The Standardized Precipitation Evapotranspiration Index. J. Clim. 2010, 23, 1696–1718. [Google Scholar] [CrossRef]
  45. Vanderlinden, K.; Giráldez, J.V.; van Meirvenne, M. Spatial Estimation of Reference Evapotranspiration in Andalusia, Spain. J. Hydrometeorol. 2008, 9, 242–255. [Google Scholar] [CrossRef]
  46. Valler, V.; Franke, J.; Brugnara, Y.; Brönnimann, S. An Updated Global Atmospheric Paleo-Reanalysis Covering the Last 400 Years. Geosci. Data J. 2022, 9, 89–107. [Google Scholar] [CrossRef]
  47. Mann, H.B. Non-Parametric Test against Trend. Econometrica 1945, 13, 245–259. [Google Scholar] [CrossRef]
  48. Adamowski, K.; Prokoph, A.; Adamowski, J. Development of a New Method of Wavelet Aided Trend Detection and Estimation. Hydrol. Process. 2009, 23, 2686–2696. [Google Scholar] [CrossRef]
  49. Dang, V.H.; Tran, D.D.; Cham, D.D.; Hang, P.T.T.; Nguyen, H.T.; Truong, H.V.; Tran, P.H.; Duong, M.B.; Nguyen, N.T.; Le, K.V.; et al. Assessment of Rainfall Distributions and Characteristics in Coastal Provinces of the Vietnamese Mekong Delta under Climate Change and ENSO Processes. Water 2020, 12, 1555. [Google Scholar] [CrossRef]
  50. Hamed, K.H.; Rao, A.R. A Modified Mann-Kendall Trend Test for Autocorrelated Data. J. Hydrol. 1998, 204, 182–196. [Google Scholar] [CrossRef]
  51. Sen, P.K. Estimates of the Regression Coefficient Based on Kendall’s Tau. J. Am. Stat. Assoc. 1968, 63, 1379–1389. [Google Scholar] [CrossRef]
  52. Ionita, M.; Tallaksen, L.M.; Kingston, D.G.; Stagge, J.H.; Laaha, G.; Lanen, H.A.J.V.; Scholz, P.; Chelcea, S.M.; Haslinger, K.; Lanen, H.A.J.V.; et al. The European 2015 Drought from a Climatological Perspective. Hydrol. Earth Syst. Sci. 2017, 21, 1397–1419. [Google Scholar] [CrossRef]
  53. Parry, S.; Hannaford, J.; Lloyd-Hughes, B.; Prudhomme, C. Multi-Year Droughts in Europe: Analysis of Development and Causes. Hydrol. Res. 2012, 43, 689–706. [Google Scholar] [CrossRef]
  54. Moravec, V.; Markonis, Y.; Rakovec, O.; Svoboda, M.; Trnka, M.; Kumar, R.; Hanel, M. Europe under Multi-Year Droughts: How Severe Was the 2014–2018 Drought Period? Environ. Res. Lett. 2021, 16, 034062. [Google Scholar] [CrossRef]
  55. Ionita, M.; Nagavciuc, V.; Kumar, R.; Rakovec, O. On the Curious Case of the Recent Decade, Mid-Spring Precipitation Deficit in Central Europe. NPJ Clim. Atmos. Sci. 2020, 3, 49. [Google Scholar] [CrossRef]
  56. Ionita, M.; Boroneanṭ, C.; Chelcea, S. Seasonal Modes of Dryness and Wetness Variability over Europe and Their Connections with Large Scale Atmospheric Circulation and Global Sea Surface Temperature. Clim. Dyn. 2015, 45, 2803–2829. [Google Scholar] [CrossRef]
  57. Brooks, C.E.P.; Glasspoole, J. The Drought of 1921 in the British Isles. Mon. Weather Rev. 1922, 50, 93. [Google Scholar] [CrossRef]
  58. Büntgen, U.; Urban, O.; Krusic, P.J.; Rybníček, M.; Kolář, T.; Kyncl, T.; Ač, A.; Koňasová, E.; Čáslavský, J.; Esper, J.; et al. Recent European Drought Extremes beyond Common Era Background Variability. Nat. Geosci. 2021, 14, 190–196. [Google Scholar] [CrossRef]
  59. Ionita, M.; Dima, M.; Nagavciuc, V.; Scholz, P.; Lohmann, G. Past Megadroughts in Central Europe Were Longer, More Severe and Less Warm than Modern Droughts. Commun. Earth Environ. 2021, 2, 61. [Google Scholar] [CrossRef]
  60. Wilks, D.S. Statistical Methods in the Atmospheric Sciences, 4th ed.; Elsevier: Amsterdam, The Netherlands, 2019. [Google Scholar]
  61. Vicente-Serrano, S.M.; Domínguez-Castro, F.; Murphy, C.; Hannaford, J.; Reig, F.; Peña-Angulo, D.; Tramblay, Y.; Trigo, R.M.; Donald, N.M.; Luna, M.Y.; et al. Long-Term Variability and Trends in Meteorological Droughts in Western Europe (1851–2018). Int. J. Climatol. 2021, 41, E690–E717. [Google Scholar] [CrossRef]
  62. Andreu-Hayles, L.; Lévesque, M.; Guerrieri, R.; Siegwolf, R.T.W.; Körner, C. Limits and Strengths of Tree-Ring Stable Isotopes. In Stable Isotopes in Tree Rings: Inferring Physiological, Climatic and Environmental Responses; Springer International Publishing: Cham, Switzerland, 2022. [Google Scholar]
  63. Gagen, M.; Battipaglia, G.; Daux, V.; Duffy, J.; Dorado-Liñán, I.; Hayles, L.A.; Martínez-Sancho, E.; McCarroll, D.; Shestakova, T.A.; Treydte, K. Climate Signals in Stable Isotope Tree-Ring Records. In Stable Isotopes in Tree Rings. Tree Physiology; Siegwolf, R.T.W., Brooks, J.R., Roden, J., Saurer, M., Eds.; Springer International Publishing: Cham, Switzerland, 2022; pp. 537–579. [Google Scholar]
  64. Samaniego, L.; Thober, S.; Kumar, R.; Wanders, N.; Rakovec, O.; Pan, M.; Zink, M.; Sheffield, J.; Wood, E.F.; Marx, A. Anthropogenic Warming Exacerbates European Soil Moisture Droughts. Nat. Clim. Change 2018, 8, 421–426. [Google Scholar] [CrossRef]
  65. McCarroll, D.; Loader, N.J. Stable Isotopes in Tree Rings. Quat. Sci. Rev. 2004, 23, 771–801. [Google Scholar] [CrossRef]
  66. Levanič, T.; Popa, I.; Poljanšek, S.; Nechita, C. A 323-Year Long Reconstruction of Drought for SW Romania Based on Black Pine (Pinus Nigra) Tree-Ring Widths. Int. J. Biometeorol. 2013, 57, 703–714. [Google Scholar] [CrossRef] [PubMed]
  67. Nagavciuc, V.; Roibu, C.C.; Ionita, M.; Mursa, A.; Cotos, M.; Popa, I. Different Climate Response of Three Tree Ring Proxies of Pinus Sylvestris from the Eastern Carpathians, Romania. Dendrochronologia 2019, 54, 56–63. [Google Scholar] [CrossRef]
  68. Barrington, R.M. The Drought of 1887, and Some of Its Effects on Irish Agriculture. J. Stat. Soc. Inq. Soc. Irel. 1888, 9, 223–247. [Google Scholar]
  69. Bonacina, L.C.W. The European Drought of 1921. Nature 1923, 112, 488–489. [Google Scholar] [CrossRef]
  70. Brázdil, R.; Kiss, A.; Luterbache, J.; Nash, D.J.; Řezníčková, L. Documentary Data and the Study of Past Droughts: A Global State of the Art. Clim. Past 2018, 14, 1915–1960. [Google Scholar] [CrossRef]
  71. Brázdil, R.; Dobrovolný, P.; Trnka, M.; Řezníčková, L.; Dolák, L.; Kotyza, O. Extreme Droughts and Human Responses to Them: The Czech Lands in the Pre-Instrumental Period. Clim. Past 2019, 15, 1–24. [Google Scholar] [CrossRef]
  72. European Environment Agency. Economic Losses from Climate-Related Extremes in Europe; European Environment Agency: Copenhagen, Denmark, 2022. [Google Scholar]
  73. Glaser, R. Klimageschichte Mitteleuropas; WBG: Washington, DC, USA, 2013. [Google Scholar]
  74. Ionita, M.; Scholz, P.; Chelcea, S. Assessment of Droughts in Romania Using the Standardized Precipitation Index. Nat. Hazards 2016, 81, 1483–1498. [Google Scholar] [CrossRef]
  75. Lanen, H.A.J.V.; Laaha, G.; Kingston, D.G.; Gauster, T.; Ionita, M.; Vidal, J.P.; Vlnas, R.; Tallaksen, L.M.; Stahl, K.; Hannaford, J.; et al. Hydrology Needed to Manage Droughts: The 2015 European Case. Hydrol. Process. 2016, 30, 3097–3104. [Google Scholar] [CrossRef]
  76. Linderholm, H.W.; Molin, T. Early Nineteenth Century Drought in East Central Sweden Inferred from Dendrochronological and Historical Archives. Clim. Res. 2005, 29, 63–72. [Google Scholar] [CrossRef]
  77. Mihailescu, C. Clima Si Harardele Moldovei. Evolutia, Starea Si Predictia; Licorn: Chisinau, Moldova, 2004. [Google Scholar]
  78. Možný, M.; Brázdil, R.; Dobrovolný, P.; Trnka, M. April-August Temperatures in the Czech Lands, 1499–2015, Reconstructed from Grape-Harvest Dates. Clim. Past 2016, 12, 1421–1434. [Google Scholar] [CrossRef]
  79. Noone, S.; Broderick, C.; Duffy, C.; Matthews, T.; Wilby, R.L.; Murphy, C. A 250-Year Drought Catalogue for the Island of Ireland (1765–2015). Int. J. Climatol. 2017, 37, 239–254. [Google Scholar] [CrossRef]
  80. Schrier, G.V.D.; Allan, R.P.; Ossó, A.; Sousa, P.M.; Vyver, H.V.D.; Schaeybroeck, B.V.; Coscarelli, R.; Pasqua, A.A.; Petrucci, O.; Curley, M.; et al. The 1921 European Drought: Impacts, Reconstruction and Drivers. Clim. Past 2021, 17, 2201–2221. [Google Scholar] [CrossRef]
  81. Teodoreanu, E. În Căutarea Timpului Trecut Schiță de Climatologie Istorică; Editura Paodeia: Bucuresti, Romania, 2017. [Google Scholar]
  82. Topor, N. Anii Ploioşi Şi Secetoşi Din Republica Populară Romînă; C.S.A Institutul Meteorologic: Bucureşti, Romania, 1963. [Google Scholar]
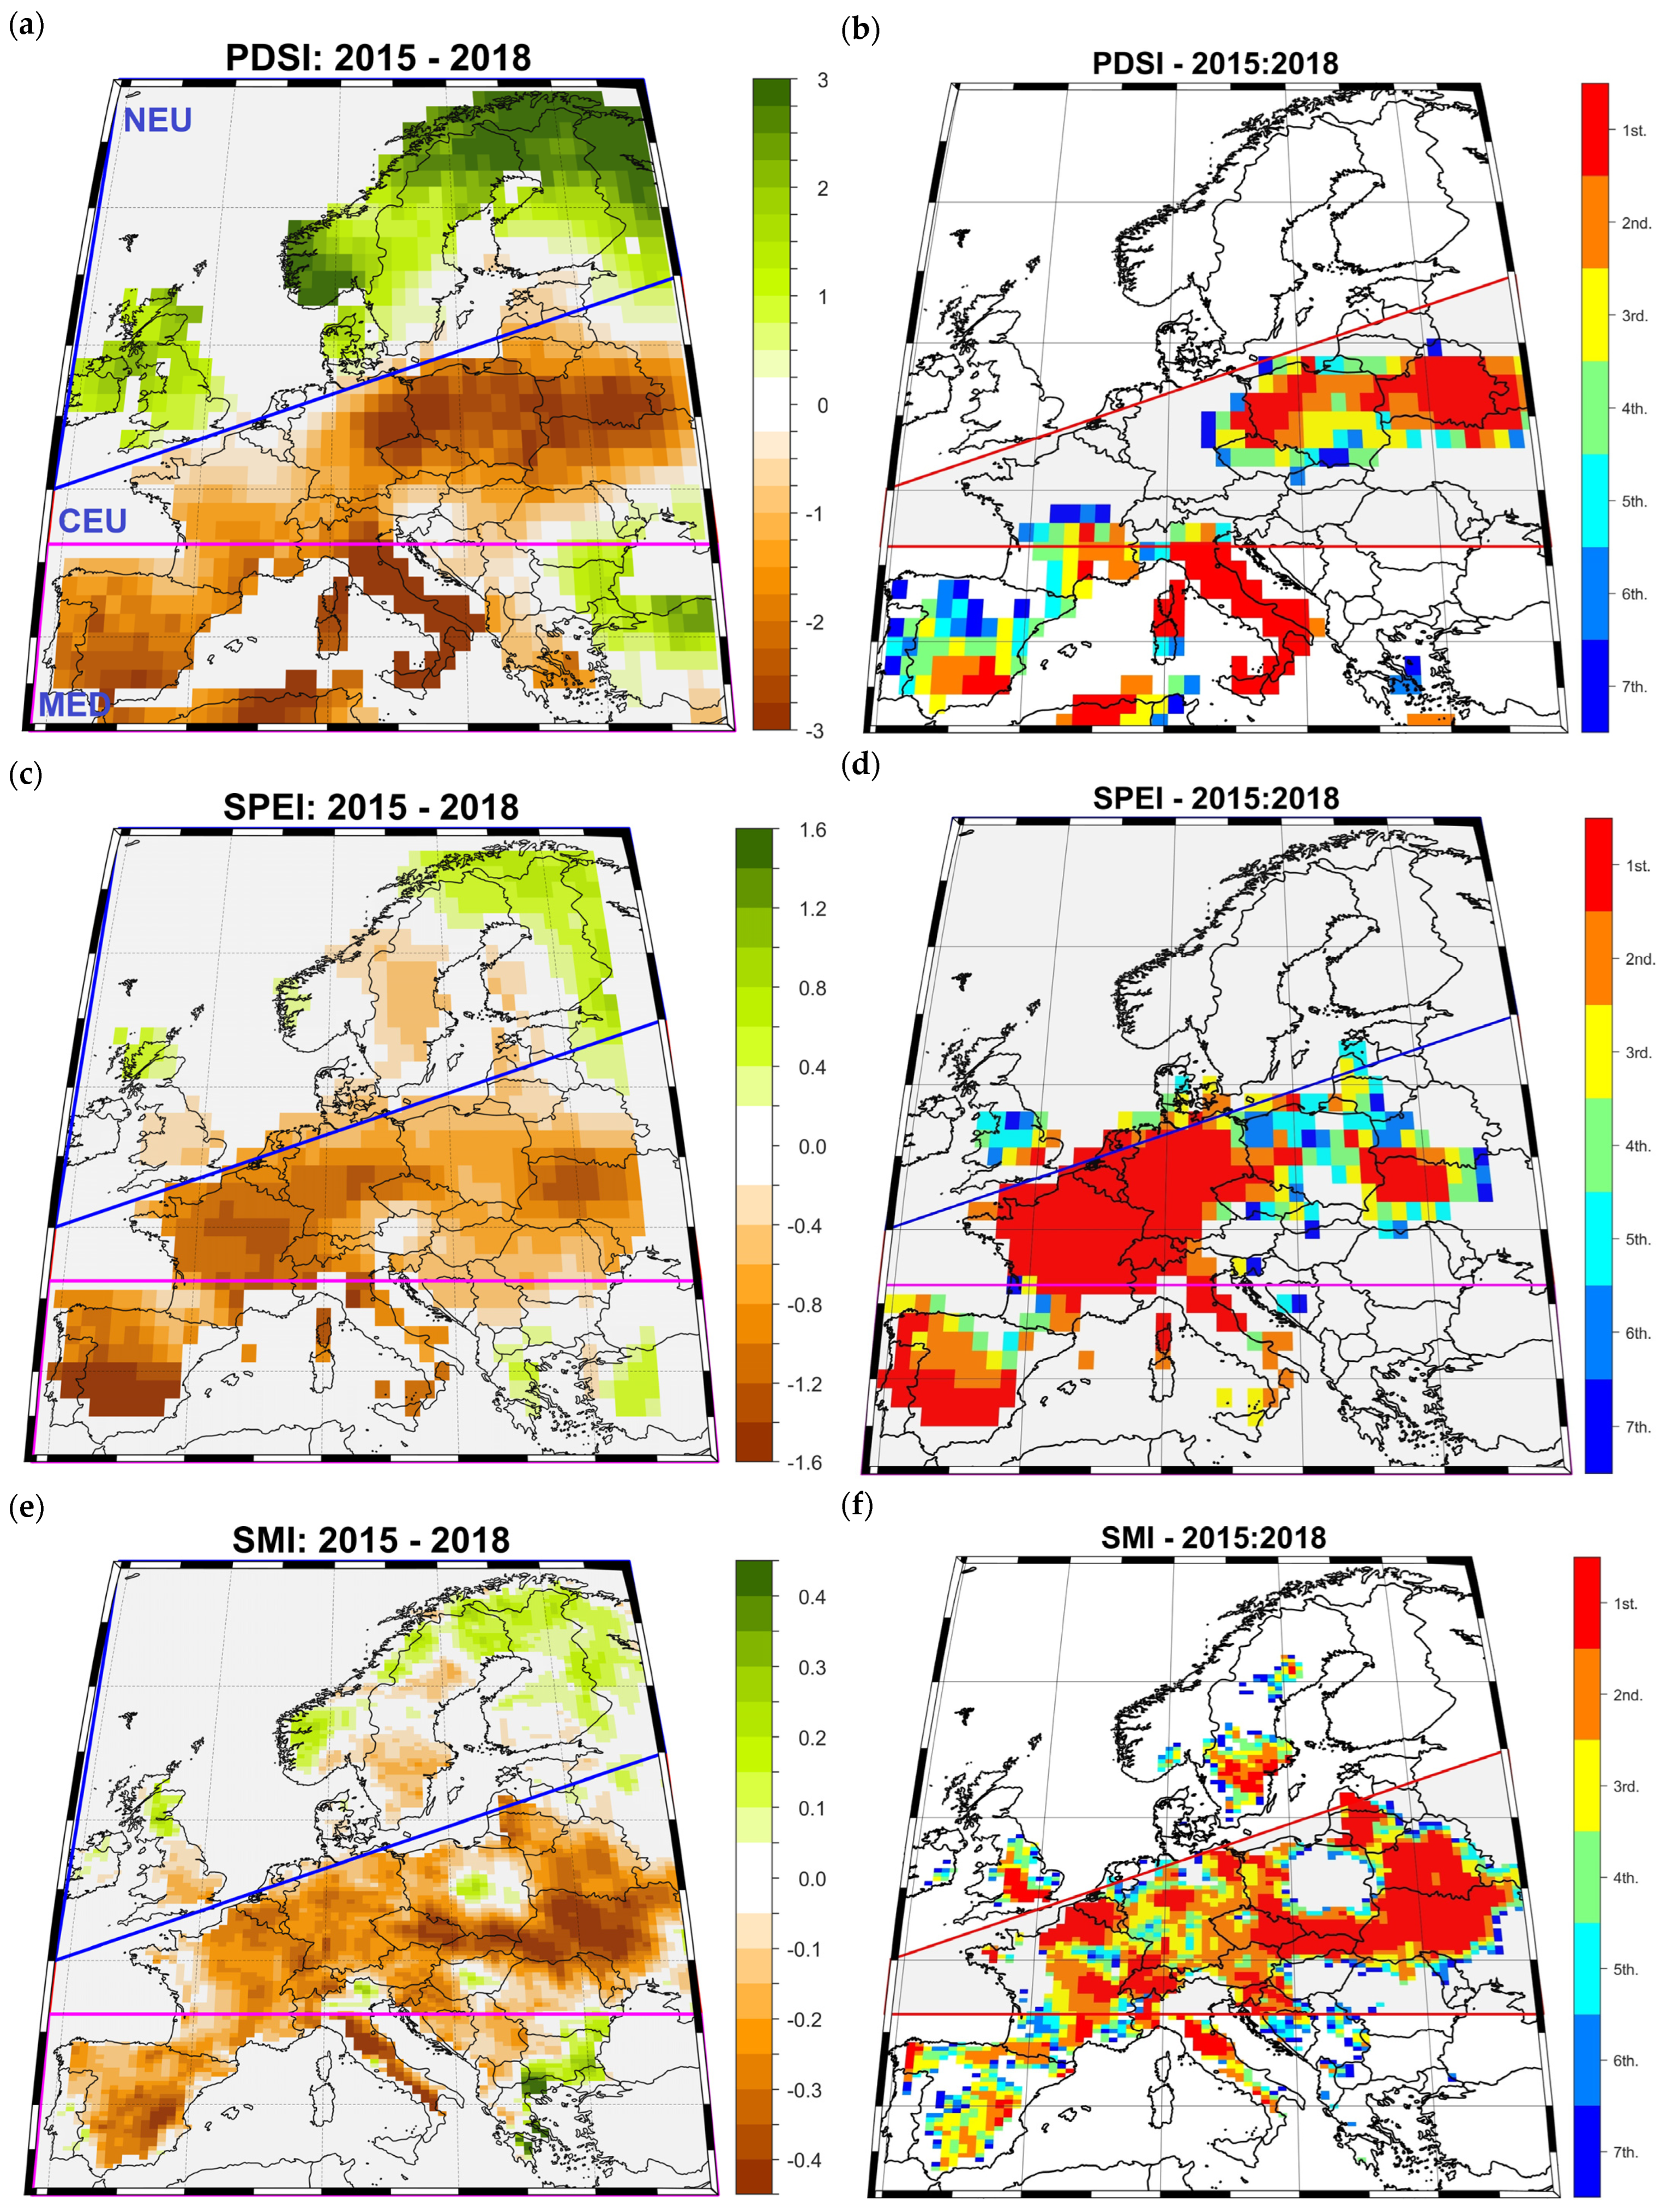
Figure 1. The magnitude ((left) column) and rank ((right) column) of the 2015–2018 drought event in Europe, as captured by three different drought indicators: (a,b) PDSI [30]; (c,d) SPEI2 July–August (JA) [31], and (e,f) SMI [32]. The data on the left column represent the average values of PDSI and SPEI over the period of 2015–2018. For SMI, the anomalies relative to the period of 1971–2000 are shown, since SMI is not defined based on different thresholds for drought conditions. For the figures on the right column, 1 means the driest period, 2 signifies the second-driest, etc., and all ranks greater than 7 are shown in white. Analyzed period: 1776–2018. In (a) the locations of the different regions used in this paper are also indicated (i.e., MED, CEU, and NEU).
Forests 16 01739 g001
Figure 2. Temporal evolution of the regional (i.e., EURO) means of (a) PDSI, (b) SPEI, and (c) SMI. The blue line in (ac) indicates the linear trend over the analyzed period and the red line indicates the smoothed time series with a lowest filter. The values of the slope (S) and the p-value for each indicator (p) are shown on each figure in the gray shaded area. Analyzed period: 1766–2018.
Forests 16 01739 g002
Figure 3. Temporal evolution of the percentage area affected by droughts over EURO for (a) PDSI, (b) SPEI, and (c) SMI. The thresholds used to define a drought event for each indicator are given in Table 1. The blue line in (ac) indicates the linear trend over the analyzed period and the red line indicates the smoothed time series with a lowest filter. The values of the slope (S) and the p-value for each indicator (p) are shown on each figure in the gray shaded area. Analyzed period: 1776–2018.
Forests 16 01739 g003
Figure 4. Spatial patterns of the driest years identified for each drought indicator for EURO (a) PDSI (1868), (b) SPEI (1868), (c) SMI (1868), (d) PDSI (1874), (e) SPEI (1874), (f) SMI (1874), (g) PDSI (2003), (h) SPEI (2003), (i) SMI (2003), see Table 2 for a detailed overview. Light to dark green colors indicate wetness, while light to dark brown colors indicate dryness.
Forests 16 01739 g004
Figure 5. Scatter plot of the time series and total area affected by drought, at decadal time scales, for (a) PDSI, (b) SMI, and (c) SPEI. The bubble size corresponds to the total drought area. Analyzed period: 1776–2018. The drought area is defined as the average over the whole of Europe for the grid points where the respective drought indicator was smaller than Q10 (see Table 1 for the thresholds for each indicator).
Forests 16 01739 g005
Figure 6. The decadal temporal evolution of the regional means of (a) PDSI, (b) SPEI, and (c) SMI. Analyzed period for PDSI, SPEI, and SMI: 1776–2018. In panels (a,b), green colors represent wet climatic conditions and dark red colors represent dry climatic conditions.
Forests 16 01739 g006
Figure 7. Spatial patterns of the driest decades identified for each drought indicator (a) PDSI (1941–1950), (b) PDSI (2011–2018), (c) SPEI (1941–1950), (d) SPEI (2011–2018), (e) SMI (1941–1950), (f) SMI (2011–2018), (see Table S2 for a detailed overview).
Forests 16 01739 g007
Figure 8. The first coupled mode of variability between (a) PDSI, (b) SPEI, (c) SMI, and (d) summer Z500. (e) The standardized amplitudes corresponding to CCA1 Drought (PC1 Drought—orange line) computed from the reconstructed PDSI, SPEI, and SMI datasets (panels (ac)) and CCA1 Z500 (PC1 Z500—magenta line). The red line indicates the smoothed time series with a lowest filter. Analyzed period: 1766–2008. In panel (d) “H” means high and “L” means low.
Forests 16 01739 g008
Figure 9. The second coupled mode of variability between (a) PDSI, (b) SPEI, (c) SMI, and (d) summer Z500. (e) The standardized amplitudes corresponding to CCA2 Drought (PC2 Drought—gray line) computed from the reconstructed PDSI, SPEI, and SMI datasets (panels (ac)) and CCA2 Z500 (PC2 Z500—blue line). The red line indicates the smoothed time series with a lowest filter. Analyzed period: 1766–2008. In panel (d) “H” means high and “L” means low.
Forests 16 01739 g009
Figure 10. The third coupled mode of variability between (a) PDSI, (b) SPEI, (c) SMI, and (d) summer Z500; (e) The standardized amplitudes corresponding to CCA3 Drought (PC3 Drought—black line) computed from the reconstructed PDSI, SPEI, and SMI datasets (panels (ac)) and CCA3 Z500 (PC3 Z500—green line). The red line indicates the smoothed time series with a lowest filter. Analyzed period: 1766–2008. In panel (d) “H” means high and “L” means low.
Forests 16 01739 g010
Table 1. Q10 is the threshold for each indicator (i.e., PDSI, SPEI, and SMI), for each analyzed region (i.e., EURO, MED, CEU, and NEU), and the analyzed period.
EUROMEDCEUNEUPeriod
PDSI−1.74−1.79−1.17−1.141766–2018
SPEI−0.64−0.68−0.81−0.591766–2018
SMI0.330.320.310.361766–2018
Table 2. The driest years in terms of magnitude (M) and spatial extent (A) at interannual time scales over the common period of 1766–2018. The years in bold represent the years with the most severe drought.
EUROMEDCEUNEU
PDSISPEISMIPDSISPEISMIPDSISPEISMIPDSISPEISMI
Magnitude187420031868194520121945192120151868182618681826
194720061947177920032003183518072015181818581858
189318422003187420161950195219471921197619011798
185818741822189320071990196418341811194020062018
185920131783201718812012182718352003196918261959
Area185918421868194520121945192120151868182619591826
189320031947187420032003183518072015185820061798
185820132003177918811950196418421921195918581858
187420061822186719672015185919041819196918191901
194718742015189318591990195220131811184719011959
Table 3. The driest years in terms of magnitude (M) and spatial extent (A) at decadal time scales over the common period of 1766–2018. The years in bold represent the years with the most severe drought.
EUROMEDCEUNEU
PDSISPEISMIPDSISPEISMIPDSISPEISMIPDSISPEISMI
Magnitude1941–502011–181781–901941–502011–182001–101941–502011–181781–901971–801851–601771–80
1801–101861–702011–181861–702001–101991–002011–181941–502011–181851–601861–701941–50
1891–001941–501941–501981–901861–701941–501831–402001–101861–701821–301971–801791–00
1861–702001–102001–102011–181771–801981–801801–101861–702001–101811–201891–001851–60
1781–901831–401861–701891–001941–502011–181791–001791–001991–001911–201811–201911–20
Area1941–502011–182011–181941–502011–181991–001941–502011–182011–181851–601851–601851–60
2011–182001–101941–502011–182001–102001–101831–402001–101781–901821–301891–001941–50
1821–301991–001781–901981–901771–801941–502011–181991–001861–701971–801971–801771–80
1861–701861–702001–101861–701981–901981–901801–101941–501951–601771–801921–301791–00
1801–101891–001861–702001–101961–702011–181861–701861–702001–101931–401861–701971–80
Disclaimer/Publisher’s Note: The statements, opinions and data contained in all publications are solely those of the individual author(s) and contributor(s) and not of MDPI and/or the editor(s). MDPI and/or the editor(s) disclaim responsibility for any injury to people or property resulting from any ideas, methods, instructions or products referred to in the content.