Article

A Method for Estimating Tree Age Based on the Tree Trunk Diameter and the Average Radial Growth Rate in Recent Years

1
College of Computer and Information Technology, Xinyang Normal University, Xinyang 464000, China
2
Henan Dabieshan National Field Observation and Research Station of Forest Ecosystem, Zhengzhou 450046, China
3
Xinyang Academy of Ecological Research, Xinyang 464000, China
4
College of Tourism, Xinyang Normal University, Xinyang 464000, China
5
Affairs Center, Henan Jigongshan National Nature Reserve, Xinyang 464000, China
6
Research Institute of Forest Resource Information Techniques, Chinese Academy of Forestry, Beijing 100091, China
7
Beijing Key Laboratory of Greening Plants Breeding, Beijing Academy of Forestry and Landscape Architecture, Beijing 100102, China
8
College of Mathematics and Statistics, Xinyang Normal University, Xinyang 464000, China
*
Author to whom correspondence should be addressed.
Forests 2025, 16(11), 1725; https://doi.org/10.3390/f16111725
Submission received: 10 September 2025 / Revised: 5 November 2025 / Accepted: 8 November 2025 / Published: 13 November 2025
(This article belongs to the Special Issue Growth Models for Forest Stand Development Dynamics)

Abstract

To improve the accuracy of tree age estimation by accounting for variations in radial growth, this study developed a diameter/age model that incorporates the radial growth rate for seven typical tree species across subtropical to cold temperate regions. For each tree species, six trees—representing dominant, intermediate, and suppressed trees—were selected. A total of 646 disks were collected at 1 m intervals along the stems, starting at 0.3 m height. Disk diameters and tree rings were measured, and the radial growth rate of each disk over the past two years was calculated. For each tree species, two-thirds of the data were randomly selected as the modeling dataset, while the remaining one-third served as the testing dataset. Based on scatter plots, we selected linear models, logarithmic models, and exponential models as candidate models. A logarithmic function best described the diameter/age relationship, while an exponential model best fit the radial growth rate/age relationship. A dual-factor nonlinear model combining both variables achieved the highest estimation accuracy (80.29%), significantly outperforming single-factor models based solely on diameter (50.76%) or growth rate (73.01%). These results demonstrate that integrating radial growth rate substantially enhances the precision of tree age estimation.

1. Introduction

Tree age serves as a fundamental ecological parameter with profound implications for forest ecosystem dynamics, sustainable resource management, and climate change adaptation strategies, constituting a critical research focus in contemporary forestry science [1,2,3,4,5]. Accurate age determination through dendrochronological analysis enables precise reconstruction of forest growth patterns and carbon sequestration potential, which fundamentally influences the development of silvicultural practices and forest productivity models [6,7]. The temporal architecture of forest communities, as reflected in age/class distributions, provides critical insights into successional trajectories, disturbance regimes, and ecosystem resilience mechanisms [8,9,10,11,12,13,14]. Such structural analyses form the scientific foundation for understanding community assembly processes, biodiversity maintenance, and functional adaptation in forest ecosystems—knowledge essential for formulating climate-smart conservation policies and optimizing forest management under rapidly changing environmental conditions [15,16,17]. The advancement of age estimation methodologies, particularly through integration of advanced dendrochronological techniques with non-destructive sampling methodologies, therefore represents a priority research area with significant implications for achieving sustainable development goals in forestry sectors worldwide [18,19]. Meanwhile, under the conceptual framework for socio-cultural value assessment and multi-scale protection of large old trees, references can be provided for the improvement of current conservation policies and the formulation of rural revitalization strategies in China [20].
Currently, the methods for measuring and estimating tree age mainly include mathematical model [21,22,23], tree disk [24,25], increment core [26,27,28], micro drill resistance [29,30], and so on.
The mathematical model method generally estimates tree age with the model between tree trunk diameter and tree age. Measuring the diameter of a tree trunk is non-destructive, fast, and accurate. Therefore, once an accurate mathematical model has been established, it is very easy to estimate the tree age [31,32]. However, due to the significant differences in radial growth rates between different trees, there are significant differences in the age of trees with the same diameter. Therefore, mathematical modeling method has large errors in estimating tree age [33,34,35].
The tree disk method is employed to determine the age of a tree by counting the number of tree rings on the trunk disk. Among all the methods for measuring tree age, this method has the highest measurement accuracy [36]. Cutting disks will damage forest resources, and collecting and processing disks are time-consuming and laborious. Therefore, this method has many limitations [37]. Advanced scanning systems such as Lignostation enable high-resolution, non-contact analysis of tree disks, thereby enhancing measurement accuracy and efficiency, reducing human error, and facilitating the digitization and subsequent processing of ring width data [38]. However, these devices are relatively expensive, and most forestry workers and researchers cannot afford them.
The increment core method measures the tree age by counting the number of tree rings in a core taken from the tree trunk [28,39]. This method does not require logging and has high measurement accuracy, making it the most commonly used method for measuring tree age. However, this method will leave a hole in the trunk, which has some negative impact on tree growth and wood quality [40]. In addition, sampling and processing wood cores are time-consuming and laborious. Therefore, researchers have been trying to develop a non-destructive, rapid, and accurate method to replace the increment core method [41].
The micro drill resistance method uses a motor to control a drill needle to drill into a tree at a constant speed and measures tree rings through the drill resistance curve. When the drill needle penetrates the latewood, the latewood density is higher and the drill resistance is greater; when the drill needle drills into the earlywood, the density of the earlywood is lower and the drill resistance is smaller [42]. If the drill needle drills into the trunk in the radial direction, the drill resistance alternates between peaks and valleys. Therefore, the tree age can be estimated by the number of peaks in the resistance curve [43,44]. This method has fast measurement speed and causes minimal damage to trees. Therefore, it has great potential for development. However, due to noise signals in the drill resistance, the peaks in the resistance curve cannot be matched one-to-one with latewood, resulting in difficulties in identifying tree rings and low measurement accuracy [45].
Among the four commonly used methods for measuring tree age, the mathematical model method is non-destructive [46]. If the accuracy of the mathematical model can be improved, the mathematical model method will be widely used [47,48]. The main reason for the low estimation accuracy of the mathematical model is the different radial growth rates among different trees [49]. Assuming that there is no sudden change in the growth environment of trees, the radial growth rate of trees will change according to a certain pattern. Therefore, the growth environment of trees can be roughly determined by the average growth rate of trees in recent years. Inspired by this idea, this paper adds the ratio of the radial increment in the last two years to truck diameter to the tree age estimation model to further improve the accuracy of the mathematical model. Using trunk diameter and the average radial growth rate of the outermost layer as independent variables, and using tree age as the dependent variable, a new mathematical model for tree age is constructed.

2. Materials and Methods

2.1. Overview of the Research Area and Tree Species

From June to September 2024, seven tree species with different radial growth rates were selected. The four study sites were selected based on a strategic design to capture key environmental gradients. The study areas and the tree species selected in each area are summarized as follows.
(1)
Wudaoxia National Nature Reserve
Wudaoxia National Nature Reserve (111°05′–111°27′ E, 31°37′–31°45′ N) is located in Xiangyang City, Hubei Province, China. The study area experiences a humid subtropical monsoon climate, with an average annual precipitation ranging from 800 to 1000 mm and a mean annual temperature of 14–16 °C. The dominant soil type is mountain yellow-brown soil, which is well drained and nutrient-rich. Therefore, this area is suitable for the growth of Larix kaempferi (Lamb.) Carr. Due to the very wide tree ring width and clear tree ring lines of Larix kaempferi trees growing in this area, six Larix kaempferi trees were selected as research objects in this area.
(2)
Ji Gong Mountain Nature Reserve
Ji Gong Mountain Nature Reserve (114°01′–114°06′ E, 31°46′–31°52′ N) is located in Xinyang City, Henan Province, China. The region receives 1100–1400 mm of annual precipitation with a mean temperature of 15.2 °C. The dominant soil types include yellow-brown soil and mountain brown soil. Therefore, the growth rate of trees in this area is relatively fast. This area is the northern boundary for the growth of Pinus massoniana Lamb., Cunninghamia lanceolata (Lamb.) Hook, and Cryptomeria fortune Hook.f. Due to the wide average tree ring width and clear tree ring lines of Pinus massoniana, Cunninghamia lanceolata, and Cryptomeria fortune growing in this area, six Cryptomeria fortunei, six Pinus massoniana, and six Cunninghamia lanceolata trees were selected as study objects in this area.
(3)
Miyun Reservoir Water Conservation Forest Demonstration Zone
Miyun Reservoir Water Conservation Forest Demonstration Zone (116°53′ E, 40°25′ N) is located in Miyun District, Beijing, China. The mean annual precipitation is approximately 600 mm, and the average annual temperature is 11.8 °C. Situated in a low mountainous region, the site exhibits poor soil quality, characterized by low nutrient availability and limited water retention capacity, which poses significant challenges for tree growth and forest regeneration. This area is suitable for the growth of trees with good drought and cold tolerance. Due to the narrow tree ring width and clear ring lines of Pinus tabulaeformis Carr. and Platycladus orientalis (L.) Franco growing in this area, six Pinus tabuliformis and six Platycladus orientalis trees were selected as study objects in this area.
(2)
Xinlin Forestry Bureau in Daxing’anling area
Xinlin Forestry Bureau (123°41′–125°25′ E, 51°21′–52°10′ N) is situated in the Greater Khingan Mountains (Daxing’anling) of Mohe City, Heilongjiang Province, northeastern China. The terrain exhibits a gentle undulating topography within low mountain hills, with elevations ranging from 300 to 600 m a.s.l., underlain by a continuous permafrost layer that profoundly influences ecosystem dynamics. Climatic records indicate a mean annual precipitation of 400–500 mm (predominantly as summer rainfall) and an average annual temperature of −3.5 °C (±0.8 °C SD), creating one of the most challenging growth environments for boreal conifers globally. This area is more suitable for the growth of Larix gmelinii (Rupr.) Kuzen. Due to the moderate tree ring width and clear annual ring boundaries of Larix gmelinii growing in this area, six Larix gmelinii trees were selected as study objects in this area.
The distribution map of the research area is shown in Figure 1.

2.2. Disk Sampling and Processing

Among the seven tree species studied, each species contains 6 trees, for a total of 42 trees. In each tree species, two dominant trees, two intermediate trees, and two suppressed trees with normal growth were selected for disk sampling. The basic information of the analytical wood is shown in Table 1.
After a tree was cut down, the tree height was measured. We cut 5 cm thick tree disks separately at 0.3 m, 1.0 m, 1.3 m, 1.5 m, and at intervals of 1 m above 1.5 m on the trunk. The disks were polished until the tree ring lines were clear. We measured the number and width of all tree rings in four directions on each disk using Lintab 6.0. The basic information of the tree disks is shown in Table 2.

2.3. Data Processing

Firstly, the current diameter D of each disk’s xylem and the diameter D0 2 years ago were calculated. Subsequently, the average annual radial growth rate in the last two years R was calculated using Equation (1).
R = D D 0 2 D   100 %  

2.4. Modeling Method

For each tree species, the disk data of 4 trees were randomly selected as the modeling dataset, and the disk data of the remaining 2 trees were used as the testing dataset. Firstly, the scatter plot between disk age and the average radial growth rate of the outermost layer, as well as the scatter plot between disk age and the disk diameter D were drawn with the total disk data. Secondly, based on the distribution of these scatter plots, the alternative form of the mathematical model between disk age and average radial growth rate of the outermost layer, disk age, and disk diameter D was determined. Thirdly, using the alternative model forms, mathematical models for the relationship between disk age and average radial growth rate of the outermost layer, as well as the relationship between disk age and diameter, were established with the modeling dataset separately. Finally, the mathematical model with the highest R-squared between disk age and the average radial growth rate of the outermost layer, and the mathematical model with the highest R-squared between disk age and disk diameter D were selected to establish a mathematical model for disk age and the average radial growth rate of the outermost layer and disk diameter D.

2.5. Model Evaluation Method

Firstly, using the modeling dataset, we calculated the estimated age of the mathematical model with the highest R-squared between disk age and disk diameter D, the estimated age of the mathematical model with the highest R-squared between disk age and the average radial growth rate of the outermost layer, and the estimated age of the mathematical model between disk age and the average radial growth rate of the outermost layer and diameter D. Secondly, using the test dataset, the root mean square error (RMSE) and mean absolute error (MAE) of these 3 models were calculated with Equations (2) and (3), respectively. Thirdly, Equation (4) was used to calculate the average estimation accuracy ( ε ) of these 3 models; to assess the predictive performance of the models, we compared the predicted tree ages from each model against the observed values using paired t-tests. This allowed us to detect any systematic biases in the predictions and to statistically compare the accuracy between competing models. The t-tests were conducted under a significance level of α = 0.05. Finally, three models were evaluated through a comparative analysis of their RMSE, MAE, Akaike information criterion (AIC), Bayesian information criterion (BIC), variance, standard deviation (SD), and the t-values among their estimated tree ages.
R M S E = i = 1 n y i y ^ i 2 n  
  M A E = 1 n i = 1 n y i y ^ i  
  ε = i = 1 n 1 y ^ l ˙ y i y i / n
  A I C = 2 k 2 ln L ^
  B I C = k ln n 2 ln L ^  
  σ 2 = 1 n k i = 1 n y ^ i y i 2  
σ = 1 n k i = 1 n y ^ i y i 2  
In the formulas, y i refers to the i -th observed value, and y i ^ represents the i -th predicted value. The total sample size is denoted by n . k is the number of model-estimated parameters, and ln L ^ is the log-likelihood of the model.

3. Results and Analysis

3.1. Modeling Results

3.1.1. The Results of Alternative Mathematical Model Forms

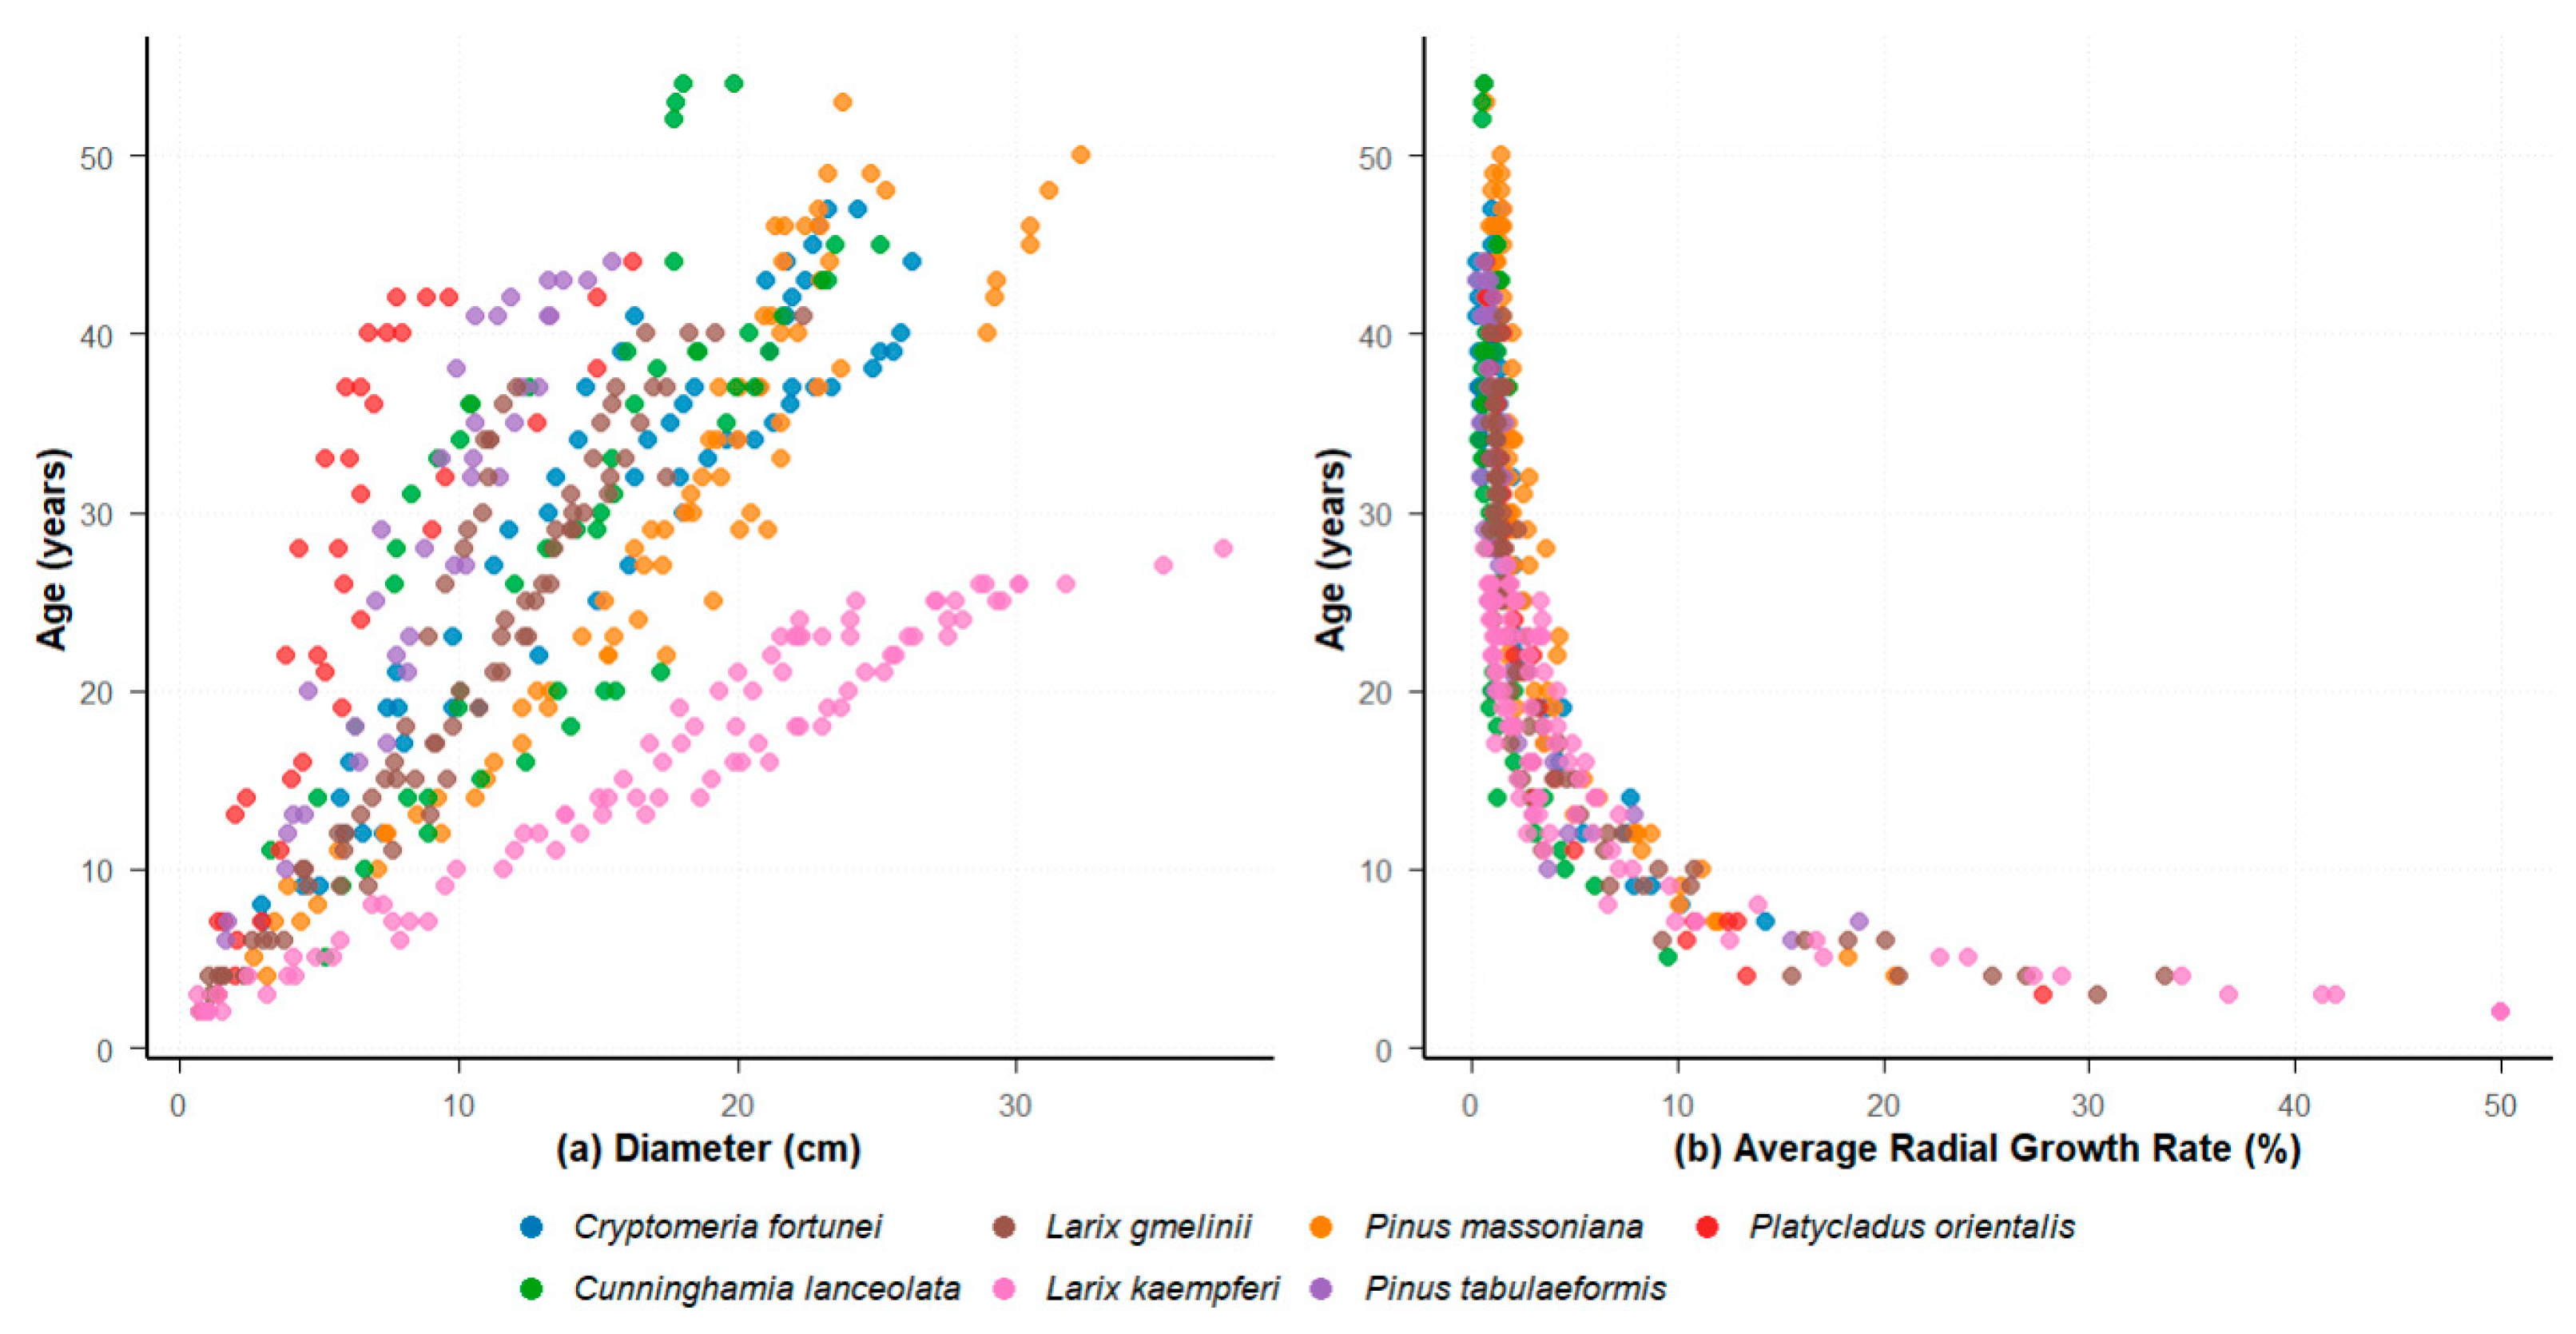
The scatter plots between diameter and tree age, and radial growth rate and tree age are shown in Figure 2a and Figure 2b, respectively.

3.1.2. The Results of Selected Model Form from the Alternative Mathematical Model Forms

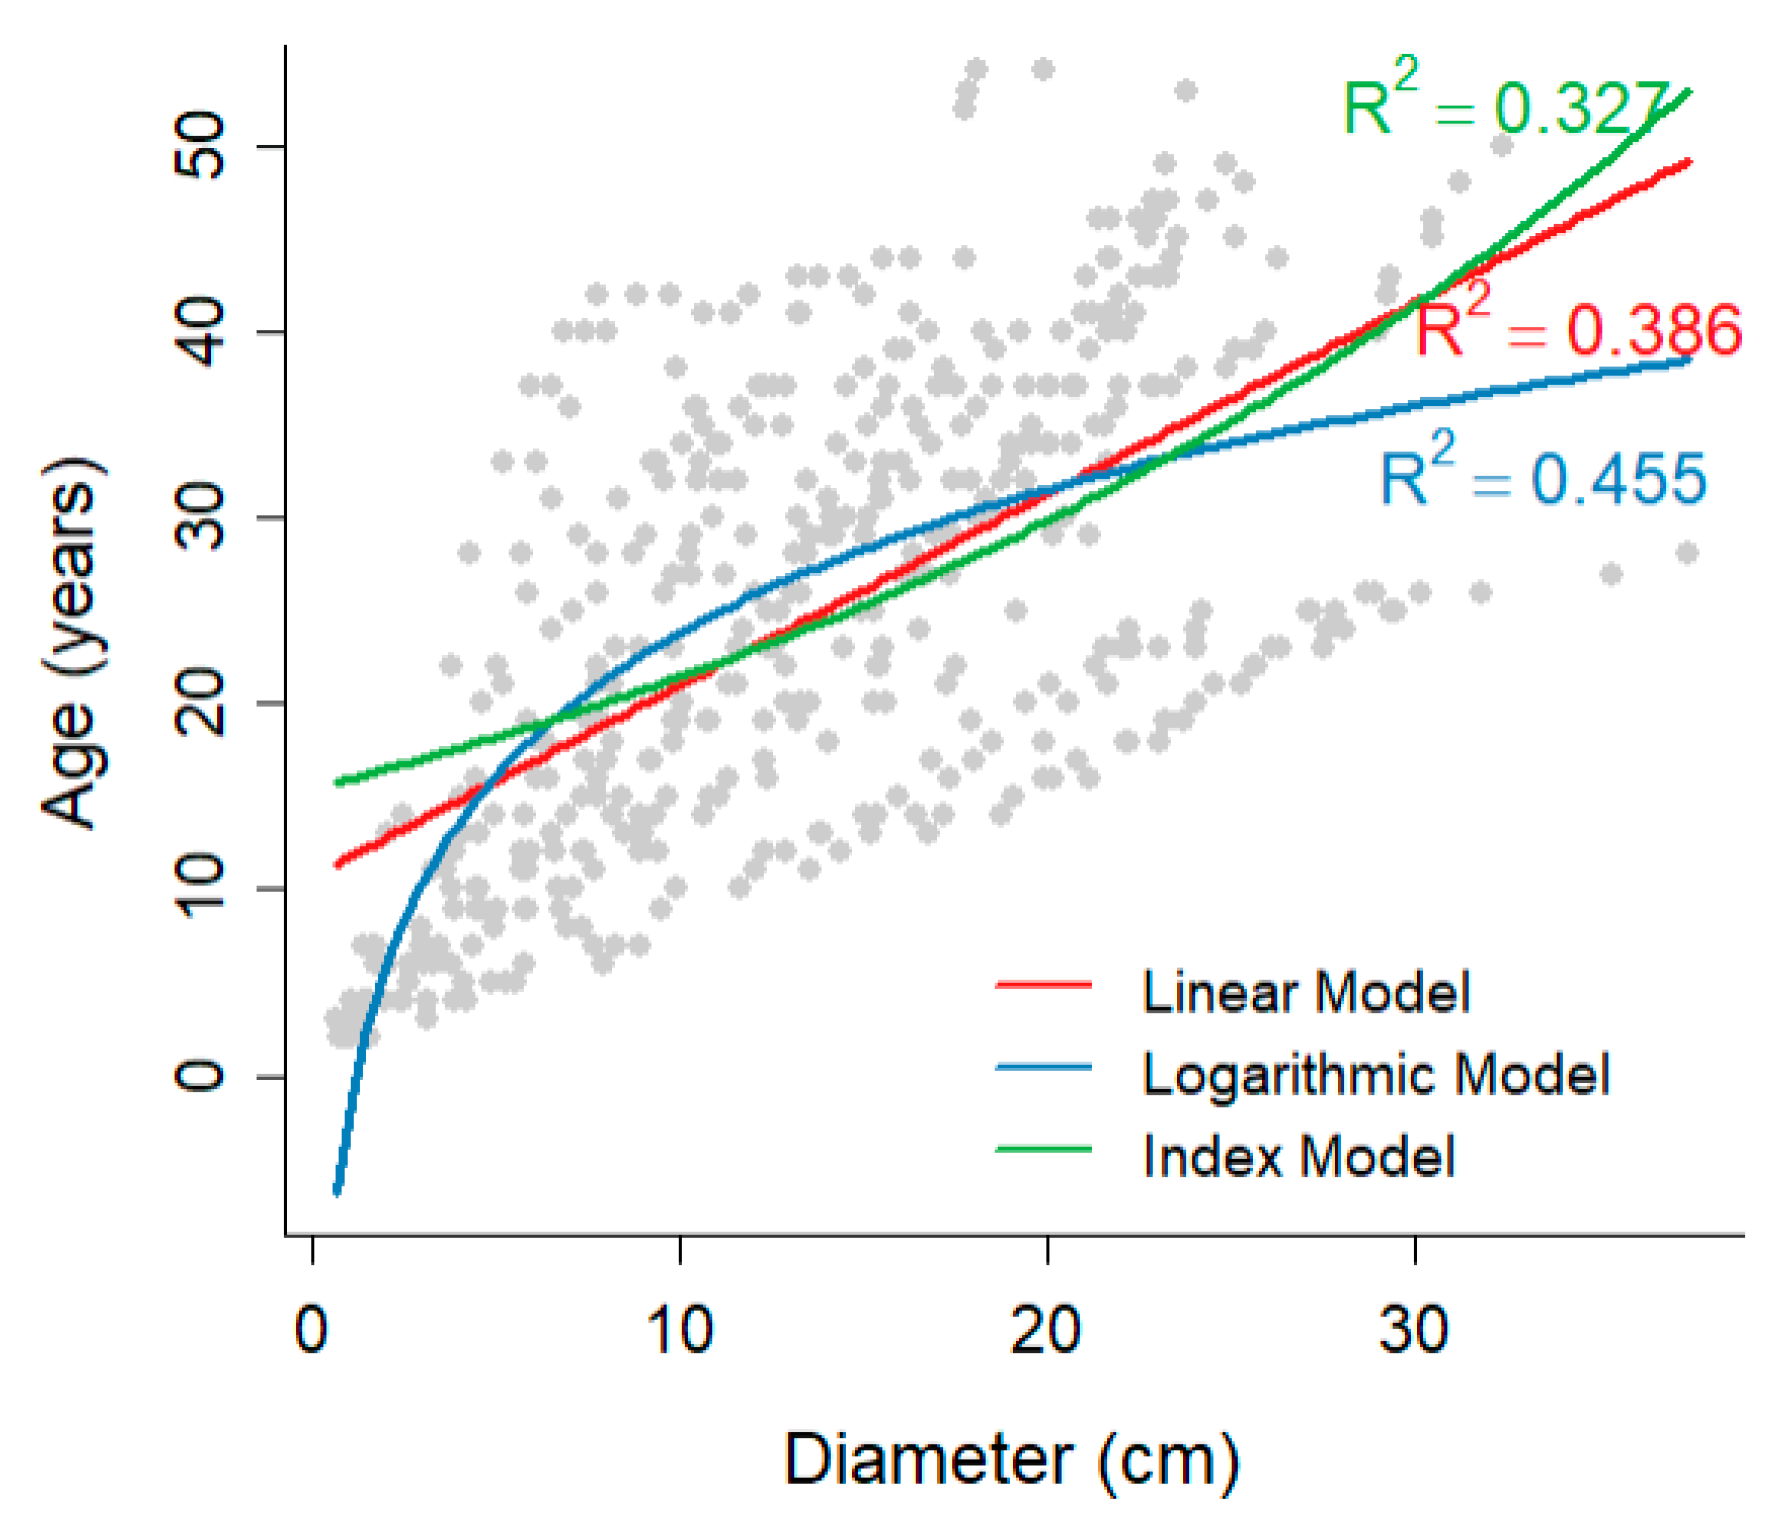
The fitting formulas and R-squared of these three models are shown in Table 3, and the fitting curves are shown in Figure 3. From Table 3, it can be seen that the logarithmic model has the highest R-squared among these three models. Therefore, the logarithmic model was used as the mathematical model between the disk age and disk diameter.
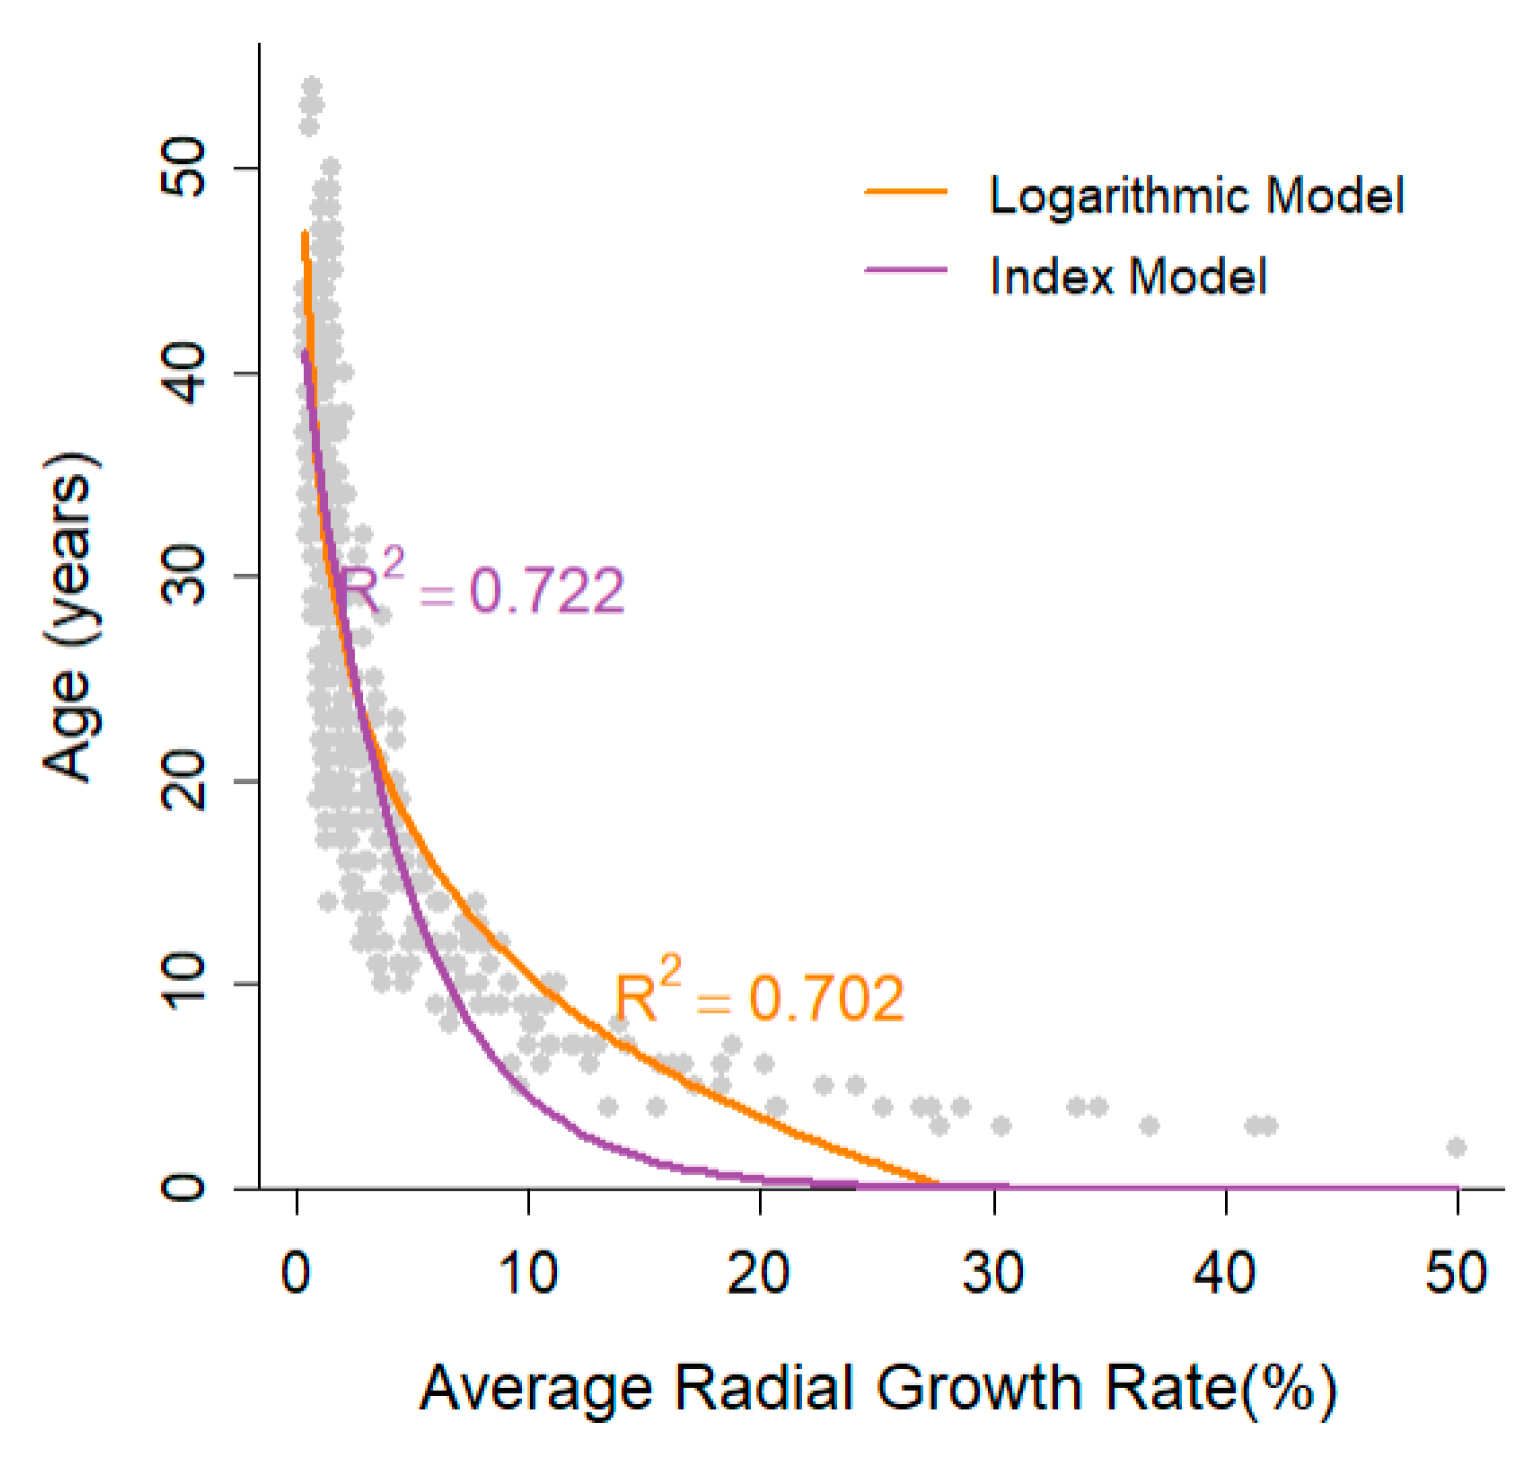
The fitting formulas and R-squared of these two models are shown in Table 4, and the fitting curves are shown in Figure 4. From Table 4, it can be seen that the exponential model has the highest R-squared among these two models. Therefore, the exponential model was used as the mathematical model between the disk age and average radial growth rate of the outermost layer.
Therefore, in the tree age estimation model with dual factors of diameter and radial growth rate, the diameter is chosen in logarithmic form and the radial growth rate is chosen in exponential form. The equation of the dual-factor mathematical model is shown in Equation (9).
y = a log b x 1 + c e x p d x 2  
In this model, y is the age of the tree, x 1 is the diameter, and x 2 is the proportion between radial increment in the last two years and D. The parameters a , b , c , and d were to be estimated through Nonlinear Least Squares.

3.1.3. Modeling Results

Using the modeling dataset, a single-factor model is used to determine the relationship between the age and diameter, and the age and average radial growth rate of the outermost layer. We established a dual-factor mathematical model using R language to determine the relationship between the disk age and diameter and the average radial growth rate of the outermost layer. The modeling results are shown in Table 5.

3.2. Test Results

The three total models tested are shown in Table 6.
Using the test dataset, these three total models were tested, and the test results are shown in Table 7.
From Table 7, it can be seen that the estimation accuracy of M3 was the highest, which was 29.53 percentage points higher than that of M1, and 7.28 percentage points higher than that of M2; the RMSE of M3 was the lowest, which was 0.755 a lower than that of M2, and 3.565 a lower than that of M1; the MAE of M3 was the lowest, which was 0.798 a lower than that of M2, and 3.404 a lower than M1. Therefore, it can be seen that M3 has the highest accuracy, while the RMSE, MAE, AIC, BIC, variance, and SD are relatively lower compared to M1 and M2. The estimated results of these three models were subjected to a t-test on the data, and the t-test results are shown in Table 8.
From Table 8, it can be seen that the estimated results of these three models were significantly different at the significance level of 0.05.

4. Discussion

The DBH is generally positively correlated with tree age, and the measurement process is simple and the measurement results are accurate. Therefore, many researchers have used DBH to estimate tree age [34,50]. Hu et al. (2009) utilized multiple nonlinear regression analysis to model the relationship between DBH and tree age. Initially, the trends between the DBH and tree age were simulated for seven dominant tree species, such as Betula costata, Ulmus pumila, Abies nephrolepis, and Picea koraiensis [34]. Subsequently, the optimal equation was determined by comparing the R-squared and the residual variance. The results revealed that the optimal growth equations for each species effectively characterized the DBH growth patterns, and their R-squared exceeded 0.90. Xiong et al. (2016) fitted the curve between the DBH and tree age relationship for Pseudotsuga sinensis using seven common regression models, including the linear, cubic, parabolic, and logistic growth models [50]. Based on the criteria of R-squared and residual variance, the cubic model (R-squared = 0.812) was determined to be optimal. However, there are significant differences in the radial growth rate of trees for different tree species, even if the same tree species grow in different environments. In even-aged forests, there are significant differences in the diameter at breast height among different trees, while in uneven-aged forests, there are significant differences in the age of trees with the same diameter at breast height. Therefore, the error of estimated tree age solely based on breast height diameter is significant. Therefore, a mathematical model that only uses breast diameter to estimate tree age has the following shortcomings: (1) the universality of the model is relatively low, (2) the accuracy of the model is relatively low.
The radial growth rate of trees is influenced by site type [51,52], competition index [53,54], climate conditions [55,56], and other factors [57]. In order to improve the accuracy of estimating tree age, some scholars have added these environmental variables to between the DBH and tree age model. Abrams et al. (1985) employed linear regression models and polynomial regression models to construct a regression equation between the DBH and tree age, and deeply explored the relationship between tree age, diameter at breast height, soil nutrients, and topographic slope [52]. The research results indicate that among numerous linear regression models and polynomial regression models, the R-squared ranges from 0.33 to 0.96, which means that the model can explain 33% to 96% of tree age variation. J. Chen et al. (2020) employed a machine learning algorithm based on an artificial neural network (ANN) to construct a non-linear regression model relating DBH, height, and age, and deeply analyzed the complex coupling relationships among tree age, DBH, tree height, and numerous environmental factors [54]. On the test dataset, the model’s explanatory power for age variation reached 84.5%, with an R-squared of 0.845 and an MSE of 183.0. Rohner et al. (2013) proposed two new tree age estimation methods based on nonlinear models and compared them with traditional polynomial methods [55]. Among them, the nonlinear method with covariates introduces environmental variables (such as slope, altitude, orientation, soil water holding capacity, drought index) on the basis of the nonlinear approach without the covariates method to reflect the impact of environmental differences on tree growth. Its accuracy is close to the polynomial method (R-squared =0.94), and the accuracy is significantly improved. Lu et al. (2025) employed the Random Forest (RF) model and the Ordinary Least Squares (OLS) regression model to estimate tree ages [57]. They used variables such as DBH, tree height, tree species, topography, geography, and climate variables as independent variables, with tree age as the dependent variable, and constructed a functional relationship to simulate the change trend. A 10-fold cross-validation was utilized to evaluate the performance of the models, and the R-squared and the RMSE were calculated. The research findings indicated that the R-squared values of the models ranged from 0.51 to 0.87, and the relative RMSE values ranged from 0.14 to 0.49.
Although incorporating competitive factors, environmental factors, climate factors, and other factors can improve the estimation accuracy of mathematical models, these models have the following problems: (1) it is difficult to collect these data and the modeling workload is large, (2) due to the fact that modeling data are usually collected from a specific environment, the universality of the model still needs further validation. Conversely, the radial growth rate of a tree’s outermost layer, which reflects its recent growth environment, is relatively straightforward to measure. Meanwhile, the radial growth rate of trees is determined by a combination of genetic and environmental factors. If there is no significant change in the growth environment of trees, the relative radial growth rate between trees is stable. Trees with faster radial growth rates in recent years have had relatively faster radial growth rates, while trees with slower radial growth rates in recent years have had relatively slower radial growth rates. The radial growth rate of trees in recent years is relatively easy to calculate or measure. For trees with historical records of DBH, the radial growth rate in recent years can be easily calculated. For trees without historical records of DBH, the radial growth rate can be calculated by collecting a small number of annual rings from the outermost layer of the trunk with a micro increment corer. Therefore, it is feasible to establish a tree age estimation model using the radial growth rate of trees in recent days.
This study incorporates this radial growth rate into an age estimation model. Based on a mathematical model, this research proposes a method to estimate tree age using the average outermost annual ring width growth rate and trunk diameter, aiming to improve detection accuracy in non-destructive tree age assessment. Given that tree growth typically exhibits nonlinear characteristics, and diameter alone provides insufficient information for accurate age prediction, nonlinear models are employed to effectively simulate this growth trend. Therefore, a mathematical model incorporating both diameter and proportion as dual factors is employed to describe tree growth patterns, leading to improved tree age prediction. Consequently, a dual-factor mathematical model is developed, demonstrating superior performance compared to simple exponential or linear models across diverse tree species. These models effectively capture the inherent nonlinearity of tree growth. Furthermore, using the modeling dataset, the sub-models for seven tree species within this framework exhibit R-squared values ranging from 0.78 to 0.98. A dual-factor nonlinear model combining both variables achieved the highest estimation accuracy (80.29%), significantly outperforming single-factor models based solely on diameter (50.76%) or growth rate (73.01%). These results demonstrate that integrating radial growth rate substantially enhances the precision of tree age estimation. Therefore, this model more accurately reflects tree growth characteristics, indicating consistent predictive accuracy across different tree species, regions, and age ranges. Regardless of the tree’s age, the model reliably represents growth patterns with minimal error fluctuations. Notably, even with older tree samples, the model maintains a strong fit, validating its broad applicability across regions, species, and time scales.
To improve the effectiveness and universality of the model, the tree species used in this study include those with fast, moderate, and slow radial growth rates, the experimental trees of each tree species include dominant trees, moderate trees, and compressed trees. To reduce the autocorrelation of the analysis tree data and improve the reliability of the test results, data from four trees in each tree species were used to establish the model, while data from the remaining two trees were used as test data. Therefore, the total tree age estimation model established in this article has some practical value. For example, it can be used to estimate the age of ancient trees, precious tree species, tropical trees without annual rings, and trees without specialized mathematical models. However, this study still has the following limitations: (1) the number of tree species is relatively small, (2) the tree age is relatively young, and many trees have not yet reached the turning point of radial growth rate, (3) trees come from artificial forests, (4) analysis wood data have some degree of autocorrelation. In future research, the following measures will be taken to further improve the effectiveness and universality of the model: increasing the number of tree species; increasing the number of sample trees, especially natural forest sample trees; increasing the number of large tree age samples, using data from the diameter at breast height of sample trees; and so on.

5. Conclusions

The research results showed that the accuracy of the dual-factor model (M3) combining trunk diameter and radial growth rate reached 80.29%, significantly better than the single-factor model. Compared with the models based only on diameter (50.76%) and growth rate (73.01%), the accuracy was improved by 29.53% and 7.28%, respectively. It performs the best on all evaluation metrics (RMSE, MAE, AIC, BIC, variance, and standard deviation). Therefore, the dual-factor mathematical model is more closely consistent with the growth characteristics of trees, indicating that for different tree species in different regions and different age ranges within the same tree species, the dual-factor mathematical model exhibits consistent predictive accuracy. This model can accurately reflect the growth characteristics of both young and old tree species, with minimal error fluctuations. We verified the model’s applicability across regions, species, and time scales. For the first time, the system verified the contribution of radial growth rate to improving the accuracy of tree age estimation, and provided a reliable technical solution for non-destructive tree age estimation.

6. Patents

There is a patent (CN:202510562753X) resulting from the work reported in this manuscript.

Author Contributions

Conceptualization, Formal analysis, Methodology, Software, Validation, Writing—original draft, Writing—review and editing, J.Y.; Data processing, Writing—review and editing, M.Y.; Data curation, Writing—review and editing, Z.L.; Data curation, Writing—review and editing, D.H.; Conceptualization, Data acquisition and processing, Writing—review and editing, W.G.; Conceptualization, Data acquisition and processing, Writing—review and editing, X.H. (Xiao He); Conceptualization, Data acquisition and processing, Writing—review and editing, X.H. (Xuefan Hu); Conceptualization, Funding acquisition, Supervision, Writing—review and editing, X.S. All authors have read and agreed to the published version of the manuscript.

Funding

This research was funded by the Natural Science Foundation of Henan Province (252300423088); the Xinyang Academy of Ecological Research Open Foundation (2023XYQN04); National Key Research and Development Program Project (2022YFD2200501); Research on the multifunctionality and driving factors of oak forest ecosystems in Beijing (YZQN202405); Research on Key Techniques for Quercus Planting (YZZD202407); Postgraduate Education Reform and Quality Improvement Project of Henan Province (YJS2023SZ23).

Data Availability Statement

The raw data supporting the conclusions of this article will be made available by the authors on request.

Conflicts of Interest

The authors declare that they have no conflicts of interest.

References

  1. Dieler, J.; Uhl, E.; Biber, P.; Müller, J.; Rötzer, T.; Pretzsch, H. Effect of forest stand management on species composition, structural diversity, and productivity in the temperate zone of Europe. Eur. J. For. Res. 2017, 136, 739–766. [Google Scholar] [CrossRef]
  2. Ling, R.; Xie, C.; Qiu, C. Study on Forest Management Plan Based on Forecast of the Carbon Sequestration and Comprehensive Value. In Proceedings of the 4th International Conference on Business, Economics, Management Science (BEMS 2022); International College, Xiamen University, Ed.; International College, Xiamen University: Xiamen, China, 2022; pp. 452–464. [Google Scholar]
  3. Nath, C.D.; Boura, A.; De Franceschi, D.; Pélissier, R.J.T. Assessing the utility of direct and indirect methods for estimating tropical tree age in the Western Ghats, India. Trees-Struct. Funct. 2012, 26, 1017–1029. [Google Scholar] [CrossRef]
  4. Schall, P.; Ammer, C. How to quantify forest management intensity in Central European forests. Eur. J. For. Res. 2013, 132, 379–396. [Google Scholar] [CrossRef]
  5. Tian, H.; Zhu, J.; Lei, X.; Jian, Z.; Chen, X.; Zeng, L.; Huang, G.; Liu, C.; Xiao, W. Models considering the theoretical stand age will underestimate the future forest carbon sequestration potential. For. Ecol. Manag. 2024, 562, 121982. [Google Scholar] [CrossRef]
  6. Barry, D. Refining Dendrochronology to Evaluate the Relationship Between Age and Diameter for Dominant Riparian Trees in the Redwood Creek Watershed. Master’s Thesis, The University of San Francisco, San Francisco, CA, USA, 2014. [Google Scholar]
  7. Ricker, M.; Gutiérrez-García, G.; Juárez-Guerrero, D.; Evans, M.E. Statistical age determination of tree rings. PLoS ONE 2020, 15, e0239052. [Google Scholar] [CrossRef]
  8. Garet, J.; Raulier, F.; Pothier, D.; Cumming, S.G. Forest age class structures as indicators of sustainability in boreal forest: Are we measuring them correctly? Ecol. Indic. 2012, 23, 202–210. [Google Scholar] [CrossRef]
  9. Reyes-Palomeque, G.; Dupuy, J.; Portillo-Quintero, C.; Andrade, J.; Tun-Dzul, F.; Hernández-Stefanoni, J. Mapping forest age and characterizing vegetation structure and species composition in tropical dry forests. Ecol. Indic. 2021, 120, 106955. [Google Scholar] [CrossRef]
  10. Martin, M.; Fenton, N.; Morin, H. Structural diversity and dynamics of boreal old-growth forests case study in Eastern Canada. For. Ecol. Manag. 2018, 422, 125–136. [Google Scholar] [CrossRef]
  11. Bonou, W.; Kakaï, R.G.; Assogbadjo, A.; Fonton, H.; Sinsin, B. Characterisation of Afzelia africana Sm. habitat in the Lama forest reserve of Benin. For. Ecol. Manag. 2009, 258, 1084–1092. [Google Scholar] [CrossRef]
  12. Zhang, H.; Lei, X.; Zhang, C.; Zhao, X.; Hu, X. Research on theory and technology of forest quality evaluation and precision improvement. J. Beijing For. Univ. 2019, 41, 1–18. [Google Scholar] [CrossRef]
  13. Michel, A.K.; Winter, S. Tree microhabitat structures as indicators of biodiversity in Douglas-fir forests of different stand ages and management histories in the Pacific Northwest, USA. For. Ecol. Manag. 2008, 257, 1453–1464. [Google Scholar] [CrossRef]
  14. Winter, S. Forest naturalness assessment as a component of biodiversity monitoring and conservation management. Forestry 2012, 85, 293–304. [Google Scholar] [CrossRef]
  15. Moussaoui, L.; Leduc, A.; Girona, M.M.; Bélisle, A.C.; Lafleur, B.; Fenton, N.J.; Bergeron, Y. Success factors for experimental partial harvesting in unmanaged boreal forest: 10-year stand yield results. Forests 2020, 11, 1199. [Google Scholar] [CrossRef]
  16. Wilhelmsson, P.; Wallerman, J.; Lämås, T.; Öhman, K. Dynamic treatment units in forest planning improves economic performance over stand-based planning. Eur. J. For. Res. 2024, 144, 163–177. [Google Scholar] [CrossRef]
  17. Ashraf, M.I.; Meng, F.-R.; Bourque, C.P.-A.; MacLean, D.A. A novel modelling approach for predicting forest growth and yield under climate change. PLoS ONE 2015, 10, e0132066. [Google Scholar] [CrossRef]
  18. Wen, Z. Research on Forest Utility for Maximizing Forest Value. In Proceedings of the 3rd International Symposium on Frontiers of Economics and Management Science (FEMS 2022), Macao, China, 29–30 April 2022; p. 9. [Google Scholar]
  19. Forrester, D.I.; Tachauer, I.H.H.; Annighoefer, P.; Barbeito, I.; Pretzsch, H.; Ruiz-Peinado, R.; Stark, H.; Vacchiano, G.; Zlatanov, T.; Chakraborty, T. Generalized biomass and leaf area allometric equations for European tree species incorporating stand structure, tree age and climate. For. Ecol. Manag. 2017, 396, 160–175. [Google Scholar] [CrossRef]
  20. Yao, N.; Gu, C.; Qi, J.; Shen, S.; Nan, B.; Wang, H. Protecting Rural Large Old Trees with Multi-Scale Strategies: Integrating Spatial Analysis and the Contingent Valuation Method (CVM) for Socio-Cultural Value Assessment. Forests 2023, 15, 18. [Google Scholar] [CrossRef]
  21. Diallo, A.; Agbangba, E.C.; Ndiaye, O.; Guisse, A. Ecological structure and prediction equations for estimating tree age, and dendometric parameters of acacia senegal in the senegalese semi-arid zone—Ferlo. Am. J. Plant Sci. 2013, 4, 1046–1053. [Google Scholar] [CrossRef]
  22. Lei, X.; Peng, C.; Wang, H.; Zhou, X. Individual height–diameter models for young black spruce (Picea mariana) and jack pine (Pinus banksiana) plantations in New Brunswick, Canada. For. Chron. 2009, 85, 43–56. [Google Scholar] [CrossRef]
  23. Kang, H. Juvenile selection in tree breeding: Some mathematical models. Silvae Genet. 1985, 34, 75–84. [Google Scholar]
  24. Zhou, H.; Feng, R.; Huang, H.-H.; Lin, E.-P.; Yu, J.-L. Method of tree-ring image analysis for dendrochronology. Opt. Eng. 2012, 51, 077202. [Google Scholar] [CrossRef]
  25. Duncan, R. An evaluation of errors in tree age estimates based on increment cores in kahikatea (Dacrycarpus dacrydioides). N. Z. Nat. Sci. 1989, 16, 31–37. [Google Scholar]
  26. Norton, D.A.; Palmer, J.G.; Ogden, J. Dendroecological studies in New Zealand 1. An evaluation of tree age estimates based on increment cores. N. Z. J. Bot. 1987, 25, 373–383. [Google Scholar] [CrossRef]
  27. Altman, J.; Doležal, J.; Čížek, L. Age estimation of large trees: New method based on partial increment core tested on an example of veteran oaks. For. Ecol. Manag. 2016, 380, 82–89. [Google Scholar] [CrossRef]
  28. Fraver, S.; Bradford, J.B.; Palik, B.J. Improving tree age estimates derived from increment cores: A case study of red pine. Forest Sci. 2011, 57, 164–170. [Google Scholar] [CrossRef]
  29. Yao, J.F.; Zhao, Y.D.; Zhang, H.R.; Song, X.Y.; Lei, X.D.; Tang, S.Z. Drill resistance expression method of tree micro drill instrument. Trans. Chin. Soc. Agric. Mach. 2021, 52, 271–277, 286. [Google Scholar]
  30. Downes, G.M.; Lausberg, M.; Potts, B.; Pilbeam, D.; Bird, M.; Bradshaw, B. Application of the IML Resistograph to the infield assessment of basic density in plantation eucalypts. Aust. For. 2018, 81, 177–185. [Google Scholar] [CrossRef]
  31. Sharma, R.P.; Vacek, Z.; Vacek, S.; Jansa, V.; Kučera, M. Modelling individual tree diameter growth for Norway spruce in the Czech Republic using a generalized algebraic difference approach. J. For. Sci. 2017, 64, 227–238. [Google Scholar] [CrossRef]
  32. Loewenstein, E.F.; Johnson, P.S.; Garrett, H.E. Age and diameter structure of a managed uneven-aged oak forest. Can. J. For. Res. 2000, 30, 1060–1070. [Google Scholar] [CrossRef]
  33. Wang, M.; Borders, B.E.; Zhao, D. An empirical comparison of two subject-specific approaches to dominant heights modeling: The dummy variable method and the mixed model method. For. Ecol. Manag. 2008, 255, 2659–2669. [Google Scholar] [CrossRef]
  34. Hu, Y.Y.; Kang, X.G.; Zhao, J.H. Variable relationship between tree age and diameter at breast height for natural forests in Changbai Mountains. J. Northeast For. Univ. 2009, 37, 38–42. [Google Scholar]
  35. Divya, K.; Kaur, S. A Study on Tree Rings: Dendrochronology using Image Processing. IOP Conf. Ser. Mater. Sci. Eng. 2021, 1022, 012115. [Google Scholar] [CrossRef]
  36. Wu, W.N.; Wan, T. Progress of dating methods of tree age. J. Green Sci. Technol. 2013, 7, 152–155. [Google Scholar]
  37. Villalba, R.; Veblen, T.T. Improving estimates of total tree ages based on increment core samples. Ecoscience 1997, 4, 534–542. [Google Scholar] [CrossRef]
  38. Wang, H.; Sun, J.; Duan, A.; Zhu, A.; Wu, H.; Zhang, J. Dendroclimatological analysis of chinese fir using a long-term provenance trial in Southern China. Forests 2022, 13, 1348. [Google Scholar] [CrossRef]
  39. Oh, J.-A.; Seo, J.-W.; Kim, B.-R. Verifying the possibility of investigating tree ages using resistograph. J. Korean Wood Sci. Technol. 2019, 47, 90–100. [Google Scholar] [CrossRef]
  40. Zhang, Y.; Li, H.; Zhang, X.; Lei, Y.; Huang, J.; Liu, X. An Approach to Estimate Individual Tree Ages Based on Time Series Diameter Data—A Test Case for Three Subtropical Tree Species in China. Forests 2022, 13, 614. [Google Scholar] [CrossRef]
  41. Gao, S.; Wang, X.; Wiemann, M.C.; Brashaw, B.K.; Ross, R.J. A critical analysis of methods for rapid and nondestructive determination of wood density in standing trees. Ann. For. Sci. 2017, 74, 27. [Google Scholar] [CrossRef]
  42. Yao, J.f.; Lu, J.; Fu, L. Micro drill resistance instrument measurements at different feed speeds: Novel conversion algorithm for enhanced accuracy. J. Nondestruct. Eval. 2023, 42, 56. [Google Scholar] [CrossRef]
  43. Pan, H.; Lu, J.; Guo, X.Z.; Tang, S.Z.; Gao, R.D.; Xu, J.J. Algorithm for Determining Tree Age Using Acupuncture Instrument Based on Spectrum Analysis. For. Res. 2021, 34, 19–25. [Google Scholar] [CrossRef]
  44. Orozco-Aguilar, L.; Nitschke, C.R.; Livesley, S.J.; Brack, C.; Johnstone, D. Testing the accuracy of resistance drilling to assess tree growth rate and the relationship to past climatic conditions. Urban For. Urban Green. 2018, 36, 1–12. [Google Scholar] [CrossRef]
  45. Yao, J.F.; Wang, F.H.; Zhao, C.C.; Gao, C.; Hu, X.F. Study on Mathematical Model of Camellia oleifera Tree Age. J. Xinyang Norm. Univ. (Nat. Sci. Ed.) 2025, 38, 402–407. [Google Scholar]
  46. Khan, M. Advanced estimation of orange tree age using fuzzy inference and linear regression models. Int. J. Knowl. Innov. Stud. 2024, 2, 119–129. [Google Scholar] [CrossRef]
  47. Chen, J.J.; Du, H.Q.; Mao, F.J.; Huang, Z.H.; Chen, C.; Hu, M.C.; Li, X.J. Improving forest age prediction performance using ensemble learning algorithms base on satellite remote sensing data. Ecol. Indic. 2024, 166, 112327. [Google Scholar] [CrossRef]
  48. Melesse, S.F.; Zewotir, T. Additive mixed models to study the effect of tree age and climatic factors on stem radial growth of Eucalyptus trees. J. For. Res. 2020, 31, 463–473. [Google Scholar] [CrossRef]
  49. Iqbal, J.; Ahmed, M.; Siddiqui, M.F.; Khan, A. Tree ring studies from some conifers and present condition of forest of Shangla district of Khyber Pukhtunkhwa Pakistan. Pak. J. Bot. 2020, 52, 653–662. [Google Scholar] [CrossRef]
  50. Xiong, B.; Wang, Z.; Li, Z.; Zhang, E.; Tian, K.; Li, T.; Li, Z.; Song, C. Study on the correlation between age, diameter at breast height, and tree height of Chinese fir in the Seven Sisters Mountain Nature Reserve. Res. For. Grass Resour. 2016, 41. [Google Scholar] [CrossRef]
  51. Matsushita, M.; Takata, K.; Hitsuma, G.; Yagihashi, T.; Noguchi, M.; Shibata, M.; Masaki, T. A novel growth model evaluating age–size effect on long--term trends in tree growth. Funct. Ecol. 2015, 29, 1250–1259. [Google Scholar] [CrossRef]
  52. Abrams, M.D. Age-diameter relationships of Quercus species in relation to edaphic factors in gallery forests in northeast Kansas. For. Ecol. Manag. 1985, 13, 181–193. [Google Scholar] [CrossRef]
  53. Kalliovirta, J.; Tokola, T. Functions for estimating stem diameter and tree age using tree height, crown width and existing stand database information. Silva Fenn. 2005, 39, 227–248. [Google Scholar] [CrossRef]
  54. Chen, J.; Yang, H.; Man, R.; Wang, W.; Sharma, M.; Peng, C.; Parton, J.; Zhu, H.; Deng, Z. Using machine learning to synthesize spatiotemporal data for modelling DBH-height and DBH-height-age relationships in boreal forests. For. Ecol. Manag. 2020, 466, 118104. [Google Scholar] [CrossRef]
  55. Rohner, B.; Bugmann, H.; Bigler, C. Towards non-destructive estimation of tree age. For. Ecol. Manag. 2013, 304, 286–295. [Google Scholar] [CrossRef]
  56. Rohner, B.; Bugmann, H.; Bigler, C. Estimating the age–diameter relationship of oak species in Switzerland using nonlinear mixed-effects models. Eur. J. For. Res. 2013, 132, 751–764. [Google Scholar] [CrossRef]
  57. Lu, J.; Huang, C.; Schleeweis, K.; Zou, Z.; Gong, W. Tree age estimation across the US using forest inventory and analysis database. For. Ecol. Manag. 2025, 584, 122603. [Google Scholar] [CrossRef]
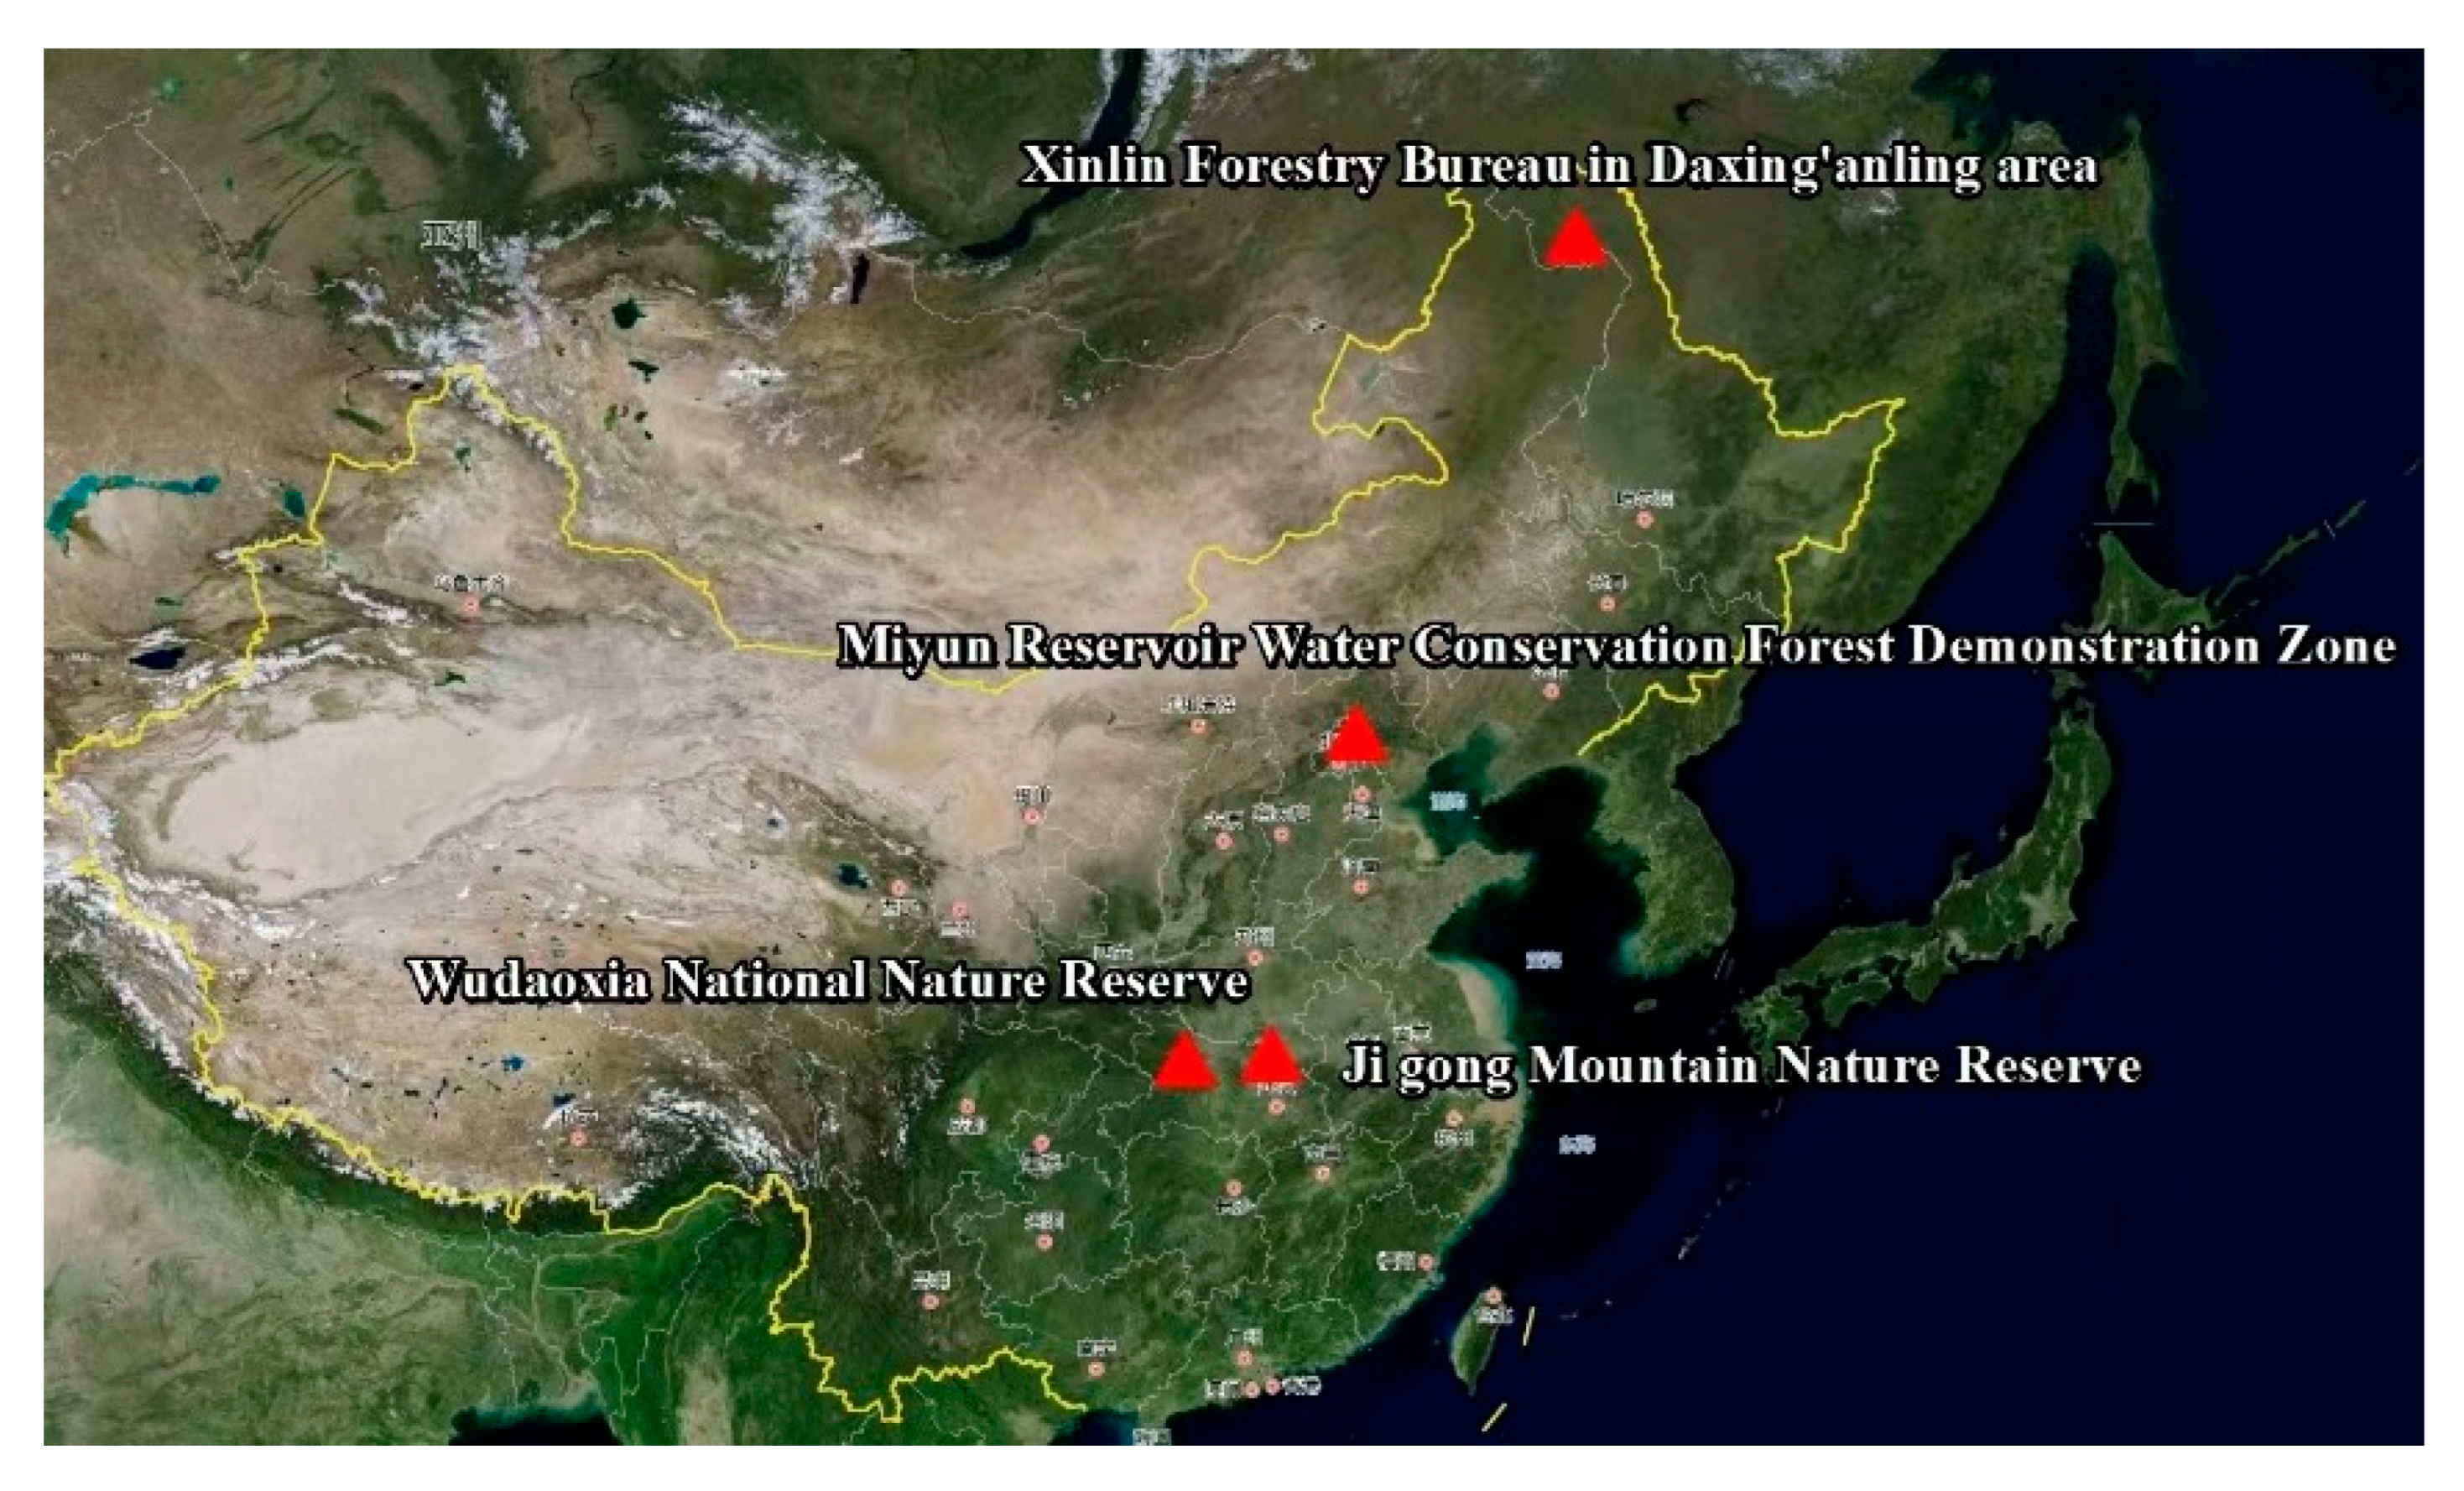
Figure 1. Geographical location of the four study areas.
Forests 16 01725 g001
Figure 2. Scatter plot. From the scatter plot, it can be seen that there is a significant nonlinear relationship between diameter and tree age, as well as between radial growth rate and tree age. From (a), it can be seen that linear models, logarithmic models, and exponential models can be used to fit the relationship between diameter and tree age. Therefore, linear models, logarithmic models, and exponential models were selected as alternative models for the mathematical model between tree age and diameter. From (b), it can be seen that logarithmic and exponential models can be used to fit the relationship between radial growth rate and tree age. Therefore, logarithmic models and exponential models were selected as alternative models for the mathematical model between tree age and radial growth rate.
Forests 16 01725 g002
Figure 3. Fitting curves between disk age and diameter.
Forests 16 01725 g003
Figure 4. Fitting curves between disk age and average radial growth rate of the outermost layer.
Forests 16 01725 g004
Table 1. Basic information of trees for analytical wood.
Tree SpeciesTree Height Range/mDiameter at Breast Height (DBH) Range/cmTree Age Range/yrArea
Cryptomeria
fortunei
11~1715~2637~48Ji Gong Mountain Nature Reserve
Pinus massoniana15~1918~3139~53Ji Gong Mountain Nature Reserve
Cunninghamia lanceolata14~1810~2537~54Ji Gong Mountain Nature Reserve
Pinus
tabuliformis
10~1210~1442~46Miyun Reservoir Water Conservation Forest Demonstration Zone
Platycladus
orientalis
8.5~10.36~1542~44Miyun Reservoir Water Conservation Forest Demonstration Zone
Larix kaempferi15~2217~3024~28Wudaoxia National Nature Reserve
Larix gmelinii14~1711~1731~41Xinlin Forestry Bureau in Daxing’anling area
Total8.5~226~3124~54-
In the table, the abbreviation yr stands for year.
Table 2. Basic information of the tree disks.
Tree SpeciesDisk NumberRange of Tree Ring/A NumbersDiameter Range/cm
Cryptomeria fortunei937~482~27
Pinus massoniana1094~532~33
Cunninghamia lanceolata865~543~28
Pinus tabulaeformis546~461~16
Platycladus orientalis552~440.8 ~17
Larix kaempferi1312~280.6~38
Larix gmelinii1182~410.7~23
Total6462~540.6~38
Table 3. Fitting results between disk age and diameter.
Model TypeFormula R 2
Linear model y = 1.03 x 1 + 10.78 0.386
Index model y = 15.47 exp 0.03 x 1 0.327
Logarithmic model y = 11.08 log 0.86 x 1 0.455
In Table 3, y is the age of the tree, x 1 is the diameter.
Table 4. Fitting results between disk age and average radial growth rate of the outermost layer.
Model TypeFormula R 2
Index model y = 43.64 exp 0.23 x 2 0.722
Logarithmic model y = 10.10 log 0.04 x 2 0.702
In Table 4, y is the age of the tree, x 2 is the proportion between radial increment in the last two years and D.
Table 5. The fitting results of sub-models and total models for each tree species.
Tree SpeciesEquation R 2
Cryptomeria fortunei y = 18.76 log 0.36 x 1 0.878
y = 44.92 e x p ( 0.20 x 2 ) 0.829
y = 13.51 log 0.42 x 1 + 12.88 e x p ( 0.43 x 2 ) 0.901
Pinus massoniana y = 20.88 log 0.27 x 1 0.795
y = 59.88 e x p ( 0.28 x 2 ) 0.835
y = 12.00 log 0.38 x 1 + 60.73 e x p ( 1.00 x 2 ) 0.924
Cunninghamia lanceolata y = 20.85 log 0.33 x 1 0.571
y = 48.54 e x p ( 0.37 x 2 ) 0.542
y = 17.17 log 0.28 x 1 + 42.18 e x p ( 1.68 x 2 ) 0.778
Pinus tabulaeformis y = 19.30 log 0.54 x 1 0.824
y = 46.41 e x p ( 0.33 x 2 ) 0.717
y = 13.90 log 0.61 x 1 + 21.01 e x p ( 1.03 x 2 ) 0.890
Platycladus orientalis y = 17.72 log 0.83 x 1 0.795
y = 54.16 e x p ( 0.34 x 2 ) 0.912
y = 2.90 log 3.89 x 1 + 47.26 e x p ( 0.50 x 2 ) 0.944
Larix kaempferi y = 7.24 log 0.67 x 1 0.788
y = 26.07 e x p ( 0.11 x 2 ) 0.829
y = 4.13 log 0.95 x 1 + 14.44 e x p ( 0.29 x 2 ) 0.888
Larix gmelinii y = 12.72 log 0.68 x 1 0.751
y = 42.12 e x p ( 0.23 x 2 ) 0.854
y = 5.81 log 1.12 x 1 + 38.54 e x p ( 0.69 x 2 ) 0.923
Total y = 11.08 log 0.86 x 1 0.455
y = 43.64 e x p ( 0.23 x 2 ) 0.722
y = 3.99 log 1.33 x 1 + 35.02 e x p ( 0.42 x 2 ) 0.762
In Table 5, the fitting effect of the dual-factor mathematical model is better than that of the single-factor model.
Table 6. Tested models.
ModelEquation
M1: between age and diameter y = 11.08 log 0.86 x 1
M2: between the age and average radial growth rate of the outermost layer y = 43.64 e x p ( 0.23 x 2 )
M3: between the age and diameter, and average radial growth rate of the outermost layer y = 3.99 log 1.33 x 1 + 35.02 e x p ( 0.42 x 2 )
Table 7. Test results.
ModelAccuracy/%RMSE/aMAE/aAICBIC Variance / a 2 SD/a
M150.768.5717.2631547.0961557.22274.1538.611
M273.015.7614.6571375.4601385.58633.4995.788
M380.295.0063.8591318.7351335.61125.5285.053
Table 8. t-test results.
Tested Modelst-Valuep-Value
Between M1 and M26.627<0.001
Between M1 and M38.887<0.001
Between M2 and M32.606<0.05
Disclaimer/Publisher’s Note: The statements, opinions and data contained in all publications are solely those of the individual author(s) and contributor(s) and not of MDPI and/or the editor(s). MDPI and/or the editor(s) disclaim responsibility for any injury to people or property resulting from any ideas, methods, instructions or products referred to in the content.