Article

Developing Interpretable Deep Learning Model for Subtropical Forest Type Classification Using Beijing-2, Sentinel-1, and Time-Series NDVI Data of Sentinel-2

1
Institute of Forest Resource Information Techniques, Chinese Academy of Forestry, Beijing 100091, China
2
State Forestry and Grassland Administration, Key Laboratory of Forest Management and Growth Modelling, Beijing 100091, China
3
Advanced Interdisciplinary Institute of Satellite Applications, Beijing Normal University, Beijing 100875, China
*
Author to whom correspondence should be addressed.
Forests 2025, 16(11), 1709; https://doi.org/10.3390/f16111709
Submission received: 10 October 2025 / Revised: 4 November 2025 / Accepted: 6 November 2025 / Published: 10 November 2025
(This article belongs to the Section Forest Inventory, Modeling and Remote Sensing)

Abstract

Accurate forest type classification in subtropical regions is essential for ecological monitoring and sustainable management. Multimodal remote sensing data provide rich information support, yet the synergy between network architectures and fusion strategies in deep learning models remains insufficiently explored. This study established a multimodal deep learning framework with integrated interpretability analysis by combining high-resolution Beijing-2 RGB imagery, Sentinel-1 data, and time-series Sentinel-2 NDVI data. Two representative architectures (U-Net and Swin-UNet) were systematically combined with three fusion strategies, including feature concatenation (Concat), gated multimodal fusion (GMU), and Squeeze-and-Excitation (SE). To quantify feature contributions and decision patterns, three complementary interpretability methods were also employed: Shapley Additive Explanations (SHAP), Grad-CAM++, and occlusion sensitivity. Results show that Swin-UNet consistently outperformed U-Net. The SwinUNet-SE model achieved the highest overall accuracy (OA) of 82.76%, exceeding the best U-Net model by 3.34%, with the largest improvement of 5.8% for mixed forest classification. The effectiveness of fusion strategies depended strongly on architecture. In U-Net, SE and Concat improved OA by 0.91% and 0.23% compared with the RGB baseline, while GMU slightly declined. In Swin-UNet, all strategies achieved higher gains between 1.03% and 2.17%, and SE effectively reduced NDVI sensitivity. SHAP analysis showed that RGB features contributed most (values > 0.0015), NDVI features from winter and spring ranked among the top 50%, and Sentinel-1 features contributed less. These findings reveal how architecture and fusion design interact to enhance multimodal forest classification.

1. Introduction

The functions and services of terrestrial ecosystems are largely determined by their vegetation cover patterns. As the dominant and core component of vegetation cover, forests play a crucial role in maintaining ecological balance and ensuring ecological security. Therefore, understanding the spatial distribution of forest types is vital for effective ecological management, biodiversity conservation, and climate change mitigation [1,2]. This is particularly true in subtropical regions, where vegetation cover is complex and diverse, forest resources are abundant, and ecosystems are highly sensitive to environmental changes [3]. Consequently, accurately classifying forest types in subtropical areas helps monitor forest dynamics and implement sustainable forest management practices, which are essential for preserving these unique ecosystems.
The traditional method for achieving forest type data is based on forest resource surveys, which is time consuming, labor costs, and difficult to meet the increasingly dynamic demands of forest management and monitoring. In recent years, the remote sensing technology provides an efficient way for large-scale mapping and classification of forest types. While traditional machine learning approaches such as Random Forest (RF) and Support Vector Machines (SVM) have been widely applied [2,4], deep learning models are increasingly employed for their powerful feature extraction and representation capabilities [5]. Satellite sensors provide multimodal data, such as optical data (multispectral and hyperspectral) and synthetic aperture radar (SAR), which are commonly used for forest type and tree species classification [4,6]. Optical data relies on spectral reflectance in visible to shortwave infrared (SWIR) bands to distinguish forest types. SAR data uses microwave signals to analyze scattering properties, providing insights into forest structure, such as canopy density and height, under any weather conditions. Moreover, remote sensing data with different spectral, spatial and temporal resolutions also demonstrate different characteristics of forestry types. Therefore, compared with unimodal data (data from a single sensor type), multimodal data (integrating information from multiple sources) often offers a more comprehensive and reliable approach. This approach improves robustness in varied environmental conditions and enables more precise identification of complex forest structures and types [7].
Fusion strategies are crucial in multimodal data processing as they enable the integration of complementary information from different sources, improving the accuracy, robustness, and overall performance of models in complex tasks [8]. Fusion strategies can be divided into three types, including early, intermediate, and late fusion. Early fusion integrates multimodal data at the input or feature level, combining raw data or extracted features before feeding them into a unified model. Intermediate fusion refers to integrating multimodal features at an intermediate stage of the learning process, after each modality has undergone initial feature extraction but before the final decision layer. Late fusion combines decisions or outputs from separate models trained on different modalities [9,10]. In the classification tasks, early and intermediate fusion is more widely used than late fusion because it integrates multimodal information at the feature level. This enables models to capture fine-grained cross-model interactions and improve overall accuracy [11]. Late fusion often fails to fully exploit the complementary relationships between modalities, which makes it less effective in tasks that require detailed feature integration. Early and intermediate fusion strategies include several methods including concatenation, weighted combinations, gating mechanism and attention mechanism [12]. Each method has pros and cons. For example, Concatenation is simple but may cause high dimensionality in feature space; weighted fusion is efficient but limited in capturing complex relations; gating mechanism dynamically adjusts modality contributions but increases model complexity; attention mechanism effectively captures key cross-modal interactions but is computationally demanding [13]. Therefore, it is essential to test and compare different fusion strategies to identify the most suitable approach.
Other than fusion strategies, model architecture is another factor that influences the forest type classification accuracy. Deep learning techniques provide a wide range of reference methods for classification, including convolutional neural networks (CNNs), recurrent neural networks (RNNs), and transformers [14]. Representative architectures such as U-Net and Swin-UNet follow encoder–decoder paradigms that enable multi-scale feature extraction and semantic reconstruction, and have been widely applied in remote sensing classification tasks [15,16]. Their hybrid variants offer diverse strategies for extracting spatial, spectral, and temporal features, as well as modeling complex cross-modal relationships. Therefore, different model architectures often exhibit varying sensitivities to specific types of remote sensing data and forest categories. Previous studies have extensively examined the impact of model architecture on classification accuracy [7,17,18], but the opaque nature of deep models has limited in-depth understanding of how different modalities contribute to the results and influence class sensitivity.
To address this opacity, model interpretability methods have been proposed and tested in the computer vision field. Model-agnostic approaches such as shapley additive explanations (SHAP) and local interpretable model-agnostic explanations (LIME) provide global or local explanations by estimating feature contributions [19]. Model-specific methods such as gradient-based techniques highlight critical input features. Attention mechanisms, inherently embedded in some architectures, also offer interpretability by explicitly indicating which inputs the model prioritizes during decision-making [20]. These methods provide different advantages, therefore integrating insights from multiple approaches is essential to obtain a more comprehensive understanding of model behavior in forest type classification.
This study aims to develop an accurate forest type classification method for subtropical regions based on multimodal data. Three sub-objectives are discussed: (1) investigating the impact of different deep learning architectures on classification accuracy; (2) to evaluate the performance of various feature fusion strategies within different architectures; and (3) to interpret the contributions of multimodal data to forest type classification under different fusion strategies and model architectures using multiple model interpretability methods.

2. Materials and Methods

2.1. Study Area

The study area (Figure 1) is located within the Experimental Center of Tropical Forestry Chinese Academy of Forestry. The center comprises four experimental divisions: Qingshan, Fubo, Baiyun, and Shaoping. It is situated in Pingxiang City, at the southernmost part of Guangxi Zhuang Autonomous Region, China. The region is characterized by a subtropical monsoon climate with abundant sunlight and rainfall. The mean annual temperature ranges between 21 °C and 23 °C. Vegetation is dominated by South subtropical monsoon evergreen broadleaf forest. The common tree species are conifers such as Pinus massoniana and Cunninghamia lanceolata. Valuable hardwood species including Betula alnoides and Castanopsis hystrix are also present. The shrub layer is relatively diverse, with common species such as Litsea cubeba, Rhus chinensis, and Clerodendrum cyrtophyllum.

2.2. Remote Sensing Data

The multi-source remote sensing data utilized in this study comprised very high-resolution imagery from Beijing-2 (BJ-2), along with synthetic aperture radar and optical imagery from Sentinel-1 and Sentinel-2, respectively. A BJ-2 image acquired on 20 June 2021, provided the foundational optical data with a spatial resolution of 0.8 m. We utilized its red, green, and blue bands, which were preprocessed through radiometric calibration, geometric correction, and atmospheric correction. All datasets were projected to a common coordinate system (WGS 1984/UTM Zone 48N) to ensure geometric consistency.
Sentinel-1 and Sentinel-2 data were processed within the Google Earth Engine (GEE) platform. For Sentinel-1, we extracted the 10 m resolution backscattering coefficients (VV and VH) over two seasonal windows: winter (December 2020 to February 2021) and summer (June to August 2021). These acquisition periods were selected to minimize phenological discrepancies with the BJ-2 image. To preserve the inherent texture information, speckle filtering was deliberately not applied in this study. Regarding Sentinel-2, Sentinel-2 imagery was used as the geometric reference for all datasets, and all images were precisely co-registered. We employed the Level-2A surface reflectance product to construct a monthly NDVI time series for 2021 by applying a median composite to all available images within each month. Data gaps, primarily caused by clouds, were filled using reflectance values from the corresponding months in 2020 and 2022. The completed time series was subsequently smoothed using harmonic filtering to reduce residual noise while preserving authentic vegetation phenological dynamics. The final NDVI time-series variables used as model inputs correspond to these harmonically smoothed values.

2.3. Constructing the Sample Set

The study area is situated in a subtropical monsoon climate zone, where mountain forests are diverse and highly fragmented. Based on differences in spectral phenological features and radar texture features, forest type was classified into five categories: coniferous forest, broadleaved forest, mixed forest, shrubland, and others (e.g., buildings, bare land, and water). To ensure both representativeness and reproducibility, two fixed sample plots of 2000 × 2000 m were selected.
Reference labels were produced using the 2019 forest resource inventory vector data from the Experimental Center of Tropical Forestry Chinese Academy of Forestry, supplemented by manual interpretation of high-resolution Google Earth imagery acquired in 2021. In areas with unclear boundaries or severe shadows, time-series NDVI features and SAR features were introduced to assist interpretation. After label generation, the imagery was cropped according to its native resolution with an overlap rate of 0.25: optical patches of 200 × 200 pixels (0.8 m), SAR patches of 16 × 16 pixels (10 m), and NDVI time-series patches of 16 × 16 pixels (10 m). Labels were resampled synchronously to 200 × 200 pixels (0.8 m). The dataset (922) was randomly divided into training and validation subsets at an approximately 8:2 ratio, ensuring that samples from the same patch did not appear in different subsets (Table 1). This design provides a consistent foundation for subsequent multi-source data fusion and cross-scale matching.

3. Methods

This study investigates the performance and interpretability of deep learning models for forest classification using multi-modal remote sensing data. The overall workflow is illustrated in Figure 2. First, baseline models (U-Net and Swin-UNet) were trained exclusively on RGB imagery. Second, we incorporated time-series NDVI and Sentinel-1 data, employing three distinct fusion strategies to rigorously evaluate their effects on classification performance. Third, multiple interpretability techniques were applied to elucidate the decision-making processes of the models and to quantify the contributions of different data modalities and fusion strategies. Detailed descriptions of each methodological component are provided in the subsequent sections.

3.1. Baseline Models

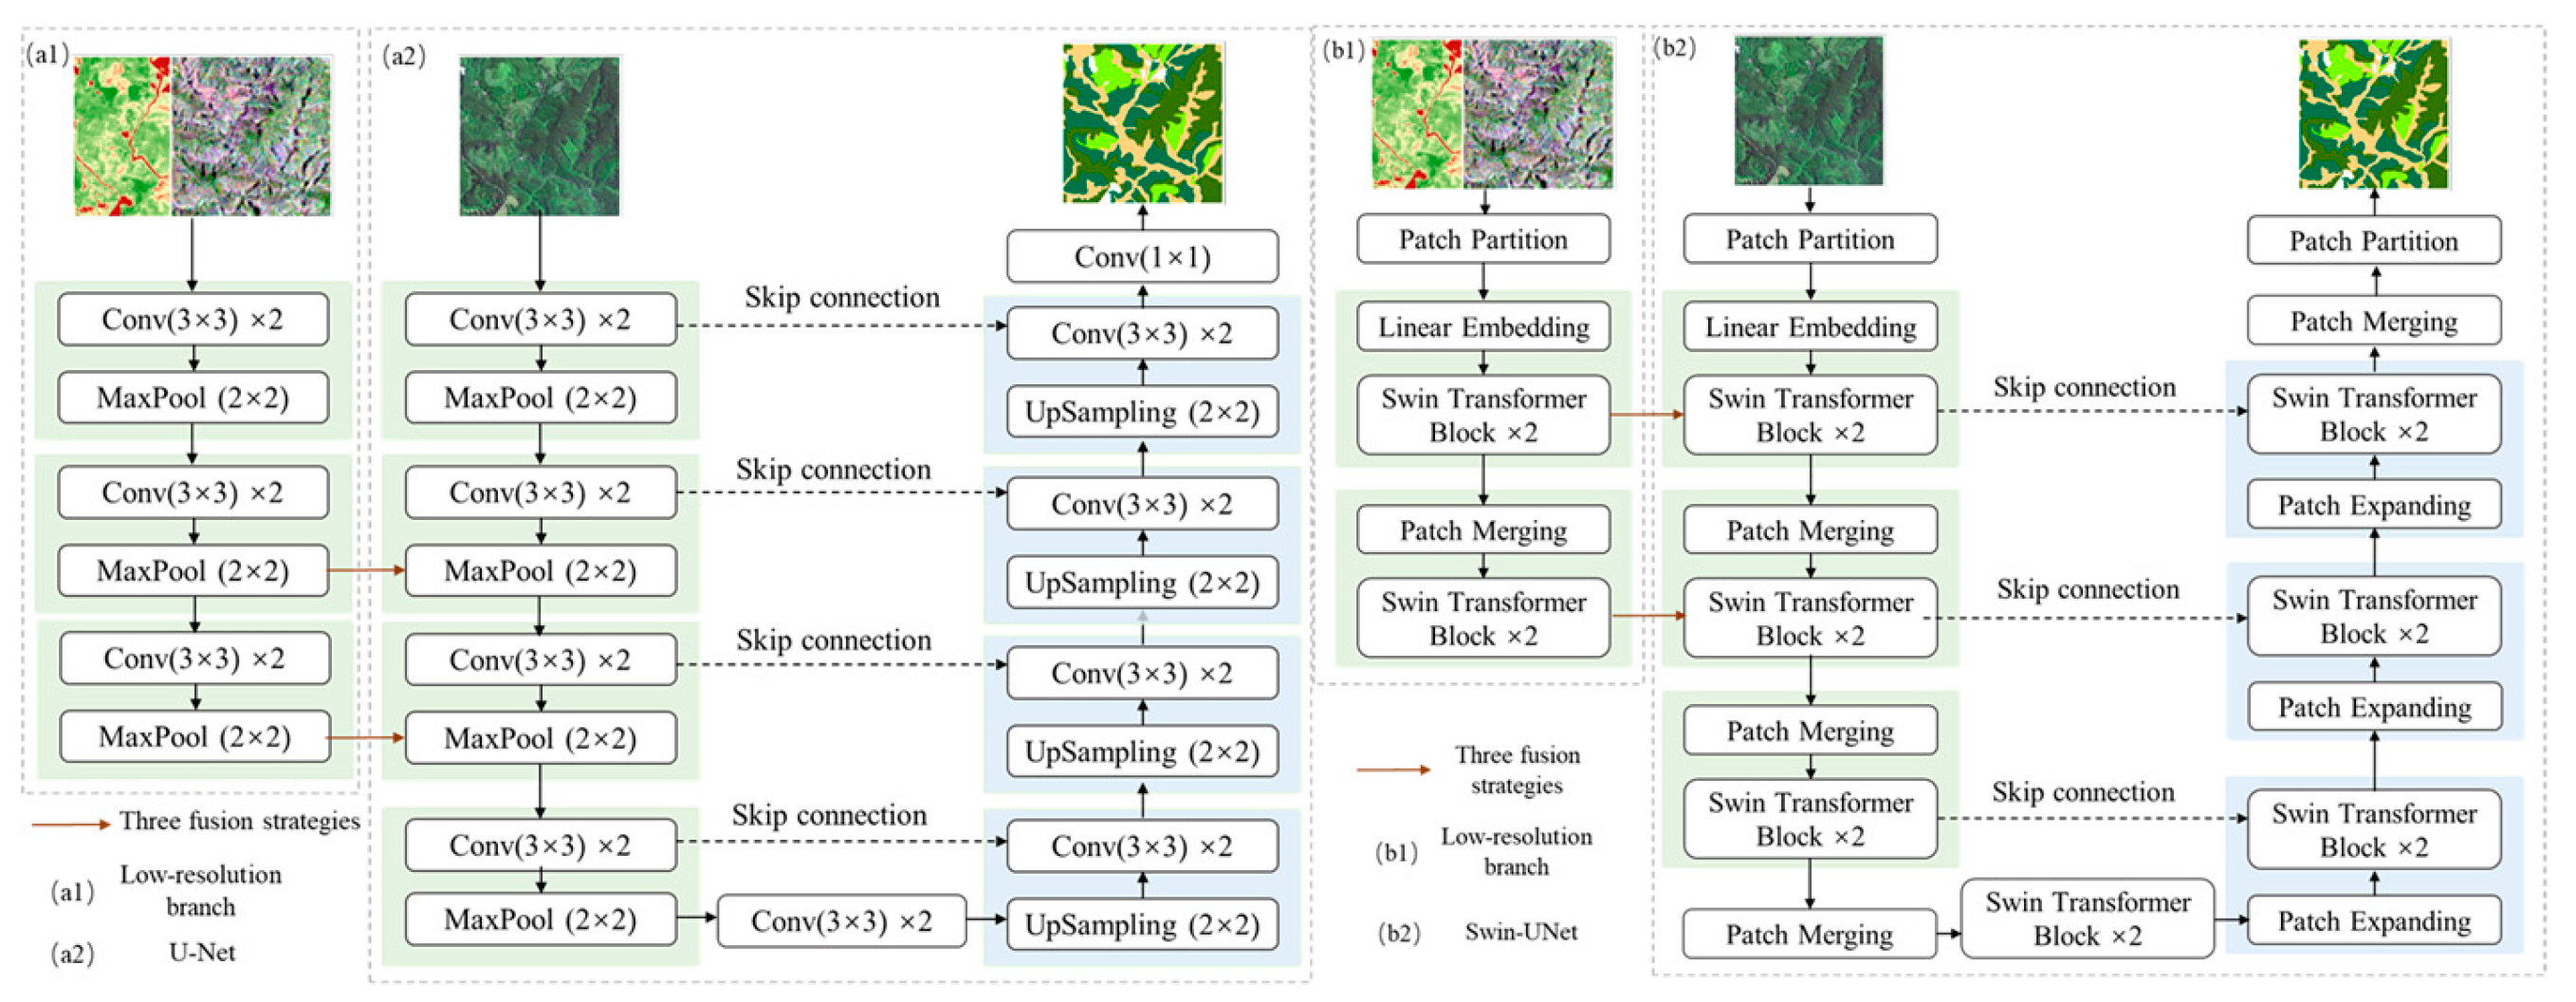
To systematically evaluate different architectures for forest classification, two representative segmentation models were selected as baselines: the convolution-based U-Net and the Transformer-based Swin-UNet. Both models adopt the well-established encoder–decoder framework, but they differ fundamentally in feature extraction paradigms. U-Net relies on convolutional inductive bias to capture local features, whereas Swin-UNet leverages self-attention mechanisms to model long-range dependencies. This contrast enables a direct comparison of convolutional and attention-based approaches in forest classification. In all baseline settings, high-resolution RGB imagery served as the model input (Figure 3a2,b2).
The U-Net encoder consists of four downsampling stages, each comprising convolutional blocks and max-pooling [21], with feature channel dimensions of 64, 128, 256, 512, and 1024. The decoder progressively upsamples feature maps using transposed convolutions, and employs skip connections to concatenate shallow high-resolution features with deep semantic features, facilitating accurate pixel-level predictions.
Swin-UNet combines the Swin Transformer with a U-shaped encoder–decoder design [22]. Input images are divided into non-overlapping patches through patch embedding, and features are extracted by four stages of Swin Transformer blocks with depths of (2, 2, 2, 2) and attention heads of (3, 6, 12, 24). Window-based and shifted-window attention (7 × 7) are employed, and patch merging layers perform hierarchical downsampling. In the decoder, Patch Expand layers with pixel shuffle restore spatial resolution. Skip connections link encoder and decoder stages, implemented as additive fusion rather than concatenation as in U-Net. Dropout and DropPath regularization are applied to improve generalization.

3.2. Feature Fusion Strategies

To investigate the effects of different fusion strategies under distinct deep learning architectures, three fusion mechanisms were integrated into the baseline U-Net and Swin-UNet models. All fusion variants adopt a dual-branch encoder design, where the high-resolution branch takes RGB imagery as input, while the low-resolution branch receives timeseries NDVI and Sentinel-1 data. Feature fusion is performed in the first two encoder stages. The strategies include direct concatenation, gating, and attention-based fusion.
To investigate the effects of different fusion strategies under distinct deep learning architectures, three fusion mechanisms were integrated into the baseline U-Net and Swin-UNet models. All fusion variants adopt a dual-branch encoder design, where the high-resolution branch takes RGB imagery as input, while the low-resolution branch receives time-series NDVI and Sentinel-1 data (Figure 3a1,b1). Feature fusion is performed in the first two encoder stages. The strategies include direct concatenation, gating, and attention-based fusion.

3.2.1. Direct Concatenation

The concatenation-based models, denoted as UNet-Concat and SwinUNet-Concat, fuse features at two encoder stages. Specifically, low-resolution features are first upsampled by bilinear interpolation to match the spatial resolution of the high-resolution branch. The two features are then concatenated along the channel dimension, followed by a 1 × 1 convolution for dimensionality reduction and feature refinement. This straightforward approach serves as a baseline for evaluating the benefits of more sophisticated fusion mechanisms.

3.2.2. Gated Mechanism

Unlike direct concatenation, the Gated Multimodal Unit (GMU) [23] adaptively balances the contributions of high- and low-resolution features through a dynamic gating mechanism. Given high-resolution RGB features xv and low-resolution NDVI+ Sentinel-1 features xt, the gate vector is computed as:
z = σ W z · x v , x t
and the fused representation is obtained as:
h = z · h v + 1 z · h t
where [xv, xt] denotes feature concatenation, σ is the Sigmoid function, and hv, ht are the non-linear transformations of each modality. In our implementation, a residual connection with a learnable scalar parameter α was further introduced to stabilize training and adaptively refine the corrective influence of low-resolution features. Based on this strategy, we constructed two fusion models: UNet-GMU and SwinUNet-GMU.

3.2.3. Attention Mechanism

This strategy employs the classical Squeeze-and-Excitation (SE) module to implement channel-wise attention, leading to the construction of UNet-SE and SwinUNet-SE models. Specifically, high- and low-resolution features are first concatenated and passed through a 1 × 1 convolution for preliminary fusion. The SE module then performs a squeeze operation using global average pooling to extract channel-level statistics [24]:
z c = 1 H × W i = 1 H j = 1 W x i j x
where xijc denotes the activation of the c-th channel at spatial position (i, j). Subsequently, the excitation step employs a bottleneck structure with two fully connected layers and a Sigmoid activation to generate channel weights, which are applied to recalibrate the initially fused features. In our implementation, we further introduced a residual design with a learnable scalar parameter α to enhance training stability and refine the adjustment of channel responses.

3.3. Experimental Setup and Evaluation Metrics

3.3.1. Training Configuration

All models were implemented in the PyTorch (version 2.1.2+cu118) framework and trained on an NVIDIA GeForce RTX 4060 GPU (NVIDIA Corporation, Santa Clara, CA, USA). To ensure consistent numerical ranges across modalities, modality-specific normalization was applied. High-resolution RGB imagery and time-series NDVI were normalized using the Z-score method based on training set statistics, while Sentinel-1 data underwent linear stretching followed by Z-score normalization to better accommodate its dynamic range [25]. To improve generalization, data augmentation was performed. All modalities were subjected to random horizontal, vertical [26], and 90° rotations, while random brightness and contrast adjustments were additionally applied to RGB imagery to enhance robustness.
Training was conducted for 120 epochs with a batch size of 4. The AdamW optimizer was used with an initial learning rate of 1 × 10⁻⁴. Validation set mIoU was monitored, and if no improvement was observed for 10 consecutive epochs, the learning rate was reduced by a factor of 0.5. This strategy ensured convergence and prevented overfitting. Motivated by the proven effectiveness of hybrid CE-Dice loss [27] in mitigating class imbalance and improving segmentation accuracy, we adopted a composite loss function integrating label-smoothed cross-entropy (smoothing factor = 0.01) and Dice loss:
L t o t a l = L C E + ω · L D i c e
where the weight ω was set to 1. Cross-entropy provides stable optimization, while Dice loss directly optimizes spatial overlap, particularly improving segmentation performance for minority classes.

3.3.2. Performance Evaluation

Model performance was comprehensively evaluated using a suite of metrics derived from the confusion matrix. We reported Overall Accuracy (OA), which represents the proportion of correctly classified pixels and reflects overall model precision. The mean Intersection over Union (mIoU) was calculated as the average of class-wise IoUs. This metric provides a more stringent and balanced evaluation of boundary delineation across all classes, particularly for minority classes. In addition, the F1 score was computed based on precision and recall for each class, and the Mean F1 was obtained by averaging class-wise F1 values to provide an aggregated measure of class-level discrimination. The formulations of these metrics are as follows:
O A = i = 1 k T P i N
m I o U = 1 k i = 1 k T P i T P i + F P i + F N i
F 1 = 2 × p r e c i s i o n × r e c a l l p r e c i s i o n + r e c a l l
where k is the number of classes, N is the total number of pixels, TPi, FPi, and FNi represent the true positives, false positives, and false negatives for class i, calculated from the marginal probabilities of the confusion matrix. In Equation (7), precision and recall denote the class-wise precision and recall, respectively.
To assess computational efficiency, three additional indicators were measured on the validation set. Parameter count (Params) was used to indicate model scale, while Floating-Point Operations (FLOPs) quantified theoretical computational complexity in a hardware-agnostic manner. Frames Per Second (FPS) was further reported to evaluate practical inference throughput on a GPU and thus reflect deployment potential.

3.4. Model Interpretability

To enhance the interpretability of deep learning models, this study employed multiple explainable AI (XAI) techniques, including game-theoretic feature attribution, gradient-based spatial visualization, and perturbation-based sensitivity analysis. Specifically, Shapley Additive Explanations (SHAP) was applied to globally quantify the importance of features from different modalities. Grad-CAM++ was used to reveal the spatial regions that most influenced the model’s decisions, while occlusion sensitivity analysis assessed the impact of local information loss by systematically perturbing the inputs. Together, these complementary methods move beyond mere performance metrics by providing both quantitative and visual insights into how different fusion strategies and network architectures contribute to forest classification. This multi-faceted interpretability analysis offers a robust foundation for evaluating model reliability and understanding its decision-making processes.

3.4.1. Feature Contribution

To quantify the contribution of multi-modal data and uncover class-specific discriminative patterns, we employed SHAP, a game-theoretic method that attributes model predictions to input features with strong theoretical guarantees [28].
The analysis was performed on a 19-dimensional input feature space, including spectral bands (3), NDVI time series (12), and Sentinel-1 polarizations (4). For each land-cover class, SHAP values were computed from randomly sampled validation patches, and the mean absolute values per channel were aggregated into class-wise feature importance vectors. Visualization of these vectors enabled clear comparisons of modality contributions across different architectures. The methodology not only identified the features driving classification accuracy but also clarified their distinct roles in distinguishing specific forest types, thereby enhancing the transparency and credibility of model predictions.

3.4.2. Spatial Visualization

To elucidate the spatial decision-making mechanisms of different models, we employed Gradient-weighted Class Activation Mapping++ (Grad-CAM++). Grad-CAM++ extends conventional Grad-CAM by introducing higher-order gradients [29]. This enhancement provides more precise and stable visual explanations of class-specific activations, especially in multi-class forest mapping tasks.
For the U-Net-based models (UNet-Concat, UNet-SE, UNet-GMU), hooks were attached to the final convolutional block in the decoder. For the Swin-UNet-based models (SwinUNet-Concat, SwinUNet-SE, SwinUNet-GMU), the target was the convolutional block after the last skip fusion. These layers preserve rich semantic information and maintain spatial detail. They are therefore well suited for generating attention heatmaps. We then overlaid the Grad-CAM++ heatmaps onto the original imagery. This visualization highlighted the spatial focus of each architecture in forest classification and provided clear pixel-level evidence of their decision patterns.

3.4.3. Occlusion Sensitivity

To determine the dependence of the models on specific input features, an occlusion sensitivity analysis was conducted. This perturbation-based method quantifies the importance of features by systematically removing input information and monitoring the resulting performance degradation [30].
Two types of perturbations were applied. In the spectral dimension, each input channel was sequentially replaced with its mean value, and the decrease in class confidence was recorded to construct spectral sensitivity curves. In the spatial dimension, a sliding window was used to occlude local regions, and the corresponding changes in prediction probabilities were used to generate spatial sensitivity heatmaps. Features or regions that induced the largest confidence drops were identified as critical to model decisions. By actively perturbing the input, occlusion sensitivity provides complementary evidence to SHAP with its game-theoretic foundation and to Grad-CAM++ with its gradient-based visualization. Together, these methods form a robust and multi-faceted foundation for interpreting model behavior.

4. Results

4.1. Overall Model Performance and Classification Accuracy

4.1.1. Comparison of Overall Performance

We initiated our analysis by evaluating the classification accuracy across all models. When utilizing only high-resolution RGB imagery, the transformer-based Swin-UNet surpassed the convolutional U-Net (Figure 4), indicating a potential architectural advantage for capturing the spectral-spatial complexities inherent in forest canopies. The integration of multi-modal data (time-series NDVI and SAR) revealed a pronounced architectural dependence in leveraging complementary information. Within the Swin-UNet, all three fusion strategies consistently enhanced performance, with the SwinUNet-SE model achieving the highest OA of 82.76%. This represents a significant gain of 2.17 percentage points over its RGB-only baseline. Conversely, the same fusion strategies yielded inconsistent results when applied to the U-Net backbone. While modest improvements were observed for UNet-Concat (78.74% OA) and UNet-SE (79.42% OA), the UNet-GMU variant experienced a noticeable performance degradation.
In terms of computational efficiency, Swin-UNet contains slightly more parameters than U-Net (21.99 M and 17.26 M, respectively), but its floating-point operations are substantially lower (5.24 G compared with 24.48 G) (Table 2). This discrepancy arises from their fundamental structural differences. The Transformer-based encoder in Swin-UNet heavily reduces computation through patch merging and Windowed Self-Attention. This Windowed Self-Attention mechanism has linear computational complexity, but it is significantly more efficient than the standard convolution-heavy U-Net encoder when processing high-resolution feature maps. For this reason, we focus on empirical inference speed (FPS). The experiments show that adding multimodal branches caused the inference speed of U-Net to drop markedly, from 179.41 FPS to 132.53 FPS. Swin-UNet models also slowed down, with FPS reduced to the range of 105–116. Among them, SwinUNet-SE achieved the highest classification accuracy (OA = 82.76%) while still maintaining 106.57 FPS, demonstrating the best balance between accuracy and efficiency. SwinUNet-GMU also performed robustly, reaching near-optimal accuracy (OA = 82.27%) while sustaining 105.8 FPS. Overall, Swin-UNet shows stronger potential than U-Net for forest classification, particularly when integrating multimodal data.

4.1.2. Classification Results

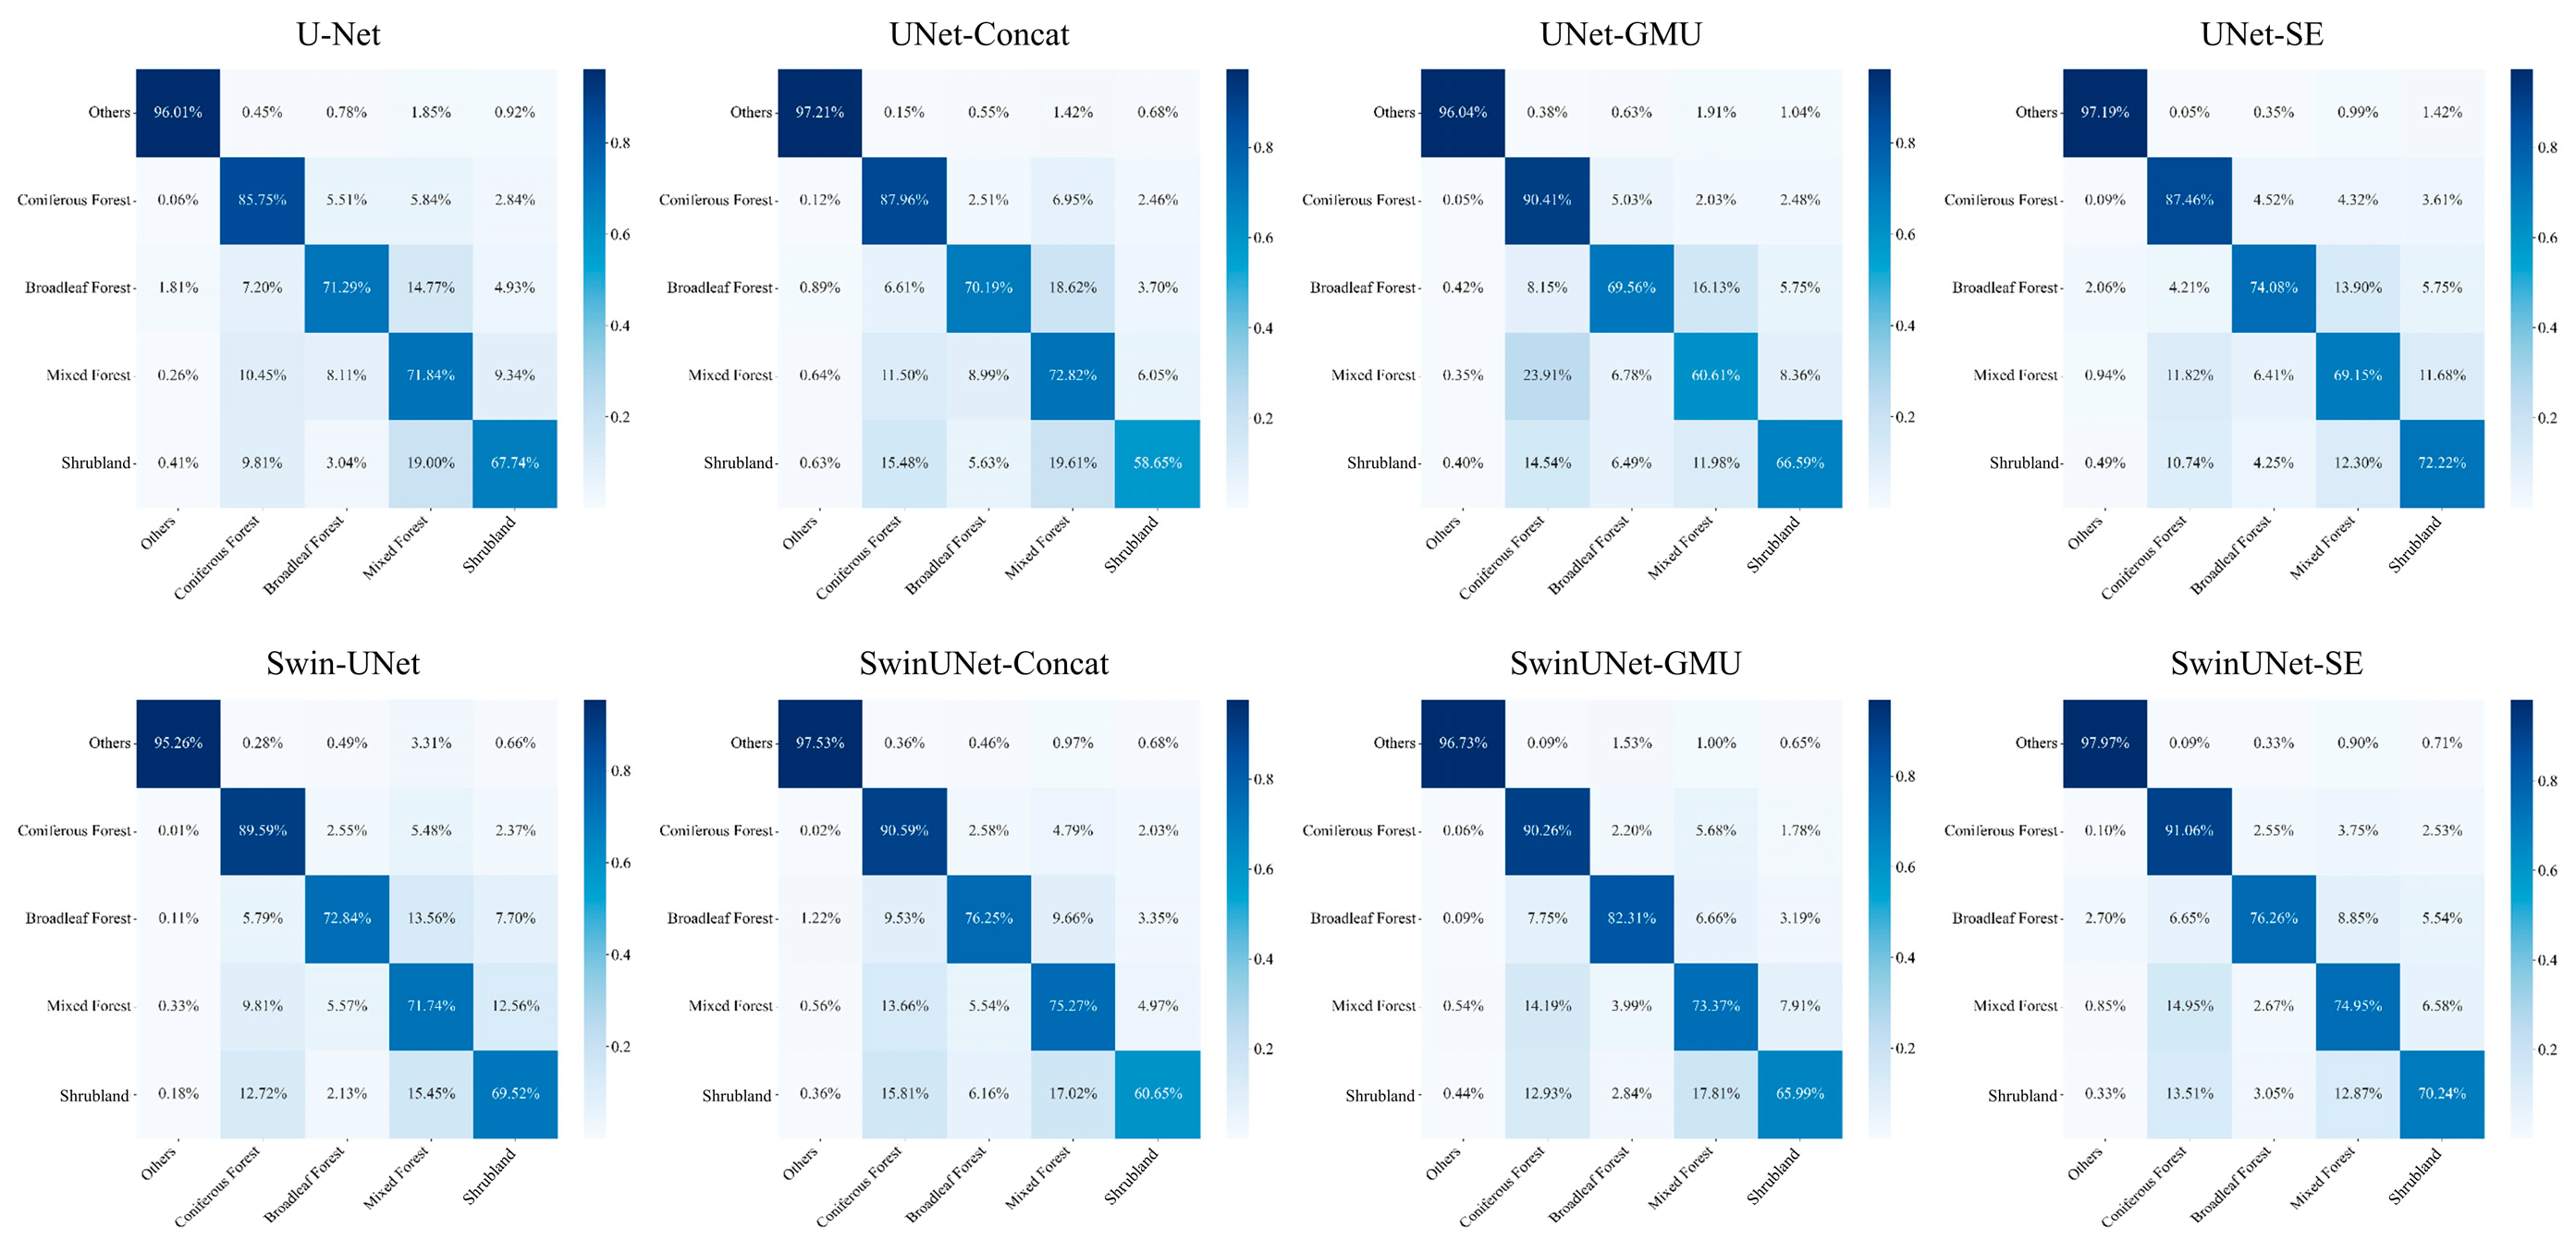
Class-level performance is illustrated in the confusion matrices (Figure 5). The Others class was consistently and accurately identified, with accuracy exceeding 95% for all models and reaching 97.97% for SwinUNet-SE, underscoring its high distinguishability from forest types. Coniferous forest was also stably classified, with U-Net and its variants achieving 85.75%–90.41% accuracy, and Swin-UNet models performing slightly higher at 89.59%–91.06%. In contrast, broadleaf and mixed forests presented the greatest classification challenges. U-Net-based models struggled with broadleaf forest, failing to exceed 75% accuracy. The Swin-UNet frameworks, however, demonstrated a marked capacity to leverage multi-modal data for this class, with SwinUNet-GMU attaining a leading accuracy of 82.31%. For mixed forest, the three Swin-UNet fusion models (Concat, GMU, SE) all outperformed the RGB-only baseline (71.74%), achieving accuracies of 75.27%, 73.37%, and 74.95%, respectively. For shrubland, while Swin-UNet-based models generally surpassed their U-Net counterparts, the integration of multi-modal data yielded inconsistent results and even slightly degraded accuracy in some cases, suggesting a more complex feature interaction for this class.
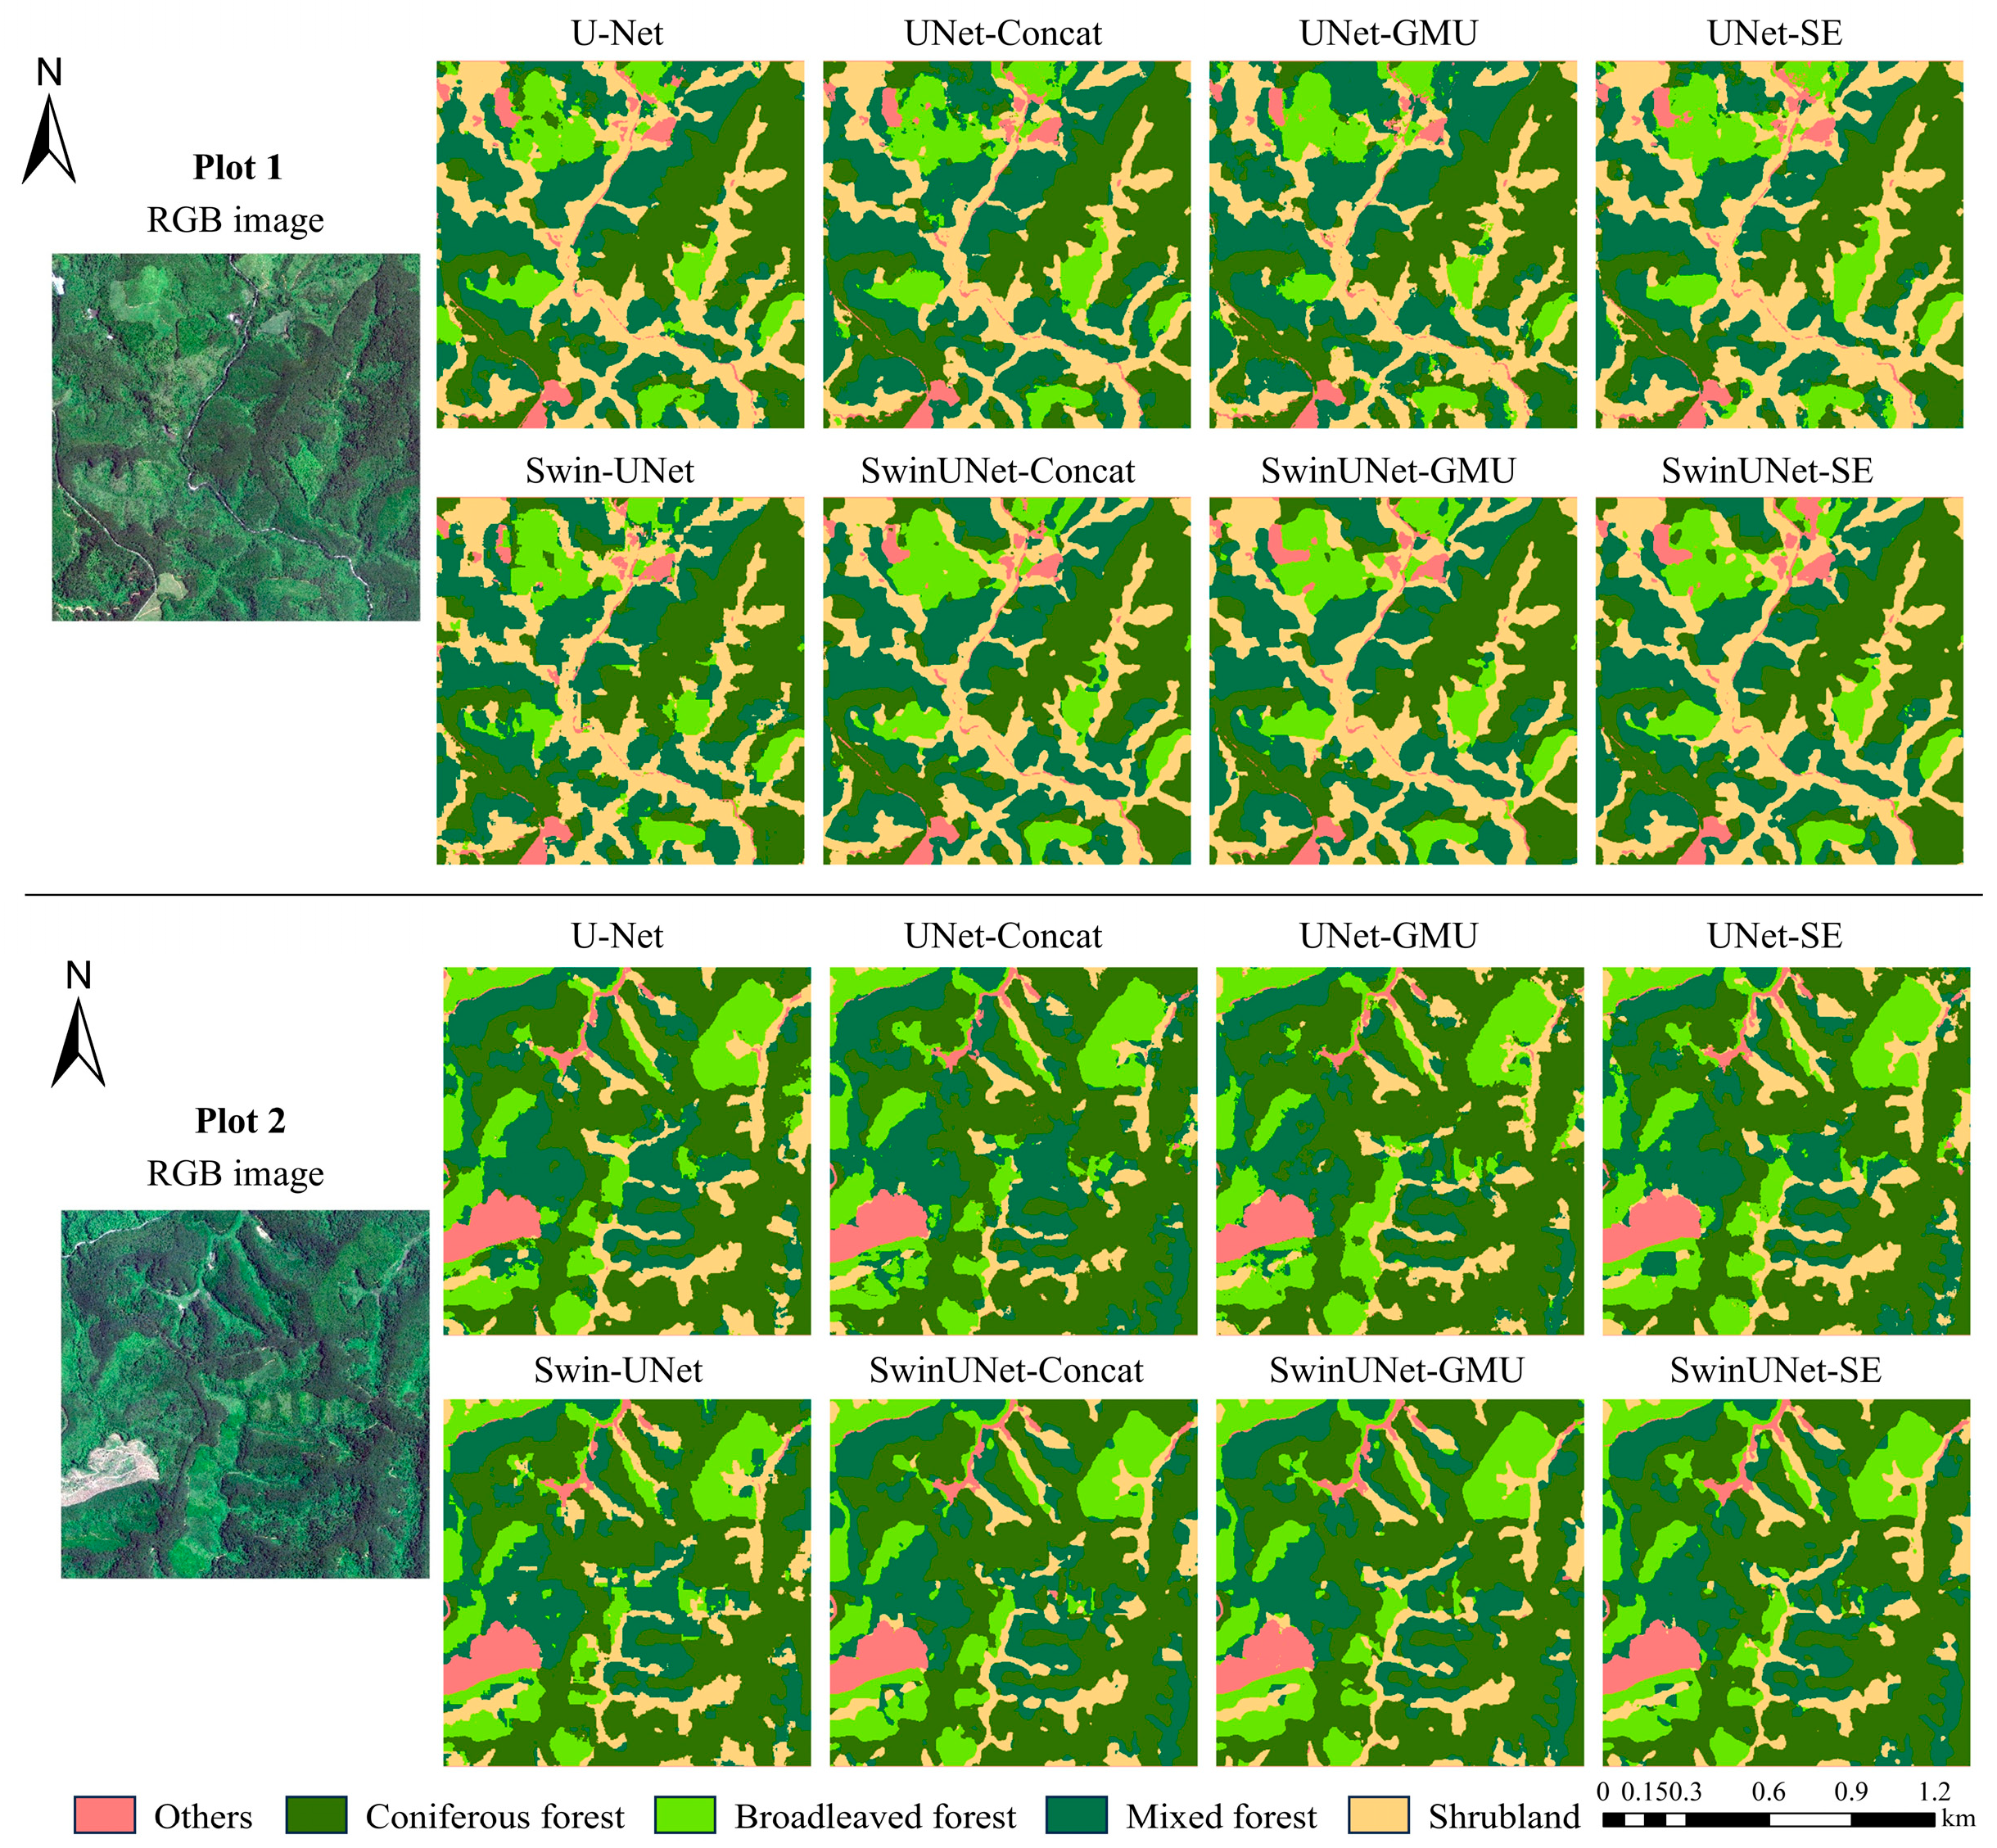
The classification maps of the two sample areas further validate the conclusions drawn from the accuracy and confusion matrix analyses (Figure 6). Models based on U-Net are more prone to producing fragmented patches in complex mountainous forests, especially along the boundaries between broadleaved and mixed forests, where misclassifications are more evident and class boundaries appear blurred. In contrast, models based on Swin-UNet effectively mitigate salt-and-pepper noise, preserving the integrity and continuity of forest stands and yielding classification results that align more closely with the actual landscape patterns. Notably, SwinUNet-GMU and SwinUNet-SE not only achieved superior accuracy metrics but also produced spatial distributions that better matched the real forest structures, with clearer and more coherent boundaries. Overall, while different models performed consistently well for easily distinguishable classes (e.g., Others and Coniferous forest), the U-Net and its multimodal variants exhibited greater limitations in handling confusing categories (broadleaved forest, mixed forest, and shrub), whereas Swin-UNet and its improved models demonstrated stronger discrimination and representation capabilities in these challenging cases.

4.2. Modal Contribution Analysis

To quantify the contribution of different data modalities, we conducted an ablation study by systematically removing NDVI or Sentinel-1 from the full tri-modal input (RGB+NDVI+SAR) across all multi-modal models. The results showed that the complete tri-modal input consistently achieved the best performance (Table 3).
Within the U-Net framework, removing any auxiliary modality caused a substantial decline in performance. The exclusion of Sentinel-1 was particularly detrimental, reducing OA to 50.5%–60.42% and mIoU to 0.283–0.374. By contrast, the RGB+ Sentinel-1 combination produced a less severe but still evident decline compared with the full input. In Swin-UNet-based models, time-series NDVI contributed more than SAR. When NDVI was removed, the OA of SwinUNet-Concat, SwinUNet-GMU, and SwinUNet-SE decreased by 15.92%, 15.16%, and 16.11%, respectively. Overall, the Swin-UNet series demonstrated greater robustness under modality absence, with OA reductions contained within 17%. At the same time, differences were also observed across fusion strategies: in most cases, advanced mechanisms (GMU, SE) outperformed simple concatenation, showing smaller performance drops. In summary, the contribution of a single modality is not fixed but depends on both the backbone architecture and the specific fusion strategy used to integrate multi-source information.

4.3. Model Interpretability Analysis

4.3.1. SHAP Analysis of Different Features

To elucidate the role of different modalities in forest classification, SHAP analysis was applied to attribute the contributions of individual features in multi-modal models. Overall, high-resolution spectral bands (RGB) consistently served as the primary decision basis (Figure 7). The green band was the most influential feature across all models, followed by the red band. The relative importance of the blue band varied with architecture: in U-Net-Concat and U-Net-SE, certain monthly NDVI indices (e.g., NDVI_2 and NDVI_3, corresponding to spring months) surpassed the blue band in distinguishing forest types, whereas in the SwinUNet series, the blue band consistently outweighed NDVI.
NDVI features (NDVI_1–12, representing monthly mean NDVI from January to December) were secondary to RGB overall but played a critical role in separating complex forest types such as broadleaved and mixed forests. Their highest SHAP values were observed during winter and spring, and they also contributed modestly to shrubland discrimination. In U-Net models, NDVI occasionally exceeded the blue band in importance, while SwinUNet models displayed a sharper decline from RGB to NDVI and SAR, reflecting a stronger reliance on dominant spectral features. Sentinel-1 features contributed least overall but varied across architectures. In the U-Net series, summer VV and winter VV channels provided supplementary cues for recognizing coniferous and mixed forests. By contrast, in SwinUNet models, Sentinel-1 contributions were consistently suppressed, remaining at marginal levels.

4.3.2. Visualization of Grad-CAM++ Analysis

To further compare the spatial discriminative capabilities of the models, Grad-CAM++ visualizations were produced for representative samples of each land-cover class. All models were able to focus on the target patches. This confirms the rationality of their classification decisions. Clear differences, however, appeared in spatial precision, boundary preservation, and the concentration of activation.
In multi-modal U-Net models, the highlighted regions covered the target patches but remained broad (Figure 8). Their boundary alignment was weaker, reflecting lower spatial precision. Swin-UNet models, in contrast, produced more concentrated responses (Figure 9). The activation maps matched the true shapes and distributions of the patches more closely, with sharper boundaries and fewer off-target responses. At the fusion-strategy level, all three variants generated compact activations. Yet subtle differences were observed. In mixed forest and shrubland, Concat and GMU models showed boundary spillover, with activations extending beyond the true patch edges. The SE model maintained more stable boundaries, and its activations were more tightly confined within the target areas.

4.3.3. Occlusion Sensitivity Analysis

Occlusion sensitivity analysis revealed distinct patterns in model reliance on different input features (Figure 10). Optical bands (RGB) emerged as the most influential, with green and red bands showing the largest confidence drops upon occlusion, followed by blue. Class-specific responses were also evident. Broadleaved and mixed forests were highly sensitive to green and blue perturbations, coniferous forests to red and green, while shrubland showed moderate sensitivity and the “Others” class was largely unaffected. In contrast, the importance of temporal NDVI was strongly architecture-dependent. U-Net models displayed noticeable fluctuations, suggesting auxiliary contributions, whereas Swin-UNet variants remained nearly flat, indicating only marginal influence. Sentinel-1 features consistently produced the lowest sensitivity across all models and classes. Fusion strategies further modulated these sensitivities. In U-Net models, the differences among Concat, GMU, and SE were minimal. In Swin-UNet models, however, clearer distinctions emerged. SE and GMU both suppressed NDVI sensitivity compared with Concat, and the SE strategy additionally showed more restrained responses to RGB bands, underscoring its superior robustness in feature integration.
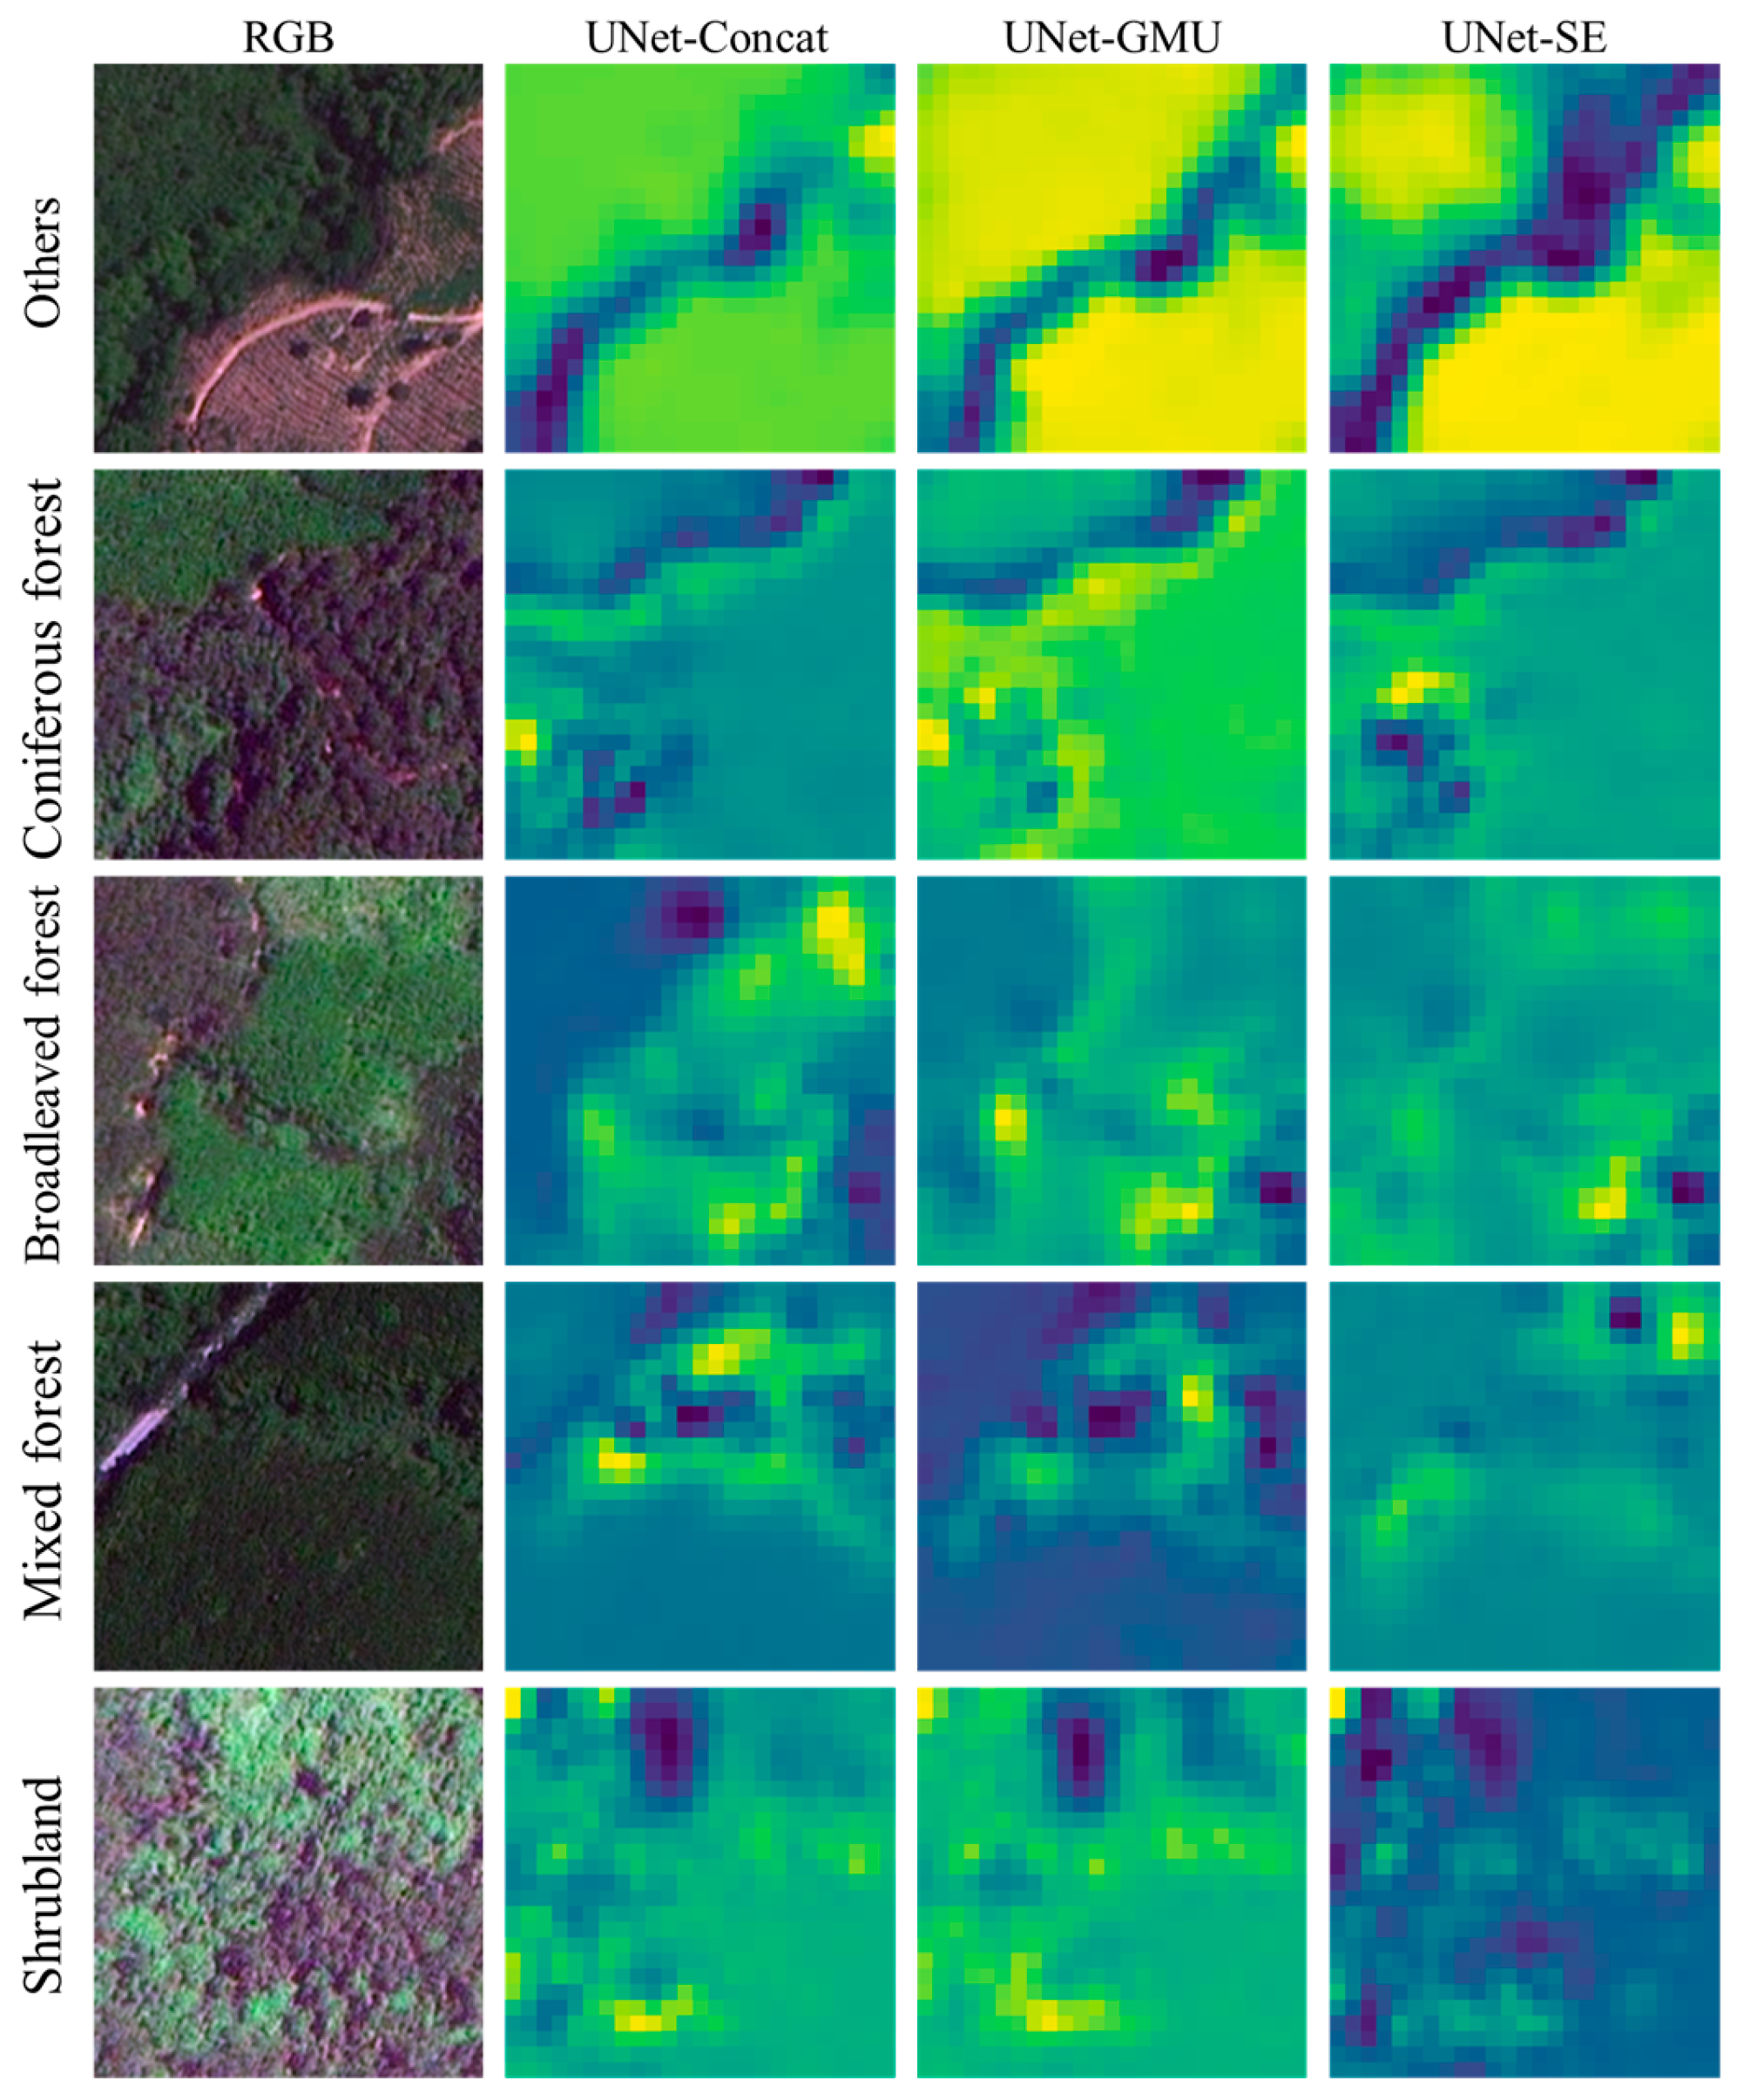
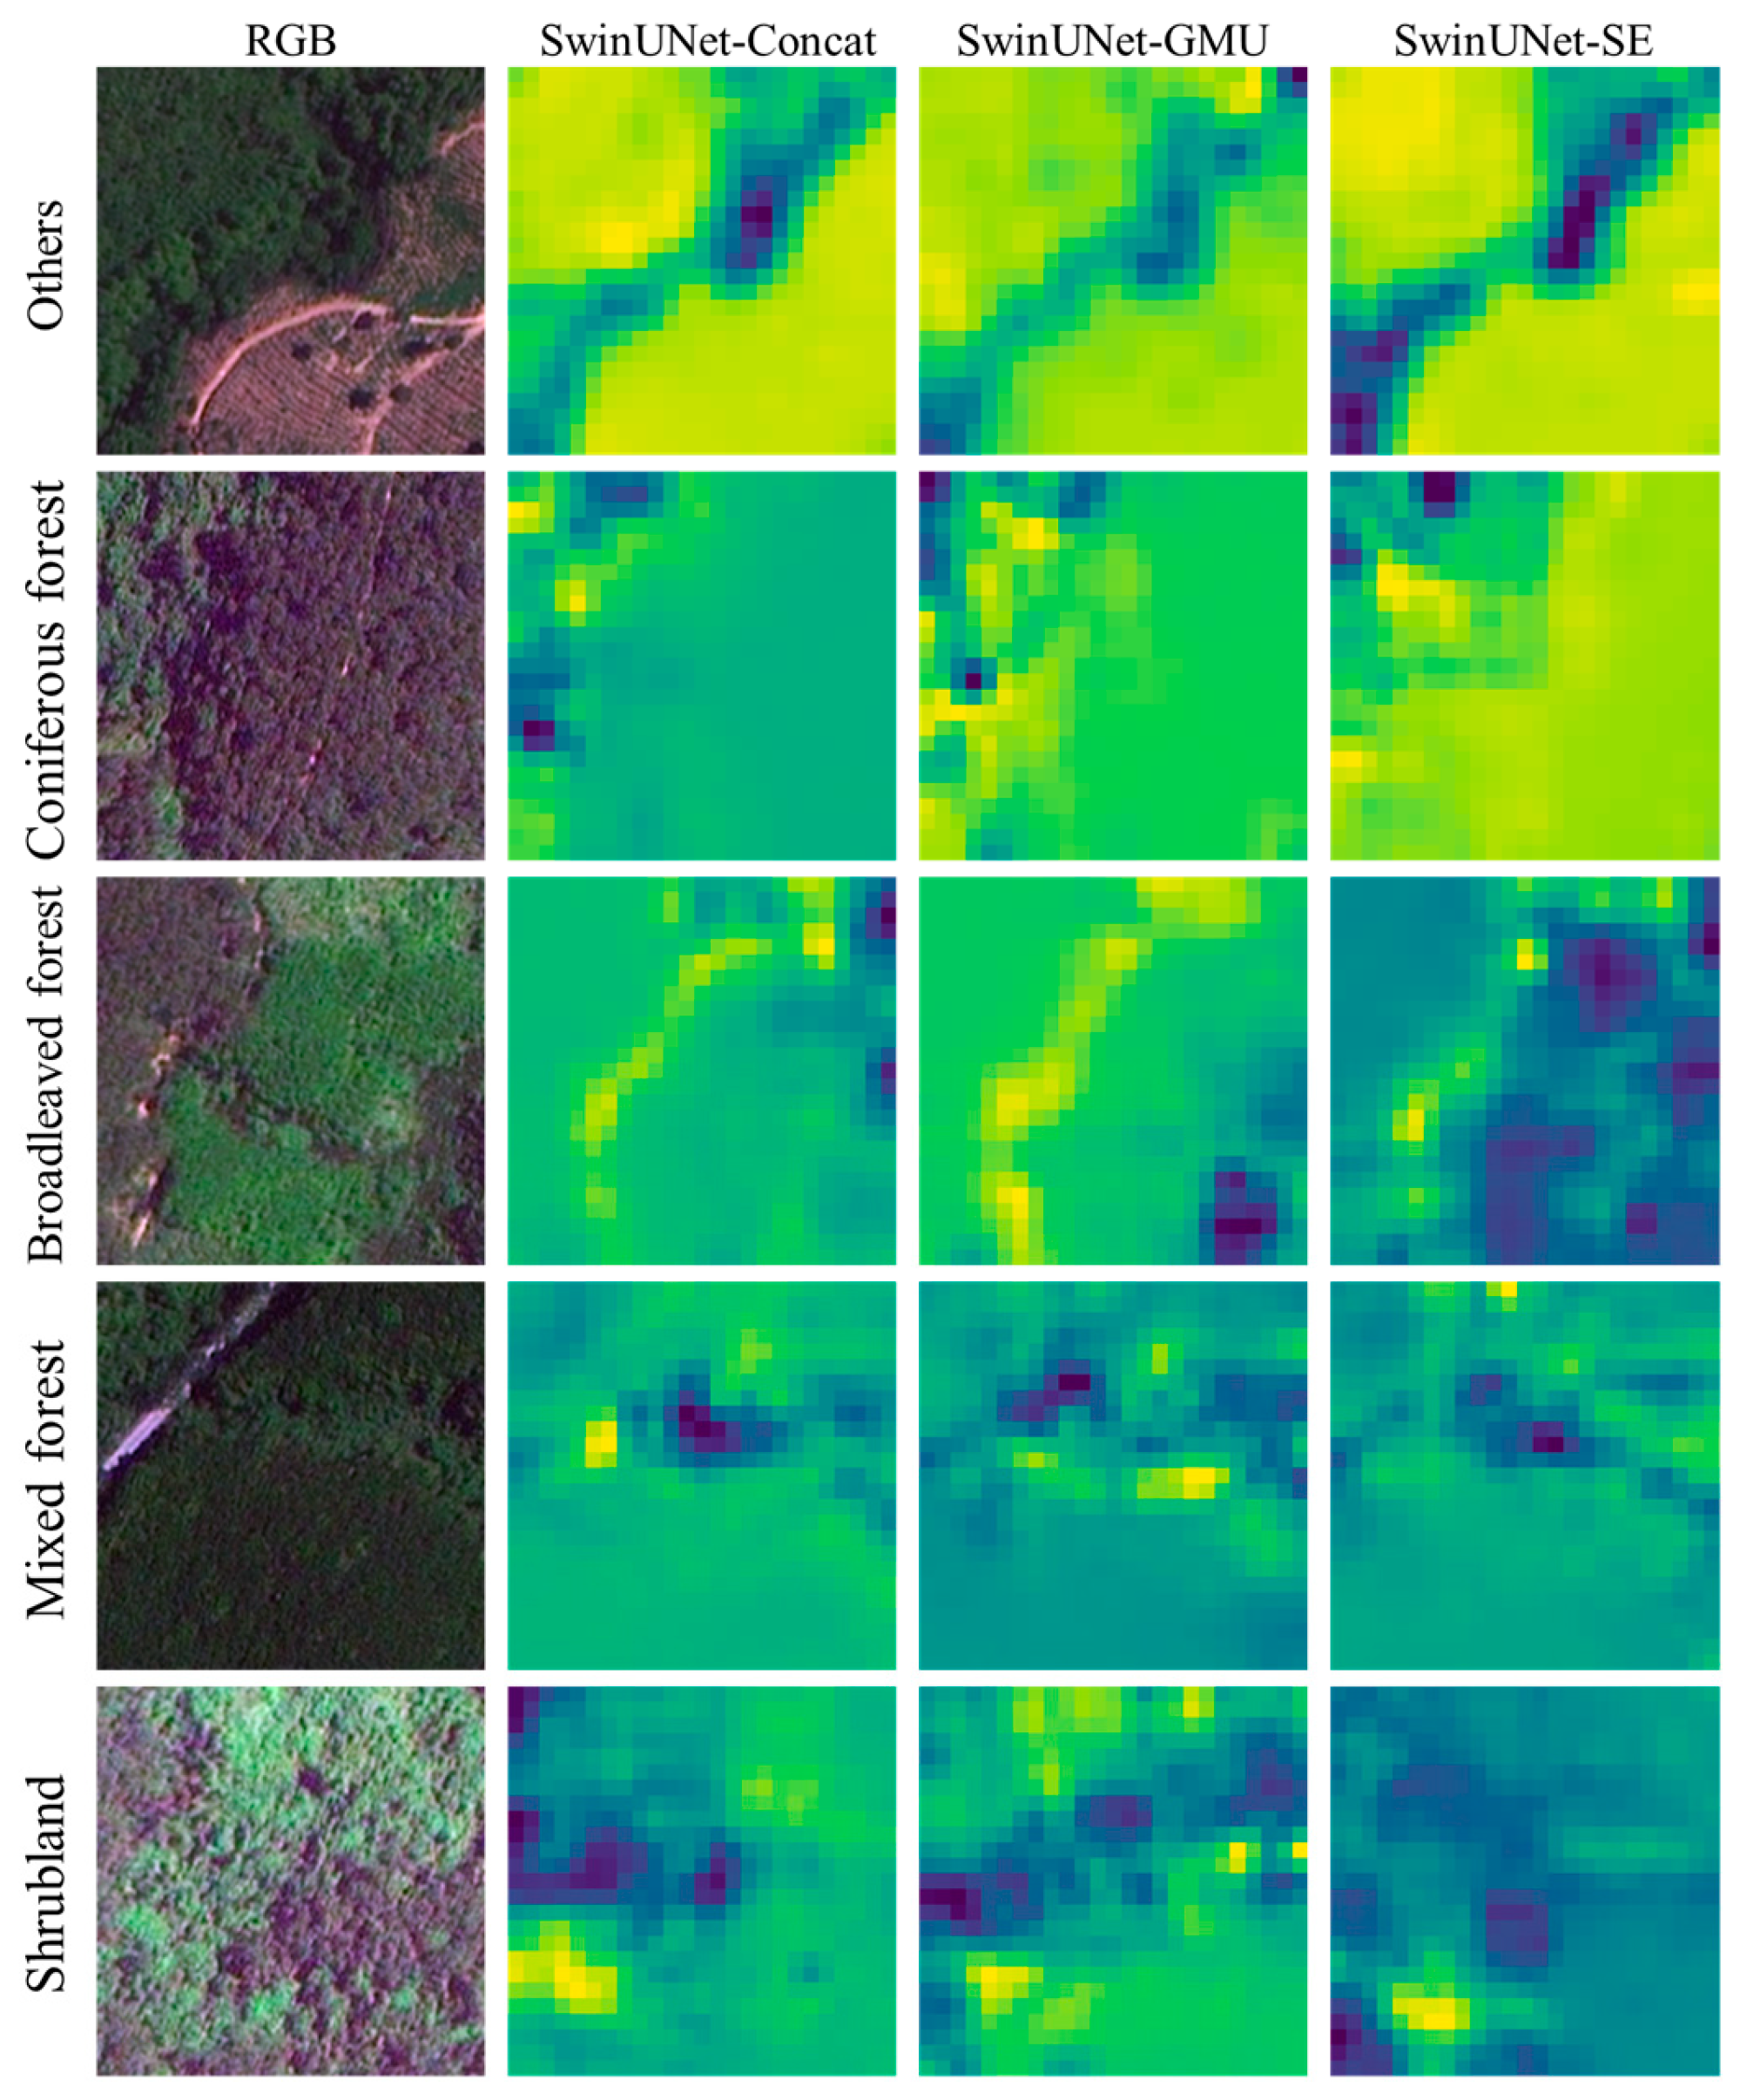
The spatial occlusion sensitivity heatmaps in Figure 11 and Figure 12 reveal the location-specific importance of image regions for model predictions, with yellow and blue-purple hues denoting high and low sensitivity, respectively. All models correctly allocated high sensitivity to the target patches, validating their fundamental spatial reasoning. A clear class-dependent gradient in spatial focus was observed. For well-separated classes such as “Others,” coniferous, and broadleaved forests, the high-sensitivity regions were compact and sharply delineated. By contrast, mixed forests and shrubland exhibited more dispersed and fragmented patterns with weaker overall intensity, reflecting their inherent spectral–structural ambiguity. From an architectural perspective, U-Net models followed a localized, detail-oriented strategy, producing tightly concentrated hotspots aligned with key local features. Swin-UNet models, in contrast, adopted a contextual strategy, activating broader and more diffuse regions that capture large-scale spatial context and texture. This divergence illustrates how architectural inductive biases fundamentally shape the scale of spatial cues each model prioritizes.

5. Discussion

5.1. Analysis of Modality Complementarity

Integrated analysis of overall performance (Figure 4 and Figure 5) and ablation studies (Table 3) confirms that tri-modal data fusion yields consistent superiority over any single modality. The most substantial gains are observed for the challenging broadleaved and mixed forest classes, which often exhibit high spectral similarity and internal structural complexity. This highlights a strong synergistic complementarity among sensor data types for classifying complex land covers. Our results on complex forest types thus provide further evidence supporting previous findings on multi-sensor fusion [7,31].
High-resolution RGB imagery forms the indispensable foundation. It provides the most discriminative features across all models. SHAP analysis (Figure 7) and occlusion sensitivity curves (Figure 10) both highlight by identifying the green and red bands as the primary contributors. Their occlusion induces the largest prediction confidence drops. This can be attributed to their ability to capture the fine-grained spectral and spatial details (e.g., canopy texture) that the 10 m Sentinel data cannot resolve. These details are essential for delineating stand boundaries, a capability widely recognized in review literature [32]. However, for spectrally similar classes, RGB data alone is insufficient. This limitation, which has also been noted in other studies [33], is evidenced by the fragmented predictions in the baseline classification maps (Figure 6).
The incorporation of NDVI adds critical temporal phenological information. SHAP analysis highlights the increased importance of winter and spring NDVI values. Despite their negligible impact in the occlusion sensitivity analysis (Figure 10), this discrepancy is expected. This is because perturbation-based methods are highly sensitive to the strong correlation among adjacent temporal features. The model likely compensates for a single occluded band using this correlated information, whereas SHAP still identifies the band’s high mean absolute contribution. SHAP values correspond to the leaf-flushing signatures of deciduous species, which provide a seasonal window for separating them from evergreen conifers. In contrast, the utility of Sentinel-1 data is strongly dependent on network architecture. In U-Net–based models, its removal leads to a significant performance drop (Table 3). This reveals its role in providing structural complementarity, particularly for coniferous and mixed forests where canopy geometry is informative. Sentinel-1 helps mitigate the limitations of optical data in structural representation, a role consistent with findings in [34,35] regarding multimodal land monitoring. In Swin-UNet models, however, Sentinel-1′s contribution is notably reduced and its marginal utility is limited.
In conclusion, RGB, NDVI, and Sentinel-1 each offer complementary information: RGB supplies stable spectral-textural details, NDVI introduces decisive seasonal dynamics, and Sentinel-1 provides structural cues. Yet this complementarity is not equally realized. Its effectiveness is critically shaped by network architecture. In more powerful backbones such as Swin-UNet, RGB dominance is further amplified, which reduces the relative contribution space available to NDVI and Sentinel-1.

5.2. Differences Across Network Architectures

From the overall accuracy (Figure 4 and Figure 5) and classification results (Figure 6), clear differences emerge between U-Net and Swin-UNet in handling complex forest types. U-Net performs reliably for classes with distinctive spectral-structural features such as coniferous forests. However, it often produces blurred boundaries and fragmented patches in broadleaved and mixed forests, a limitation directly linked to the restricted receptive fields of convolutional kernels. In contrast, Swin-UNet leverages hierarchical self-attention to simultaneously preserve fine-grained details and capture long-range dependencies, which significantly reduces confusion between broadleaved and mixed forests and yields sharper boundary delineation. These findings regarding complex forest types are consistent with recent work highlighting the advantages of Transformer-based backbones for complex land-cover classification [36,37].
This contrast is further substantiated by interpretability analyses. Grad-CAM++ visualizations (Figure 8 and Figure 9) and spatial occlusion sensitivity heatmaps (Figure 11 and Figure 12) reveal that U-Net focuses on localized hotspots but with insufficient boundary adherence, while Swin-UNet exhibits broader and more context-aware attention that closely matches the true patch morphology. Occlusion sensitivity curves (Figure 10) further highlight robustness differences: U-Net displays larger fluctuations under multimodal perturbations, whereas Swin-UNet produces smoother responses, reflecting greater stability. This relative insensitivity to NDVI and Sentinel-1 perturbations (Figure 10) confirms its stronger reliance on RGB features. Taken together, these results confirm that U-Net, as a classical CNN, excels at fine local feature extraction but is limited in capturing spatial continuity and global dependencies. These limitations are effectively addressed by Swin-UNet’s self-attention mechanism, which enables superior modeling of the global context essential for remote sensing segmentation, as confirmed in [16,37].

5.3. Effectiveness of Multimodal Fusion Strategies

The overall experimental results demonstrate that multimodal fusion improves model performance across different backbones. As a baseline, simple concatenation (Concat) delivers consistent gains in both U-Net and Swin-UNet, confirming the general utility of multisource fusion for forest classification (Figure 4 and Figure 5), a principle widely established in previous research [38]. However, the actual impact of a given fusion strategy is highly dependent on the backbone’s feature extraction mechanism.
In the convolution-based U-Net, different fusion schemes significantly influence performance. SE and Concat perform better for complex classes such as broadleaved and mixed forests, whereas GMU shows weaker stability and in some cases underperforms the unfused baseline (Figure 6). When the input modalities differ substantially in resolution, fusion modules in U-Net need adjustments tailored to the data and the network to balance modalities and improve classification. This finding is consistent with existing literature, which shows that convolutional architectures are highly sensitive to fusion strategy and require carefully engineered designs to achieve significant performance improvements in multimodal classification [39,40], a challenge that our study observes in the context of forest type discrimination.
In the self-attention-based Swin-UNet, the performance gap among fusion strategies narrows, with overall accuracy and boundary consistency reaching comparable levels (Figure 4, Figure 5 and Figure 6). This suggests that strong backbones already have inherent multimodal integration capacity, thus reducing the marginal benefit of explicit fusion. Nonetheless, interpretability analyses still reveal subtle differences: occlusion sensitivity curves show smoother responses to NDVI perturbations in SE and GMU (Figure 10), and Grad-CAM++ further demonstrates that SE produces more compact, boundary-aligned activations in mixed forest and shrubland (Figure 8 and Figure 9).
In summary, the effectiveness of multimodal fusion strategies varies with the backbone architecture, which accounts for the disparate behavior of both the Sentinel-1 data and the GMU strategy across models. In U-Net, particularly when input modalities differ in resolution or semantics, fusion mechanisms must be carefully adapted to the characteristics of the data and the network to ensure balanced feature integration. In contrast, the self-attention-based Swin-UNet backbone exhibits an inherently stronger multimodal integration capacity and reinforces the dominance of RGB features (as discussed in Section 5.1). As a result, its performance shows substantially reduced dependence on specific fusion strategies (e.g., GMU) and diminished reliance on auxiliary structural information such as Sentinel-1.

5.4. Limitations and Future Work

Despite the promising results, this study has some limitations that need to be addressed in future work. The classification labels were derived from 2021 high-resolution RGB imagery and manually corrected based on 2019 forest inventory data to ensure temporal consistency between labels and images. However, this manual annotation process was time-consuming and labor-intensive, limiting the dataset to only two study sites. Consequently, the generalizability and geographical transferability of the models require further validation. Future studies should expand model testing to regions with greater ecological diversity.
To reduce data redundancy, Sentinel-1 data were limited to median composites from summer and winter, while temporal vegetation dynamics were represented only by Sentinel-2-based NDVI. Other band information, such as red-edge and SWIR, may provide additional spectral cues to better distinguish forest types and improve classification accuracy. Future work could explore denser Sentinel-1 time series and incorporate a wider range of spectral features to improve model performance.
Finally, as discussed in Section 5.1, Section 5.2 and Section 5.3, the superior performance of the optimal model is largely attributable to the progressive enhancements built upon the baseline architecture. The backbone establishes the fundamental representational capacity, but further improvements depend on how effectively the model integrates multimodal information through appropriate feature design and fusion strategies. However, the exact contributions of each component and their interactions remain insufficiently transparent. Developing more robust and quantifiable interpretability techniques represents an important direction for future research.

6. Conclusions

This study systematically evaluated the performance and interpretability of different deep learning architectures (U-Net and Swin-UNet) and multimodal fusion strategies (Concat, GMU, SE) for classifying complex subtropical mountainous forests. The results demonstrate that high-resolution RGB imagery provides the foundation for classification but is limited in distinguishing broadleaved and mixed forests, while temporal NDVI offers critical phenological cues that assist in separating deciduous from evergreen types, and Sentinel-1 contributes complementary structural information for coniferous and mixed forests. At the same time, clear architectural differences were observed, with U-Net relying on local features and prone to boundary blurring, whereas Swin-UNet leverages self-attention to capture long-range dependencies and performs better on complex classes. Furthermore, the effectiveness of multimodal fusion strategies is closely tied to the backbone network: in U-Net, the fusion method directly determines whether heterogeneous information can be effectively integrated, while in Swin-UNet the differences among strategies narrow, although SE still improves robustness and spatial discrimination. Overall, this work confirms the complementarity of RGB, NDVI, and Sentinel-1data and highlights the decisive role of network architecture and fusion design in multimodal forest classification.

Author Contributions

Conceptualization, S.C. and Z.C.; methodology, S.C. and X.W.; software, S.Q.; validation, S.C.; formal analysis, S.C.; investigation, X.W. and M.S.; resources, X.W.; writing—original draft preparation, S.C.; writing—review and editing, S.C., X.W., M.S., G.T. and Z.C.; visualization, G.T.; supervision, Z.C.; funding acquisition, Z.C. All authors have read and agreed to the published version of the manuscript.

Funding

This research was funded by the National Key Research and Development Program of China under grant number 2023YFB3907702, and the National Natural Science Foundation of China under Grant 32401581.

Data Availability Statement

The data and code presented in this study are available on request from the corresponding author. The availability of the data is constrained by institutional restrictions; the Beijing-2 imagery was provided by the Experimental Center of Tropical Forestry Chinese Academy of Forestry, and is not publicly available. Sentinel-1 SAR and Sentinel-2 NDVI data were obtained via the Google Earth Engine (https://earthengine.google.com/) platform.

Acknowledgments

We would like to express our sincere gratitude to Hongyan Jia from Experimental Center of Tropical Forestry Chinese Academy of Forestry for providing ground survey data for this research.

Conflicts of Interest

The authors declare no conflicts of interest.

References

  1. Lu, M.; Chen, B.; Liao, X.; Yue, T.; Yue, H.; Ren, S.; Li, X.; Nie, Z.; Xu, B. Forest Types Classification Based on Multi-Source Data Fusion. Remote Sens. 2017, 9, 1153. [Google Scholar] [CrossRef]
  2. Yu, Y.; Li, M.; Fu, Y. Forest type identification by random forest classification combined with SPOT and multitemporal SAR data. J. For. Res. 2018, 29, 1407–1414. [Google Scholar] [CrossRef]
  3. Yu, X.; Lu, D.; Jiang, X.; Li, G.; Chen, Y.; Li, D.; Chen, E. Examining the Roles of Spectral, Spatial, and Topographic Features in Improving Land-Cover and Forest Classifications in a Subtropical Region. Remote Sens. 2020, 12, 2907. [Google Scholar] [CrossRef]
  4. Cheng, K.; Wang, J. Forest Type Classification Based on Integrated Spectral-Spatial-Temporal Features and Random Forest Algorithm—A Case Study in the Qinling Mountains. Forests 2019, 10, 559. [Google Scholar] [CrossRef]
  5. Li, J.; Cai, Y.; Li, Q.; Kou, M.; Zhang, T. A review of remote sensing image segmentation by deep learning methods. Int. J. Digit. Earth 2024, 17, 2328827. [Google Scholar] [CrossRef]
  6. Chen, X.; Shen, X.; Cao, L. Tree Species Classification in Subtropical Natural Forests Using High-Resolution UAV RGB and SuperView-1 Multispectral Imageries Based on Deep Learning Network Approaches: A Case Study within the Baima Snow Mountain National Nature Reserve, China. Remote Sens. 2023, 15, 2697. [Google Scholar] [CrossRef]
  7. Sothe, C.; De Almeida, C.M.; Schimalski, M.B.; Liesenberg, V.; La Rosa, L.E.C.; Castro, J.D.B.; Feitosa, R.Q. A comparison of machine and deep-learning algorithms applied to multisource data for a subtropical forest area classification. Int. J. Remote Sens. 2020, 41, 1943–1969. [Google Scholar] [CrossRef]
  8. Diwei, Z.; Xiaoyang, C.; Yunxiang, G. A Multi-Model Output Fusion Strategy Based on Various Machine Learning Techniques for Product Price Prediction. J. Electron. Inf. Syst. 2024, 4, 42–51. [Google Scholar] [CrossRef]
  9. Stahlschmidt, S.R.; Ulfenborg, B.; Synnergren, J. Multimodal deep learning for biomedical data fusion: A review. Brief. Bioinform. 2022, 23, bbab569. [Google Scholar] [CrossRef]
  10. Boulahia, S.Y.; Amamra, A.; Madi, M.R.; Daikh, S. Early, intermediate and late fusion strategies for robust deep learning-based multimodal action recognition. Mach. Vis. Appl. 2021, 32, 121. [Google Scholar] [CrossRef]
  11. Singh, L.; Janghel, R.R.; Sahu, S.P. A hybrid feature fusion strategy for early fusion and majority voting for late fusion towards melanocytic skin lesion detection. Int. J. Imaging Syst. Technol. 2022, 32, 1231–1250. [Google Scholar] [CrossRef]
  12. Gadzicki, K.; Khamsehashari, R.; Zetzsche, C. Early vs Late Fusion in Multimodal Convolutional Neural Networks. In Proceedings of the 2020 IEEE 23rd International Conference on Information Fusion (FUSION), Rustenburg, South Africa, 6–9 July 2020; pp. 1–6. [Google Scholar]
  13. Pereira, L.M.; Salazar, A.; Vergara, L. A Comparative Analysis of Early and Late Fusion for the Multimodal Two-Class Problem. IEEE Access 2023, 11, 84283–84300. [Google Scholar] [CrossRef]
  14. Yun, T.; Li, J.; Ma, L.; Zhou, J.; Wang, R.; Eichhorn, M.P.; Zhang, H. Status, advancements and prospects of deep learning methods applied in forest studies. Int. J. Appl. Earth Obs. Geoinf. 2024, 131, 103938. [Google Scholar] [CrossRef]
  15. Shamsolmoali, P.; Zareapoor, M.; Wang, R.; Zhou, H.; Yang, J. A Novel Deep Structure U-Net for Sea-Land Segmentation in Remote Sensing Images. IEEE J. Sel. Top. Appl. Earth Obs. Remote Sens. 2019, 12, 3219–3232. [Google Scholar] [CrossRef]
  16. He, X.; Zhou, Y.; Zhao, J.; Zhang, D.; Yao, R.; Xue, Y. Swin Transformer Embedding UNet for Remote Sensing Image Semantic Segmentation. IEEE Trans. Geosci. Remote Sens. 2022, 60, 4408715. [Google Scholar] [CrossRef]
  17. Zhong, L.; Dai, Z.; Fang, P.; Cao, Y.; Wang, L. A Review: Tree Species Classification Based on Remote Sensing Data and Classic Deep Learning-Based Methods. Forests 2024, 15, 852. [Google Scholar] [CrossRef]
  18. Xu, J.; Yang, J.; Xiong, X.; Li, H.; Huang, J.; Ting, K.C.; Ying, Y.; Lin, T. Towards interpreting multi-temporal deep learning models in crop mapping. Remote Sens. Environ. 2021, 264, 112599. [Google Scholar] [CrossRef]
  19. Li, Z. Extracting spatial effects from machine learning model using local interpretation method: An example of SHAP and XGBoost. Comput. Environ. Urban Syst. 2022, 96, 101845. [Google Scholar] [CrossRef]
  20. Ma, Y.; Zhao, Y.; Im, J.; Zhao, Y.; Zhen, Z. A deep-learning-based tree species classification for natural secondary forests using unmanned aerial vehicle hyperspectral images and LiDAR. Ecol. Indic. 2024, 159, 111608. [Google Scholar] [CrossRef]
  21. Ronneberger, O.; Fischer, P.; Brox, T. U-Net: Convolutional Networks for Biomedical Image Segmentation. In Proceedings of the Medical Image Computing and Computer-Assisted Intervention–MICCAI 2015, Cham, Switzerland, 18 November 2015; pp. 234–241. [Google Scholar]
  22. Cao, H.; Wang, Y.; Chen, J.; Jiang, D.; Zhang, X.; Tian, Q.; Wang, M. Swin-Unet: Unet-Like Pure Transformer for Medical Image Segmentation. In Proceedings of the Computer Vision–ECCV 2022 Workshops, Cham, Switzerland, 18 February 2023; pp. 205–218. [Google Scholar]
  23. Arevalo, J.; Solorio, T.; Montes-y-Gómez, M.; González, F.A. Gated multimodal units for information fusion. arXiv 2017, arXiv:1702.01992. [Google Scholar] [CrossRef]
  24. Hu, J.; Shen, L.; Sun, G. Squeeze-and-excitation networks. In Proceedings of the IEEE Conference on Computer Vision and Pattern Recognition, Salt Lake City, UT, USA, 16 December 2018; pp. 7132–7141. [Google Scholar]
  25. Chen, X.; Yao, X.; Zhou, Z.; Liu, Y.; Yao, C.; Ren, K. DRs-UNet: A Deep Semantic Segmentation Network for the Recognition of Active Landslides from InSAR Imagery in the Three Rivers Region of the Qinghai–Tibet Plateau. Remote Sens. 2022, 14, 1848. [Google Scholar] [CrossRef]
  26. Van Soesbergen, A.; Chu, Z.; Shi, M.; Mulligan, M. Dam Reservoir Extraction from Remote Sensing Imagery Using Tailored Metric Learning Strategies. IEEE Trans. Geosci. Remote Sens. 2022, 60, 4207414. [Google Scholar] [CrossRef]
  27. Liu, Y.; Gao, K.; Wang, H.; Yang, Z.; Wang, P.; Ji, S.; Huang, Y.; Zhu, Z.; Zhao, X. A Transformer-based multi-modal fusion network for semantic segmentation of high-resolution remote sensing imagery. Int. J. Appl. Earth Obs. Geoinf. 2024, 133, 104083. [Google Scholar] [CrossRef]
  28. Pradhan, B.; Lee, S.; Dikshit, A.; Kim, H. Spatial flood susceptibility mapping using an explainable artificial intelligence (XAI) model. Geosci. Front. 2023, 14, 101625. [Google Scholar] [CrossRef]
  29. Chattopadhay, A.; Sarkar, A.; Howlader, P.; Balasubramanian, V.N. Grad-CAM++: Generalized Gradient-Based Visual Explanations for Deep Convolutional Networks. In Proceedings of the 2018 IEEE Winter Conference on Applications of Computer Vision (WACV), Lake Tahoe, NV, USA, 12–15 March 2018; pp. 839–847. [Google Scholar]
  30. Mäyrä, J.; Keski-Saari, S.; Kivinen, S.; Tanhuanpää, T.; Hurskainen, P.; Kullberg, P.; Poikolainen, L.; Viinikka, A.; Tuominen, S.; Kumpula, T.; et al. Tree species classification from airborne hyperspectral and LiDAR data using 3D convolutional neural networks. Remote Sens. Environ. 2021, 256, 112322. [Google Scholar] [CrossRef]
  31. Heckel, K.; Urban, M.; Schratz, P.; Mahecha, M.D.; Schmullius, C. Predicting Forest Cover in Distinct Ecosystems: The Potential of Multi-Source Sentinel-1 and -2 Data Fusion. Remote Sens. 2020, 12, 302. [Google Scholar] [CrossRef]
  32. Fassnacht, F.E.; Latifi, H.; Stereńczak, K.; Modzelewska, A.; Lefsky, M.; Waser, L.T.; Straub, C.; Ghosh, A. Review of studies on tree species classification from remotely sensed data. Remote Sens. Environ. 2016, 186, 64–87. [Google Scholar] [CrossRef]
  33. Bai, Y.; Sun, G.; Li, Y.; Ma, P.; Li, G.; Zhang, Y. Comprehensively analyzing optical and polarimetric SAR features for land-use/land-cover classification and urban vegetation extraction in highly-dense urban area. Int. J. Appl. Earth Obs. Geoinf. 2021, 103, 102496. [Google Scholar] [CrossRef]
  34. Li, Y.; Xiao, X. Deep Learning-Based Fusion of Optical, Radar, and LiDAR Data for Advancing Land Monitoring. Sensors 2025, 25, 4991. [Google Scholar] [CrossRef]
  35. Liu, X.; Zou, H.; Wang, S.; Lin, Y.; Zuo, X. Joint Network Combining Dual-Attention Fusion Modality and Two Specific Modalities for Land Cover Classification Using Optical and SAR Images. IEEE J. Sel. Top. Appl. Earth Obs. Remote Sens. 2024, 17, 3236–3250. [Google Scholar] [CrossRef]
  36. Xu, Z.; Zhang, W.; Zhang, T.; Yang, Z.; Li, J. Efficient Transformer for Remote Sensing Image Segmentation. Remote Sens. 2021, 13, 3585. [Google Scholar] [CrossRef]
  37. Fan, L.; Zhou, Y.; Liu, H.; Li, Y.; Cao, D. Combining Swin Transformer with UNet for Remote Sensing Image Semantic Segmentation. IEEE Trans. Geosci. Remote Sens. 2023, 61, 5530111. [Google Scholar] [CrossRef]
  38. Chen, B.; Huang, B.; Xu, B. Multi-source remotely sensed data fusion for improving land cover classification. ISPRS J. Photogramm. Remote Sens. 2017, 124, 27–39. [Google Scholar] [CrossRef]
  39. Audebert, N.; Le Saux, B.; Lefèvre, S. Beyond RGB: Very high resolution urban remote sensing with multimodal deep networks. ISPRS J. Photogramm. Remote Sens. 2018, 140, 20–32. [Google Scholar] [CrossRef]
  40. Sun, Y.; Fu, Z.; Sun, C.; Hu, Y.; Zhang, S. Deep Multimodal Fusion Network for Semantic Segmentation Using Remote Sensing Image and LiDAR Data. IEEE Trans. Geosci. Remote Sens. 2022, 60, 5404418. [Google Scholar] [CrossRef]
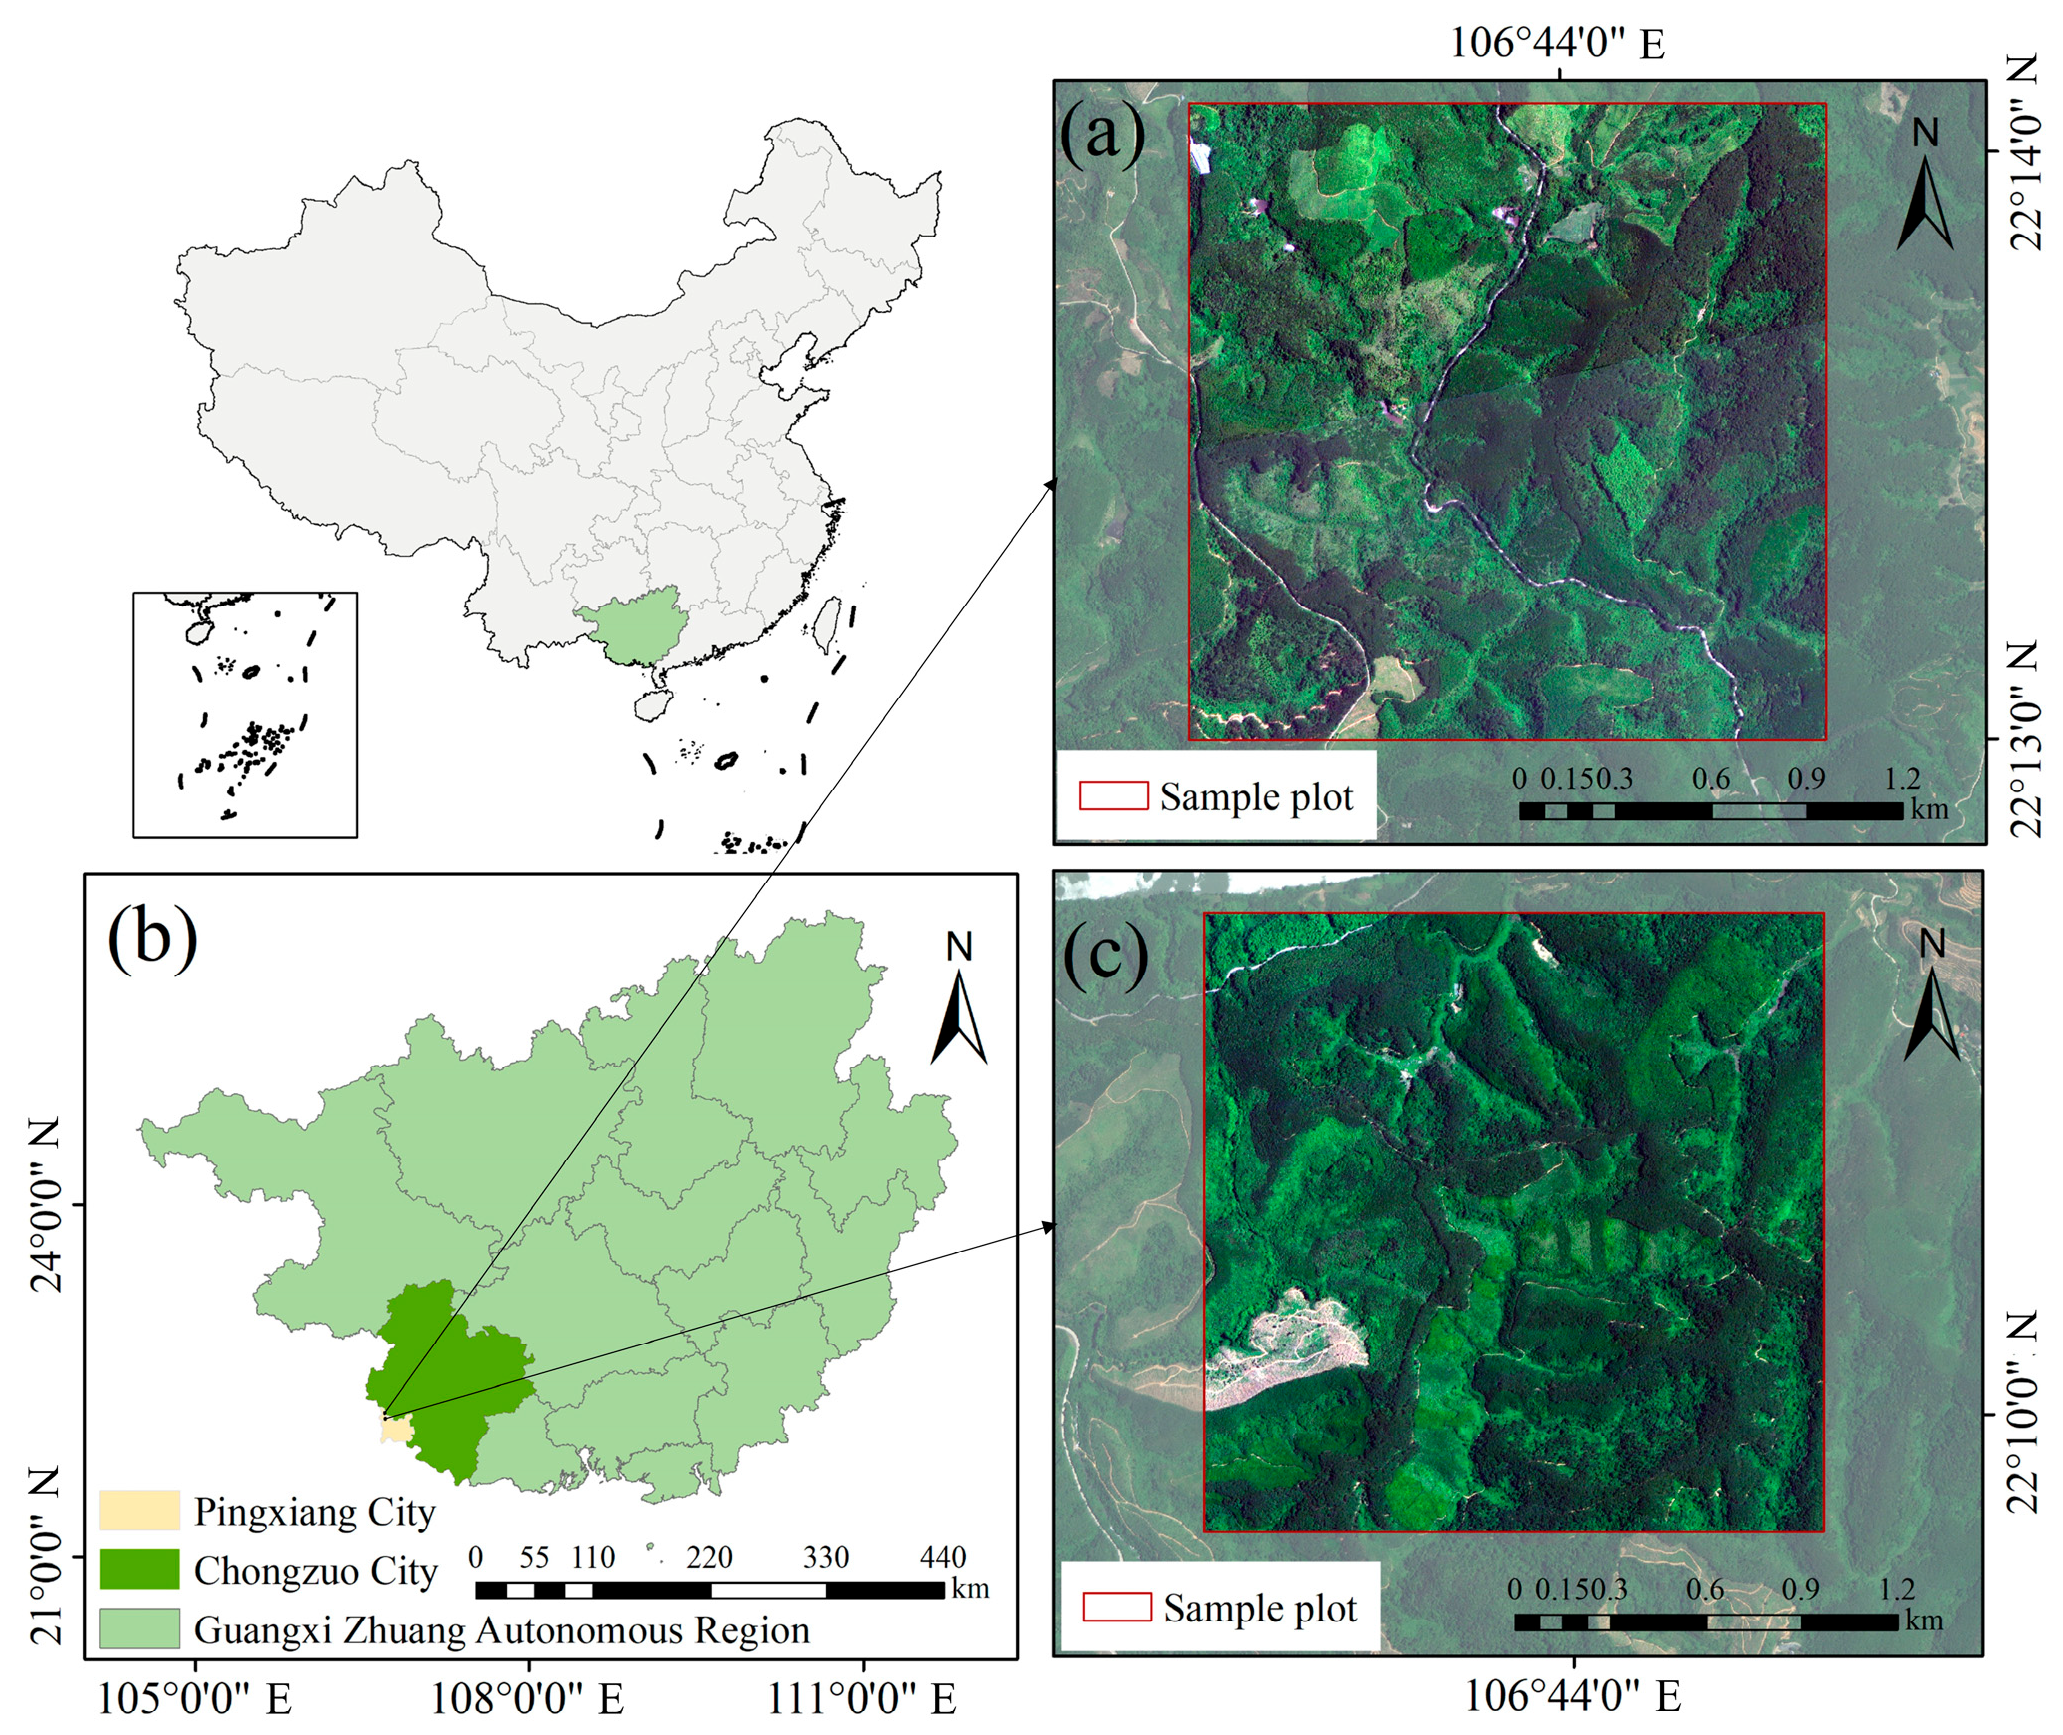
Figure 1. Study area. (b) Location of the study sites within the Guangxi Zhuang Autonomous Region; (a,c) are Sample Plot 1 and Sample Plot 2, respectively.
Forests 16 01709 g001
Figure 2. Workflow of the proposed method.
Forests 16 01709 g002
Figure 3. Multimodal architectures based on U-Net and Swin-UNet. (a) The architecture based on U-Net, where (a1) represents the low-resolution branch and (a2) depicts the U-Net structure. (b) The architecture based on Swin-UNet, where (b1) represents the low-resolution branch and (b2) depicts the Swin-UNet structure.
Forests 16 01709 g003
Figure 4. Classification performance of all models.
Forests 16 01709 g004
Figure 5. Confusion matrices of different models.
Forests 16 01709 g005
Figure 6. Comparison of classification results in sample regions.
Forests 16 01709 g006
Figure 7. SHAP-based feature importance analysis across models.
Forests 16 01709 g007
Figure 8. Grad-CAM++ visualizations of multimodal models based on U-Net. The colors range from dark blue (low importance) to bright red (high importance).
Forests 16 01709 g008
Figure 9. Grad-CAM++ visualizations of multimodal models based on Swin-UNet. The colors range from dark blue (low importance) to bright red (high importance).
Forests 16 01709 g009
Figure 10. Occlusion sensitivity curves of different multimodal models.
Forests 16 01709 g010
Figure 11. Spatial occlusion sensitivity heatmaps of multimodal models based on U-Net. The colors range from dark purple (low sensitivity) to bright yellow (high sensitivity).
Forests 16 01709 g011
Figure 12. Spatial occlusion sensitivity heatmaps of multimodal models based on Swin-UNet. The colors range from dark purple (low sensitivity) to bright yellow (high sensitivity).
Forests 16 01709 g012
Table 1. Pixel counts of each forest type in the training and validation datasets.
Sample SetOthersConiferous ForestBroadleaf ForestMixed ForestShrubland
Training (pixel)1,078,93210,499,3023,998,4947,614,3225,448,950
validation (pixel)294,0643,736,6581,076,5662,276,734855,978
Table 2. Parameter counts and computational complexity of different models.
ModelParams (M)FLOPs (G)FPS
U-Net17.2624.48179.41
UNet-Concat18.5825.18160.3
UNet-GMU19.3828.38132.53
UNet-SE19.3328.13148.71
Swin-UNet21.995.24184.89
SwinUNet-Concat25.574.53116.2
SwinUNet-GMU25.744.70105.8
SwinUNet-SE25.714.66106.57
Table 3. Ablation study results under modality removal.
ModelRGB+NDVI+SARRGB+NDVIRGB+SAR
OAMIoUMean F1OAMIoUMean F1OAMIoUMean F1
UNet-Concat78.74%0.63980.768950.50%0.28340.347666.84%0.34230.4620
UNet-GMU77.18%0.63240.762455.11%0.31650.426972.35%0.49080.6447
UNet-SE79.42%0.64520.775760.42%0.37350.524170.84%0.42380.5724
SwinUNet-Concat81.62%0.67900.800179.08%0.64400.772665.70%0.30690.4172
SwinUNet-GMU82.27%0.70090.815981.68%0.68410.804867.11%0.32490.4359
SwinUNet-SE82.76%0.68850.810281.25%0.65780.788366.65%0.36790.5066
Disclaimer/Publisher’s Note: The statements, opinions and data contained in all publications are solely those of the individual author(s) and contributor(s) and not of MDPI and/or the editor(s). MDPI and/or the editor(s) disclaim responsibility for any injury to people or property resulting from any ideas, methods, instructions or products referred to in the content.