Article

Predicting Forest Carbon Sequestration of Ecological Buffer Zone in Urban Agglomeration: Integrating Vertical Heterogeneity and Age Class Dynamics to Unveil Future Trajectories

1
Changsha General Survey of Natural Resources Center, China Geological Survey, Ningxiang 410600, China
2
Hunan Botanical Garden, Hunan Changsha-Zhuzhou-Xiangtan City Cluster Ecosystem Observation and Research Station, Changsha 410116, China
3
National Rhododendron Engineering Research Center of the National Forestry and Grassland Bureau, Changsha 410116, China
*
Author to whom correspondence should be addressed.
Forests 2025, 16(11), 1648; https://doi.org/10.3390/f16111648 (registering DOI)
Submission received: 19 September 2025 / Revised: 18 October 2025 / Accepted: 28 October 2025 / Published: 29 October 2025
(This article belongs to the Section Forest Meteorology and Climate Change)

Abstract

Forest ecosystems are vital for climate mitigation, yet predicting their carbon (C) sequestration remains challenging, especially in urban-proximal regions. This study investigates the C storage dynamics across five major forest types in the Chang-Zhu-Tan Green Heart, a critical ecological buffer zone in China’s Yangtze River Mid-Reach urban agglomeration. We integrated field measurements with structural equation and random forest modeling to analyze vertical C distribution and its drivers. The results revealed that over 90% of vegetation C was stored in the tree layer, with soil C highest in evergreen broad-leaved forests (41.26 Mg C/ha). Biological factors (i.e., tree volume and biomass) primarily drove vegetation C (52–73% of variance), while non-biological factors (soil properties and micronutrients) predominantly regulated soil C. We identified distinct age-related trajectories: J-shaped accumulation in broad-leaved forests versus S-shaped patterns in coniferous and mixed forests. These findings provide a mechanistic framework for forest-type-specific management strategies to enhance C sequestration in urban-agglomeration buffer zones.

1. Introduction

Forest ecosystems sequester approximately 2.4 Pg C annually, constituting 30% of anthropogenic CO2 emission mitigation potential [1,2,3]. This carbon (C) sink function has become a critical climate regulation mechanism under the dual pressures of global change and C neutrality initiatives [4]. Notably, forests located within urban transition zones play a disproportionately important role due to their proximity to anthropogenic emissions and high vulnerability to land-use change. Forest C sequestration has emerged as a critical research frontier in ecosystem science. Forest ecosystems sequester substantial C stores within vegetation, litter, and soil compartments, whose distribution dynamics exert pivotal controls on regional to global C cycling [5]. C storage dynamics in forests are governed by complex interactions between biological components (stand age, vegetation traits, biodiversity) and non-biological factors (soil properties, climate), with vertical partitioning from canopy to rhizosphere, exerting pivotal controls on ecosystem-scale C persistence [6,7,8,9,10].
Stand age is widely recognized as a central determinant of forest C storage capacity, profoundly influencing both the magnitude and allocation of ecosystem C pools [11]. This influence manifests through multiple interconnected mechanisms: as forests mature, they undergo significant shifts in biomass accumulation rates, root-shoot partitioning (i.e., declining root: shoot ratios with age), and soil organic matter stabilization processes [12]. Globally, observations confirm that old-growth forests (>200 years) consistently maintain substantially higher C stores (averaging ~98 Mg C ha−1 in aboveground biomass) compared to young stands (<20 years, ~43.5 Mg C ha−1), underscoring the critical role of age-related structural development in long-term C sequestration [13]. However, the relationship is complex; while younger, fast-growing forests can exhibit higher annual C sequestration rates, they operate from a much smaller C storage base and cannot match the absolute C storage capacity of mature ecosystems over meaningful timescales [13]. Recent global analyses further reveal a troubling trend of net C losses due to the widespread replacement of old-growth forests with younger stands, estimated at ~0.14 Pg C yr−1 in aboveground biomass, highlighting the irreversible impacts of aging forest loss on long-term C storage potential [14]. Consequently, accurately quantifying age-dependent C trajectories is not merely an academic exercise but a prerequisite for predicting forest C sink functionality under changing climate conditions and informing effective conservation and management strategies aimed at maximizing climate mitigation benefits.
Subtropical forests, accounting for >25% of global forest C stores [1,15], display particularly pronounced stratification due to high productivity and deep organic horizons. The Chang-Zhu-Tan Green Heart District (CZT-GHD), a subtropical humid region in central China, constitutes an essential ecological barrier for the Yangtze River Mid-Reach urban agglomeration [16,17]. As a forest ecosystem situated within an urban transition zone, this area provides vital ecosystem services, including climate regulation, biodiversity conservation, and sustainable development support. However, intensive urbanization and anthropogenic disturbances, particularly land use changes such as urban encroachment and forest fragmentation, threaten structural and functional degradation of its forest ecosystems. Some scholars have explored the impact of land use change on C storage in CZT-GHD [17,18], yet their C sequestration potential remains systematically unevaluated. While prior studies have isolated specific C pools, synergistic distribution patterns and drivers across multiple components, particularly quantitative interactions between biological and non-biological factors, are inadequately resolved. Consequently, elucidating spatial heterogeneity mechanisms of forest C storage in CZT-GHD is imperative for optimizing ecological governance and enhancing C sink efficacy.
Vertical C partitioning constitutes a critical research frontier in global biogeochemistry, governing ecosystem C persistence and climate feedback trajectories [19,20]. Globally, forest C pools exhibit consistent partitioning patterns: live biomass and soils constitute the dominant reservoirs, accounting for 43% and 45% of total C stores, respectively, with minor proportions in dead wood (8%) and litter (4%) [3]. However, subtropical forests exhibit distinct C allocation patterns that differ from these broad biome categories, with typically higher biomass allocation compared to temperate systems but greater soil C storage than tropical forests, reflecting their unique climatic and edaphic conditions. The proportional distribution of C between biomass and soil compartments correlates strongly with latitudinal biomes [21,22]: boreal forests store 20% (biomass) and 64% (soil); temperate forests allocate 38% (biomass) and 54% (soil); tropical forests retain 57% (biomass) and 32% (soil) [3]. The complexity-focused canopy traits may be even more strongly tied to net primary production through their positive effects on both light acquisition and light-use efficiency [23,24], with a dominant position in the total C pools of forests. Jobbágy and Jackson [6] demonstrated exponential soil organic C (SOC) decline with depth, a pattern now recognized as biome-specific: surface SOC (0–30 cm) dominates temperate systems (>50%), whereas tropical forests harbor substantial deep SOC reservoirs (>1 m) through root-mineral interactions [25]. In subtropical forests, C heterogeneity is governed by synergistic biotic–abiotic drivers—stand age, species traits, and disturbance regimes hierarchically interact with climatic gradients to regulate SOC stratification [26]. Recent evidence indicates microbial necromass and mineral association processes underpin 60–70% of subsoil C persistence in these systems [27,28]. Nevertheless, quantitative mechanisms linking stand-specific traits to edaphic properties remain unresolved, limiting predictive capacity for C-climate feedbacks under anthropogenic change [4].
The vertical partitioning of C storage in subtropical forests and its regulatory mechanisms exhibit marked forest-type specificity. In evergreen broadleaved forests, the tree stratum dominates C storage (70–85%), with this proportion increasing significantly with stand age. Conversely, understory C stores decline with rising forest age, reflecting niche competition for light resources [29]. Substantial deep-soil C accumulation in mature broadleaved stands strongly correlated with root vertical distribution [30]. Deep-rooted species (i.e., broad-leaved tree species) enhance subsoil (>50 cm) C stabilization through ligand-promoted mineral associations between root exudates and Fe and Al oxides [31]. Although coniferous forests exhibit lower C density than broadleaved systems, their recalcitrant litter inputs drive pronounced surface-layer accumulation [32]. Acidic soils (pH < 5.0) in coniferous forests inhibit bacterial decomposition but constrain deep C storage due to limited root penetration [33]. Mixed forests had a significant advantage in C storage [34]. Mixed conifer-broadleaf forests optimize soil resource utilization via complementary root stratification—broadleaf deep roots and conifer shallow roots [35,36]. Litter diversity further enhances mineral-associated organic C formation, while fungal communities facilitate humification-mediated stabilization [37,38]. Critically, broadleaf litter inputs in mixed stands improve soil structure and stimulate conifer deep-rooting [35,36]. Although vertical partitioning of C storage across subtropical forest types has been preliminarily characterized, the synergistic regulatory pathways governing biotic–abiotic interactions on spatial C allocation remain mechanistically unresolved. Furthermore, key processes such as age-dependent shifts in C sequestration potential lack quantitative validation, critically constraining predictive accuracy of ecosystem C sink functionality.
Recent years have witnessed growing research on C storage dynamics in the CZT-GHA forest ecosystems [16,17,18]. However, significant disparities persist in conceptual frameworks, methodological approaches, and conclusions across studies, attributable to the region’s unique status as an urban-agglomeration ecological core and ecosystem complexity. This investigation targets the prototypical forest ecosystems within CZT-GHA to achieve three primary objectives: (1) quantify the spatial heterogeneity and structural characteristics of vegetation-soil C reservoirs; (2) identify the key drivers and elucidate synergistic interactions between biological (i.e., vegetation traits) and non-biological (i.e., soil properties) factors using machine learning and structural equation modeling; and (3) simulate age-dependent C trajectories to project sequestration potential. Based on the foregoing, we hypothesize the following: (1) C storage will exhibit significant spatial heterogeneity and vertical stratification across forest types, yet follow predictable patterns. (2) The dynamics of vegetation C will be primarily driven by biological factors (i.e., structural traits), whereas soil C storage will be predominantly governed by the synergistic effects of abiotic factors (i.e., soil properties and micronutrients). (3) Forest age will modulate C sequestration trajectories, resulting in distinct accumulation pathways (i.e., J-shaped vs. sigmoidal curves) and partitioning between vegetation and soil pools among different forest types. This multidimensional analytical framework will establish a mechanistic basis for enhancing regional forest C sink capacity and adaptive management strategies.

2. Materials and Methods

2.1. Study Site

The research site was located in CZT-GHD (27°40′–28°40′ N, 112°30′–113°45′ E), which spans the conjoined metropolitan regions of Changsha, Zhuzhou, and Xiangtan in Hunan Province, China. Encompassing 528.32 km2, it represents the world’s largest urban agglomeration green heart. The topography exhibits a stepwise elevational gradient (50–300 m), dominated by low-relief hills (70%) and dissected by Quaternary alluvial terraces (30%). This region experiences a subtropical monsoon humid climate, characterized by thermal synchrony and pronounced seasonality: Mean annual temperature is 17.3 °C (min: 5.2 °C in January; max: 29.1 °C in July). Annual precipitation is 1420 mm, with 50% concentrated during the April-June monsoon. The dominant soils are Haplic Acrisols (FAO classification) derived from Mesozoic sandstones and Quaternary red clays.
The five major forest types in this region are as follows: evergreen broad-leaved forest (EBF), mixed evergreen and deciduous broad-leaved forest (MEDBF), deciduous broad-leaved forest (DBF), mixed needle and broad-leaved forest (MNBF), and coniferous forest (CF), were selected for this study because they represent the dominant and ecologically critical vegetation formations in the subtropical green-heart ecosystem (encompassing 522 km2), each with distinct species composition, successional status, and management history. EBF represents the zonal climax vegetation, dominated by species of Castanopsis and Cyclobalanopsis, and is primarily protected within nature reserves with minimal recent management. MEDBF and DBF largely consist of secondary forests recovering from historical logging or abandoned plantations, forming transitional successional stages. MNBF often results from intentional afforestation or natural colonization of conifers into broadleaved stands, reflecting active reforestation practices. CF is predominantly composed of Pinus massoniana or Cunninghamia lanceolata plantations, regularly managed for timber production and thus experiencing higher disturbance frequency. These forest types differ significantly in stand structure, nutrient cycling, and anthropogenic influence, which collectively govern their C storage patterns and sequestration potential. Together, they anchor the ecological security of the Yangtze River Mid-Reach urban agglomeration.
Urban expansion has led to significant fragmentation of core forest areas (as evidenced by studies on vegetation dynamics under urban expansion [16]), triggering soil erosion that affected 6.92% of the total area and altering its C sequestration potential [39]. Concurrently, these forests predominantly occupy young to mid-successional stages, exhibiting substantial C sequestration potential that provides a validated framework for projecting C storage dynamics along forest developmental chronosequences. Investigation plots were established using a systematic sampling approach, with the number of plots determined via a repeated sampling formula (see Equation (1)).
n = t 2 c 2 E 2
where n represents the number of sample plots, t represents the reliability coefficient (set at t = 1.960 for a 95% confidence level), and c represents the coefficient of variation (CV) of the population. Given that c was unknown, it was conservatively assigned its maximum theoretical value (c = 0.5). E represents the allowable relative error, set at a maximum of 7%. This calculation yielded a theoretical requirement of n = 196 sample plots. Considering the study area’s extent, a systematic grid sampling design with 2 km × 1 km cells was implemented. A total of 73 forest plots were established across the study area. Among these, 61 plots were distributed in the five dominant arbor forest types, with the sample allocation reflecting their relative abundance and ecological importance (for a detailed spatial distribution, see Figure 1; for the exact number (n) of plots per type, see Table A1). The remaining 12 plots sampled other vegetation formations (i.e., shrubland, bamboo forest, or other non-arbor types), ensuring comprehensive coverage of the ecosystem.

2.2. Research Methods

2.2.1. Plant Community Survey

Ground-based plot surveys were conducted from April to October 2022. Plot locations were optimized through integration of ground data and remote sensing imagery. Final plot positions were adjusted to ensure a minimum distance of 30 m from forest edges. Plots were preferentially established on uniform slopes to minimize topographic heterogeneity within plots.
Tree-dominated forest plots (25.82 m × 25.82 m square plot) were established according to the Technical Regulations for Continuous Forest Inventory [40]. Tree layer (overstory): a full tree census was conducted for all individuals with a diameter at breast height ≥ 5 cm. Measured parameters included breast height and tree height. Shrub layer (understory): within the main plot, representative 5 m × 5 m subplots were established based on expert assessment of stand structure. Within these subplots, all woody understory individuals (saplings, shrubs) were measured for breast height (if applicable), height, species, count, crown diameter, and basal diameter. Herb layer and litter layer: at each corner of the shrub subplot, four 1 m × 1 m quadrats were established. Herb vegetation: all above-ground biomass within the quadrat was harvested and weighed in the field (fresh weight). Subsamples were transported to the laboratory for oven-drying to determine dry mass. Litter layer: all litter (dead plant material) within the quadrat was collected, weighed in the field (fresh weight), and subsampled for laboratory drying to determine dry mass. The foundational attributes and dominant tree species composition for the 5 vegetation communities are summarized in Table A1.

2.2.2. Determination of Biomass

Aboveground C storage at the plot level was computed by summing C stores across stratified vegetation layers: tree, shrub, herb, and litter strata. Volume-biomass method was applied to estimate the biomass of the tree layer. Individual tree volumes were derived using two-variable volume equations (Table A2) referenced from the China Standing Tree Volume Tables [41]. Plot-level stand volume (m3) was aggregated and standardized to stand volume per unit area (m3/ha). Aboveground biomass (Mg/ha) was converted from stand volume using the Continuous Biomass Expansion Factor Method by using the following Equation (2), as prescribed in the National Technical Guidelines for Forest Carbon Sink Monitoring and Accounting (Trial) [42].
W = a V + b
where W represents biomass of the tree layer; V represents standing timber volume; and a, b represent biomass conversion parameters. The specific values are shown in Table A3 [42].
Biomass of scattered trees and shrubs was calculated per individual using biomass equations [43] (see Table A4), then converted to per-unit-area biomass at the plot level.
Herb and litter layers employed direct harvesting: all herb plants within quadrats were collected for fresh mass measurement. Within each tree-layer plot, a 1 m × 1 m subplot was established for stratified litter collection according to standardized horizon classification (L: undecomposed; F: semi-decomposed; H: decomposed layers) [44]. Samples were oven-dried at 80 °C to constant mass, with moisture content determined gravimetrically. This temperature was selected to avoid the thermal decomposition of labile organic compounds (i.e., resins in coniferous species), ensuring an accurate measurement of biomass and subsequent C content estimation [45,46]. Dry matter mass per square meter was then extrapolated to estimate area-based community biomass.
Biological parameters quantified in this study encompass: shrub coverage (SC), average height of shrubs (AHS), herb coverage (HC), average height of herbs (AHC), total vegetation coverage (TVC), number of plants (NP), plant density (PD), average dominant height (AAH), average diameter at breast height (DBH), average diameter at breast height (TH), canopy density (CD), total volume (TV), tree layer volume (TSV), tree layer biomass (TB), shrub layer biomass (SB), herb layer biomass (HB), litter layer biomass (LB), Shannon–Wiener’s diversity index (SI).

2.2.3. Sample Collection and Analysis

Plant samples, including leaves, branches, stems, roots, and litter, were collected, respectively, from the tree, shrub, and herb layers within the survey plots. These samples of the same layer were uniformly mixed and then subjected to the determination of plant organic C content via the potassium dichromate concentrated sulfuric acid oxidation method (following the procedure outlined in the Chinese National Standard GB/T 42490-2023 [47]).
Each tree layer quadrat was divided into 3 equal grids of cells along the diagonal for soil sampling. Soil samples were taken by using cylindrical cores with a volume of 200 cm3 collected at depths of 0–20 cm in April to October 2022. Soil samples from three cells within a quadrat were mixed into a composite sample. Plant roots, debris, and gravel were cleared. Soil samples were air-dried and sieved through a 2 mm mesh for soil pH and particle composition; and through a 0.25 mm mesh for soil SOC, total nitrogen (N), total phosphorus (P), total potassium (K), total calcium (Ca), total sulfur (S), total manganese (Mn), total iron (Fe), total copper (Cu), and total zinc (Zn) determinations. The following properties were determined in the soil samples:
(1) Quantification of soil particle composition across particle-size classes was performed via ultrasonic-assisted dispersion using an ultrasonic bath (frequency: 40 kHz; power: 200 W; Merck, Darmstadt, Germany), followed by wet sieving and centrifugation fractionation [48]. Divided by particle size into clay particles (<2 um, PS1), powder particles (2–50 um, PS2), and sand particles (>50 um, PS3); (2) bulk density (BD) was calculated using weights of the dried soil sample from the known cylindrical core volume, and soil moisture (SM) was determined by the oven-drying method at 105 °C; (3) pH value was analyzed in a soil-to-water (deionized) ratio of 1:2.5 using a pH meter (FE20, Mettler Toledo, Zurich, Switzerland); (4) SOC content was determined by the K2Cr2O7–H2SO4 oxidation method [48]; (5) N content was determined using a semi-micro Kjeldahl method [49]; (6) P, K, Ca, S, Mn, Fe, Cu and Zn were extracted via aqua regia and 1:1 HCl. After extraction, P was determined by spectrophotometry and K, Ca, S, Mn, Fe, Cu, and Zn via atomic emission spectrometry with inductively coupled plasma (ICP–OES) using a Perkin Elmer Optima 7300DV optical emission spectrometer (PerkinElmer, Waltham, MA, USA) [50].
Among the non-biological factors, we also accounted for the influences of air temperature (AT) and precipitation (PRCP). The corresponding data for each sampling site were extracted from a 1 km monthly mean temperature dataset for China (1901–2023) [51] and a 1 km monthly precipitation dataset for China (1901–2023) [52], respectively.

2.2.4. Statistical Analysis

The C storage of vegetation layers (tree layer, shrub layer, herb layer) and the litter layer was estimated based on their C content and biomass, by using Equations (3) and (4).
W V = C V × B V 10 6
W L = C L × B L 10 6
where WV and WL represent the C storage of vegetation layers and litter layers, CV and CL represent the C content of vegetation layers and litter layers, and BV and BL represent the biomass of vegetation layers and litter layers, respectively. The total C storage in the vegetation layer is the sum of the C storage in the tree layer, shrub layer, herb layer, and litter layer.
The C storage in the soil layer was estimated based on soil SOC content, BD, and soil layer thickness using Equation (5).
W S = C S × B D × D 10
where WS represents soil layer C storage, CS represents soil layer SOC content, BD represents the soil layer bulk density, and D represents soil layer thickness.
The Shannon–Wiener index was employed to assess plant species diversity in each plant community, calculated as Equation (6).
S I = i = 1 n P i ln P i
where n represents the total number of species, and Pi represents the relative abundance of the i-th species within the community.
We used the Microsoft Excel package (Office 2010) to calculate the mean and standard deviation of various indicators and perform routine calculations. We used the ggplot2 [53] package in R software (R version 4.4.3) [54] to plot the changes in C storage in vegetation vertical structure, and the tidyverse [55] and ggplot2 [53] packages to plot the changes in soil layer C storage. A one-way analysis of variance (ANOVA) was conducted to determine the effect of forest type on soil organic C storage. Significant differences (p < 0.05) among groups were further examined using a post hoc test (i.e., Tukey’s HSD). Using ggplot2 [53] and randomForest packages [56] to draw heat maps and contribution maps of vegetation and soil C storage with biotic and abiotic factors. Structural equation modeling (SEM) was constructed using the piecewiseSEM package [57] in R to further examine the synergistic effects of biological and non-biological factors on the variation in C storage. The Figure of SEM results for key factors and C storage was plotted by the ggplot2 [53] and patchwork [58] packages of R software. We analyzed the impact of biological factors, non-biological factors, and their interactions on forest total C storage by using vegan [59] and tidyverse [55] packages. Forest growth stages within each of the five forest categories (EBF, MEDBF, DBF, MNBF, CF) were categorized into 5 age cohorts at decadal intervals: juvenile (<10 years), middle-aged (10–20 years), near-mature (20–30 years), mature (30–40 years), and over-mature (>40 years). The classification was based on the growth characteristics of major tree species and stand development patterns in the subtropical region. Since all dominant tree species across these forest types are moderate-growth species, a uniform 10-year interval was adopted for age class classification across all categories. These decadal intervals reflect significant changes in biomass accumulation, canopy structure, and ecosystem functionality across successive stages of forest development. This approach aligns with widely used forest age class categorization systems in national forest inventories and ecological studies [60], allowing for better comparability across regions and studies. Age-dependent C storage trajectories were modeled using Random Forest regression with bootstrap aggregation. The model was established using the randomForest package [56] of R, and the plotting was performed using the ggplot2 package [53] in R software. During the preparation of this study, the authors used Deepseek version 3.2 for the purposes of assisting in language polishing and improving the readability of the Section 1 and Section 4. The authors have reviewed and edited the output and take full responsibility for the content of this publication.

3. Results

3.1. Changes in C Storage and Vertical Distribution Patterns of Different Forest Types

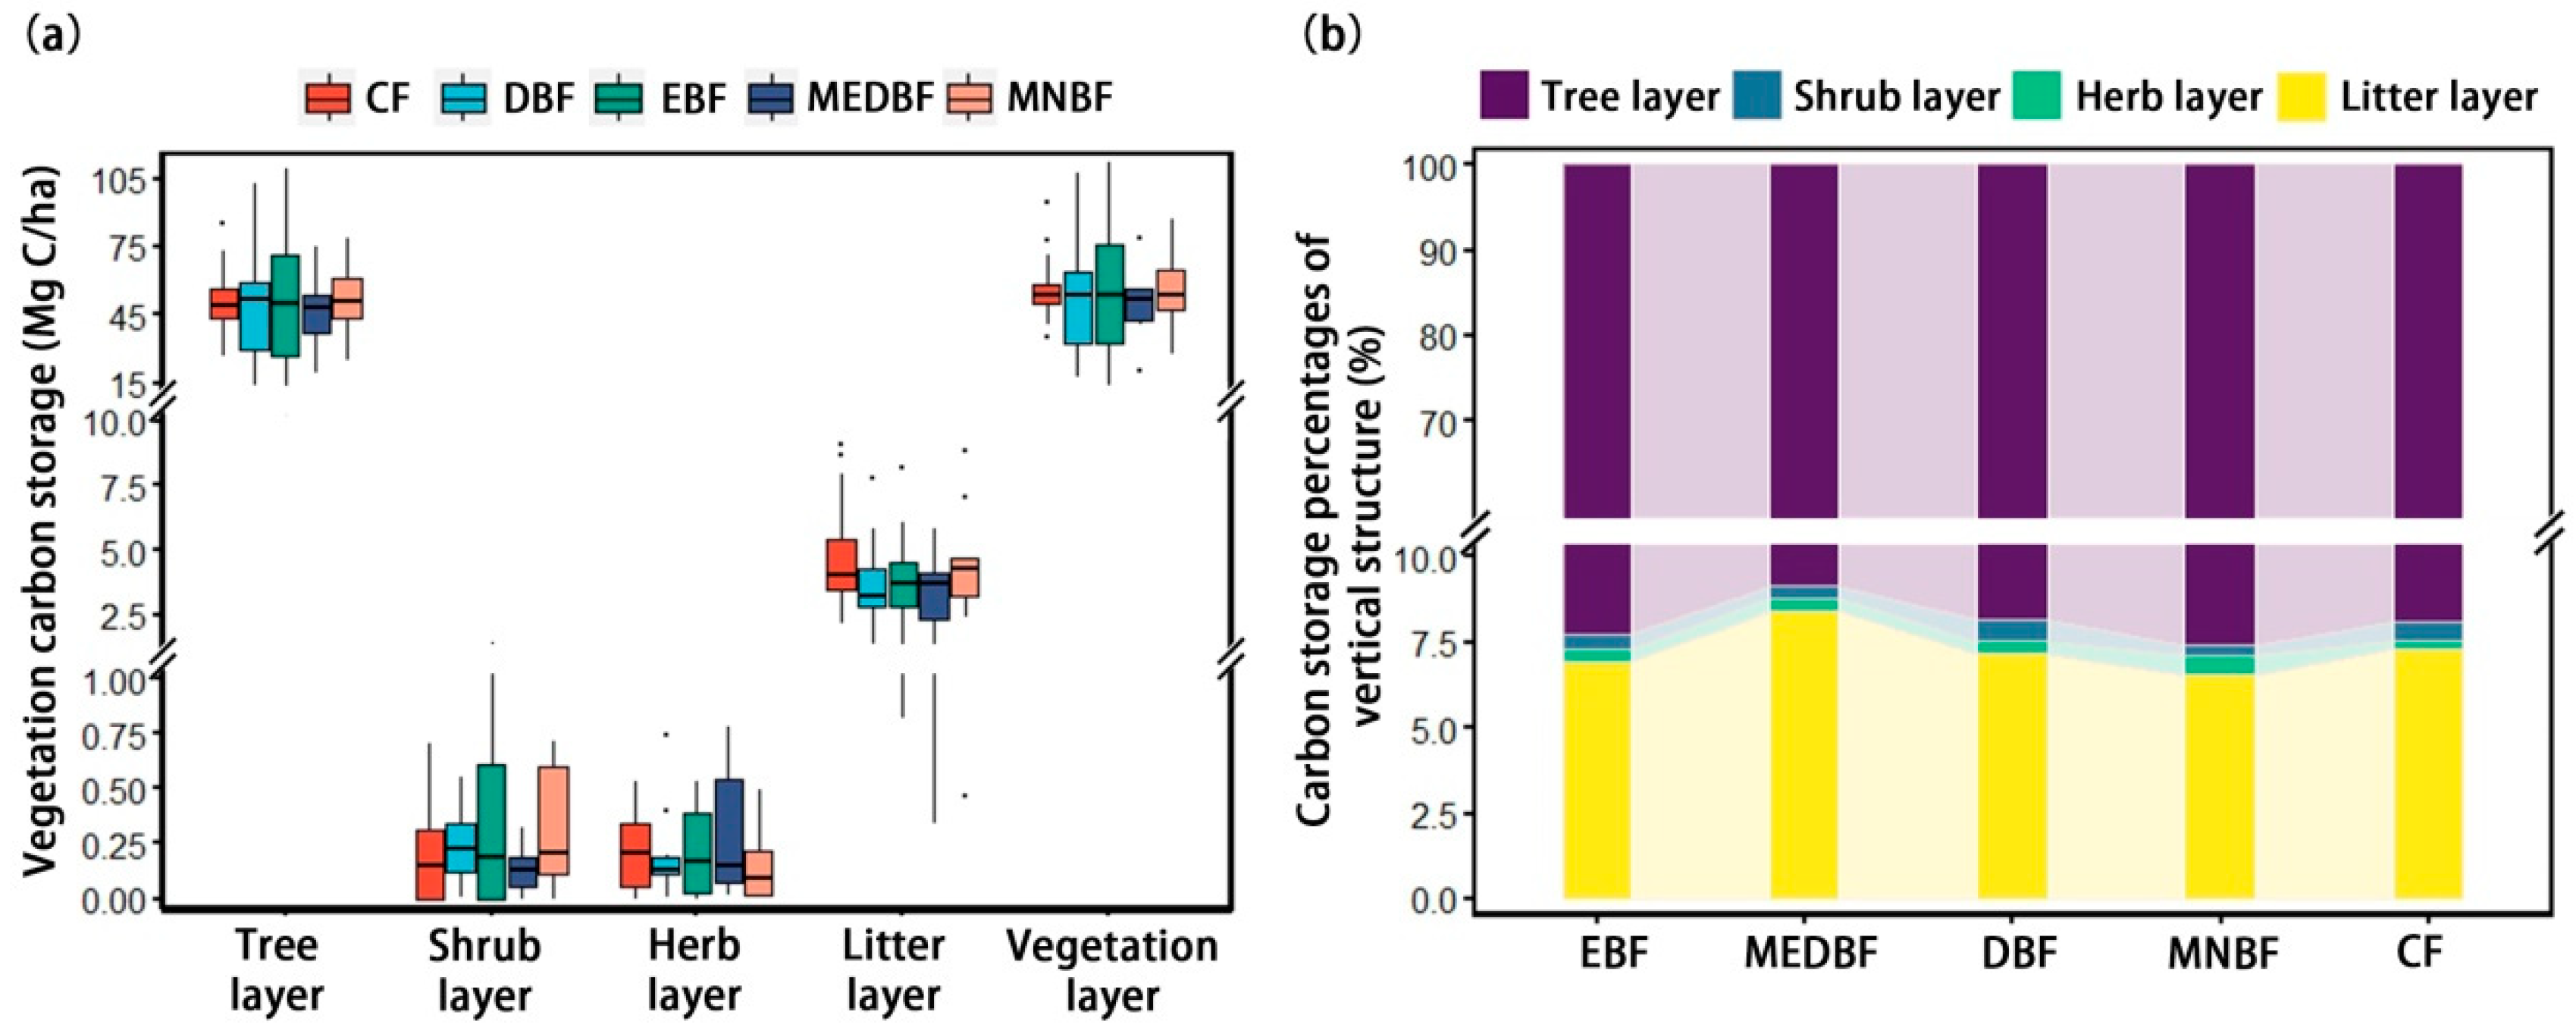
Vegetation layer C storage exhibited variations across different forest types, with an average value ranging from 50.20 to 56.71 Mg C/ha; however, these differences were not statistically significant (p > 0.05) (Figure 2a). Based on the data distribution depicted in the boxplots, DBF and EBF exhibit greater variability in C storage, indicating substantial heterogeneity in C stores across sampling plots for these forest types (Figure 2a). In terms of vertical distribution patterns, C storage varied significantly among different layers within the same forest type. All forest types exhibited a consistent trend: the average C storage of the tree layer had the highest values (46.49–52.11 Mg C/ha), accounting for over 90% of the total vegetation C pool across all forest types; followed by the litter layer (3.28–4.74 Mg C/ha), which comprised approximately 6–9% of the total; while the shrub layer and herb layer displayed much lower values (0.13–0.35 Mg C/ha and 0.14–0.30 Mg C/ha, respectively) together representing less than 1% of total vegetation C storage (Figure 2a,b). Based on the spatial distribution of data, substantial heterogeneity was observed in C storage across sampling plots for the tree layer in DBF and EBF, shrub layer in EBF and MNBF, and herb layer in EBF and MEDBF (Figure 2a). Overall, the C stratification of different forest types is pronounced, that is, more than 90% of vegetation C resides in the tree layer. Non-tree layers (shrub and herb layers) contribute minimally to total C, underscoring the critical role of canopy trees in C sequestration.
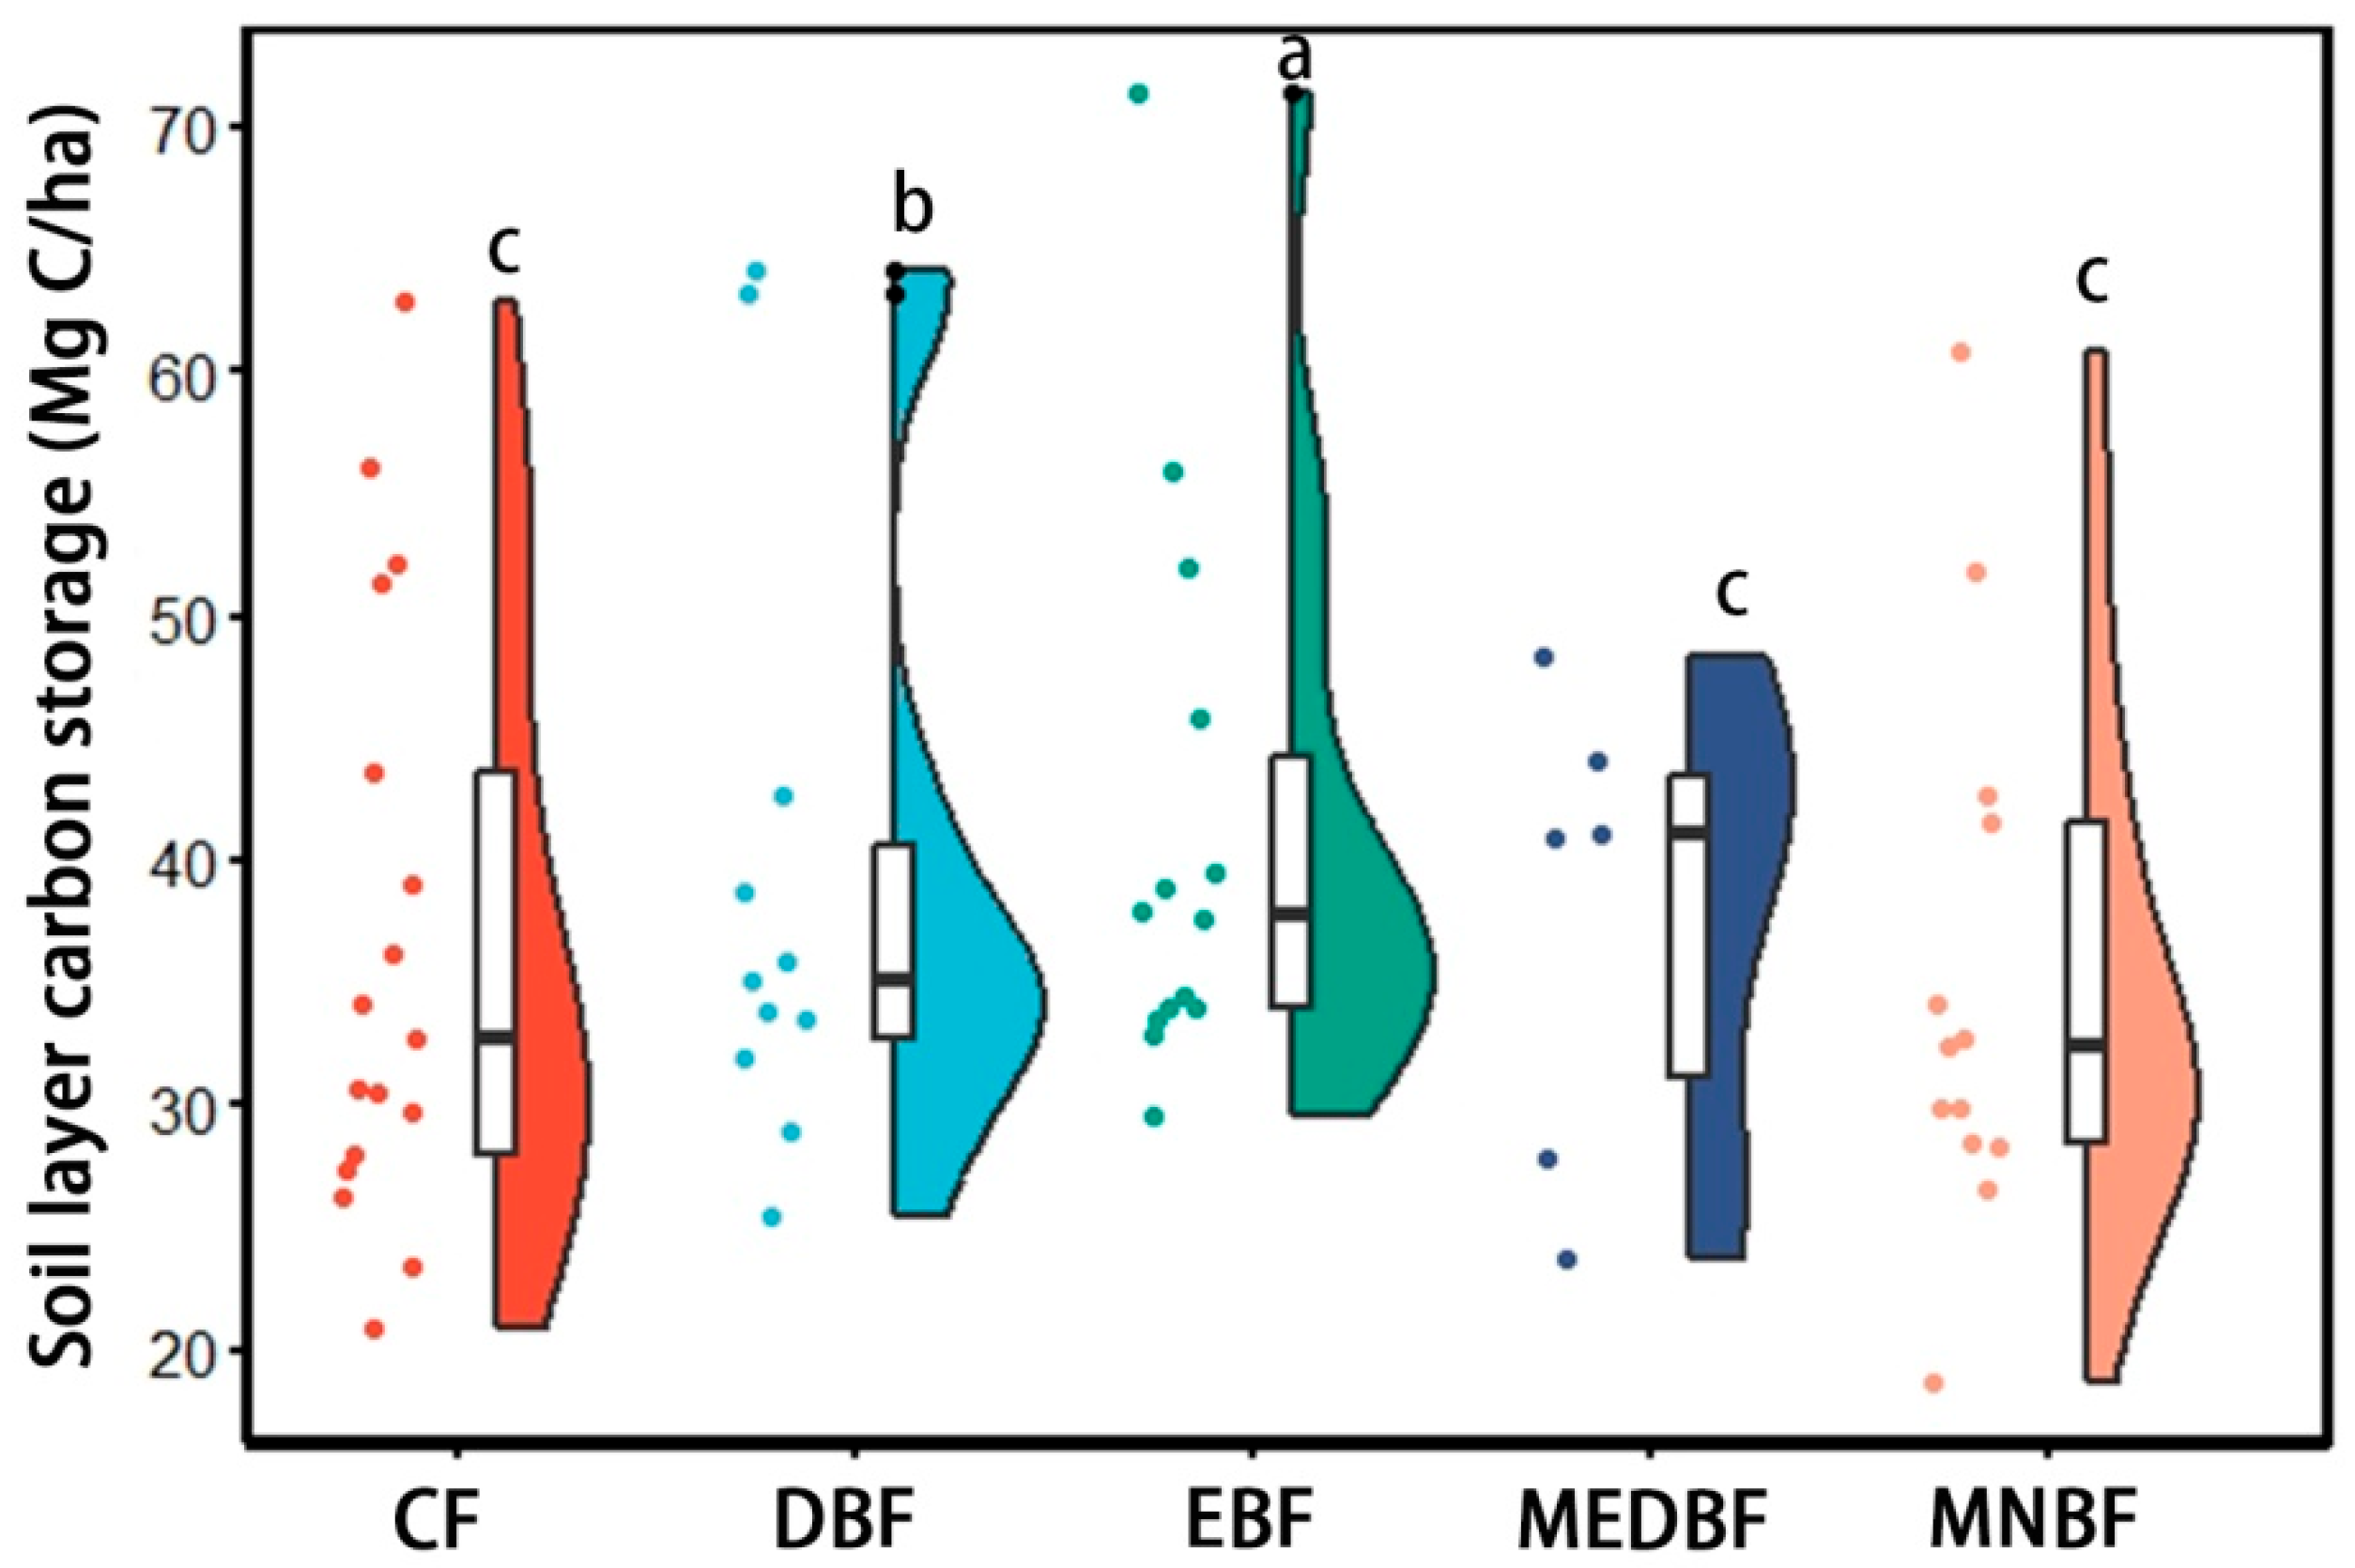
In the soil layer, EBF exhibited a significantly higher average C storage (41.26 Mg C/ha) compared to other forest types (p < 0.05). DBF ranked second (39.39 Mg C/ha), while MEDBF (37.70 Mg C/ha), MNBF (35.26 Mg C/ha), and CF (36.79 Mg C/ha) demonstrated lower values with no significant differences among them (Figure 3). Based on the schematic representation of Figure 3, with the exception of MWDBF, soil C storage across other forest types exhibited high dispersion in sample data distribution. Most datasets demonstrated asymmetric distributions with values dispersed away from the median, reflecting pronounced spatial heterogeneity in soil C sequestration patterns (Figure 3).

3.2. Biological Factors Influencing C Storage of Vegetation and Soil in Different Forest Types

Biological factors exhibited varying capacities to explain C storage heterogeneity for different layers (Figure 4). TV, TVC, TH, and TB consistently accounted for the highest importance (more than 20%) in C storage of the tree layer and vegetation layer for all forest types, and showed a significant positive effect, highlighting their critical role in driving C allocation in the vegetation layer. SB showed high explanatory power (importance more than 50%) in shrub layer C storage, reflecting their direct positive linkage to aboveground C accumulation. HC and HB exhibited strong positive associations with herb layer C storage, accounting for over 50% of the importance. Strong positive associations were observed between LB and C storage of litter layer, and displayed high importance (importance more than 60%).
The cumulative influence of biological factors on vertical C distribution varies significantly across forest types. In EBF, biological factors exerted the strongest total effect on tree layer C storage (total explained variance: 52.03%), followed by vegetation layer C storage (49.17%). Moderate effects occurred on the herb layer (37.28%), shrub layer C storage (27.14%), and litter C storage (14.35%), with minimal influence on soil layer C storage (1.96%) (Figure 4a). By comparison, the influence of biotic factors on MEDBF was generally weaker, with their main effects observed on C storage in the tree layer (11.62%) and vegetation layer (11.68%) (Figure 4b). Biological factors exerted pronounced effects on the tree layer (35.34%), shrub layer (35.19%), and integrated vegetation layer C storage (33.59%) in DBF. Moderate positive mediation characterized litter layer (22.26%) and soil layer C storage (15.40%), whereas herb layer C storage exhibited the weakest influence (4.59%) (Figure 4c). The C storage of the tree layer (44.88%) and vegetation layer (41.80%) in MNBF had been highest effects by biological factors. Secondary modulation occurred in the herb layer (32.66%), shrub layer (27.06%), and litter layer C storage (14.07%), while soil litter layer C storage exhibited a marginal effect (7.82%) (Figure 4d). In CBF, biological factors demonstrated paramount positive explanatory capacity for shrub layer C storage (46.48% explained variance). This was succeeded by tree layer C storage (39.63), integrated vegetation layer C storage (38.97%), herb layer C storage (38.83%), litter layer C storage (24.14%), and soil layer C storage (9.99%) (Figure 4e).

3.3. Effects of Non-Biological Factors on C Storage of Vegetation and Soil in Different Forest Types

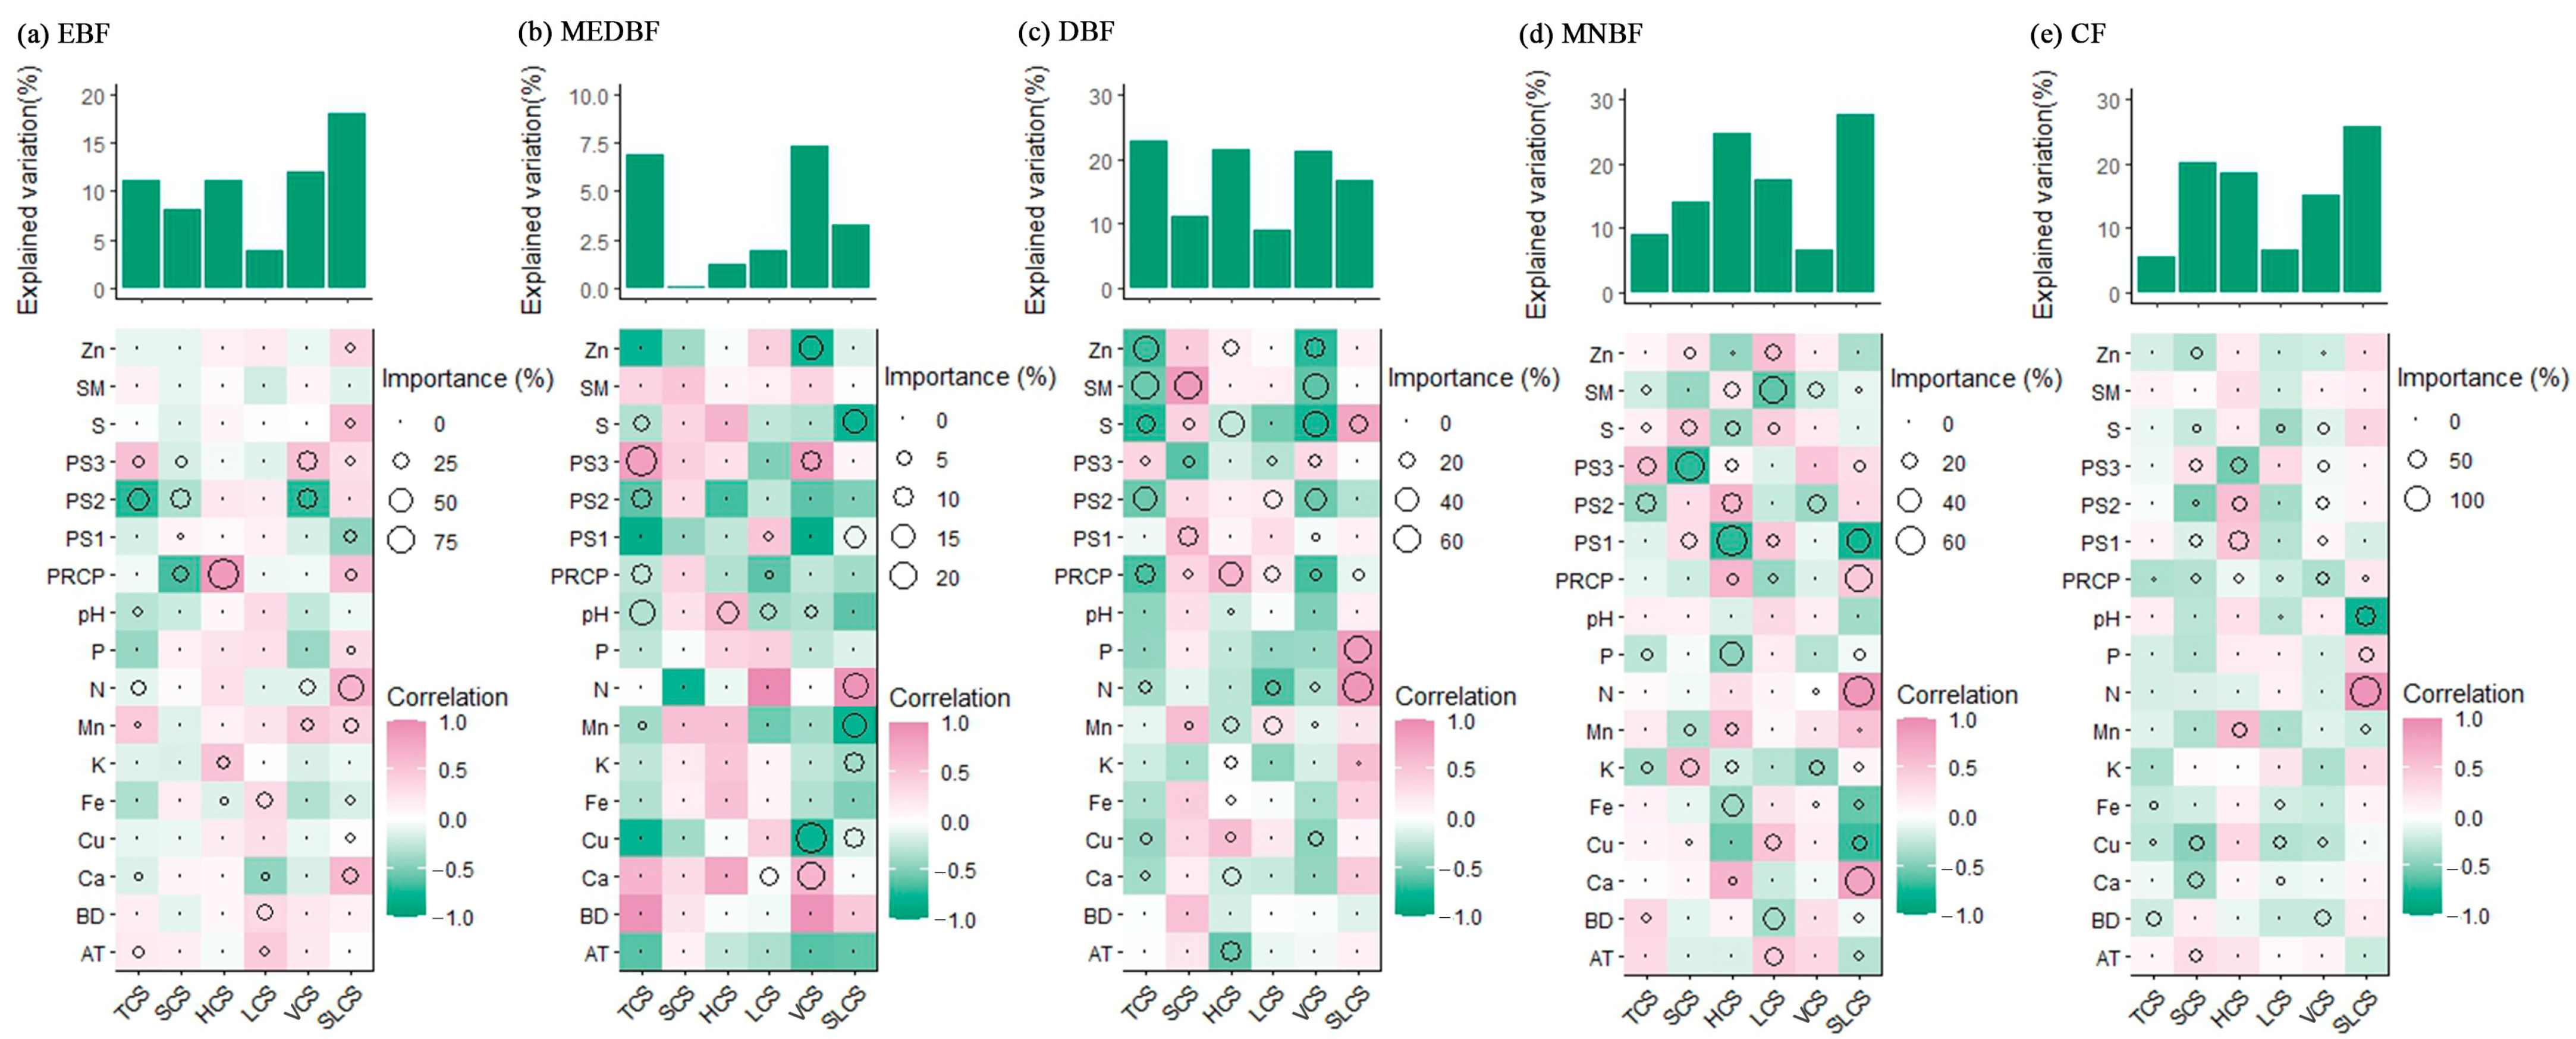
Non-biological factors exhibited divergent capacities to explain C storage heterogeneity (Figure 5). Collectively, soil texture parameters (PS1, PS2, PS3), precipitation, and N availability constituted a primary regulatory mechanism governing C storage across the vegetation layer and soil layer in different forest ecosystems. Moreover, Mn, Ca, and air temperature emerged as principal regulators mediating stratified C storage within EBF. Vertical C distribution in MEDBF demonstrated multivariate control dominated by S, pH, Cu, and Ca. Vertical C allocation in DBF was predominantly regulated by geochemical drivers, with Zn, soil moisture, S, P, Mn, Cu, and Ca constituting principal modulators across layers. MNBF exhibited C storage dynamics primarily governed by Zn, soil moisture, S, P, Mn, K, Fe, Cu, BD, air temperature, and Ca concentrations. In CF, soil organic C storage across different layers was significantly associated with fluctuations in S, pH, Mn, Cu, Ca, and BD.
The cumulative effects of non-biological factors on C storage exhibited significant heterogeneity across forest types. In EBF, non-biological factors exhibited limited explanatory power for litter layer C storage (3.92%), but demonstrated moderate effects on the tree layer (11.01%), shrub layer (8.14%), herb layer (11.15%), and integrated vegetation layer (12.01%) C storage. Soil layer C storage showed the highest sensitivity to these factors (18.10%) (Figure 5a). Non-biological factors exhibited the strongest explanatory power for vegetation layer (7.36%) and tree layer (6.85%) C storage in MEDBF, with minimal effects on shrub layer (0.05%), herb layer (1.27%), litter layer (1.92%), and soil layer (3.31%) C storage (Figure 5b). In DBF, non-biological pronounced influences modulated tree layer (22.75%), herb layer (21.55%) and vegetation layer C storage (21.25%), while moderate explanatory was also observed for shrub layer (11.10%), litter layer (9.07%) and soil layer C storage (16.60%) (Figure 5c). Non-biological factors exerted pronounced effects on the soil layer (27.62%), herb layer (24.59%), litter layer (17.59%) and shrub layer (14.02%) in MNBF. Other layers’ C storage exhibited limited responsiveness (<10% explained variance) (Figure 5d). All layers’ C storage of CF, except the tree layer and litter layer, showed pronounced abiotic sensitivity. Soil layer C storage manifested paramount susceptibility (25.70%), succeeded by shrub layer C storage (20.17%) (Figure 5e).

3.4. Synergy Effects of Biological and Non-Biological Factors on the Variation in C Storage of Different Layers

The structural equation modeling (SEM) results (Figure 6) elucidate the direct and indirect pathways through which key biological and abiotic factors influence C storage across forest types, as assessed by Fisher’s C statistic and associated p-values. The non-significant p-value (p > 0.05) aligns with established thresholds for SEM, where higher p-values reflect better alignment between theoretical constructs and empirical covariance structures [61]. Most models exhibited good fit to the data, with non-significant Fisher’s C values (p > 0.05) across scenarios (a: C = 8.67, p = 0.13; b: C = 0.11, p = 0.95; c: C = 0.76, p = 0.68; f: C = 0.68, p = 0.71). This indicates that the hypothesized relationships among variables align well with observed data. Models (d: C = 4.53, p = 0.10; e: C = 6.31, p = 0.06) approached significance thresholds, suggesting minor discrepancies, potentially due to unaccounted interactions.
The SEM demonstrated robust explanatory capacity for the variation in C storage, with R2 = 0.54–0.99 (Figure 6), indicating that above 50% of the variance in C storage was accounted for by a combination of biological and non-biological factors. The biological factors exhibited strong positive direct effects on C storage in the tree layer, shrub layer, herb layer, litter layer and vegetation layer, with coefficients of 0.75, 0.68, 0.58, 0.99 and 0.99, respectively (Figure 6a–e). Nevertheless, non-biological factors predominantly exerted positive indirect effects on the C storage of these layers, with standardized path coefficients of 0.66, 0.44, 0.48, 0.42, and 0.67, respectively (Figure 6g). Conversely, soil layer C storage exhibited a predominant and direct association with non-biological factors (coefficients of 0.91) (Figure 6f).
The heterogeneity in C storage of the shrub layer, herb layer, vegetation layer and soil layer across forest types was predominantly mediated by negative indirect effects stemming from biological and non-biological factors, with coefficients of −0.15, −0.03, −0.13 and −0.10 (Figure 6b,c,e,f). By contrast, the variation in C storage of the tree layer and litter layer across forest types was regulated by positive indirect effects of biological and non-biological factors (coefficients of 0.07 and 0.09) (Figure 6d).
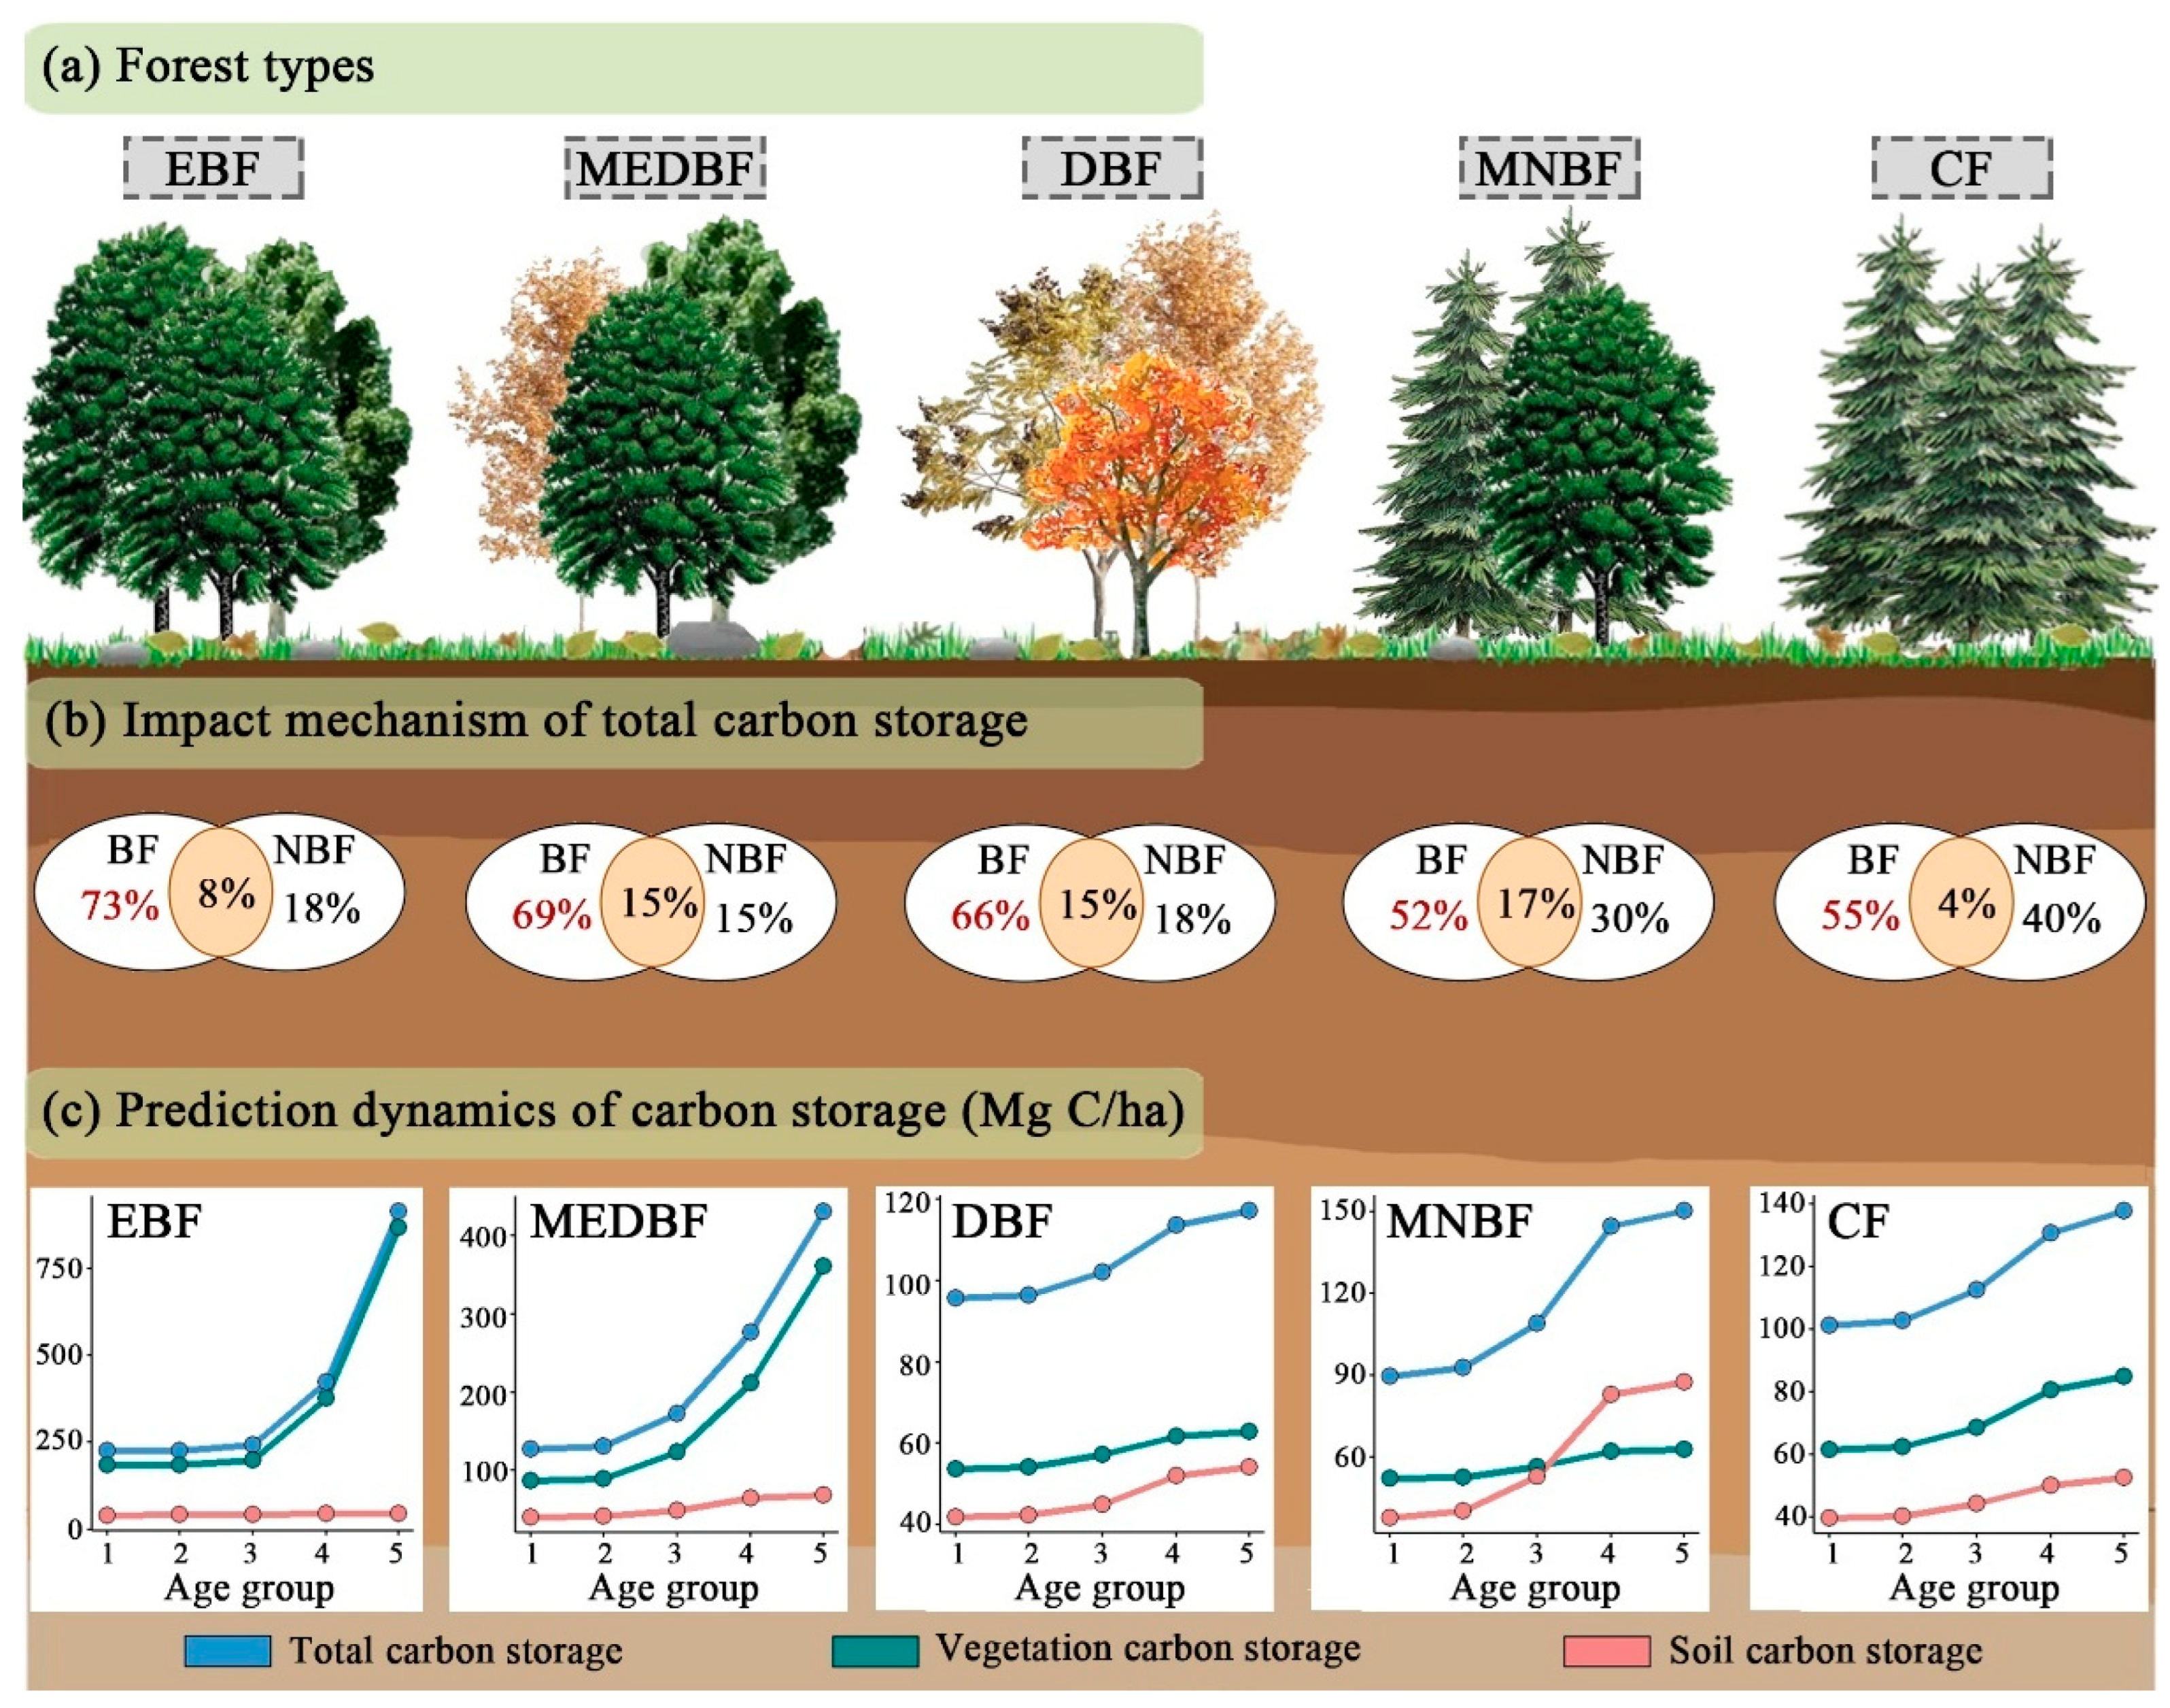
The schematic diagram (Figure 7b) synthesizes the effects of biological and non-biological factors on C storage across forest types. Biological factors accounted for 52–73% of total C storage variability, with the highest contributions observed in EBF (73%) and MEDBF (69%), underscoring their pivotal role in C sequestration. Non-biological drivers explained 15–40% of C storage variability. Their influence peaked in coniferous forests (CF: 40%) and mixed needle leaf-broadleaf forests (MNBF: 30%), where cold climates and acidic soils amplify physicochemical constraints on decomposition and root growth. In MEDBF, DBF and MNBF, synergy effects accounted for 15–17% of variability, revealing that the remaining variation is attributable to other drivers or interactions. These patterns highlight the complex interplay between biological and non-biological processes in governing forest C dynamics.

3.5. Prediction Dynamics of C Storage with Age Group

Utilizing the Random Forest algorithm, an integrated machine learning approach, a dynamic model was constructed to elucidate the relationship between key drivers and C storage. This model simulated the evolution of C storage across major forest types along chronosequences (Figure 7c). Total C storage exhibited distinct accumulation patterns among forest types. In EBF and MEDBF, total C storage followed a characteristic J-shaped curve, demonstrating: (1) modest growth rates from juvenile to near-mature stages, and (2) exponential acceleration from near-mature to elderly stages. Conversely, DBF, MNBF, and CF displayed sigmoidal (S-shaped) accumulation curves featuring: (1) rapid C sequestration during early establishment phases, (2) moderated accumulation in near-mature stands, and (3) asymptotic stabilization in aged forests. Vegetation-layer C dynamics mirrored total storage patterns in EBF and MEDBF, maintaining the J-curve trajectory. DBF and MNBF vegetation C accumulated more gradually, peaking at maturity. CF vegetation C exhibited sigmoidal accumulation with maximal sequestration during mature phases and plateauing in senescence. Soil C storage revealed ecosystem-specific patterns. EBF and MEDBF soils showed delayed accumulation, lagging behind vegetation C sequestration. DBF and CF soils demonstrated steady, linear accumulation. MNBF displayed unique partitioning: balanced vegetation-soil distribution in near-mature stands, with soil C ultimately dominating in later stages. Across all age classes except MNBF, vegetation C constituted the dominant pool, highlighting its primary role in forest C budgets.

4. Discussion

4.1. Spatial Heterogeneity and Vertical Stratification of C Storage Between Forest Types

Our study reveals substantial yet non-significant variations in vegetation C storage across forest types (50.20–56.71 Mg C/ha; p > 0.05), consistent with findings in subtropical forests where stand age often overrides forest type effects [62]. Notably, DBF and EBF exhibited pronounced spatial heterogeneity in vegetation C (Figure 2), likely attributable to patchy disturbance regimes and microtopographic complexity [63,64]. The vertical stratification of C was unequivocal: >90% of vegetation C resided in the tree layer (46.49–52.11 Mg C/ha), while shrub (0.13–0.35 Mg C/ha) and herb layers (0.14–0.30 Mg C/ha) contributed minimally (<1% combined). This aligns with global syntheses confirming canopy dominance in forest C pools [24], underscoring that C sequestration strategies must prioritize canopy integrity. Non-tree layers, despite their marginal C role, warrant conservation due to their biodiversity value [65]. Soil C patterns diverged markedly: EBF stored significantly more C (41.26 Mg C/ha) than other types (p < 0.05), attributable to its slower decomposition rates and higher clay content stabilizing organic matter [66,67]. The pronounced spatial heterogeneity in soil C storage (Figure 3) implicates covarying regulation by vegetation structural complexity (i.e., TV, TSV, TH, and TB) and edaphic nutrient gradients (i.e., N and P), particularly pronounced in EBF and DBF. The pronounced heterogeneity observed in SOC dynamics across spatial scales carries significant implications for terrestrial C sequestration potential [68].

4.2. Biological and Non-Biological Regulation of Stratified C Allocation

Our analysis delineates distinct biological drivers governing C allocation across forest strata (Figure 4). The consistent dominance of tree structural traits (TV, TVC, TH, TB) in explaining >20% of tree layer and vegetation layer C storage (p < 0.05) underscores their universal role in canopy C sequestration, aligning with trait-based allocation theory [69]. Notably, shrub and herb layers exhibited strong dependence on organic substance metrics (SB, HC, HB; >50% importance), reflecting niche differentiation in understory C capture [70]. Litter C was primarily controlled by litter biomass (LB; >60% importance), consistent with decomposition-complexity relationships [71].
The intensity of biological mediation varied markedly by forest type. Strongest control occurred in EBF (52.03% of tree-layer variance), with DBF and MNBF also showing significant effects (35.34% and 44.88%, respectively), likely due to complex canopy structures enhancing carbon retention [23]. MEDBF exhibited weak biological influence (<12% across layers), whereas CF showed pronounced shrub-layer regulation (46.48% variance). Soil carbon was minimally affected by biological factors (<10% variance, except DBF at 15.40%), indicating limited direct biotic control. The exceptional explanatory power of biological factors on herb-layer C storage in MNBF (32.66% variance) may reflect suppressed competition in mixed forests [72]. These stratified controls highlight that biodiversity–C relationships are layer-contextual and forest-type-specific, necessitating ecosystem-stratified management.
Edaphic and climatic factors further shaped carbon stratification (Figure 5). Soil texture, precipitation, and nitrogen availability acted as universal controllers, while metallic micronutrients (Zn, Mn, Cu) and macronutrients (S, Ca, P, K) exerted forest-type-specific roles, implicating their involvement in biogeochemical cycles [73,74,75]. Furthermore, climate factors, particularly air temperature and soil moisture, exerted critical controls on C dynamics: air temperature emerged as a key modulator in both EBF and MNBF, likely influencing microbial activity and decomposition rates, while soil moisture served as a principal regulator in DBF and MNBF, potentially affecting nutrient diffusion, root growth, and heterotrophic respiration [76,77]. The synergistic effects of these climate drivers with soil properties underscore the multidimensional nature of abiotic control on forest C storage.
Interestingly, the explanatory power of non-biological factors varied markedly across forest strata and types. Non-biological factors showed substantial explanatory power for vegetation-layer C storage in DBF (21.25%) and EBF (12.01%), highlighting their direct effects on plant growth through climate, nutrient availability and soil physical properties. In EBF, DBF, MNBF and CF, they exerted a strong influence on tree, shrub and herb layers, suggesting comprehensive abiotic control throughout the vegetation profile. In contrast, MEDBF showed generally weak non-biological effects (<8% across all layers), indicating stronger biological dominance in this forest type. Non-biological factors exhibited particularly strong control over soil C storage in MNBF (27.62% explained variance) and CF (25.70%), indicating pronounced mineral protection and physicochemical stabilization mechanisms in these systems [78]. CF’s demonstrated sensitivity to variations in S, pH, Mn, Cu, Ca and BD further supports the importance of geochemical buffering and metal–organic complexation processes [79]. These findings establish edaphic filtering as a core principle in stratified C management, particularly for forests where non-biological factors explain >20% of C storage variability (i.e., DBF, MNBF, and CF). The forest-type-specific patterns of abiotic control emphasize the need for tailored management strategies that consider local soil geochemistry and climatic conditions.

4.3. Integrated Biotic–Abiotic Controls on C Allocation

SEM revealed hierarchical regulation of carbon storage across forest strata, demonstrating fundamental asymmetries in biotic versus abiotic control mechanisms. The robust model fit (Fisher’s C = 0.06–8.67, p > 0.05; R2 = 0.54–0.99) validates our conceptual framework and aligns with established trait–environment interaction theories [80,81].
The strong direct effects of biological factors (path coefficients: 0.58–0.99) on vegetation-layer C storage corroborate global patterns of biomass-driven C sequestration [82]. Evergreen forests (EBF and MEDBF) showed the strongest biotic control (75% and 69% variance explained), consistent with leaf longevity enhancing carbon accumulation efficiency [83], reflecting long-term biomass accumulation through lignified tissue production of evergreen species. The attenuated biotic influence in DBF (66%) and MNBF (53%) reflects phenology-mediated constraints: seasonal litterfall accelerates organic matter mineralization, reducing plant-driven C stabilization [84]. Furthermore, synergy effects between biotic and abiotic drivers accounted for 15–17% of variability in MEDBF, DBF and MNBF, highlighting the importance of interactive pathways in ecosystem functioning (i.e., C storage) of these forests [85].
In contrast, soil carbon storage showed predominant abiotic control (path coefficient = 0.91), with climate and soil properties explaining 11–27% of variability across forest types. This dominance aligns with the concept, where edaphic properties gatekeep C stabilization via mineral association [86,87,88]. The elevated abiotic influence in coniferous systems (CF: 40%; MNBF: 30%) underscores acidification-driven constraints: low pH inhibits microbial processing while enhancing organo-metal complexation, creating Fe and Al oxide-mediated C sinks [89].
The negative indirect effects (−0.03 to −0.15) governing shrub, herb, vegetation and soil C heterogeneity reveal not only competitive resource allocation but also potential underlying antagonisms between biotic and abiotic drivers. Tree-layer biomass expansion limits light and nutrient availability for understory strata, suppressing shrub and herb C storage (Figure 6b,c,e,f) [90]. Beyond direct competition, the observed negative indirect pathways suggest that biological processes (i.e., tree growth) may exacerbate abiotic constraints, or conversely, that harsh abiotic conditions may limit the positive expression of biological drivers. For instance, in resource-limited environments, high tree biomass could intensify nutrient competition, reducing the beneficial effects of soil fertility on understory C storage [91]. Alternatively, in highly disturbed or fragmented stands, strong abiotic filters (i.e., microclimate extremes, compacted soils) might prevent the full realization of biodiversity-driven C sequestration benefits [92]. This interplay creates a cross-forest heterogeneity where the same biological factor (i.e., stand density) can have contrasting effects on C storage depending on the local abiotic context (i.e., soil nutrient status, potential anthropogenic influences). Furthermore, the negative indirect effect on soil C (−0.10) implies that biological factors promoting aboveground biomass may sometimes accelerate soil organic matter decomposition via priming effects or shifts in microbial community composition [93], particularly in forests with high turnover rates. These complexes, antagonistic interactions highlight that C management must consider not only the direct but also the indirect and often counterintuitive pathways through which biological and non-biological factors jointly shape ecosystem C stores. Conversely, the positive indirect effects on tree and litter layer C (coefficients of 0.07 and 0.09, respectively) signify synergistic interactions where biological activity and abiotic conditions enhance C accumulation in these compartments [94]. These findings collectively underscore the multidimensional and forest-type-specific nature of C storage regulation in subtropical ecosystems.

4.4. Age-Modulated C Trajectories and Partitioning

Our Random Forest simulations reveal fundamental divergences in C accumulation pathways across subtropical forest types, mainly manifested between broad-leaved forests and coniferous forests. The J-shaped trajectory in EBF and MEDBF is characterized by delayed exponential growth post-maturity, which aligns with documented patterns in late-successional systems where canopy complexity amplifies C sequestration efficiency [23]. This contrasts sharply with the sigmoidal accumulation in DBF, MNBF, and CF, where rapid early-stage biomass accumulation reflects resource-acquisitive strategies [95], followed by progressive stabilization as nutrient limitations constrain productivity in aged stands [96].
Notably, the decoupling between vegetation and soil C pools observed in EBF and MEDBF, where soil C lagged vegetation accumulation, supports the “priming effect” hypothesis: sustained litter inputs from mature trees enhance microbial necromass formation, gradually building mineral-associated organic C reservoirs [97]. Conversely, the linear soil C accrual in DBF and CF signifies weaker biotic–abiotic coupling, likely due to faster organic matter turnover in deciduous systems [84] and inhibitory acidic conditions in coniferous soils [98].
The paradigm shift in MNBF from balanced vegetation-soil C distribution in near-mature stands to soil-dominated pools in late stages constituted a novel finding. We attribute this to the following: (1) Deep-rooted broadleaves (i.e., Quercus) transport dissolved organic C to subsoil horizons, while conifer fine roots stabilize surface C [35,36]. (2) Combined needle and broadleaf litter enhances humification and organo-mineral associations at depth [38]. (3) Ectomycorrhizal fungi in mixed stands promote aggregate formation, reducing heterotrophic respiration losses [37]. These mechanisms explain MNBF’s exceptional late-stage soil C dominance—a pattern unreported in other subtropical forests and contradicting global meta-analyses that prioritize vegetation C [6,99]. This underscores the necessity of forest-type-specific C models, as generalized assumptions [4] (i.e., fixed 40–60% soil C contributions) fail to capture dynamic partitioning.

4.5. Comparison of C Stores and Drivers Between Urban Buffer and Natural Forests

Our findings in the CZT-GHD urban-agglomeration forests reveal both parallels and distinctions when compared to natural subtropical forests reported in the literature. The vegetation C storage range observed in our study (50.20–56.71 Mg C/ha) is generally lower than that documented for well-protected natural subtropical forests [9,100] (i.e., <60 Mg C/ha), strongly suggesting that historical and ongoing anthropogenic disturbances, particularly forest fragmentation and land-use change, have significantly constrained biomass C accumulation. Forest fragmentation, a well-documented consequence of urban expansion, can increase edge effects, alter microclimates, and elevate tree mortality, thereby reducing C storage capacity. This reduction is particularly evident in the tree layer biomass, which typically constitutes the most sensitive compartment to human disturbance. In contrast, soil carbon storage (peaking at 41.26 Mg C/ha in EBF) showed less pronounced depletion relative to natural forests (36–52 Mg C/ha) [101], suggesting slower response times to landscape degradation and potential compensatory mechanisms from sustained litter inputs. Nevertheless, long-term or intensive land-use changes (i.e., conversion to plantation or agricultural use) can still lead to substantial soil C loss, underscoring the critical role of sustainable land management.
The key drivers of C storage also exhibit notable shifts in their relative importance within the urban buffer context. While biological factors (i.e., tree structural traits) remained dominant in our sites, their explanatory power was generally attenuated compared to natural forests, where biodiversity and DBH variation often explain >40% of biomass C variance [62]. This attenuation is likely attributable to the truncated age structure and simplified species composition resulting from historical management and urban-edge effects. Furthermore, non-biological factors, particularly soil physicochemical properties and local climate modifiers (i.e., urban heat island effects on air temperature), exerted disproportionately stronger influences (explaining up to 40% of variance) in our urban-proximal forests compared to their natural counterparts (typically <15%) [102]. This heightened abiotic control reflects the intensified environmental filtering and stress associated with urban-edge conditions, such as altered hydrology, soil compaction, and modified nutrient cycles.
Notably, synergistic effects between biological and non-biological drivers accounted for substantial variability (15–18%) in MEDBF, DBF, and MNBF—a pattern less common in natural forests where single-driver dominance prevails. This suggests that the complex, interactive controls on C cycling may be a distinctive feature of urban-impacted forests, necessitating management strategies that simultaneously address multiple stressors.
Ultimately, while urban buffer forests maintain significant C storage function, their capacity is often compromised relative to natural forests, and the underlying regulatory mechanisms are distinctly reshaped by anthropogenic pressures. This underscores the critical importance of conserving remnant old-growth patches, minimizing further fragmentation, and implementing targeted interventions (i.e., soil amendment, assisted regeneration) to enhance C sink resilience in these vital ecological transition zones. Future efforts to model and manage urban forest C must therefore explicitly account for these unique biotic–abiotic interactions and their divergence from natural forest paradigms.
This study of a Chinese urban-agglomerated forest delivers principles with broad relevance to subtropical forest C management. The consistent dominance of the tree layer in vegetation C pools (>90%) aligns with findings from South Asian [103] and North American forests [104], confirming the universal priority of canopy management. Similarly, the stronger biological control in evergreen forests resonates with patterns in South African forest [7], highlighting trait-mediated accumulation as a common mechanism. However, the pronounced non-biological control on soil C in our coniferous and mixed forests (explaining up to 30% of variance) exceeds that typical in other regions around the world [105], underscoring the critical role of local soil geochemistry. The divergent age class trajectories (J-shaped vs. sigmoidal) and the novel finding of late-stage soil C dominance in MNBF challenge the application of generalized C models across all subtropical forests. These consistencies and divergences collectively emphasize that while core ecological principles are shared, their specific manifestations are context-dependent, necessitating management strategies tailored to regional forest types, soil conditions, and disturbance histories.

5. Conclusions

This study elucidates the complex hierarchical and interactive controls governing forest C storage across major subtropical forest types within an urban-agglomeration ecological core. Pronounced vertical stratification was observed, with the tree layer storing > 90% (46.49–52.11 Mg C/ha) of total vegetation C, while shrub and herb layers together contributed minimally (<1%). Soil C exhibited significant forest-type specificity, peaking in evergreen broadleaf forests (EBF: 41.26 Mg C/ha) and being significantly higher than in other types (p < 0.05). Biological factors (TV, TVC, TH, TB) served as the primary drivers of vegetation C dynamics, exhibiting strong positive direct effects (path coefficients: 0.58–0.99) and accounting for 52–73% of variability, with the highest explanatory power in EBF (73%) and MEDBF (69%). Their influence was comparatively lower in deciduous broadleaf forest (DBF: 66%) and mixed needle-broadleaf forest (MNBF: 53%), likely due to phenology-mediated constraints on C stabilization. Non-biological factors (i.e., soil texture, micronutrients, climate) predominantly regulated soil C storage (direct effect = 0.91), explaining 15–40% of variability across layers, with peak influence in coniferous forests (CF: 40%) and MNBF (30%), where acidic soils and climatic constraints amplify physicochemical controls. Notably, synergy effects between biological and non-biological drivers accounted for a substantial portion (15–17%) of C storage variability in MEDBF, DBF, and MNBF, highlighting the interactive pathways governing C sequestration in these systems. Negative indirect effects (−0.03 to −0.15) between these factors shaped cross-forest heterogeneity in shrub, herb, vegetation, and soil C storage, suggesting antagonistic interactions such as resource competition or abiotic constraint amplification. J-shaped curves characterized EBF and MEDBF, with slow initial growth and exponential acceleration post-maturity. Sigmoidal (S-shaped) trajectories prevailed in DBF, MNBF, and CF, featuring rapid early sequestration followed by stabilization in aged stands. Soil C lagged behind vegetation in EBF and MEDBF but surpassed it in late-stage MNBF, highlighting ecosystem-specific C allocation strategies. This work advances the mechanistic understanding of subtropical forest C cycling by quantifying the synergistic effects of biotic–abiotic drivers and their age-dependent modulation. The findings provide a scientific foundation for forest management and climate mitigation policies aimed at enhancing C sequestration in urban-agglomeration ecological cores.

Author Contributions

Conceptualization, C.C.; methodology, C.C. and Z.S.; software, C.C.; validation, C.C.; formal analysis, C.C., Y.H. and Z.S.; investigation, Y.H., Q.L., X.Y., L.W. (Ling Wang), L.W. (Linshi Wu) and Z.S.; data curation, C.C. and Z.S.; writing—original draft preparation, C.C.; writing—review and editing, C.C. and Z.S.; visualization, C.C. and Y.H.; supervision, J.L. and Z.S.; project administration, C.C., J.L. and Z.S.; funding acquisition, C.C., Y.L., J.L. and Z.S. All authors have read and agreed to the published version of the manuscript.

Funding

This research was funded the Hunan Provincial Natural Science Foundation of China (2024JJ6283, 2024JJ5235), the China Geological Survey’s project (DD20230800106), the Natural Science Foundation of Changsha (kq2402146), the Central Finance Forestry Science and Technology Promotion Demonstration Fund Project ([2023]No.XT20), the Hunan Forestry Science and Technology Innovation Project (XLKY202313, XLKY202319), and Forest Quality Improvement and Efficiency Enhancement Demonstration Project of Hunan Province with Loan from European Investment Bank (OT-S-KTA4).

Data Availability Statement

The original contributions presented in this study are included in the article. Further inquiries can be directed to the corresponding author(s).

Acknowledgments

The authors would like to thank the survey participants. The authors acknowledge the use of Deepseek version 3.2 for language editing and improvement of readability in sections of this manuscript.

Conflicts of Interest

The authors declare no conflicts of interest.

Abbreviations

The following abbreviations are used in this manuscript:
CZT-GHDChang-Zhu-Tan Green Heart District
CCarbon
SOCSoil organic carbon
EBFEvergreen broad-leaved forest
MEDBFMixed evergreen and deciduous broad-leaved forest
DBFDeciduous broad-leaved forest
MNBFMixed needle and broad-leaved forest
CFConiferous forest
NTotal nitrogen
PTotal phosphorus
KTotal potassium
CaTotal calcium
STotal sulfur
MnTotal manganese
FeTotal iron
CuTotal copper
ZnTotal zinc
BDBulk density
SMSoil moisture
PS1Clay particles (<2 um)
PS2Powder particles (2–50 um)
PS3Sand particles (>50 um)
ATAir temperature
PRCPPrecipitation
SCShrub coverage
AHSAverage height of shrubs
HCHerb coverage
AHCAverage height of herbs
TVCTotal vegetation coverage
NPNumber of plants
PDPlant density
AAHAverage dominant height
DBHAverage diameter at breast height
THAverage diameter at breast height
CDCanopy density
TVTotal volume
TSVTree layer volume
TBTree layer biomass
SBShrub layer biomass
HBHerb layer biomass
LBLitter layer biomass
SIShannon–Wiener’s diversity index
TCSTree layer carbon storage
SCSShrub layer carbon storage
HCSHerb layer carbon storage
LCSLitter layer carbon storage
VCSVegetation layer carbon storage
SLCSSoil layer carbon storage
BFBiological factor
NBFNon-biological factor
ANOVAA one-way analysis of variance
SEMStructural equation modeling
IQRInterquartile range

Appendix A

Appendix A.1

Table A1. Foundational attributes and dominant tree species composition for the 5 forest types.
Forest TypesNumber of Sample PlotsDominant Tree SpeciesAge GroupShrub Coverage (%)Average Shrub Height (m)Herb Coverage (%)Average Herbaceous Height (m)Total Vegetation Coverage (%)Number of PlantsPlant Density
(Plants/ha)
Average Dominant Height (m)Average Breast Height Diameter (cm)Average Tree Height (m)Canopy DensitySoil Texture
EBF14Cinnamomum camphora
Lithocarpus glaber
Castanopsis sclerophylla
Schima superba
Ilex chinensis
Juvenile, middle-aged5~470.7~3.05~800.3~1.0575~9080~1751199~26245.7~15.87.4~15.75.1~13.70.5~0.8Clay, loam, and clay loam soils
MEDBF6Choerospondias axillaris
Cinnamomum camphora
Toxicodendron vernicifluum
Liquidambar formosana
Paulownia
Juvenile, middle-aged7~401.1~1.27~550.32~0.9075~9298~1441469~215910.3~11.59.2~10.96.5~8.20.5~0.7Loam and clay loam soils
DBF11Liquidambar formosana
Quercus
Paulownia
Firmiana simplex
Rhus chinensis
Juvenile, middle-aged8~510.5~25~730.17~0.8685~9526~248390~37187.3~16.19.9~20.06.6~11.90.3~0.8Clay, loam, and clay loam soils
MNBF13Chinese Fir
Cinnamomum camphora
Pinus massoniana Castanopsis sclerophylla
Pinus elliottii
Juvenile, middle-aged5~800.8~2.05~800.2~0.775~9657~280855~41988.2~13.98.4~17.85.4~10.50.6~0.9Clay, loam, and clay loam soils
CF17Chinese Fir
Pinus massoniana
Juvenile, middle-aged2~500.8~1.86~780.2~0.7875~9794~3881409~58179.7~178.3~206.5~13.90.6~0.9Clay, loam, clay loam, and sandy clay loam soils

Appendix A.2

Table A2. The tree volume model of two genes.
Tree SpeciesModels
Chinese FirV = 0.000058777042D1.9699831H0.89646157
Pinus massonianaV = 0.000062341803D1.8551497H0.95682492
Pinus elliottiiV = 0.000086791543DxHy
x = 1.663800058 + 0.009429976(D + 10H)
y = 0.969340486 − 0.029203083(D + 2.5H)
Broad-leaved treeV = 0.000050479055D1.9085054H0.99076507
Note: D represents diameter at breast height; H represents height of tree; V represents volume of wood.

Appendix A.3

Table A3. Biomass conversion parameters and carbon content of dominant tree species.
Tree Speciesa (Mg/m3)b (Mg)Carbon Content
Cinnamomum camphora0.92926.49400.4916
Liquidambar (Other hard broadleaf varieties)0.92926.49400.4901
Broad-leaved mixed forest0.97885.37640.4796
Mixed broadleaf–conifer forest0.813618.46600.4893
Chinese Fir0.465219.14100.5127
Pinus massoniana0.503420.54700.5271
Coniferous mixed forest0.529225.0870.5168

Appendix A.4

Table A4. Shrub biomass equations.
Tree SpeciesEquationsab
Camellia oleiferaM = a(D2H)b0.05630.9291
Gardenia jasminoidesM = a + b × D2H0.00190.0223
Loropetalum chinenseM = a + b × D2H0.01010.0341
Rhododendron simsiiM = a(D2H)b0.02980.8484
Vaccinium bracteatumM = a(D2H)b0.04940.7627

References

  1. Pan, Y.; Birdsey, R.A.; Fang, J.; Houghton, R.; Kauppi, P.E.; Kurz, W.A.; Phillips, O.L.; Shvidenko, A.; Lewis, S.L.; Canadell, J.G.; et al. A large and persistent carbon sink in the world’s forests. Science 2011, 333, 988–993. [Google Scholar] [CrossRef] [PubMed]
  2. Friedlingstein, P.; O’Sullivan, M.; Jones, M.W.; Andrew, R.M.; Bakker, D.C.E.; Hauck, J.; Landschützer, P.; Le Quéré, C.; Luijkx, I.T.; Peters, G.P.; et al. Global Carbon Budget 2023. Earth Syst. Sci. Data 2023, 15, 5301–5369. [Google Scholar] [CrossRef]
  3. Pan, Y.; Birdsey, R.A.; Phillips, O.L.; Houghton, R.A.; Fang, J.; Kauppi, P.E.; Liao, Y.; Zhou, G.; Poorter, L.; Zhou, M.; et al. The enduring world forest carbon sink. Nature 2024, 631, 563–569. [Google Scholar] [CrossRef] [PubMed]
  4. IPCC. Climate Change 2022: Mitigation of Climate Change; Cambridge University Press: Cambridge, UK, 2022. [Google Scholar] [CrossRef]
  5. Lorenz, K. Carbon Sequestration in Forest Ecosystems; Springer: Berlin, Germany, 2010. [Google Scholar] [CrossRef]
  6. Jobbágy, E.G.; Jackson, R.B. The distribution of soil nutrients with depth: Global patterns and the imprint of plants. Biogeochemistry 2001, 53, 51–77. [Google Scholar] [CrossRef]
  7. Mensah, S.; Veldtman, R.; Assogbadjo, A.E.; Glèlè Kakaï, R.; Seifert, T. Tree species diversity promotes aboveground carbon storage through functional diversity and functional dominance. Ecol. Evol. 2016, 6, 7546–7557. [Google Scholar] [CrossRef]
  8. Li, Q.; Wang, X.; Jiang, M.; Liu, H.; Liu, G. How environmental and vegetation factors affect spatial patterns of soil carbon and nitrogen in a subtropical mixed forest in Central China. J. Soils Sediments 2017, 17, 2296–2304. [Google Scholar] [CrossRef]
  9. Liu, X.; Trogisch, S.; He, J.S.; Niklaus, P.A.; Bruelheide, H.; Tang, Z.; Erfmeier, A.; Scherer-Lorenzen, M.; Pietsch, K.A.; Yang, B.; et al. Tree species richness increases ecosystem carbon storage in subtropical forests. Proc. R. Soc. B 2018, 285, 20181240. [Google Scholar] [CrossRef]
  10. Augusto, L.; Boča, A. Tree functional traits, forest biomass, and tree species diversity interact with site properties to drive forest soil carbon. Nat. Commun. 2022, 13, 1097. [Google Scholar] [CrossRef] [PubMed]
  11. Li, X.; Aguila, L.C.R.; Wu, D.; Lie, Z.; Xu, W.; Tang, X.; Liu, J. Carbon sequestration and storage capacity of Chinese fir at different stand ages. Sci. Total Environ. 2023, 904, 166962. [Google Scholar] [CrossRef] [PubMed]
  12. Wu, H.; Du, Z.; Zhou, L.; Zhou, G.; Coco, G.; Gao, J.; Zhou, X. The stand age governs forest root: Shoot ratios across northeast China. Agric. For. Meteorol. 2025, 370, 110595. [Google Scholar] [CrossRef]
  13. Besnard, S.; Heinrich, V.H.A.; Carvalhais, N.; Ciais, P.; Herold, M.; Luijkx, I.; Peters, W.; Suarez, D.R.; Santoro, M.; Yang, H. Global covariation of forest age transitions with the net carbon balance. Nat. Ecol. Evol. 2025, 9, 1848–1860. [Google Scholar] [CrossRef] [PubMed]
  14. Besnard, S.; Santoro, M.; Herold, M.; Cartus, O.; Gütter, J.; Heinrich, V.; Herault, B.; Kassi, J.; Koirala, S.; N’Guessan, A.; et al. Global Age Mapping Integration (GAMI); V. 2.0; GFZ Data Services: Potsdam, Germany, 2023. [Google Scholar] [CrossRef]
  15. Yu, G.; Chen, Z.; Piao, S.; Peng, C.; Ciais, P.; Wang, Q.; Li, X.; Zhu, X. High carbon dioxide uptake by subtropical forest ecosystems in the East Asian monsoon region. Proc. Natl. Acad. Sci. USA 2014, 111, 4910–4915. [Google Scholar] [CrossRef]
  16. Li, C.; Zhang, R.; Li, T.; Guo, H.; Guo, R. Dynamic Changes and Influencing Factors of Vegetation in the “Green Heart” Zone of the Chang-Zhu-Tan Urban Agglomeration during the Past 21 Years. Int. J. Environ. Res. Public Health 2023, 20, 4517. [Google Scholar] [CrossRef] [PubMed]
  17. Mi, Y.; Li, S.; Wu, B. Study on the variation of carbon storage in the Chang-Zhu-Tan urban agglomeration in China based on topographic relief. Front. Environ. Sci. 2024, 12, 1481540. [Google Scholar] [CrossRef]
  18. Sun, W.; Liu, X. Spatio-temporal evolution and multi-scenario prediction of ecosystem carbon storage in Chang-Zhu-Tan Urban agglomeration based on the FLUS-InVEST Model. Sustainability 2024, 16, 7025. [Google Scholar] [CrossRef]
  19. Schlesinger, W.H.; Bernhardt, E.S. Biogeochemistry: An Analysis of Global Change, 3rd ed.; Academic Press: Cambridge, MA, USA, 2013; pp. 419–444. [Google Scholar]
  20. Luo, Y.; Ahlström, A.; Allison, S.D.; Batjes, N.H.; Brovkin, V.; Carvalhais, N.; Chappell, A.; Ciais, P.; Davidson, E.A.; Finzi, A.; et al. Toward more realistic projections of soil carbon dynamics by Earth system models. Glob. Biogeochem. Cycles 2016, 30, 40–56. [Google Scholar] [CrossRef]
  21. Malhi, Y.; Baldocchi, D.D.; Jarvis, P.G. The carbon balance of tropical, temperate and boreal forests. Plant Cell Environ. 1999, 22, 715–740. [Google Scholar] [CrossRef]
  22. Tikuye, B.G.; Ray, R.L.; Gurau, S. Modeling carbon stock change and carbon dioxide emissions under different ecosystems in the Brazos River Basin, USA. Environ. Chall. 2025, 19, 101138. [Google Scholar] [CrossRef]
  23. Hardiman, B.S.; Gough, C.M.; Halperin, A.; Hofmeister, K.L.; Nave, L.E.; Bohrer, G.; Curtis, P.S. Maintaining high rates of carbon storage in old forests: A mechanism linking canopy structure to forest function. For. Ecol. Manag. 2013, 298, 111–119. [Google Scholar] [CrossRef]
  24. Atkins, J.W.; Fahey, R.T.; Hardiman, B.S.; Gough, C.M. Forest canopy structural complexity and light absorption relationships at the subcontinental scale. J. Geophys. Res. Biogeosci. 2018, 123, 1387–1405. [Google Scholar] [CrossRef]
  25. Jackson, R.B.; Lajtha, K.; Crow, S.E.; Hugelius, G.; Kramer, M.G.; Piñeiro, G. The ecology of soil carbon: Pools, vulnerabilities, and biotic and abiotic controls. Annu. Rev. Ecol. Evol. Syst. 2017, 48, 419–445. [Google Scholar] [CrossRef]
  26. Zhang, T.; Ding, G.; Zhang, J.; Qi, Y. Contributions of Biotic and Abiotic Factors to the Spatial Heterogeneity of Aboveground Biomass in Subtropical Forests: A Case Study of Guizhou Province. Sustainability 2022, 14, 10771. [Google Scholar] [CrossRef]
  27. Sulman, B.N.; Moore, J.A.M.; Abramoff, R.; Averill, C.; Kivlin, S.; Georgiou, K.; Sridhar, B.; Hartman, M.D.; Wang, G.; Wieder, W.R.; et al. Multiple models and experiments underscore large uncertainty in soil carbon dynamics. Biogeochemistry 2018, 141, 109–123. [Google Scholar] [CrossRef]
  28. Yu, Z.; Ciais, P.; Piao, S.; Houghton, R.A.; Lu, C.; Tian, H.; Agathokleous, E.; Kattel, G.R.; Sitch, S.; Goll, D.; et al. Forest expansion dominates China’s land carbon sink since 1980. Nat. Commun. 2022, 13, 5374. [Google Scholar] [CrossRef] [PubMed]
  29. Sun, L.; Guan, D.S. Carbon stock of the ecosystem of lower subtropical broadleaved evergreen forests of different ages in pearl river delta, China. J. Trop. For. Sci. 2014, 26, 249–258. [Google Scholar]
  30. Maier, C.A.; Johnsen, K.H.; Anderson, P.H.; Palmroth, S.; Kim, H.S.; McCarthy, H.R.; Oren, R. The response of coarse root biomass to long-term CO2; enrichment and nitrogen application in a maturing Pinus taeda stand with a large broadleaved component. Glob. Change Biol. 2022, 28, 1458–1476. [Google Scholar] [CrossRef]
  31. Joshi, S.R.; Tfaily, M.M.; Young, R.P.; McNear, D.H., Jr. Root exudates induced coupled carbon and phosphorus cycling in a soil with low phosphorus availability. Plant Soil 2024, 498, 371–390. [Google Scholar] [CrossRef]
  32. Song, Y.; Gu, X.Y.; Yan, H.Y.; Mao, W.T.; Wu, X.L.; Wang, Y.X. Dynamics of microbes and enzyme activities during litter decomposition of Pinus massoniana forest in mid-subtropical area. Environ. Sci. 2014, 35, 1151–1158. [Google Scholar]
  33. Philippot, L.; Chenu, C.; Kappler, A.; Rillig, M.C.; Fierer, N. The interplay between microbial communities and soil properties. Nat. Rev. Microbiol. 2024, 22, 226–239. [Google Scholar] [CrossRef]
  34. Xu, W.; Zhang, B.; Xu, Q.; Gao, D.; Zuo, H.; Ren, R.; Zhang, Y.; Chen, Z. Enhanced Carbon Storage in Mixed Coniferous and Broadleaf Forest Compared to Pure Forest in the North Subtropical-Warm Temperate Transition Zone of China. Forests 2024, 15, 1520. [Google Scholar] [CrossRef]
  35. Guo, L.B.; Wang, M.; Gifford, R.M. The change of soil carbon stocks and fine root dynamics after land use change from a native pasture to a pine plantation. Plant Soil 2007, 299, 251–262. [Google Scholar] [CrossRef]
  36. Laganière, J.; Angers, D.A.; Paré, D. Carbon accumulation in agricultural soils after afforestation: A meta-analysis. Glob. Change Biol. 2009, 16, 439–453. [Google Scholar] [CrossRef]
  37. Ekblad, A.; Wallander, H.; Godbold, D.L.; Cruz, C.; Johnson, D.; Baldrian, P.; Björk, R.G.; Epron, D.; Kieliszewska-Rokicka, B.; Kjøller, R.; et al. The production and turnover of extramatrical mycelium of ectomycorrhizal fungi in forest soils: Role in carbon cycling. Plant Soil 2013, 366, 1–27. [Google Scholar] [CrossRef]
  38. Dai, W.; Xiao, R.; Wei, C.; Yang, F. Plant litter traits control the accumulation of mineral-associated organic carbon by influencing its molecular composition and diversity. Soil Tillage Res. 2025, 253, 106667. [Google Scholar] [CrossRef]
  39. Yang, L.L.; Wen, S.Z.; Xing, Y.J. The Planning Strategies of Changsha-Zhuzhou-Xiangtan Urban Agglomeration Based on” Two-Oriented Society”. J. Cent. South Univ. For. Technol. 2018, 38, 81–87. [Google Scholar] [CrossRef]
  40. GB/T 38590-2020; Technical Regulations for Continuous Forest Inventory. Standards Press of China: Beijing, China, 2020.
  41. Liu, Q.J. Tree Volume Tables of China; China Forestry Publishing House: Beijing, China, 2017; ISBN 978-7-5038-9152-3. [Google Scholar]
  42. State Forestry Administration. National Technical Guidelines for Forest Carbon Sink Monitoring and Accounting (Trial); China Forestry Publishing House: Beijing, China, 2011; ISBN 978-7-5038-6110-6.
  43. Xie, Z.Q.; Wang, Y.; Tang, Z.Y.; Xu, W.T. Biomass Models of Common Shrubs in China: A Handbook; Science Press: Beijing, China, 2019; ISBN 978-7-03-062123-8. [Google Scholar]
  44. Zheng, L.; Lu, L.H. Standing crop and nutrient characteristics of forest floor litter in China. J. Northwest For. Univ. 2012, 27, 63–69. [Google Scholar]
  45. Martin-Vertedor, A.I.; Dodd, I.C. Root-to-shoot signalling when soil moisture is heterogeneous: Increasing the proportion of root biomass in drying soil inhibits leaf growth and increases leaf abscisic acid concentration. Plant Cell Environ. 2011, 34, 1164–1175. [Google Scholar] [CrossRef]
  46. Imada, S.; Yamanaka, N.; Tamai, S. Water table depth affects Populus alba fine root growth and whole plant biomass. Funct. Ecol. 2008, 22, 1018–1026. [Google Scholar] [CrossRef]
  47. GB/T 42490-2023; Soil Quality—Determination of Total Content and Isotope Ratio of Organic Carbon and Nitrogen of Soil and Biological Samples—Stable Isotope Ratio Mass Spectrometry. Standards Press of China: Beijing, China, 2023.
  48. Dong, B.; Liu, M.; Jiang, J.; Shi, C.; Wang, X.; Qiao, Y.; Liu, Z.; Zhao, M.; Si, F. Growth, grain yield, and water use efficiency of rain-fed spring hybrid millet (Setaria italica) in plastic-mulched and unmulched fields. Agric. Water Manag. 2014, 143, 93–101. [Google Scholar] [CrossRef]
  49. Bremner, J.M. Nitrogen-total. In Methods of Soil Analysis: Part 3 Chemical Methods; Sparks, D.L., Ed.; SSSA: Madison, WI, USA, 1996; pp. 1085–1121. [Google Scholar] [CrossRef]
  50. US EPA. Method 3050B: Acid Digestion of Sediments, Sludges, and Soils; United States Environmental Protection Agency: Washington, DC, USA, 1996. [Google Scholar]
  51. Peng, S. 1-km Monthly Mean Temperature Dataset for China (1901–2023). National Tibetan Plateau/Third Pole Environment Data Center. 2019. Available online: https://cstr.cn/18406.11.Meteoro.tpdc.270961 (accessed on 1 March 2025).
  52. Peng, S. 1-km Monthly Precipitation Dataset for China (1901–2023). National Tibetan Plateau/Third Pole Environment Data Center. 2020. Available online: https://data.tpdc.ac.cn/zh-hans/data/faae7605-a0f2-4d18-b28f-5cee413766a2 (accessed on 1 March 2025).
  53. Wickham, H.; Chang, W.; Henry, L.; Pedersen, T.L.; Takahashi, K.; Wilke, C.; Woo, K.; Yutani, H.; Dunnington, D. ggplot2: Create Elegant Data Visualisations Using the Grammar of Graphics. R Package Version 3.4.4. 2023. Available online: https://ggplot2.tidyverse.org (accessed on 1 September 2024).
  54. R Core Team. R: A Language and Environment for Statistical Computing; R Foundation for Statistical Computing: Vienna, Austria, 2025; Available online: https://www.R-project.org/ (accessed on 1 September 2024).
  55. Wickham, H.; Averick, M.; Bryan, J.; Chang, W.; McGowan, L.D.; François, R.; Grolemund, G.; Hayes, A.; Henry, L.; Hester, J.; et al. Welcome to the Tidyverse. J. Open Source Softw. 2019, 4, 1686. [Google Scholar] [CrossRef]
  56. Rigatti, S.J. Random forest. J. Insur. Med. 2017, 47, 31–39. [Google Scholar] [CrossRef]
  57. Lefcheck, J.S. piecewiseSEM: Piecewise structural equation modelling in R for ecology, evolution, and systematics. Methods Ecol. Evol. 2016, 7, 573–579. [Google Scholar] [CrossRef]
  58. Pedersen, T.L. Patchwork: The Composer of Plots. R Package Version 1.2.0, 2024. Available online: https://CRAN.R-project.org/package=patchwork (accessed on 1 September 2024).
  59. Oksanen, J.; Blanchet, F.G.; Friendly, M.; Kindt, R.; Legendre, P.; McGlinn, D.; Minchin, P.R.; O’Hara, R.B.; Simpson, G.L.; Solymos, P.; et al. Vegan: Community Ecology Package. R Package Version 2.6-4, 2022. Available online: https://CRAN.R-project.org/package=vegan (accessed on 1 September 2024).
  60. GB/T 26424-2010; Technical Regulations for Inventory for Forest Management Planning and Design. China Forestry Publishing House: Beijing, China, 2011.
  61. Mu, Y.X.; Lin, W.Y.; Diao, X.L.; Zhang, Z.; Wang, J.; Lu, Z.J.; Guo, W.C.; Wang, Y.; Hu, C.X.; Zhao, C.Y. Implementation of the visual aesthetic quality of slope forest autumn color change into the configuration of tree species. Sci. Rep. 2022, 12, 1034. [Google Scholar] [CrossRef]
  62. Li, Y.; Bao, W.; Bongers, F.; Chen, B.; Chen, G.; Guo, K.; Jiang, M.; Lai, J.; Lin, D.; Liu, C.; et al. Drivers of tree carbon storage in subtropical forests. Sci. Total Environ. 2019, 654, 684–693. [Google Scholar] [CrossRef]
  63. Zhang, C.; Xia, B.; Lin, J. A Basin-Scale Estimation of Carbon Stocks of a Forest Ecosystem Characterized by Spatial Distribution and Contributive Features in the Liuxihe River Basin of Pearl River Delta. Forests 2016, 7, 299. [Google Scholar] [CrossRef]
  64. Xu, J.; Zhang, H.; Qiao, Y.; Yuan, H.; Xu, W.; Xia, X. Effects of Microtopography on Neighborhood Diversity and Competition in Subtropical Forests. Plants 2025, 14, 870. [Google Scholar] [CrossRef] [PubMed]
  65. Ullah, S.; Wu, J.; Shah, J.A.; Wang, X.; Lyu, Y.; Guo, Z.; Sun, H. Tree diversity drives understory carbon storage rather than overstory carbon storage across forest types. J. For. Res. 2024, 35, 125. [Google Scholar] [CrossRef]
  66. Conforti, M.; Lucà, F.; Scarciglia, F.; Matteucci, G.; Buttafuoco, G. Soil carbon stock in relation to soil properties and landscape position in a forest ecosystem of southern Italy (Calabria region). Catena 2016, 144, 23–33. [Google Scholar] [CrossRef]
  67. Borah, P. Role of Soil Properties on Ecosystem Carbon Flux in a Semi-Evergreen Forest of North East India. Ph.D. Thesis, Tezpur University, Tezpur, India, 2023. [Google Scholar]
  68. Bird, S.B.; Herrick, J.E.; Wander, M.M.; Wright, S.F. Spatial heterogeneity of aggregate stability and soil carbon in semi-arid rangeland. Environ. Pollut. 2002, 116, 445–455. [Google Scholar] [CrossRef]
  69. Reich, P.B. The world-wide ‘fast-slow’ plant economics spectrum: A traits manifesto. J. Ecol. 2014, 102, 275–301. [Google Scholar] [CrossRef]
  70. Wei, L.; Gosselin, F.; Rao, X.; Lin, Y.; Wang, J.; Jian, S.; Ren, H. Overstory and niche attributes drive understory biomass production in three types of subtropical plantations. For. Ecol. Manag. 2021, 482, 118894. [Google Scholar] [CrossRef]
  71. Berg, B.; McClaugherty, C. Plant Litter: Decomposition, Humus Formation, Carbon Sequestration, 4th ed.; Springer: Cham, Switzerland, 2020. [Google Scholar] [CrossRef]
  72. Peh, K.S.H.; Lewis, S.L.; Lloyd, J. Mechanisms of monodominance in diverse tropical tree-dominated systems. J. Ecol. 2011, 99, 891–898. [Google Scholar] [CrossRef]
  73. Wang, Z.; Li, S.; Malhi, S. Effects of fertilization and other agronomic measures on nutritional quality of crops. J. Sci. Food Agric. 2008, 88, 7–23. [Google Scholar] [CrossRef]
  74. Soetan, K.O.; Olaiya, C.O.; Oyewole, O.E. The importance of mineral elements for humans, domestic animals and plants: A review. Afr. J. Food Sci. 2010, 4, 200–222. [Google Scholar]
  75. Hemingway, J.D.; Rothman, D.H.; Grant, K.E.; Rosengard, S.Z.; Eglinton, T.I.; Derry, L.A.; Galy, V.V. Mineral protection regulates long-term global preservation of natural organic carbon. Nature 2019, 570, 228–231. [Google Scholar] [CrossRef] [PubMed]
  76. Steinweg, J.M.; Dukes, J.S.; Paul, E.A.; Wallenstein, M.D. Microbial responses to multi-factor climate change: Effects on soil enzymes. Front. Microbiol. 2013, 4, 146. [Google Scholar] [CrossRef]
  77. Gomez, E.J.; Delgado, J.A.; Gonzalez, J.M. Environmental factors affect the response of microbial extracellular enzyme activity in soils when determined as a function of water availability and temperature. Ecol. Evol. 2020, 10, 10105–10115. [Google Scholar] [CrossRef] [PubMed]
  78. Kleber, M.; Bourg, I.C.; Coward, E.K.; Hansel, C.M.; Myneni, S.C.B.; Nunan, N. Dynamic interactions at the mineral-organic matter interface. Nat. Rev. Earth Environ. 2021, 2, 402–416. [Google Scholar] [CrossRef]
  79. Rowley, M.C.; Grand, S.; Verrecchia, É.P. Calcium-mediated stabilisation of soil organic carbon. Biogeochemistry 2018, 137, 27–49. [Google Scholar] [CrossRef]
  80. Bruelheide, H.; Dengler, J.; Purschke, O.; Lenoir, J.; Jiménez-Alfaro, B.; Hennekens, S.M.; Jandt, U. Global trait-environment relationships of plant communities. Nat. Ecol. Evol. 2018, 2, 1906–1917. [Google Scholar] [CrossRef]
  81. Blouin, M.; Dubs, F.; Ponge, J.F. Harnessing trait-environment interactions to predict ecosystem functions. Front. Ecol. Environ. 2025, 23, e2826. [Google Scholar] [CrossRef]
  82. Luo, M.; Zhao, X.; Hao, D.; Bond-Lamberty, B.; Daigneault, A.; Patel, P.L.; Chen, M. Role of forest biomass change in shaping future land use and land cover change. ESS Open Arch. 2024. [Google Scholar] [CrossRef]
  83. Zhang, H.; Liu, D.; Dong, W.; Cai, W.; Yuan, W. Accurate representation of leaf longevity is important for simulating ecosystem carbon cycle. Basic Appl. Ecol. 2016, 17, 396–407. [Google Scholar] [CrossRef]
  84. Baum, C.; Fienemann, M.; Glatzel, S.; Gleixner, G. Overstory-specific effects of litter fall on the microbial carbon turnover in a mature deciduous forest. For. Ecol. Manag. 2009, 258, 109–114. [Google Scholar] [CrossRef]
  85. Lee, M.K.; Lee, Y.J.; Chun, J.H.; Kim, A.R.; Lee, C.B. Ecosystem services and multifunctionality are co-regulated by biotic and abiotic factors along with forest types in a temperate forest of South Korea. Glob. Ecol. Conserv. 2025, 61, e03683. [Google Scholar] [CrossRef]
  86. Mikutta, R.; Turner, S.; Schippers, A.; Gentsch, N.; Meyer-Stüve, S.; Condron, L.M.; Peltzer, D.A.; Richardson, S.J.; Eger, A.; Hempel, G.; et al. Microbial and abiotic controls on mineral-associated organic matter in soil profiles along an ecosystem gradient. Sci. Rep. 2019, 9, 10294. [Google Scholar] [CrossRef]
  87. Sokol, N.W.; Whalen, E.D.; Jilling, A.; Kallenbach, C.; Pett-Ridge, J.; Georgiou, K. Global distribution, formation and fate of mineral-associated soil organic matter under a changing climate: A trait-based perspective. Funct. Ecol. 2022, 36, 1411–1429. [Google Scholar] [CrossRef]
  88. Bramble, D.S.E.; Ulrich, S.; Schöning, I.; Mikutta, R.; Brandt, L.; Poll, C.; Schrumpf, M. Formation of mineral-associated organic matter in temperate soils is primarily controlled by mineral type and modified by land use and management intensity. Glob. Change Biol. 2024, 30, e17024. [Google Scholar] [CrossRef] [PubMed]
  89. Li, Y.; Wang, C.C.; Zou, C.; Zhao, Y.; Wei, P.; Liu, Y.Y.; Zhu, G.Y. Effects of iron/aluminum mineral phases on soil organic carbon storage in different clay soils of subtropical acidic forests. Catena 2025, 252, 108853. [Google Scholar] [CrossRef]
  90. Laurans, M.; Hérault, B.; Vieilledent, G.; Vincent, G. Vertical stratification reduces competition for light in dense tropical forests. For. Ecol. Manag. 2014, 329, 79–88. [Google Scholar] [CrossRef]
  91. Deng, J.; Fang, S.; Fang, X.; Jin, Y.; Kuuid, Y.; Lin, F.; Liu, C. Forest understory vegetation study: Current status and future trends. For. Res. 2023, 3, 6. [Google Scholar] [CrossRef]
  92. Daba, M.H.; Dejene, S.W. The role of biodiversity and ecosystem services in carbon sequestration and its implication for climate change mitigation. Environ. Sci. Nat. Resour. 2018, 11, 555810. [Google Scholar] [CrossRef]
  93. Bertini, S.C.B.; Azevedo, L.C.B. Soil microbe contributions in the regulation of the global carbon cycle. In Microbiome Under Changing Climate; Woodhead Publishing: Sawston, UK, 2022; pp. 69–84. [Google Scholar] [CrossRef]
  94. Szanser, M.; Ilieva-Makulec, K.; Kajak, A.; Górska, E.; Kusińska, A.; Kisiel, M.; Wojewoda, D. Impact of litter species diversity on decomposition processes and communities of soil organisms. Soil Biol. Biochem. 2011, 43, 9–19. [Google Scholar] [CrossRef]
  95. Lu, S.; Wang, J.; Liu, A.; Lei, F.; Liu, R.; Li, S. Intraspecific transitioning of ecological strategies in Pinus massoniana trees across restoration stages. Ecol. Evol. 2024, 14, e11305. [Google Scholar] [CrossRef] [PubMed]
  96. Smith, F.W.; Long, J.N. Age-related decline in forest growth: An emergent property. For. Ecol. Manag. 2001, 144, 175–181. [Google Scholar] [CrossRef]
  97. Cotrufo, M.F.; Wallenstein, M.D.; Boot, C.M.; Denef, K.; Paul, E. The Microbial Efficiency-Matrix Stabilization (MEMS) framework integrates plant litter decomposition with soil organic matter stabilization: Do labile plant inputs form stable soil organic matter? Glob. Change Biol. 2013, 19, 988–995. [Google Scholar] [CrossRef]
  98. Burgess-Conforti, J.R.; Moore, P.A.; Owens, P.R.; Miller, D.M.; Ashworth, A.J.; Hays, P.D.; Anderson, K.R. Are soils beneath coniferous tree stands more acidic than soils beneath deciduous tree stands? Environ. Sci. Pollut. Res. 2019, 26, 14920–14929. [Google Scholar] [CrossRef]
  99. Zhang, X.; Jia, W.; Sun, Y.; Wang, F.; Miu, Y. Simulation of Spatial and Temporal Distribution of Forest Carbon Stocks in Long Time Series-Based on Remote Sensing and Deep Learning. Forests 2023, 14, 483. [Google Scholar] [CrossRef]
  100. Wu, Y.; Zheng, J.; Gao, J.; He, X.; Liu, X.; Chen, Y.; Li, C. Functional diversity explains ecosystem carbon storage in subtropical forests. Glob. Change Biol. 2025, 31, e70120. [Google Scholar] [CrossRef] [PubMed]
  101. Lu, X.; Xiang, W.H.; Liu, C. Storage and Distribution of Soil Organic Carbon and Nitrogen in Four Subtropical Forests in Central Southern China. J. Soil Water Conserv. 2012, 26, 169–173. [Google Scholar]
  102. Chen, X.; Reich, P.B.; Taylor, A.R.; An, Z.; Chang, S.X. Resource availability enhances positive tree functional diversity effects on carbon and nitrogen accrual in natural forests. Nat. Commun. 2024, 15, 8615. [Google Scholar] [CrossRef] [PubMed]
  103. Haq, S.M.; Rashid, I.; Waheed, M.; Khuroo, A.A. From forest floor to tree top: Partitioning of biomass and carbon stock in multiple strata of forest vegetation in Western Himalaya. Environ. Monit. Assess. 2023, 195, 812. [Google Scholar] [CrossRef]
  104. Mora, F.; Jaramillo, V.J.; Bhaskar, R.; Gavito, M.; Siddique, I.; Byrnes, J.E.K.; Balvanera, P. Carbon accumulation in neotropical dry secondary forests: The roles of forest age and tree dominance and diversity. Ecosystems 2018, 21, 536–550. [Google Scholar] [CrossRef]
  105. Luo, Z.; Viscarra-Rossel, R.A.; Qian, T. Similar importance of edaphic and climatic factors for controlling soil organic carbon stocks of the world. Biogeosciences 2021, 18, 2063–2073. [Google Scholar] [CrossRef]
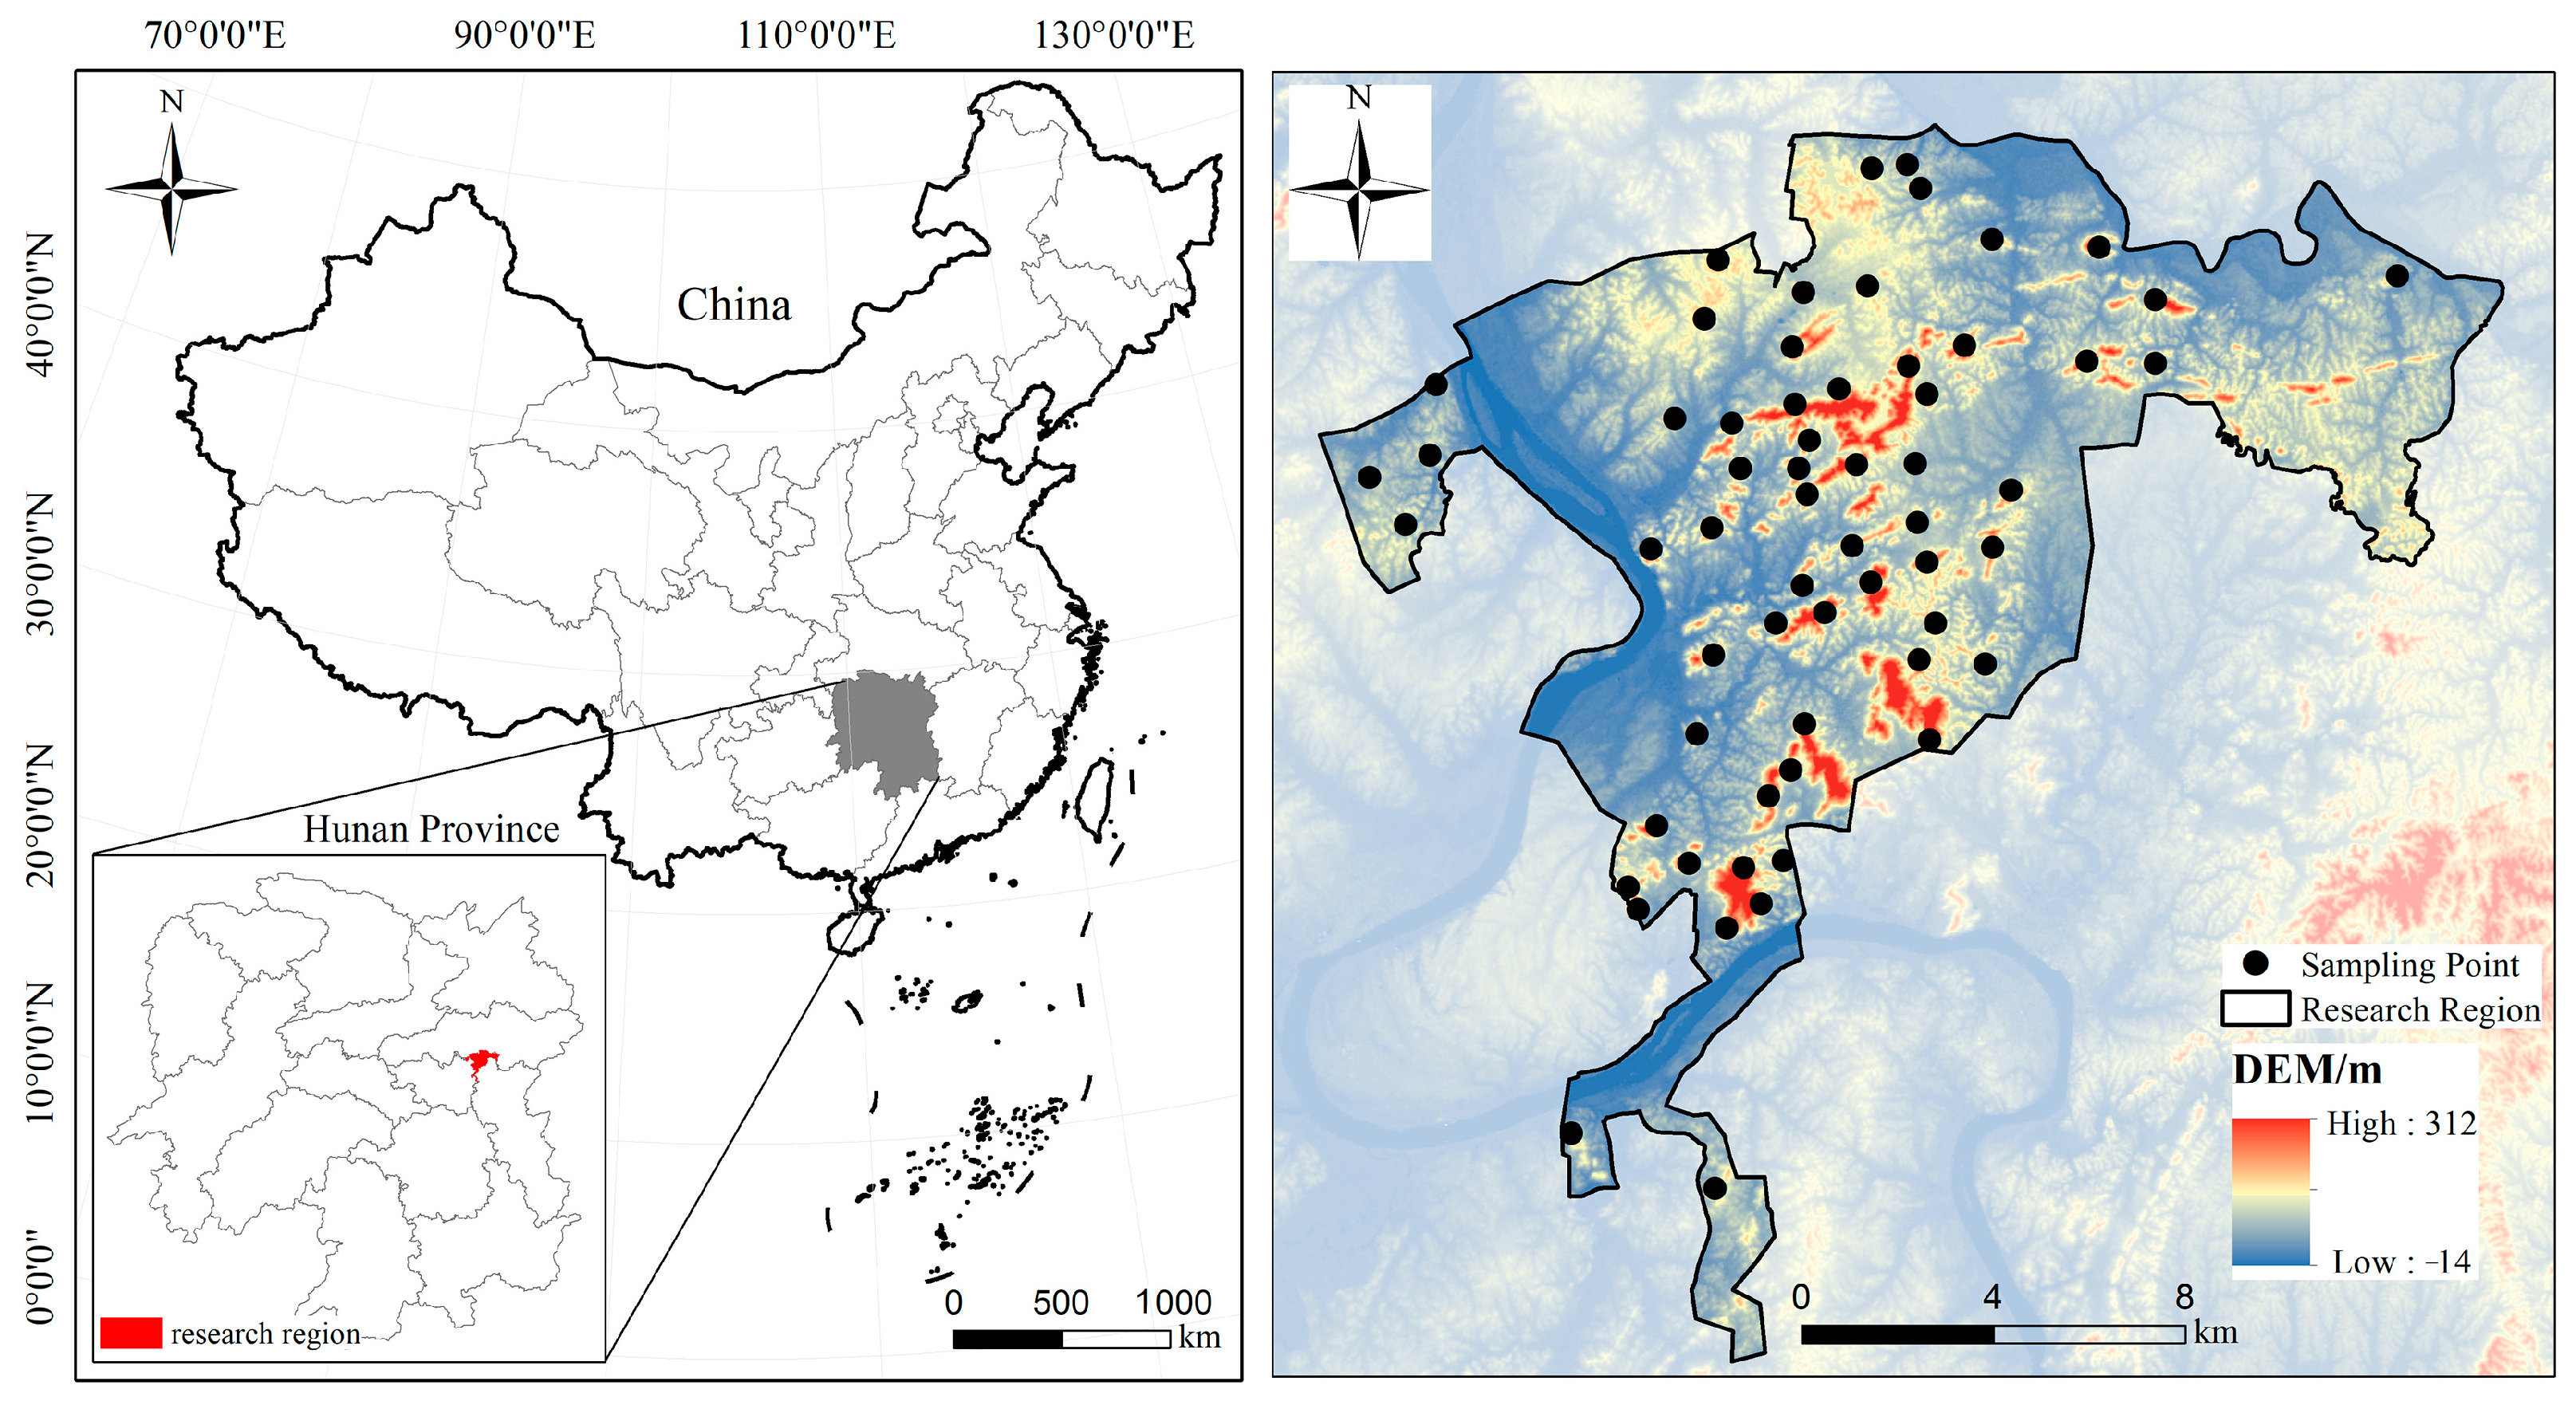
Figure 1. Location of the research area and distribution of sample plots. DEM indicates digital elevation data calculated from a digital elevation model.
Forests 16 01648 g001
Figure 2. Carbon storage (a) and percentages (b) in the vertical structure of vegetation in different forest types. CF: coniferous forest; DBF: deciduous broad-leaved forest; EBF: evergreen broad-leaved forest; MEDBF: mixed evergreen and deciduous broad-leaved forest; MNBF: mixed needle and broad-leaved forest. The length of the box (interquartile range, IQR) indicates the dispersion of the dataset. A wider box signifies greater data variability, whereas a narrower box implies higher data concentration. The horizontal line within the box denotes the median. When the median is positioned at the center of the box, the data distribution is symmetric. Conversely, deviation of the median from the central location reveals the degree of skewness in the data distribution.
Forests 16 01648 g002
Figure 3. Soil organic carbon storage of different forest types. CF: coniferous forest; DBF: deciduous broad-leaved forest; EBF: evergreen broad-leaved forest; MEDBF: mixed evergreen and deciduous broad-leaved forest; MNBF: mixed needle and broad-leaved forest. The length of the box (interquartile range, IQR) indicates the dispersion of the dataset. A wider box signifies greater data variability, whereas a narrower box implies higher data concentration. The horizontal line within the box denotes the median. When the median is positioned at the center of the box, the data distribution is symmetric. Conversely, deviation of the median from the central location reveals the degree of skewness in the data distribution. The width of the violin represents the data distribution density. Different lowercase letters indicate significant differences among different forest types (p < 0.05).
Forests 16 01648 g003
Figure 4. Relationships between biological factors and carbon storage of vegetation and soil in different forest types. (ae) The 5 forest types: EBF: evergreen broad-leaved forest; MEDBF: mixed evergreen and deciduous broad-leaved forest; DBF: deciduous broad-leaved forest; MNBF: deciduous broad-leaved forest; CF: coniferous forest. The circle size denotes variable importance, quantified as the proportion of variance explained through multivariate regression modeling and variance partitioning analysis. Color gradient represents Spearman’s correlation coefficients. The upper bar chart depicts the total explanatory power of biological factors on carbon storage across vertical strata of forest ecosystems. SC: shrub coverage; AHS: average height of shrubs; HC: herb coverage; AHC: average height of herbs; TVC: total vegetation coverage; NP: number of plants; PD: plant density; AAH: average dominant height; DBH: average diameter at breast height; TH: average diameter at breast height; CD: canopy density; TV: total volume; TSV: tree layer volume; TB: tree layer biomass; SB: shrub layer biomass; HB: herb layer biomass; LB: litter layer biomass; SI: Shannon–Wiener’s diversity index; TCS: tree layer carbon storage; SCS: shrub layer carbon storage; HCS: herb layer carbon storage; LCS: litter layer carbon storage; VCS: vegetation layer carbon storage; SLCS: soil layer carbon storage.
Forests 16 01648 g004
Figure 5. Relationships between non-biological factors and carbon storage of vegetation and soil in different forest types. (ae) The 5 forest types: EBF: evergreen broad-leaved forest; MEDBF: mixed evergreen and deciduous broad-leaved forest; DBF: deciduous broad-leaved forest; MNBF: deciduous broad-leaved forest; CF: coniferous forest. The circle size denotes variable importance, quantified as the proportion of variance explained through multivariate regression modeling and variance partitioning analysis. Color gradient represents Spearman’s correlation coefficients. The upper bar chart depicts the total explanatory power of non-biological factors on carbon storage across vertical strata of forest ecosystems. AT: air temperature; BD: bulk density; Ca: total calcium; Cu: total copper; Fe: total iron; K: total potassium; Mn: total manganese; N: total nitrogen; P: total phosphorus; PRCP: precipitation; PS1: clay particles (<2 um); PS2: powder particles (2–50 um); PS3: sand particles (>50 um); S: total sulfur; SM: soil moisture; Zn: total zinc; TCS: tree layer carbon storage; SCS: shrub layer carbon storage; HCS: herb layer carbon storage; LCS: litter layer carbon storage; VCS: vegetation layer carbon storage; SLCS: soil layer carbon storage.
Forests 16 01648 g005
Figure 6. Structural equation modeling (SEM) results for key factors and carbon storage. (af) Path diagram with standardized coefficients and explained variance (R2); (g) standardized direct and indirect effects of biological and non-biological factors on carbon storage. *: p < 0.05, **: p < 0.01, ***: p < 0.001. TCS: tree layer carbon storage; SCS: shrub layer carbon storage; HCS: herb layer carbon storage; LCS: litter layer carbon storage; VCS: vegetation layer carbon storage; SLCS: soil layer carbon storage; BF: biological factors; NBF: non-biological factors.
Forests 16 01648 g006
Figure 7. Schematic diagram of (a) different forest types (b) the effects of biological and non-biological factors on total carbon storage and (c) the prediction dynamics of carbon storage with age group. TCS: tree layer carbon storage; SCS: shrub layer carbon storage; HCS: herb layer carbon storage; LCS: litter layer carbon storage; VCS: vegetation layer carbon storage; SLCS: soil layer carbon storage; BF: biological factors; NBF: non-biological factors. Age group indicates juvenile (1), middle-aged (2), near-mature (3), mature (4), and over-mature (5).
Forests 16 01648 g007
Disclaimer/Publisher’s Note: The statements, opinions and data contained in all publications are solely those of the individual author(s) and contributor(s) and not of MDPI and/or the editor(s). MDPI and/or the editor(s) disclaim responsibility for any injury to people or property resulting from any ideas, methods, instructions or products referred to in the content.