Article

Integrating Social Conflicts into Sustainable Decision-Making of the Forest-to-Lumber Supply Chain

by
Jorge Félix Mena-Reyes
1,*,
Raúl Soto-Concha
2,
Francisco P. Vergara
3,*,
Virna Ortiz-Araya
4,
John Willmer Escobar
5 and
Rodrigo Linfati
1
1
Departamento de Ingeniería Industrial, Universidad del Bío-Bío, Concepción 4051381, Chile
2
Departamento de Ciencias de la Ingeniería, Universidad de Los Lagos, Puerto Montt 5480000, Chile
3
Departamento de Ingeniería de Procesos y Bioproductos, Universidad del Bío-Bío, Concepción 4051381, Chile
4
Departamento de Gestión Empresarial, Universidad del Bío-Bío, Chillán 3800708, Chile
5
Accounting and Finance Department, Universidad del Valle, Cali 760001, Colombia
*
Authors to whom correspondence should be addressed.
Forests 2025, 16(11), 1644; https://doi.org/10.3390/f16111644
Submission received: 1 October 2025 / Revised: 17 October 2025 / Accepted: 26 October 2025 / Published: 28 October 2025
(This article belongs to the Section Forest Economics, Policy, and Social Science)

Abstract

The sustainable management of forest supply chains is particularly challenging in regions affected by socio-territorial conflicts, such as southern Chile, where Indigenous land claims and environmental concerns complicate operations. This study develops and applies a multi-objective mixed-integer linear programming (MILP) model to support tactical planning of the forest-to-lumber supply chain. The model operates the three pillars of sustainability through representative variables: raw material consumption (economic efficiency), transport distance (environmental impact), and exposure to territorial conflicts (social risk). These sustainability dimensions are consistent with the United Nations Sustainable Development Goals (SDGs) 8 (Decent Work and Economic Growth), 9 (Industry, Innovation and Infrastructure), 12 (Responsible Consumption and Production), and 16 (Peace, Justice and Strong Institutions). Computational experiments reveal Pareto trade-offs between productive efficiency and social vulnerability, showing that simpler logistics networks can substantially reduce conflict exposure without significant efficiency losses. Additionally, the strategy of minimizing the production of lumber that does not have immediate demand also helps reduce log consumption and improves log yield. The results provide a decision-oriented framework for conflict-sensitive supply chain planning, contributing to more resilient, socially responsible, and sustainable forest operations in Chile.

1. Introduction

Supply chain optimization has been widely studied, with classical approaches such as linear programming, heuristics, and simulation models commonly applied to improve efficiency and support decision-making in industrial settings [1]. In the forestry sector, supply chain management typically involves harvesting, transportation, and processing planning, which have been extensively analyzed in seminal studies on logistics and mathematical modeling [2]. The forest-to-lumber supply chain presents additional challenges due to the complexity of harvesting and logging operations, sawmilling processes, and market fluctuations, making advanced optimization strategies essential for enhancing sustainability [3,4].
In this context, sustainable planning in the forest sector is closely related to the principles of the United Nations Sustainable Development Goals (SDGs), particularly Goals 8 (Decent Work and Economic Growth), 9 (Industry, Innovation and Infrastructure), 12 (Responsible Consumption and Production), and 16 (Peace, Justice and Strong Institutions). These goals emphasize efficient resource use, environmentally responsible production, and social stability in territories affected by conflict.
Recent studies on sustainable forest supply chain management have highlighted the need to incorporate not only economic and environmental objectives but also social dimensions into decision-making processes [5,6,7,8,9,10]. However, most optimization approaches still emphasize cost and efficiency, overlooking the territorial and community-related challenges present in regions such as southern Chile, where forestry operations coexist with Indigenous land claims and social tensions.
Accordingly, the objective of this study is to develop and apply a multi-objective mixed-integer linear programming (MILP) model that integrates economic, environmental, and social dimensions to support tactical planning of the forest-to-lumber supply chain in southern Chile. The model includes a social conflict exposure index to quantify territorial risk and evaluate trade-offs among the three pillars of sustainability.
This study sought to address the following research questions:
(i)
How do logistical decisions in the forest-to-lumber supply chain influence exposure to territorial conflicts in socially sensitive regions?
(ii)
Which operational strategies can balance economic, environmental, and social sustainability in conflict-affected territories?
In this study, the social conflict exposure index was considered an external territorial factor influencing supply chain performance. The novelty of our approach was the integration of this index into the optimization model as a social objective, which enables tactical decisions such as route selection and flow allocation to minimize overall exposure. Rather than modeling changes in conflict intensity, the objective is to evaluate how different exposure levels affect performance and to identify resilient configurations.

1.1. Contributions of This Study

This study made three key contributions:
(1)
It introduced a novel social conflict exposure index for the forest-to-lumber supply chain. The index is derived from region-specific historical data and expert weightings, providing a quantitative measure of territorial risk not addressed in previous optimization models
(2)
It integrated this social dimension into a multi-objective mixed-integer linear programming (MILP) model, together with economic and environmental objectives, allowing for an explicit balance among the three pillars of sustainability.
(3)
It presented extensive computational experiments, including trade-off analyses and sensitivity tests, to evaluate how changes in the conflict exposure index affect network configuration, supply chain efficiency, and social vulnerability.
Unlike traditional parameters such as distance or cost, the conflict exposure index formalizes heterogeneous territorial risks into a comparable quantitative measure. Its integration generates trade-offs and logistics configurations that cannot be captured by minimizing distance or cost alone, which reinforces that the model itself is not trivial. This strengthens the mathematical representation of socially sensitive supply chains, extending operations research beyond purely economic and environmental dimensions.

1.2. Literature Review

Sustainable forest supply chain management is an increasingly critical challenge and requires integrated strategies to balance environmental, economic, and social objectives [5,6]. The forest-to-lumber supply chain spans multiple stages, including timber harvesting, processing, inventory management, and distribution. It involves diverse actors, complex logistical coordination, and sustainability-driven practices [7,8]. Given this complexity, there is a need for comprehensive optimization models to address sustainability challenges in harvest planning, transportation logistics, and raw material transformation [9,10].
Since the early 2000s, research on forest supply chain management has evolved significantly. Early studies focused on maximizing value while maintaining sustainability [11]. Later work emphasized how forest raw material management influences the profitability of the lumber industry. This supply chain is characterized by fragmented production and high demand variability, which requires adaptive strategies [12]. Geographic-specific studies have further refined optimization approaches. For example, in Sweden, integrating operations and improving stakeholder communication proved essential for efficiency [13]. In Chile, mathematical programming models have been applied to optimize harvesting strategies and sawmill production, improving raw material utilization while mitigating overharvesting impacts [14].
Mathematical models and simulation tools have been instrumental in optimizing forest-to-lumber operations at the strategic, tactical, and operational levels, covering harvesting, processing, and distribution [2]. Decision support systems and spatial analysis technologies have further improved logistics efficiency in the lumber industry [15,16,17]. In addition, optimization models that address uncertainty have gained traction, using discrete-event simulation and stochastic optimization to evaluate supply chain performance under varying climatic conditions [18,19,20]. The convergence of traditional methodologies with modern technologies represents a transformative shift toward more sustainable and intelligent forest-to-lumber supply chain management.
Initially, sustainability in the forest-to-lumber industry lacked structure but has progressively incorporated economic, environmental, and social dimensions across all stages of the supply chain [6]. A systematic review of research from 2018 to 2023 shows a predominant focus on economic and environmental aspects, while social sustainability has received comparatively less attention [10]. Yet, the social dimension remains crucial, shaping employment, community development, and quality of life in forestry-dependent regions [21].
Multi-objective optimization methodologies have emerged as a key tool for integrating the three pillars of sustainability into decision-making processes [22]. Traditional models typically prioritize cost minimization and profit maximization [9], while environmental metrics include greenhouse gas emissions, carbon sequestration, fuel consumption, and biodiversity conservation [10]. In contrast, social sustainability has been addressed through models that optimize employment, working conditions, and community development while respecting cultural values and human rights [10,23]. This integration is particularly relevant in emerging contexts, where socially responsible supply chains remain nascent and underdeveloped [24].
A more holistic approach to forest-to-lumber supply chain sustainability has also emerged in recent studies. For example, ref. [25] developed a multi-objective tree-level harvesting model that integrates advanced algorithms for sustainable planning. Similarly, ref. [26] proposed a nonlinear, multi-objective programming model to optimize costs, environmental impacts, and social benefits in forest management. Other works have focused on specific dimensions, such as carbon sequestration optimization to balance economic and ecological benefits [27]. In addition, ref. [28] analyzed circular business models within the forest bioeconomy, linking internal factors such as social capital, dynamic capabilities, and entrepreneurial orientation with external regulatory, technological, and sociocultural variables.
Digitalization and Industry 4.0 have further transformed sustainability management into forest supply chains. For instance, blockchain technologies enhance traceability and authenticity in sustainable wood products [29]. The concept of Forestry 4.0, introduced by [30], extends Industry 4.0 principles to forestry by leveraging digital twins, the Internet of Things (IoT), and data-driven technologies to optimize harvesting, transportation, and traceability. Nevertheless, in regions with high levels of social conflict, these technologies need to be adapted to local territorial dynamics.
A major challenge for the forest-to-lumber supply chain is the prevalence of social conflicts arising from land disputes, labor issues, environmental regulations, Indigenous rights, and economic pressures [31]. Such conflicts disrupt industry operations and undermine both sustainability and the equitable distribution of benefits [32]. In Chile, the forestry sector has been historically shaped by disputes, particularly in the southern macrozone, where Indigenous communities oppose the expansion of monoculture plantations on lands, they consider ancestral. Environmental degradation and water scarcity have further exacerbated community tensions [33]. Sustainability certifications, such as the Forest Stewardship Council (FSC), have also been criticized for failing to address territorial claims and, in some cases, for exacerbating conflicts [34]. Moreover, perceptions of state-supported extractivism have fueled local resistance, reinforcing opposition to forestry activities [35].
Research highlights the need for strategies that balance economic development with social stability [35,36,37]. The forest sector must navigate competing land uses, community relations, and resource ownership disputes, which together create a complex operational landscape. In Chile, growing tensions between Indigenous communities and forestry companies have increased operational risks and highlighted the need to incorporate equity and social participation metrics into sustainable management models [38,39,40,41,42].
Different disciplines have also addressed the quantitative treatment of conflicts in decision-making. An early example is the work of Pawlak [43], who developed mathematical frameworks for negotiation and dispute resolution in complex systems, although not specifically in supply chains. These approaches remain conceptually valuable and have been adapted in this study to analyze conflict dynamics in the forest-to-lumber supply chain.
In this context, decision-making in the forest-to-lumber supply chain must operate efficiently in territories where environmental pressures, economic demands, and persistent social tensions converge. In the southern macrozone of Chile, territorial conflicts, related to Indigenous rights, land use, and opposition to forestry expansion, require the inclusion of new variables in decision models that capture social vulnerability and anticipate its impact on logistical viability. Although advanced models address operational and environmental aspects, the explicit integration of the social dimension in conflict-prone contexts remains limited in the literature.
In contrast to previous studies that optimize forest supply chains under multiple criteria [24,25], this study incorporates a novel and explicit social dimension through a quantitative index of conflict exposure. The index is derived from historical events and expert weightings and is directly integrated into the MILP formulation as an objective function, allowing territorial risk within the logistics process to be evaluated and minimized. This approach represents a significant advance over prior systematic reviews [10], which noted the limited formal integration of social sustainability into quantitative models.
To summarize the main approaches identified in the literature, Table 1 presents an overview of selected studies, their methodological focus, sustainability dimensions, and the main gaps identified.
As shown in Table 1, most existing optimization models emphasize economic and environmental performance, while the explicit incorporation of social or territorial conflict indicators remains limited. This study addresses that gap by proposing a quantitative model that integrates social conflict exposure as a third sustainability objective.

2. Materials and Methods

This study developed a comprehensive model with three objective functions, which are optimized under a set of constraints to support sustainable decision-making in a Chilean forest-to-lumber supply chain. The model integrates the three pillars of sustainability (economic, environmental, and social) by minimizing raw material consumption, transportation distance, and exposure to territorial conflicts through a conflict exposure index. It considers variables related to surplus generation, cutting losses, and network complexity. The model is evaluated under different computational scenarios to analyze how variations in supply, demand, and social conflict intensity affect overall system performance and identify more resilient and balanced configurations. Figure 1 provides a schematic representation of the forest-to-lumber supply chain and its main decision components.

2.1. Study Area

The southern macrozone of Chile is one of the country’s main forested regions. It contains extensive plantations of Radiata pine (Pinus radiata) and eucalyptus (Eucalyptus spp.), covering approximately 1,335,331 hectares [44].
Between 2020 and 2022, this region was a major contributor to national forest production, particularly in lumber and related products. The plantations and sawmills in the supply chain analyzed here (eight cut blocks and four sawmills) are in the Bío-Bío and La Araucanía regions. These operations have faced logistical disruptions due to social conflicts [45], which have affected both transportation and processing activities
Figure 1 illustrates the spatial distribution of the cut blocks and sawmills that comprise the supply chain under study.

2.2. Forest-to-Lumber Supply Chain

Figure 2 shows the forest-to-lumber supply chain network analyzed in this study, which includes cut blocks, transportation routes, sawmills, and final markets or customers. Cut blocks (i = 1,…,8) are connected to sawmills (j = 1,…,4) by transportation routes and distances between nodes were calculated using Google Maps API. Some of these routes have a high degree of exposure to social conflicts and are prioritized for reduction through objective function z3, which quantifies conflict exposure along transport arcs. Logs from each site i are processed in sawmills j using cutting patterns k documented in [46], generating products that satisfy market demand. In the model, a binary variable activates or deactivates routes, while another variable quantifies the log flow.
A series of parameters, described below, were used to mathematically model this forest-to-lumber supply chain.
The cutting patterns represent how a log breaks down into several products. They are expressed as a vector indicating the quantity of products generated for each log class. Each log class is compatible with a subset of cutting patterns, determining its utilization and efficiency in the sawmilling process. In this study, the cutting patterns documented in the research of Ramos-Maldonado et al. [46] were used since they correspond to the same scope of application. In addition, it is possible to obtain relevant secondary data, such as the total volume processed and the quantity of products generated from this information.
The degree of exposure to social conflict is a normalized metric reflecting the severity and frequency of disruptive events along each supply chain connection. It is calculated in the following steps:
  • Data collection: Secondary information was compiled from news articles, institutional reports, and historical records of events associated with the supply chain’s nodes and arcs.
  • Event classification: Events were grouped into 14 categories, including fire, armed attack, machinery burning, truck burning, occupation, police action, court of guarantee, communiqués, roadblocks, threats, explosions, fatalities, protests, and robberies.
  • Severity weighting: Conflict severity weights were established through a combination of secondary data analysis and expert assessment. Three professionals with experience in Chile’s southern macrozone participated in this process: two logistics managers from the forestry sector and one territorial conflict analyst. These experts were selected for their extensive, on-the-ground knowledge of conflict-related disruptions affecting forest operations.
  • Each expert independently assigned severity scores on a 0–10 scale to the 14 event types, considering three main criteria: (i) operational impact, (ii) frequency of occurrence, and (iii) potential risk escalation. To ensure consistency, a comparative analysis was carried out, and final weights were obtained by averaging the scores. This method provided a balanced representation of both technical and territorial perspectives. Table 2 summarizes the assigned weights.
  • Conflict index calculation: The total degree of exposure to conflict for each arc was computed using Equation (1), which aggregates the weighted number of events:
D e t i j = h C i j h P h
where:
D e t i j : Total conflict exposure for the route between cut block i to sawmill j.
C i j h : Number of events of type h derived from data collected along the route between cut block i to sawmill j.
P h : The weight assigned to event type h.
Equation (1) was formulated to represent the total exposure of each route between cut block i to sawmill j, as a weighted sum of recorded conflict events. Each event category contributes to the exposure score according to its relative severity, as determined by expert judgment based on historical data and operational experience.
6.
Normalization: The normalized exposure index ( C o n f l i c t i j ) is obtained by dividing each arc’s total conflict score by the maximum value observed across all arcs, as shown in Equation (2). This normalization makes the values dimensionless and comparable across all routes, enabling consistent integration into the optimization model’s third objective function (z3), which minimizes social conflict risk along transportation routes.
C o n f l i c t i j = D e t i j m a x i j D e t i j
While the per-route conflict exposure values are fixed parameters derived from historical data and expert weightings, the overall exposure of the supply chain is determined by objective function z3. This depends on the combination of routes selected and the distribution of transport volumes across them. In this way, the social dimension of the model is directly shaped by tactical decisions, allowing the optimization to identify configurations that minimize exposure within the network.
This approach was based on the conceptual foundations of prior work on the quantitative representation of social conflicts in decision-making systems [43], and aligns with efforts to incorporate social dimensions into forest supply chain models [32,36].
In the computational experiments, the conflict exposure parameters correspond to 2022.
Beyond its quantitative construction, the conflict exposure index can be viewed as an expression of relational risks embedded in supply chain networks. This interpretation aligns with the concept of social capital, which highlights how trust, shared norms, and cooperation among actors contribute to long-term supply chain sustainability [47].
Other parameters include product volume n, which is calculated from product dimensions (thickness, width, and length) obtained in the sawing process. The volume loss corresponds to the fraction of a log that cannot be converted into products after applying cutting pattern k, including residues such as sawdust, slabs, and offcuts generated during sawmilling. The supply of logs from cut block i of log class l represents the available quantity of class l logs in cut block i, which can be transported to sawmills in the supply chain. The demand for product n at sawmill j is the required quantity determined by market needs or production commitments. The transport distance from cut block i to sawmill j is expressed in kilometers and represents the road distance required to move logs from their origin to their destination. Finally, the BigM parameter enables or disables conditional constraints based on binary decisions, ensuring logical consistency in route selection and allocation; it was set equal to the largest supply offered by any single cut block in the network.
Table 3 and Table 4 summarizes these parameters in the next subsection.

2.3. Mathematical Model

In this section, we describe the proposed MILP model for the forest-to-lumber supply chain. Before outlining the objective functions and constraints, we first introduce the model’s indexes, parameters, problem dimensions, and decision variables in Table 3, Table 4, Table 5 and Table 6.
For clarity, Table 5 summarizes the dimensions of the problem instances used in computational experiments. These values correspond to the baseline configuration described in Section 2.1 and Section 2.2 and include the network of cut blocks and sawmills, cutting patterns, product types, and log classes.
To ensure temporal consistency, the parameter values were defined using data from the year 2022, which also matches the supply and demand inputs. However, the model is not a simulation of that specific year. Instead, it operates on time-independent instances, designed to satisfy product demand under generalized structural conditions without incorporating time-dependent dynamics.
The proposed mathematical model includes three objective functions, which are applied in the experiments discussed in Section 3. These functions aim to: (i) minimize the volume of logs consumed, (ii) minimize transportation costs, and (iii) minimize exposure to social conflicts. Together, they capture key aspects of forest-to-lumber supply chain sustainability. This formulation follows the standard framework of multi-objective optimization, in which solutions are evaluated in terms of Pareto efficiency [48,49].
M i n   z 1 = i = 1 n b j = 1 n a l = 1 n d   k     C o m P a t t l B V o l l x i j k
M i n   z 2 = i = 1 n b j = 1 n a k = 1 n p d i s t i j x i j k
M i n   z 3 = i = 1 n b j = 1 n a C o n f l i c t i j y i j
j = 1 n a   k     C o m P a t t l x i j k S u p p l y i l                   i = 1 , , n b ,   l = 1 , , n d
i = 1 n b k = 1 n p P a t t k n x i j k = D e m a n d j n + S j n           j = 1 , , n a ,   n = 1 , , n t
k = 1 n p x i j k B i g M y i j           i = 1 , , n b ,   j = 1 , , n a
x i j k 0 ,   i n t e g e r                 i = 1 , , n b ,   j = 1 , , n a , k = 1 , , n p
y i j 0,1           i = 1 , , n b ,   j = 1 , , n a
S j n 0 ,   i n t e g e r           j = 1 , , n a ,   n = 1 , , n t
Equations (3)–(5) define the objective functions. Equation (3) minimizes the volume of logs consumed by sawmills. Here, represents the volume of a single log of class l expressed in cubic meters, and denotes the number of logs sent from cut block i to sawmill j using cutting pattern k. Although it does not explicitly include index l, each cutting pattern k is compatible with exactly one log class l, as specified in the model’s parameters. Therefore, the product × gives the total raw material volume for that specific flow, and summing over all relevant indexes yields the total log consumption in the supply chain. Equation (4) minimizes the transportation cost of logs from cut block i to sawmill j. Equation (5) minimizes exposure to social conflicts along the same transportation routes. This objective reduces the system’s vulnerability to social conflict by prioritizing routes with lower territorial risk. It also improves project acceptance among local communities and promotes more socially sustainable operations.
Equations (6)–(12) define the constraints of the model. Equation (6) specify log supply constraints, ensuring that the number of logs of a given diameter extracted from cut block i and processed in sawmills j using the compatible cutting patterns does not exceed the available supply in that block. Equation (7) establish demand constraints for products and surpluses, requiring that the number of products n generated from logs in cut blocks i and processed in sawmill j with cutting pattern k meets customer demand. Surpluses refer to products for which there is no current demand but a potential market. These constraints ensure that production is consistent with demand.
Equation (8) determine the use of arcs in the transport of logs between cut block i and sawmill j. The binary variable permits shipment only when it equals one. The BigM parameter, defined as a large number, ensures that when the variable equals one, logs can be shipped without additional restrictions; otherwise, no shipments are allowed. These constraints control the material flow between cut blocks and sawmills.
Equation (9) require that the number of processed logs be non-negative and integer. Equation (10) specify the binary nature of the decision variable, indicating whether shipments from cut block i to sawmill j are allowed. Finally, Equation (11) ensure that product surpluses are non-negative integers.

2.4. Computational Experiments

Three computational experiments were conducted to evaluate the model’s behavior under different operational and strategic conditions. Each experiment was designed to quantitatively analyze specific dimensions of sustainability, using tailored input configurations and solution methodologies consistent with its objectives.
In Experiment I, the ε-constraint method was applied by selecting one objective as the primary optimization target and treating the others as constraints with upper bounds ε. The ε-constraint method is a well-established approach for generating Pareto frontiers in multi-objective optimization [48,49]. The initial ε value corresponded to the minimum achievable value of the constrained objective in its single-objective formulation.
ε was then increased in fixed increments specific to each objectives pair: Δε = 0.3 for the z1–z3 comparison (Experiment I-A), Δε = 0.1 for the z2–z3 comparison (Experiment I-B), and Δε = 1.0 for the z3–z6 comparison (Experiment I-C), since z6 is an integer-valued measure representing the number of active network connections. For each ε setting, the model was solved with the Gurobi solver (version 12.0), using a time limit of 300 s per run. After solving all instances, dominated solutions were removed, and the remaining set formed the Pareto frontier for analysis. This procedure was repeated for each objective pair in Experiment I.

2.4.1. Experiment I—Multi-Objective Optimization with a Focus on Territorial Sustainability

The first experiment applied the ε-constraint method to explore trade-offs between conflicting objectives. For this purpose, Equation (12), which minimizes the number of connections between cut blocks and sawmills (z4), was added:
M i n   z 4 = i = 1 n b j = 1 n a y i j
The model was solved by considering three pairs of objective functions independently:
  • Experiment I-A: Logs consumed vs. territorial exposure to social conflicts (z1 vs. z3)
    Objective: Examine how minimizing log consumption (z1) is affected when the degree of exposure to social conflicts (z3) is progressively constrained.
    Method: ε-constraint with z1 as the primary objective, z3 as the constrained objective.
  • Experiment I-B: Transportation distance vs. territorial exposure to social conflicts (z2 vs. z3)
    Objective: Explore trade-offs between minimizing transportation distance (z2) and reducing exposure to social conflicts (z3).
    Method: ε-constraint with z2 as the primary objective, z3 as the constrained objective.
  • Experiment I-C: Territorial exposure to social conflicts vs. number of active connections (z3 vs. z4)
    Objective: Analyze the relationship between the exposure to social conflicts (z3) and the number of active connections (z4).
    Method: ε-constraint with z3 as the primary objective, z4 as the constrained objective.
This formulation allowed us to generate Pareto frontiers for each pair of objectives, revealing compromise zones where solutions with good logistical efficiency and low social impact, or simple networks with low territorial risk, can be achieved. This experiment illustrates the direct application of the model as a tool for sustainable decision-making in socially sensitive contexts.

2.4.2. Experiment II—Strategic Priorities Analysis

Objective: To study the system under different configurations of strategic priorities by applying a weighted combination of three objectives:
  • z1: log consumption (economic)
  • z5: surplus products (economic)
  • z6: cutting loss (environmental)
Method: Three weighting configurations (Tests 1–3) were tested to reflect alternative management priorities in balancing efficiency, waste reduction, and resource utilization.
The second experiment analyzed the system under varying configurations of strategic priorities. For this purpose, two additional objective functions were incorporated as alternatives to raw material consumption (z1). Equation (13) defines the objective of minimizing the volume of products produced in sawmills that customers do not demand (z5). These products currently lack demand but may have potential markets in the future.
Equation (14) defines the objective of minimizing the fraction of each log that cannot be converted into lumber (z6). This loss is associated with the cutting patterns applied when logs from cut block i are processed in sawmill j using cutting pattern k. It primarily consists of sawdust and wood chips, which may be repurposed for pellet production or as fuel for steam boilers.
M i n   z 5 = j = 1 n a n = 1 n t T a V o l n S j n
M i n   z 6 = i = 1 n b j = 1 n a k = 1 n p l o s s k x i j k
To expand the scope of analysis beyond the base model, Experiments II and III incorporated these additional objectives, bringing the total to six. Table 7 summarizes all objective functions, their sustainability dimension, and the experiments in which they are applied.

2.4.3. Experiment III—Individual Evaluation of Performance Measure

Objective: To evaluate the individual behavior of each of the six performance measures (z1–z6) under different supply and demand configurations.
  • Six supply scenarios: variations in spatial distribution of log availability.
  • Four demand scenarios: variations in product type requirements.
Method: Each performance measure was optimized individually for each configuration, allowing for an assessment of sensitivity to structural changes.
The third experiment analyzed the behavior of each of the six performance measures (z1–z6) under different supply and demand conditions. Six supply instances and four demand scenarios were considered to evaluate sensitivity to structural changes in the system.
  • Supply instances:
  • Homogeneous Supply (units)
  • Random Supply (units)
  • Homogeneous Log Supply in 2 Clusters (units)
  • Normally Distributed Log Supply in 2 Clusters (units)
  • Homogeneous Log Supply in 3 Clusters (units)
  • Normally Distributed Log Supply in 3 Clusters (units)
  • Demand scenarios:
  • Homogeneous Demand (units)
  • Demand Concentrated on Lower-Volume Products (units)
  • Demand Concentrated on Higher-Volume Products (units)
  • Demand Concentrated on Medium-Volume Products (units)
The complete datasets defining these supply and demand instances, including exact numerical values for log availability and product requirements, are provided in the Supplementary Materials to ensure reproducibility.
It is important to note that, in scenarios involving demand concentrated on low-volume products, total demand was reduced to 46% of the baseline. This adjustment was necessary to preserve model feasibility, as full demand levels resulted in infeasibility due to supply constraints. In the real world, when something like this happens, the decision maker partially meets the demand. The modification maintains realistic operational assumptions while preserving the validity of comparative analyses.
Table 8 shows a visual summary of the experimental structure of the study. The results of each experiment are presented and discussed in the following sections.

3. Results

Before presenting the results, it is important to note that three key data structures were developed to support the computational experiments: (i) a conflict degree matrix for the connections between forest cut blocks and sawmills for the year 2022; (ii) a distance matrix quantifying transport distances between all cut block–sawmill pairs; and (iii) supply and demand instances detailing log availability and product requirements across different scenarios. These datasets are essential for replicating the model and are provided as Supplementary Materials.

3.1. Social Conflicts in the Southern Macrozone

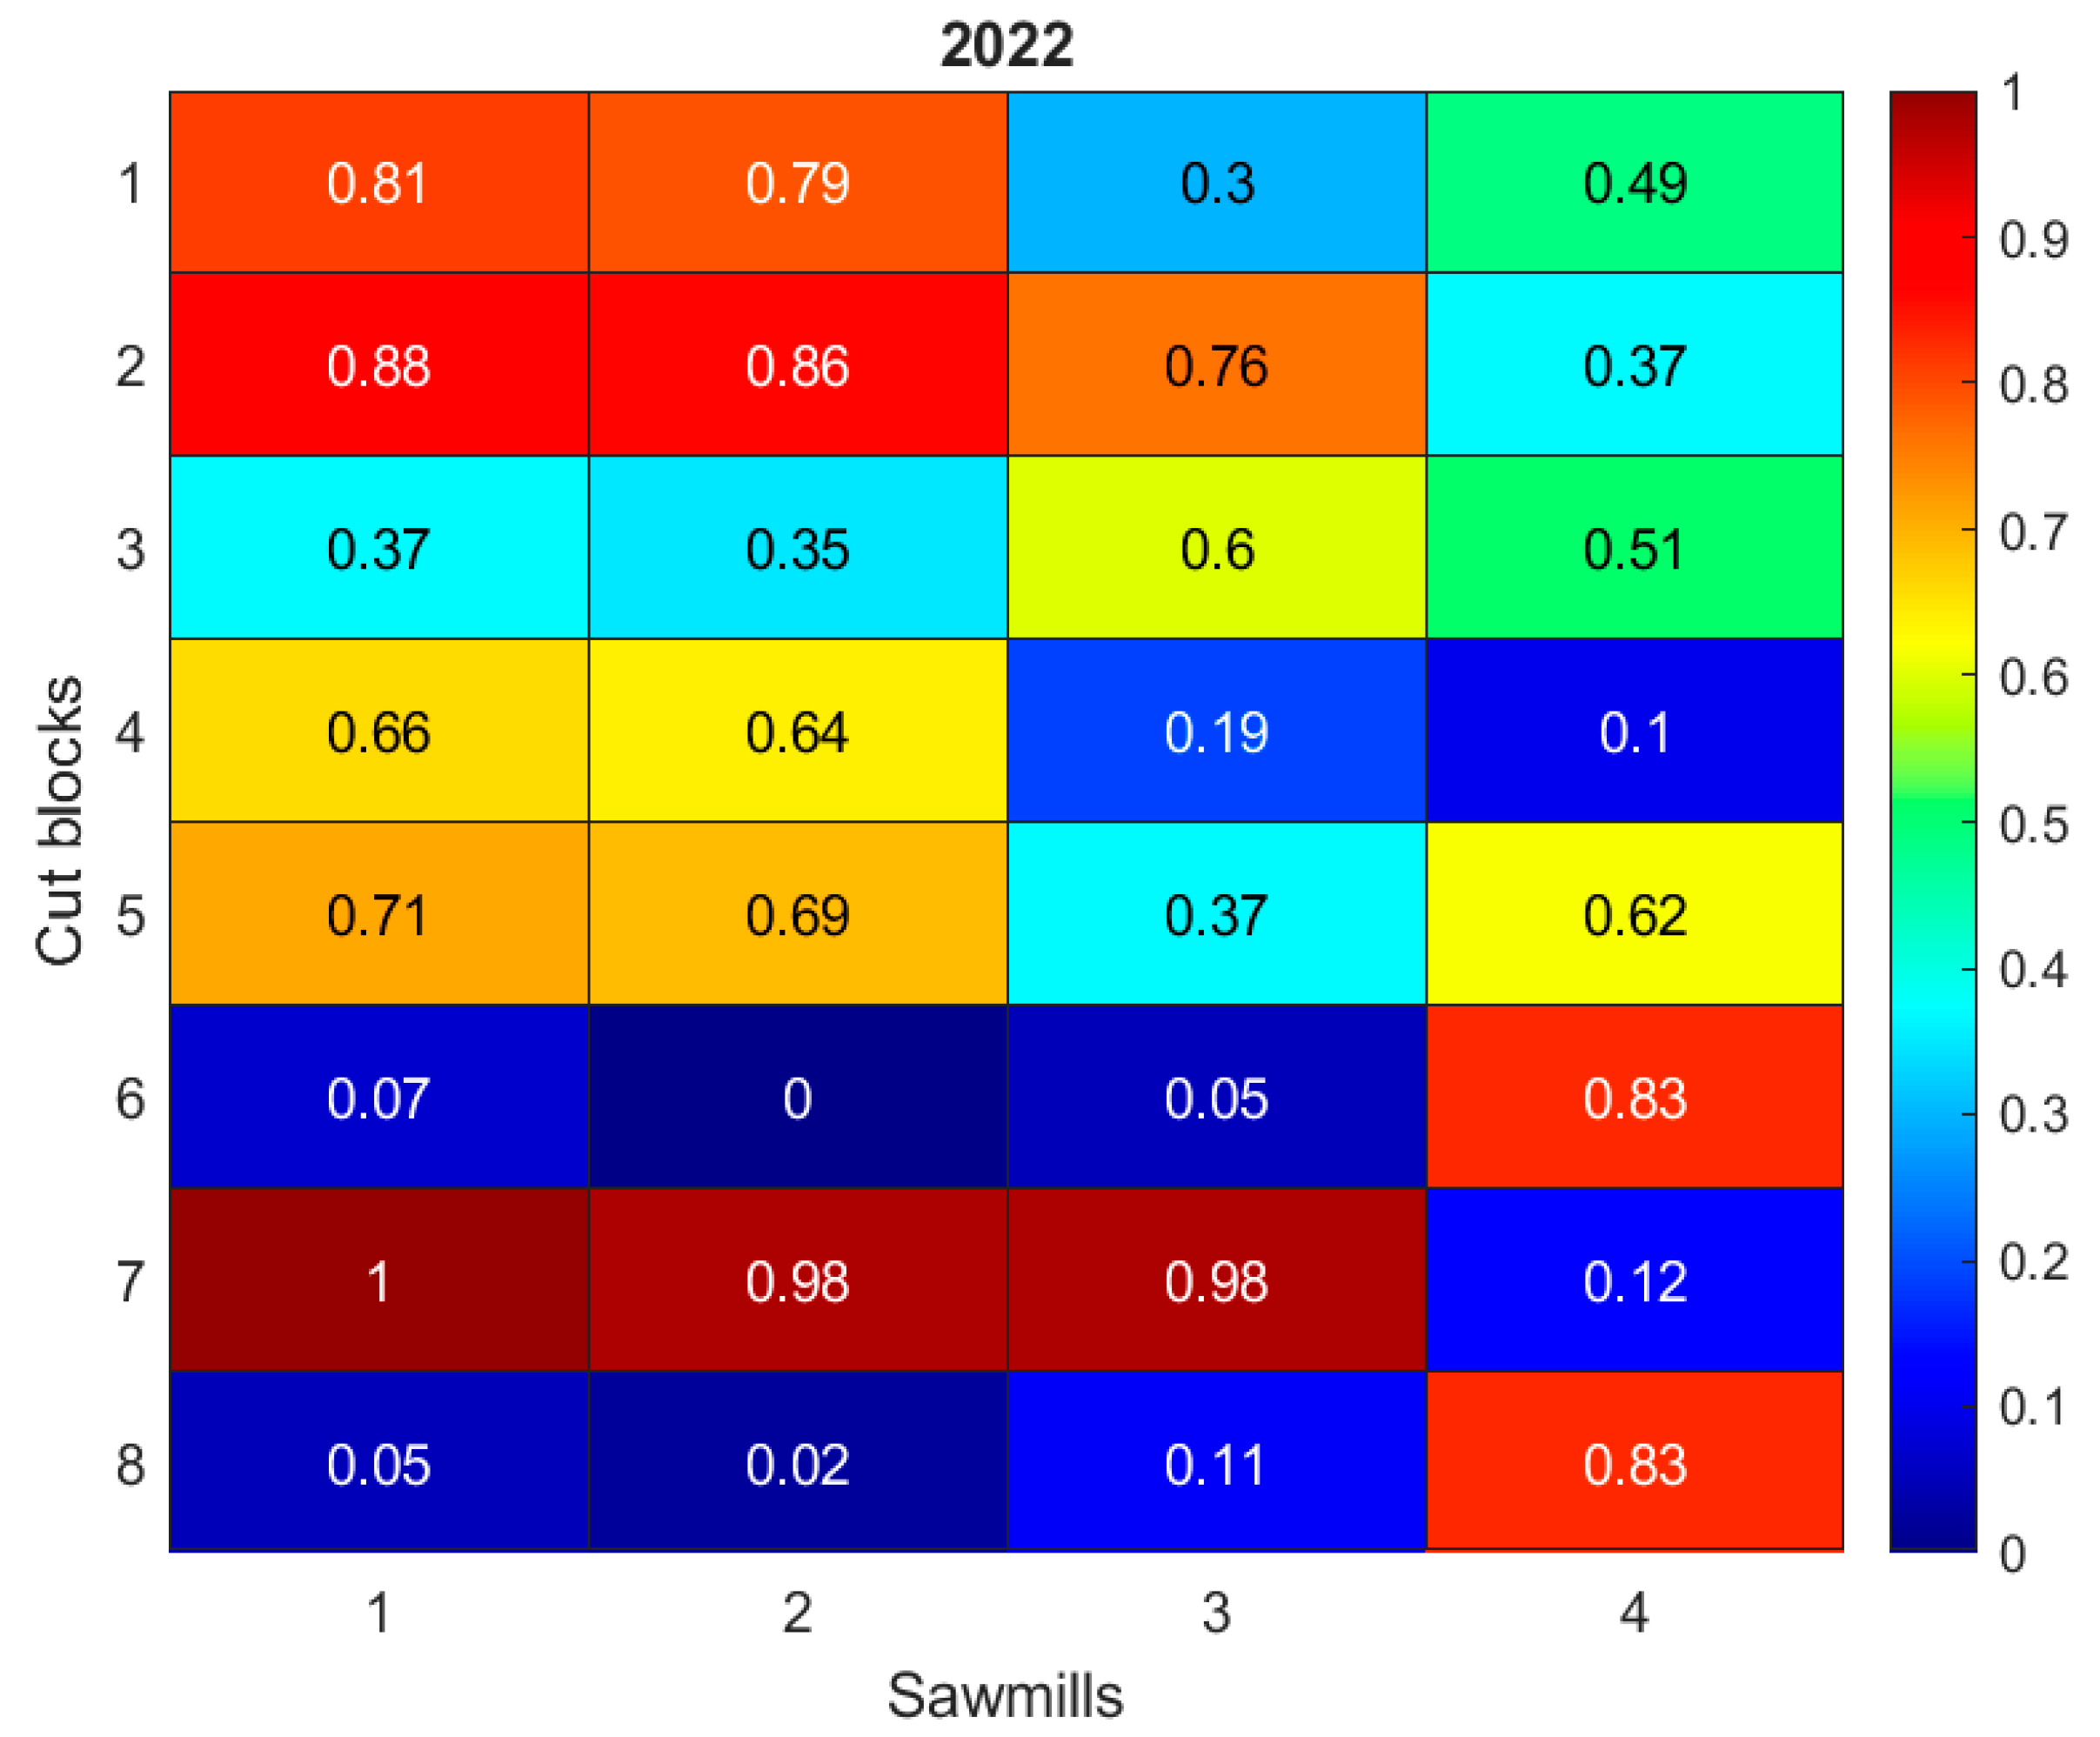
Following the methodology described in the previous section, a heat map was generated to illustrate the territorial distribution of conflict intensity across the logistical connections between the eight forest cut blocks and four sawmills for the year 2022 (see Figure 3). In the map, arcs represent potential transport routes, and the color indicates the level of conflict associated with each connection on a standardized scale, enabling rapid identification of critical logistics routes.

3.2. Solution Method

The global model consists of MILP formulations, solved using the Gurobi solver (version 12.0), coded in Julia (version 1.11), and executed on a computer with an Intel® Core™ i7-7700 3.40 GHz processor and 32 GB of RAM, utilizing up to 8 threads. Multi-objective configurations were addressed using the ε-constraint method, implemented in Julia and Gurobi.
The typical model size was approximately 236 constraints and 5244 variables. Unless otherwise noted, a time limit of 300 s was imposed. In cases where the 300 s limit was reached, the best integer solution obtained is reported.

3.3. Computational Results

The optimization model was evaluated through three computational experiments based on the created instances. The objectives of each experiment followed the descriptions provided in Section 2.4, ensuring consistency in the interpretation of methods and results.

3.3.1. Experiment I, Multi-Objective Optimization with a Focus on Territorial Sustainability

Experiment I-A: Log consumption vs. territorial exposure to social conflicts (z1 vs. z3).
Objective: To examine how minimizing log consumption (z1) is affected when the degree of exposure to social conflicts (z3) is progressively constrained. The ε-constraint method was applied with z1 as the primary objective and z3 as the constrained objective.
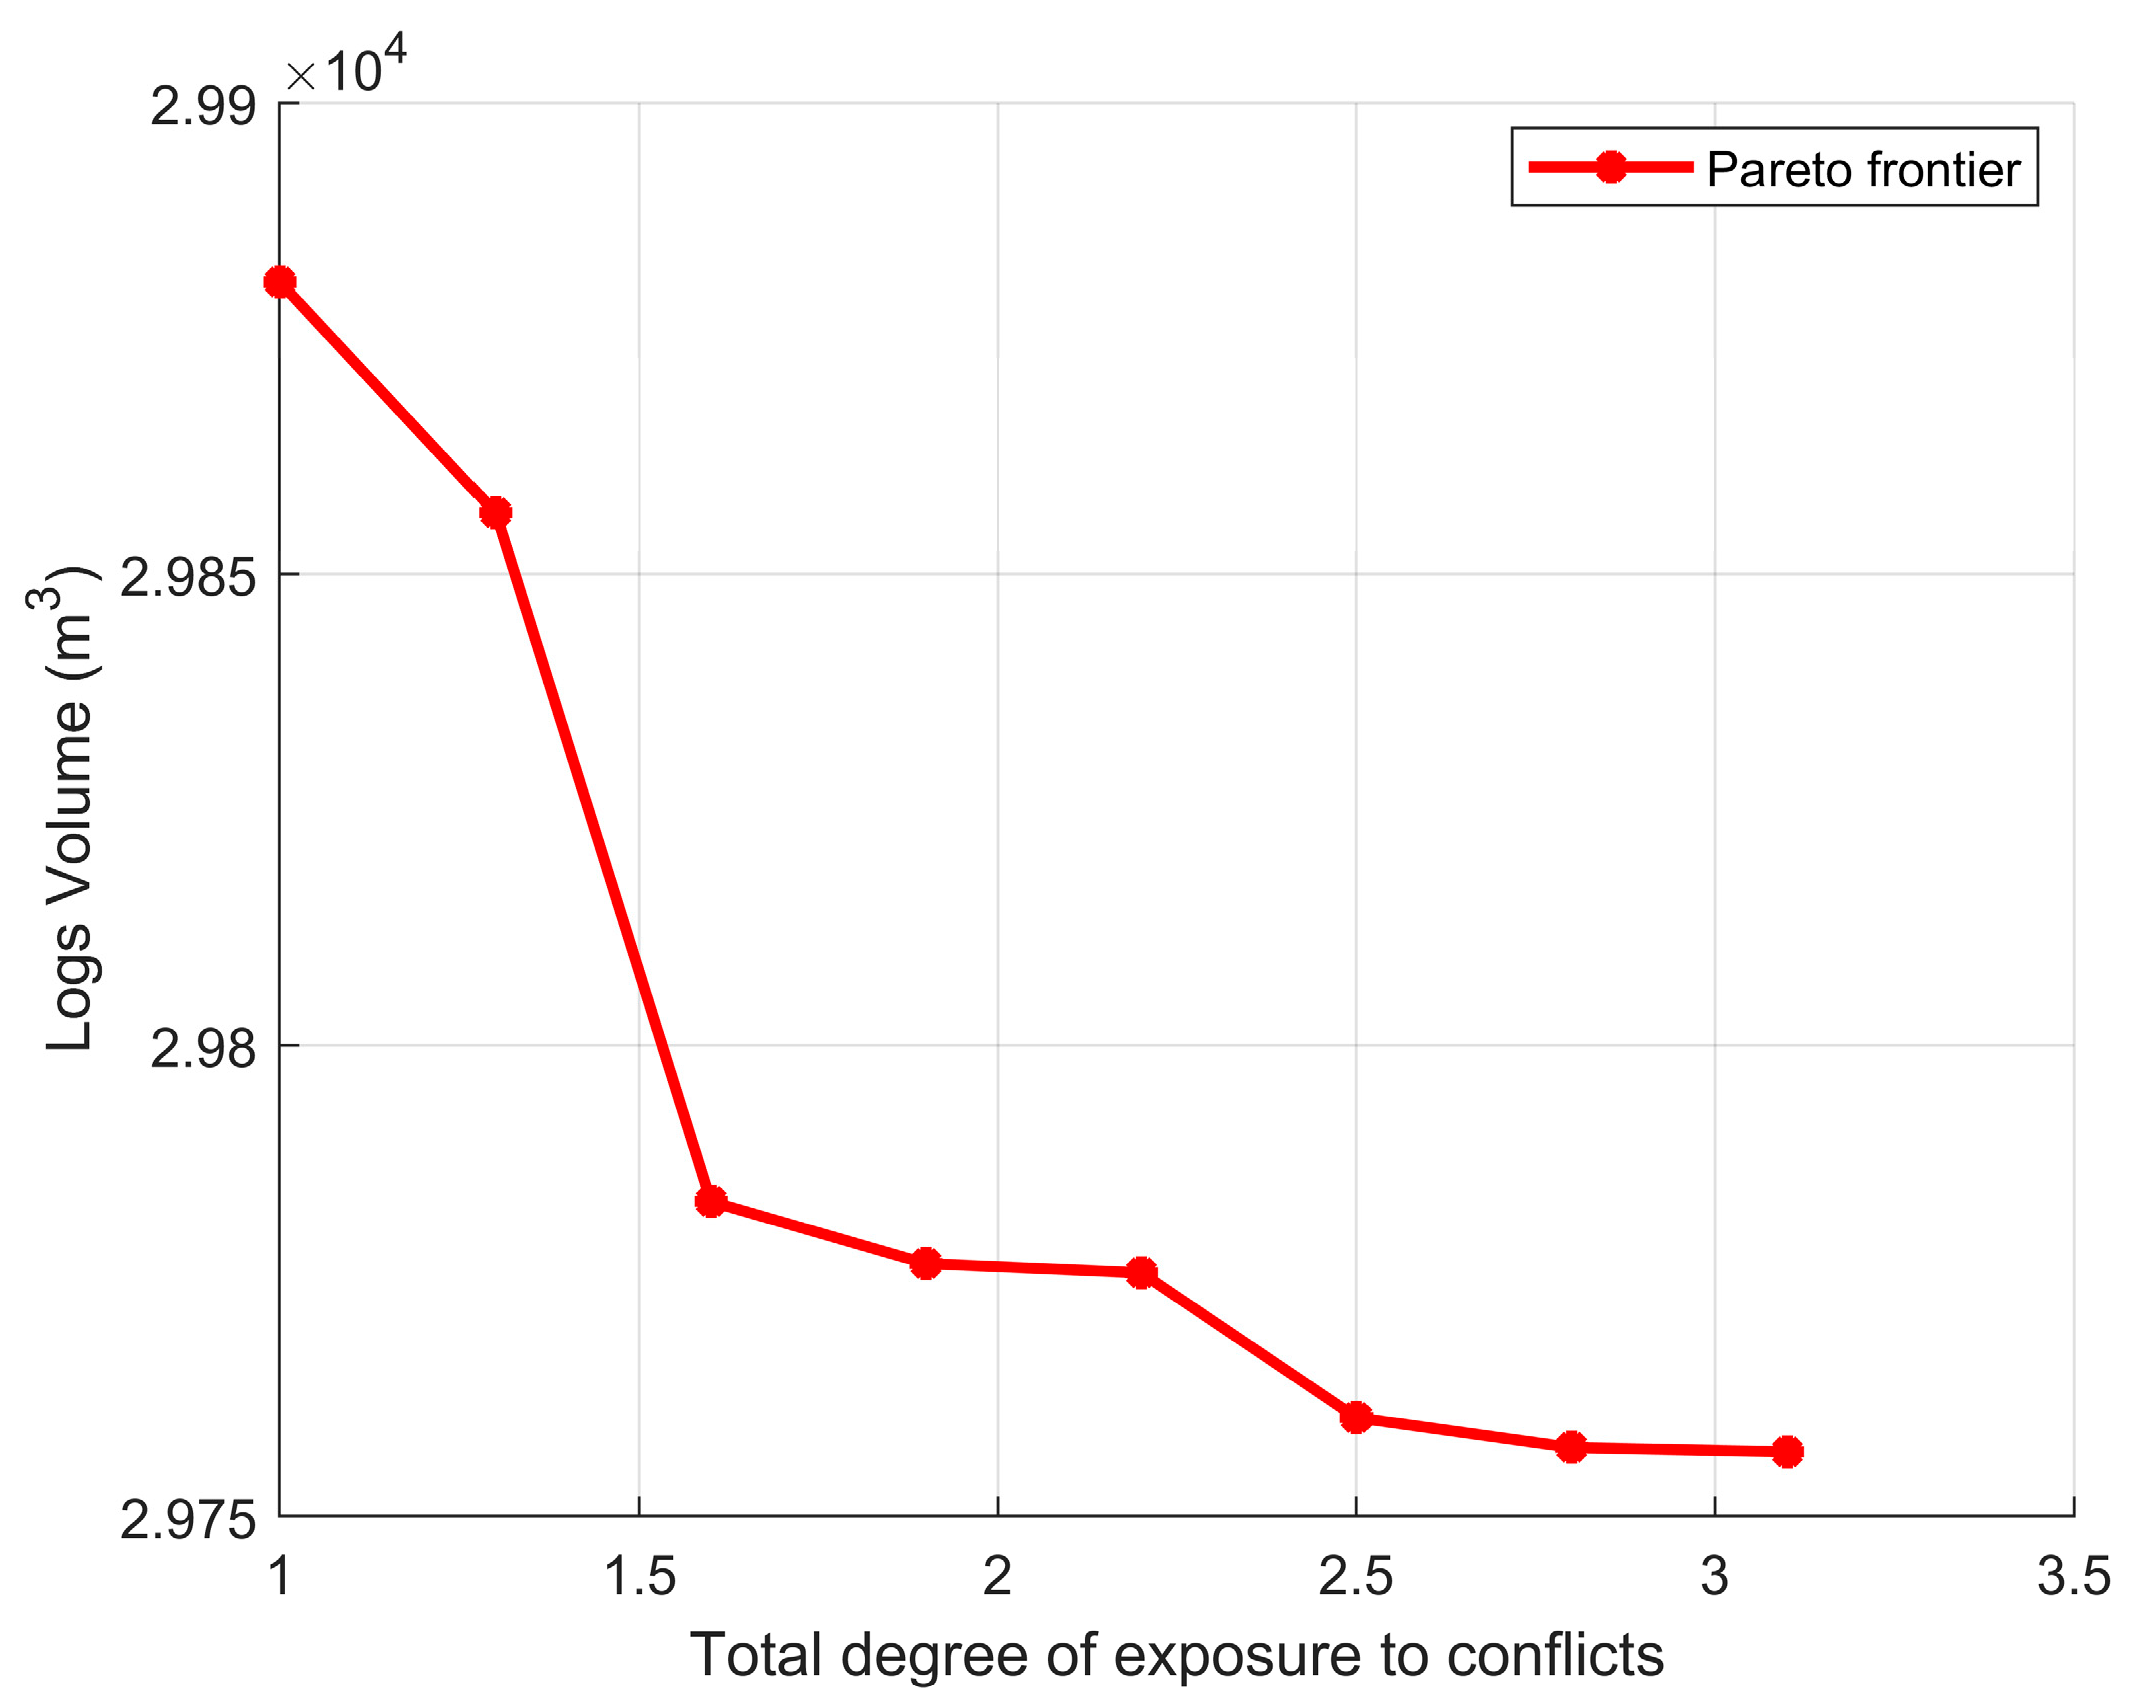
Results: Figure 4 presented the resulting Pareto frontier, showing that the total volume of logs required increases progressively as tolerance to social risk in the logistic network decreases. This indicates that limiting the use of routes with high conflict exposure reduces the options for efficient log allocation, thereby leading to higher raw material consumption.
From a tactical perspective, these solutions represent varying trade-offs between productive efficiency and social sustainability, enabling decision makers to select the configuration that best aligns with institutional objectives or community priorities.
Experiment I-B: Transportation distance vs. territorial exposure to social conflicts (z2 vs. z3).
Objective: To explore the trade-offs between minimizing transportation distance (z2) and reducing exposure to social conflicts (z3). The ε-constraint method was applied with z2 as the primary objective and z3 as the constrained objective.
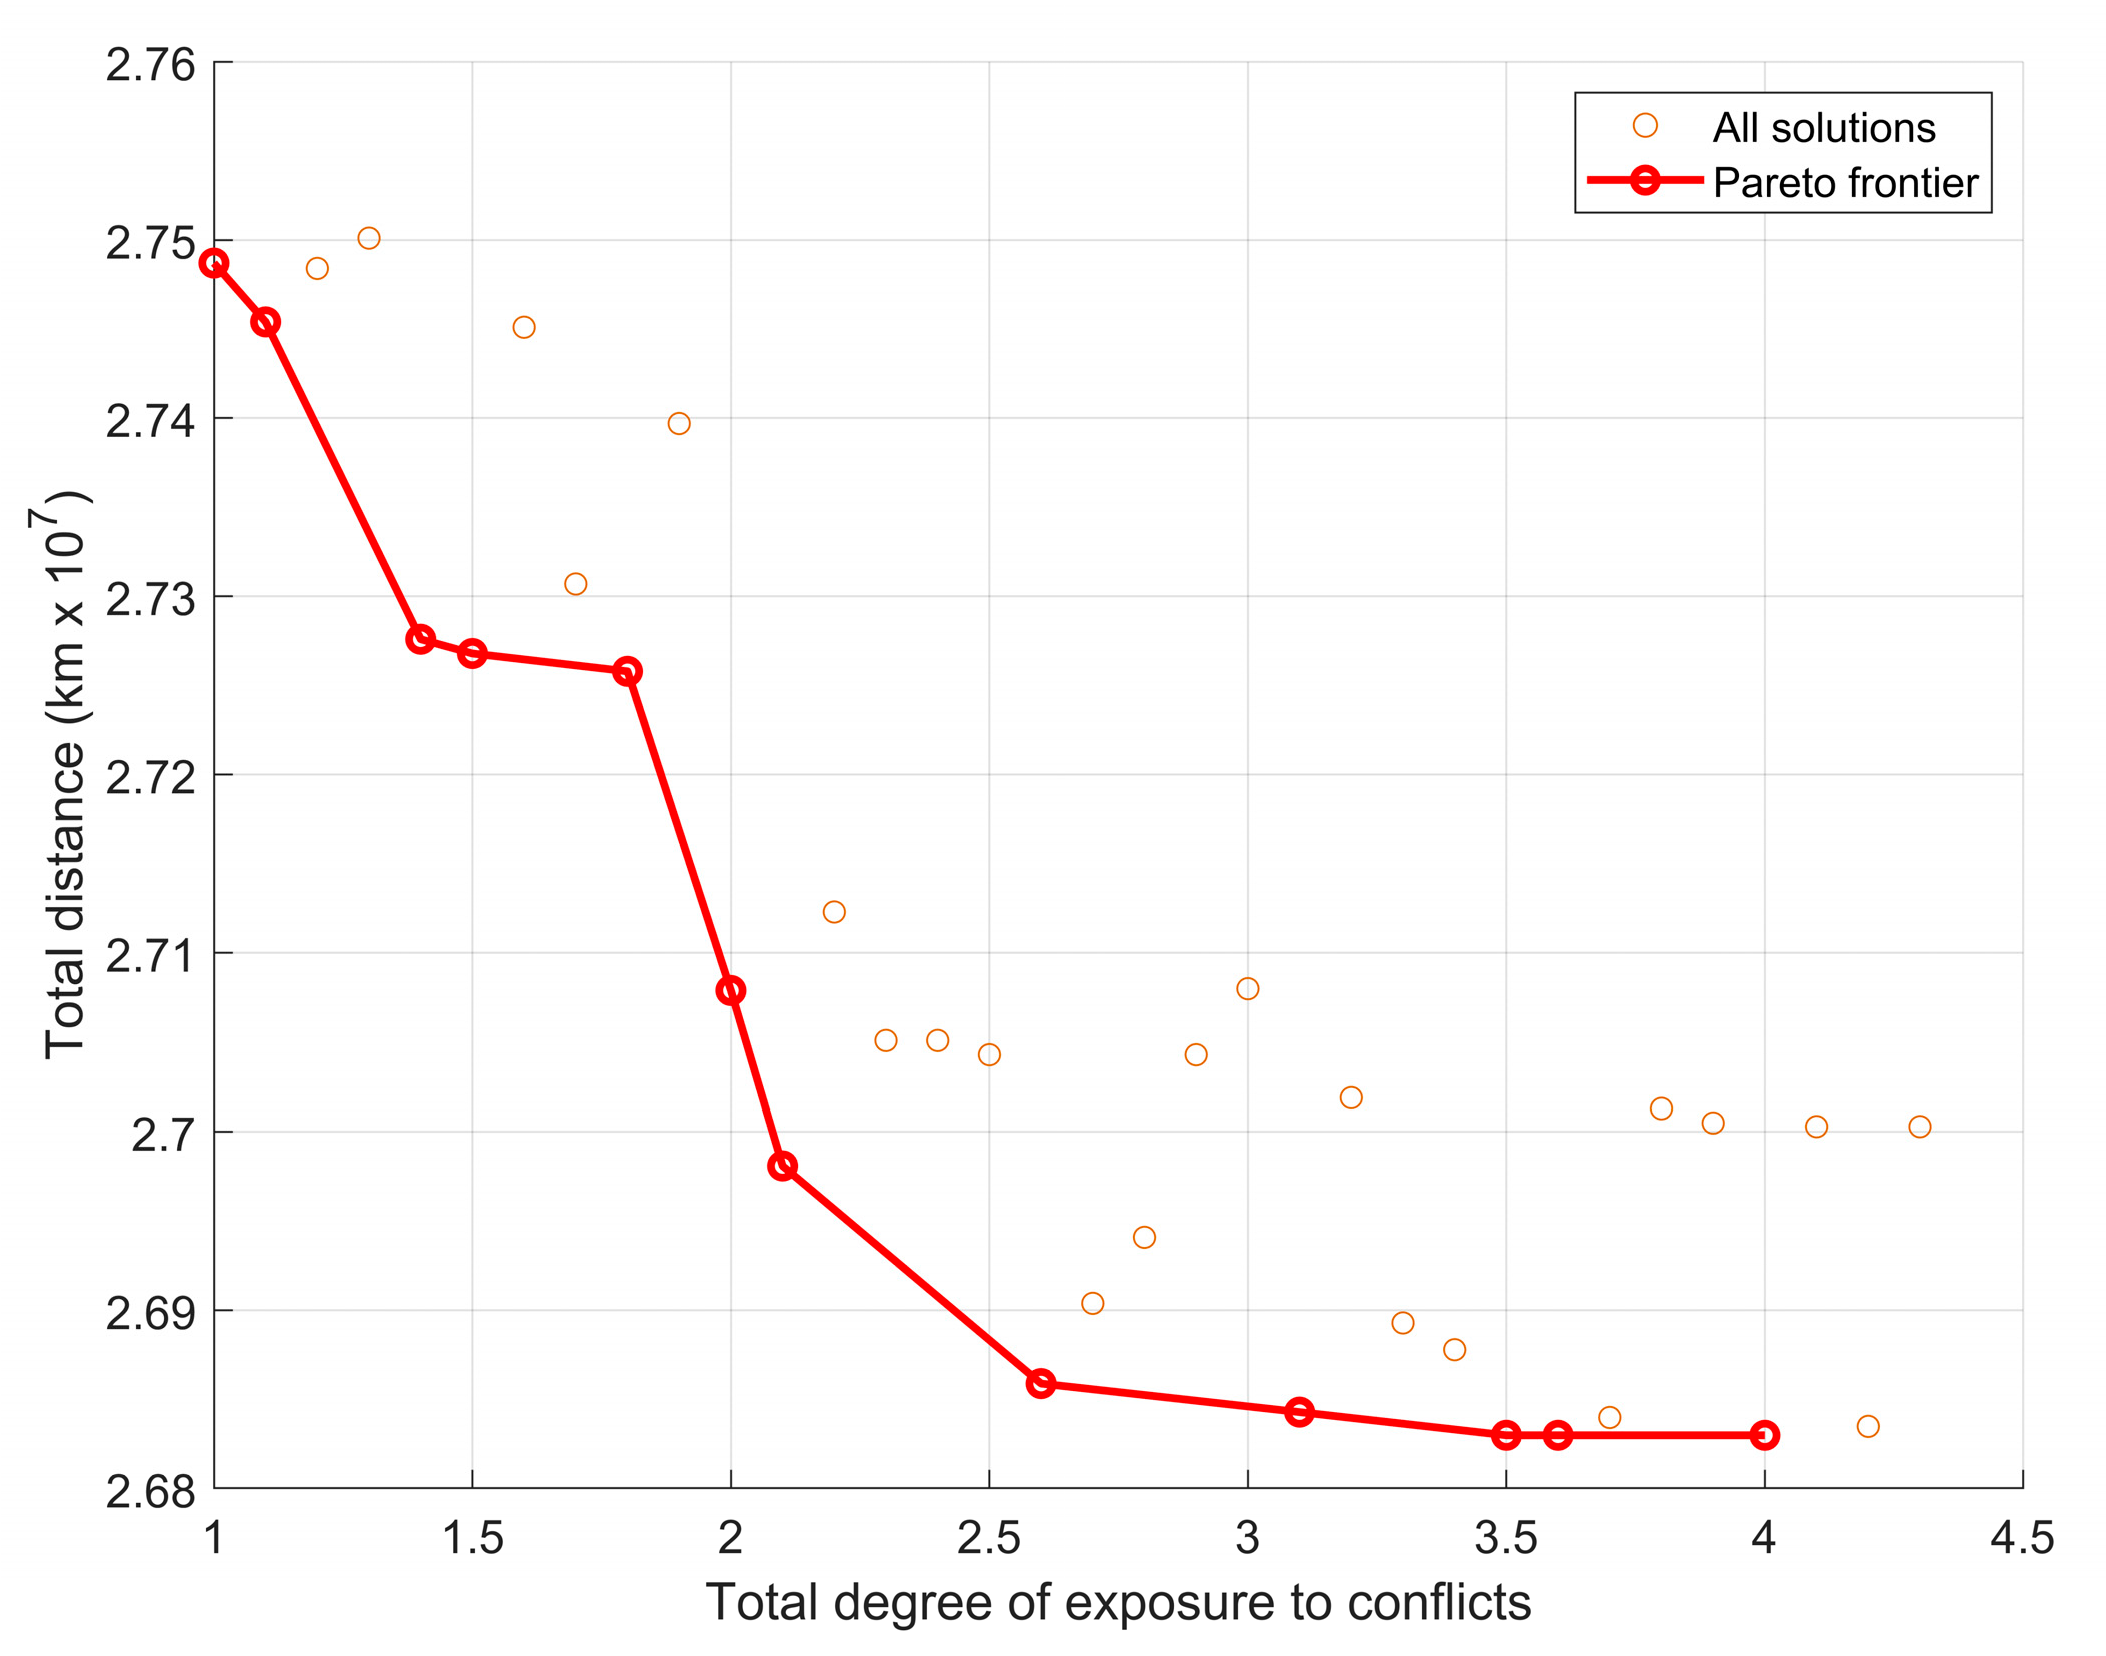
Results: Figure 5 presents the set of feasible solutions (orange dots) and the resulting Pareto frontier (red line). A clear inverse relationship was observed: as territorial exposure decreases, transportation distance increases. However, within the ε range of 2.5 to 3.5, distances close to the minimum observed (~2.68 units) are achieved alongside moderate exposure levels. These results highlight efficient compromise zones where both logistical performance and social risk are reasonably balanced.
Sensitivity of  C o n f l i c i j  parameter
The social objective z3 relies on the normalized exposure index C o n f l i c i j (Section 2.2, Equations (1) and (2)). To test its robustness, we applied a global scaling factor α ∈ {0.8, 0.9, 1.1, 1.2, 1.5} in Equation (15):
C o n f l i c i j = m i n ( 1 ,   α C o n f l i c i j )
For each α, we solved the ε-constraint model minimize z2 with the fixed bound z3 ≤ 2.3, chosen from the z2–z3 Pareto frontier in Experiment I-B. The following metrics were recorded: Δz2 (%), percentage of coincidence arcs, number of arcs leaving/entering and feasibility.
Table 9 shows that for ±10%–20% variations in C o n f l i c i j , the change in transportation distance was negligible (Δz2 ≤ 0.06%), arc coincidence high (≥87.5%), and only minor changes occurred (one arc leaving, up to two entering). For α = 1.5, however, Δz2 increased by +1.58%, arc coincidence dropped to 75%, and two arcs were replaced while two new arcs entered, reflecting rerouting toward less exposed connections. All solutions satisfied the bound z3 ≤ 2.3.
Interpretation: These results demonstrate that the model is stable under moderate perturbations (±10%–20%) of the normalized conflict exposure index C o n f l i c i j . Under such changes, the operational cost objective (z2) remains virtually unchanged (≤0.06%), and the network configuration remains highly stable (≥87.5% coincidence arcs), with only minor adjustments involving at most one arc leaving and two entering. By contrast, a severe increase (α = 1.5) triggers a reconfiguration of the network, replacing two arcs and adding two new ones to avoid higher-exposure routes. This adaptation increases z2 by about 1.58% and illustrates the intended trade-off between social risk and operational cost, confirming both the interpretability and the practical relevance of the social objective z3 in conflict-affected operational planning. These results state the consistency and practical validity of the proposed model, supporting its reliability for tactical forest supply chain planning.
Experiment I-C: Territorial exposure to social conflicts vs. number of active connections (z3 vs. z4).
Objective: To analyze the relationship between the number of active connections (z4) and exposure to social conflicts (z3). The ε-constraint method was applied with z4 as the primary objective and z3 as the constrained objective.
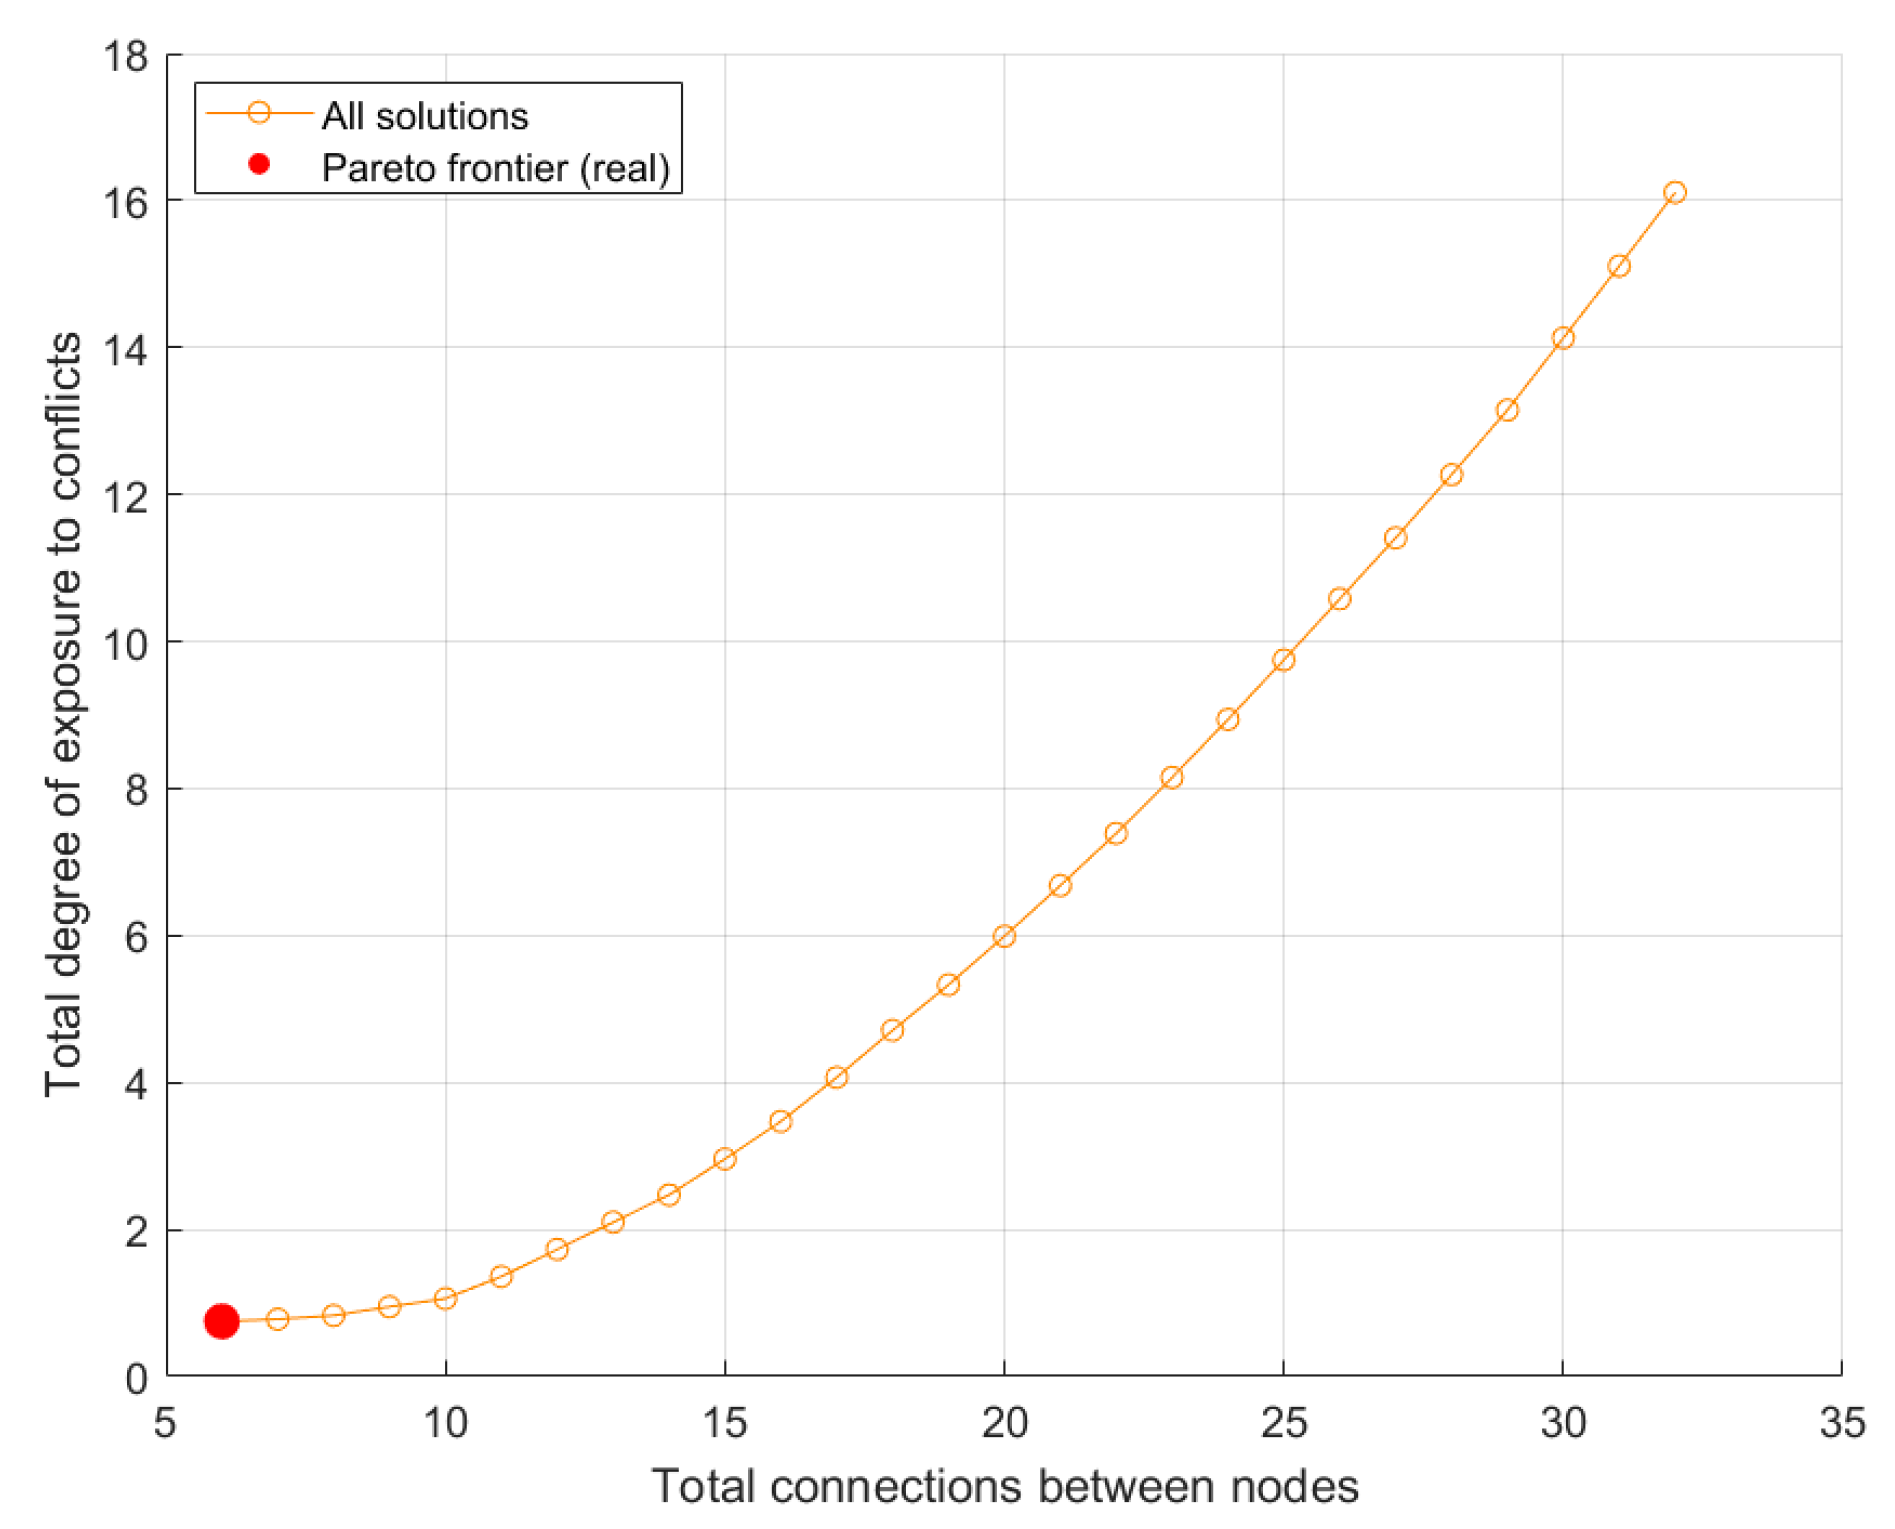
Results: Figure 6 shows the set of optimal solutions generated (orange dots) and highlights, with a red dot, the only solution belonging to the non-dominated set in this analysis (i.e., the true Pareto frontier).
An increasing quadratic relationship was observed between the total number of active connections (z4) and cumulative exposure to conflicts (z3). As the number of active arcs grows, exposure to socially conflictive routes also increases, reflecting a structural complexity penalty.
These results suggested that simpler logistics networks reduce both structural complexity and territorial exposure, thereby improving resilience in conflict-prone areas. While it may seem intuitive that increasing the number of active connections leads to greater conflict exposure, the model quantifies this relationship and identifies thresholds where added complexity significantly increases social risk. This finding supports the design of streamlined logistics networks that maintain functionality while minimizing territorial vulnerability.

3.3.2. Experiment II, Strategic Priorities Analysis

Objective: To analyze the system under different configurations of strategic priorities by applying a weighted combination of three objectives:
  • z1: log consumption (economic).
  • z5: surplus products (economic).
  • z6: cutting loss (environmental).
Results: Table 10 reports the original values obtained in each experimental scenario.
The values were normalized to the range [0.1, 1.0] to facilitate comparison between metrics of different magnitudes, while preserving the relative relationships across scenarios. Based on these normalized values, a three-dimensional representation was generated to visualize the performance of each strategy with respect to the three objective functions (see Figure 7).
Figure 7 shows that Testing 2 emerges as the most balanced alternative, combining low log consumption (0.1000), low surplus (0.1016), and moderate cutting loss (0.4896). By contrast, Testing 1 minimizes surplus but incurs the maximum cutting loss (1.0000), while Testing 3 achieves optimal cutting efficiency (0.1000) at the expense of high log consumption and surplus values (both normalized to 1.0000). These results highlight the inherent trade-offs between production efficiency, raw material use, and demand adjustment.

3.3.3. Experiment III, Individual Evaluation of Performance Measures

Objective: To evaluate the individual behavior of each of the six performance measures (z1–z6) under different supply and demand configurations:
  • Six supply scenarios: variations in spatial distribution of log availability.
  • Four demand scenarios: variations in product type requirements.
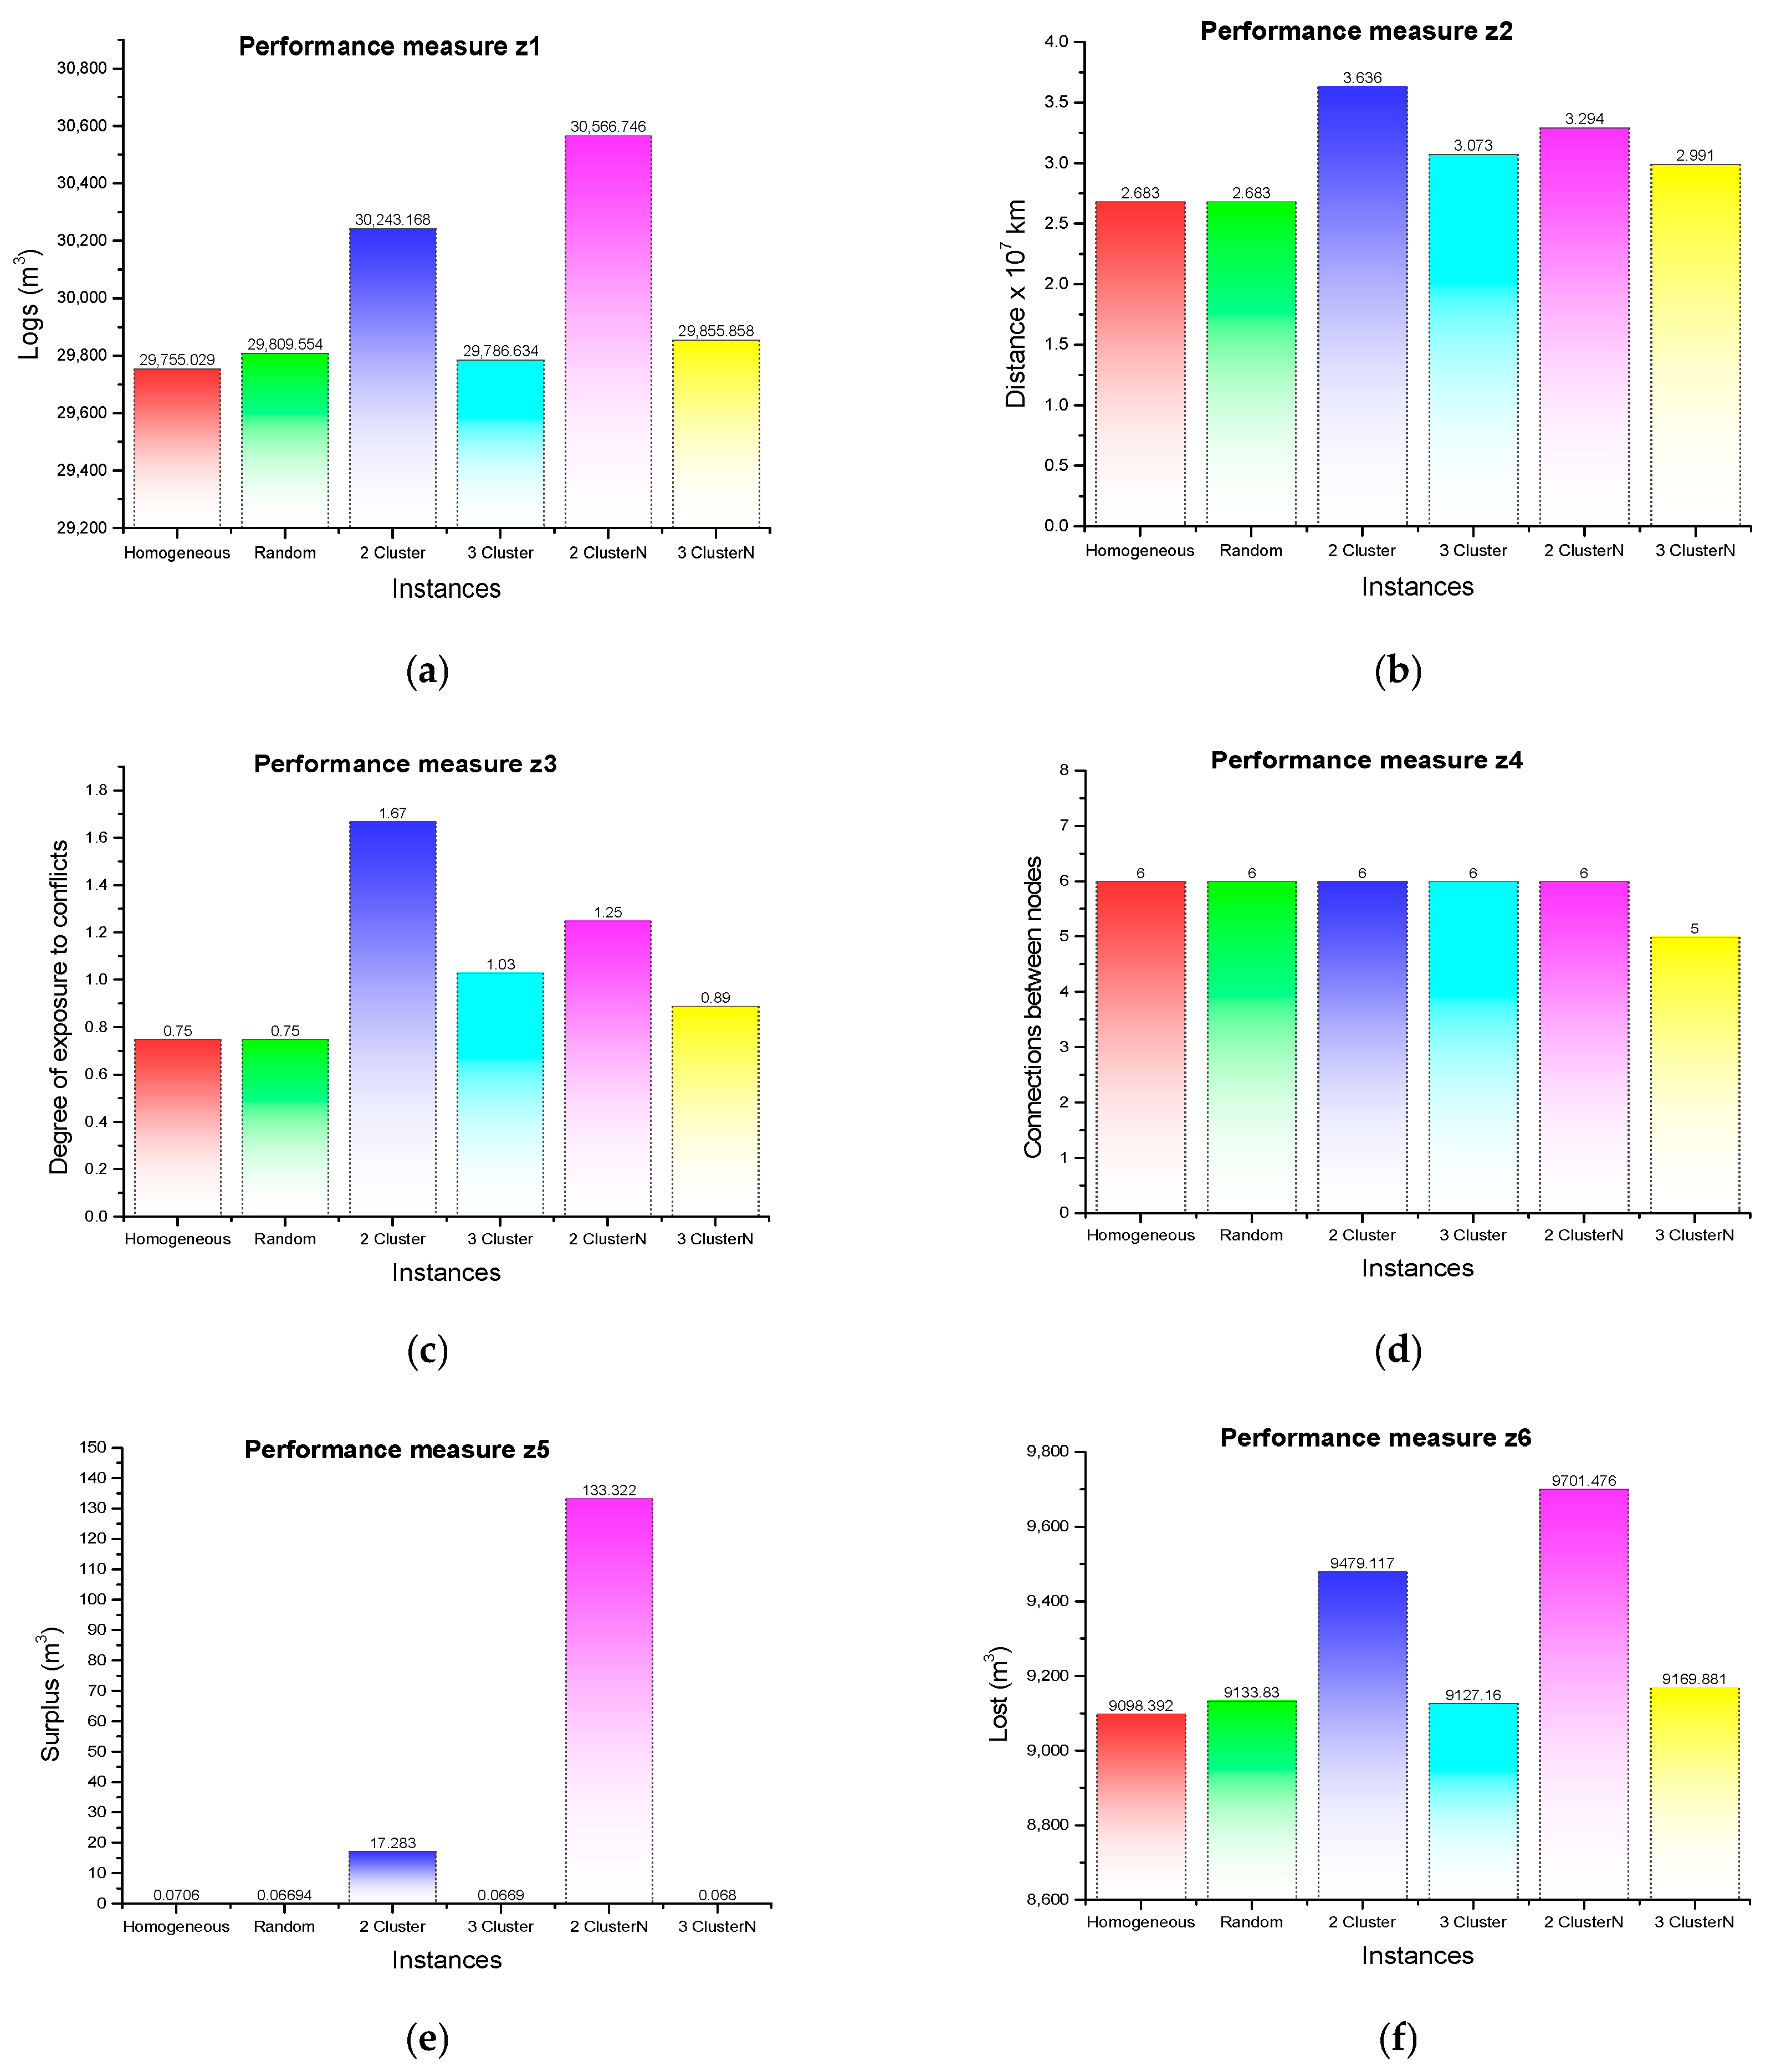
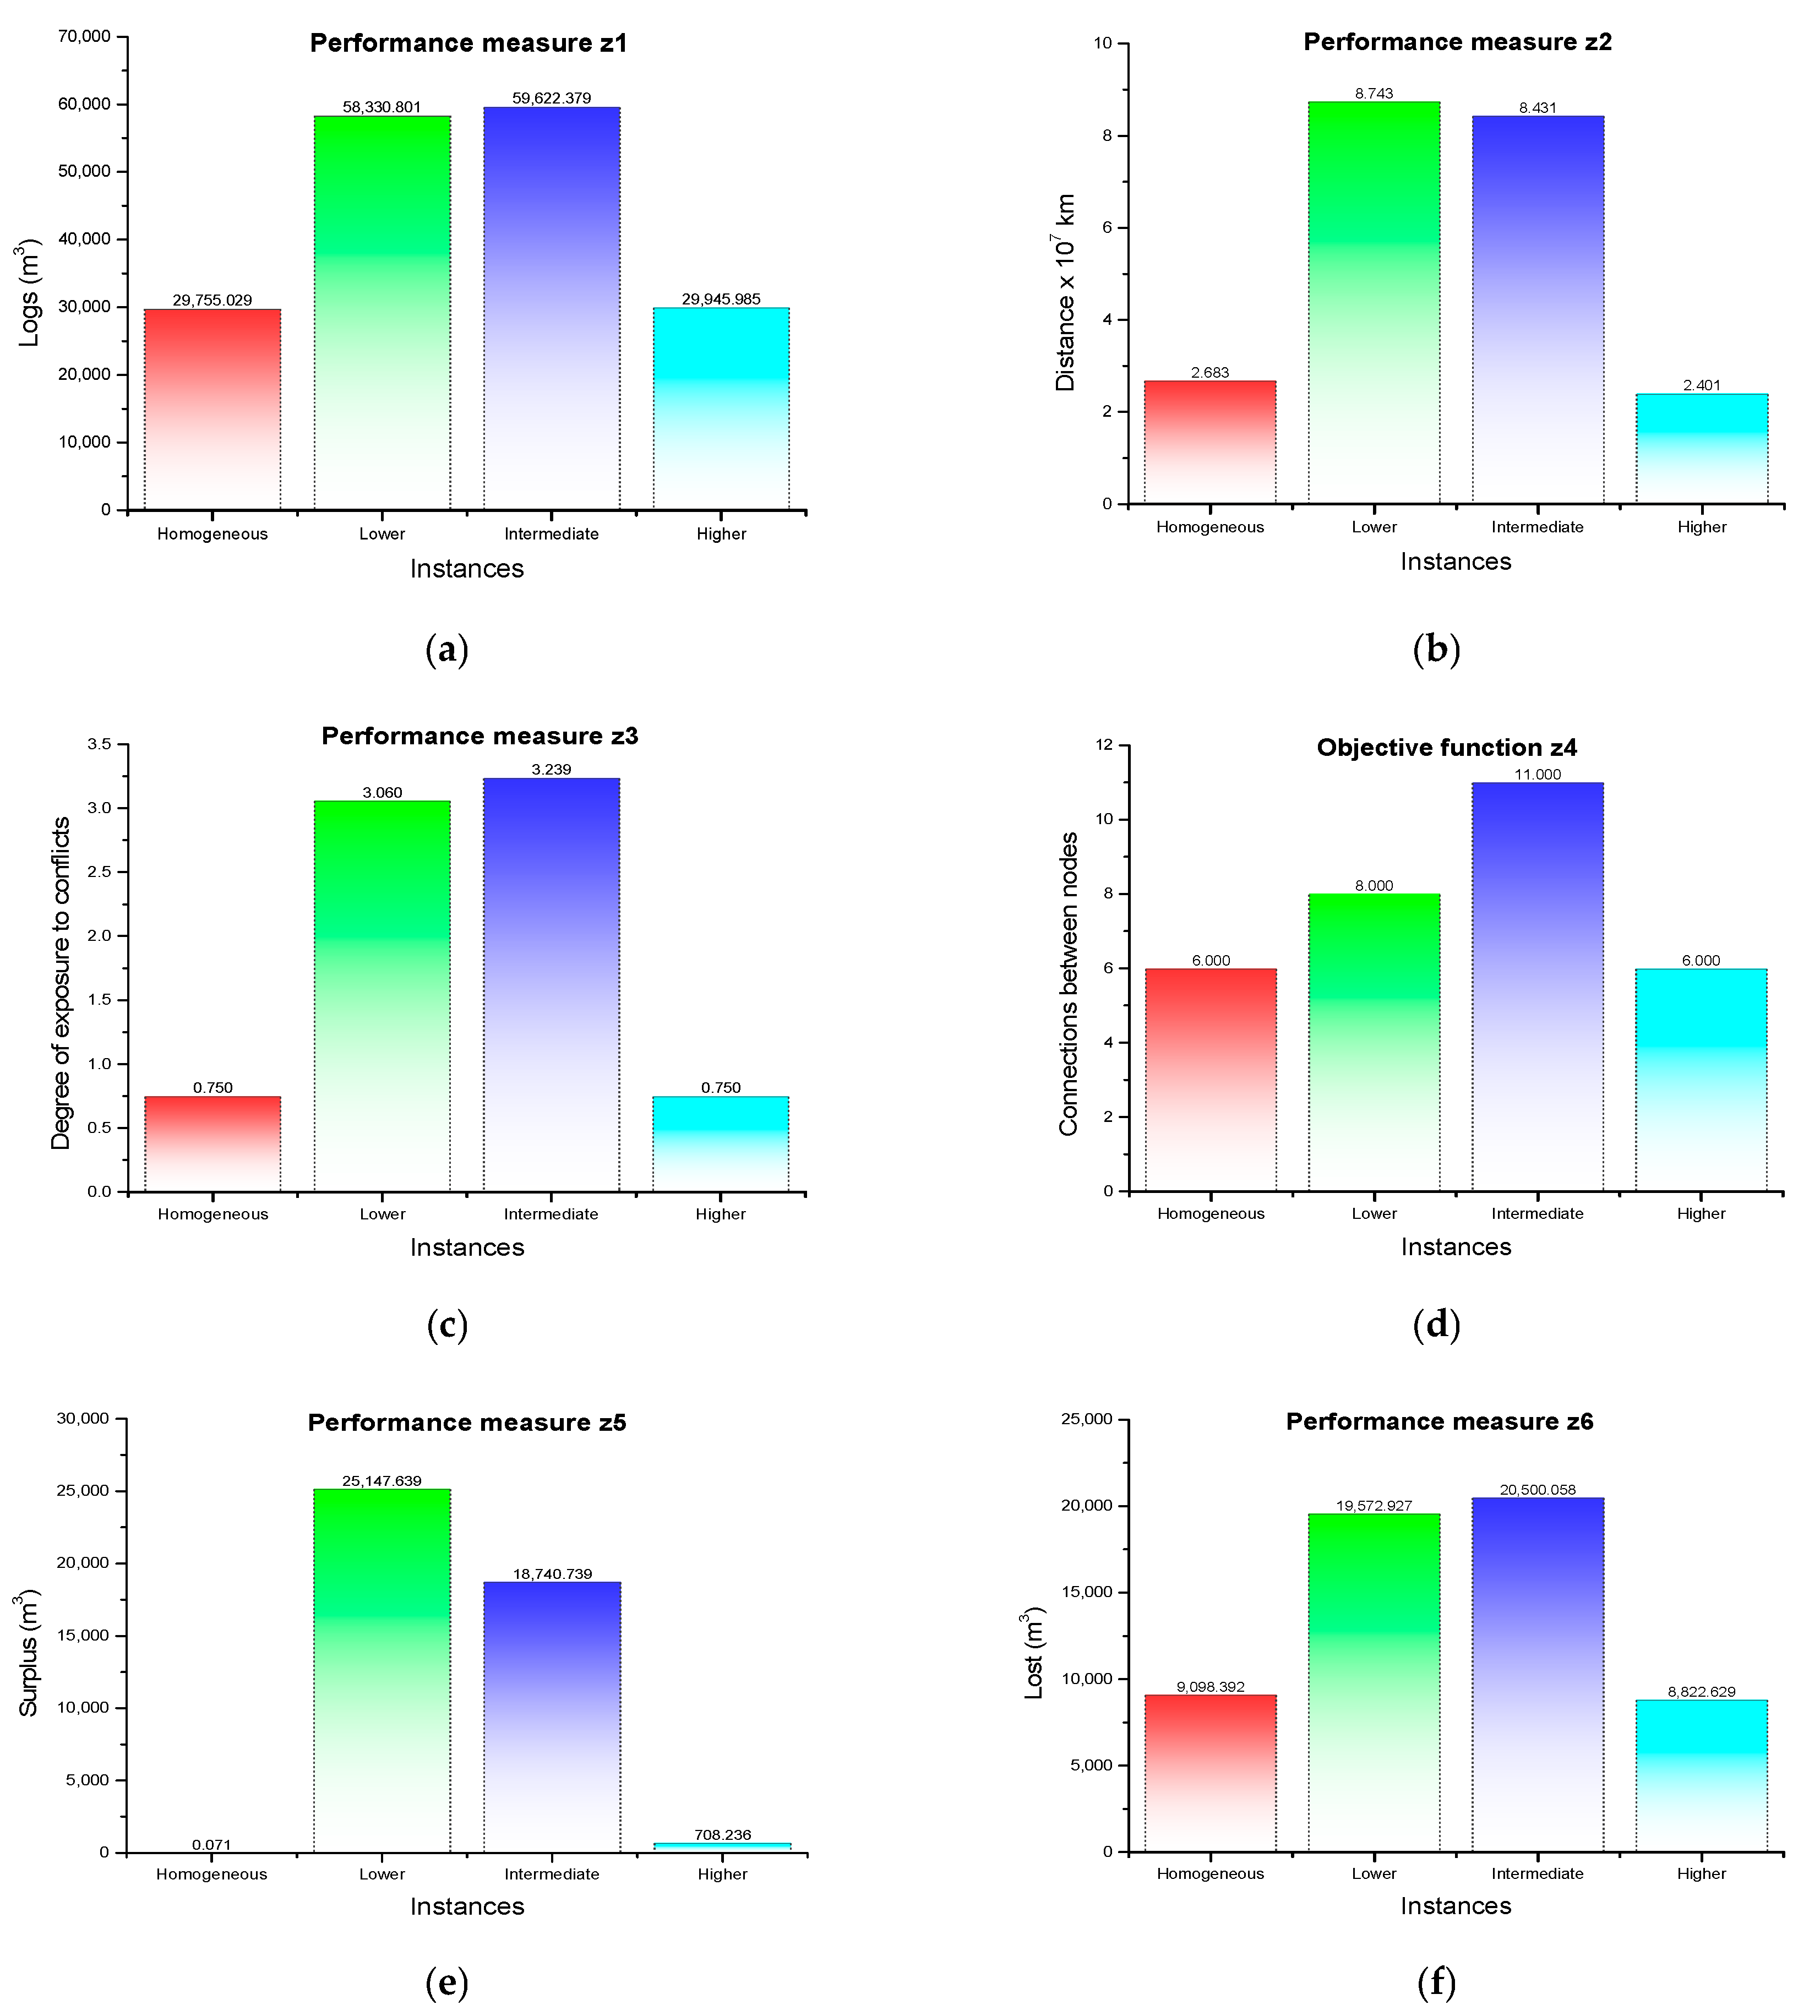
Results: Figure 8 presents the graphs comparing the values obtained for the six performance measures when evaluated individually across the six supply instances. Similarly, Figure 9 presents the results for the four demand scenarios (the detailed graphs are provided in the Supplementary Materials).
Table 11 and Table 12 report the computation times of this experiment. The performance measure z5 was the most challenging, reaching the 300 s limit in two runs, denoted by (*) in Table 11, with optimality gaps of 0.0309% and 0.099%, respectively, while the remaining cases were solved to optimality. Table 13 presents a summary of the results for each case.
These results confirm that the performance of the supply chain is highly sensitive to the spatial configuration of supply and demand. Concentrated supply scenarios tend to increase resource consumption, cutting losses, and surplus generation, while dispersed configurations promote more sustainable outcomes, albeit at the cost of greater logistical complexity. This underscores the importance of territorial planning in forest supply chains and highlights the value of flexible, context-aware optimization models capable of adapting to diverse structural conditions.

4. Discussion

This section first discusses the overall behavior and implications of the proposed multi-objective model, followed by the results obtained from computational experiments.
Implementing the proposed optimization model enabled the analysis of the forest-to-lumber supply chain from a multi-objective, sustainability-oriented perspective. Each experiment addressed key dimensions, productive, logistical, and social, highlighting the trade-offs and opportunities that emerge when pursuing integrated decision-making in territorial contexts affected by complex social conflicts.
The analysis of the 2022 heat map highlights the territorial distribution of conflict intensity across the network, allowing for the identification of high-exposure arcs that are most relevant for tactical planning.
The following discussion is organized according to the experimental structure described in Section 2.4 and the results presented in Section 3.3, in order to highlight the trade-offs and insights identified in each case.

4.1. Discussion of Experiment I: Multi-Objective Optimization with ε-Constraint Method

Experiment I-A: Log consumption vs. territorial exposure to social conflicts (z1 vs. z3)
The trade-off between minimizing log consumption (z1) and reducing exposure to social conflicts (z3) demonstrates that lowering territorial risk often requires higher raw material usage. This is shown in Figure 4, where efforts to reduce exposure (z3) progressively increase log consumption (z1).
Experiment I-B: Transportation distance vs. Territorial exposure to social conflicts. (z2 vs. z3)
The inverse relationship between transportation distance (z2) and conflict exposure (z3) shown in Figure 5 illustrates that socially safer routes generally require longer distances. These results emphasize how pursuing greater social sustainability may come at the cost of increased resource use or logistical effort. However, intermediate configurations provide balanced solutions, reducing social risk without entirely sacrificing operational efficiency. Such trade-offs can guide tactical decisions such as rerouting, decentralizing supply, or adjusting harvesting plans in response to evolving conflict risks. These findings confirm that including the conflict exposure index alters the structure of feasible trade-offs, showing that the proposed multi-objective model goes beyond a simple extension of traditional distance or cost minimization approaches.
Experiment I-C: Territorial exposure to social conflicts vs. number of active connections (z3 vs. z4).
Simpler network structures with fewer active connections (z4) tend to reduce territorial exposure (z3), thereby improving resilience in conflict-prone areas. This confirms that streamlined networks not only optimize infrastructure resources but also lower social vulnerability and enhance operational robustness.
Overall, the results underscore the importance of explicitly incorporating the social dimension into logistics planning models, particularly in productive sectors operating in disputed territories. Sustainability in such contexts requires informed decision-making that balances efficiency in resource use with respect for the social and cultural environment, while maintaining the ability to adapt to complex territorial dynamics.

4.2. Discussion of Experiment II: Strategic Priorities Analysis

The weighting approach applied to z1, z5, and z6 shows that certain configurations can balance efficiency, waste reduction, and raw material use. For example, Testing 2 emerged as the most balanced alternative, simultaneously minimizing surplus and consumption while maintaining an acceptable level of cutting loss. This outcome illustrates a sustainable production strategy, as it aligns operational efficiency with waste reduction and the rational use of forest resources.
Such analysis provides valuable evidence for the design of more circular production policies, where the goal is not only to satisfy demand volumes but also to do so responsibly and with minimal waste generation.

4.3. Discussion of Experiment III: Individual Evaluation of Performance Measures

The evaluation of each performance measure under varied supply and demand conditions highlights that no single configuration optimizes all criteria simultaneously. Concentrated supply tends to increase log consumption (z1) and cutting losses (z6), implying greater use of natural resources and lower productive efficiency. In contrast, more dispersed supply reduces these impacts but may increase logistical complexity and associated costs.
From a sustainability perspective, these findings emphasize the importance of territorial configuration as a critical factor influencing both technical efficiency and the environmental and social impacts of the system.
The sensitivity analysis of C o n f l i c i j , presented in Experiment I-B, confirms that the model’s solutions remain highly stable under moderate variations in conflict exposure. This robustness ensures that recommendations remain reliable despite data uncertainty, while still adapting appropriately under severe increases in exposure. Such behavior is particularly relevant in volatile environments, where updated conflict data may trigger abrupt changes in exposure parameters.

4.4. Limitations and Projections of the Study

Although the results advance sustainable planning of the forest-to-lumber supply chain, this study presents several limitations that should be considered. One of the most relevant concerns is the selection of cutting patterns, which was restricted to a statically predefined list to maintain computational tractability. In practice, sawmills also work with predefined pattern databases, as was done here; nevertheless, future research could incorporate dynamic pattern generation to enable more adaptive and demand-responsive decisions.
The model also does not account for temporal variations in raw material supply or market prices, both of which could significantly influence planning outcomes. It would therefore be valuable to evaluate versions with time-dependent constraints and feedback mechanisms linking tactical decisions with operational and environmental conditions. Moreover, engaging local stakeholders, particularly communities affected by conflict, could enhance the model’s practical relevance and acceptance in real-world applications.
Finally, although the model addresses economic and environmental dimensions through proxies (log volume and transport distance), it does not explicitly include monetary costs, which here are assumed to be proportional to these variables. Future extensions could integrate fixed costs, economies of scale, or nonlinear cost structures related to transported volumes. Future work will therefore explore stochastic versions of the model to capture uncertainty in a planning horizon in the forest-to-lumber supply chain operations. These advances will contribute to improving the representativeness and applicability of the model in forest-to-lumber supply chain management. Future studies should also incorporate additional social indicators, such as employment generation, community participation, and equity in benefit distribution, to broaden the scope of the sustainability assessment.

5. Conclusions

This study developed an optimization model that integrates economic, environmental, and social criteria to support tactical decision-making for the forest-to-lumber supply chain in Chile’s southern macrozone. By incorporating parameters related to exposure to social conflicts, derived from historical information and expert judgment, the model provides a more realistic representation of the territorial constraints that shape operations, enabling more resilient and socially acceptable decisions. The results confirm that multi-objective optimization models are robust tools for sustainable decision-making in complex supply chains subject to social and logistical restrictions.
Experiment I, through the ε-constraint method, identified Pareto frontiers that reveal equilibrium zones between logistical efficiency and social risk, as well as between structural simplicity and territorial vulnerability. The findings suggest prioritizing operational strategies that reduce exposure to social conflict by designing sustainable logistics networks, even at the cost of slightly higher raw material consumption or transportation distances. Overall, the results confirm that multi-objective optimization models are robust tools for sustainable decision-making in complex supply chains, particularly in contexts marked by social conflicts and logistical constraints.
Experiment II demonstrated that balanced prioritization strategies, such as the one represented by Testing 2, can simultaneously reduce resource consumption, surplus production, and cutting losses. These findings provide evidence for more rational and sustainable production models. Experiment III further showed that the spatial configuration of supply and demand affects the behavior of each performance measure differently, reinforcing both the absence of a single optimal solution and the necessity of managing trade-offs among efficiency, waste, and social exposure. These insights highlight the value of explicitly integrating social dimensions into supply chain optimization.
The integration of the conflict exposure index within the multi-objective framework revealed trade-offs and network configurations that cannot be captured by distance- or cost-based objectives alone, providing novel insights into supply chain planning under conditions of social conflict. At the same time, this study opens a research agenda centered on the refinement of parameter estimation and the use of stochastic formulations to handle uncertainty in territorial risks, as well as systematic comparisons with other social indicators (e.g., job creation, equity in benefit distribution, or community participation).
Beyond the results obtained, an important avenue for future research is the systematic comparison of the social conflict exposure index with other social indicators traditionally used in the sustainable supply chain literature, such as job creation, equity in benefit distribution, community participation, or international certifications. We anticipate that this line of work will contribute to establishing a more robust comparative framework for the integration of social dimensions into optimization models.
Finally, the practical implementation of this framework depends on the availability and reliability of spatial, operational, and conflict-related data. Addressing these challenges is essential to transforming the model’s analytical potential into a functional tool for sustainable decision-making.

Supplementary Materials

The following supporting information can be downloaded at: https://www.mdpi.com/article/10.3390/f16111644/s1.

Author Contributions

Conceptualization, F.P.V., J.W.E. and R.L.; methodology, J.F.M.-R., F.P.V., V.O.-A., J.W.E. and R.L.; software, J.F.M.-R. and R.S.-C.; validation, R.S.-C., F.P.V., V.O.-A. and J.W.E.; formal analysis, J.F.M.-R. and R.S.-C.; investigation, J.F.M.-R.; resources, F.P.V., V.O.-A. and R.L.; data curation, J.F.M.-R., R.S.-C. and R.L.; writing—original draft preparation, J.F.M.-R. and R.S.-C.; writing—review and editing, J.F.M.-R., F.P.V., V.O.-A., J.W.E. and R.L.; visualization, J.F.M.-R.; supervision, F.P.V. and R.L.; project administration, J.F.M.-R. and R.L.; funding acquisition, J.F.M.-R., F.P.V., J.W.E. and R.L. All authors have read and agreed to the published version of the manuscript.

Funding

Project University of Bío-Bío—UBIOBIO GI 2380142. Fondo Nacional de Desarrollo Científico y Tecnológico—ANID FONDECYT REGULAR 1230125 and ANID- Subdirección de Capital Humano/Doctorado Nacional/2025-21251021.

Data Availability Statement

For specific data, please contact the corresponding author directly.

Acknowledgments

UBIOBIO FAPEI FP2418052, PhD Scholarship, Universidad del Bío-Bío, Chile.

Conflicts of Interest

The authors declare no conflicts of interest.

References

  1. Beamon, B.M. Supply Chain Design and Analysis: Models and Methods. Int. J. Prod. Econ. 1998, 55, 281–294. [Google Scholar] [CrossRef]
  2. D’Amours, S.; Rönnqvist, M.; Weintraub, A. Using Operational Research for Supply Chain Planning in the Forest Products Industry. INFOR Inf. Syst. Oper. Res. 2008, 46, 265–281. [Google Scholar] [CrossRef]
  3. Rönnqvist, M. Optimization in Forestry. Math. Program. 2003, 97, 267–284. [Google Scholar] [CrossRef]
  4. Weintraub, A.; Romero, C.; Bjørndal, T.; Epstein, R.; Miranda, J. Handbook of Operations Research in Natural Resources; Springer: Berlin/Heidelberg, Germany, 2007; Volume 99. [Google Scholar]
  5. Acuna, M.; Sessions, J.; Zamora, R.; Boston, K.; Brown, M.; Ghaffariyan, M.R. Methods to Manage and Optimize Forest Biomass Supply Chains: A Review. Curr. For. Rep. 2019, 5, 124–141. [Google Scholar] [CrossRef]
  6. Wang, S.; Tian, X. Research on Sustainable Closed-Loop Supply Chain Synergy in Forest Industry Based on High-Quality Development: A Case Study in Northeast China. Forests 2022, 13, 1587. [Google Scholar] [CrossRef]
  7. Uusitalo, J.; Pearson, M. Introduction to Forest Operations and Technology; JVP Forest Systems Oy: Hämeenlinna, Finland, 2010; ISBN 952-92-5269-2. [Google Scholar]
  8. Scholz, J.; De Meyer, A.; Marques, A.S.; Pinho, T.M.; Boaventura-Cunha, J.; Van Orshoven, J.; Rosset, C.; Künzi, J.; Kaarle, J.; Nummila, K. Digital Technologies for Forest Supply Chain Optimization: Existing Solutions and Future Trends. Environ. Manag. 2018, 62, 1108–1133. [Google Scholar] [CrossRef]
  9. Santos, A.; Carvalho, A.; Barbosa-Póvoa, A.P.; Marques, A.; Amorim, P. Assessment and Optimization of Sustainable Forest Wood Supply Chains—A Systematic Literature Review. For. Policy Econ. 2019, 105, 112–135. [Google Scholar] [CrossRef]
  10. Mena-Reyes, J.F.; Vergara, F.; Linfati, R.; Escobar, J.W. Quantitative Techniques for Sustainable Decision Making in Forest-to-Lumber Supply Chain: A Systematic Review. Forests 2024, 15, 297. [Google Scholar] [CrossRef]
  11. Pulkki, R. Role of Supply Chain Management in the Wise Use of Wood Resources. S. Afr. For. J. 2001, 191, 89–95. [Google Scholar] [CrossRef]
  12. Boston, K. Forestry Raw Materials Supply Chain Management. In The Management of Industrial Forest Plantations: Theoretical Foundations and Applications; Borges, J.G., Diaz-Balteiro, L., McDill, M.E., Rodriguez, L.C.E., Eds.; Springer: Dordrecht, The Netherlands, 2014; pp. 467–487. ISBN 978-94-017-8899-1. [Google Scholar]
  13. Larsson, M.; Stendahl, M.; Roos, A. Supply Chain Management in the Swedish Wood Products Industry—A Need Analysis. Scand. J. For. Res. 2016, 31, 777–787. [Google Scholar] [CrossRef]
  14. Fuentealba, S.; Pradenas, L.; Linfati, R.; Ferland, J.A. Forest Harvest and Sawmills: An Integrated Tactical Planning Model. Comput. Electron. Agric. 2019, 156, 275–281. [Google Scholar] [CrossRef]
  15. Rodríguez-Dorna, A.; Alonso, L.; Picos, J.; Armesto, J. Mapping Feasibility for Wood Supply: A High-Resolution Geospatial Approach to Enhance Sustainable Forest Management in Galicia (NW Spain). Forests 2023, 14, 2124. [Google Scholar] [CrossRef]
  16. Lämås, T.; Sängstuvall, L.; Öhman, K.; Lundström, J.; Årevall, J.; Holmström, H.; Nilsson, L.; Nordström, E.-M.; Wikberg, P.-E.; Wikström, P.; et al. The Multi-Faceted Swedish Heureka Forest Decision Support System: Context, Functionality, Design, and 10 Years Experiences of Its Use. Front. For. Glob. Change 2023, 6, 1163105. [Google Scholar] [CrossRef]
  17. Auger, M.; LeBel, L.; Brotherton, E. Benefits and Requirements of Mathematical Optimization in the Allocation of Wood to a Network of Forest Product Mills. Forests 2023, 14, 140. [Google Scholar] [CrossRef]
  18. Kogler, C. Discrete Event Simulation-Based Risk Analysis for Efficient, Sustainable and Resilient Transportation. Soud. Inž. 2023, 34, 74–78. [Google Scholar] [CrossRef]
  19. Simard, V.; Rönnqvist, M.; LeBel, L.; Lehoux, N. Improving the Decision-Making Process by Considering Supply Uncertainty—A Case Study in the Forest Value Chain. Int. J. Prod. Res. 2024, 62, 665–684. [Google Scholar] [CrossRef]
  20. Westlund, K.; Sundström, L.E.; Eliasson, L. An Optimization and Discrete Event Simulation Framework for Evaluating Delivery Performance in Swedish Wood Supply Chains under Stochastic Weather Variations. Int. J. For. Eng. 2024, 35, 326–337. [Google Scholar] [CrossRef]
  21. Teymourifar, A.; Trindade, M.A.M. A Framework to Design and Evaluate Green Contract Mechanisms for Forestry Supply Chains. Sustainability 2023, 15, 7668. [Google Scholar] [CrossRef]
  22. Sacchelli, S.; Bernetti, I. Integrated Management of Forest Ecosystem Services: An Optimization Model Based on Multi-Objective Analysis and Metaheuristic Approach. Nat. Resour. Res. 2019, 28, 5–14. [Google Scholar] [CrossRef]
  23. Deng, D.; Ye, C.; Tong, K.; Zhang, J. Evaluation of the Sustainable Forest Management Performance in Forestry Enterprises Based on a Hybrid Multi-Criteria Decision-Making Model: A Case Study in China. Forests 2023, 14, 2267. [Google Scholar] [CrossRef]
  24. Tang, C.S. Socially Responsible Supply Chains in Emerging Markets: Some Research Opportunities. J. Oper. Manag. 2018, 57, 1–10. [Google Scholar] [CrossRef]
  25. Qiu, H.; Zhang, H.; Lei, K.; Hu, X.; Yang, T.; Jiang, X. A New Tree-Level Multi-Objective Forest Harvest Model (MO-PSO): Integrating Neighborhood Indices and PSO Algorithm to Improve the Optimization Effect of Spatial Structure. Forests 2023, 14, 441. [Google Scholar] [CrossRef]
  26. Baghizadeh, K.; Zimon, D.; Jum’a, L. Modeling and Optimization Sustainable Forest Supply Chain Considering Discount in Transportation System and Supplier Selection under Uncertainty. Forests 2021, 12, 964. [Google Scholar] [CrossRef]
  27. Zhang, W.; Shao, H.; Sun, H.; Zhang, W.; Yan, Q. Optimizing Carbon Sequestration in Forest Management Plans Using Advanced Algorithms: A Case Study of Greater Khingan Mountains. Forests 2023, 14, 1785. [Google Scholar] [CrossRef]
  28. Alcalde-Calonge, A.; Ruiz-Palomino, P.; Sáez-Martínez, F.J. The Circularity of the Business Model and the Performance of Bioeconomy Firms: An Interactionist Business-Environment Model. Cogent Bus. Manag. 2022, 9, 2140745. [Google Scholar] [CrossRef]
  29. Munoz, M.F.; Zhang, K.; Shahzad, A.; Ouhimmou, M. LogLog: A Blockchain Solution for Tracking and Certifying Wood Volumes. In Proceedings of the 2021 IEEE International Conference on Blockchain and Cryptocurrency (ICBC), Sydney, Australia, 3–6 May 2021; IEEE: Sydney, Australia, 2021; pp. 1–9. [Google Scholar]
  30. Hoppen, M.; Chen, J.; Kemmerer, J.; Baier, S.; Bektas, A.R.; Schreiber, L.J.; Mayer, D.G.; Kaulen, A.; Ziesak, M.; Rossmann, J. Smart Forestry—A Forestry 4.0 Approach to Intelligent and Fully Integrated Timber Harvesting. Int. J. For. Eng. 2024, 35, 137–152. [Google Scholar] [CrossRef]
  31. González-Hidalgo, M.; Zografos, C. How Sovereignty Claims and “Negative” Emotions Influence the Process of Subject-Making: Evidence from a Case of Conflict over Tree Plantations from Southern Chile. Geoforum 2017, 78, 61–73. [Google Scholar] [CrossRef]
  32. Medvedev, S.; Zyryanov, M.; Dudin, P. Interaction Model of Forestry Enterprises with Society and Environment. BIO Web Conf. 2024, 93, 01016. [Google Scholar] [CrossRef]
  33. Infante, F. Social Capital and Landscape: Effects of Monoculture Forest Plantations on Small Producers in the Mediterranean Dryland of South-Central Chile. Rural Soc. 2023, 32, 151–168. [Google Scholar] [CrossRef]
  34. Maher, R.; Pedemonte-Rojas, N.; Gálvez, D.; Banerjee, S.B. The Role of Multistakeholder Initiatives in the Radicalization of Resistance: The Forest Stewardship Council and the Mapuche Conflict in Chile. J. Manag. Stud. 2024, 61, 2961–2991. [Google Scholar] [CrossRef]
  35. Garrido, M.C.; Alarcón, A.M. The Commoditization of Ecosystems within Chile’s Mapuche Territory: A Violation of the Human Right to Health. Health Hum. Rights 2023, 25, 95. [Google Scholar]
  36. Meyer, R.; Campanella, S.; Corsano, G.; Montagna, J.M. Optimal Design of a Forest Supply Chain in Argentina Considering Economic and Social Aspects. J. Clean. Prod. 2019, 231, 224–239. [Google Scholar] [CrossRef]
  37. Maring, P. Conflict Transformation and Collaboration in Developing Social Forestry in Flores, Indonesia. For. Soc. 2022, 6, 40–66. [Google Scholar] [CrossRef]
  38. Wang, M.; Radics, R.; Islam, S.; Hwang, K.-S. Towards Forest Supply Chain Risks. Oper. Supply Chain Manag. Int. J. 2023, 97–108. [Google Scholar] [CrossRef]
  39. Berasaluce, M.; Díaz-Siefer, P.; Rodríguez-Díaz, P.; Mena-Carrasco, M.; Ibarra, J.T.; Celis-Diez, J.L.; Mondaca, P. Social-Environmental Conflicts in Chile: Is There Any Potential for an Ecological Constitution? Sustainability 2021, 13, 12701. [Google Scholar] [CrossRef]
  40. Carte, L.; Hofflinger, Á.; Polk, M.H. Expanding Exotic Forest Plantations and Declining Rural Populations in La Araucanía, Chile. Land 2021, 10, 283. [Google Scholar] [CrossRef]
  41. Braun, A.C. Encroached by Pine and Eucalyptus? A Grounded Theory on an Environmental Conflict between Forest Industry and Smallholder Livelihoods in Chile. J. Rural. Stud. 2021, 82, 107–120. [Google Scholar] [CrossRef]
  42. Schmalz, S.; Graf, J.; Julián-Vejar, D.; Sittel, J.; Alister Sanhueza, C. Challenging the Three Faces of Extractivism: The Mapuche Struggle and the Forestry Industry in Chile. Globalizations 2023, 20, 365–383. [Google Scholar] [CrossRef]
  43. Pawlak, Z. An Inquiry into Anatomy of Conflicts. Inf. Sci. 1998, 109, 65–78. [Google Scholar] [CrossRef]
  44. Forestal (Chile), I. El Sector Forestal Chileno 2024 = Chilean Forestry Sector 2024; Instituto Forestal: Santiago, Chile, 2024. [Google Scholar] [CrossRef]
  45. Pareja Arellano, N.; Riquelme Brevis, H.; Sandoval Obando, E. El problema económico-social de la tierra en el espacio rural de la Araucanía: Un análisis histórico (1910–1998). Rev. CUHSO 2025, 35, 1–25. [Google Scholar] [CrossRef]
  46. Ramos-Maldonado, M.; Muñoz, F.T.; Mora, P.; Venegas-Vásconez, D. Optimizing Cutting Log Operations in Softwood Sawmills: A Multi-Objective Approach Tailored for SMEs. IEEE Access 2024, 12, 128141–128150. [Google Scholar] [CrossRef]
  47. Dias, G.P.; Silva, M.E.; Viana, F.L.E. Contributions of Social Capital to Supply Chain Sustainability Practices: Conceptual Framework and Propositions. Clean. Logist. Supply Chain 2024, 11, 100151. [Google Scholar] [CrossRef]
  48. Miettinen, K. Nonlinear Multiobjective Optimization; Springer Science & Business Media: Berlin, Germany, 1999; ISBN 978-0-7923-8278-2. [Google Scholar]
  49. Ehrgott, M. Multicriteria Optimization; Springer: Berlin/Heidelberg, Germany, 2005. [Google Scholar]
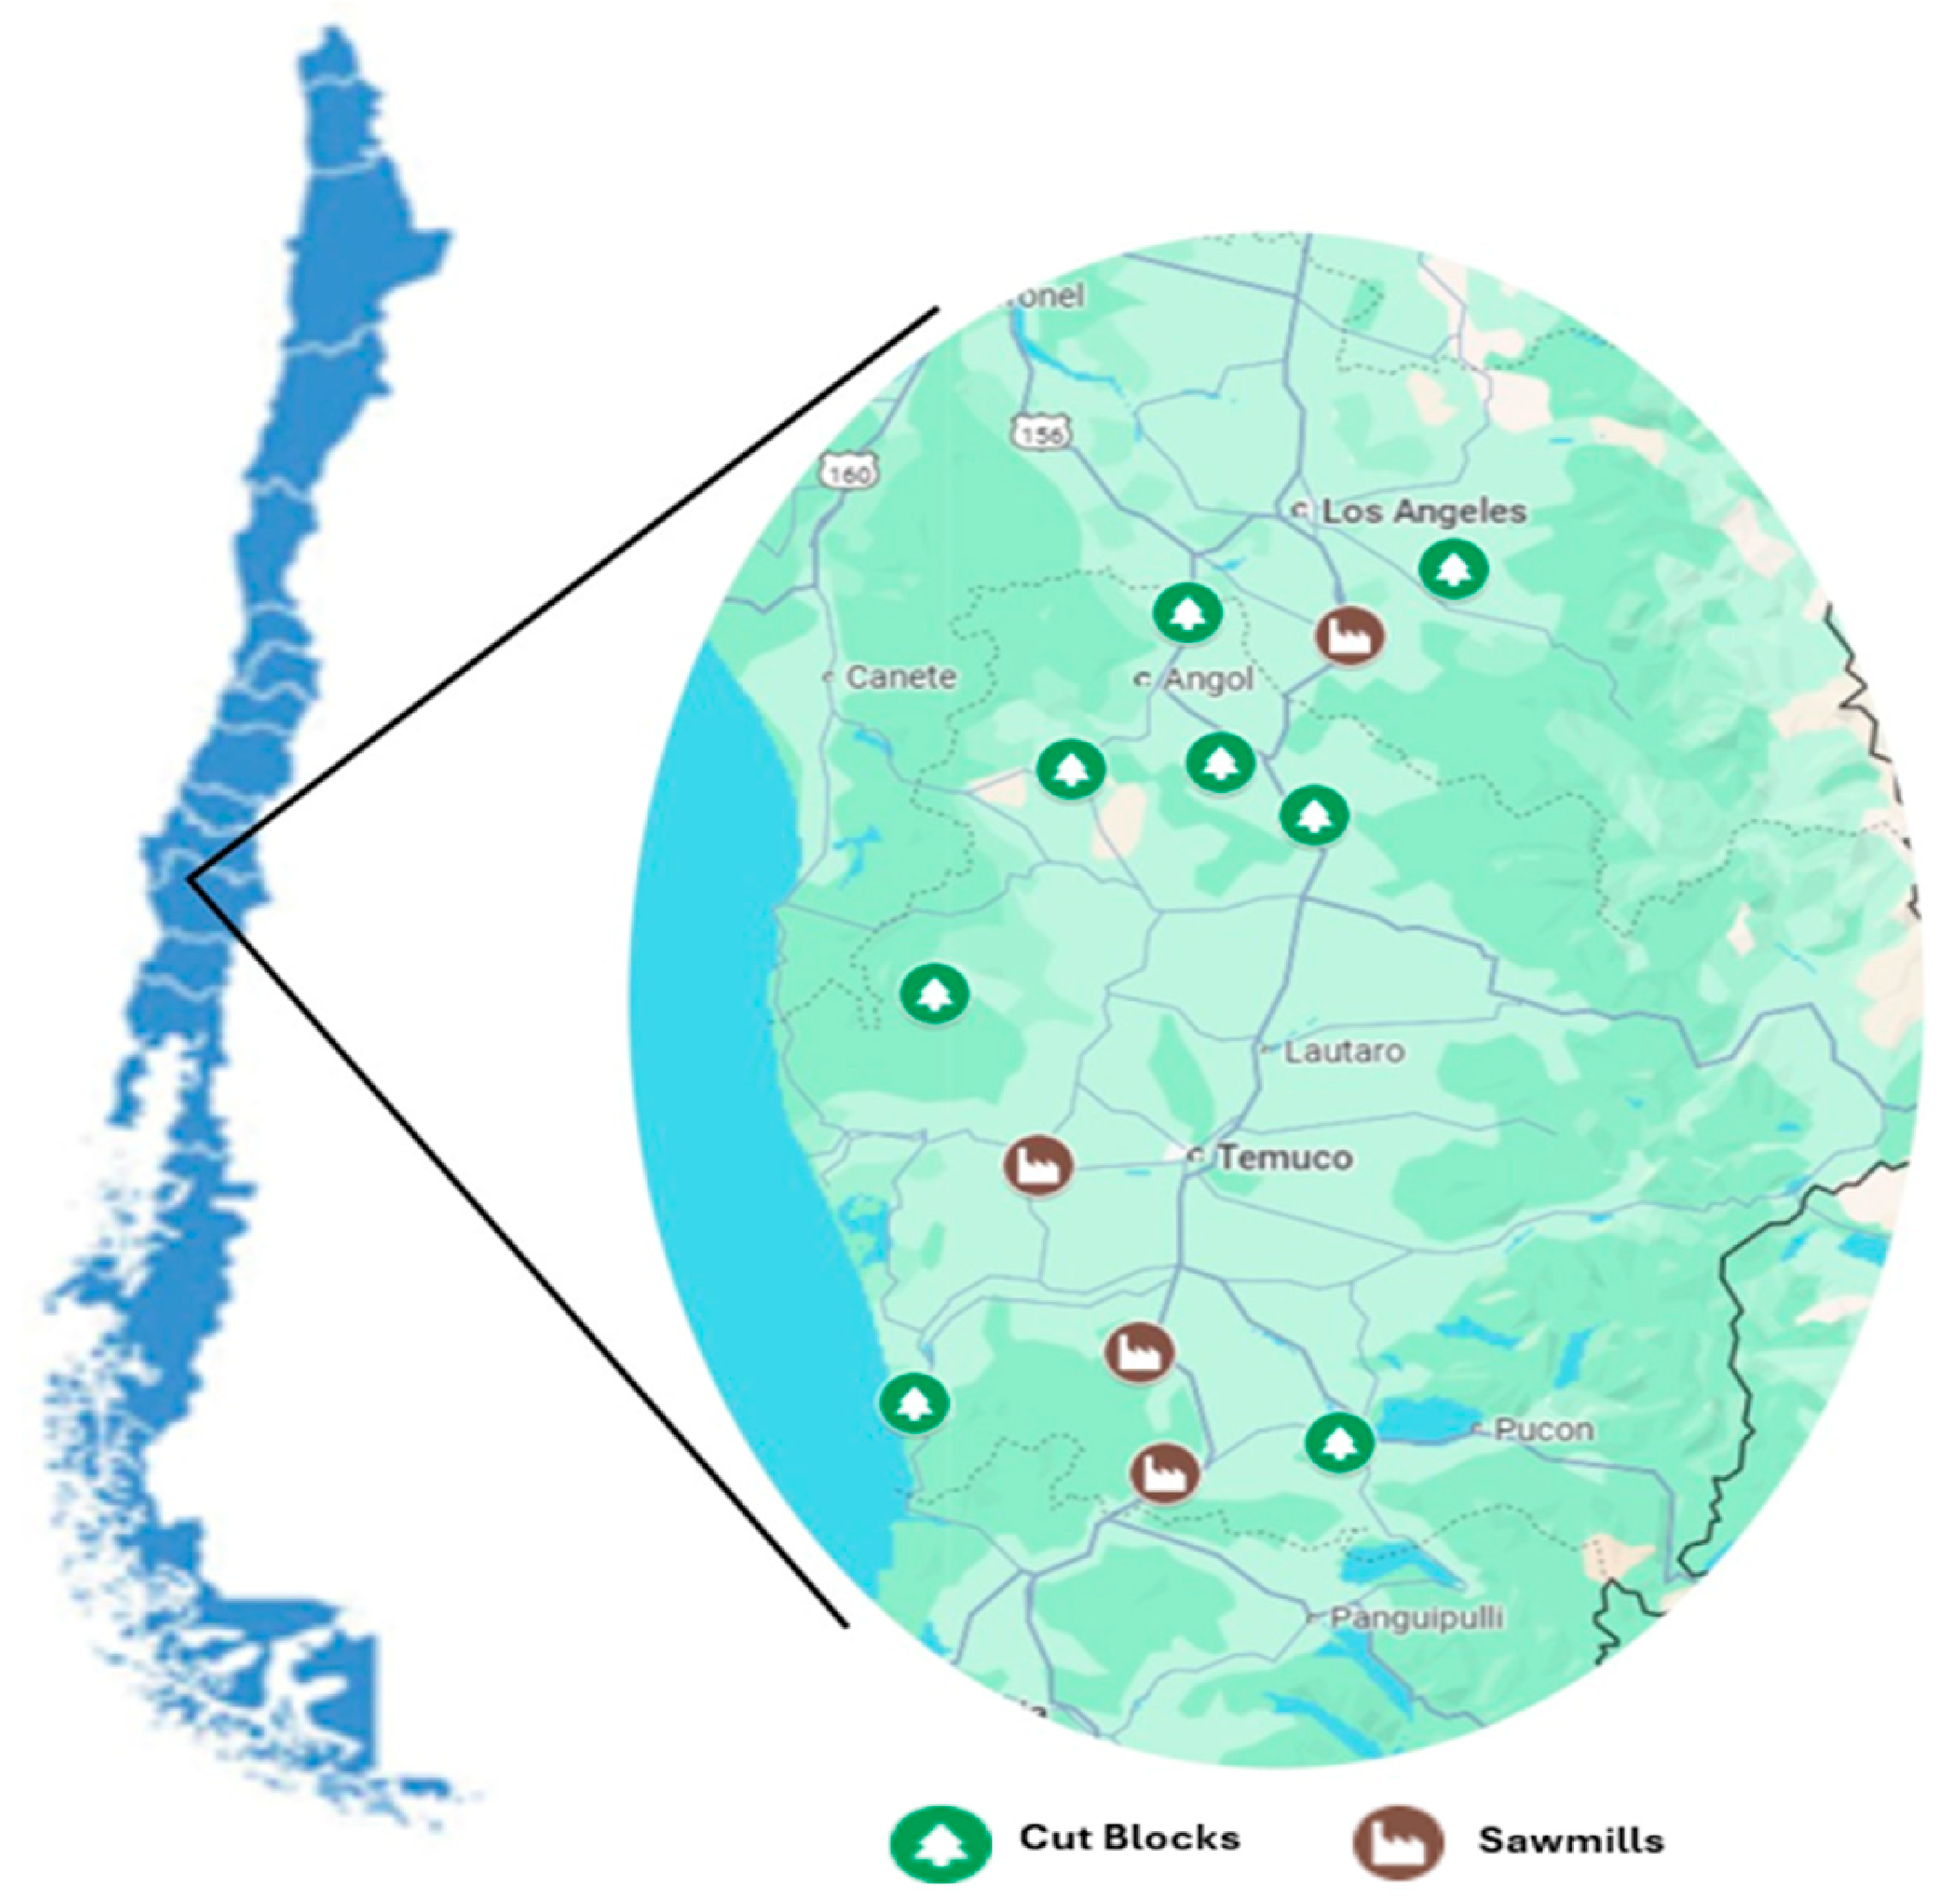
Figure 1. Study area. Map of the southern macrozone of Chile, highlighting cut blocks (green) and sawmills (brown) in the Bío-Bío and La Araucanía regions. The area covers 1.3 million hectares of plantations and has been the epicenter of conflicts between forestry companies and Indigenous communities over territorial rights [33]. Source: Own elaboration based on [44].
Forests 16 01644 g001
Figure 2. Forest-to-lumber supply chain network. Source: Own elaboration based on operational data of the Chilean forestry industry.
Forests 16 01644 g002
Figure 3. Heat map showing the intensity of territorial conflict in the arcs connecting forest cut blocks and sawmills in 2022. Colors reflect the exposure level of each arc according to a standardized scale.
Forests 16 01644 g003
Figure 4. Pareto frontier between log consumption (z1) and territorial exposure to social conflicts (z3). The model was solved using the ε-constraint method, progressively constraining z3 while optimizing z1. Each point represents an efficient solution with a distinct balance between productivity and social sustainability.
Forests 16 01644 g004
Figure 5. Pareto frontier obtained using the ε-constraint method for the objective functions z2 (total transportation distance) and z3 (exposure to social conflicts). Orange dots represent the feasible solutions generated by the model, while the red line denotes the non-dominated solutions forming the efficient frontier. The results reveal an inverse relationship between the two objectives and identify compromise zones balancing logistics efficiency and social sustainability.
Forests 16 01644 g005
Figure 6. Optimal solutions generated by the ε-constraint method between z3 (exposure to conflicts) and z4 (number of active connections). The red dot indicates the only non-dominated solution, which balances minimal network complexity with low social vulnerability.
Forests 16 01644 g006
Figure 7. Three-dimensional comparison of the experimental scenarios with normalized values of the objective functions z1 (log consumption), z5 (surplus), and z6 (cutting losses). The figure illustrates the relative performance of each strategy and the trade-offs between efficiency, demand, and raw material use.
Forests 16 01644 g007
Figure 8. Individual behavior of the six performance measures under different offer configurations. Each subfigure (af) represents the results obtained when evaluating a specific performance measure against the six supply instances.
Forests 16 01644 g008
Figure 9. Individual behavior of the six performance measures against different demand configurations. Each subfigure (af) shows the response of a performance measure to the four solved demand instances.
Forests 16 01644 g009
Table 1. Summary of selected studies on sustainable forest supply chains.
StudyApproachSustainability
Dimensions
Key Contribution/Limitation
[9]Systematic review of sustainable forest supply chainsEconomic, EnvironmentalNo explicit social indicators included
[36]MILP optimization model for forest supply chains (Argentina)Economic, SocialNo territorial conflict dimension considered
[26]Sustainable supply chain optimization under uncertaintyEconomic, EnvironmentalSocial aspects not incorporated
[24]Conceptual framework for socially responsible supply chainsSocialLacks quantitative or mathematical modeling
[23]Multi-criteria model for evaluating enterprise sustainabilityEconomic, Environmental, SocialLimited to corporate-level scope
This studyMulti-objective MILP model for forest-to-lumber supply chainEconomic, Environmental, SocialExplicitly integrates a social conflict exposure index
Table 2. Weight assigned to each type of event.
Event Type Weight   P h  (0–10)
Fatalities10
Attack or explosion10
Armed attack10
Machinery burning9
Truck burning8
Fire8
Occupation7
Roadblock6
Robbery6
Menace5
Police action5
Protests4
Court of guarantee4
Communiqués3
Table 3. Indexes of the mathematical model.
NotationDescription
i Cut   blocks ,   i { 1 , , n b }
j Sawmills ,   j     { 1 , , n a }
k Cutting   patterns ,   k     { 1 , , n p }
l Logs   class ,   l     { 1 , , n d }
n Types   of   products ,   n     { 1 , , n t }
Table 4. Parameters of the mathematical model.
NotationDescription
B V o l l Volume logs l (in m3).
T a V o l n Volume products n (in m3).
L o s s k Volume loss of the cutting pattern k (in m3).
S u p p l y i l Supply of logs from cut block i of logs class l (in units).
P a t t k n Number of products n obtained by applying the cutting pattern k (in units).
D e m a n d j n Demand for products n in the sawmill j (in units).
C o n f l i c t i j Degree of exposure to social conflicts when connecting cut block i to sawmill j (dimensionless on a scale from 0 no conflict to 1 high conflict).
C o m P a t t l Set of cutting patterns compatible with the log class l, index-based (unitless)
d i s t i j Distance to transport from cut block i to sawmill j (in km).
BigMA larger number (in units).
Table 5. Dimensions of the problem in the instances used.
ParameterSymbolValueDescription
Number of cut blocksnb8Log origin zones.
Number of sawmillsna4Processing plants in the network.
Number of cutting patternsnp160Patterns documented/used in the optimization.
Number of product typesnt23Final products (by dimensions) considered in the demand.
Number of log classesnd14Classification by diameter
(20–46 cm).
Table 6. Decision variables.
NotationDescription
x i j k Number of logs obtained from cut block i, sent to sawmill j, processed with cutting pattern k (in units).
y i j 1     i f   l o g s   a r e   s e n t   f r o m   c u t   b l o c k   i   t o   s a w m i l l   j .   0     o t h e r w i s e
S j n Difference between the demand of products n and total products production n at sawmill j (in units).
Table 7. Summary of all objective functions considered in the computational experiments, their sustainability dimension, and experimental application.
ObjectiveDescriptionSustainability
Dimension
Applied
Experiment(s)
z1Minimize volume of logs consumedEconomicE I-A, E II, E III
z2Minimize total transportation distanceEnvironmentalE I-B, E III
z3Minimize exposure to social conflictsSocialE I-A, I-B, I-C, E III
z4Minimize the number of active network connectionsEnvironmental/
Social
E I-C
z5Minimize surplus of non-demanded productsEconomicE II, E III
z6Minimize volume loss due to cutting patternsEnvironmentalE II, E III
Table 8. Summary of computational experiments.
CodeExperimentDimension EvaluatedPurpose
E I-AMulti-objective resolution with ε-constraint methodEconomic-Environmental vs. SocialExplore trade-offs between log consumption and conflict exposure.
E I-BMulti-objective resolution with ε-constraint methodEconomic-Environmental vs. SocialExplore trade-offs between transportation distance and conflict exposure.
E I-CMulti-objective resolution with ε-constraint methodEconomic-Environmental vs. SocialEvaluate the relationship between network complexity and conflict exposure to identify efficient configurations.
E IIScalar aggregate resolution (by weightings)Economic, EnvironmentalAnalyze the impact of different prioritization strategies on consumption, surplus, and cutting loss.
E IIIMono objective resolutionEconomic, Environmental, SocialEvaluate the individual behavior of each performance measure under different supply and demand scenarios.
Table 9. Sensitivity of C o n f l i c i j with fixed bound z3 ≤ 2.3.
ScenarioΔz2 (%)% Coincident ArcsLeavingEntering
α = 0.8−0.005287.512
α = 0.9−0.0095387.512
Base
α = 1.1+0.0533687.510
α = 1.2+0.0552587.510
α = 1.5+1.5819375.022
Table 10. Original results of the objective functions for the three experimental scenarios.
Data
Testingz1z5z6
129,771.1310.0719131.030
229,755.0292.0949112.905
329,860.625122.2029098.392
Table 11. Computation times of Experiment III according to supply configurations for each performance measure.
Computation Times (In Seconds)
Performance MeasureHomogeneousRandom2 Cluster3 Cluster2 ClusterN3 ClusterN
z10.191.531.471.760.240.15
z20.150.200.120.140.110.11
z31.139.1411.278.134.173.46
z48.8057.53101.2429.5965.8264.68
z566.5966.9066.8291.42300 *300 *
z61.350.130.320.130.120.16
* Time limit.
Table 12. Computation times of Experiment III according demand configurations for each performance measure.
Computation Times (In Seconds)
Performance MeasureHomogeneousLowerIntermediateHigher
z10.190.140.191.54
z20.150.110.120.16
z31.133.806.621.37
z48.801.6888.182.39
z566.590.820.54294.28
z61.351.260.190.13
Table 13. Summary of results of Experiment III according to supply and demand configurations for each performance measure.
Performance MeasuresSupplyDemand
z1: Log volume consumedHigher consumption in configurations with greater spatial concentration.Higher consumption with lower and intermediate volume products.
z2: Total distance traveledShorter distances in configurations with greater spatial dispersion.Shorter distances with higher-volume products.
z3: Degree of exposure to social conflictsLower exposure in configurations with greater spatial dispersion.Higher exposure with lower-volume products.
z4: Number of active arcsDecreases by only one arc under highly concentrated supply.More arcs with lower volume products.
z5: Surplus of non-demand productsHigher surplus in more spatially concentrated configurations; low in the others.Higher surplus with lower-volume products.
z6: Cutting lossesHigher losses in configurations with greater spatial concentration.Higher losses with lower- and medium-volume products.
Disclaimer/Publisher’s Note: The statements, opinions and data contained in all publications are solely those of the individual author(s) and contributor(s) and not of MDPI and/or the editor(s). MDPI and/or the editor(s) disclaim responsibility for any injury to people or property resulting from any ideas, methods, instructions or products referred to in the content.