Article

Dendrochronological Reconstruction of January–September Precipitation Variability (1647–2015A.D) Using Pinus arizonica in Southwestern Chihuahua, Mexico

by
Rosalinda Cervantes-Martínez
1,
Julián Cerano-Paredes
2,*,
José M. Iniguez
3,
Víctor H. Cambrón-Sandoval
4,
Gerardo Esquivel-Arriaga
2 and
José Villanueva-Díaz
2
1
Departamento Forestal, Universidad Autónoma Agraria Antonio Narro, Calzada Antonio Narro núm. 1923, Buenavista, Saltillo 25315, Coahuila, Mexico
2
Centro Nacional de Investigación Disciplinaría en Relación Agua-Suelo-Planta-Atmósfera del Instituto Nacional de Investigaciones Forestales Agrícolas y Pecuarias, Km. 6.5 Margen Derecha del Canal Sacramento, Gómez Palacio 35140, Durango, Mexico
3
United States Department of Agriculture, Forest Service, Rocky Mountain Research Station, 2500 S. Pine Knoll Drive, Flagstaff, AZ 86001, USA
4
Facultada de Ciencias Naturales, Universidad Autónoma de Queretaro, Av. De las Ciencias s/n, Delegación Santa Rosa Jáuregui, Juriquilla, Santiago de Querétaro 76230, Querétaro, Mexico
*
Author to whom correspondence should be addressed.
Forests 2025, 16(11), 1639; https://doi.org/10.3390/f16111639
Submission received: 4 September 2025 / Revised: 18 October 2025 / Accepted: 22 October 2025 / Published: 27 October 2025

Abstract

Climate projections suggest ecosystems could face drastic changes due to global climate change, including more severe and frequent droughts than those recorded in the last century. Paleoclimatic series provide more extensive information than that available with instrumental records, allowing for the analysis of trends and recurrence of extreme events over a longer time periods. The objective of this research was to reconstruct the precipitation variability for southwestern Chihuahua, based on the tree-ring records of Pinus arizonica Engelm. and to assess the influence of ocean atmospheric circulations like El Niño Southern Oscillation (ENSO) and the North American Monsoon (NAM) on both low- and high-frequency climate variability. We developed three dendrochronological series covering 214 years (1802–2015), 265 years (1750–2014) and 369 years (1647–2015), for the Talayotes (TAL), Predio Particular Las Chinas (PPC) and El Cuervo (CUE) sites, respectively. The 369-year regional chronology was significantly related to cumulative precipitation variability between January and September. Recurring droughts were observed at approximately 50-year intervals. This regional climate variability was significantly related (p < 0.05) to Niño 3 SST and PDSI (JJA) indices. Maximum and minimum extreme events reconstructed in the last 369 years were synchronized with ENSO events, both in the El Niño warm phase and the La Niña cold phase. These results suggest that P. arizonica tree rings record shared a common response to the regional climate that was significantly modulated by ENSO and the NAM. This is the first dendroclimatic study to reconstruct summer precipitation patterns in northern Mexico, which is valuable given the importance of this seasonal precipitation on the regional economy.

1. Introduction

The direct impacts of climate change on precipitation and temperature are of great interest to the human populations that depend on natural systems [1,2]. The report of the Intergovernmental Panel on Climate Change (IPCC) has projected a decrease in precipitation and an increase in temperature [3], which have been linked to structural changes in forested ecosystems and the mass mortality of trees [4,5]. Studies using tree-ring width indices have suggested that the impact of extreme drought on productivity can last up to several years and that the impacts are the greatest in semi-arid forests in the Northern Hemisphere [6,7]. Droughts are of concern worldwide, especially in arid and semi-arid regions [8], where droughts are expected to increase both in frequency and extend over time [9,10]. These effects are especially important in the region that serves as the focus of this study.
Precipitation in most of Mexico occurs in the summer season [11] and is influenced by ocean temperatures. Most (>70%) of the annual precipitation is recorded in the warm season between May and October, and less than 30% during the remaining months of the year [12]. Precipitation in northern Mexico is seasonal and strongly influenced by the North American Monsoon [13,14,15], which pulls moisture from both the Gulf of Mexico and the Pacific Ocean. Similarly, climate patterns in northern Mexico are influenced by El Niño Southern Oscillation (ENSO) that affects climates worldwide, with a strong influence in areas with subtropical humid climates [16,17]. Interannual climate variability across Mexico is, therefore, largely determined by ENSO [18,19,20].
Understanding how regional climate patterns vary over time and what causes this variability is important for economies that rely on this water. Worldwide, observational climate records are relatively short (150 years) and even shorter in Mexico (less than 80 years) [21]. Therefore, assessing whether ENSO behavior in the 20th century is not possible using observational records [22,23,24,25,26,27,28]. However, tree-ring-based paleoclimate reconstructions provide a long-term (several centuries) perspective for understanding the influence of ENSO on the regional precipitation pattern [29].
Tree ring information is crucial due to high temporal resolution, sensitivity to climate, and wide spatial distribution [30]. Large-scale or regional climate patterns for the past hundreds-to-thousands of years have been reconstructed using tree ring data worldwide [30,31,32,33]. Important progress has also been achieved in the development of paleoclimatic series during the last decades in this region, including the state of Chihuahua [34,35]. However, these studies have only reconstructed winter–spring precipitation, and few have managed to develop reconstructions that include part of the summer rainfall [36] and streamflow reconstruction [37]. Reconstructions that capture the variability of the entire summer monsoon rainfall season are lacking. Summer rainfall in Mexico is vital for agriculture and from an economic perspective, which many rural communities depend on. Significant decreases in summer precipitation affect human populations due to crop loss and public health, as there are many diseases associated with drought cycles [38,39,40].
Given these circumstances and the importance of summer rain patterns on social and economic aspects, it is important to understand precipitation variability at broad time scales and how this variability is influenced by climatic phenomena such as ENSO. To understand precipitation patterns and the factors that influence precipitation, the objectives of this study were to (1) generate dendrochronological series based on the tree ring growth patterns of Pinus arizonica Engelm., (2) reconstruct summer precipitation patterns based on the chronologies of P. arizonica, and (3) analyze the influence of ENSO on the variability of the reconstructed summer precipitation for northern Mexico. We tested the following research hypotheses: (1) tree ring growth variability of P. arizonica is a response to regional precipitation patterns, and (2) high- and low-frequency historical climate variability is significantly modulated by ENSO climate patterns.

2. Materials and Methods

2.1. Study Area

The study area was located in the Alta Sierra Tarahumara, within the municipality of Bocoyna, Chihuahua, at 27°50′25″ N and 107°35′21″ W, with an elevation of 2300–2800 masl (Figure 1). The municipality is part of a national forest reserve, called “Papigochi” Flora and Fauna Protection Area [41]. The climate in the study area is predominantly subhumid semi-cold with summer rains [42]. The area experiences cold temperatures and heavy snowfalls during the winter, with a maximum temperature of 31.1 °C and a minimum of −17.8 °C. The average annual rainfall is 683.3 mm, most of it occurring in the summer season [39].

2.2. Tree Ring Sampling

Within the study area we selected three sample sites (Figure 1, Table 1), including the following: Talayotes (TAL), Predio Particular Las Chinas (PPC) and El Cuervo (CUE). At each site, we collected increment cores from live trees using a Pressler increment borer Haglöf Sweden of 5 and 12 mm in diameter (Figure 2). We also collected cross-sections from stumps using a chainsaw Stihl MS-382 Germany. A total of 155 P. arizonica trees were sampled; at the PPC and CUE sites, we collected two-to-three samples per tree, and three samples per tree were collected at the TAL site (Table 1), which is the number of samples that meet the minimum recommended per site for dendroclimatic studies [43]. The elevation of the three sites ranged from 2400 to 2700 m asl (Table 1).
Areas with the least possible disturbance were selected: PPC is a private, unmanaged area with a 30% slope. The CUE site is a forest with a 60%–70% slope under conservation due to the recording of individuals of Picea chihuahuana Martínez, a species listed as threated or endangered in Mexico (Norma Oficial Mexicana 059). The TAL site is a managed forest with a 20–30% slope. However, despite the variability in conditions for each of the three study areas, the least disturbed and longest-lived individuals were selected as much as possible.

2.3. Laboratory Work

The samples were prepared for dating at the INIFAP CENID-RASPA Dendrochronology Laboratory. The increment cores were mounted in wood moldings and polished with sandpaper ranging from 40 to 600 grit to achieve a uniform surface to facilitate the visibility of individual tree rings under the microscope. The samples were dated using standard pattern matching techniques by comparing the growth patterns [44] to determine the exact year of formation for each annual ring. Dead trees and stumps were dated using the master chronology developed using living trees. After pre-dating, tree ring widths of all samples were measured using the Velmex measuring system, with 0.001 mm accuracy [45]. The quality of the dating was verified using COFECHA software [46]. To standardize the tree ring widths and highlight the climatic signal, biological–geometric detrending operations were performed using ARSTAN software [47]. This generated a series of standardized indices (chronology) with a mean of 1.0 and homogeneous variance [48].

2.4. Data Analysis

To determine similarities among the three sites we created a correlation matrix using the tree-ring width chronologies from each of the three sampled sites. This relationship was also verified using Principal Component Analysis (PCA) in order to merge the three site chronologies into a single “regional” chronology representative of climate variability for the southwest region of Chihuahua. Both analyses were conducted using STATISTICA Kernel program ver. 10.0 [49]. Based on the PCA results, dendrochronological series associated with the first component (PC 1), and which explained the most variance, were merged to create a single tree-ring-based series [50]. Based on the PCA results, we also used the full extent of the dendrochronological series grouped in PC1 to develop the regional chronology, and we discarded the eigenvalues obtained by PCA to avoid reducing the length of the regional chronology. In addition, we estimated the expressed population signal (EPS), which describes how well-replicated a chronology is compared to an infinitely replicated chronology. We used a minimum EPS value of 0.85 as suggested by Wigley et al. [51] to identify the best replicated portions of the chronologies (individual and regional).
The influence of climate on the tree ring growth of P. arizonica was analyzed using response function analysis. For this analysis, we used precipitation and temperature records from weather stations near the sample sites including data from the National Water Commission (CONAGUA) and the National Meteorological Service (SMN) (Table 2). The total tree-ring width indices of the residual chronologies were compared using correlation analysis with monthly and seasonal precipitation records from weather station in Creel, Chihuahua and grid points E46182, E47137 and E50658 (interpolated precipitation records) from the precipitation gridded dataset for Mexico [52], which were points located near the towns of Huicorachi, Arroyo de Agua, and Tinaja, respectively. Temperature records, however, were only available from the Creel weather station. We used the response function analysis to determine the correlation between P. arizonica tree-ring width index and both monthly climate variables, as well as cumulative values between January and the corresponding month. The climate variables analyzed included precipitation, minimum temperature and maximum temperature. The period of analysis was between 1981 and 2015, based on records from weather stations in Creel, Huicorachi, Arroyo de Agua and La Tinaja in Chihuahua, Mexico. Climate data were selected based on its completeness and proximity to the tree-ring sample sites. Therefore, although the selected climate records do not cover an extensive period, they are high-quality data that do not contain missing records, a common problem in many of the climate records observed in this region of the country. Furthermore, the relatively short calibration period provided valuable results. Analyses were conducted using the STATISTICA Kernel ver. 10.0 program [49].
We used the Climate Explorer web application to statistically analysis climate data. This web-based application for climatic research is managed by the Royal Netherlands Meteorological Institute (KNMI). Specifically, we used the ERA5 Near-Surface Air Temperature gridded dataset (European Centre for Medium-Range Weather Forecasts) [53] from 1979 to 2015 to determine correlation between the near-surface temperature and the reconstructed tree ring chronology.
To understand the relationship between tree ring growth and precipitation, we generated a linear regression model based on the observed precipitation data and the total tree-ring width index from the regional residual chronology using the STATISTICA 10.0 program. We used the VERIFY 5 subroutine from the University of Arizona’s Dendrochronological Program Library (DPL) to run the Calibration and Verification statistical tests for the common observed data period (50% of the data were used for calibration and the rest for verification). The calibration test examines the relationship between two variables, while the verification test validates the reconstruction model [54]. Once the model was validated, we applied it to the complete chronology period. Lastly, we fitted a decadal smoothing spline to the reconstruction time series to emphasize low-frequency extreme events such as dry and wet periods [55].
To analyze the influence of ENSO on the reconstructed regional precipitation patterns, we compared the Niño 3 SST Index (1400–1978) [56] to the reconstructed cumulative January–September precipitation. We used the MATLAB 6.5 program [57] to create annual resolution graphics of time–frequency and their potential wavelet spectra. For the years with the most severe drought and the highest precipitation, we generated maps, based on the Mexican Drought Atlas (MXDA) [58], Palmer Drought Severity Index (PDSI) for the months of June–August to analyze the affected area and degree of severity in relation to the study region.

3. Results

3.1. Growth Rings and Common Response of the Chronologies

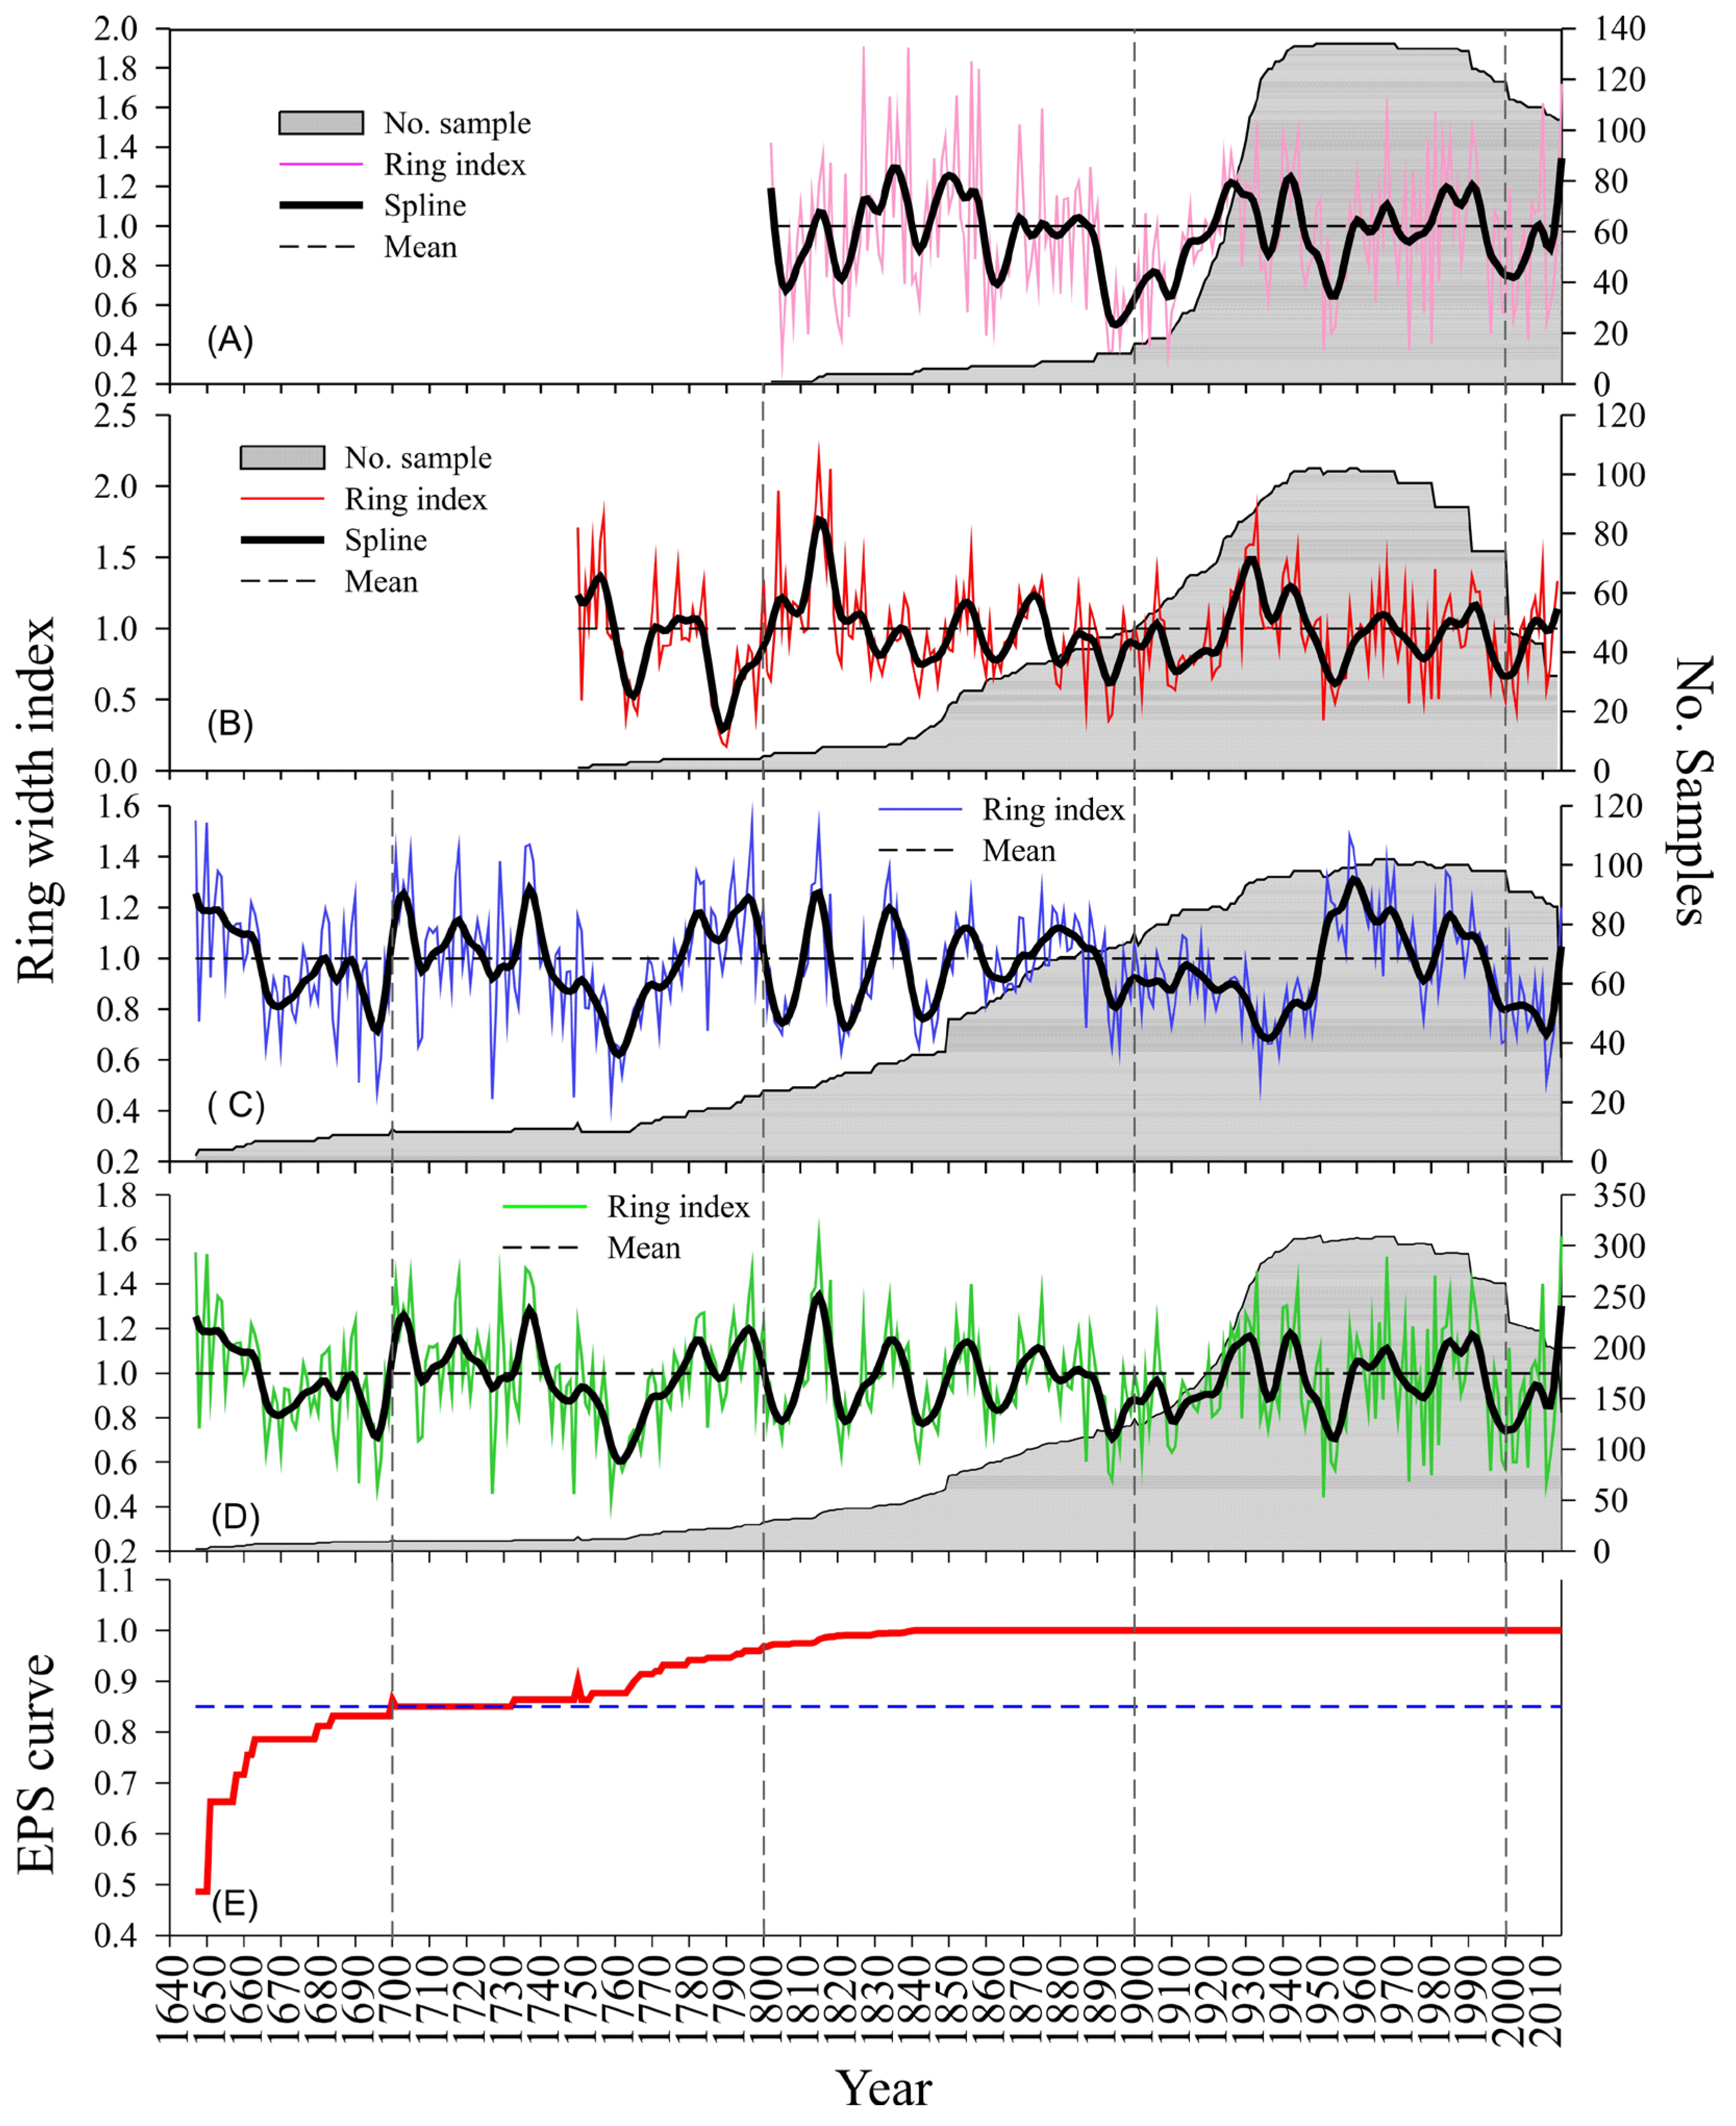
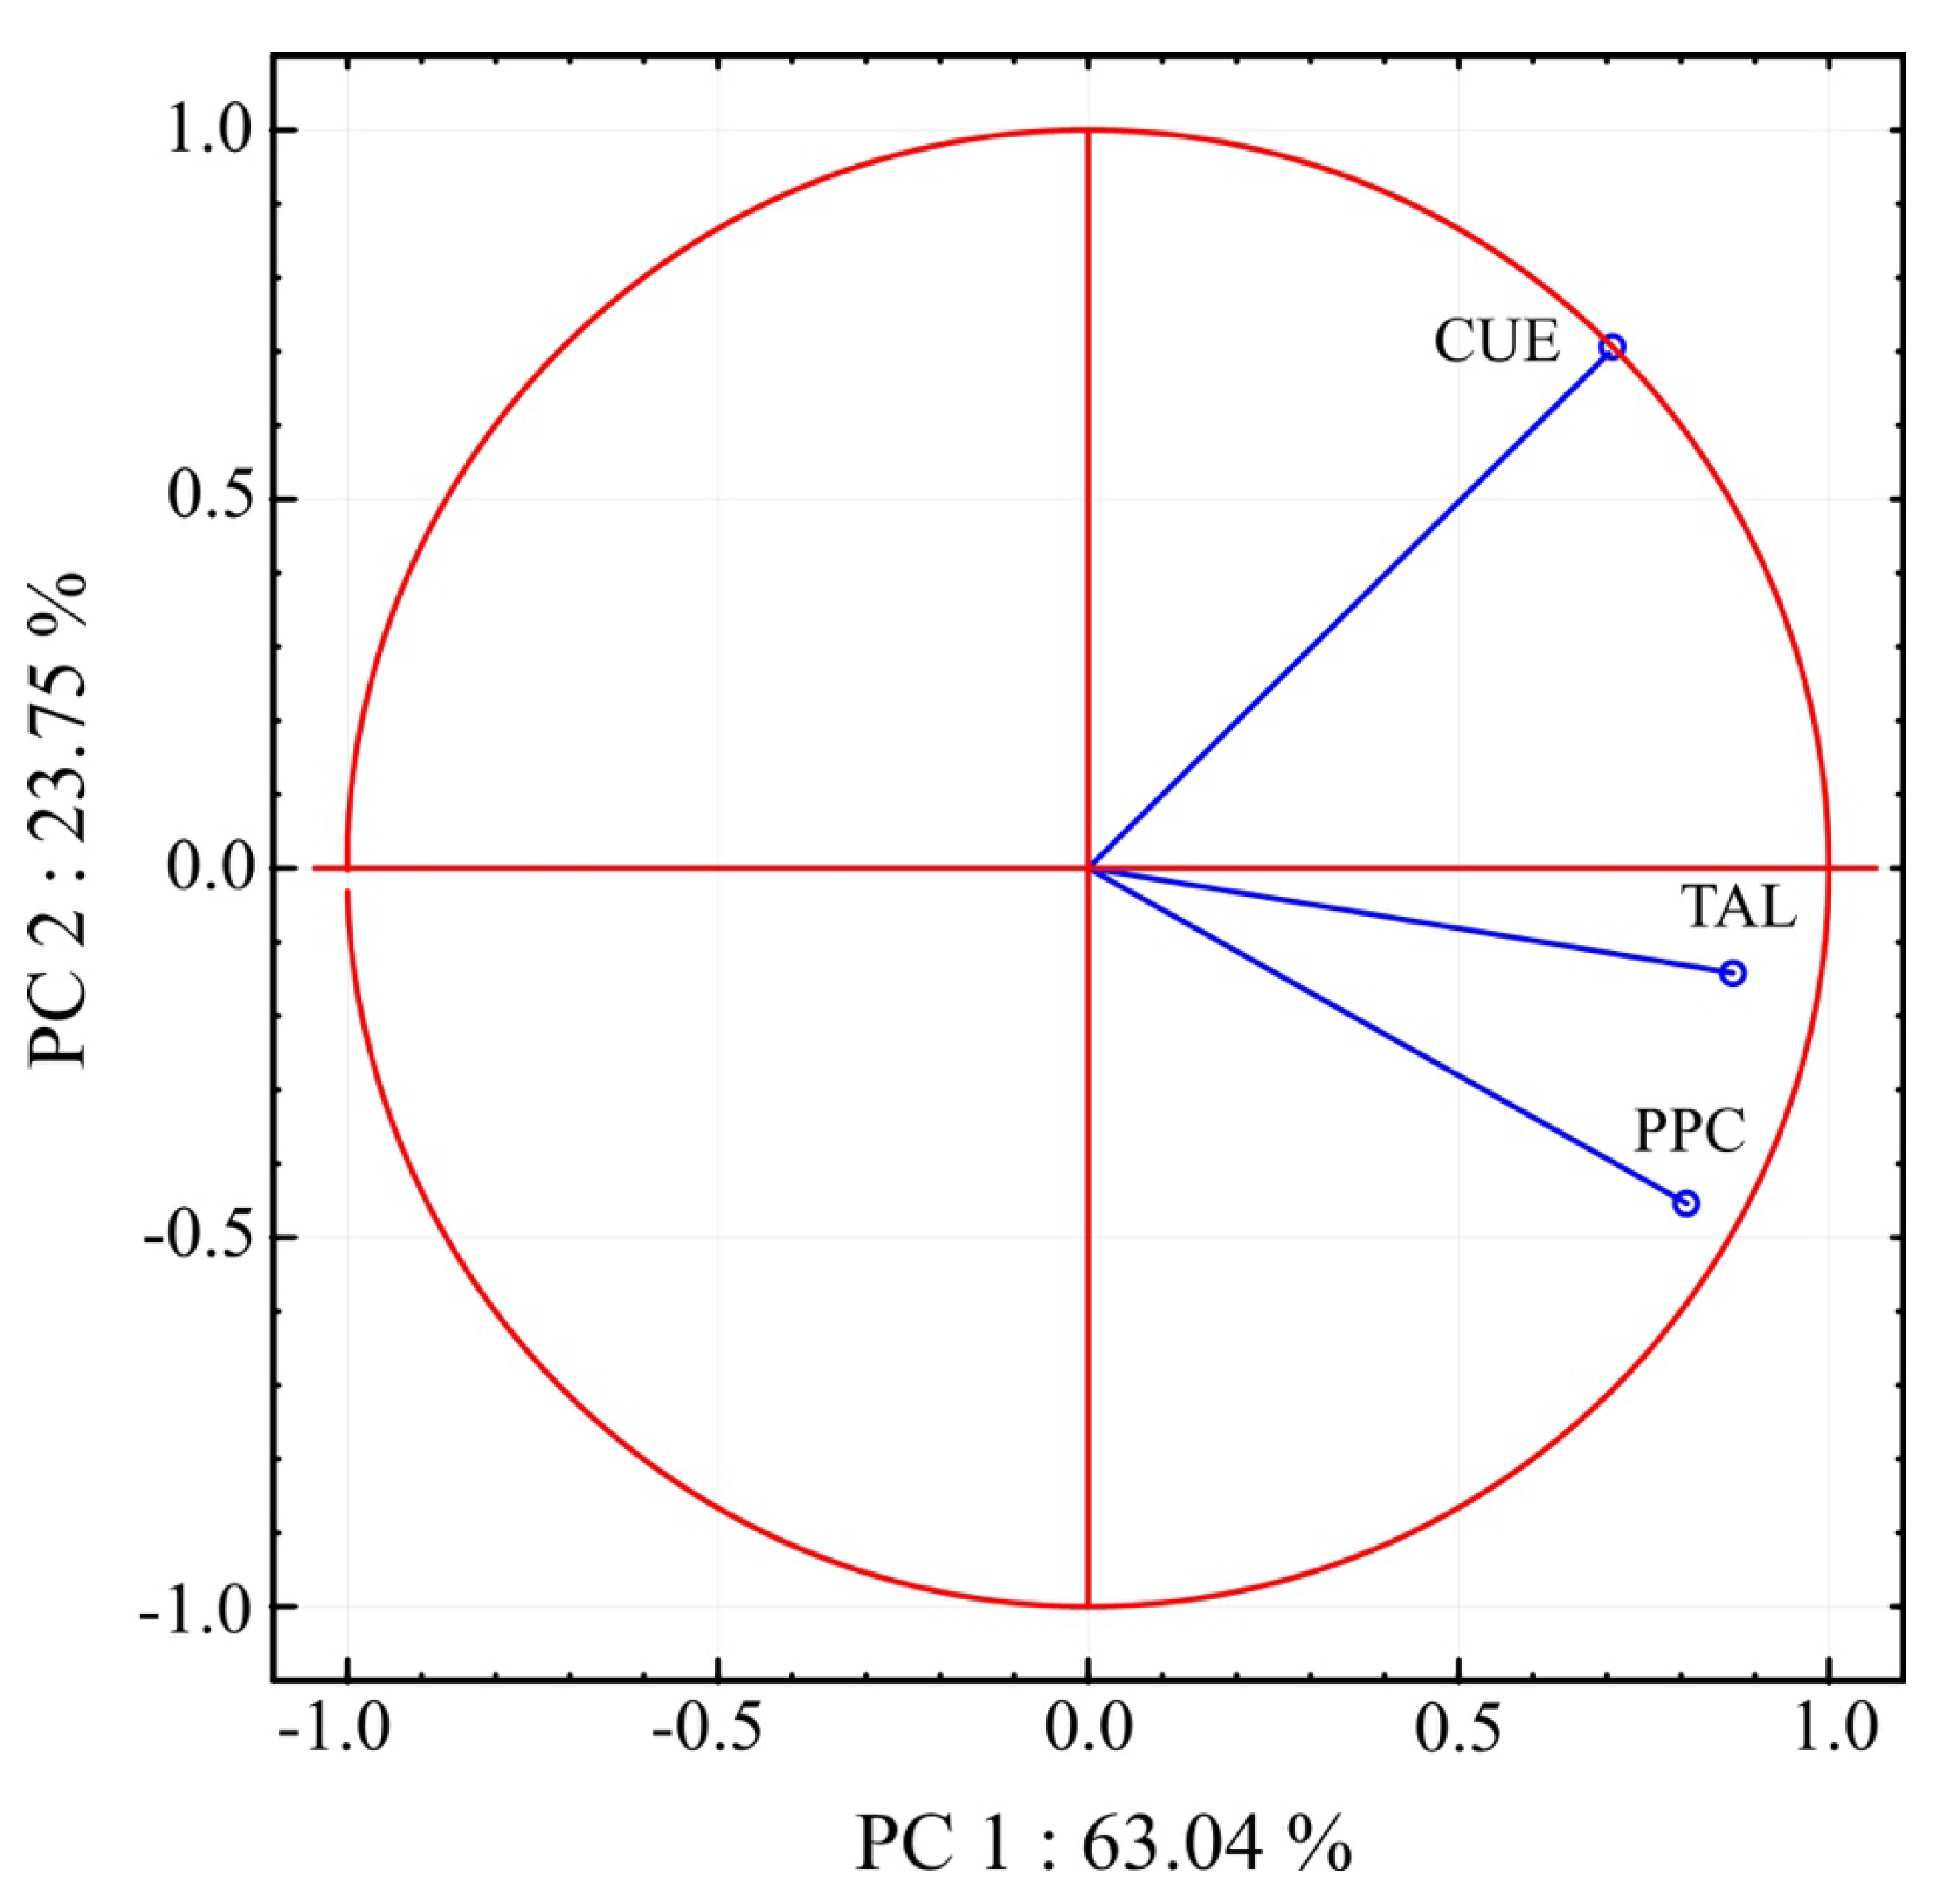
We dated a total of 359 increment cores from 155 P. arizonica trees (Table 1) and generated three chronologies with different temporal lengths (Figure 3, Table 3). The 10% of the samples (38) could not be dated due to growth problems and advanced wood rotting. The PCA results suggest that the three chronologies shared similar variability. That is, the first two principal components explain 86.8% of the variance in growth for the past two centuries (TAL chronology: CP1 = 0.86; CP2 = 0.14; PPC chronology: CP1 = 0.80; CP2 = −0.69 and CUE chronology: CP1 = 0.70; CP2 = 0.45). The three chronologies were grouped into PC1, which explained 63% of the variance (Figure 4). The correlation analysis between tree-ring series (r = 0.58, p < 0.01) also indicated similar response patterns between chronologies, allowing for the integration of the three site chronologies into a single regional chronology spanning 369 years, between 1647 and 2015 (Figure 3D, Table 3). The regional chronology showed high inter-annual and multi-year tree-ring variability for the southwest region of the state of Chihuahua.

3.2. Response Function

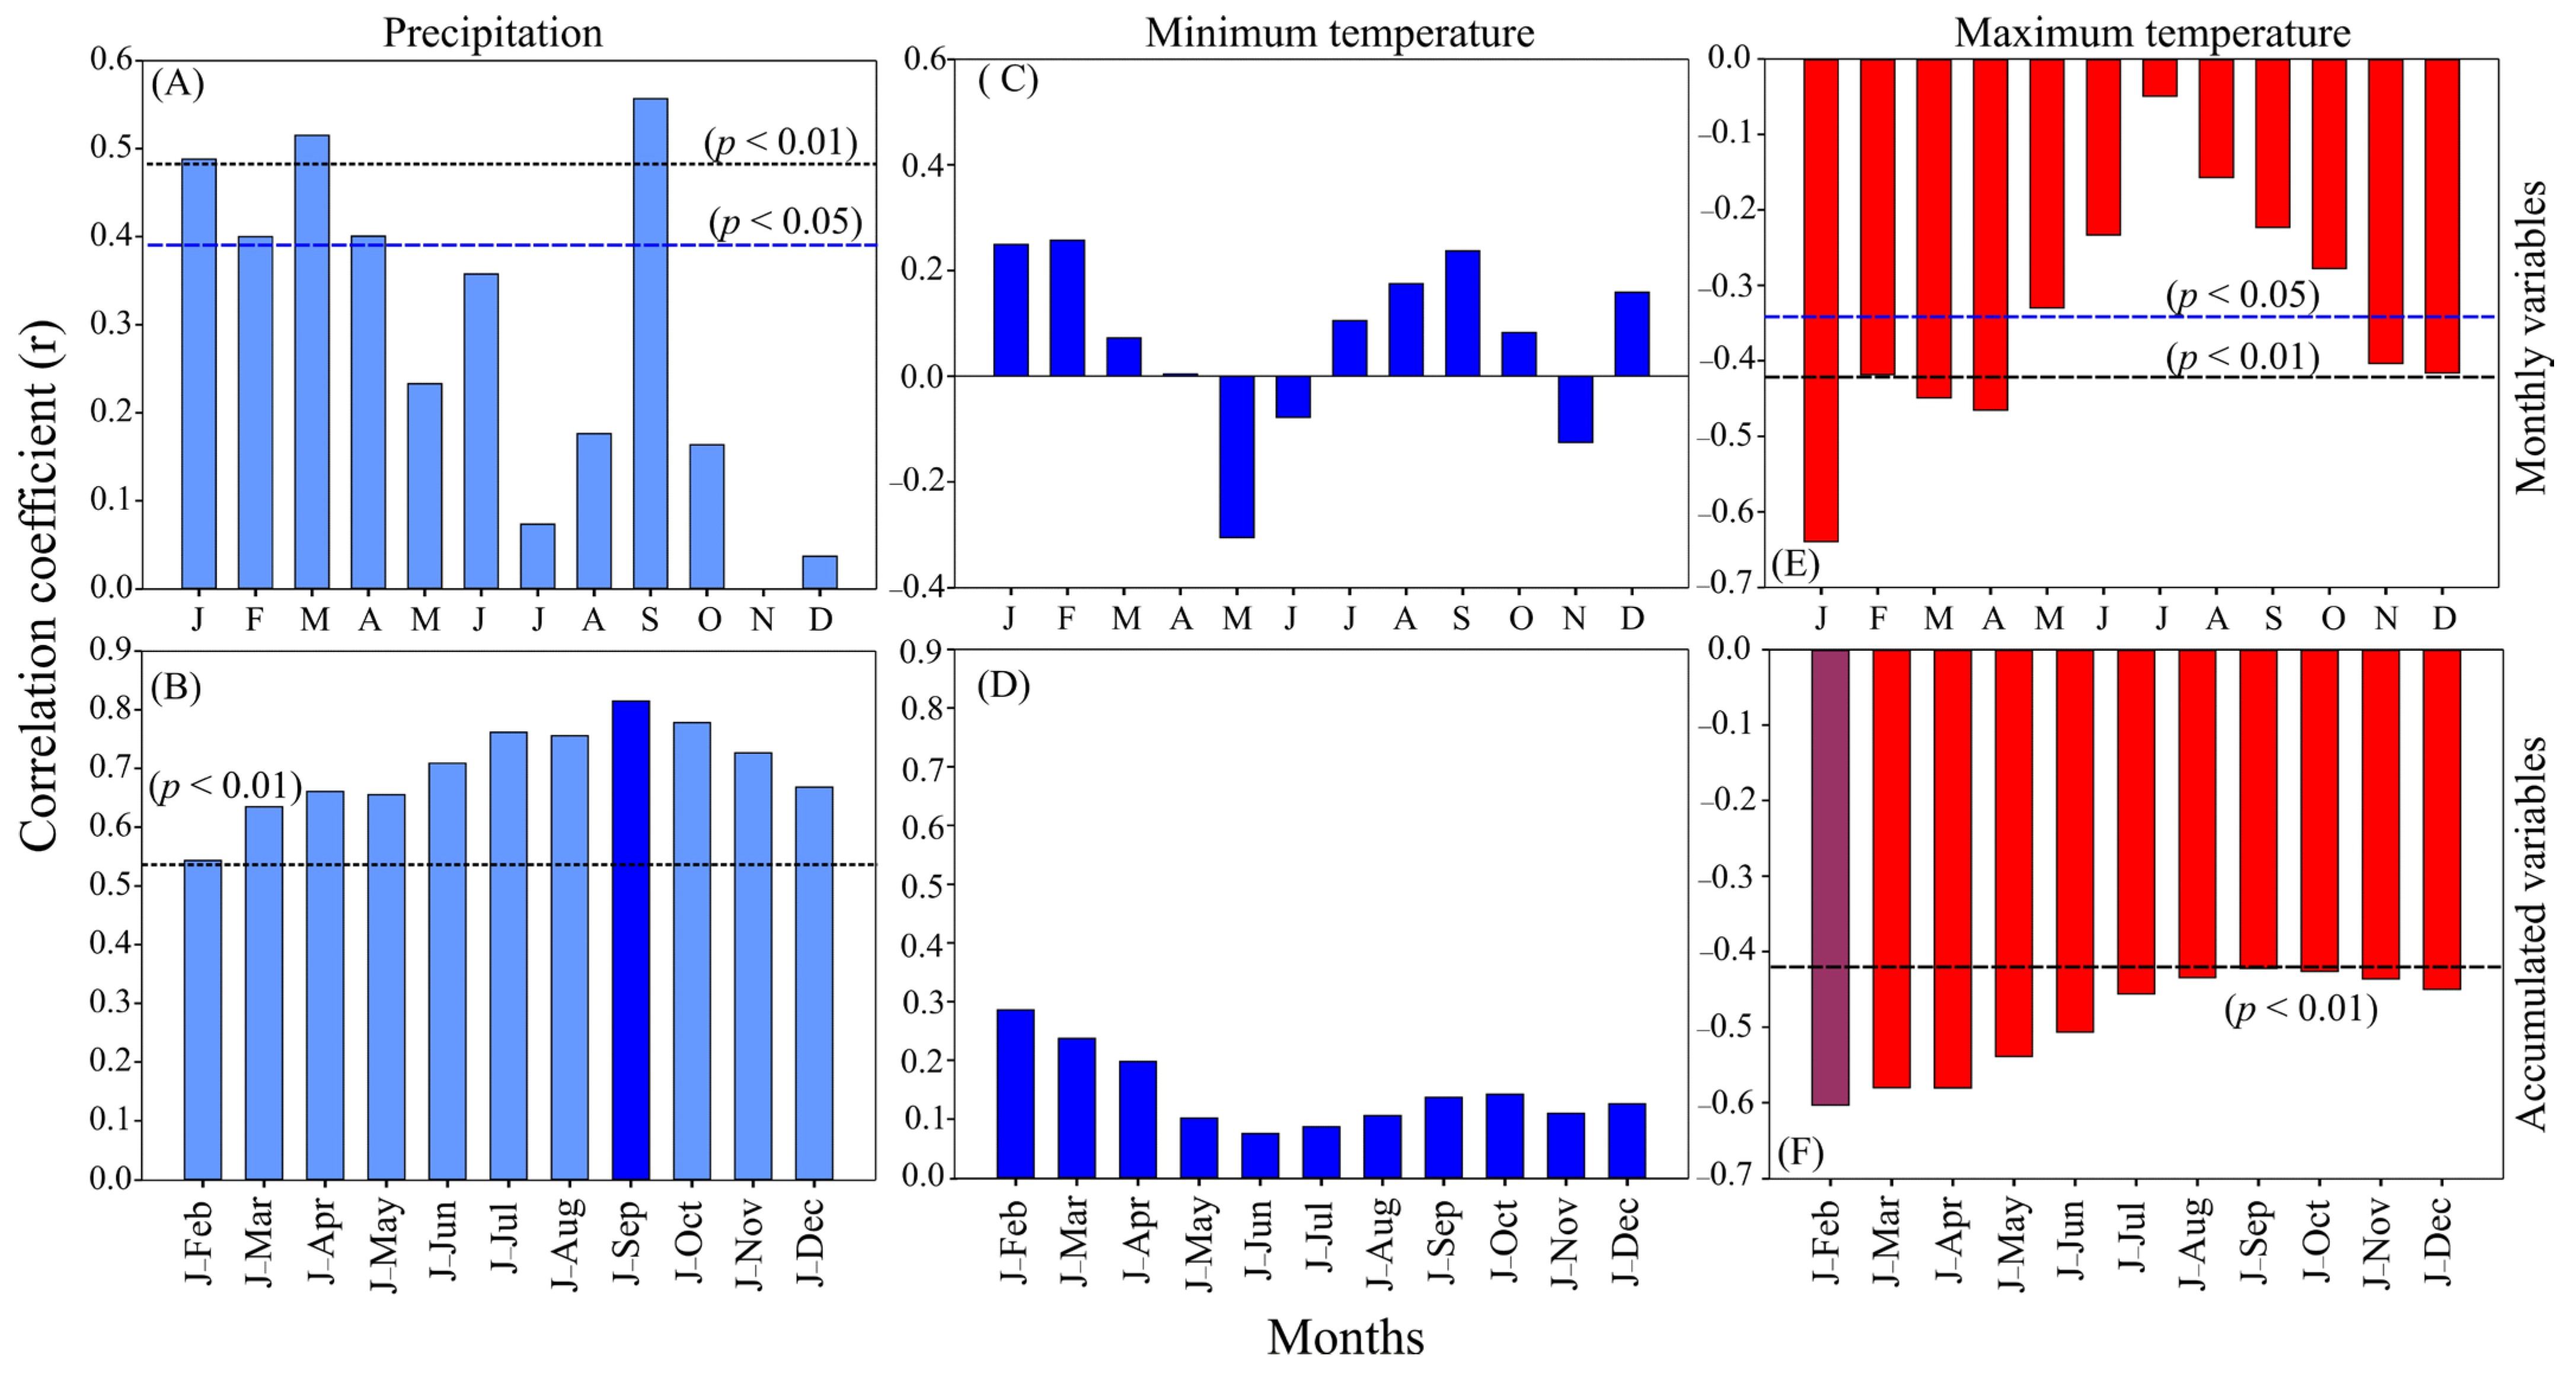
We found high correlation between residual tree ring-width chronology and observed precipitation (1981–2015). In general, there was a positive relationship between tree-ring growth and monthly precipitation (Figure 5). That is, we found a positive correlation for all the individual months except November. However, statistically significant correlations (p < 0.05) were only detected for the individual months of January through April and September. While a highly significant relationship (p < 0.01) was detected individually for three months for January, March and September (Figure 5A).
Tree-ring growth and cumulative monthly precipitation was significantly correlated (p < 0.01) though out the year (Figure 5B); however, the correlation peaked for cumulative precipitation between January and September (r = 0.814, p > 0.01) (Figure 5B). Therefore, the reconstruction period that explains the greatest variability in rainfall was January–September. Conversely, the relationship between tree-ring growth and minimum monthly temperature varied throughout the year, with a positive relationship during most months except May, June and November, but none were significant (Figure 5C). We also found a non-significant positive relationship (p > 0.05) between total ring growth and average minimum accumulated temperature (Figure 5D), the highest correlation was recorded in January–February.
Maximum monthly temperatures did significantly influence tree-ring growth. In particular, we found a highly significant negative relationship (p < 0.05) for the winter and spring months from November through April (Figure 5E). We found a significant negative relationship (p < 0.05) between tree ring growth and average maximum accumulated temperature, mainly for the months January–February (Figure 5F).

3.3. Precipitation Reconstruction

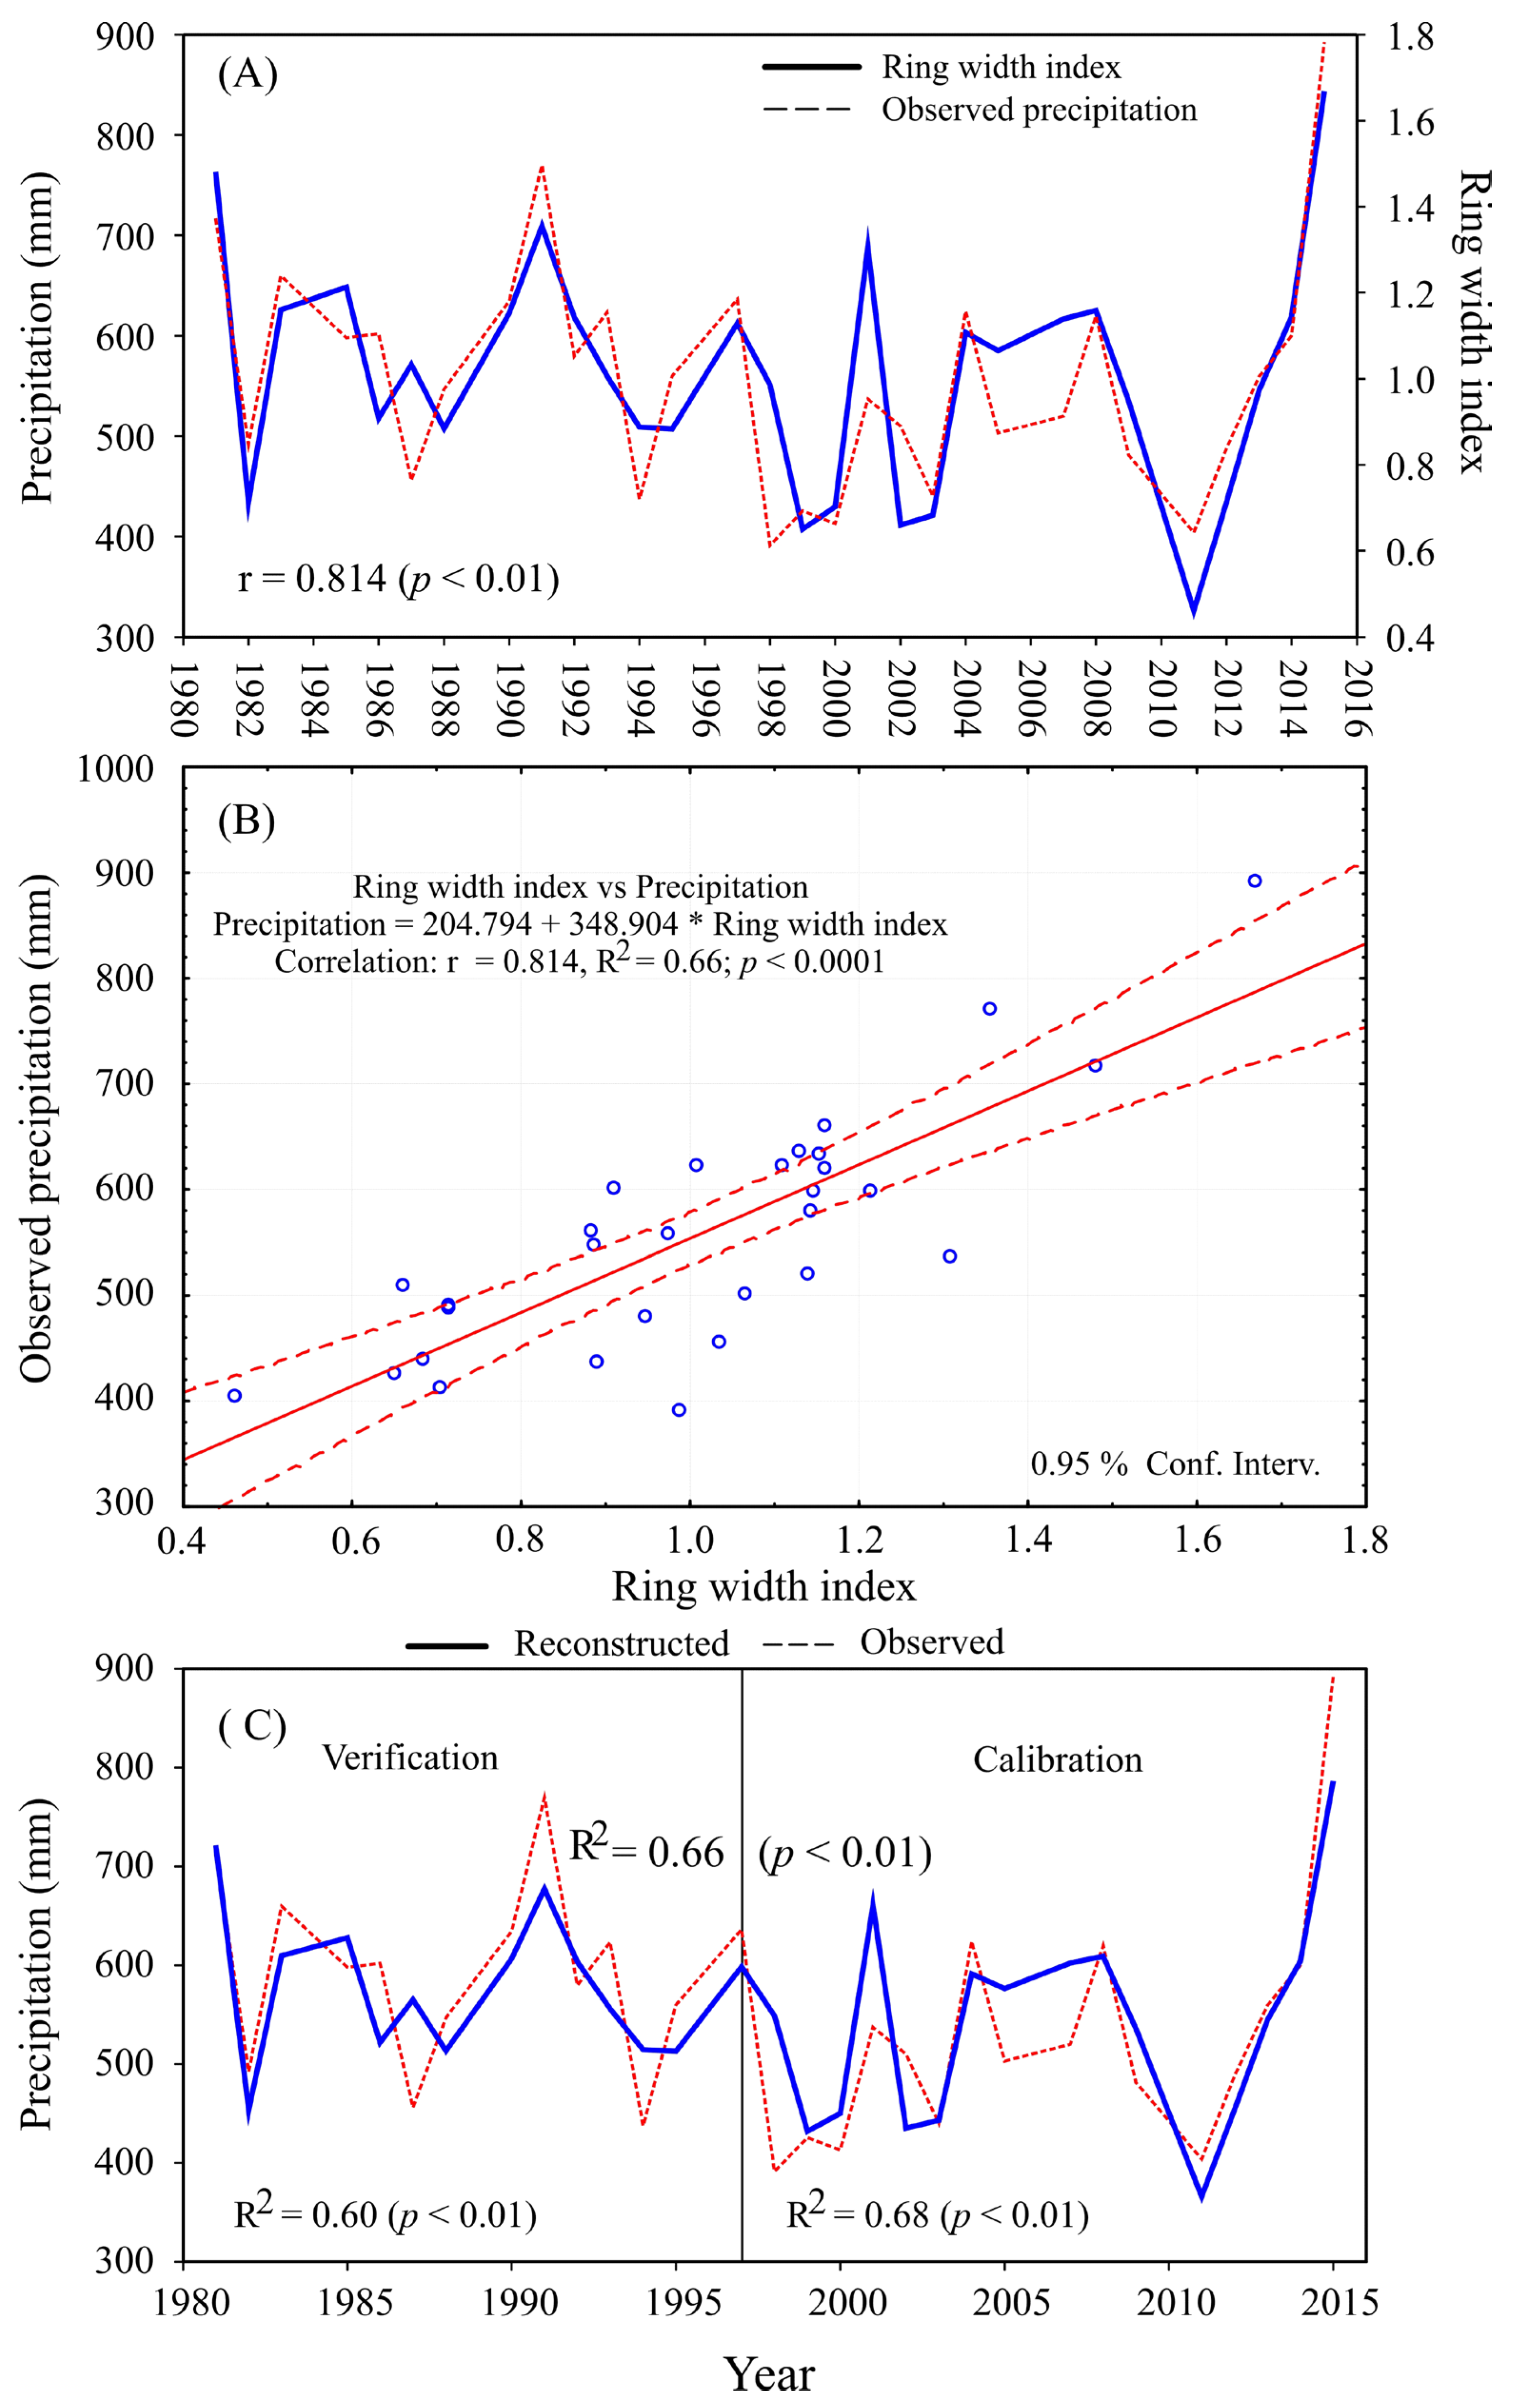
For the 35-year period (1981–2015), when we had both tree ring and recorded precipitation, we found a significant correlation between cumulative precipitation from January to September and tree ring-width index (r = 0.814; p < 0.01) (Figure 6A). The residual chronology indicated the potential to develop a regression model and reconstruct the January–September precipitation variability for previous years within the chronology (369 years). The linear regression model developed for the reconstruction (Figure 6B) was considered statistically significant (p < 0.0001, Table 4 and Table 5) and was as followed:
Yt = 204.794 + 348.904 * Xt
where:
Yt = precipitation in millimeters for a specific year;
Xt = tree-ring width index for a specific year.
Figure 6. Relationship between the seasonal precipitation between January and September, and the regional index of ring width that includes the period of 1981–2015 (A), linear regression model between the two variables based on the program STATISTICA Kernel Release 5.5 [49] (B), and comparison of the reconstructed seasonal precipitation January–September (solid line) and observed precipitation (dotted line) for the period 1981–2015 (35 years), verification and calibration of the regression model (C).
Forests 16 01639 g006
Table 4. Calibration of reconstructed of January–September precipitation for Chihuahua, Mexico based on P. arizonica ring-width residual chronologies.
PeriodR2AdjCoefficientStandard Errort-StatisticProbability
β0β1β0β1β0β1β0β1
1981–19970.60221.26348.8688.8981.832.484.260.0280.001
1998–20150.68207.34331.2861.6661.353.365.390.0040.000
1981–20150.66204.79348.9048.9946.944.177.430.0000.000
Table 5. Verification statistics for the tree-ring reconstruction January–September precipitation in Chihuahua, Mexico from three P. arizonica ring-width residual chronologies. The verification procedure used the climate estimates derived in the calibration period, e.g., verification against observed data 1981–1997 used climate estimated by regression 1998–2015.
PeriodPearson Corr. (r)Reduction a of ErrorSigns Test bt-Value cFirst d Significant Difference
1981–19970.776 *0.44 *4 ns2.41 *6 ns
1998–20150.824 *0.59 *2 * 2.32 *3 *
1981–20150.814 *0.49 *8 *2.94 *9 *
ns = Not significant. * = Significant p < 0.05 a There is no formal test of significance for this statistic, but any positive result indicates that the reconstruction contributes unique paleoclimatic information [48]. b Signs of departures from the mean of each series [48]. Means are subtracted from each series and the residuals are multiplied. A positive product is a ‘hit’. If either observed or reconstructed data are similar to the mean, the year is omitted from the test. c Comparison of the relative magnitude of hits/misses in the sign test above. d Observed and reconstructed data-first differences (t–t − 1); the transformation removes trends that may affect the Pearson correlation coefficient. The sign of the first differences measures the association at high frequencies between observed and predicted values. The number of positive signs (agreement) expected by chance follows a binomial distribution and is 1/2n, where n is the total number of observations. The test is significant whenever the number of signs exceeds the number expected from random [54].

3.4. Calibration and Verification

The regression model was then applied to the total period of observation (1981–2015, n = 35 years), the verification period between 1981 and 1997, and the calibration period was 1998–2015 (Table 4 and Table 5). Despite the relatively short validation period, the model had good predictive power (r = 0.824; R2 = 0.68; p < 0.05) between the observed and reconstructed precipitation with the regression model explaining 68% of the rainfall variability in the calibration period. The verification test resulted in an r = 0.776 (R2 = 0.60; p < 0.05), explaining 60% of the seasonal precipitation variability (Figure 6C). For the total calibration period (1981–2015), the model resulted in an r = 0.814 (R2 = 0.66; p <0.01) between observed and reconstructed precipitation, which explained 66% of the rainfall variability (Figure 6C). The results of the calibration and verification tests were significant (p < 0.05) regarding the correlation, error reduction, t-value, and first significant difference (Table 5). The linear regression model, for the 1981–2015 period, was considered statistically valid and was, therefore, used to reconstruct annual precipitation for the complete period covered by the tree-ring width index chronology (1647–2015).

3.5. Climate Variability

Using the calibrated model, we reconstructed annual cumulative precipitation between January and September from 1647 to 2015 (369 years). The reconstructed precipitation patterns had high inter-annual, decadal, and multi-decadal variability (Figure 7), including 14 different dry periods with below-mean precipitation that stand out due to their amplitude and intensity (Table 6). Similarly, we reconstructed six individual years with precipitation < 400 mm (below 2 standard deviations) (Figure 7, Table 6).
Wet periods with precipitation above average were also reconstructed (Table 6), including six years with precipitation > 700 mm (above 2 standard deviations) (Figure 7, Table 6). Recent decades (1981–2015) had years with the highest recorded precipitation including 1991, 2001, 2010 and 2015, with 2015 standing out with nearly 800 mm of precipitation, the largest amount within the 369-year reconstruction period for this site.

3.6. ENSO Influence on Rainfall Variability

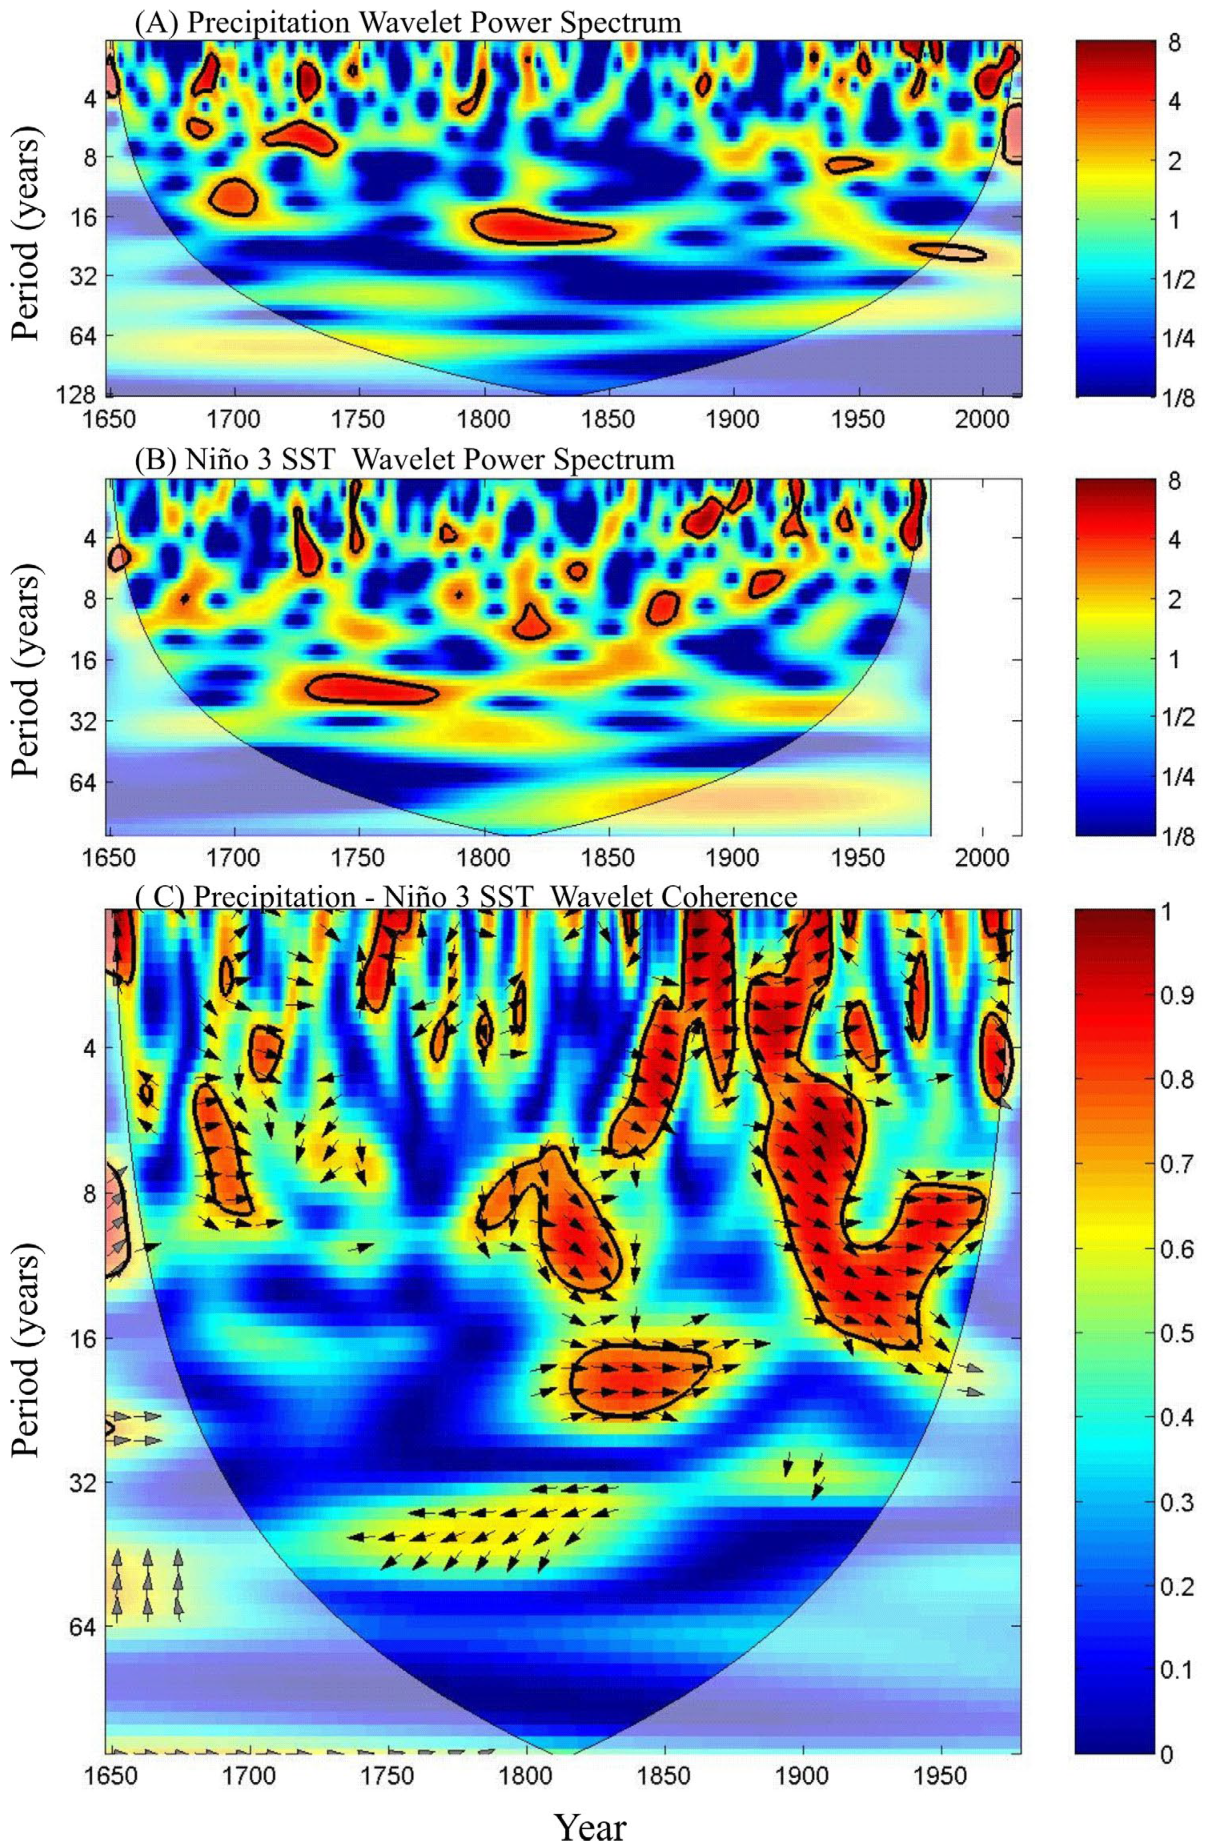
The wavelet analysis for the reconstructed precipitation (Figure 8A) found significant (p < 0.05) one- and two-year oscillatory periods after 1950. Slightly longer oscillatory periods of three and four years were scattered across the period of analysis between 1650 and 2010. Early in this period, we also found significant periods of 6–8 years and 11–16 years, while longer significant periods between 17 and 24 years were found between 1800 and 1850. On the other hand, the ENSO wavelet spectrum (Figure 8B) had significant (p < 0.05) areas of irregular cyclicity which ranged from 1 to 7 years mainly after 1725, and from 8 to 14 years after 1810. Longer periods ranging from 20 to 28 years occurred from 1730 and 1770.
Using cross-wavelet analysis of our site seasonal reconstructed precipitation and the Niño 3 SST index, we found significant coherence (p < 0.05) between 1647 and 1978 at frequencies ranging from 1 to 4 years (Figure 8C). The reconstructed precipitation from January to September and the Niño 3 SST Index coincide in phase during the periods of 1680–1700, 1830–1860, 1890–1920 and 1935–1965 at frequencies between 5 and 9 years. Similar phase coinciding occurred from 1800 to 1830 and 1890 to 1965 at frequencies between 10 and 14 years, and from 1810 to 1870 at frequencies between 16 and 24 years, and finally from 1647–1800 at frequencies of approximately 100 years (Figure 8C). These results suggest that the most severe drought periods (Table 6) reconstructed for our study area in Chihuahua were significantly modulated (p < 0.05) by ENSO.
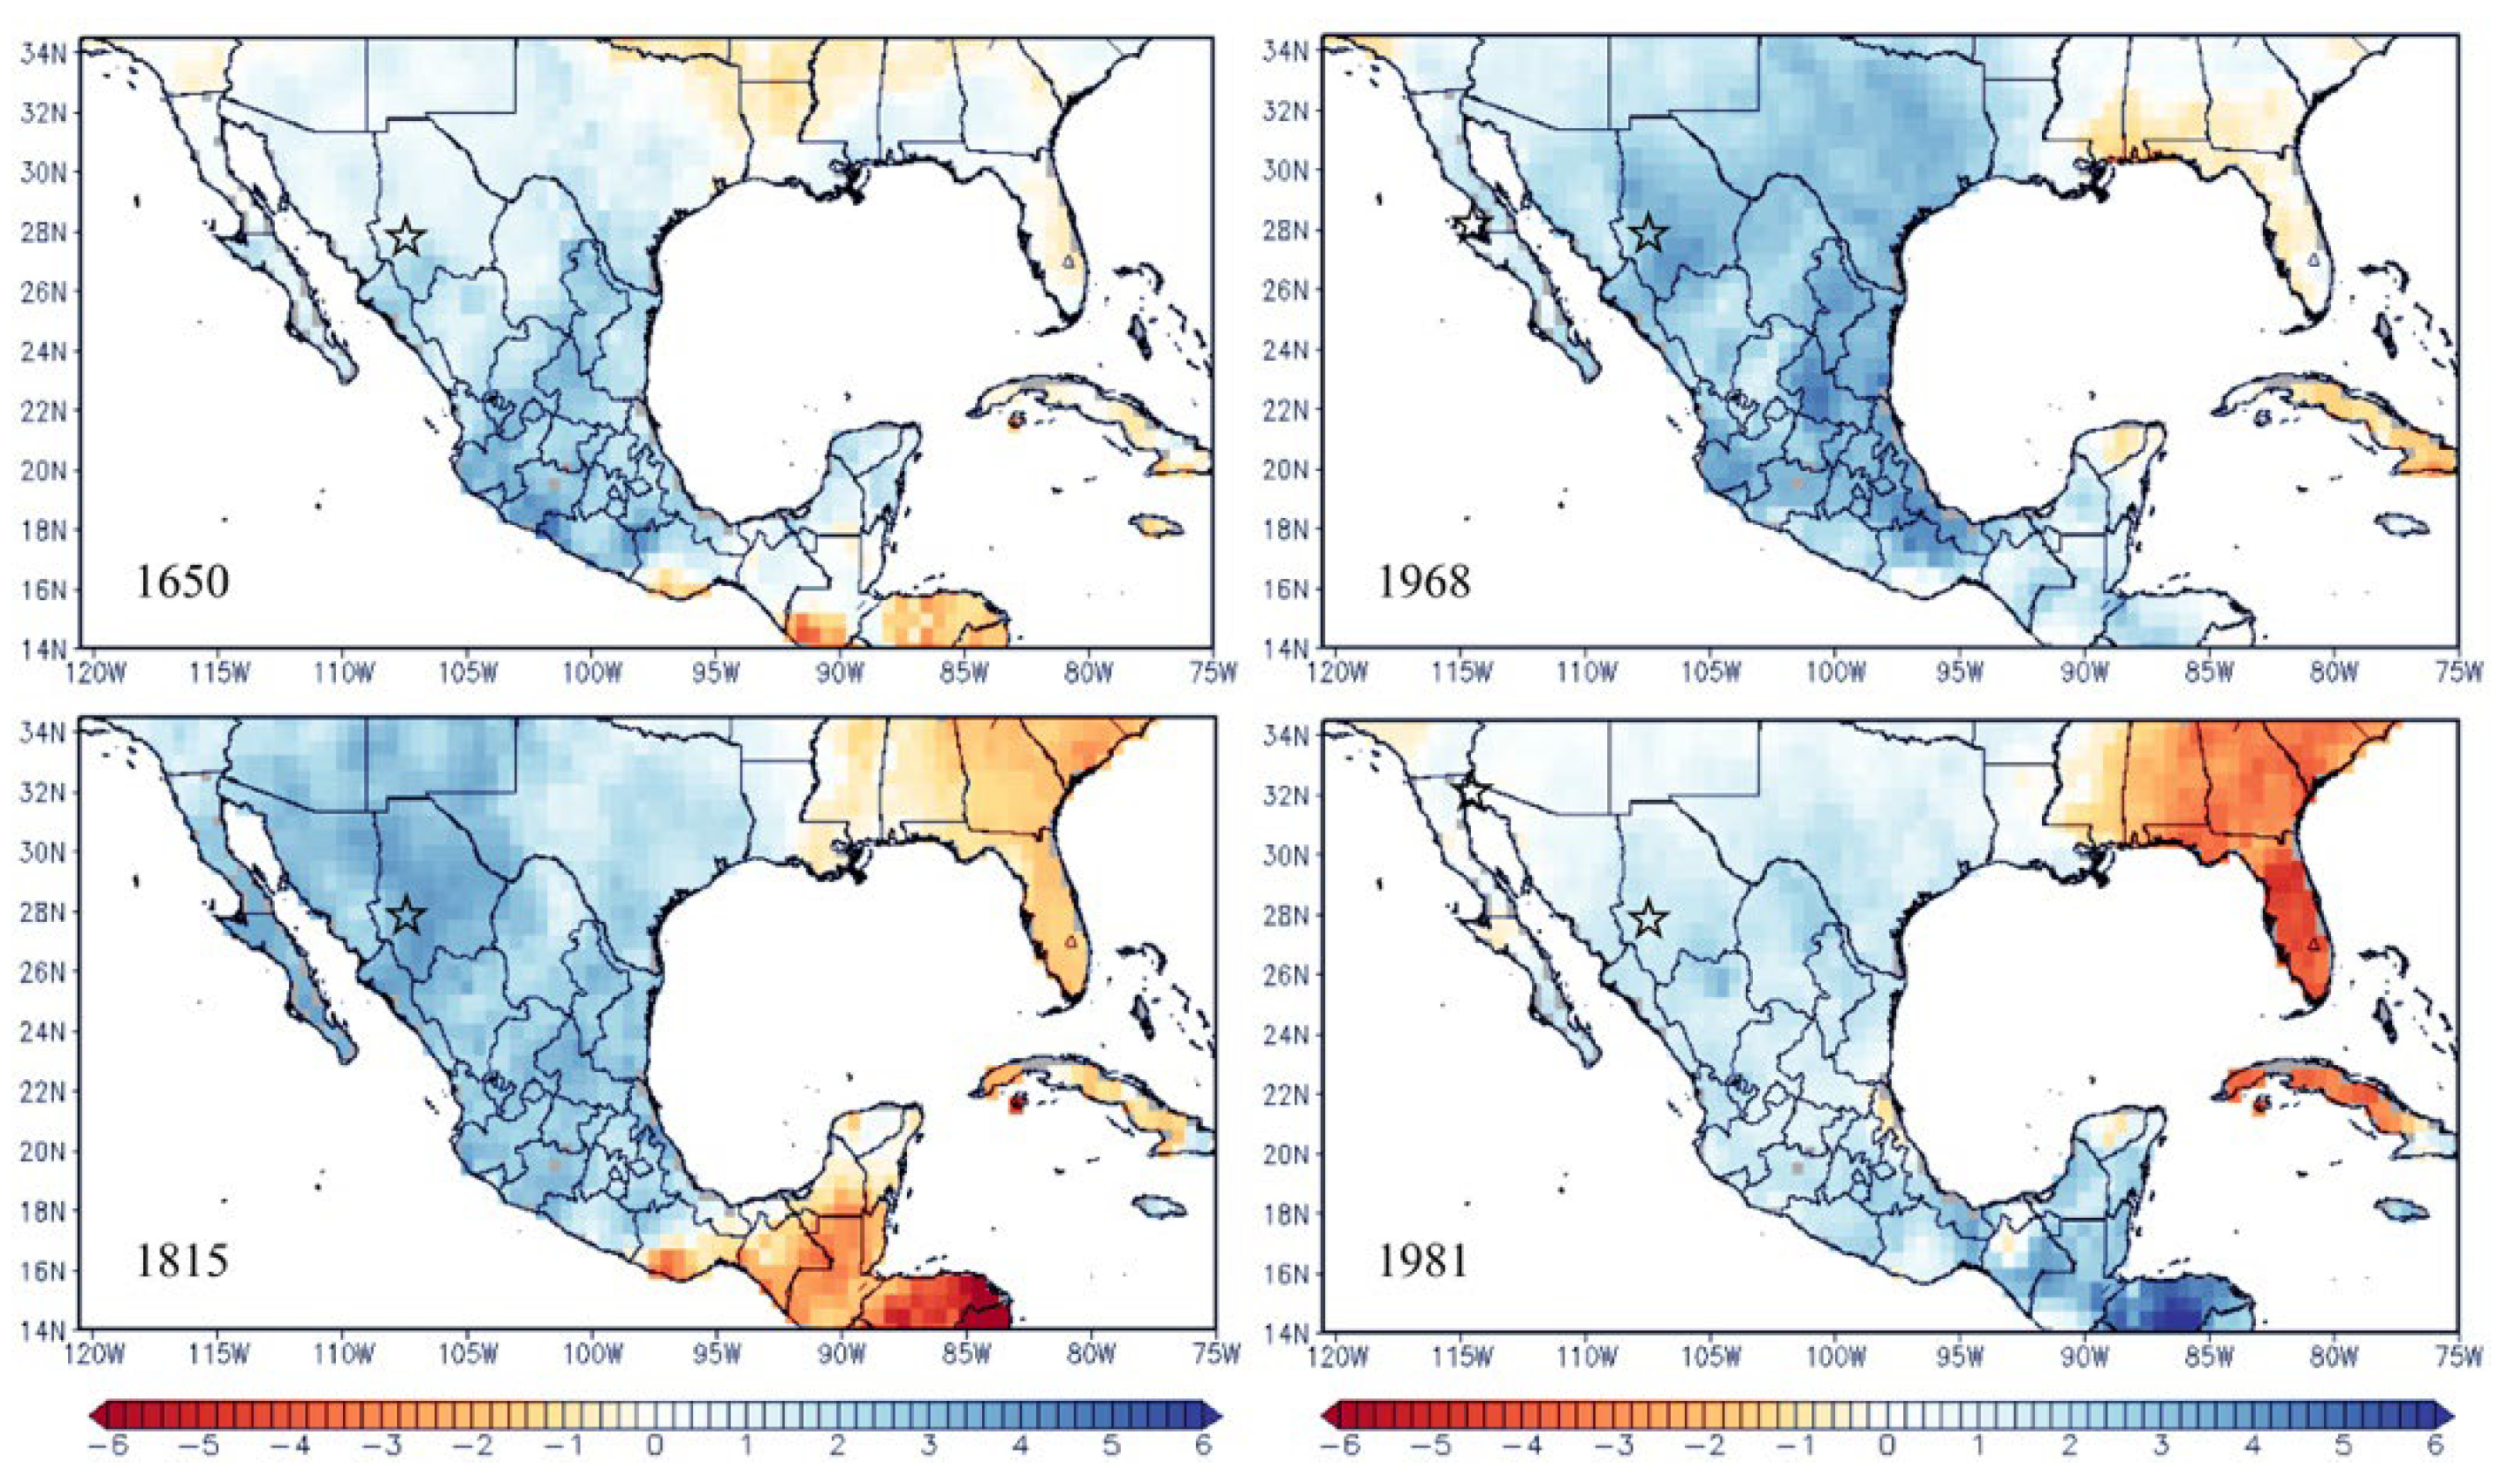
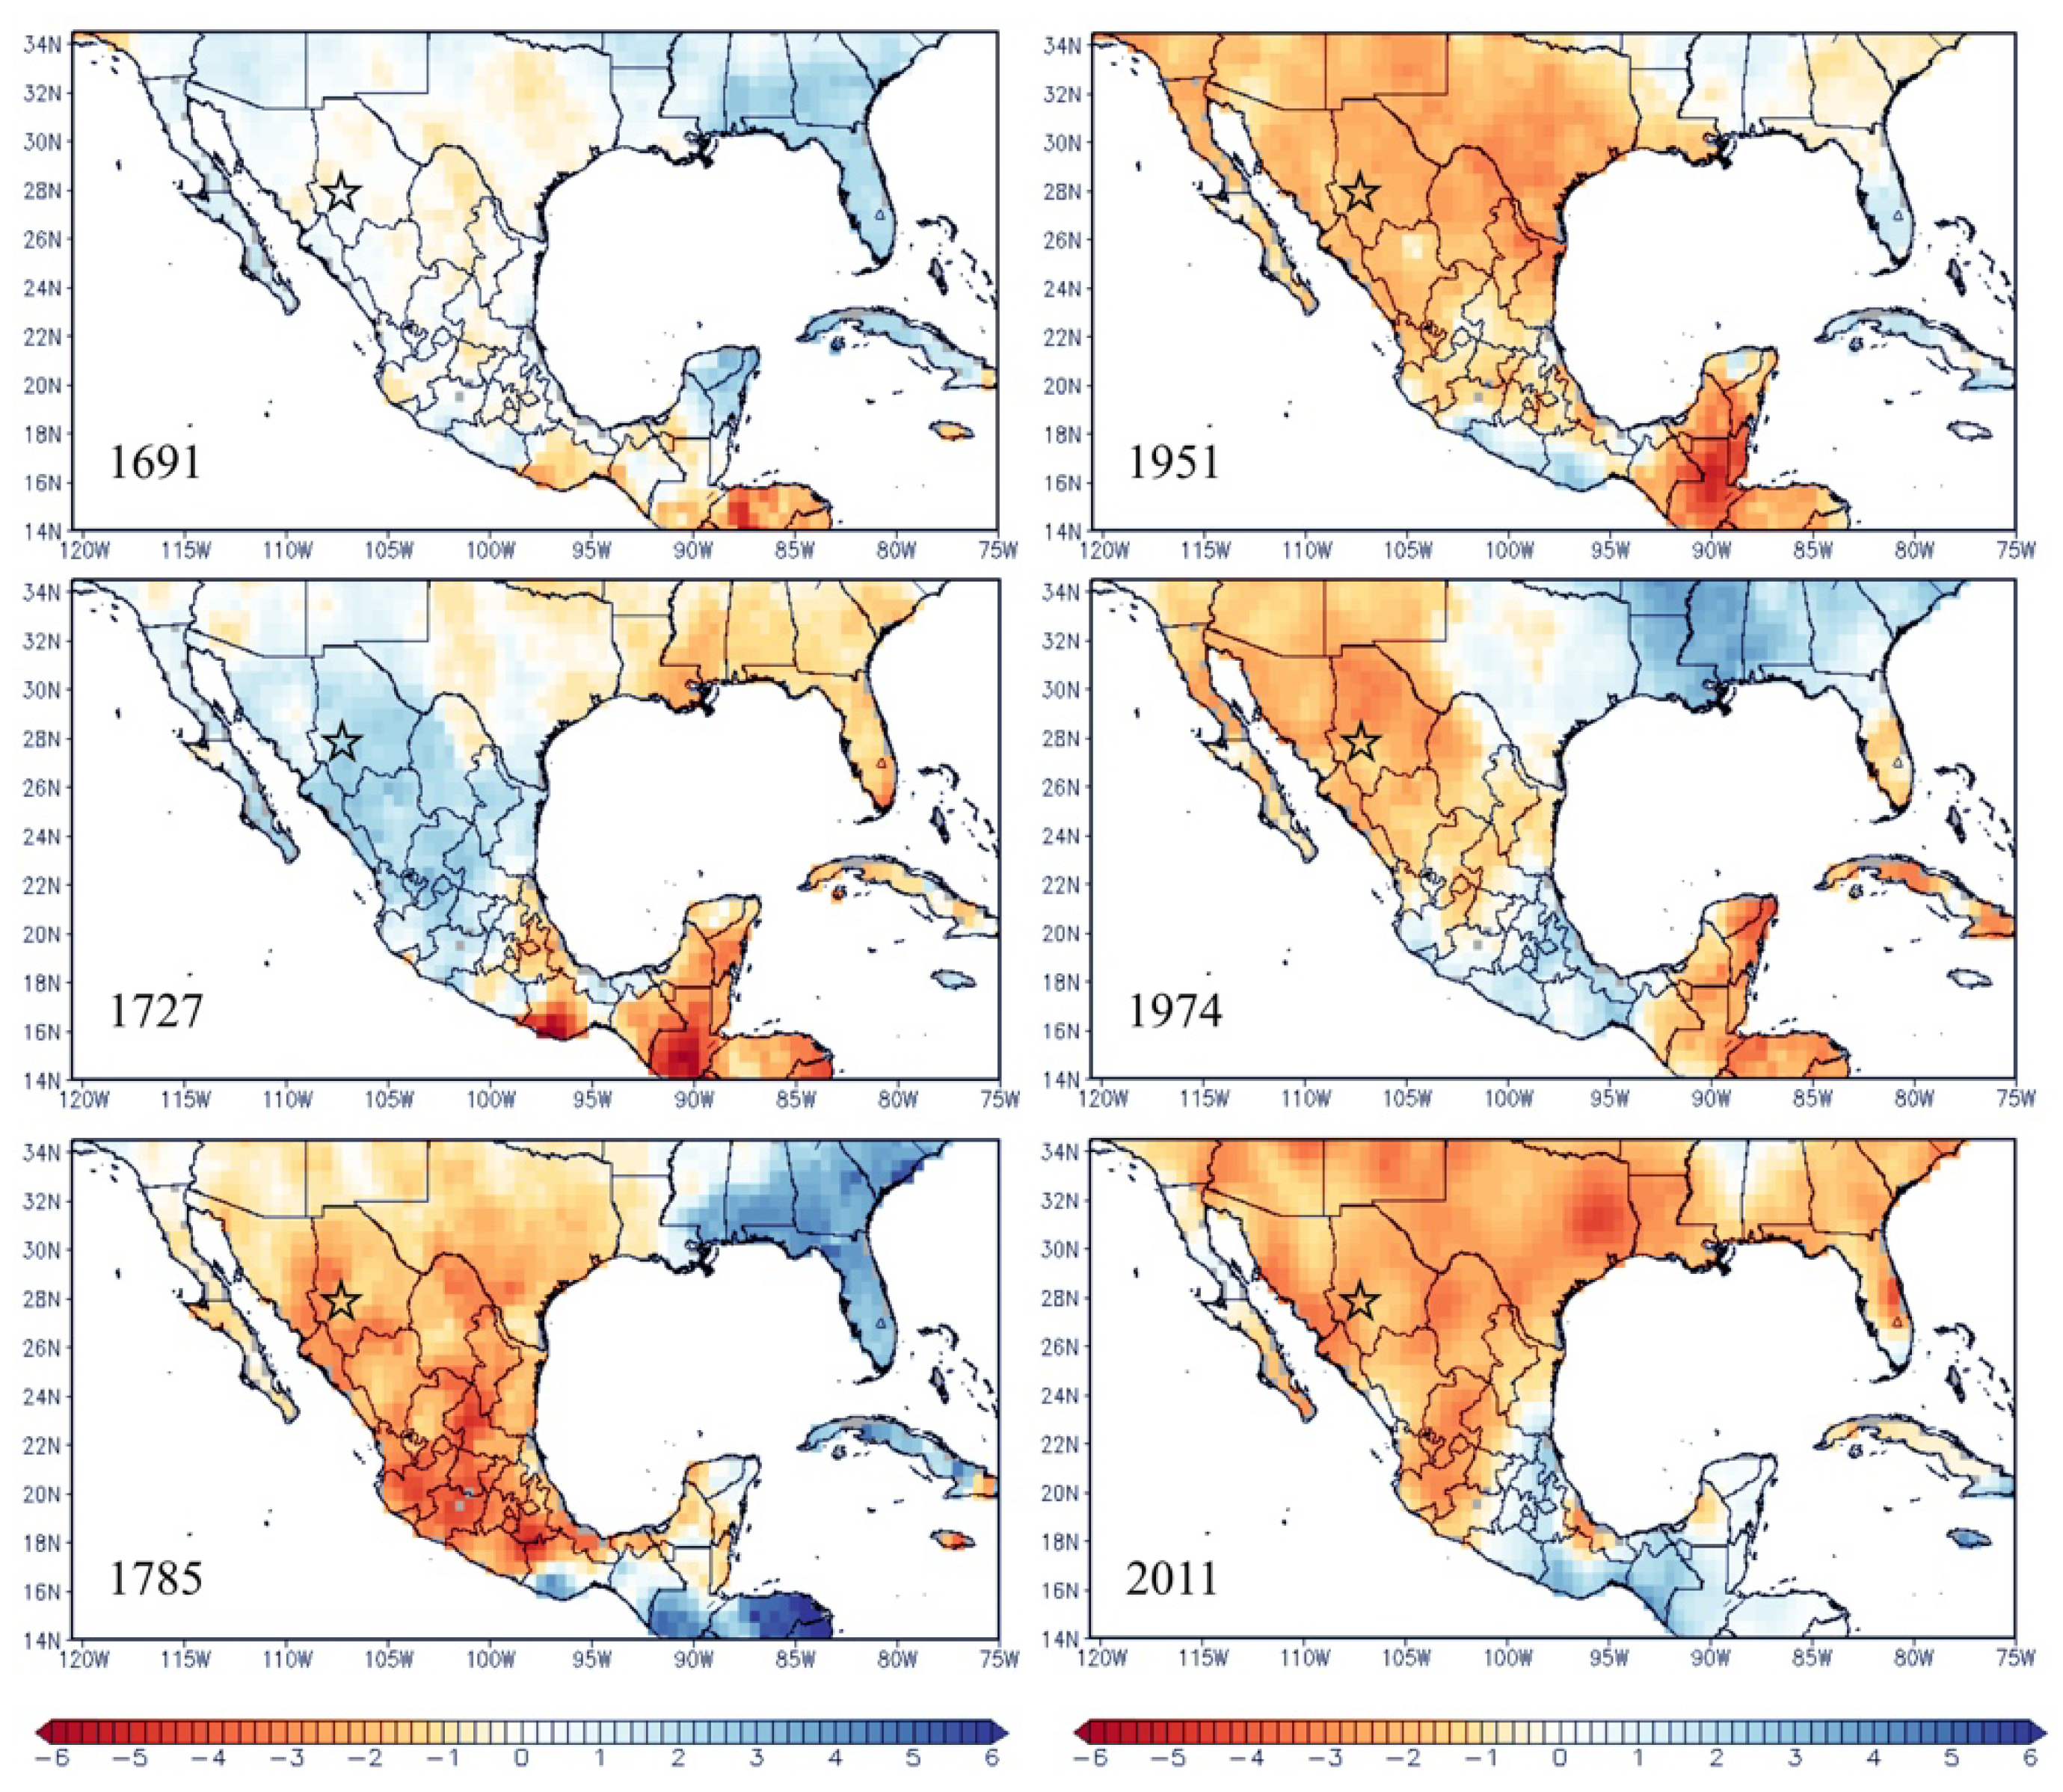
The years with the highest and lowest precipitation for the last three and a half centuries within our study area in southwest Chihuahua were synchronized with ENSO events (Figure 7). These events occurred both in the El Niño warm phase and in the La Niña cold phase, respectively (Figure 9 and Figure 10). Both ENSO and North American Monsoon are the main contributors to precipitation variability in the Chihuahua region.

4. Discussion

4.1. Growth Ring Response to Climatic Variables

Previous dendroclimatic studies in northern Mexico have reconstructed winter–spring precipitation variability based on different species like Pseudotsuga meziensii (Mirb.) Franco [35,59,60], Pinus durangensis Martínez [61], Pinus cooperi C. E. Blanco [61], and Pinus lumholtzii Robinson et Fernald [61,62]. However, summer precipitation, which represents a higher percentage of annual rainfall, has not been reconstructed using dendrochronological methods. In this study, we have reconstructed cumulative precipitation for the period January–September that includes the critical summer period and captures most of the variability in annual rainfall.
This study, based on P. arizonica annual tree rings, represents the first to analyze the dendroclimatic potential of this species in Mexico. Our analysis confirms that this species has the potential to develop extensive chronologies in this region of northern Mexico. Tree ring growth patterns across the study area had high inter-annual variability, suggesting high sensitivity to environmental variations, and the tree-ring series had high intercorrelation between trees. These parameters characterize conifers sensitive to precipitation variability in this region [63]. The correlation between series for each of the three chronologies we analyzed (Table 3) exceeded COFECHA’s minimum acceptable correlation of 0.328 (p < 0.01), meaning that they were appropriately dated [46]. These results indicate synchronous variability of annual growth that allows annual to interannual resolution and their potential use in reconstructions of climate variables.
The chronologies used in this study had similar shared interannual variability during their common period (1802–2014) which was captured in PC1 and explained 63.04% of the variance (Figure 4). This common variability among the three sites captures the dominant pattern of tree growth throughout the region, and is a direct response to precipitation, the most limiting growth factor in this region and elsewhere. Similar results have been reported in different studies across northern Mexico [37,62]. Our regional chronology also recorded an EPS value above 0.85 after 1700, which is generally cited as an acceptable threshold for dendroclimatic reconstructions [64].
The P. arizonica chronology developed in this study explained nearly 70% of the precipitation variability of instrumental climate records (January–September). In a similar study using P. durangensis, others [36] reconstructed precipitation for the January–August period in Presidio-San Pedro watershed in the state of Durango, Mexico, but their results only explain 51% of the precipitation variability and did not include the entire summer period. An accurate reconstruction of summer precipitation is important because according to instrumental climate records for this region, precipitation between January and September accounts for 90% of the annual total and includes summer precipitation which accounts for more than 70% [40,65]. Therefore, this study represents the first to reconstruct the entire summer period for this region. The analysis of trends, recurrence of extreme events, and the influence of climatic phenomena on the variability of summer precipitation, provides technical and scientific information that is critical to economic activities such as forest management and agriculture.
Maximum temperatures (>31 °C) in this region occur between March and April, and are associated with low relative humidity that characterizes the most significant fire risk. High temperatures and low humidity increase the water vapor deficit, which induces a reduction in stomatal conductance to avoid water loss. This period of low precipitation reduces photosynthesis [66], likely explaining the negative relationship we found between maximum temperature and tree ring growth. However, a decrease in growth is generally related to a decline in water availability limiting cell expansion [67,68,69]. Therefore, the relationship between temperature and tree ring growth, in this case, is explained by the close relationship between regional temperature and water availability (rainfall) where cooler temperatures are related to higher humidity and vice versa. Overall, maximum temperatures have a negative effect on growth since increasing temperatures also increase vapor pressure deficit leading to decreases in tree-ring growth [70,71].
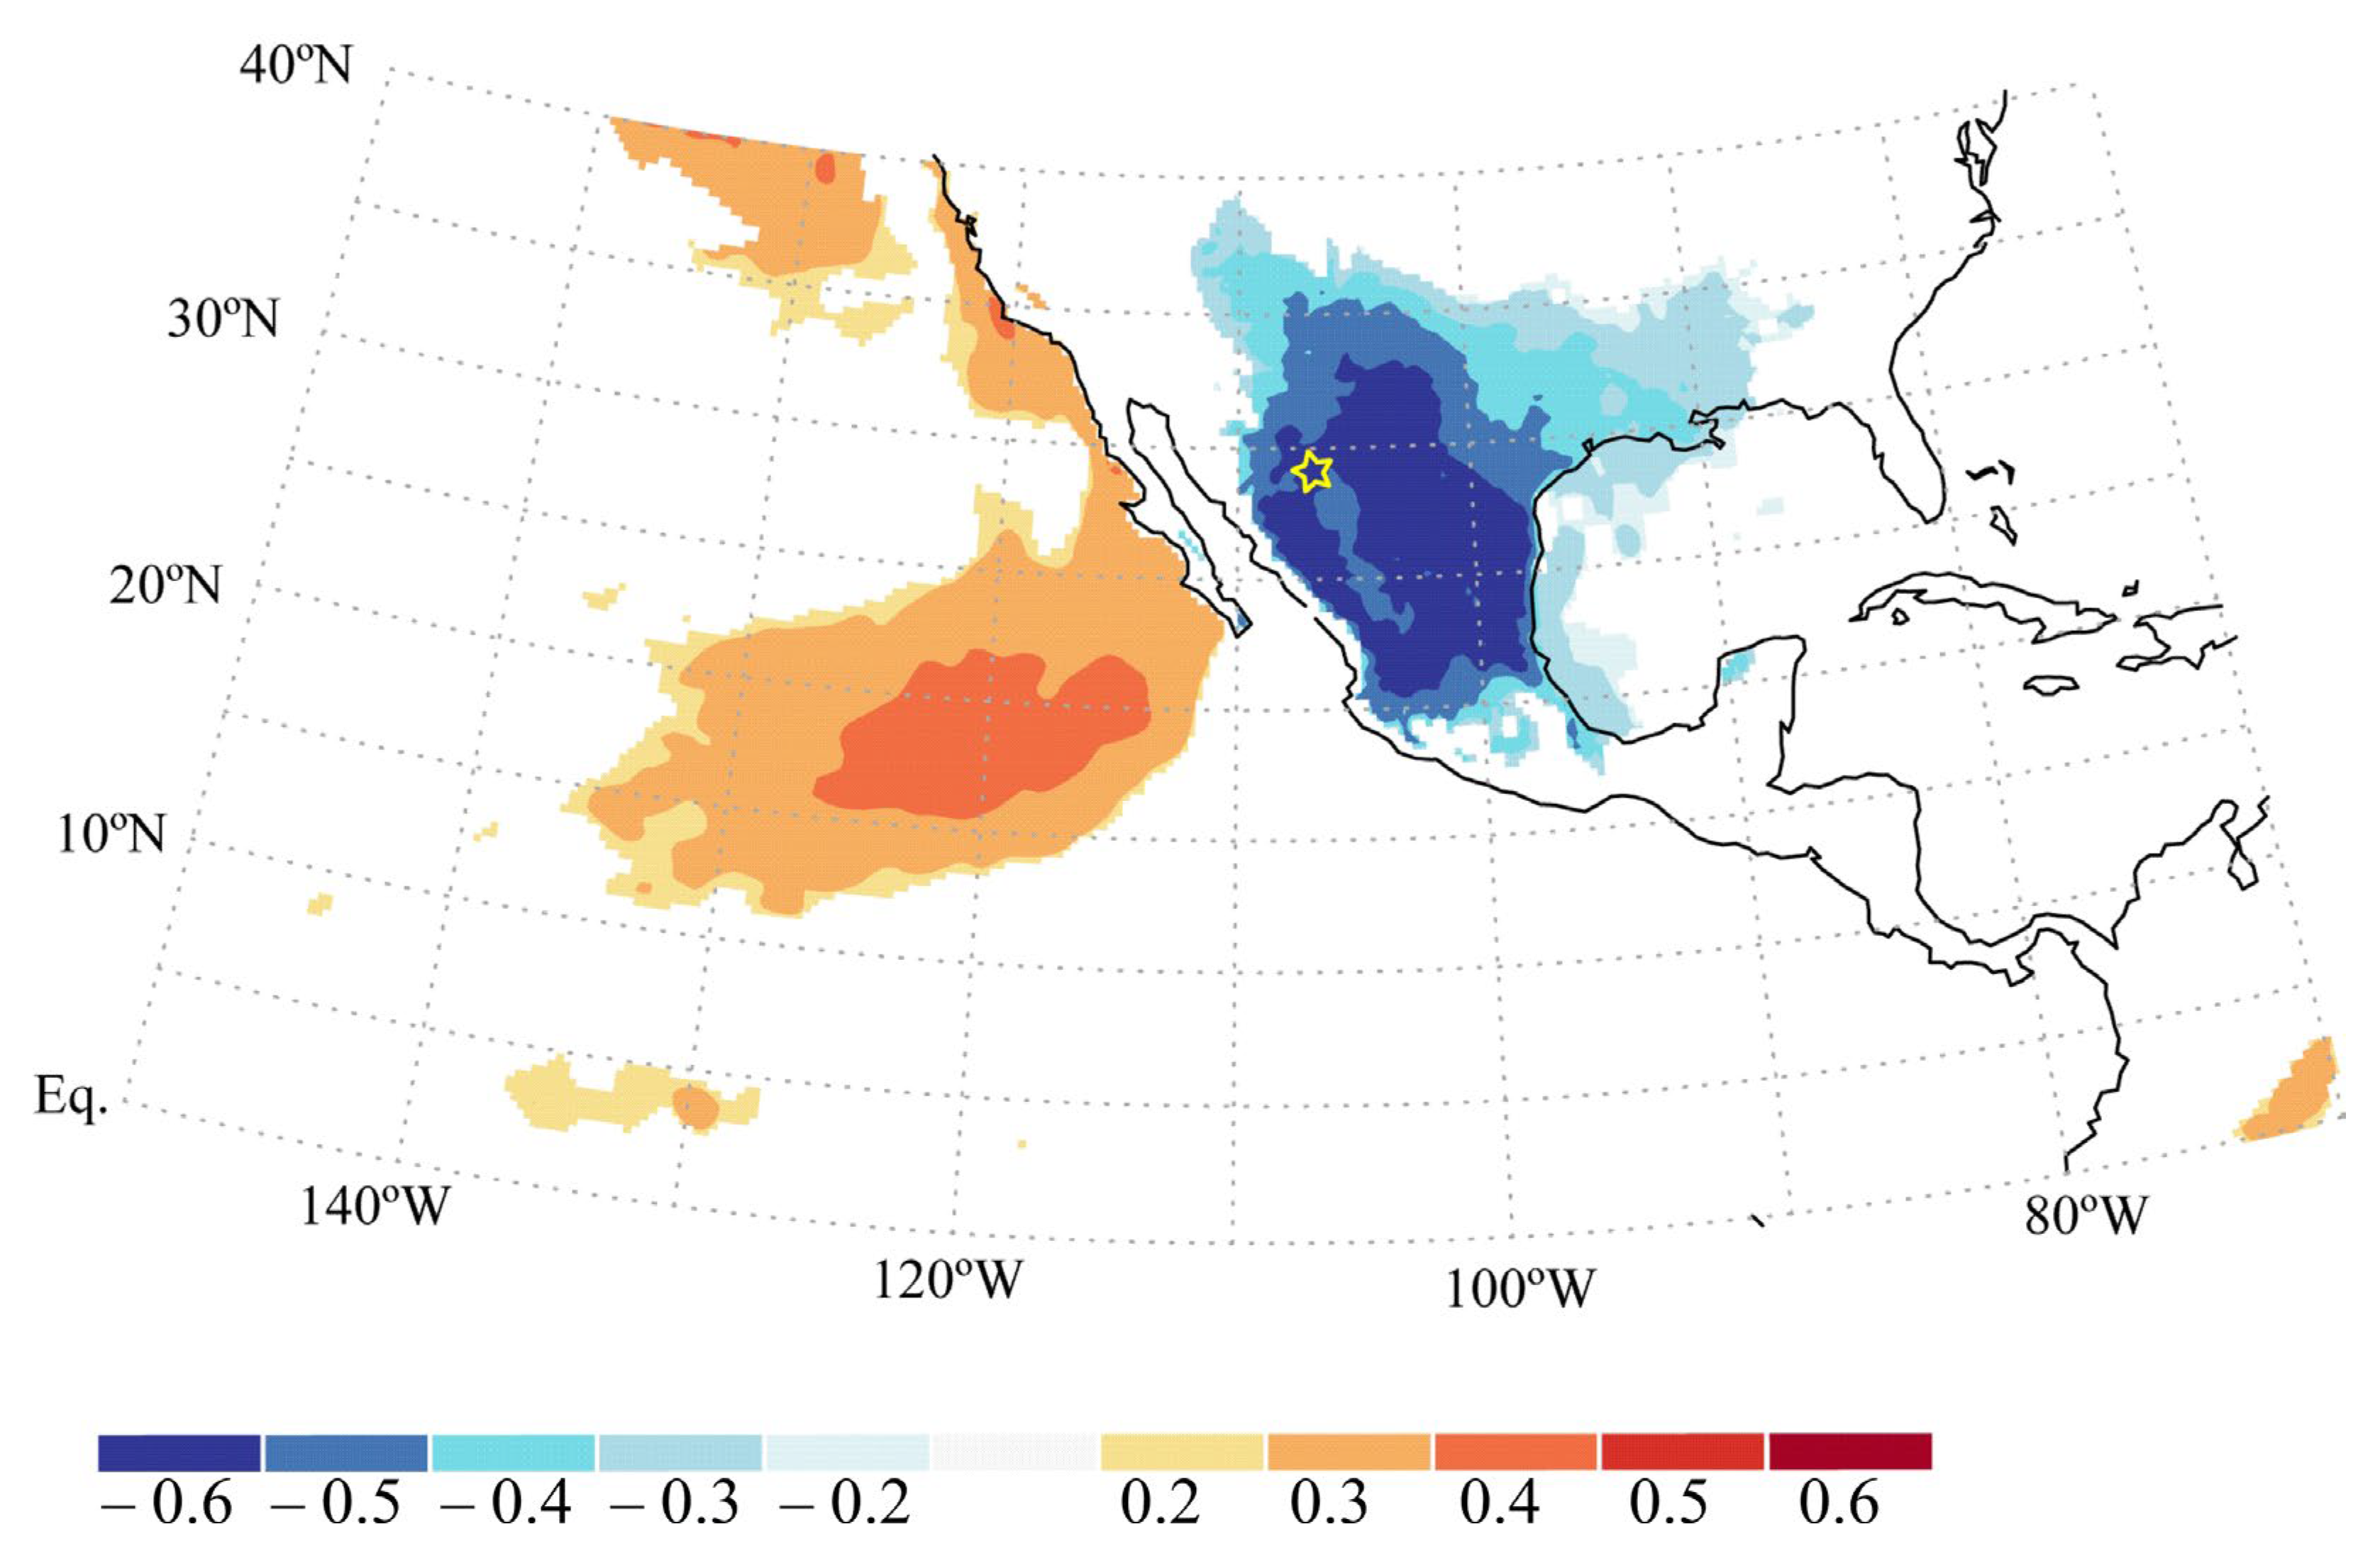
At larger scales, temperature and precipitation are related in different ways. That is, the correlation between the reconstructed precipitations is positively correlated to the eastern Pacific Ocean’s near-surface temperature and negatively correlated to the continental temperature. That is, warm oceans result in increased humidity (humid air currents to the continent), increasing rainfall potential and reducing temperatures inland. Therefore, the precipitation reconstruction is positively correlated to the ocean temperatures and negatively to the regional land temperature. This ocean–land relationship emphasizes the importance of ENSO and NAM atmospheric circulations as the main contributors to precipitation in northern Mexico. Our study suggests that these two sources are integrated into tree ring-width in the region (Figure 11). Low temperatures are related to lower potential evaporation, which favors a positive water balance, as greater soil moisture is available during the growing season [48,72]. This positive growth response at minimum temperature is consistent with previous studies on other conifers [73,74].

4.2. Precipitation Variability

The influences of ENSO vary across continental scales. For example, northern and southern Mexico have opposite climatic responses to El Niño and La Niña phases of the oscillation, a phenomenon known as the dipole [58,75,76]. During the El Niño phase, northern Mexico receives above average precipitation while drought tends to occur in southern Mexico. Precipitation patterns typically switch between these two regions during La Niña events. Therefore, it is no surprise that within the 369 years of precipitation reconstructed in this study in northern Mexico, the six individual years the lowest precipitation (<400 mm) occurred during the La Niña, cold ENSO phase [23,77]. Conversely, the six wettest years (>700 mm) occurred during the warm ENSO phase of El Niño [23,77] (Figure 7, Table 6).
Studies in this region have shown that the growing season for conifer species occurs mostly during the spring and summer [69], suggesting that summer monsoon precipitation is an important factor for tree ring development and growth. Moreover, the relationship between the ENSO and the NAM is complex [78,79,80]. This is because each phenomena influences precipitation patterns within different seasons. That is, ENSO influences winter precipitation, while NAM is active during the summer. However, studies have shown that ENSO can indirectly affect the NAM by influencing the atmospheric and oceanic conditions prior to the monsoon season [15,81,82]. Elsewhere, the ENSO phenomenon strongly influences U.S. precipitation and temperature patterns, especially extreme events. For example, the record El Niño event of 1997−1998 produced extreme rainfall and flooding in California in February 1998.
The links between summer tropical sea surface temperatures and summer climate variability in North America are not as pronounced. However, the extraordinarily wet summer of 1983 in our study area may have been an aftermath of the significant 1982–1983 El Niño. During the summer of 1983, an unusually high number of Pacific hurricanes tracked northward into the Gulf of California, contributing to the rainfall totals. Therefore, ENSO patterns and summer precipitation in our study area may be related, at least in part, to the effects of decadal variability in sea surface temperatures and surface pressure in the North Pacific [58,83].
Our reconstructed precipitation patterns (Table 6) indicate a cycle of approximately 50 years, between intense droughts and negative Niño 3 SST indices (Figure 8C). The most severe regional droughts vary in intensity; however, these episodes also tend to be recorded more broadly at the national level (Figure 9 and Figure 10), which might be attributed to global climatic phenomena that modulate climate at larger scales [58,76,84]. Our findings suggest a significant relationship between ENSO and the NAM that influences precipitation variability. Our results also suggest that these low-frequency events at 50-year intervals are significantly modulated by the La Niña the cold-phase of ENSO in northern Mexico (Figure 8). This low-frequency variability coincides with similar studies from northern [85] and central Mexico, which have found droughts at the beginning, middle, and end of every century [86]. In the Sierra Madre Occidental (SMO), other studies have documented the relationship between La Niña phase and extreme droughts that have caused water shortages [35,37].
There have been contradictory studies on the relationship between ENSO and total summer precipitation, which might be partly due to variable definitions used to identify the timing of El Niño or La Niña events [82]. On the one hand, Arizona and New Mexico have been shown to receive significantly higher monsoon precipitation in July during El Niño years compared to La Niña years [87]. On the other hand, El Niño is thought to reduce the number of monsoonal storms in Arizona [88]. In another study, La Niña events have been associated with below-average monsoon rainfall in Arizona and New Mexico, but El Niño events have resulted in normal rainfall [15]. Despite this variability in outcomes, ENSO and the NAM are broad climate patterns that strongly influence water availability in northern Mexico [37]. Climate studies indicate that the influence of the NAM in the Sonora region is weak during El Niño summers, but higher during the winter in the warm phases of ENSO, which generates higher runoff [15]. La Niña events cause storm tracks to move northwards, drying out northern Mexico and the Southwestern US [89], and this impacts NAM rainfall production in the summer [79].
Our ability to reconstruct the accumulated influence of January–September precipitation on tree-ring growth suggests that the growing season of these forests is relatively long. This could provide new opportunities to explore the differential water use between January–September and summer along the growing season using intra annual isotope records [90].

5. Conclusions

Our dendrochronological study of P. arizonica, has shown that this species was an excellent source of paleoclimatic records for nearly four centuries which allowed us to reconstruct seasonal cumulative January−September precipitation over the same period. We found that P. arizonica tree rings recorded a common growth pattern in response to climatic variability at regional levels; therefore, the first hypothesis is accepted. These findings are novel because they reconstruct precipitation beyond the commonly reported winter or winter–spring periods, to also include the summer months, which account for 90% of the annual precipitation. Within the reconstruction, we found six major drought events and six mesic events, synchronized with ENSO in its La Niña and El Niño phases, respectively. A higher frequency of major events was identified in recent decades, as well as major droughts approximately every 50 years, modulated by ENSO events. Therefore, the second hypothesis is also accepted, suggesting that historical high- and low-frequency climate variability was modulated this circulatory phenomenon.
Understanding the influence of ENSO on climate patterns in northern Mexico is critical to better predict water availability and planning. Given our current abilities to predict ENSO event months in advance using remotely sensed technologies, our findings could be used to predict how those patterns could influence future regional precipitations, which would be of great use in a region where water is such an important resource. Similarly, our 369-year reconstruction provides a baseline of natural climate variability that can be used to compare with future climate change projections to evaluate both current and future droughts.
Although our study is focused on northern Mexico. Similar climate patterns have been observed at other latitudes such as central Mexico, which is attributed to the modulation of the climate by general circulation climate phenomena. It is important to better understand how climate change is influencing the frequency and intensity of phenomena like ENSO and their effects on natural resources at regional scales. These results highlight the opportunity for future researchers to develop new work or lines of research that generate information on the influence of ENSO at different latitudes and the ENSO-NAM relationship in northern Mexico. They also provide an opportunity to analyze the influence of other climate phenomena such as the PDO and the AMO.

Author Contributions

R.C.-M. and J.C.-P., contributed to conception and design of the study. R.C.-M., J.C.-P. and G.E.-A., collected the data. R.C.-M. and J.C.-P., cross-dated the tree ring samples, organized the database and performed the statistical analysis. J.C.-P., R.C.-M. and J.M.I., wrote the first draft of the manuscript with contributions from V.H.C.-S., G.E.-A. and J.V.-D. All authors have read and agreed to the published version of the manuscript.

Funding

The present investigation was carried out thanks to the financing CONAFOR-CONACY through project “Climate variability and interaction with other factors affecting the population dynamics of bark beetles in threatened forests in Mexico” with record CONAFOR, C01-234547.

Data Availability Statement

The raw data (chronologies) presented in this study are available on request from the corresponding author, without undue reservation.

Acknowledgments

The authors thank the landowners Ejido Talayotes, Ejido El Ranchito (El Cuervo) and Ing. Saul Silva (Predio Particular Las Chinas), for allowing us to sample on their properties. We also thank Fernando Dorantes-García, Ivan Molina-Perez, Rafael Cerano-Cervantes, Julián Cerano-Cervantes, Abelardo Guevara and Enrique Rascon for their help during the fieldwork. We would also like to acknowledge the comments from three reviewers whom provided excellent feedback that greatly improved this paper.

Conflicts of Interest

The authors declare no conflicts of interest.

References

  1. Berger, W.H.; Labeyrie, L.D. (Eds.) Abrupt Climatic Change: Evidence and Implications; Springer Science & Business Media: Berlin, Germany, 1987; Volume 216. [Google Scholar]
  2. Karl, T.R.; Knight, R.W.; Plummer, N. Trends in high-frequency climate variability in the twentieth century. Nature 1995, 377, 217–220. [Google Scholar] [CrossRef]
  3. Intergovernmental Panel on Climate Change (IPCC). Cambio climático 2014. Impactos, adaptación y vulnerabilidad. Resumen para responsables de políticas. In Contribución del Grupo de trabajo II al Quinto Informe de Evaluación del Grupo Intergubernamental de Expertos sobre el Cambio Climático; Organización Meteorológica Mundial: Geneva, Switzerland, 2014. [Google Scholar]
  4. McDowell, N.G.; Allen, C.D. Darcy’s law predicts widespread forest mortality under climate warming. Nat. Clim. Change 2015, 5, 669–672. [Google Scholar] [CrossRef]
  5. Hartmann, H.; Moura, C.; Anderegg, W.; Ruehr, N.; Salmon, Y.; Allen, C.D.; Arndt, S.K.; Breshears, D.D.; Davi, H.; Galbraith, D.; et al. Research frontiers for improving our understanding of drought-induced tree and forest mortality. New Phytol. 2018, 218, 15–28. [Google Scholar] [CrossRef]
  6. Wu, X.; Liu, H.; Li, X.; Ciais, P.; Babst, F.; Guo, W.; Zhang, C.; Magliulo, V.; Pavelka, M.; Liu, S.; et al. Differentiating drought legacy effects on vegetation growth over the temperate Northern Hemisphere. Glob. Change Biol. 2017, 24, 504–516. [Google Scholar] [CrossRef] [PubMed]
  7. Peltier, D.M.P.; Ogle, K. Legacies of La Ninña: North American monsoon can rescue trees from winter drought. Glob. Change Biol. 2019, 25, 121–133. [Google Scholar] [CrossRef] [PubMed]
  8. Cook, E.R.; Meko, D.M.; Stahle, D.W.; Cleaveland, M.K. Drought reconstructions for the continental United States. J. Clim. 1999, 12, 1145–1162. [Google Scholar] [CrossRef]
  9. Cook, E.R.; Woodhouse, C.A.; Eakin, C.M.; Meko, D.M.; Stahle, D.W. Long-term aridity changes in the western United States. Science 2004, 306, 1015–1018. [Google Scholar] [CrossRef]
  10. Dai, A.; Trenberth, K.E.; Qian, T. A global dataset of Palmer Drought Severity Index for 1870–2002: Relationship with soil moisture and effects of surface warming. J. Hydrometeorol. 2004, 5, 1117–1130. [Google Scholar] [CrossRef]
  11. García, E. Distribución de la precipitación en la República Mexicana. Investig. Geográficas 2003, 50, 67–76. [Google Scholar]
  12. Mosiño, P.A.; García, E. The climate of Mexico. In World Survey of Climatology; Bryson, R.A., Hare, F.K., Eds.; Elsevier Science Ltd.: Oxford, UK, 1974; Volume 2, pp. 345–404. [Google Scholar]
  13. Pyke, C.B. Some Meteorological Aspects of the Seasonal Distribution of Precipitation in the Western United States and Baja California; University of California Water Resources Center Contribution: Los Angeles, CA, USA, 1972; 205p. [Google Scholar]
  14. Szejner, P.; Wright, W.E.; Babst, F.; Belmecheri, S.; Trouet, V.; Leavitt, S.W.; Ehleringer, J.R.; Monson, R.K. Latitudinal gradients in tree ring stable carbon and oxygen isotopes reveal differential climate influences of the North American Monsoon System. J. Geophys. Res. Biogeosci. 2016, 121, 1978–1991. [Google Scholar] [CrossRef]
  15. Higgins, R.W.; Chen, Y.; Douglas, A.V. Interannual variability of the North American warm season precipitation regime. J. Clim. 1999, 12, 653–680. [Google Scholar] [CrossRef]
  16. Walker, B.H.; Steffen, W.L. The Nature of Global Change. In The Terrestrial Biosphere and Global Change; Walker, B.H., Steffen, W.L., Canadell, J., Ingram, J., Eds.; Cambridge University Press: Cambridge, UK, 1999; pp. 1–18. [Google Scholar]
  17. Wolter, K.; Timlin, M.S. El Niño/Southern Oscillation behaviour since 1871 as diagnosed in an extended multivariate ENSO index (MEI. ext). Int. J. Climatol. 2011, 31, 1074–1087. [Google Scholar] [CrossRef]
  18. Magaña, R.V.O.; Quintanar, A. On the use of a general circulation model to study regional climate. In Numerical Simulations in the Environmental and Earth Sciences, Proceedings of the Second UNAM-Cray Supercomputing Conference, Mexico City, 21–24 June; Cambridge University Press: Cambridge, UK, 1995; pp. 39–48. [Google Scholar]
  19. Stahle, D.W.; D’Arrigo, R.D.; Krusic, P.J.; Cleaveland, M.K.; Cook, E.R.; Allan, R.J.; Cole, J.E.; Dunbar, R.B.; Therrell, M.D.; Gay, D.A.; et al. Experimental dendroclimatic reconstruction of the Southern Oscillation. Bull. Am. Meteorol. Soc. 1998, 79, 2137–2152. [Google Scholar] [CrossRef]
  20. Magaña, R.V.O.; Amador, J.A.; Medina, S. The midsummer drought over Mexico and Central America. J. Clim. 1999, 12, 1577–1588. [Google Scholar] [CrossRef]
  21. Instituto Mexicano de Tecnología del Agua (IMTA). Extractor Rápido de Información Climatológica III (ERIC), Software 2009; Jiutepec, México. Available online: https://es.scribd.com/document/358805978/ERIC-III-Extractor-Rapida-de-Informacion-Climatologica (accessed on 4 April 2024).
  22. Trenberth, K.E.; Hoar, T.J. The 1990–1995 El Niño-Southern Oscillation event: Longest on record. Geophys. Res. Lett. 1996, 23, 57–60. [Google Scholar] [CrossRef]
  23. Trenberth, K.E.; Hoar, T.J. El Niño and climate change. Geophys. Res. Lett. 1997, 24, 3057–3060. [Google Scholar] [CrossRef]
  24. Allan, R.J.; D’Arrigo, R.D. ‘Persistent’ ENSO sequences: How unusual was the 1990–1995 El Niño? Holocene 1999, 9, 101–118. [Google Scholar] [CrossRef]
  25. Fedorov, A.V.; Philander, S.G. Is El Niño changing? Science 2000, 288, 1997–2002. [Google Scholar] [CrossRef]
  26. Gergis, J.L.; Fowler, A.M. Classification of synchronous oceanic and atmospheric El Niño-Southern Oscillation (ENSO) events for palaeoclimate reconstruction. Int. J. Climatol. A J. R. Meteorol. Soc. 2005, 25, 1541–1565. [Google Scholar] [CrossRef]
  27. Mendelssohn, R.; Bograd, S.J.; Schwing, F.B.; Palacios, D.M. Teaching old indices new tricks: A state-space analysis of El Niño related climate indices. Geophys. Res. Lett. 2005, 32, 1–4. [Google Scholar] [CrossRef]
  28. Solow, A.R. An ENSO shift revisited. Geophys. Res. Lett. 2006, 33, 1–3. [Google Scholar] [CrossRef]
  29. Jones, P.D.; Mann, M.E. Climate over past millennia. Rev. Geophys. 2004, 42, 1–42. [Google Scholar] [CrossRef]
  30. He, M.; Yang, B.; Shishov, V.; Rossi, S.; Bräuning, A.; Ljungqvist, F.C.; Grießinger, J. Projections for the changes in growing season length of tree-ring formation on the Tibetan Plateau based on CMIP5 model simulations. Int. J. Biometeorol. 2018, 62, 631–641. [Google Scholar] [CrossRef] [PubMed]
  31. Cook, E.R.; Seager, R.; Heim, R.R., Jr.; Vose, R.S.; Herweijer, C.; Woodhouse, C. Megadroughts in North America: Placing IPCC projections of hydroclimatic change in a long-term palaeoclimate context. J. Quat. Sci. 2020, 25, 48–61. [Google Scholar] [CrossRef]
  32. Esper, J.; Frank, D.C.; Timonen, M.; Zorita, E.; Wilson, R.J.; Luterbacher, J.; Holzkämper, S.; Fischer, N.; Wagner, S.; Nievergelt, D.; et al. Orbital forcing of tree-ring data. Nat. Clim. Change 2012, 2, 862–866. [Google Scholar] [CrossRef]
  33. Büntgen, U.; Myglan, V.S.; Ljungqvist, F.C.; McCormick, M.; Di Cosmo, N.; Sigl, M.; Jungclaus, J.; Wagner, S.; Krusic, P.J.; Esper, J.; et al. Cooling and societal change during the Late Antique Little Ice Age from 536 to around 660 AD. Nat. Geosci. 2016, 9, 231–236. [Google Scholar] [CrossRef]
  34. Cerano-Paredes, J.; Villanueva-Díaz, J.; Fulé, P.Z.; Arreola-Ávila, J.G.; Sánchez-Cohen, I.; Valdez-Cepeda, R.D. Reconstrucción de 350 años de precipitación para el suroeste de Chihuahua, México. Madera Y Bosques 2009, 15, 27–44. [Google Scholar] [CrossRef]
  35. Díaz, S.C.; Therrell, M.D.; Stahle, D.W.; Cleaveland, M.K. Chihuahua (Mexico) winter-spring precipitation reconstructed from tree-rings, 1647–1992. Clim. Res. 2002, 22, 237–244. [Google Scholar] [CrossRef]
  36. Díaz, R.B.; Villanueva-Díaz, J.; Cerano-Paredes, J. Reconstrucción de la precipitación estacional con anillos de crecimiento para la región hidrológica Presidio-San Pedro. Madera Y Bosques 2016, 22, 111–123. [Google Scholar]
  37. Martínez-Sifuentes, A.R.; Villanueva-Díaz, J.; Carlón-Allende, T.; Estrada-Ávalos, J. 243 years of reconstructed streamflow volume and identification of extreme hydroclimatic events in the Conchos River Basin, Chihuahua, Mexico. Trees 2020, 34, 1347–1361. [Google Scholar] [CrossRef]
  38. Liverman, D.M. Vulnerability and adaptation to drought in Mexico. Nat. Resour. J. 1999, 39, 99. [Google Scholar]
  39. Eakin, H. Smallholder maize production and climatic risk: A case study from Mexico. Clim. Change 2000, 45, 19–36. [Google Scholar] [CrossRef]
  40. Douglas, M.; Maddox, R.; Howard, K.; Reyes, S. The Mexican Monsoon. J. Clim. 1993, 6, 1665–1667. [Google Scholar] [CrossRef]
  41. Secretaría de Medio Ambiente y Recursos Naturales (SEMARNAT); Comisión Nacional de Áreas Naturales Protegidas (CONANP). Programa de Manejo Área de Protección de Flora y Fauna Papigochic, 1st ed.; Comisión Nacional de Áreas Naturales Protegidas (CONANP): Chihuahua, México, 2017; 166p. [Google Scholar]
  42. Instituto Nacional de Estadística, Geografía e Informática (INEGI). Anuario Estadístico y Geográfico de Chihuahua; Gobierno del Estado de Chihuahua: Chihuahua, México, 2015. [Google Scholar]
  43. Speer, J.H. Fundamentals of Tree-Ring Research; University of Arizona Press: Tucson, AZ, USA, 2010. [Google Scholar]
  44. Stokes, M.A.; Smiley, T.L. An Introduction to Tree Ring Dating; University of Chicago Press: Chicago, IL, USA, 1968; 73p. [Google Scholar]
  45. Robinson, W.J.; Evans, R. A microcomputer-based tree-ring measuring system. Tree-Ring Bull. 1980, 40, 59–64. [Google Scholar]
  46. Holmes, R.L. Computer-assisted quality control in tree-ring dating and measurement. Tree-Ring Bull. 1983, 43, 69–78. [Google Scholar]
  47. Cook, E.R.; Holmes, R.H. Program ARSTAN and User’s Manual; Laboratory of Tree-Ring Research, University of Arizona: Tucson, AZ, USA, 1984; 15p. [Google Scholar]
  48. Fritts, H.C. Tree-Rings and Climate; Blackburn Press: Caldwell, NJ, USA, 2001. [Google Scholar]
  49. Stat Soft Inc. Statistica for Windows (Computer Program Manual); StatSoft, Inc.: Tulsa, OK, USA, 2011. [Google Scholar]
  50. Fritts, H.C. Tree rings, a record of seasonal variations in past climate. Naturwissenschaften 1978, 65, 48–56. [Google Scholar] [CrossRef]
  51. Wigley, T.M.; Briffa, K.R.; Jones, P.D. On the average value of correlated time series, with applications in dendroclimatology and hydrometeorology. J. Clim. Appl. Meteorol. 1984, 23, 201–213. [Google Scholar] [CrossRef]
  52. Terán, C.A.R. Escenarios de lluvia en México. Ph.D. Thesis, CIEMAD-IPN, Mexico City, Mexico, 2010. [Google Scholar]
  53. Hersbach, H.; Bell, B.; Berrisford, P.; Hirahara, S.; Horányi, A.; Muñoz-Sabater, J.; Nicolas, J.; Peubey, C.; Radu, R.; Schepers, D.; et al. The ERA5 global reanalysis. Q. J. R. Meteorol. Soc. 2020, 146, 1999–2049. [Google Scholar] [CrossRef]
  54. Fritts, H.C. Reconstructing Large-Scale Climatic Patterns from Tree-Ring Data; University of Arizona Press: Tucson, AZ, USA, 1991; 286p. [Google Scholar]
  55. Cook, E.R.; Peters, K. The smoothing spline: A new approach to standardizing forest interior tree-ring width series for dendroclimatic studies. Tree-Ring Bull. 1981, 41, 45–53. [Google Scholar]
  56. Cook, E.R. Niño 3 index reconstruction. International Tree-Ring Data Bank. In IGBP PAGES/World Data Center-A for Paleoclimatology Data Contribution Series Number 2000-052; NOAA/NGDC Paleoclimatology Program: Boulder, CO, USA, 2000. [Google Scholar]
  57. Software Matemático, MATLAB Versión 6.5; MathWorks: Natick, MA, USA, 2002.
  58. Stahle, D.W.; Cook, E.R.; Burnette, D.J.; Villanueva, D.J.; Cerano, P.J.; Burns, J.N.; Griffin, D.; Cook, B.I.; Acuña, S.R.; Torbenson, M.C.A.; et al. The Mexican Drought Atlas: Tree-Ring Reconstructions of the Soil Moisture Balance During the Late Pre-Hispanic, Colonial, and Modern Eras. Quat. Sci. Rev. 2016, 149, 34–60. [Google Scholar] [CrossRef]
  59. Stahle, D.W.; Cleaveland, M.K. Southern oscillation extremes reconstructed from tree-rings of the Sierra Madre Occidental and Southern Great Plains. J. Clim. 1993, 6, 129–140. [Google Scholar] [CrossRef]
  60. Stahle, D.W.; Cleaveland, M.K.; Therrell, M.D.; Villanueva, D.J. Tree-ring reconstruction of winter and summer precipitation in Durango, Mexico, for the past 600 years. In Proceedings of the 10th Conference of Global Change Studies, American Meteorological Society 79th Annual Meeting, Dallas, TX, USA, 10–15 January 1999; pp. 205–211. [Google Scholar]
  61. Chávez-Gandara, M.P.; Cerano-Paredes, J.; Nájera-Luna, J.A.; Pereda-Breceda, V.; Esquivel-Arriaga, G.; Cervantes-Martínez, R.; Corral-Rivas, S. Reconstrucción de la precipitación invierno-primavera con base en anillos de crecimiento de árboles para la región de San Dimas, Durango, México. Bosque 2017, 38, 387–399. [Google Scholar] [CrossRef]
  62. González, E.M.; González, E.M.S.; Villanueva, D.J.; Cerano, P.J. Evaluación del potencial dendroclimático de Pinus lumholtzii BL Rob & Fernald. In Revista Mexicana de Ciencias Forestales; Instituto Nacional de Investigaciones Forestales, Agricolas y Pecuarias: Mexico City, Mexico, 2017; Volume 8. [Google Scholar]
  63. Santillán, H.M.; Cornejo, O.E.H.; Villanueva, D.J.; Cerano, P.J.; Valencia, M.S.; Capó, A.M.A. Potencial dendroclimático de Pinus pinceana Gordon en la Sierra Madre Oriental. Madera Y Bosques 2010, 16, 17–30. [Google Scholar] [CrossRef]
  64. Briffa, K.R.; Jones, P.D. Basic chronology statistics and assessment. In Methods of Dendrochronology: Applications in the Environmental Sciences; Cook, E.R., Kairiukstis, L.A., Eds.; Kluwer Academic Publishers: Dordrecht, The Netherlands, 1990; pp. 137–152. [Google Scholar]
  65. Griffin, D.; Woodhouse, C.A.; Meko, D.M.; Stahle, D.W.; Faulstich, H.L.; Carrillo, C.; Touchan, R.; Castro, C.L.; Leavitt, S.W. North American monsoon precipitation reconstructed from tree-ring latewood. Geophys. Res. Lett. 2013, 40, 954–958. [Google Scholar] [CrossRef]
  66. Leverenz, J.W. Photosynthesis and transpiration in large forest-grown Douglas fir: Diurnal variation. Can. J. Bot. 1981, 59, 349–356. [Google Scholar] [CrossRef]
  67. Cuny, H.E.; Rathgeber, C.B.K.; Frank, D.; Fonti, P.; Mäkinen, H.; Prislan, P.; Rossi, S.; Martinez del Castillo, E.; Campelo, F.; Vavrčík, H.; et al. Woody biomass production lags stem-girth increase by over one month in coniferous forests. Nat. Plants 2015, 1, 1–6. [Google Scholar] [CrossRef]
  68. Ziaco, E.; Truettner, C.; Biondi, F.; Bullock, S. Moisture-driven xylogenesis in Pinus ponderosa from a Mojave Desert mountain reveals high phenological plasticity. Plant Cell Environ. 2018, 41, 823–836. [Google Scholar] [CrossRef]
  69. Pacheco, A.; Camarero, J.J.; Pompa-García, M.; Battipaglia, G.; Voltas, J.; Carrer, M. Growth, wood anatomy and stable isotopes show species-specific couplings in three Mexican conifers inhabiting drought-prone areas. Sci. Total Environ. 2020, 698, 134055. [Google Scholar] [CrossRef]
  70. Marlés, M.J.; Valor, I.T.; Claramunt, L.B.; Pérez, S.D.R.; Maneja, Z.R.; Sánchez, M.S.; Boada, J.M. Análisis dendroclimático de Pinus pseudostrobus y Pinus devoniana en los municipios de Áporo y Zitácuaro (Michoacán), Reserva de la Biósfera de la Mariposa Monarca. Investig. Geográficas 2015, 88, 19–32. [Google Scholar] [CrossRef]
  71. Gutiérrez-García, G.; Ricker, M. Influencia del clima en el crecimiento radial en cuatro especies de coníferas en la sierra de San Antonio Peña Nevada (Nuevo León, México). Rev. Mex. De Biodivers. 2019, 90, 1–14. [Google Scholar] [CrossRef]
  72. Litton, C.M.; Raich, J.W.; Ryan, M.G. Carbon allocation in forest ecosystems. Glob. Change Biol. 2007, 13, 2089–2109. [Google Scholar] [CrossRef]
  73. Huang, J.; Tardif, J.C.; Bergeron, Y.; Denneler, B.; Berninger, F.; Girardin, M.P. Radial growth response of four dominant boreal tree species to climate along a latitudinal gradient in the eastern Canadian boreal forest. Glob. Change Biol. 2010, 16, 711–731. [Google Scholar] [CrossRef]
  74. Pompa-García, M.; Cerano-Paredes, J.; Fulé, P.Z. Variation in radial growth Pinus cooperi in response to climatic signals across an elevational gradient. Dendrochronologia 2013, 31, 198–204. [Google Scholar] [CrossRef]
  75. Caso, M.; González-Abraham, C.; Ezcurra, E. Divergent ecological effects of oceanographic anomalies on terrestrial ecosystems of the Mexican Pacific coast. Proc. Natl. Acad. Sci. USA 2007, 104, 10530–10535. [Google Scholar] [CrossRef]
  76. Seager, R.; Tzanova, A.; Nakamura, J. Drought in the southeastern United States: Causes, variability over the last millennium, and the potential for future hydroclimate change. J. Clim. 2009, 22, 5021–5045. [Google Scholar] [CrossRef]
  77. Gergis, J.L.; Fowler, A.M. A history of ENSO events since AD 1525: Implications for future climate change. Clim. Change 2009, 92, 343–387. [Google Scholar] [CrossRef]
  78. Carrillo, C.M.; Castro, C.L.; Garfin, G.; Chang, H.I.; Bukovsky, M.S.; Mearns, L.O. Pacific sea surface temperature related influences on North American monsoon precipitation within North American Regional Climate Change Assessment Program models. Int. J. Climatol. 2018, 38, 4189–4210. [Google Scholar] [CrossRef]
  79. Castro, C.L.; McKee, T.B.; Pielke, R.A. The relationship of the North American monsoon to tropical and North Pacific Sea surface temperatures as revealed by observational analyses. J. Clim. 2001, 14, 4449–4473. [Google Scholar] [CrossRef]
  80. Castro, C.L.; Chang, H.I.; Dominguez, F.; Carrillo, C.; Schemm, J.K.; Henry Juang, H.M. Can a regional climate model improve the ability to forecast the North American monsoon? J. Clim. 2012, 25, 8212–8237. [Google Scholar] [CrossRef]
  81. Leavitt, S.W.; Wright, W.E.; Long, A. Spatial expression of ENSO, drought, and summer monsoon in seasonal δ13C of ponderosa pine tree rings in southern Arizona and New Mexico. J. Geophys. Res. Atmos. 2002, 107, ACL-3. [Google Scholar] [CrossRef]
  82. Sheppard, P.R.; Comrie, A.C.; Packin, G.D.; Angersbach, K.; Hughes, M.K. The climate of the US Southwest. Clim. Res. 2002, 21, 219–238. [Google Scholar] [CrossRef]
  83. Metcalfe, S.E.; Barron, J.A.; Davies, S.J. The Holocene history of the North American Monsoon: ‘known knowns’ and ‘known unknowns’ in understanding its spatial and temporal complexity. Quat. Sci. Rev. 2015, 120, 1–27. [Google Scholar] [CrossRef]
  84. Stahle, D.W.; Cook, E.R.; Villanueva, D.J.; Fye, F.K.; Burnette, D.J.; Griffin, D.; Acuña, S.R.; Seager, R.; Heim, R.R. Early 21st Century Drought in Mexico. EOS 2009, 90, 89–90. [Google Scholar] [CrossRef]
  85. Cerano-Paredes, J.; Villanueva-Díaz, J.; Valdez-Cepeda, R.D.; Méndez-González, J.; Constante-García, V. Sequías reconstruidas en los últimos 600 años para el noreste de México. Rev. Mex. De Cienc. Agrícolas 2011, 2, 235–249. [Google Scholar]
  86. Therrell, D.M.; Stahle, D.W.; Villanueva-Díaz, J.; Cornejo-Oviedo, E.; Cleaveland, M.K. Tree-ring reconstructed maize yield in central Mexico: 1474–2001. Climtic Change 2006, 74, 493–504. [Google Scholar] [CrossRef]
  87. Harrington, J.A., Jr.; Cerveny, R.S.; Balling, R.C., Jr. Impact of the Southern Oscillation on the North American southwest monsoon. Phys. Geogr. 1992, 13, 318–330. [Google Scholar] [CrossRef]
  88. Webb, R.H.; Betancourt, J.L. Climatic Variability and Flood Frequency of the SANTA Cruz River, Pima County, Arizona (No. 2379); US Geological Survey: Reston, VA, USA, 1992. [Google Scholar] [CrossRef]
  89. Seager, R.; Ting, M.; Davis, M.; Cane, M.; Naik, N.; Nakamura, J.; Li, C.; Cook, E.; Stahle, D. Mexican drought: An observational modeling and tree ring study of variability and climate change. Atmosfera 2009, 22, 1–31. [Google Scholar]
  90. Kerhoulas, L.P.; Kolb, T.E.; Koch, G.W. The influence of monsoon climate on latewood growth of southwestern ponderosa pine. Forests 2017, 8, 140. [Google Scholar] [CrossRef]
Figure 1. Location of the study site in the municipality of Bocoyna, Chihuahua and the geographical distribution of the tree ring chronologies and climatic stations used in the study.
Forests 16 01639 g001
Figure 2. Panoramic view of Pinus arizonica forest (A), old trees selected (B), and samples taken from P. arizonica using Pressler increment borer of a 12 mm diameter (C).
Forests 16 01639 g002
Figure 3. Total tree-ring width residual chronologies generated based on growths for P. arizonica, at (A) Talayotes (TAL), (B) Predio Particular Las Chinas (PPC), (C) El Cuervo (CUE), (D) merged regional chronology based on the three site chronologies from Chihuahua, Mexico and (E) expressed population signal (EPS) curve. The red line shows the variability of the EPS, and the blue dashed line indicates the EPS value = 0.85. The period 1700–2015 of the regional chronology indicates an EPS > 0.85.
Forests 16 01639 g003
Figure 4. Principal components analysis (PCA) grouped all three site chronologies in PC1, indicative of a common variability.
Forests 16 01639 g004
Figure 5. Correlation between P. arizonica tree-ring width index and both monthly as well as cumulative values between January and the corresponding month for average regional precipitation (A,B), minimum temperature (C,D) and maximum temperature (E,F). The period of analysis was between 1981 and 2015, based on records from weather stations in Creel, Huicorachi, Arroyo de Agua and La Tinaja in Chihuahua, Mexico.
Forests 16 01639 g005
Figure 7. Reconstructed winter–spring precipitation (January–September) from 1647 to 2015. The thin gray line indicates the annual variability, while thick black represents decadal smoothing spline fitted to the annual data emphasizes low frequency variance in the reconstruction. The black horizontal line represents the mean (550 mm) and the gray background area indicates the sample size in each segment of the series. The dotted horizontal lines above and below the mean in blue and red color indicate one and two standard deviations, respectively. The wettest years (>700 mm) and driest years (<400 mm) are marked in red.
Forests 16 01639 g007
Figure 8. Continuous annual wavelet power spectrum for January–September reconstructed precipitation (A), Niño 3 SST index (B,C) represents the Wavelet Coherence domain between the reconstructed precipitation series and the Niño 3 SST index. The red spots delineated in black represent periods with significant frequencies (p < 0.05), and the arrows pointing to the right indicate that both phenomena are in phase (positive correlation).
Forests 16 01639 g008
Figure 9. Maps of the climatic condition (PDSI, JJA) for the four years with the highest precipitation records (>700 mm) in the reconstructed period (1647–2015) in southwestern Chihuahua. In each of the four years analyzed, there was synchrony with the warm phase of ENSO (El Niño). The maps were generated based on the MXDA [58].
Forests 16 01639 g009
Figure 10. Drought maps (PDSI, JJA) for the six years with the lowest precipitation records (<400 mm) in the reconstructed period (1647–2015) in southwestern Chihuahua. In each of these six years analyzed, there was a synchrony with the cold phase of ENSO (La Niña). The maps were generated based on the MXDA [58].
Forests 16 01639 g010
Figure 11. Spatial correlation values between the January-September near-surface temperature ERA5 1979–2015 and the precipitation reconstruction, positively correlated to the eastern Pacific Ocean’s near-surface temperature and negatively correlated to the continental temperature. The yellow star represents the study area.
Forests 16 01639 g011
Table 1. Geographic and sampling characteristics of the three sample sites within the study area in southwest Chihuahua, Mexico.
Site NameSite CodeLong WLat NElevation (m)No. of TreesNo. of Samples CollectedNo. of Samples Crossdated/%
Predio Particular las ChinasPPC−107.600428.0384253652129107/83
El CuervoCUE−107.775627.9492245858133118/89
TalayotesTAL−107.548627.9902264845135134/99
RegionalREG---------155397359/90
Table 2. Geographic characteristics of the four climate stations in southwest Chihuahua, Mexico used in the analysis.
Climate StationLong WLat NElevation (m)Total PeriodNo. of Years
Creel, Bocoyna−107.63427.75523451981–201535
Huicorachi, Bocoyna (E46182) a−107.49127.66622811981–201535
Arroyo de Agua, Maguarichic (E47137) a−107.96627.93821981981–201535
La Tinaja, Temósachic (E50658) a−107.87128.93720651981–201535
a Grids of precipitation points.
Table 3. Temporal length and correlation statistics between the three sites and regional chronology based on P. arizonica tree ring-width series from Chihuahua, Mexico.
SiteSpan (Years)Avg r aMS bEPS c
PPC1750–2014 (265)0.66 (p < 0.01)0.401803
CUE1647–2015 (369)0.46 (p < 0.01)0.291700
TAL1802–2015 (214)0.71 (p < 0.01)0.451843
Regional1647–2015 (369)0.58 (p < 0.01)0.381700
a Average correlation between all series and the master chronology determined using 50-year blocks; all correlations are significant. b Mean sensitivity is the average percentage of change in chronology indices between years [45]. c First year each chronology exhibited a 0.85 expressed population signal statistic [51].
Table 6. Reconstructed periods with minimum and maximum records of precipitation in the last 369 years for the southwestern Chihuahua region.
Duration (Years)Dry PeriodsWet Periods
21707–1708
32011–2013
41934–19371735–1738, 1812–1815, 1958–1961, 1990–1993
51801–1805, 1839–1843, 1907–19111830–1834, 1924–1928, 1940–1944
6 1700–1705, 1779–1784
71691–1697, 1890–1896, 1951–1957, 1994–2000
81673–1680, 1819–1826
91759–1767, 1859–1867
Driest years (Precipitation < 400 mm)Wettest years (Precipitation > 700 mm)
1691 (343.9)1650 (712.1)
1727 (350.7)1729 (729.8)
1785 (389.4)1815 (712.3)
1951 (356.3)1968 (727.4)
1974 (374.2)1981 (721.5)
2011 (365.7)2015 (786.7)
Disclaimer/Publisher’s Note: The statements, opinions and data contained in all publications are solely those of the individual author(s) and contributor(s) and not of MDPI and/or the editor(s). MDPI and/or the editor(s) disclaim responsibility for any injury to people or property resulting from any ideas, methods, instructions or products referred to in the content.