Article

Block or Connect? Optimizing Ecological Corridors to Enhance the Dual Functions of Resistance and Provision in Forest-Mountain Ecological Security Barriers

School of Landscape Architecture, Beijing Forestry University, Beijing 100083, China
*
Author to whom correspondence should be addressed.
Forests 2025, 16(11), 1625; https://doi.org/10.3390/f16111625 (registering DOI)
Submission received: 22 September 2025 / Revised: 15 October 2025 / Accepted: 22 October 2025 / Published: 24 October 2025
(This article belongs to the Section Forest Ecology and Management)

Abstract

Ecological security barriers safeguard regional ecological security by blocking external risks and supplying internal services. However, existing research has primarily focused on optimizing the connectivity and protection of internal ecological patches within barriers. At a broader scale, there remains insufficient attention on coordinating the “blocking of external ecological risk corridors” and “connecting corridors that supply ecosystem services to internal urban areas”. To address this, this study develops a framework for constructing ecological corridors that integrates both reverse (resistance) and forward (provision) perspectives. Taking the Yanshan–Taihang Mountain Ecological Barrier as a case study, circuit theory is applied to identify risk corridors traversing the barrier area. Service supply corridors directed toward internal urban areas are also established, and key nodes along these corridors are identified. Furthermore, the XGBoost-SHAP method is employed to quantitatively analyze the influencing factors and mechanisms of these key nodes. Finally, strategies are proposed to block risk corridors and connect supply corridors. The main results are as follows: (1) A total of 29 risk corridors, 158 risk pinch points, and 210 risk barriers were identified, along with 250 supply corridors, 158 supply pinch points, and 118 supply barriers, revealing the distinct distribution patterns of both risk transmission and service supply corridors. (2) The dominant factors influencing different types of corridors exhibited significant differences: risk corridors were primarily regulated by natural factors such as mean annual evapotranspiration (EVA) and soil volumetric water content (VWC), whereas supply corridors were mainly influenced by human activities, including the human footprint index (HFP) and land surface temperature (TEM). (3) Even within the same type of corridor, the dominant factors and their operating mechanisms—such as threshold effects and nonlinear interactions—showed considerable heterogeneity across nodes of different characteristics. Based on these findings, differentiated policy recommendations were proposed. This study aims to synergistically enhance the bidirectional functionality of forest-mountain ecological barriers by disrupting external risk corridors and reconstructing internal supply networks. The framework and methodology presented here can provide theoretical and empirical references for the planning and management of other similar barrier regions.

1. Introduction

Resource scarcity, global warming, air pollution, and accelerating desertification pose significant threats to ecological security, placing socio-economic development in an environmentally constrained predicament [1,2,3]. Against this backdrop, safeguarding national and regional ecological security has become a critical strategic issue vital to public well-being and sustainable development of the country [4]. To address this challenge, the Chinese government proposed and implemented the national strategy of establishing ecological barrier zones in 2016 [5], identifying ecological security as one of the key priorities for maintaining national security. This initiative aims to ensure national ecological security by protecting and developing regions with crucial ecological functions. As a core component of the national ecological security strategy, the spatial layout of ecological barrier areas heavily relies on continuous and intact forest-mountain systems. Leveraging complex terrain and vegetation structures, these areas perform critical ecosystem services such as resisting and buffering ecological risks [6], maintaining biodiversity, and enhancing water conservation and carbon sequestration [4,7]. Therefore, optimizing the spatial configuration of ecological barriers centered on forest-mountain regions and balancing their dual functions of “external defense” and “internal supply” has become a crucial scientific issue urgently needing resolution to achieve national ecological security.
Building regional ecological networks provides a crucial pathway for forest mountainous areas to fulfill dual functions of resilience and provisioning within ecological barriers [4]. By implementing measures such as blocking ecological risk pathways and connecting supply and demand areas within ecosystems [8], it offers concrete implementation plans for effectively resisting external ecological risks and safeguarding ecosystem services. Therefore, the construction of ecological security barriers should not be limited to their own ecological protection and restoration but should also enhance their dual functions of resisting external ecological risks and providing internal ecosystem services. However, current research in this area still faces the following limitations: (1) In terms of scope, existing studies focus on internal connectivity among ecological patches within barriers, while neglecting the functional requirement of linking with external environments to resist external disturbances and provide ecosystem services [9,10]. Studies conducted at broader spatial scales remain insufficient [4]. Although recent practices, such as China’s Three-North Shelterbelt Forest Program [11] and Barcelona’s Green Corridors Plan [12], have demonstrated the importance of large-scale ecological networks, their integration into theoretical frameworks for dual-function optimization is still limited. (2) In terms of research approaches, the construction of ecological networks largely follows the traditional paradigm of “sources–resistance surface–corridors” [13], emphasizing the protection of connectivity among key ecological patches [14]. There is less emphasis on integrating forward-thinking (service provision) and backward-thinking (risk containment) approaches to ensure the transmission of fundamental ecological services while effectively blocking risk transmission pathways [15]. (3) In terms of research depth, most studies remain confined to delineating source areas, constructing corridors, and identifying nodes [16,17,18], with few investigations delving into the mechanisms by which factors that block or facilitate corridor transmission exert their effects. Factors are sometimes treated as isolated units acting independently [19]. Although some studies acknowledge interactive effects between factors [5,20], they tend to focus on numerical representations rather than elucidating the underlying mechanisms. Yet, extensive research has shown that these influencing factors often exhibit complex nonlinear relationships and interactions. Uncovering and interpreting these mechanisms is essential for issuing early warnings and formulating targeted strategies. These limitations hinder the precise interception of risk corridors and the facilitation of supply corridors, thereby constraining the synergistic enhancement of the resistance and supply functions of ecological barriers.
Ecological pinch points refer to areas within ecological corridors characterized by lower landscape resistance and highly concentrated current flow, indicating a higher probability of material and energy flow through the corridor with no alternative pathways available [21,22]. In contrast, ecological barriers represent key areas that significantly impede the efficiency of ecological flow transmission [23]. The degradation or loss of pinch points and the expansion of barriers may severely disrupt connectivity between ecological source areas, whereas their conservation and restoration can substantially enhance corridor transmission efficiency [24]. Therefore, identifying the influencing factors and underlying mechanisms of these critical nodes is essential for achieving the dual objectives of risk resistance and service supply. Explainable machine learning models provide a powerful methodological tool for addressing these questions. XGBoost (eXtreme Gradient Boosting version 2.0.3), with its strong capability for feature selection and nonlinear fitting, can effectively reveal the contribution of key environmental variables to the formation of pinch points and barriers, as well as their nonlinear responses and threshold effects [25]. The SHAP (SHapley Additive exPlanations) method, grounded in cooperative game theory, decomposes feature contributions and quantitatively explains how multiple environmental variables interact in nonlinear ways to influence the spatial distribution of pinch points and barriers [26]. It is particularly effective in identifying critical thresholds and effective ranges of key influencing factors.
Therefore, this study proposes an innovative research framework entitled “Corridor Construction–Node Identification–Mechanism Analysis–Strategy Implementation”. This framework transcends the limitations of conventional research by expanding the study area to incorporate both external risk zones and internally protected urban agglomerations into a comprehensive analytical scope. Adopting a dual perspective of “supply enhancement” and “risk blocking”, it targets key nodes (i.e., ecological pinch points and barriers) within different types of corridors as focal points for intervention strategies. Using an interpretable machine learning approach (XGBoost-SHAP), the model ranks the feature importance of key factors influencing these nodes and elucidates their underlying mechanisms. At the strategy level, for risk corridors, effective defense is achieved by intercepting ecological pinch points and strengthening barriers; for supply corridors, service transmission is optimized through enhancing pinch points and mitigating barriers.
The Beijing–Tianjin–Hebei urban cluster is one of China’s three world-class urban agglomerations [27]. As the most economically developed and densely populated urban cluster in Northern China, its ecological security directly affects the living environment of 110 million people and the region’s sustainable development [28]. The Yanshan–Taihang mountain forest area serves as a critical ecological barrier for the Beijing–Tianjin–Hebei area, providing essential ecological functions such as windbreak and sand fixation, Water Conservation (WC), Carbon Sequestration (CS), Air Purification (AP), and Urban Cooling (UC) [29,30]. This region plays a pivotal role in safeguarding the ecological security of the urban cluster (Figure 1). However, global warming and rapid urbanization have posed severe challenges to the ecological integrity of this barrier. On the one hand, frequent spring sandstorms in the Beijing–Tianjin–Hebei region, driven by sand transport from the arid northwest [31], highlight the importance of the barrier zone’s windbreak and sand fixation functions. On the other hand, the region is increasingly affected by the spillover effects of rapid urban development in the metropolitan area. Human activities such as deforestation and mineral extraction have intensified, resulting in ongoing ecological degradation and heightened vulnerability [32]. Consequently, the original ecological barrier functions have been significantly weakened, posing serious constraints on regional ecological security and sustainable development [33]. Systematic ecological restoration in this region holds significant demonstration value for achieving the dual functional objectives of ecological barriers: resilience and support. In this context, the present study uses the Yanshan–Taihang Mountain ecological barrier as a case study, with the following objectives: (1) from a resistance-based perspective, intercepting wind and sediment transport corridors to enhance the windbreak and sand fixation functions of the ecological security barrier, and (2) from a supply-based perspective, improving connectivity between areas with high ecosystem service supply within the barrier zone and urban demand areas in the plains, thereby strengthening the support and provisioning capacity of the ecological security barrier.

2. Materials

2.1. Study Area

The Yanshan–Taihang Mountains Ecological Barrier Zone in the Beijing–Tianjin–Hebei region serves as a critical ecological security barrier in Northern China [34]. Primarily situated in Western and Northeastern Hebei Province, it encompasses a total area of 109,500 square kilometers. This region features rich forest, wetland, and mountain ecosystems, providing a strong ecological foundation and supporting diverse biological resources [35]. It fulfills essential ecological functions, including windbreak and sand fixation, soil and water conservation, water retention, and climate regulation [36] (Figure 2).

2.2. Data Sources

All raster data were collected in 2020 and uniformly resampled to a 1 km resolution. Additionally, the meteorological data (wind direction and wind speed) for the monitoring stations during the period 2011–2020 were sourced from hourly observation records provided by the China National Environmental Monitoring Centre (https://quotsoft.net/air/ accessed on 3 August 2025). Detailed information is provided in Supplementary Materials S1.

3. Research Framework and Methods

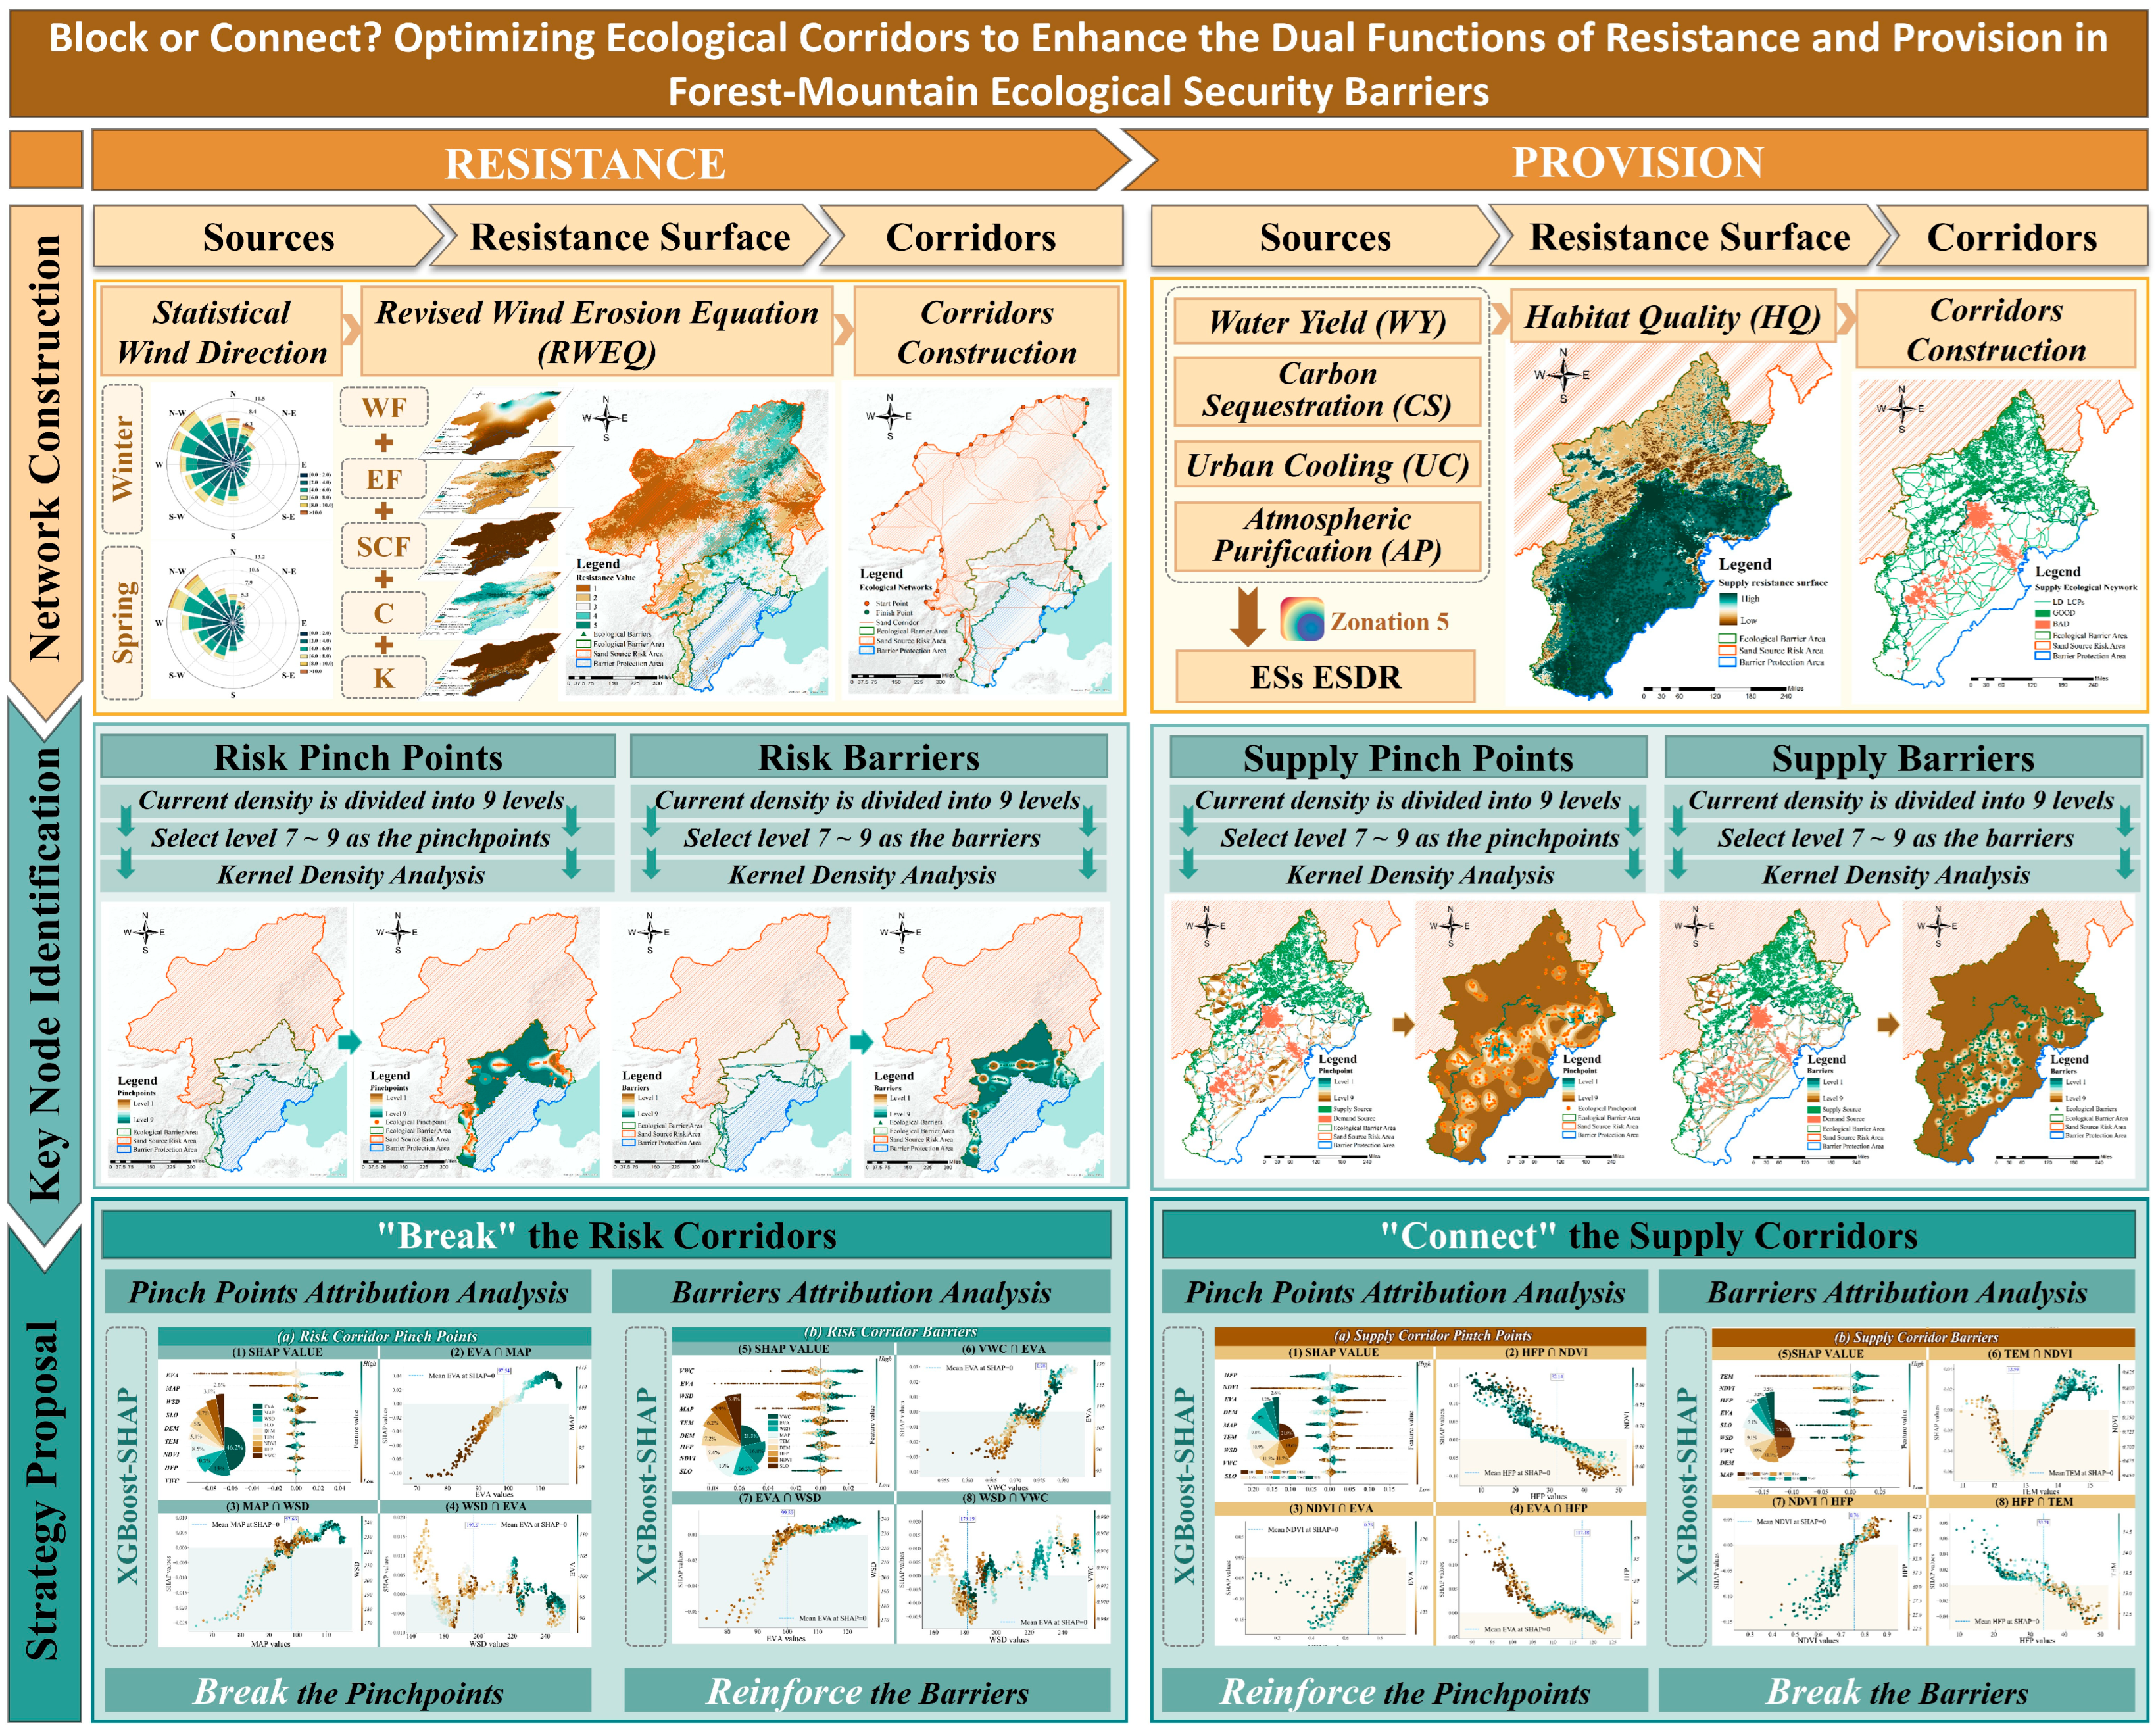
In this study, “resistance” refers to the capacity of an ecological barrier to block and mitigate external ecological risks, such as wind-blown sand transport, through its structure and processes. The core of this concept lies in interrupting the pathways of risk propagation, specifically by identifying and blocking risk corridors and reinforcing key barriers. In the context of the Yanshan–Taihang Mountains ecological barrier zone, the most critical aspect is the prevention and control of sandstorm risks, with the primary objective being wind prevention and sand fixation [37]. Accordingly, this study will adopt a research framework of “identifying sandstorm sources–constructing wind resistance surfaces–identifying potential sandstorm corridors–blocking critical nodes” to precisely interrupt risk corridors and thereby achieve the resistance function of the forest ecological security barrier.
Correspondingly, “provision” in this study refers to the capacity of the ecological barrier to supply key ecosystem services to internal urban agglomerations. Its essence lies in ensuring the flow and connectivity of these services, achieved by consolidating pinch points and clearing barriers to maintain the connectivity of supply corridors. The primary services provided by the Yanshan–Taihang Mountains region mainly include water conservation (WC), carbon sequestration (CS), air purification (AP), and Urban Cooling (UC) [38]. Therefore, this study follows the research framework of “identifying supply and demand sources–constructing resistance surfaces–connecting supply and demand corridors–clearing critical nodes” to facilitate the supply corridors and ensure the realization of the provision of services from the ecological barrier zone to the protected areas (Figure 3).

3.1. Resistance: Breaking Up Risk Corridors

To achieve the “Resilience” function, this study first determined the dominant wind directions from January to March (the frequent sandstorm season) based on meteorological data. The soil wind erosion intensity was then calculated using the Revised Wind Erosion Equation to construct a resistance surface. Based on circuit theory, potential sand transport corridors were identified, and pinch points and barriers were classified according to current density levels. Subsequently, the XGBoost-SHAP method was employed to quantitatively analyze the driving factors and their mechanisms influencing these critical nodes. This provides a scientific basis for formulating targeted measures to “break ecological pinch points and consolidate barriers”.

3.1.1. Wind Source Identification

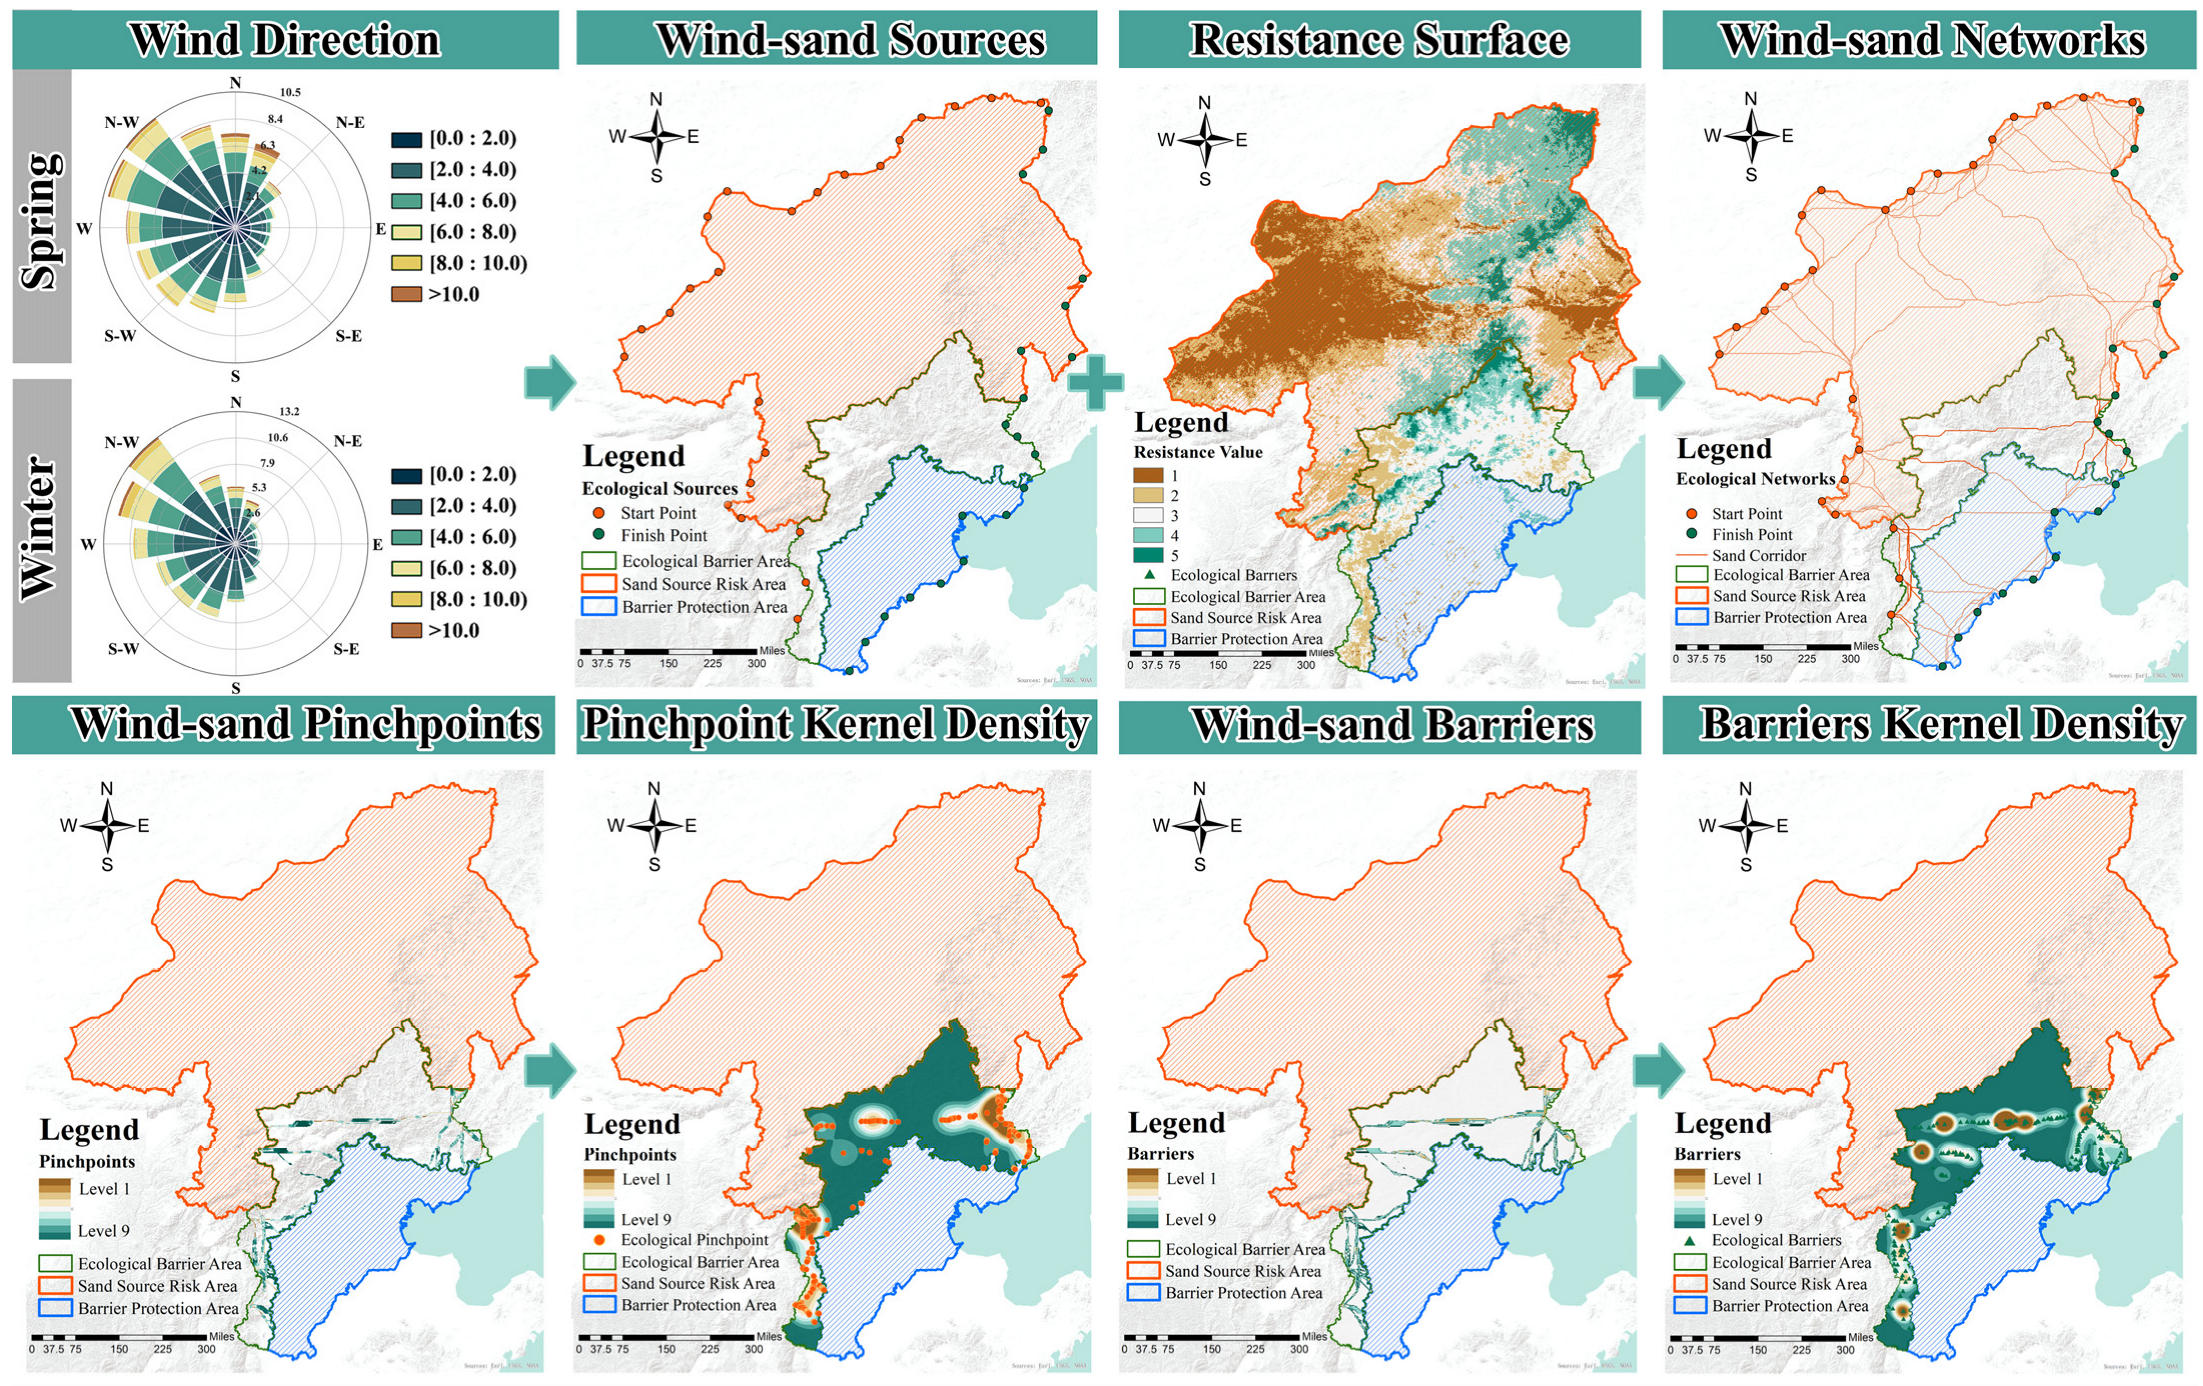
The identification of risk corridors is closely related to a region’s wind direction and wind speed. Since dust storms in the Beijing–Tianjin–Hebei region predominantly occur during spring [39], this study collected hourly wind direction and frequency data from meteorological stations spanning 2011 to 2020. This period represents recent data and can accurately reflect current climate characteristics; a decade-long cycle is sufficient to eliminate interannual fluctuations and ensure the robustness of the statistical results; moreover, data from this period are easily obtainable from authoritative institutions and possess excellent completeness and quality [40]. Data from January to March of each year were subsequently extracted to statistically analyze wind direction frequencies during spring in the study area.

3.1.2. Wind Resistance Surface Construction

Wind resistance surface represents the inhibitory effect of surface ecosystems on sand-dust movement. Based on the Revised Wind Erosion Equation (RWEQ) model, this study assessed soil wind erosion intensity to construct a sand-dust movement resistance surface. This surface quantitatively characterizes the ease of sediment transport through wind corridors. Higher wind erosion intensity corresponds to lower resistance. The calculation methods for each primary factor of the RWEQ model are presented in Table 1 [41]. For detailed calculations of the variables in Table 1, refer to Supplementary Materials Table S2.

3.1.3. Blocking Risk Corridors

To elucidate the formation mechanisms of these key nodes, this study employs an interpretable machine learning framework based on XGBoost and SHAP [42]. Initially, the Pinchpoint Mapper tool was employed to extract ecological pinch points, while the Barrier Mapper tool was used to identify barriers. Both tools operated based on cumulative current recovery values, which were classified into nine levels in descending order. The top three levels were extracted as key nodes. Subsequently, kernel density analysis was performed on these key nodes, and the results were also categorized into nine levels. The study area was divided into 5 km × 5 km grid cells, from which those with kernel density levels 6 to 9 were selected as target research units. Based on previous studies [43], sampling was conducted within the target units. Data were collected for nine major environmental resistance factors: Digital Elevation Model (DEM), Slope (SLO), Normalized Difference Vegetation Index (NDVI), Mean Annual Precipitation (MAP), Evapotranspiration (EVA), Volumetric Water Content (VWC), Land Surface Temperature (TEM), Human Footprint Index (HFP), and Wind Speed (WSD). The sample dataset was split into training and test sets at a ratio of 7:3. To enhance the model’s performance, robustness, and generalization, we employed the Optuna framework with 5-fold cross-validation on the training set for hyperparameter optimization (detailed model parameters are provided in Supplementary Materials S3). Subsequently, SHAP (Shapley Additive Explanations) analysis was applied to quantify and interpret the contributions of factors influencing corridor transmission. This analysis elucidates their operating mechanisms, such as threshold effects and interactions, thereby providing scientific support for practical conservation measures.

3.2. Supply: Support for Protected Areas

To achieve the “provision” function, this study first comprehensively assessed the supply and demand of four key ecosystem services to identify integrated supply sources and demand areas. Habitat quality was utilized as the resistance surface for the supply services to model supply corridors. Subsequently, the XGBoost-SHAP method was applied to analyze the formation mechanisms of supply pinch points and barriers. This analysis provides a scientific basis for formulating targeted measures to “consolidate ecological pinch points and eliminate barriers”.

3.2.1. Ecosystem Services Calculation Methods

(1) Water Conservation
Supply: This study utilized the Annual Water Yield module of the InVEST model to calculate the water yield. The specific calculation method is as follows: [44]:
S W C = 1 A E T x P X × P x
where S W C represents the regional annual average WC; P x denotes the precipitation (mm) at grid cell x; and A E T x indicates the annual actual EVA (mm) at grid cell x, calculated using Equation (2):
A E T x P X = 1 + ω x R x 1 + ω x R x + 1 R x
where R x represents the aridity index for each grid cell x within the region, a dimensionless quantity defined as the ratio of potential EVA to precipitation, calculated using Equation (3). ω x denotes the ratio of the modified annual available water for vegetation to precipitation, also a dimensionless value.
R x = k × E T 0 P x , k = min 1 , L A I 3
where k is the vegetation coefficient, calculated from the leaf area index (LAI) of vegetation. The formula for calculating potential evapotranspiration ET (mm/d) is the following [44]:
E T 0 = 0.0013 × 0.408 × R A × T a v g + 17 × T D 0.0123 P 0.76
where R A denotes solar top-of-atmosphere radiation (MJ·m−2·d−1); T a v g represents the average of the daily maximum and minimum temperatures (°C); and TD denotes the difference between the daily maximum and minimum temperatures (°C).
Demand: This study assigned the statistical water consumption data to raster cells using population density data [45]:
D W Y = D w a t e r × ρ p o p
where D W Y represents the annual water demand (m3/ha); D w a t e r denotes per capita water consumption (m3/person); and ρ p o p indicates population density (persons/km2).
(2) Carbon Sequestration Services
Supply: This study employs the CASA model to calculate the net primary productivity (NPP) of vegetation in the study area. The calculation is based on the photosynthesis equation, which indicates that for every unit of dry matter stored by vegetation, 1.63 units of CO2 can be fixed. The calculation formula is provided in the following [46]:
S C S = 1.63 × N P P
In the equation, S C S denotes the CS service supply (kg) per grid cell, and NPP represents the NPP (kg) of vegetation per grid cell.
Demand: In this study, the demand for carbon sequestration services was calculated by multiplying per capita carbon emissions by population density [47]:
D C S = D c a r b o n × ρ p o p × C t r a n s f e r
where D C S represents the demand for CS services (t/hm2); D c a r b o n denotes per capita carbon emissions (t/person); ρ p o p indicates population density (people/km2); and C t r a n s f e r signifies the carbon emission conversion rate for energy consumption, set to 0.67 based on relevant research findings.
(3) Air Purification
Supply: PM2.5 is the primary pollutant contributing to air pollution in the Beijing–Tianjin–Hebei region. Therefore, this study employs the PM2.5 purification capacity of different land use types as an indicator to quantify the supply of air purification services [48]:
S A P = A i f × e f
where S A P denotes the AP service supply (kg), and A i f represents the PM2.5 purification index (kg·hm−2) for land use type f within grid i. The e values for different land use types are as follows: water bodies, 0.01; wooded areas, 0.1; grasslands in wooded–grassland mixed areas, 0.08; cropland, 0.09; bare land, 0.09; buildings, 0.02; and roads/squares, 0 kg·hm−2.
Demand: The demand for AP services is quantified using a disaster risk assessment framework consisting of three indicators: disaster hazard, exposure, and social vulnerability. Following Tan Chuandong’s research, these indicators are measured using the annual average PM2.5 concentration in the Beijing–Tianjin–Hebei region, population density, and the proportion of elderly and child populations, respectively. The formula for calculating AP service demand is provided in the following [49]:
D A P = H i × A i × h × E i × V i
where D A P represents the demand for AP services (kg); H i denotes the PM2.5 concentration in grid i (kg·m−3); Ai is the area of grid i; h is the PM2.5 distribution height, set at 10 m; E i indicates the population density within grid i (persons·m−3); and V i represents the proportion of elderly and children within grid i (%).
(4) Urban Cooling
Supply: UC demand is quantified using the Urban Heat Island model within the InVEST framework to derive the thermal mitigation index. The calculation formula is provided in the following [50]:
S U C = j d · r a d i u s · f r o m · i g i · C C j · e d i , j / d c o o l
If a grid cell represents green space, then g i is assigned a value of 1; otherwise, g i is 0. d ( i , j ) denotes the distance between pixels, and d c o o l represents the effective cooling effect of the distance of green space.
Demand: The demand for temperature regulation is quantified using the Urban Heat Risk Index, which combines the Surface Temperature Index and the Heat Vulnerability Index. Landsat 8 imagery from July 2020 was processed in ENVI 5.6.2 with atmospheric correction to invert surface temperature. The standardized surface temperature index for summer 2020 was subsequently derived. Vulnerability is represented by population density, with higher density indicating greater vulnerability to heat and reflecting the potential human health risks posed by elevated temperatures [50]:
L r = L S T L S T m i n / L S T m a x L S T m i n
P r = P / P m a x
T r = 0.5 × L r + 0.5 × P r
where T r denotes the urban heat risk index, L r represents the surface temperature index, and P r indicates the heat vulnerability index. P refers to the population density (persons/0.01 km2) in the study area.

3.2.2. Comprehensive Evaluation of Ecosystem Service Supply and Demand

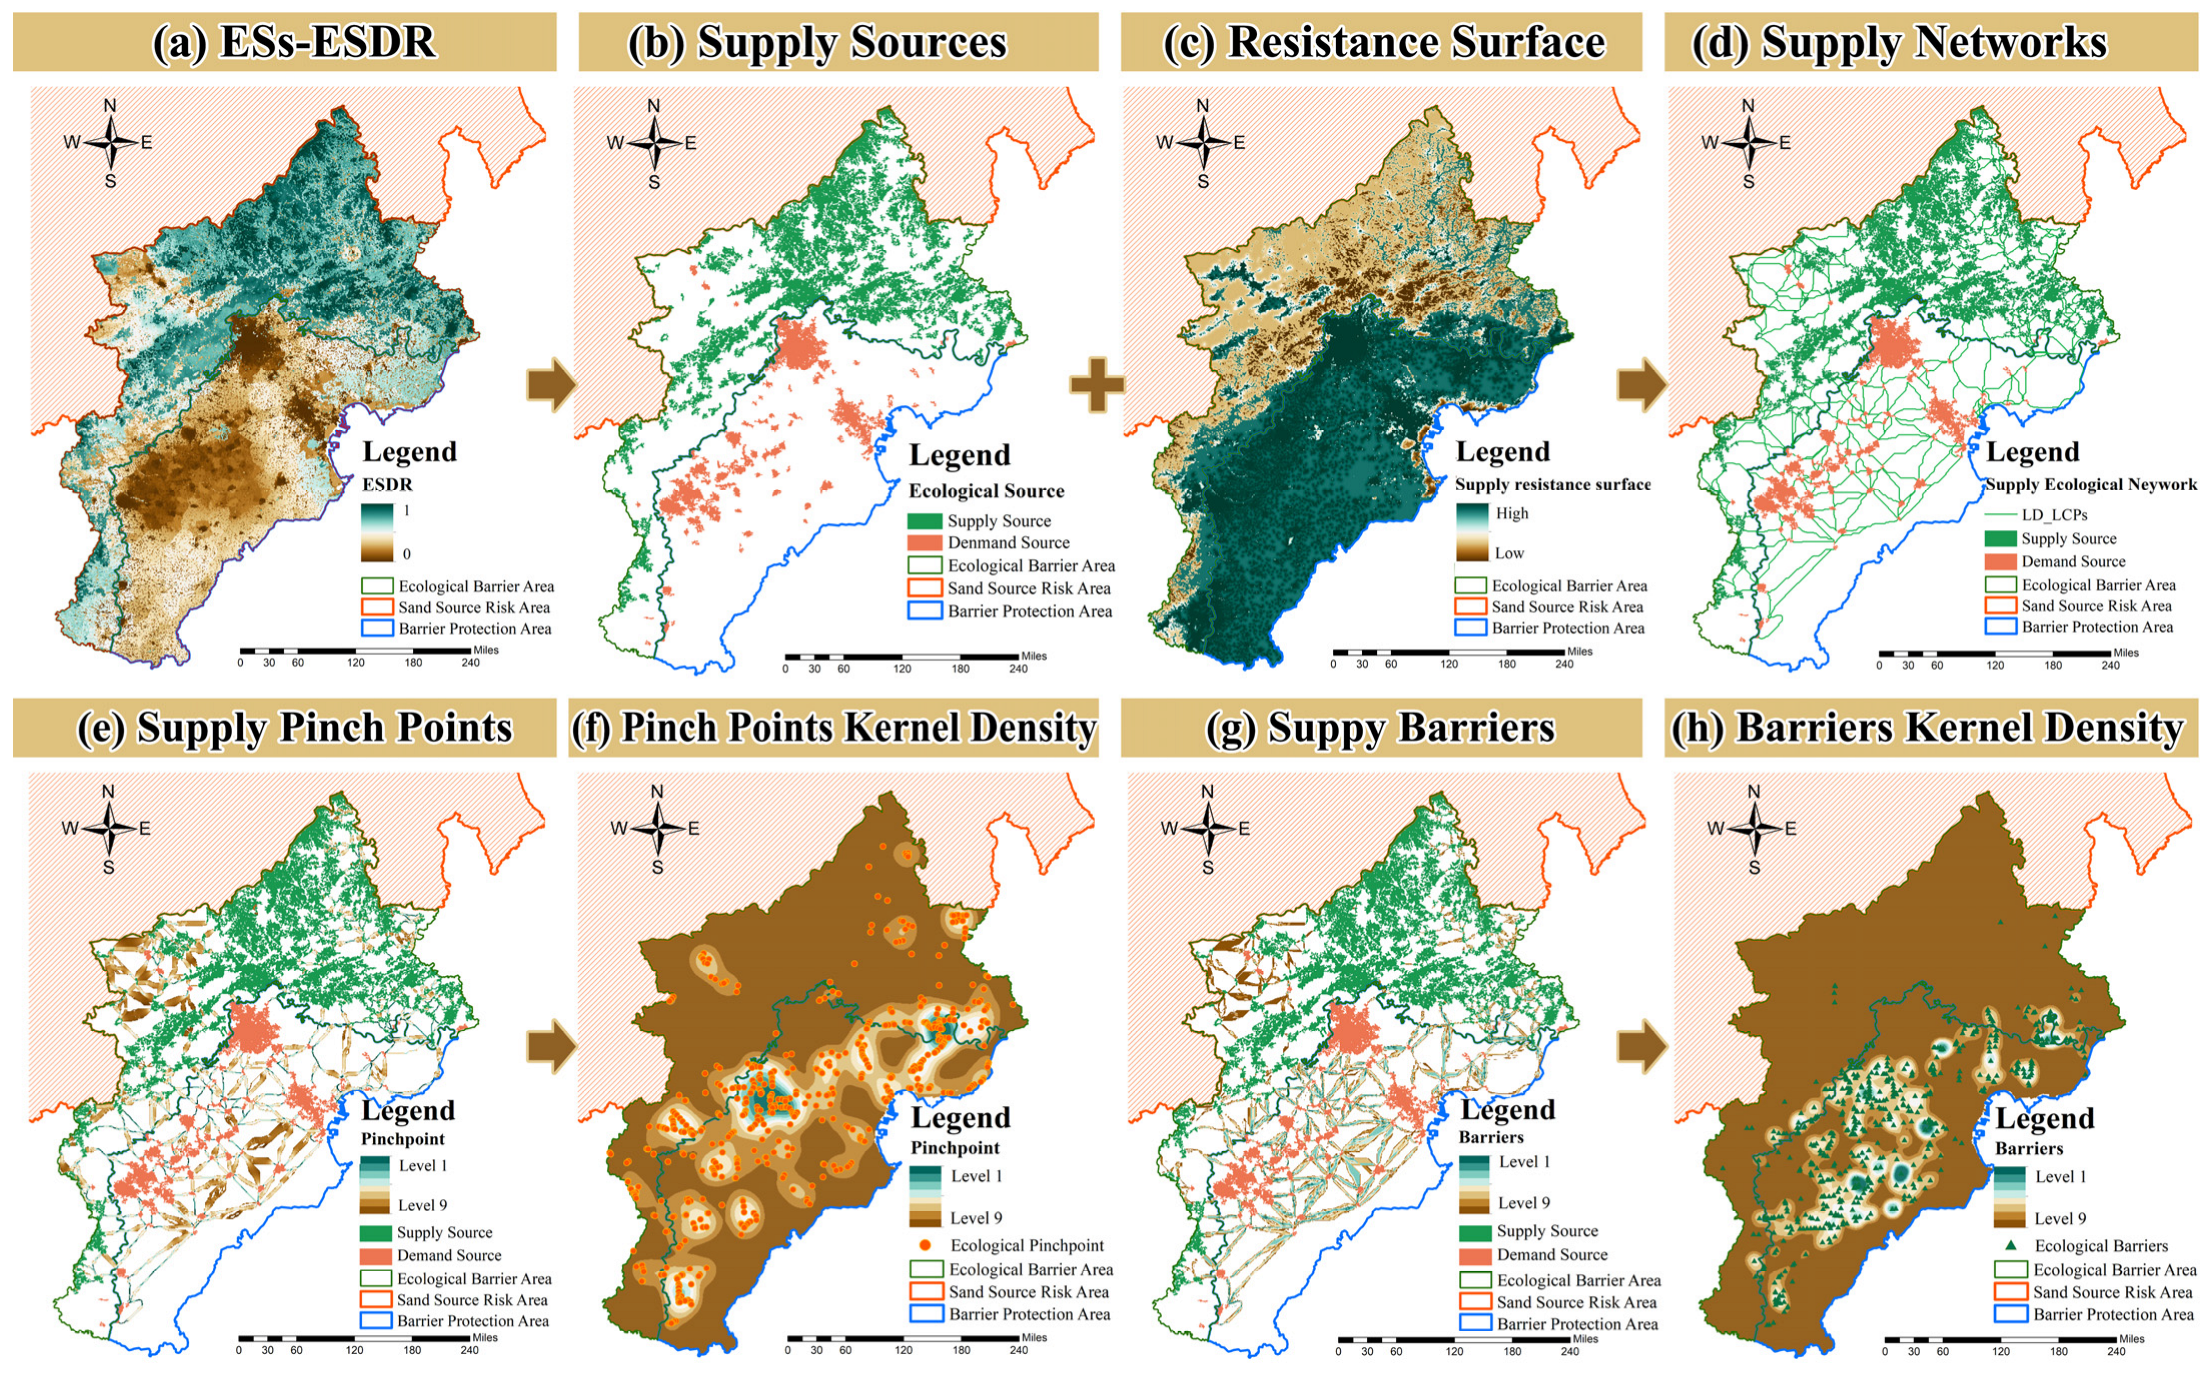
Zonation 5 is an advanced software tool for spatial conservation prioritization and large-scale conservation planning [51], which has developed into a decision-making instrument for regional resource conservation and optimal allocation. Its underlying principle is based on the complementarity–efficiency theory of systematic conservation planning [52]. This approach integrates spatial data of multiple key ecosystem services to identify areas with optimal multifunctional efficiency. It prioritizes regions by synthesizing the supply and demand of ecosystem services, providing an objective basis for selecting integrated source–sink areas [53]. Following previous research [54], the top 20% of areas by conservation priority are designated as comprehensive supply sources, while the bottom 20% are designated as comprehensive demand sources.

3.2.3. Resistance Surface Construction

The habitat quality module of the InVEST model evaluates the suitability of land cover types for specific species, characterizing the probability of survival and reproduction while accounting for stressors from human activities and landscape fragmentation, as well as the influence of stressor sources on species [55]. Accordingly, and drawing on prior research, this study employs the inverse of habitat quality to construct an ecological resistance surface.

3.2.4. Connecting Supply Corridors

This study adopted the same methodology as described in Section 3.1.3 to sample ecological pinch points and barriers within the supply network. The XGBoost-SHAP framework was applied to interpret the contribution levels of various influencing factors and their operational mechanisms (detailed model parameters are provided in the Supplementary Materials S3).

4. Result

4.1. Identification and Mitigation of Risk Corridors

4.1.1. Identification of Risk Corridors

Statistical analysis indicates that northwest winds dominate during both spring and winter in the Beijing–Tianjin–Hebei region. Based on this, the study established 20 wind direction source points within sandstorm source areas for simulation analysis. Wind erosion assessments show that the dust storm prevention zone on the northern side of the barrier area, the Bashang Plateau, has achieved significant control, effectively mitigating dust storm activity. Spatially, windbreak and sand fixation risks follow a pattern of “low in the east and west, high in the center.” The study identified 122 risk corridors, of which 29 cross the barrier zone, totaling 103,058.85 km in length. Within the barrier zone, 61 ecological pinch points cover 1397 km2, while 210 barriers span 144,705 km2 (Figure 4). Ecological pinch points are primarily concentrated around Qinhuangdao City and Shijiazhuang City. Barriers share a similar distribution pattern but additionally cluster in Yongning County within the central section of the Yanshan Mountains. These areas often represent convergence zones of diverse landforms, including mountains, hills, coastal dunes, and plains, which compress risk sources, transport pathways, and deposition spaces, resulting in the dense occurrence of both obstacles and pinch points (Figure 4).

4.1.2. Analysis of the Mechanism of Key Nodes in Risk Corridors

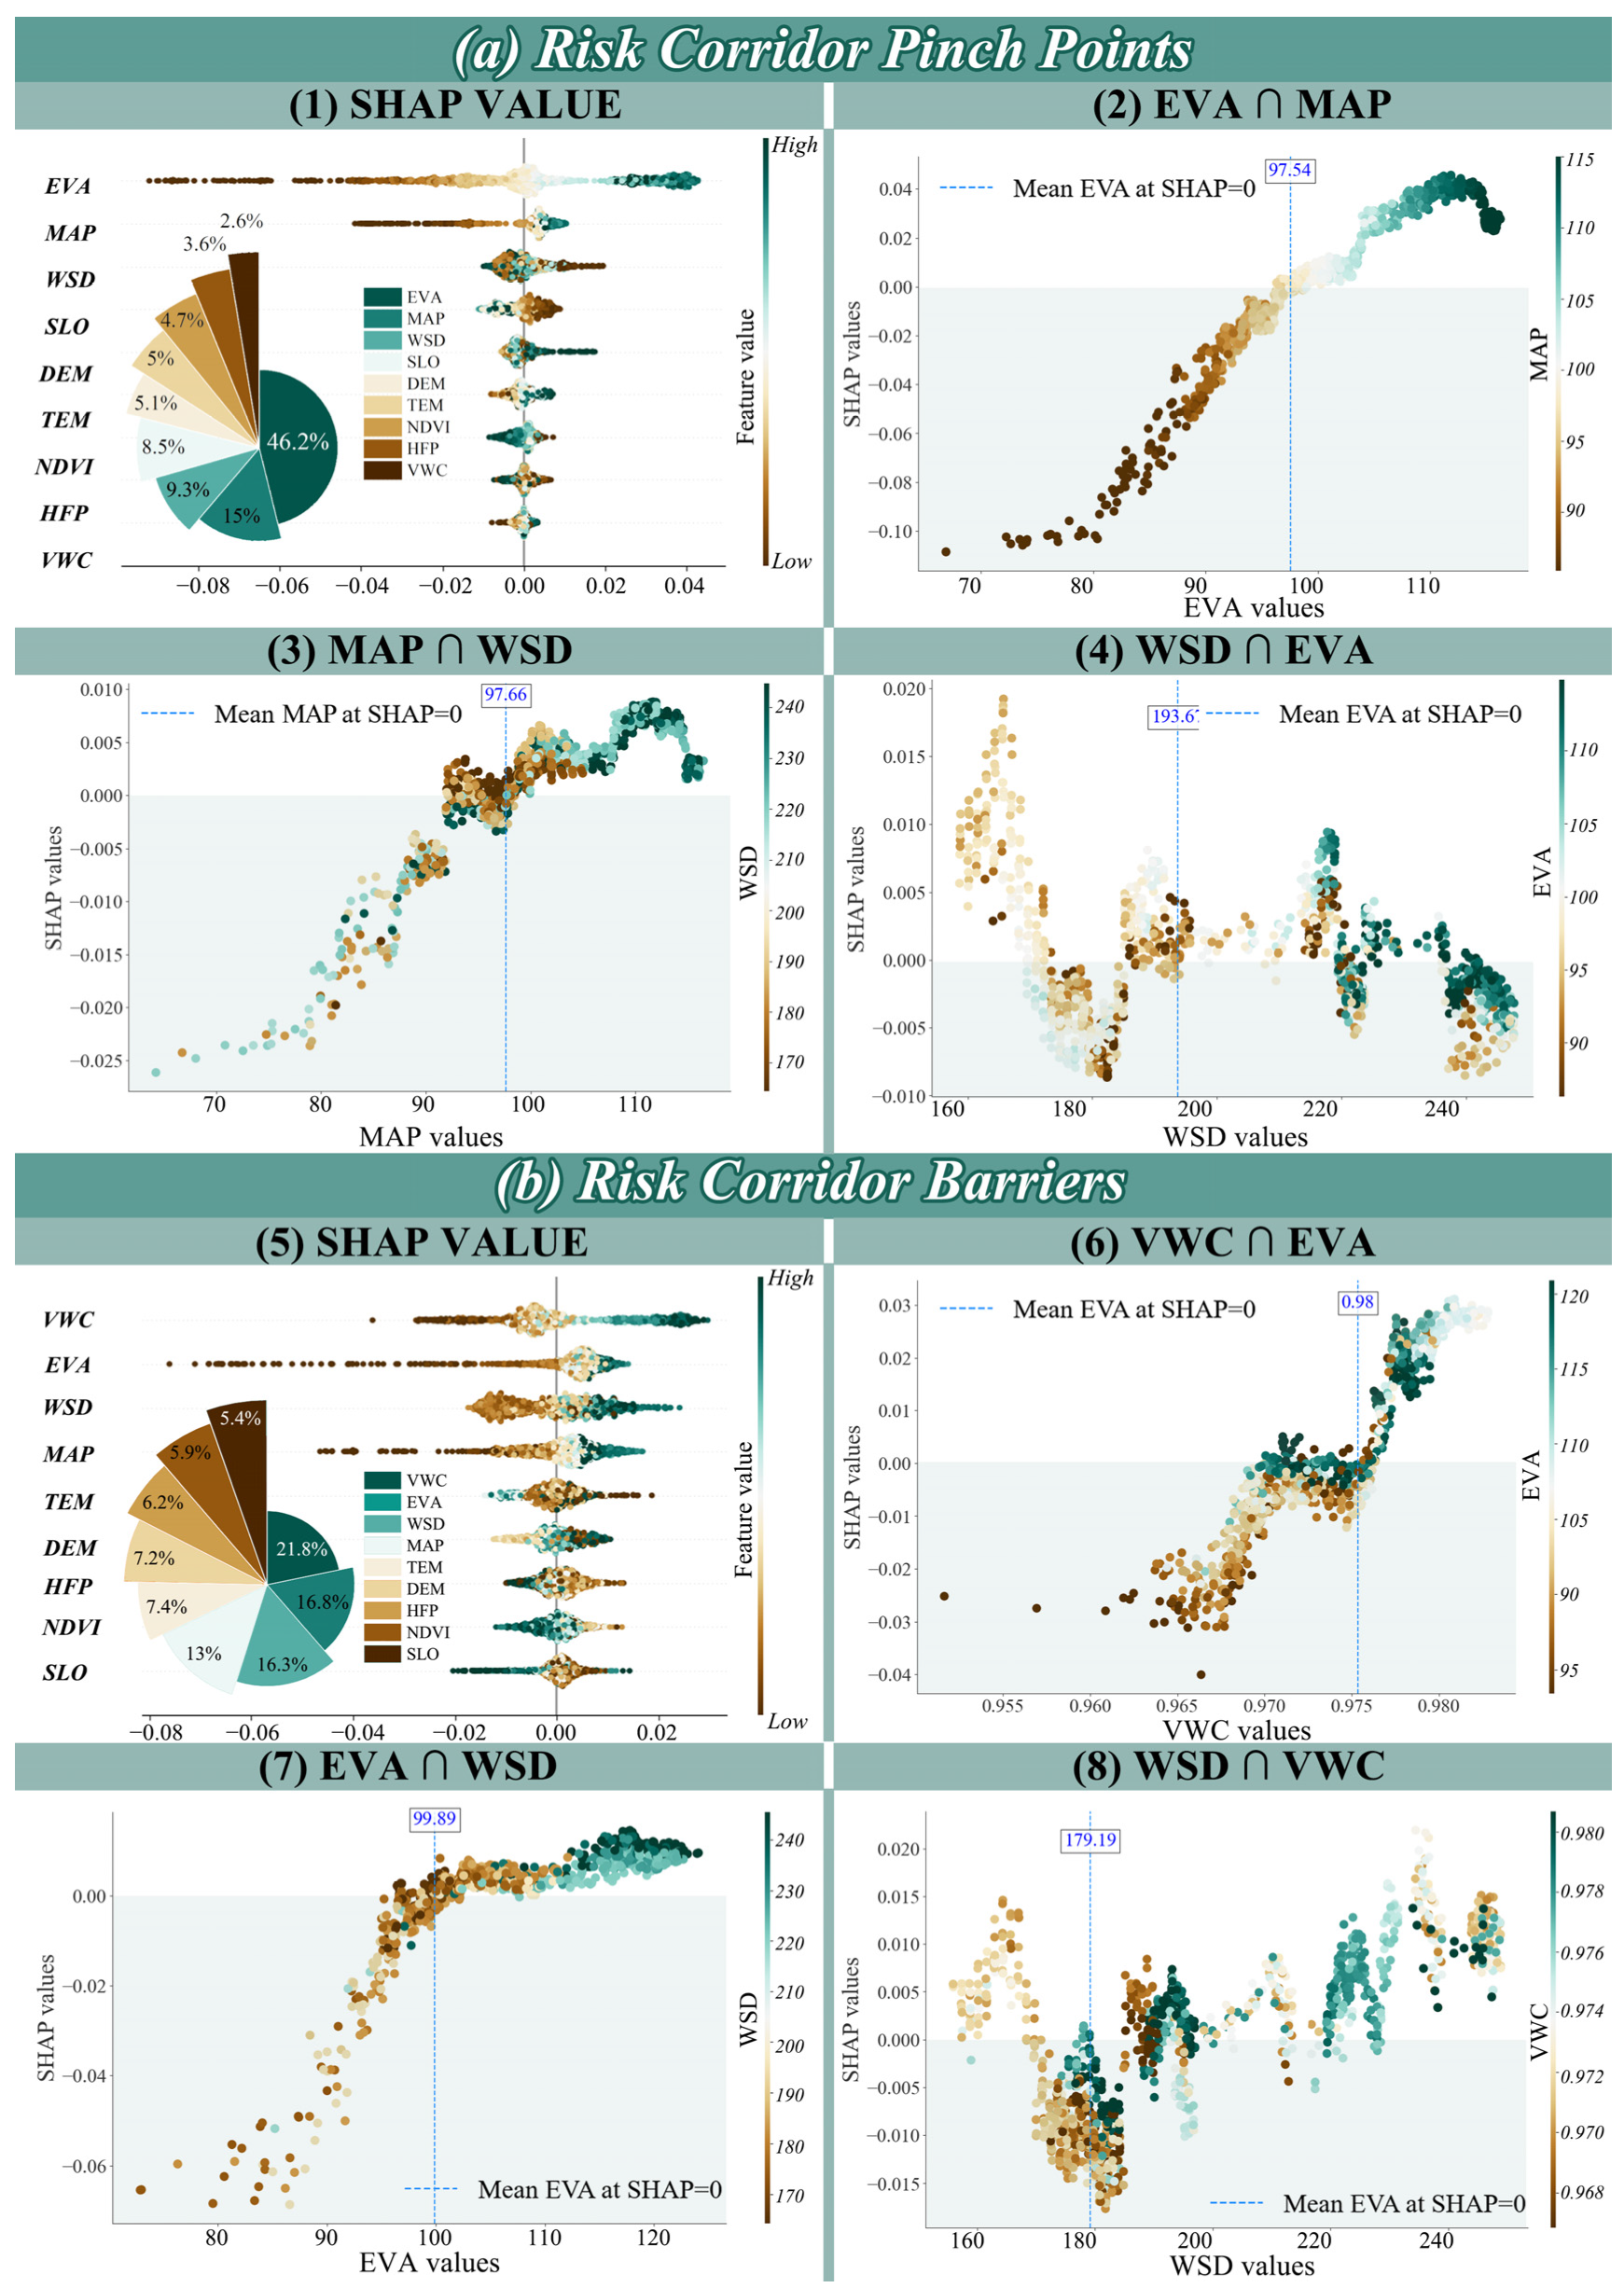
For pinch points along the risk corridor, the top three contributors in terms of feature importance were Evapotranspiration (EVA), Mean Annual Precipitation (MAP), and Wind Speed (WSD), with Volumetric Water Content (VWC) ranking lowest (Figure 5(1)). Conversely, VWC, EVA, and WSD exerted greater influence on barriers (Figure 5(5)). Pinch points represent the least resistant sections along sand transport pathways, where particles are most readily carried away, indicating that the primary condition for sand formation is surface soil wind erosion, jointly determined by regional instantaneous moisture and wind intensity. Barriers, on the other hand, are the most resistant sections where particles are most likely to deposit or become trapped. Effective blocking of sand transport relies on long-term, stable resistance to wind erosion, which is largely determined by the soil’s sustained moisture content.
For risk corridor pinch points, EVA is the most critical factor (SHAP value = 0.0116) and exhibits a significant positive synergistic relationship with MAP (Figure 5(2)). In regions with abundant precipitation, increased WSD significantly enhances windbreak and sand fixation effects. Precipitation not only directly affects VWC and soil particle cohesion but also influences vegetation growth, thereby regulating wind erosion. When MAP < 97.66 mm, windbreak and sand fixation capacity decline significantly with increasing WSD. When MAP ≥ 97.66 mm, the SHAP value shifts from negative to positive within the same WSD range, indicating that precipitation compensation enhances corridor resistance (Figure 5(3)). Wind acts as a primary climatic driver of wind erosion. WSD exhibits complex interactions with EVA; beyond WSD exceeding 199.67 m/s, increased EVA positively contributes to transmission resistance within the same WSD range. This suggests that higher EVA can effectively buffer wind erosion by regulating surface VWC conditions (Figure 5(4)).
For risk barriers, VWC is the dominant factor (SHAP value = 0.01022). VWC and EVA exhibit an inverted S-shaped relationship, with wind erosion resistance increasing sharply when VWC exceeds 98% (Figure 5(6)). Moreover, at constant VWC, higher EVA suppresses sand formation, likely because increased transpiration enhances soil particle cohesion and promotes vegetation growth, thereby inhibiting sand movement. EVA and WSD show an inverted U-shaped synergistic relationship (Figure 5(7)). When EVA exceeds 99.89 mm, its effect shifts from suppressing wind erosion to significantly promoting sand fixation, with the enhancing effect gradually plateauing. WSD displays nonlinear characteristics in relation to soil wind erosion and interacts complexly with WSD. Below 179.19 m/s, WSD dominates, with increased speed intensifying erosion. Above this threshold, elevated VWC suppresses sand transport (Figure 5(8)).

4.2. Identification and Consolidation of Supply Corridors

4.2.1. Supply Ecological Network Identification

By analyzing and visualizing the supply and demand dynamics of WC, CS, AP, and UC, Figure 6 demonstrates that all four services exhibit supply-demand imbalances, although the degree of mismatch varies across categories. The imbalance for WC and urban heat island effects spans extensive areas, with clusters primarily concentrated in central urban districts, accounting for 95.2% and 69.6% of the total area in the buffer and protected zones, respectively. In contrast, areas experiencing carbon imbalance and air pollution are relatively limited, representing only 3.7% and 1.1% of the total area.
As shown in Figure 7a, the study identified 108 supply areas covering 18,454 km2 and 68 demand areas covering the same total area. A total of 259 corridors were delineated, with a combined length of 9606 km. Within these corridors, 101 supply pinch points were identified, covering 974 km2, primarily located in Baoding, Tangshan, and other regions. These areas represent key industrial, energy, and densely populated zones in the Beijing–Tianjin–Hebei region, where high-intensity urbanization and industrialization have created ecological demands that far exceed supply capacity, resulting in supply-demand imbalance pinch points. Additionally, 263 supply barriers were identified, covering 5471 km2 (Figure 7b). These barriers are mainly concentrated in Baoding and Hengshui, where the ecological baseline is relatively fragile and has long been affected by water scarcity, soil degradation, and environmental pollution. The combined effects of the Huangjing Five-Day Index and population pressure have led to significant declines in ecosystem service functions, making these areas critical hotspots for barriers.

4.2.2. Analysis of the Mechanism of Key Nodes in Supply Corridors

As shown in Figure 8(1), the key factors influencing supply points within supply corridors are the Human Footprint Index (HFP), Normalized Difference Vegetation Index (NDVI), and Evapotranspiration (EVA), while Land Surface Temperature (TEM) contributes less significantly. For barriers within supply corridors, temperature emerges as the primary factor affecting supply efficiency, followed by NDVI and HFP. This suggests that the formation of supply points is largely driven by the compression of ecological space due to increased impervious surfaces from human activities. Conversely, barriers are primarily influenced by climatic factors, where rising temperatures limit the regulatory effects of vegetation and human activities. Accordingly, supply points should prioritize optimizing land use and vegetation restoration, whereas barriers require urgent interventions to mitigate temperature stress.
Among supply-side factors, HFP (SHAP value = 0.03571) plays a dominant role. Moderate FVC notably helps maintain the supply capacity of the barrier zone, mitigating the inhibitory impact of human activities on ecosystem supply (Figure 8(2)). Moreover, NDVI and EVA exhibit synergistic effects: when NDVI exceeds 0.73, evaporation decreases significantly, enhancing the barrier zone’s supply capacity (Figure 8(3)). EVA also demonstrates a synergistic inhibitory effect with HFP that follows a declining-then-leveling trend; when EVA exceeds 117.38 mm, it suppresses supply at pinch points, while under lower human activity, this inhibitory effect is correspondingly reduced (Figure 8(4)).
Among the factors influencing supply corridor pinch points, TEM exhibits the highest contribution (SHAP value = 0.01992). TEM and NDVI display a U-shaped positive synergistic relationship, facilitating the alleviation of supply ecological pinch points when the annual mean temperature is below 12 °C or above 13.5 °C. In contrast, increases in the HFP show negative synergistic interactions with both decreasing NDVI and rising TEM, effectively suppressing the transmission efficiency of supply ecological pinch points. However, when NDVI exceeds 0.76, this inhibitory effect is substantially reduced (Figure 8(7,8)).

5. Discussion

5.1. The Applicability of Methods for Optimizing Ecological Corridors to Enhance the Dual Functions of Forest-Mountain Areas as Ecological Barriers

The primary purpose of constructing ecological security barriers is to conserve and nurture favorable factors while blocking and purifying unfavorable ones, with the effectiveness of these functions depending on their impact on surrounding areas. Constructing and optimizing an ecological security framework provides a critical pathway to achieving this goal. However, most existing studies focus solely on the barriers themselves [56], lacking a framework that integrates both “external defense” and “internal supply” perspectives to establish a structure capable of simultaneously fulfilling defensive and provisioning functions.
Therefore, this study focuses on the ecological security barrier of the Beijing–Tianjin–Hebei region, constructing an ecological security pattern by integrating both reverse (resistance) and forward (provision) perspectives to address the limitation of traditional research that solely concerns the connectivity of internal ecological sources. Compared to previous studies, the novelty and distinctiveness of this research are mainly reflected in three aspects. First, regarding the research perspective and framework, most prior studies focused only on the connectivity of ecological sources within the barrier [4] or unilaterally addressed the internal urban supply [57]. This study innovatively adopts differentiated spatial delineation strategies for constructing ecological networks with distinct functions. For the resistance function, the analysis concentrates on the barrier zone itself as the final defense line against external sand and dust risks. For the supply function, the spatial scope is extended to include both the barrier zone and the internal urban agglomerations. This approach ensures direct delivery of ecosystem services from supply areas to demand sites. Second, in terms of research methodology and depth, traditional studies often remain at the level of spatial identification of corridors and nodes [58], lacking qualitative and quantitative data support for targeted corridor facilitation or blocking. This study employs interpretable machine learning (XGBoost-SHAP) to quantitatively analyze the driving mechanisms of key nodes, such as pinch points and barriers, including factor contributions, nonlinear relationships, and threshold effects, thereby achieving comprehensive corridor management by facilitating or blocking key nodes to influence the entire network. Finally, regarding research findings and application, based on the above methodological framework, this study reveals that factors influencing corridor efficiency differ significantly depending on the corridor’s functional type. Climate change is the dominant factor affecting regional soil wind erosion, while the reduction in ecological space due to human activities is key to impacting the supply service transmission efficiency of the barrier zone, which resonates with findings from Hu et al. [59] and Chen et al. [60]. Further analysis shows that even for corridors with the same function, the contribution levels of influencing factors for pinch points and obstacle points exhibit significant heterogeneity, and factors demonstrate differentiated interactive effects and threshold characteristics. These findings indicate that there is no one-size-fits-all optimization scheme for the ecological security pattern of barrier zones; instead, differentiated and precise restoration strategies must be formulated based on the functional attributes of key nodes and the operational characteristics of their dominant factors.

5.2. Policy Implications for Blocking Risk Corridors and Connecting Supply Corridors

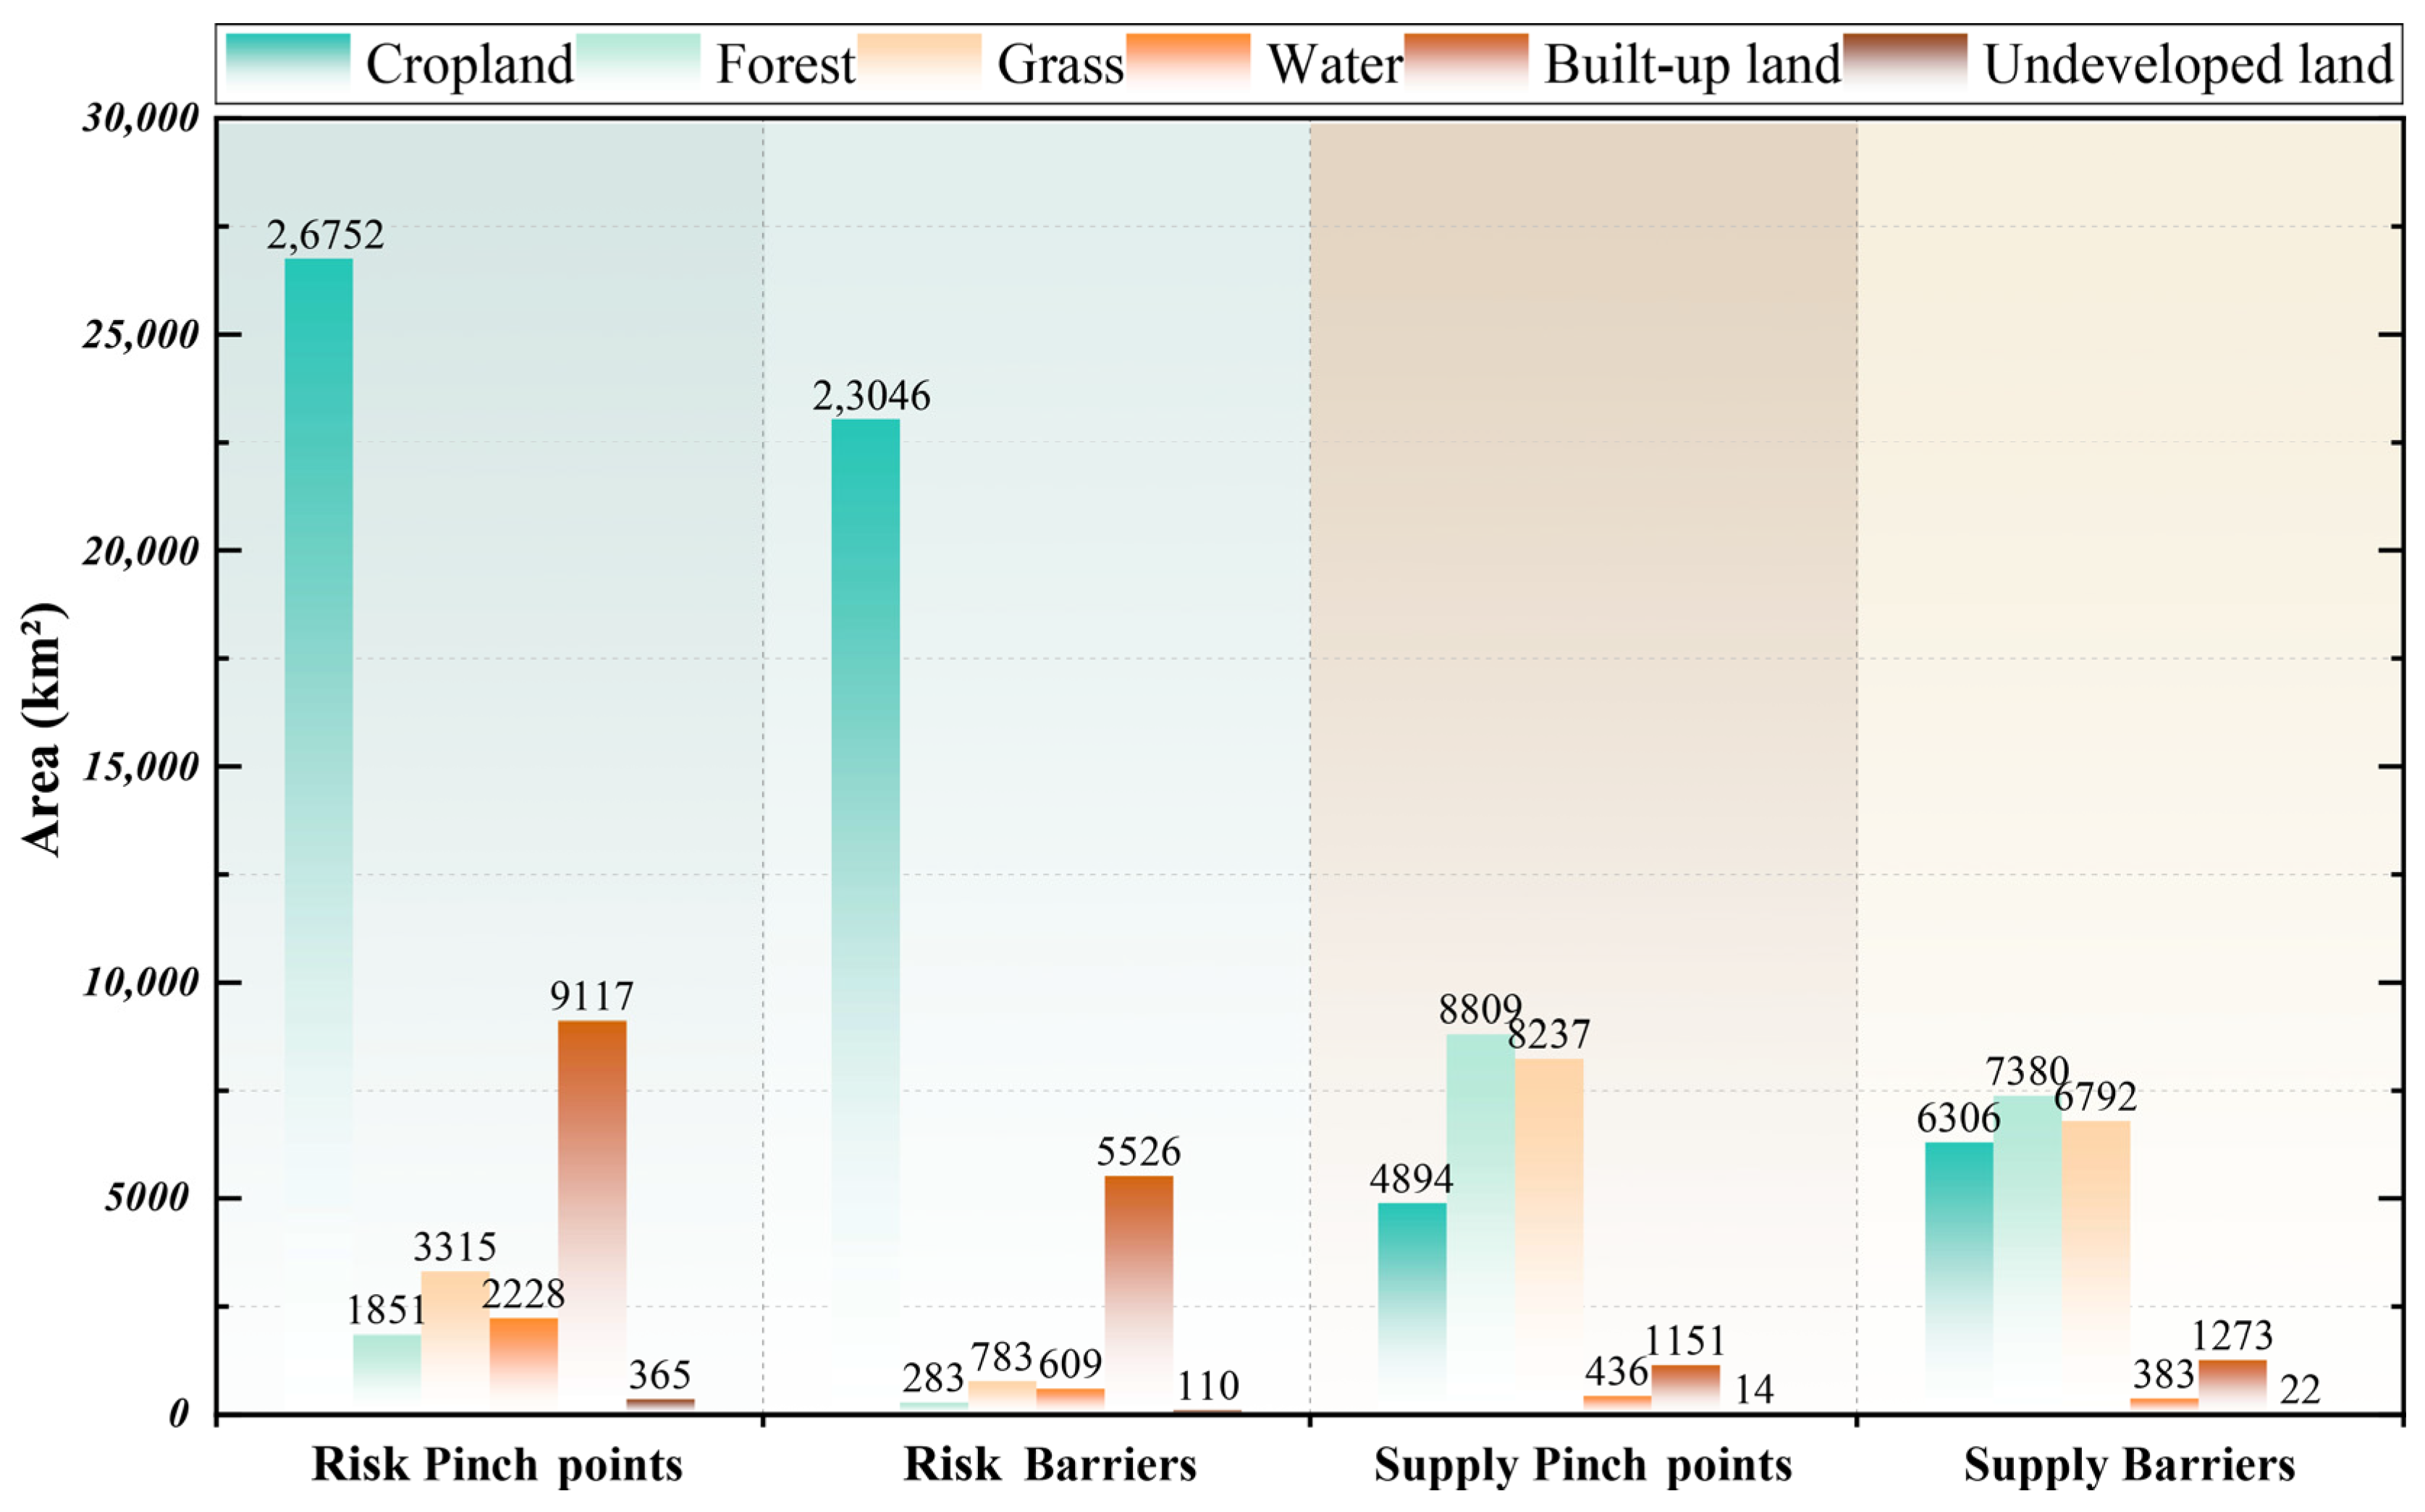
To achieve the synergistic enhancement of both the resistance and provision capacities of the ecological security barrier, it is imperative to translate the research findings into concrete spatial planning and ecological management actions. Based on the spatial distribution (Figure 4 and Figure 7), land use types (Figure 9), and formation mechanisms of the critical nodes, the following governance strategies are proposed, aiming to provide specific recommendations for territorial spatial planning and regional ecological restoration projects:
To block the 29 identified risk corridors, it is essential to increase the resistance to sand transport by disrupting pinch points and reinforcing barriers. As shown in Figure 9, the critical nodes of risk corridors are predominantly located in construction land and cultivated land. Based on the operational mechanisms of the critical nodes within the risk corridors, the following science-based management strategies are proposed:
For risk pinch points: (1) Utilize the positive synergy between Evapotranspiration (EVA) and Mean Annual Precipitation (MAP), combined with precipitation data, to achieve zoned optimization. In urban built-up areas where MAP < 97.66 mm, evaporation can be enhanced through the strategic use of permeable pavements and sub-surface structures [61], while farmland may adopt straw mulching and conservation tillage to increase evaporation [62]. In regions with MAP ≥ 97.66 mm, one should utilize native tree species characterized by high leaf stomatal conductance and dense canopy closure [63]. This approach enhances transpiration, effectively converting soil moisture into atmospheric humidity to strengthen sand fixation. (2) To mitigate wind speed impacts, urban areas should incorporate pinch points into the regulatory framework of urban ventilation corridors. This can be achieved by controlling building orientation, spacing, and height to buffer wind speed [64]. For cultivated land, mixed shrub-grass shelterbelts can be established along field edges, serving dual functions of wind reduction and humidity enhancement, thereby effectively weakening wind erosion [65].
For risk barriers: (1) The core strategy involves maintaining soil volumetric moisture content. In urban greening, priority should be given to deep-rooted or drought-tolerant tree species, establishing multi-layered structures combining trees, shrubs, and grasses to maximize soil water utilization and increase evapotranspiration in limited spaces [66]. For high-risk farmland areas with elevated wind speeds, water-saving irrigation techniques such as shallow-buried drip irrigation and micro-sprinkler irrigation should be promoted to maintain critical surface soil moisture during windy seasons. (2) Given the inverted U-shaped relationship between EVA and Wind Speeds (WSD), in low-EVA zones (EVA < 99.89 mm), increase ground roughness through measures like gravel windbreaks and shrub belts to control WSD [67]. In zones where EVA ≥ 99.89 mm, leverage WSD to promote sand particle aggregation while maintaining surface moisture with cover crops. Ensure appropriate canopy closure to avoid excessive planting density [68].
To enhance the connectivity of the 250 identified supply corridors, it is essential to reduce resistance to service flow by consolidating pinch points and eliminating barriers. As shown in Figure 9, the critical nodes of these supply corridors are predominantly distributed in woodland, grassland, and cultivated land areas. Based on the operational mechanisms of these critical nodes, the following targeted strategies are proposed:
Addressing supply pinch points: (1) The primary task is to strictly control destructive human development activities. It is recommended to prioritize the designation of these areas as ecological protection zones [69], impose binding constraints on urban development boundaries, and ensure that the regional NDVI value remains above 0.73 to safeguard the fundamental ecological provision base. (2) To reduce accelerated evapotranspiration from construction activities, ecological restoration should prioritize low-water-consumption native species [70]. Retaining the forest litter layer helps intercept precipitation and minimize ineffective soil evaporation [71].
Addressing supply barriers: (1) Leverage the “U-shaped effect” of air temperature by introducing cold- or heat-tolerant vegetation based on regional thermal characteristics. In cold zones (TEM < 12 °C) and hot zones (TEM > 13.5 °C), vegetation adaptability should be utilized to enhance provision capacity [72]. In temperate zones (12 °C ≤ TEM ≤ 13.5 °C), microclimate can be regulated through planned urban ventilation corridors and wetland restoration. (2) Restore the ecological baseline by controlling construction encroachment on woodlands and grasslands. Given the widespread distribution of barriers in cultivated land, farming intensity must be strictly regulated. Establishing vegetation buffer zones with NDVI ≥ 0.76 around barriers can effectively mitigate the suppressive effects of human activities on service flow [73].

5.3. Research Limitations and Future Directions

Although this study established an ecological security pattern framework integrating the dual functions of “resilience and supply” and provided a scientific basis for the coordinated governance of ecological security barriers, certain limitations remain: (1) The critical sand-lifting Wind Speed (WSD) was uniformly set at 5 m/s based on empirical values, which may introduce bias into the revised wind erosion equation (RWEQ) model’s simulation results. To address this, future studies could determine critical dust-lifting WSDs based on actual surface conditions in different regions to improve the accuracy of model simulations and forecasts. (2) In identifying risk corridors, current intensity reflects the likelihood of dust occurrence rather than its actual intensity. In reality, structures and other environmental factors dissipate aerodynamic energy through friction, thereby affecting actual WSDs. Limited by current research methods, this study could not effectively simulate or accurately describe these aerodynamic behaviors. To address this, potential corridors could first be preliminarily screened using macro-scale models, followed by detailed analysis of key sections through coupled computational fluid dynamics (CFD) simulations to evaluate actual dust transport efficiency [74]. (3) Regarding ecosystem service assessment, the InVEST model simplifies the simulation of physical processes, and its results rely on subjectively set biophysical parameters (e.g., EVA coefficients, albedo), which typically require reference literature or empirical data. This may reduce regional adaptability and affect the accuracy of outcomes. To address this limitation, future research should integrate multi-source high-resolution remote sensing data, ground-based observations, and process-based models to develop higher-precision dynamic assessment models, thereby enhancing the reliability of quantitative ecosystem service evaluations.

6. Conclusions

Forest-mountain ecological security barriers serve as a critical intermediary between external risk sources and internal urban clusters. To synergistically optimize the dual functions of ‘external defense and internal supply’, this study proposes a corridor construction framework integrating both ‘reverse blocking’ and ‘forward connectivity’ functions. Taking the Yanshan–Taihang Mountain ecological barrier zone as a case study, the key findings are as follows:
(1) Identification and construction of spatial corridors and key nodes for both resistance and supply functions. A total of 29 risk corridors, 158 risk pinch points, and 210 risk barriers were identified, along with 250 supply corridors, 158 supply pinch points, and 118 supply barriers. These findings clearly illustrate the spatial patterns and distribution characteristics of risk transmission and service provision.
(2) Revealing the differential formation mechanisms of key nodes for different functions. Results indicate that the transmission efficiency of risk corridors is primarily governed by natural climatic factors, whereas the connectivity of supply corridors is more strongly influenced by HFP and NDVI. Importantly, the study quantitatively analyzed the interactions among dominant factors and identified key thresholds, advancing node research from simple “spatial identification” to “mechanistic understanding”.
(3) Proposing a targeted ecological restoration paradigm with customized strategies based on causal analysis. For risk pinch points, the focus should be on enhancing evapotranspiration; for risk barriers, the core lies in maintaining soil moisture to reinforce their sand-retention capacity. For supply pinch points, the key is to mitigate the impact of human activities and increase vegetation cover, whereas for supply barriers, greater attention must be paid to addressing climate stress.
In summary, the scientific contributions of this study are manifested in three levels: Theoretically, this study breaks away from the traditional ecological security pattern paradigm that predominantly focuses on ecological source connectivity by proposing a corridor construction framework that coordinates resistance and supply functions. Methodologically, this study employs interpretable machine learning models, providing a new paradigm for analyzing complex ecological processes in key nodes. Practically, this study is grounded in corridor delineation, employing a “spatial identification–cause diagnosis–optimization strategy” pathway to support decision-makers by informing the precise allocation of limited restoration resources to key areas and the implementation of targeted measures for synergistic enhancement of the ecological security barrier. The research outcomes not only provide a scientific basis for precise restoration in the Yanshan–Taihang Mountains Ecological Barrier Zone but also offer a replicable and scalable technical pathway and practical paradigm for the planning and management of other similar regions globally.

Supplementary Materials

The following supporting information can be downloaded at https://www.mdpi.com/article/10.3390/f16111625/s1: Table S1: Data Sources; Table S2: Soil Wind Erosion Model Calculation Formula; Table S3.1: Risk Corridor Pinch Points Hyperparameter Optimization Results; Table S3.2: Risk Corridor Pinch Points Model fitting results; Table S3.3: Risk Corridor Barriers Hyperparameter Optimization Results; Table S3.4: Risk Corridor Barriers Model fitting results; Table S3.5: Supply Pinch Points Hyperparameter Optimization Results; Table S3.6. Supply Pinch Points Model fitting results; Table S3.7. Supply Barriers Hyperparameter Optimization Results; Table S3.8. Supply Barriers Model fitting results.

Author Contributions

All authors made significant contributions to the work. Specific contributions include Conceptualization, L.C.; methodology, L.C.; software, L.C.; validation, C.X.; formal analysis, C.X.; investigation, C.X.; resources, Y.Z.; data curation, X.Z.; writing—original draft preparation, L.C.; writing—review and editing, X.Z.; visualization, L.C.; supervision, L.C.; project administration, Y.Z.; funding acquisition, Y.Z. All authors have read and agreed to the published version of the manuscript.

Funding

This work is “Financially supported by National Key Research and Development Plan Program” [No. 2024YFD2200900], Beijing–Tianjin–Hebei Ecological Breakthrough Technology Collaborative Innovation Center 2025 Service Project [No. 2025132052].

Data Availability Statement

The raw data supporting the conclusions of this article will be made available by the authors on request.

Conflicts of Interest

The authors declare no conflicts of interest.

Abbreviations

  • The following abbreviations are used in this manuscript:
WCwater conservation
CScarbon sequestration
APair purification
UCurban cooling
EVAmean annual evapotranspiration
VWCsoil volumetric water content
MAPmean annual precipitation
TEMland surface temperature
WSDwend speed
HFPhuman footprint index
NDVInormalized difference vegetation index
DEMdigital elevation model
SLOslope
XGBoosteXtreme gradient boosting
SHAPSHapley additive exPlanations

References

  1. Cai, E.X.; Zhang, S.N.; Chen, W.Q.; Li, L. Spatio-temporal dynamics and human-land synergistic relationship of urban expansion in Chinese megacities. Heliyon 2023, 9, 12. [Google Scholar] [CrossRef]
  2. He, J.J.; Huang, Z.R.; Fan, X.; Zhang, H.; Zhou, R.; Song, M.W. The impact of environmental regulation on regional economic growth: A case study of the Yangtze River Economic Belt, China. PLoS ONE 2023, 18, e0290607. [Google Scholar] [CrossRef] [PubMed]
  3. Niu, H.P.; Liu, M.M.; Xiao, D.Y.; Zhao, X.M.; An, R.; Fan, L.X. Spatio-Temporal Characteristics of Trade-Offs and Synergies in Ecosystem Services at Watershed and Landscape Scales: A Case Analysis of the Yellow River Basin (Henan Section). Int. J. Environ. Res. Public Health 2022, 19, 15772. [Google Scholar] [CrossRef] [PubMed]
  4. Li, C.; Wu, Y.M.; Gao, B.P.; Zheng, K.J.; Wu, Y.; Wang, M.J. Construction of ecological security pattern of national ecological barriers for ecosystem health maintenance. Ecol. Indic. 2023, 146, 17. [Google Scholar] [CrossRef]
  5. Tang, L.D.; Liang, G.D.; Gu, G.H.; Xu, J.; Duan, L.; Zhang, X.Y.; Yang, X.X.; Lu, R.C. Study on the spatial-temporal evolution characteristics, patterns, and driving mechanisms of ecological environment of the Ecological Security Barriers on China’s Land Borders. Environ. Impact Assess. Rev. 2023, 103, 18. [Google Scholar] [CrossRef]
  6. Tang, L.; Long, H.; Aldrich, D.P. Putting a Price on Nature: Ecosystem Service Value and Ecological Risk in the Dongting Lake Area, China. Int. J. Environ. Res. Public Health 2023, 20, 4649. [Google Scholar] [CrossRef]
  7. Bai, J.T.; Sun, R.; Liu, Y.F.; Chen, J.; Li, X.H. Integrating ecological and recreational functions to optimize ecological security pattern in Fuzhou City. Sci. Rep. 2025, 15, 22. [Google Scholar] [CrossRef]
  8. Yu, J.-F.; Du, H.-Y.; Wang, J.-L.; Zhang, Y. Construction and Assessment of Ecological Security Pattern in Gansu Along the Yellow River Based on Zonation-MSPA Coupling Model. Huan Jing Ke Xue Huanjing Kexue 2025, 46, 3085–3097. [Google Scholar]
  9. Wang, X.X.; Wang, X.F.; Zhang, X.R.; Zhou, J.T.; Jia, Z.X.; Ma, J.H.; Yao, W.J.; Tu, Y.; Sun, Z.C.; Wei, Y.H. Ecological barriers: An approach to ecological conservation and restoration in China. Ambio 2024, 53, 1077–1091. [Google Scholar] [CrossRef]
  10. Xu, D.M.; Peng, J.; Jiang, H.; Dong, J.Q.; Liu, M.L.; Chen, Y.Y.; Wu, J.S.; Meersmans, J. Incorporating barriers restoration and stepping stones establishment to enhance the connectivity of watershed ecological security patterns. Appl. Geogr. 2024, 170, 10. [Google Scholar] [CrossRef]
  11. Mu, H.W.; Li, X.C.; Ma, H.J.; Du, X.P.; Huang, J.X.; Su, W.; Yu, Z.; Xu, C.; Liu, H.L.; Yin, D.Q.; et al. Evaluation of the policy-driven ecological network in the Three-North Shelterbelt region of China. Landsc. Urban. Plan. 2022, 218, 11. [Google Scholar] [CrossRef]
  12. Iungman, T.; Caballé, S.V.; Segura-Barrero, R.; Cirach, M.; Mueller, N.; Daher, C.; Villalba, G.; Barboza, E.P.; Nieuwenhuijsen, M. Co-benefits of nature-based solutions: A health impact assessment of the Barcelona Green Corridor (Eixos Verds) plan. Environ. Int. 2025, 196, 13. [Google Scholar] [CrossRef] [PubMed]
  13. Wu, S.T.; Shi, S.; Zhang, J.L. Evolution Analysis of Ecological Security Pattern in Forest Areas Coupling Carbon Storage and Landscape Connectivity: A Case Study of the Xiaoxing’an Mountains, China. Forests 2025, 16, 331. [Google Scholar] [CrossRef]
  14. Huang, H.; Fu, D.L.; Ding, G.C.; Yan, C.; Xie, X.C.; Gao, Y.L.; Liu, Q.Y. Construction and optimization of Green Infrastructure Network in mountainous cities: A case study of Fuzhou, China. Sci. Rep. 2024, 14, 17. [Google Scholar] [CrossRef]
  15. Yu, Z.W.; Zhang, J.G.; Yang, G.Y. How to build a heat network to alleviate surface heat island effect? Sust. Cities Soc. 2021, 74, 10. [Google Scholar] [CrossRef]
  16. Li, W.J.; Kang, J.W.; Wang, Y. Exploring the interactions and driving factors among typical ecological risks based on ecosystem services: A case study in the Sichuan-Yunnan ecological barrier area. Ecol. Indic. 2025, 170, 14. [Google Scholar] [CrossRef]
  17. Liu, F.; Zhang, Q.; Wang, J.L.; Liu, Y.X.; Wang, W.B.; Li, S. Ecological security assessment of Yunnan Province, China in the context of Production-Living-Ecological space division. Ecol. Evol. 2024, 14, 18. [Google Scholar] [CrossRef]
  18. Ren, J.Y.; Wang, W.J.; Fei, L.; Wang, L.; Xing, S.F.; Cong, Y. Impacts of climate change and land Use/Cover change on ecological security networks in Changbai Mountains, Northeast China. Ecol. Indic. 2024, 169, 10. [Google Scholar] [CrossRef]
  19. Wang, S.; Zhang, R.; Wang, J.F.; Li, Q.; Wang, R.D.; Li, Y.R.; Zhang, L.X. Identification and optimization of ecological corridors in the middle reaches of the Yellow River Basin. J. Clean. Prod. 2025, 512, 12. [Google Scholar] [CrossRef]
  20. Li, C.; Wu, Y.M.; Gao, B.P.; Zheng, K.J.; Wu, Y.; Li, C. Multi-scenario simulation of ecosystem service value for optimization of land use in the Sichuan-Yunnan ecological barrier, China. Ecol. Indic. 2021, 132, 13. [Google Scholar] [CrossRef]
  21. Yang, D.; Gao, Y.; Chen, J.; Li, X.; Li, Z.; Shen, L.; Yang, C. Optimizing regional ecological security patterns based on interpretable machine learning models: A case study of Huzhou, Zhejiang Province. J. Environ. Manag. 2025, 393, 126905. [Google Scholar] [CrossRef]
  22. Gou, R.; Su, W.-C.; Huang, X.-F. Construction of Ecological Security Network and Multi-scenario Simulation in Guizhou Province Based on Landscape Ecological Security Assessment. Huan Jing Ke Xue Huanjing Kexue 2025, 46, 4580–4591. [Google Scholar] [PubMed]
  23. Zhang, H.X.; Song, Q.; Wang, S.R.; Zhao, J.Y.; Gao, W.M. Ecological network construction and land degradation risk identification in the Yellow River source area. iScience 2025, 28, 16. [Google Scholar] [CrossRef]
  24. Wang, Z.Y.; Zhang, J.; Chen, J.C.; Gao, H.Z.; Li, J.M.; Li, M.H. Determining the ecological security pattern and important ecological regions based on the supply-demand of ecosystem services: A case study of Xuzhou City, China. Front. Public Health 2023, 11, 14. [Google Scholar] [CrossRef]
  25. Sharma, D.; Das, S.; Goswami, B.N. Variability and predictability of the Northeast India summer monsoon rainfall. Int. J. Climatol. 2023, 43, 5248–5268. [Google Scholar] [CrossRef]
  26. Shi, Y.; Fan, Q.; Song, X.A.; Li, D.D. Assessing the severity of urban heat transfer and flow across years: Evidence from thermal environment spatial networks. Urban. Clim. 2025, 61, 14. [Google Scholar] [CrossRef]
  27. Yang, J. Economic Synergistic Development of Guangdong-Hong Kong-Macao Greater Bay Area Urban Agglomeration: Based on Composite System. Comput. Intell. Neurosci. 2022, 2022, 10. [Google Scholar] [CrossRef]
  28. Liu, Y. Coupling and coordination evaluation of digital economy and green development efficiency in eight urban agglomerations in China. Sci. Rep. 2025, 15, 17. [Google Scholar] [CrossRef]
  29. An, P.F.; Li, C.; Duan, Y.J.; Ge, J.F.; Feng, X.M. Inter-metropolitan land price characteristics and pattern in the Beijing-Tianjin-Hebei urban agglomeration, China. PLoS ONE 2021, 16, e0256710. [Google Scholar] [CrossRef] [PubMed]
  30. Wang, X.F.; Xu, S.L.; Huang, X.; Yang, C.C.; Li, Y.S. Optimization and Construction of Forestland Ecological Security Pattern: A Case Study of the Huai River Source-Dabie Mountains in China. Forests 2025, 16, 426. [Google Scholar] [CrossRef]
  31. Xiao, Q.; Xiao, Y.; Luo, Y.; Song, C.S.; Bi, J.C. Effects of afforestation on water resource variations in the Inner Mongolian Plateau. PeerJ 2019, 7, 16. [Google Scholar] [CrossRef]
  32. Chen, J.H.; Wang, D.C.; Li, G.D.; Sun, Z.C.; Wang, X.; Zhang, X.; Zhang, W. Spatial and Temporal Heterogeneity Analysis of Water Conservation in Beijing-Tianjin-Hebei Urban Agglomeration Based on the Geodetector and Spatial Elastic Coefficient Trajectory Models. GeoHealth 2020, 4, 18. [Google Scholar] [CrossRef]
  33. Fang, J.Z.; Xiong, K.N.; Chi, Y.K.; Song, S.Z.; He, C.; He, S.Y. Research Advancement in Grassland Ecosystem Vulnerability and Ecological Resilience and Its Inspiration for Improving Grassland Ecosystem Services in the Karst Desertification Control. Plants 2022, 11, 1290. [Google Scholar] [CrossRef]
  34. Yan, F.; Guo, X.Y.; Zhang, Y.W.; Shan, J.; Miao, Z.H.; Li, C.Y.; Huang, X.H.; Pang, J.; Chen, Y.H. Analysis of the multiple drivers of vegetation cover evolution in the Taihangshan-Yanshan region. Sci. Rep. 2024, 14, 21. [Google Scholar] [CrossRef] [PubMed]
  35. Zhao, S.M.; Zhang, Z.X.; Gao, C.Y.; Dong, Y.D.; Jing, Z.Y.; Du, L.X.; Hou, X.Y. MaxEnt-Based Predictions of Suitable Potential Distribution of Leymus secalinus Under Current and Future Climate Change. Plants 2025, 14, 293. [Google Scholar] [CrossRef] [PubMed]
  36. Wang, F.; Liu, J.; Fu, T.; Gao, H.; Qi, F. Spatial-Temporal Variations in of Soil Conservation Service and Its Influencing Factors under the Background of Ecological Engineering in the Taihang Mountain Area, China. Int. J. Environ. Res. Public Health 2023, 20, 3427. [Google Scholar] [CrossRef]
  37. Du, H.Q.; Zhao, L.; Zhang, P.T.; Li, J.X.; Yu, S. Ecological compensation in the Beijing-Tianjin-Hebei region based on ecosystem services flow. J. Environ. Manag. 2023, 331, 14. [Google Scholar] [CrossRef]
  38. Chen, Y.M.; Zhai, Y.P.; Gao, J.X. Spatial patterns in ecosystem services supply and demand in the Jing-Jin-Ji region, China. J. Clean. Prod. 2022, 361, 14. [Google Scholar] [CrossRef]
  39. Jiang, H.T.; Guo, C.R.; Li, X.J.; Zhang, W.F.; Du, P.F.; Guo, Q.K.; Wang, Y.S.; Wang, J. Assessing the contribution of wind and water erosion in the agro-pastoral ecotone of Northern China with 137Cs tracer technology. Sci. Rep. 2025, 15, 24. [Google Scholar] [CrossRef]
  40. Fang, Y.H.; Zhao, L.Y. Assessing the environmental benefits of urban ventilation corridors: A case study in Hefei, China. Build. Environ. 2022, 212, 13. [Google Scholar] [CrossRef]
  41. Wang, Y.Y.; Xiao, Y.; Xie, G.D.; Xu, J.; Qin, K.Y.; Liu, J.Y.; Niu, Y.N.; Gan, S.; Huang, M.D.; Zhen, L. Evaluation of Qinghai-Tibet Plateau Wind Erosion Prevention Service Based on RWEQ Model. Sustainability 2022, 14, 4635. [Google Scholar] [CrossRef]
  42. Huang, X.B.; Liu, X.S.; Jin, Y.H.; Gao, X.; Chen, Y.L. Identification and attribution analysis of integrated ecological zones based on the XGBoost-SHAP model: A case study of Chengdu, China. Ecol. Indic. 2025, 177, 18. [Google Scholar] [CrossRef]
  43. Schwantes, A.M.; Firkowski, C.R.; Gonzalez, A.; Fortin, M.J. Revealing driver-mediated indirect interactions between ecosystem services using Bayesian Belief Networks. Ecosyst. Serv. 2025, 73, 12. [Google Scholar] [CrossRef]
  44. Wang, Q.Y.; Zhao, Q.J. Assessing Ecological Infrastructure Investments-A Case Study of Water Rights Trading in Lu’an City, Anhui Province, China. Int. J. Environ. Res. Public Health 2022, 19, 2443. [Google Scholar] [CrossRef]
  45. Wang, L.; Huang, L.; Cao, W.; Zhai, J.; Fan, J.W. Assessing grassland cultural ecosystem services supply and demand for promoting the sustainable realization of grassland cultural values. Sci. Total Environ. 2024, 912, 13. [Google Scholar] [CrossRef]
  46. Zhang, Y.L.; Su, T.T.; Ma, Y.; Wang, Y.Y.N.; Wang, W.Q.; Zha, N.Y.; Shao, M. Forest ecosystem service functions and their associations with landscape patterns in Renqiu City. PLoS ONE 2022, 17, e0265015. [Google Scholar] [CrossRef] [PubMed]
  47. Gao, M.W.; Hu, Y.C.; Liu, X.W.; Liang, M.Y. Revealing multi-scale characteristics of ecosystem services supply and demand imbalance to enhance refined ecosystem management in China. Ecol. Indic. 2025, 170, 13. [Google Scholar] [CrossRef]
  48. Luo, C.; Li, X.Y. Assessment of Ecosystem Service Supply, Demand, and Balance of Urban Green Spaces in a Typical Mountainous City: A Case Study on Chongqing, China. Int. J. Environ. Res. Public Health 2021, 18, 11002. [Google Scholar] [CrossRef]
  49. Wang, D.M.; Hu, Y.G.; Tang, P.X.; Liu, C.; Kong, W.H.; Jiao, J.; Kovács, K.F.; Kong, D.Z.; Lei, Y.K.; Liu, Y.P. Identification of Priority Implementation Areas and Configuration Types for Green Infrastructure Based on Ecosystem Service Demands in Metropolitan City. Int. J. Environ. Res. Public Health 2022, 19, 8191. [Google Scholar] [CrossRef]
  50. Wang, Y.; Fu, Q.; Wang, T.H.; Gao, M.F.; Chen, J.H. Multiscale Characteristics and Drivers of the Bundles of Ecosystem Service Budgets in the Su-Xi-Chang Region, China. Int. J. Environ. Res. Public Health 2022, 19, 12910. [Google Scholar] [CrossRef]
  51. Wang, C.J.; Wan, J.Z.; Zhang, Z.X.; Zhang, G.M. Identifying appropriate protected areas for endangered fern species under climate change. SpringerPlus 2016, 5, 12. [Google Scholar] [CrossRef]
  52. Kreitler, J.; Schloss, C.A.; Soong, O.; Hannah, L.; Davis, F.W. Conservation Planning for Offsetting the Impacts of Development: A Case Study of Biodiversity and Renewable Energy in the Mojave Desert. PLoS ONE 2015, 10, e0140226. [Google Scholar] [CrossRef] [PubMed]
  53. Villa, F.; Bagstad, K.J.; Voigt, B.; Johnson, G.W.; Portela, R.; Honzák, M.; Batker, D. A Methodology for Adaptable and Robust Ecosystem Services Assessment. PLoS ONE 2014, 9, e91001. [Google Scholar] [CrossRef]
  54. Popescu, V.D.; Munshaw, R.G.; Shackelford, N.; Pouzols, F.M.; Dubman, E.; Gibeau, P.; Horne, M.; Moilanen, A.; Palen, W.J. Quantifying biodiversity trade-offs in the face of widespread renewable and unconventional energy development. Sci. Rep. 2020, 10, 12. [Google Scholar] [CrossRef] [PubMed]
  55. Wu, D.F.; Mo, J.Z.; Zeng, L.C.; Zhou, P.; Xie, M.Y.; Yuan, H.B. Ecosystem services scenario simulation in Guangzhou based on the FLUS-InVEST model. Sci. Rep. 2025, 15, 18. [Google Scholar] [CrossRef] [PubMed]
  56. Cao, W.J.; Jia, G.X.; Yang, Q.K.; Sun, H.Y.; Wang, L.X.; Svenning, J.C.; Wen, L. Construction of ecological network and its temporal and spatial evolution characteristics: A case study of Ulanqab. Ecol. Indic. 2024, 166, 10. [Google Scholar] [CrossRef]
  57. Sun, D.L.; Wu, X.Q.; Wen, H.J.; Ma, X.L.; Zhang, F.T.; Ji, Q.; Zhang, J.L. Ecological Security Pattern based on XGBoost-MCR model: A case study of the Three Gorges Reservoir Region. J. Clean. Prod. 2024, 470, 143252. [Google Scholar] [CrossRef]
  58. Fan, J.Y.; Liu, S.L.; Wang, W.T.; Li, Y.T.; Zhao, Y.F.; Wu, G. Quantifying the ecological network dynamics associated with ecological restoration projects: A case study in Southwest China. Glob. Ecol. Conserv. 2025, 62, 16. [Google Scholar] [CrossRef]
  59. Hu, L.H.; Xie, Y.M.; Liu, Y.Z.; Chen, S.Y.; Yu, H.F.; Bie, Q.L.; Zhao, F.; Zhao, Y.L. Mapping the primary factors driving spatiotemporal variations of surface soil moisture in the Yellow River Basin of China. Sci. Rep. 2025, 15, 17. [Google Scholar] [CrossRef]
  60. Chen, Y.; Liu, Y.L.; Yang, S.F.; Liu, C.W. Impact of Land-Use Change on Ecosystem Services in the Wuling Mountains from a Transport Development Perspective. Int. J. Environ. Res. Public Health 2023, 20, 1323. [Google Scholar] [CrossRef]
  61. Bandyopadhyay, S.; Maiti, S.K. Steering restoration of coal mining degraded ecosystem to achieve sustainable development goal-13 (climate action): United Nations decade of ecosystem restoration (2021–2030). Environ. Sci. Pollut. Res. 2022, 29, 88383–88409. [Google Scholar] [CrossRef]
  62. Shi, H.Q.; Zheng, F.L.; Zhao, T.; Xu, X.M.; Liu, G. Impacts of straw mulching in longitudinal furrows on hillslope soil erosion and deposition in the Chinese Mollisol region. Soil. Tillage Res. 2024, 243, 11. [Google Scholar] [CrossRef]
  63. Lintunen, A.; Preisler, Y.; Oz, I.; Yakir, D.; Vesala, T.; Hölttä, T. Bark Transpiration Rates Can Reach Needle Transpiration Rates Under Dry Conditions in a Semi-arid Forest. Front. Plant Sci. 2021, 12, 16. [Google Scholar] [CrossRef]
  64. Liu, R.; Wang, Y.X.; Zhang, Y.; Peng, Z.X.; Chen, H.K.; Li, X.; Li, H.; Li, W.Y. Analysis of the city-scale wind environment and detection of ventilation corridors in high-density metropolitan areas based on CFD method. Urban. Clim. 2025, 59, 14. [Google Scholar] [CrossRef]
  65. Tianjiao, F.; Mingxin, J.; Yixin, W.; Dong, W.; Zhiming, X.; Huijie, X.; Junran, L. Impact of farmland shelterbelt patterns on soil properties, nutrient storage, and ecosystem functions in desert oasis ecotones of Hetao irrigated areas, China. Catena 2023, 225, 14. [Google Scholar] [CrossRef]
  66. Yu, Z.W.; Chen, J.Q.; Chen, J.K.; Zhan, W.F.; Wang, C.H.; Ma, W.J.; Yao, X.H.; Zhou, S.Q.; Zhu, K.; Sun, R.H. Enhanced observations from an optimized soil-canopy-photosynthesis and energy flux model revealed evapotranspiration-shading cooling dynamics of urban vegetation during extreme heat. Remote Sens. Environ. 2024, 305, 15. [Google Scholar] [CrossRef]
  67. Zhang, M.R.; Xu, Y.; Wang, J.; Hu, J.Z.; Qi, S.T.; Jiang, Z.W.; Yang, S.H. Impact of biochar on the antibiotic resistome and associated microbial functions in rhizosphere and bulk soil in water-saving and flooding irrigated paddy fields. Environ. Pollut. 2024, 342, 12. [Google Scholar] [CrossRef]
  68. Adhikari, Y.; Bachstein, N.; Gohr, C.; Blumröder, J.S.; Meier, C.; Ibisch, P.L. Old-growth beech forests in Germany as cool islands in a warming landscape. Sci. Rep. 2024, 14, 14. [Google Scholar] [CrossRef]
  69. Wang, M.; Qin, K.T.; Jia, Y.H.; Yuan, X.H.; Yang, S.Q. Land Use Transition and Eco-Environmental Effects in Karst Mountain Area Based on Production-Living-Ecological Space: A Case Study of Longlin Multinational Autonomous County, Southwest China. Int. J. Environ. Res. Public Health 2022, 19, 7587. [Google Scholar] [CrossRef] [PubMed]
  70. Yi, X.B.; Wang, L. Land Suitability Assessment on a Watershed of Loess Plateau Using the Analytic Hierarchy Process. PLoS ONE 2013, 8, e69498. [Google Scholar] [CrossRef]
  71. Li, G.; Yang, T.; Chen, R.; Dong, H.G.; Wu, F.; Zhan, Q.H.; Huang, J.Y.; Luo, M.X.; Wang, L. Experimental study on in-situ simulation of rainfall-induced soil erosion in forest lands converted to cash crop areas in Dabie Mountains. PLoS ONE 2025, 20, e0317889. [Google Scholar] [CrossRef] [PubMed]
  72. Yu, K.N.; Yang, C.J.; Wu, T.; Zhai, Y.F.; Tian, S.X.; Feng, Y.Q. Analysis of vegetation coverage changes and driving forces in the source region of the yellow river. Sci. Rep. 2025, 15, 17. [Google Scholar] [CrossRef] [PubMed]
  73. Li, G.C.; Chen, W.; Zhang, X.P.; Yang, Z.; Bi, P.S.; Wang, Z. Ecosystem Service Values in the Dongting Lake Eco-Economic Zone and the Synergistic Impact of Its Driving Factors. Int. J. Environ. Res. Public Health 2022, 19, 3121. [Google Scholar] [CrossRef]
  74. Hu, H.; Tao, Y.C.; Zhang, H.; Zhao, Y.Q.; Lan, Y.D.; Ge, Z.H. Experimental study on the influence of longitudinal slope on airflow-dust migration behavior after tunnel blasting. Sci. Rep. 2023, 13, 18. [Google Scholar] [CrossRef] [PubMed]
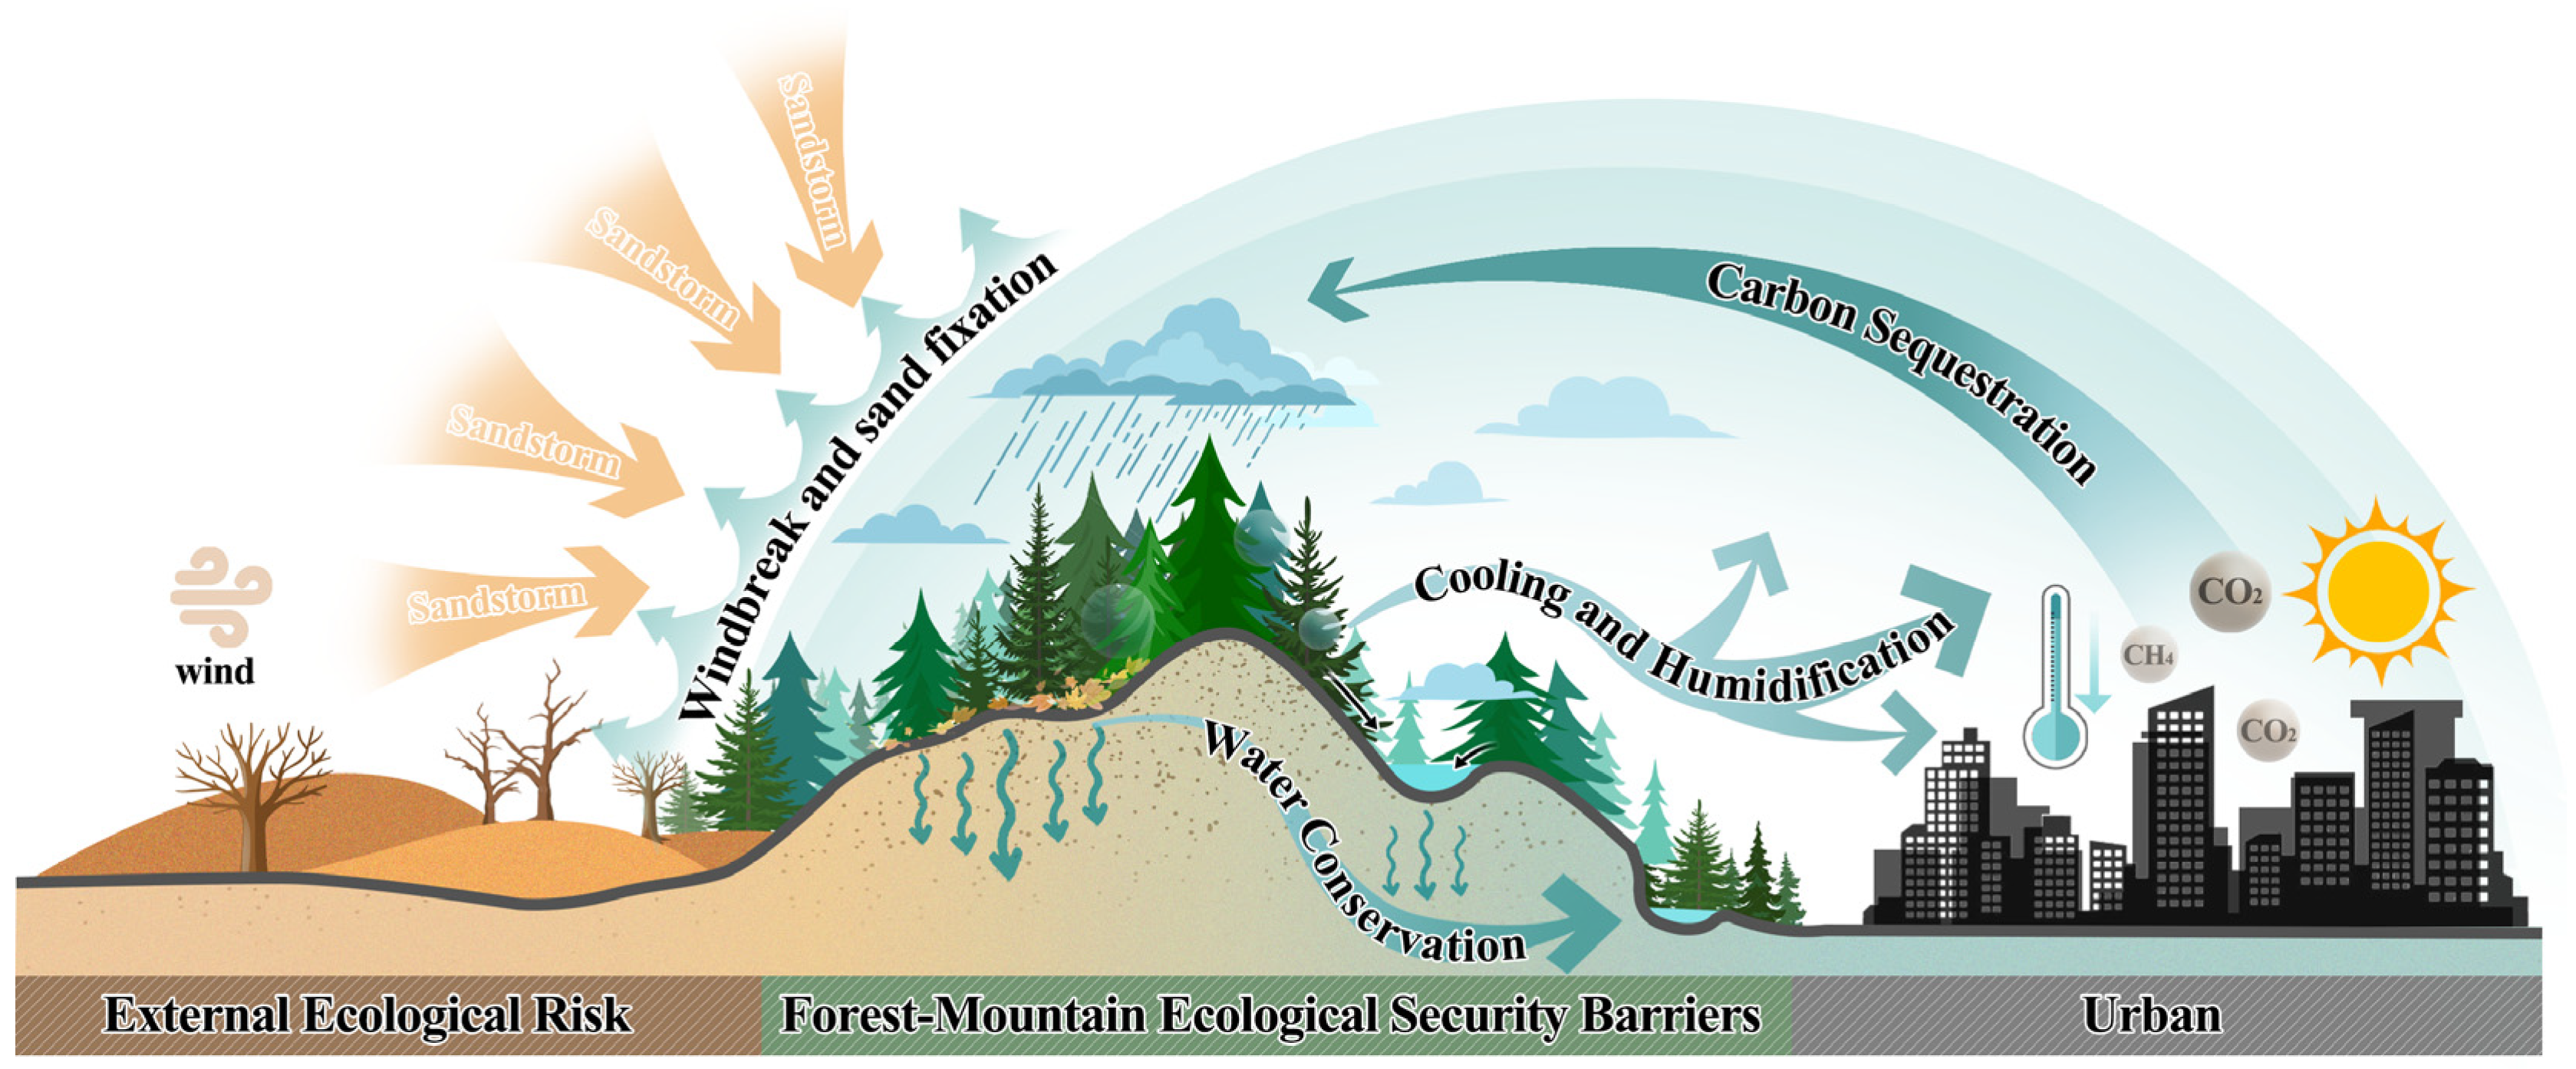
Figure 1. Conceptual Diagram of Functional Roles in Forest-Mountain Ecological Security Barriers.
Forests 16 01625 g001
Figure 2. Study Area Map.
Forests 16 01625 g002
Figure 3. Method Flowchart.
Forests 16 01625 g003
Figure 4. Identification of Risk Corridors, Corridor Pinch Points, and Barriers.
Forests 16 01625 g004
Figure 5. Analysis of the Influence Mechanism of Risk Corridor Pinch Points and Barriers.
Forests 16 01625 g005
Figure 6. Estimation of Supply and Demand for Key Ecosystem Services.
Forests 16 01625 g006
Figure 7. Identification of Supply Corridors, Corridor Pinch Points, and Barriers.
Forests 16 01625 g007
Figure 8. Analysis of the Influence Mechanism of Supply Corridor Pinch Points and Barriers.
Forests 16 01625 g008
Figure 9. Proportion of Land Use Types at Key Nodes.
Forests 16 01625 g009
Table 1. Soil Wind Erosion Model Calculation Formula.
FormulasMarginal Notes
S R = S L p o t e n t i a l l y S L S L p o t e n t i a l l y S L denotes soil wind erosion rate; Q m a x represents maximum sand transport rate (kg/m); S indicates critical plot length (m); z signifies maximum downwind erosion distance (m); W F is the weather factor (kg/m); K r denotes surface roughness factor; E F denotes soil erosivity factor; S C F denotes the soil crusting factor; C denotes the FVC factor.
  S L = 2 · z S 2 Q M A X · e ( z / s ) 2
S = 150.71 · ( W F × E F × S C F × K × C ) 0.3711
Q m a x = 109.8 × W F × E F × S C F × K × C
S L p o t e n t i a l l y = 2 · z S 2 Q M A X p o t e n t i a l l y · e ( z / s p o t e n t i a l l y ) 2 S L p o t e n t i a l l y potentially represents the maximum potential wind erosion rate; Q M A X p o t e n t i a l l y denotes the maximum potential sand transport rate (kg/m)
Q M A X p o t e n t i a l l y = 109.8 × W F × E F × S C F × K
S p o t e n t i a l l y = 150.71 ( W F × E F × S C F × K × C ) 0.3711
Disclaimer/Publisher’s Note: The statements, opinions and data contained in all publications are solely those of the individual author(s) and contributor(s) and not of MDPI and/or the editor(s). MDPI and/or the editor(s) disclaim responsibility for any injury to people or property resulting from any ideas, methods, instructions or products referred to in the content.