Abstract
Stand density is one among a multitude of factors impacting the growth of trees and their responses to climatic variables, but its effect on wood quality at the scale of anatomical structure is hardly investigated. Therefore, we analyzed the radial growth and wood structure of Siberian spruce (Picea obovata Ledeb.) and Scots pine (Pinus sylvestris L.) in an experimental conifer plantation with a wide gradient of stand density in the Siberian southern taiga. The measured and indexed chronologies of the tree-ring width (TRW), number of tracheid cells per radial row in the ring produced in the cambial zone (N), cell radial diameter (D), and cell wall thickness (CWT) demonstrated the influence of the planting density. The TRW and N have a negative allometric dependence on the stand density (R2 = 0.75–0.88), likely due to competition for resources. The consistent negative dependence of the D on the stand density (R2 = 0.85–0.97) is log-linear and also seems to be related to tree size, while the CWT is not significantly dependent on the stand density. These findings can be used as insights in regulating cellular structure and procuring desired wood quality by silvicultural means. Both conifer species have similar climatic reactions. We observed significant suppression of TRW and D related to water deficit in May–July (both species), as well as frosty (more for pine) and low-snow (for spruce) conditions in winters, as shown by both dendroclimatic correlation and pointer year analysis. Temporal shifts in the climatic responses indicate later transition to latewood and growth cessation in sparse stands, especially in spruce. Better performance was observed in sparce and medium-density stands for both species.
1. Introduction
Wood, by its nature, has a rather complex structure characterized by the variability of numerous anatomical, chemical, and physical-mechanical traits [1,2,3,4,5]. For the optimal use of wood in various industries, a clear understanding of how and its quality is determined and what it is determined by is necessary, but there are still more than enough “blank spots” regarding this knowledge [6,7,8,9]. This is due, first of all, to a large range of factors affecting both the tree growth and the properties of developing wood [3,10,11,12,13].
Competition between neighboring trees often has as much of an influence on the tree growth and wood structure as climatic variables [9,14,15]. At the same time, regulation of stand density is one of the important forest management measures used to control wood production and quality [16,17]. However, studies of the effects of stand density have yielded mixed and even contradictory results, so there is still no clear understanding, for example, of how responses of trees and stands to climate fluctuations and change depend on stand density [9,18,19]. Some studies have indicated that wood quality may suffer as a result of changes in tree growth rate with a decrease in stand density [16,20,21,22]. Others argued that stand density regulates the rate of cell production but does not affect wood properties [23,24]. Some others have demonstrated that the distance between trees affects their growth rate, wood density, and the anatomical traits of its cells [6,25]. At the same time, the observed differences in these patterns between populations may develop as a result of both genetic adaptation and phenotypic acclimatization to changing environmental conditions [26,27,28,29]. In any case, there is no single optimal initial or current stand density because, after all, the environment and the adaptation to it are very diverse and dynamic in nature [17,30].
As a rule, the studies of wood traits’ dependence on stand density are aimed at studying the dynamics of inventory indicators, such as tree height, diameter, wood stock, etc., or macroscopic technological wood properties, including wood density, mechanical strength, wood fiber size, etc. [3,13,16,31,32,33,34,35]. The studies of the effect of stand density on the anatomical traits of wood are very limited, mainly due to the labor intensity of conducting measurements [6,35,36,37,38,39]. At the same time, it is the indicators of the anatomical traits of wood that underlie its technological qualities [1,40,41]. The effect of the distance between trees in a stand on the anatomical indicators of wood can be species-specific in nature [42]. Therefore, establishing accurate relationships between stand density, tree growth, and anatomical wood traits for various species and regions (or even habitat conditions) will contribute to making more informed decisions on regulating planting density for specific end products and goals.
Stand density effects on wood anatomical traits in boreal conifers remain poorly understood due to the lack of particular studies. To fill this knowledge gap, we used data from a 40-year-old experimental plantation in Central Siberia, including Siberian spruce (Picea obovata Ledeb.) and Scots pine (Pinus sylvestris L.). This silvicultural experiment was unique in terms of observing natural growth of even-aged single-species forest stands planted with a fine gradient of 18 density values in a homogenous environment. This allowed us to grasp differences between stands due to planting density. In addition, these conifer species have contrasting ecophysiological qualities (e.g., requirements regarding their water and light supply) and are important for forest management, as they are key species across wide forest areas.
In this study, we addressed several research questions: (1) does planting density affect basic traits of wood tracheids and functional traits of xylem as a water-conducting tissue in spruce and pine; (2) does planting density affect plastic responses of the wood anatomy of these species to climatic variables; (3) if these influences do exist, are they species-specific; and (4) are there differences between the impacts of planting density on tree radial growth and those on wood anatomical traits.
2. Materials and Methods
2.1. Study Area, Plant Material, and Climatic Data
This study was conducted in the southern taiga subzone of Central Siberia (Bolshemurtinsky district of Krasnoyarsk territory). In the region, coniferous forests with an admixture of angiosperm species predominate on weakly dissected plains. The climate of the study area is continental, which is notable for its large-amplitude temperature fluctuations [43,44] (Figure 1a).
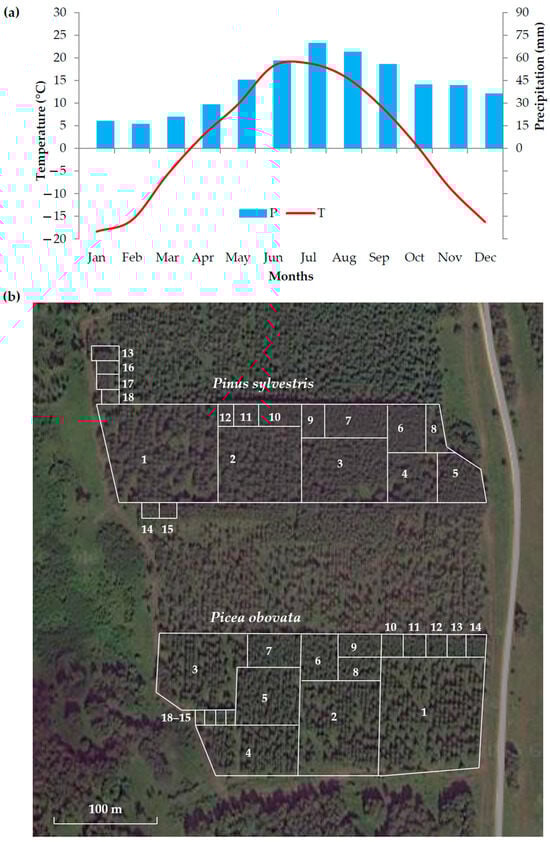
Figure 1.
The study area: (a) monthly average temperatures (T) and precipitation (P) for 2000–2020 in the study area including experimental plantation, according to the Climatic Research Unit Time-Series version 4.04 high-resolution gridded data of month-by-month variation in climate (CRUTS v. 4.04); (b) layout of plots with different planting densities for Pinus sylvestris L. (1–18) and Picea obovata Ledeb. (1–18) in the experimental plantation.
Due to the absence of weather stations within 100 km from the sampling site, the climate of the study area was assessed based on a spatially distributed high-resolution gridded dataset of month-by-month variation in climate: Climatic Research Unit Time-Series (CRU TS version 4.04; https://climexp.knmi.nl, accessed on 18 August 2025). We used the monthly precipitation (P) and average temperature (T) for coordinates 57–57.5° N 93–93.5° E for the period 2000–2020. Due to small elevation differences, these data are representative for the study area, despite less accurately reflecting small-scale meteorological variation at the sampling site than local weather station data would. The average annual temperatures over the investigated period were +1 °C, with 500 mm of annual precipitation. The warmest month was July (+18.8 °C), the coldest was January (−18.4 °C), and the warm period with T > +5 °C lasted on average from May to September. Precipitation fell mainly in the warm period (~60% of the annual amount), with the maximum precipitation occurring in July (70 mm).
The sampling site is an experimental plantation of several conifers, including Siberian spruce (Picea obovata, PO) and Scots pine (Pinus sylvestris, PS), established near the Talovka Village, Bolshemurtinsky District, Krasnoyarsk Krai, Russia (57°12′18″ N 93°08′36″ E, 240 m a.s.l.) [45,46,47] (Figure 1b). In 1982, two-year-old seedlings were planted on gray forest soils in uniform forest growth conditions following a square scheme of plots and using 18 planting density options (DENS0 = 500–128,000 trees/ha). At least 500 individuals were planted for each option. All seed material was obtained from local provenances, and seedlings of similar height and stem diameter were selected for planting, maximizing homogeneity of material. As a result, differences in tree traits between plots should be related mainly to ontogenetic processes and to phenotypical responses to weather conditions and different stand densities.
Afterwards, the plantation was not thinned artificially but naturally underwent a self-thinning process. During the last inventory in 2015, the survival rate was 12%–70% for spruce and 9%–67% for pine, decreasing in densely planted plots but not disturbing the gradient of stand density; more detailed data on the stand density dynamics from three inventories (2000, 2005, 2015) were presented in earlier studies [48,49].
At the time of sampling, each plot represented even-aged forest stand with relatively homogenous stand density. Wood samples (cores) of Siberian spruce and Scots pine were sampled at all plots in 2020: 10 double cores (opposite radii) per plot were collected from randomly selected dominant trees at the height of ~0.5 m from the ground, excluding marginal rows of trees. Collection of cores closer to the ground than the usual ~1.3 m was conducted to maximize cambial age of samples; however, even so, juvenile wood and injuries of saplings by frost limited available anatomical data.
Since anatomical measurements are very labor-intensive, we used only five cores from different trees per plot in six pine plots (PS2, PS5, PS7, PS11, PS14, and PS17) and six spruce plots (PO2, PO5, PO8, PO11, PO14, and PO17) with respective planting densities of 0.75 (PS2 and PO2), 2 (PS5 and PO5), 4 (PS7), 6 (PO8), 12 (PS11 and PO11), 36 (PS14 and PO14), and 96 (PS17 and PO17) thousand trees per hectare. Such a relatively evenly distanced (in log scale) selection of plots allowed us to cover most of the planting density gradient of the plantation despite some plots being omitted.
2.2. Sampling, Measurement, and Processing of Tree-Ring Data
Collection and subsequent processing of cores were carried out using standard dendrochronology methods [50]. The tree-ring width (TRW) series were measured on the LINTAB 5 tool (Rinntech, Heidelberg, Germany) using the TSAPWin program (version 4.69h, Rinntech, Heidelberg, Germany) [51]. Cross-dating was checked in the COFECHA program (version 6.06P, by Richard L. Holmes) [52].
The next step was to obtain cross-sections with a thickness of ~15–20 μm from cores, using a rotary microtome MicromHM 340E (Thermo Fisher Scientific, Waltham, MA, USA). Sections were stained with 1% safranin and astra blue, dehydrated in increasing concentrations of ethanol, and mounted on glass slides in glycerol. High-resolution microphotographs at 400x magnification were taken using an optical microscope BX43 (Olympus, Tokyo, Japan) and a digital camera, ProgRes Gryphax Subra (Jenoptik, Jena, Germany).
In these microphotographs, the production of tracheid cells in the cambial zone, that is, the number of tracheids per radial row in the ring produced in the cambial zone (N), their radial diameter (D), and cell wall thickness (CWT) [3,53,54], were measured in the radial direction in each ring using the Lineyka program (version 2.03, by Pavel P. Silkin) [55] (Figure A1a) in five radial rows of tracheids [56]. In order to be able to average the data for radial rows with different cell numbers, a procedure was used to normalize the tracheidograms (rows of measurements) of D and CWT, in which they were compressed or stretched to the same number of cells in the ring [57], averaged over the five measured radial rows of tracheids. After normalization, the tracheidograms of all five rows were averaged in each ring, with outliers being suppressed.
Then, for each ring, the maximum and arithmetic mean values Dmax, Dmean, CWTmax, and CWTmean (Figure A1b) were calculated from the averaged tracheidograms, as well as the tree-ring width TRW = ΣD, which was used to align the dating of the anatomical data with the TRW series of the same core measured on LINTAB. After that, long-term series were used for these mean and maximum indicators for each individual tree and averaged at each plot to develop plot chronologies.
In total, more than 200,000 tracheids were measured in spruce and more than 170,000 tracheids in pine (Table A1). The measurements were limited to the period from 2000 to 2020, since, before 2000, tree rings of both species often contained anomalies that made measurements difficult, primarily frost rings. It should also be taken into account that the first rings from the core, mostly before 2000, contain juvenile wood with D and CWT values that are quite different from those of mature wood [58,59]. Plot chronologies showing some trends in the early 2000s are demonstrated in Figure A2.
In order to evaluate the functional traits of wood based on its basic anatomical measurements, previously known patterns were used. For example, the hydraulic conductivity of wood cells (vessels or tracheids) is proportional to the fourth power of their effective hydraulic diameter [60], i.e., the internal diameter of a circular cross-section with equal conductivity. The highest conductivity is exhibited by earlywood tracheids with the maximum lumen, where CWT is minimal and less variable. Therefore, the hydraulic diameter of the largest cells, which has the greatest contribution to the overall xylem conductivity, will be closely related to their external radial (Dmax) and tangential (TD) diameters. It should also be taken into account that the TD, in principle, changes little within the entire forest stand and lifespan of trees, and, therefore, the hydraulic conductivity, as a first approximation, is proportional to the second power of Dmax.
Another important function of wood is mechanical strength, which is related to wood density. Therefore, we used the estimation of wood density (ρ) from anatomical cell traits, calculated by the following equation for each cell of the normalized tracheidogram:
where ρ0 = 1500 kg/m3 is the average wood matter density [61], and TD = 30 μm is the average estimate of the tangential diameter of tracheids. Since strength is provided primarily by small and thick-walled cells of latewood, we were interested in the maximum value of wood density in the ring ρmax, which was obtained from its tracheidograms. To estimate the functional wood traits, such as indicators of maximum hydraulic conductivity (Dmax2) and mechanical strength of wood (ρmax), their individual series for 2000–2020 and chronologies averaged per plot (not indexed) were calculated.
ρ = ρ0 (D × TD – (D − 2CWT) (TD − 2CWT)/D × TD)
2.3. Processing of Series of Tree-Ring Traits
Measured series of TRW and anatomical traits for individual trees were averaged over the bi-weighted mean per plots in the ARSTAN program (version 41d, by Edward R. Cook, Paul. J. Krusic) [62] to obtain local measured chronologies.
To calculate long-term trends in the series of tree-ring traits associated with the size–age dynamics of trees and the stand dynamics, smoothing spline covering 67% of the series length was used for individual series. Then, these trends were removed by division of raw series by trend values, and indexed individual series and averaged plot chronologies of all considered tree-ring traits were obtained. These procedures were also carried out using ARSTAN.
To compare the anatomical structure of trees in positive and negative pointer years (two years with maximum and two years with minimum growth indices for both species, respectively), an alternative normalization of all tracheidograms to N = 30 cells was carried out, and the average long-term tracheidograms of each individual tree were calculated over the entire 2000–2020 period. Then, for each pointer year, the relative deviation (in %) of D and CWT from the average long-term values was obtained for each cell from the 1st to the 30th cell. This was done to (1) make the non-indexed dataset from several individual trees dataset more homogenous, (2) eliminate the innate pattern of earlywood-to-latewood transition and respective dynamics of tracheid traits in the ring, and (3) highlight the impact of particular stressful seasons. Values averaged per plot were used to demonstrate common patterns, but individual trees’ datasets were used to analyze significance of deviation.
2.4. Statistical Methods
Paired Pearson correlation coefficients and linear regression models were used to analyze the relationships of wood traits among themselves and with planting density. In this case, taking into account the possible allometric nature of the relationships with planting density [63,64], logarithmic transformation of dependent and/or independent variables was used in the models if this increased their fitness.
ANOVA was used to compare the significance of differences between plots in values of TRW, basic anatomical measurements, and wood functional performance traits.
The climate responses of the indexed local chronologies of TRW and mean and max values of D and CWT were estimated by paired Pearson correlation coefficients with monthly series of temperature and precipitation for the seasonal interval from September of the previous year to August of the current year. The significance levels of the correlation coefficients were assessed using a two-tailed t-test. However, due to the relatively short duration of the climate response analysis (21 years) questioning its reliability and requiring a relatively high correlation coefficient for statistical significance (threshold of |r| ≥ 0.433 is required at p < 0.05), its results should be treated with caution.
In addition, since we used standard and not residual tree-ring chronologies, it should be taken into account that autocorrelation can impact results of any dendroclimatic analysis. However, most of the TRW and anatomical chronologies that were used had first-order autocorrelation that was not significant at p < 0.05, while all significant autocorrelation values were negative (Table A2). The same pattern was observed for monthly temperature and precipitation, with values from −0.25 to 0.20 (all insignificant) for temperatures and from −0.53 to 0.27 (significant in February) for precipitation.
Therefore, we additionally analyzed the pointer years, when TRW indices, averaged over all considered plot chronologies (six for spruce and six for pine), were in the top and bottom 10% of the studied interval of 2000–2020, i.e., two years of each type. Positive pointer years represent fast growth of both conifers under favorable weather conditions, and negative pointer years represent repressed growth under stressful conditions. Significance of differences in anatomical structure between pointer years of the opposite nature were estimated by two-tailed t-test for means between two samples of 10 values (5 trees, 2 years), for relative deviation of each cell trait (D and CWT) and for each normalized cell (1st to 30th).
Aside from the measurements being cross-dated with the help of COFECHA and indexed/averaged in ARSTAN, all other calculations and statistical analysis were conducted using Microsoft Excel (version 2007, Microsoft Corporation, Redmond, WA, USA).
3. Results
3.1. Relationships Between Chronologies of Tree-Ring Traits
The indexing by trend removal allowed us to identify high-frequency fluctuations that are largely common among stands of different densities. The indexed TRW chronologies of both species showed a very high synchronicity between plots, with the exception of the first few years (Figure 2a). Over 2000–2020, the indexed chronologies of spruce had correlation values of 0.58–0.87 between plots and 0.74 on average, and all were significant at p < 0.05; for pine they were in the range of 0.35–0.90 and 0.67 on average, and all were significant, except for the relationships between the chronology of the sparsest stand (PS2) and the chronologies of dense stands (Figure 2b). Interspecific correlations between TRW chronologies were lower; however, they were also all positive (0.02–0.80), and the average correlation was 0.44. Closer and more significant correlations were observed between plots with higher planting densities. For both compared species, the lowest indexed TRW was recorded in 2012 and 2019. Common growth maxima were observed in 2002 and 2007; fast growth was also observed in 2015–2016 and 2020, but was less pronounced for one or the other of the species.
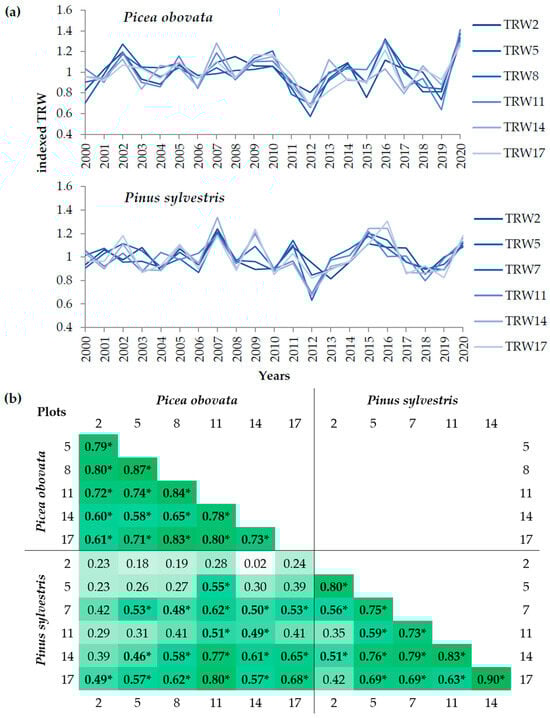
Figure 2.
Indexed tree-ring width (TRW) of the studied species: (a) growth dynamics of TRW at plots 2, 5, 8, 11, 14, and 17 for Picea obovata and plots 2, 5, 7, 11, 14, and 17 for Pinus sylvestris with different planting densities for the years 2000–2020; (b) heat map of pairwise correlations between local chronologies of indexed TRW of the studied plots over 2000–2020. The values of correlation coefficients significant at p < 0.05 are highlighted in bold and marked by *, and the color intensity reflects the values of the correlation coefficients.
Consideration of the inter-plot correlation pattern for indexed chronologies of anatomical traits revealed that, for both species, they gradually decreased from TRW to D to CWT. It is noticeable on the graphs of the indexed D (Figure 3) that they were highly synchronous at all plots in both species. This is confirmed by the very high between-plot correlations for spruce: 0.41–0.88, 0.70 on average for Dmax and 0.72 for Dmean. Slightly lower correlations were observed in the D of pine: 0.16–0.82 in general for both D variables, 0.49 on average for Dmax, and 0.61 for Dmean. On the graphs of the CWT, the synchronicity between plots was lesser: the between-plot correlations were 0.11–0.91, 0.53 on average for CWTmax and 0.57 for CWTmean for spruce; 0.00–0.80 in general and 0.42 on average for both CWTmax and CWTmean for pine. The least synchronous plot chronologies were at the opposite ends of the planting density gradient (plots 2 and 17).
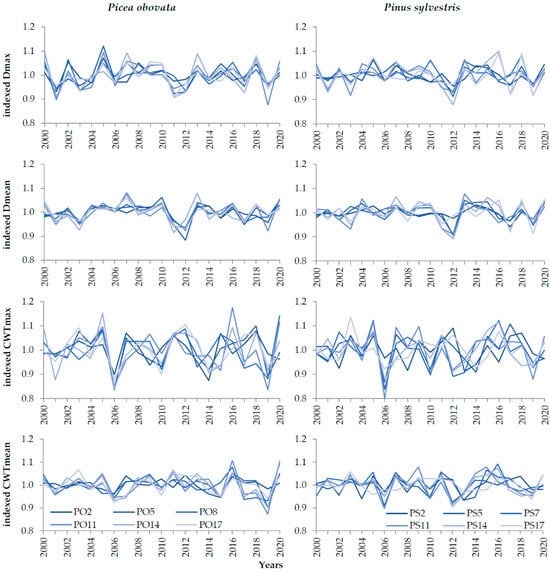
Figure 3.
Dynamics of indexed mean and maximum cell radial diameter (D) and cell wall thickness (CWT) at plots of Picea obovata (PO2, PO5, PO8, PO11, PO14, and PO17) and Pinus sylvestris (PS2, PS5, PS7, PS11, PS14, and PS17) with different planting densities over 2000–2020.
As for interrelations between tree-ring traits, the TRW apparently was very close to being directly proportional to the N at all considered scales. The relationship between the average long-term values of the TRW and N for each plot was almost linear in both species, considering the extremely high coefficient of determination of corresponding linear regression (0.998–0.999) (Figure 4a). When investigating the relationship of these traits for the entire dataset of measured tree rings, the coefficient of determination was only slightly lower (0.976–0.983) (Figure 4b), and, for separate plots, it fluctuated in the range of 0.936–0.984 (Figure 4c). With an increase in planting density, the slope of the linear model for individual plots gradually decreased, but in all cases the free term was insignificant and close to zero.
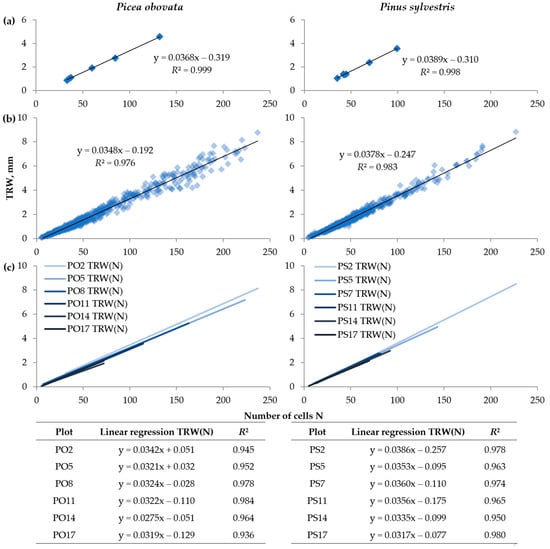
Figure 4.
The relationship between tree-ring width (TRW) and the number of cells (N): (a) models based on average values for each plot, (b) linear regression models based on individual tree rings in all plots, (c) linear regression models calculated separately for plots of Picea obovata (PO2, PO5, PO8, PO11, PO14, and PO17) and Pinus sylvestris (PS2, PS5, PS7, PS11, PS14, and PS17) with various planting densities; equations are presented in the table below the graphs.
Correlation analysis was also conducted between the tree-ring traits depending on the species and planting density (Table 1). It revealed the following: (1) cell radial diameter variables were more closely related to radial growth, (2) all anatomical traits had common variation with the TRW after removal of the long-term trends at least at some plots (with tendency of stronger relations in denser stands), and (3) the mean and maximal values of the same cell measurement were positively related.

Table 1.
Correlations between tree-ring traits depending on the species and planting density at the plots of Picea obovata (PO2, PO5, PO8, PO11, PO14, and PO17) and Pinus sylvestris (PS2, PS5, PS7, PS11, PS14, and PS17).
The cell radial diameter variables Dmax and Dmean were positively and mostly significantly correlated with the TRW in both species. These correlations were higher in dense stands, both raw and indexed. The correlations of the CWT and TRW were lower and had both positive and negative values; after indexing, more positive and mostly significant correlations were observed.
The maximum and average values of the D (Dmax and Dmean) or CWT (CWTmax and CWTmean) were closely related in both species; all correlations were positive and mostly significant. The correlations of Dmax and Dmean with CWTmax and CWTmean showed lower and insignificant values, and both positive and negative correlations were observed.
It should also be noted that, although Dmax and Dmean had a positive correlation with the N in trees at plots of different planting densities, which was well described by linear functions (Figure A3a, R2 = 0.59–0.95), its nonlinearity is visible in the scatter plots (Figure A3b). The strengthening of this correlation was found in the narrow rings, and less variable values of Dmean and Dmax were observed in wide rings.
3.2. Dependence of Tree-Ring Traits on Planting Density
Linear regression analysis (with logarithmic transformation where necessary) revealed similar patterns of influence of the planting density on tree-ring traits in both species, but the type of relationship depended on the nature of the tree-ring trait. The relationship of the TRW and N (growth measures) with the planting density was negative and close to a linear function in the log-log scale (R2 = 0.746–0.879), i.e., it followed a well-known allometric pattern (Figure 5a). For Dmax and Dmean, this dependence was also negative but close to log-linear (linear function of the logarithm of planting density): R2 = 0.850–0.893 for spruce and R2 = 0.930–0.969 for pine (Figure 5b). The relationship for the CWT was not significant in both species (R2 < 0.21) (Figure 5c).
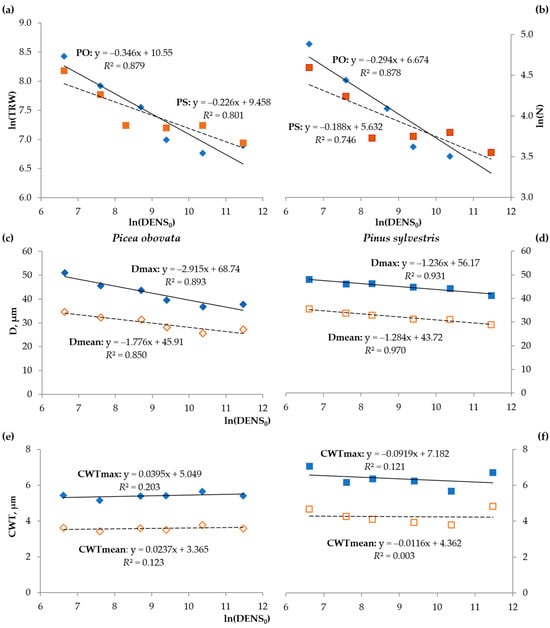
Figure 5.
Dependence of the average long-term values of the tree-ring traits on the log-transformed planting density: tree-ring width (TRW) (a) and number of cells in the radial row (N) (b) for spruce (PO) and pine (PS); cell radial diameter (D) for spruce (c) and pine (d); cell wall thickness (CWT) for spruce (e) and pine (f).
ANOVA analysis also showed significant differences and certain patterns in the average values of quantitative tracheid cell structural (N, Dmean, Dmax, CWTmean, and CWTmax) and functional (Dmax2 and ρmax) traits between plots with different planting densities (Table 2). In both species, the N and D decreased with an increase in planting density, but there was no clear pattern regarding the CWT.
Table 2.
Mean values and variability (mean ± SD) of cell structural (N, Dmean, Dmax, CWTmean, and CWTmax) and functional (Dmax2 and ρmax) traits at plots of Picea obovata (PO) and Pinus sylvestris (PS).
With regard to the functional wood traits, spruce showed a significant decrease in Dmax2 with an increasing planting density. In pine, Dmax2 varied less between plots of different planting densities than in spruce. It should be noted that, according to the latest inventory conducted in 2015, the difference in average tree height between the plots with lowest and highest planting densities was 3.8 m for spruce (14.2 and 10.4 m at plots PO2 and PO17, respectively), but only 1.2 m for pine (15.0 and 13.8 m at plots PS2 and PS17, respectively). In the first year of the anatomical analysis period, in 2000, this difference was 0.8 m for spruce (5.9 and 5.1 m) and 0.3 m for pine (7.8 and 7.5 m).
There were no significant trends or patterns in the dynamics of ρmax in spruce, while there was a slight tendency for it to increase in pine, although it was not a clearly linear trend.
Comparison of the average long-term tracheidograms (Figure A4) showed that, in both species, the decrease in D with increases in the planting density was observed throughout all of the ring, with this trend being most pronounced in the transitional wood and beginning of latewood (the zone where D decreases and CWT increases). As for the dependence of the CWT on the planting density, in spruce, the weak decreasing trend of the CWT in earlywood was replaced by the opposite trend in the transition wood and latewood. In pine, the decrease in CWT with increases in planting density was also more pronounced in earlywood and disrupted in latewood.
3.3. Dendroclimatic Analysis and Comparison of Pointer Years
The climate response of the radial growth of both conifers was analyzed by correlations of TRW chronologies with the monthly and seasonal temperature and precipitation. It should be noted that the number of statistically significant correlations was small (Figure 6). For the TRW, the correlations closely follow the results of analysis performed over longer periods of 1988–2020 for pine and 1992–2020 for spruce (29–33 years long; those are respective common periods for TRW chronologies among all plots) [48,49]. However, we decided to consider the period 2000–2020 for all tree-ring traits indiscriminately in this article to ensure that all of them were under the impact of the same climatic fluctuations, to make their responses more easily comparable, and to unify the reliability of correlations for TRW and anatomical traits.
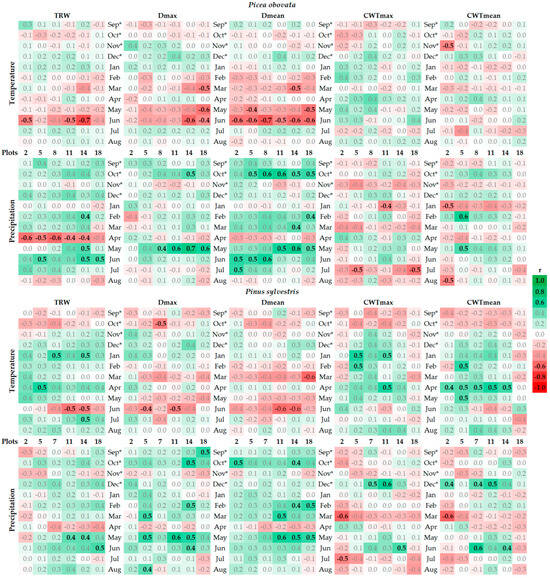
Figure 6.
Correlations of indexed local tree-ring width (TRW), maximum (Dmax) and mean (Dmean) radial cell diameter (D), and maximum (CWTmax) and mean (CWTmean) cell wall thickness (CWT) with monthly temperature and precipitation series. * Months of the year preceding tree-ring formation. Green and red colors depict positive and negative correlations, respectively, with color intensity reflecting the absolute value of the correlation (see legend). Correlations significant at p < 0.05 are highlighted by bold black font.
In general, the climate response of pine and spruce radial growth follows patterns of damage by the most severe winter frosts and mild growth limitation by water stress. Both species show a negative response to June temperature (correlations were up to −0.70 for spruce and −0.54 for pine) and a positive response to May–July precipitation (correlations were 0.41–0.62 over three months for spruce and 0.51–0.55 over May–June in three dense stands of pine). In April, precipitation negatively correlated with spruce growth (−0.40 to −0.59), and in the cold period, both climatic variables had a weakly positive effect on subsequent tree growth: December–March precipitation had correlations of 0.22–0.57 and 0.04–0.44 with spruce and pine growth, respectively, and November–May temperatures were positively associated (0.38–0.44) with pine growth.
Radial cell diameter variables have a climatic response that is similar to that of TRW, but their response to the temperatures and precipitation of the current vegetation season is more pronounced, especially in spruce. May–June temperatures limit (up to −0.70 and −0.57 for spruce and pine, respectively) and precipitation stimulates (up to 0.61) the Dmean and Dmax of both species. Precipitation in the previous September–October (up to 0.63 and 0.52) also contributes to the formation of large cells in the entire ring. The climatic response of the CWT includes a weakly positive response to winter temperatures and precipitation, but is less consistent and stable than the response of the D. In general, climatic reactions are more pronounced at plots of medium and high planting density (plots 7 or 8, 11, and 14).
The pointer years with growth extremes had distinctive climatic characteristics (Table 3). The years 2002 and 2007, with fast growth of both conifers, were characterized by very mild, warm, and snowy winters (November–March) and a cold June. Summer precipitation was at the average long-term level. The hot July apparently did not interfere with the growth. In the years 2012 and 2019, which had slow growth, the winters were, on the contrary, frosty and with little snow. The spring–summer period (May–August) was characterized by pronounced droughts, especially in 2012, and high temperatures. In 2012, the most unfavorable conditions were observed in June, in 2019—in May and July. In addition, a comparison of the previous year’s temperatures indicates a sharper onset of winter in negative pointer years than in positive ones, with warm conditions in October and subsequent frosts in November.
Table 3.
Temperatures (T, °C) and precipitation (P, mm) averaged over 2000–2020 and their deviations in positive (2002, 2007) and negative (2012, 2019) pointer years.
Analysis of deviation tracheidograms over pointer years (Figure 7) showed that, in years that are favorable for conifer growth, both species tend to form large cells throughout most of the ring, but mainly in its second half.
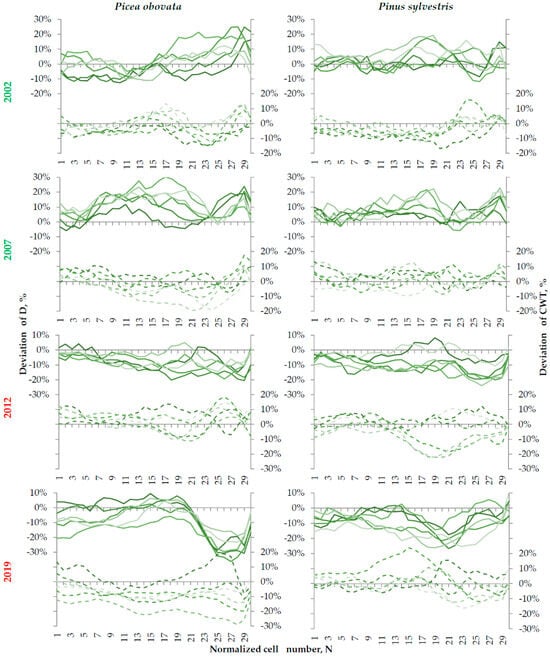
Figure 7.
Relative deviation of the radial cell diameter (D, solid lines) and cell wall thickness (CWT, dashed lines) from their average long-term tracheidograms (Figure A4) in positive (2002, 2007) and negative (2012, 2019) pointer years. The color intensity of the lines from dark to light reflects an increase in planting density.
The CWT in earlywood was usually slightly below average, but increased in the last cells of the ring (up to 20% more than the long-term average). In years with inhibited growth, spruce and pine formed small tracheids throughout the ring. An additional sharp drop in cell diameter in latewood was clearly expressed in 2019, especially in spruce. In terms of CWT, the response to unfavorable conditions was less consistent across species and plots with different planting densities; both thinner- and thicker-walled cells were found.
The significance (at p = 0.05) of differences in D between tree rings formed during positive and negative pointer years increased in dense stands, spreading over the entire ring (Table A3). However, even at low planting densities, latewood cells were significantly larger in years of fast growth. The significant differences in CWT were also observed in individual plots and zones of the ring, but did not have a consistent localization or patterns of its relationship with planting density.
4. Discussion
4.1. Relationships of Tree-Ring Traits Among Themselves and with Planting Density
The high synchronicity and commonality of year-to-year fluctuations in the growth and structure of tree rings between plots of different planting densities indicate the common limiting environmental factors. Obviously, when comparing species, this similarity is lower due to species-specific resource needs and morphological and ecophysiological traits, allowing, for example, Scots pine to more successfully withstand a lack of moisture and spruce to more successfully survive in shading and high competition for light [65,66,67]. These species may also differ in the timing of their climatic response, since the discrepancy between their phenological phases is obvious, e.g., when comparing observations of vegetative growth and reproduction, even in a common environment [68,69]. However, despite the ecophysiological differences, common climatic conditions might dictate significant similarities in growth dynamics in the most extreme manifestations, which is confirmed by the commonality of the pointer years.
As the tracheid differentiation process progresses, the correlations between plot chronologies of the respective tree-ring traits for plots of differing planting densities gradually decrease: they are the highest for TRW (being the result of tracheid production), lower for D (tracheid growth by expansion), and reach a minimum for CWT (secondary wall deposition). This means a decrease in the external influence that is common for all plots of any planting density in the given habitat conditions, as the cells differentiate. Nevertheless, the indexed chronologies show that such a common influence also exists for anatomical traits, as their extremes were recorded in the same years in all or most plots.
For all tree-ring traits, there was a common pattern: correlations between trait chronologies decrease as the difference in planting density increases. That is, the planting density still modifies the external influence, either in intensity or in the timing of its registration.
Regarding the relationship of the integral tree-ring variable TRW with the growth processes on the cell scale, it is obvious that this variable reflects the result of cambial activity, i.e., the production of tracheids (N) in the cambial zone [3,53,54]. The observed almost direct proportionality of these indicators with the exceptional linearity of the relationship between them was not affected much by the planting density, which is confirmed by comparable coefficients of determination at the scale of the plot and species. However, looking at Figure 4c, it is noticeable that the slope angle of the linear regression model TRW(N) generalized at the species scale is determined primarily by the widest rings from plots with low planting density. Therefore, a weakly expressed decrease in the numerical coefficient at N (which can be interpreted as an estimate of the average D because TRW = sum(D) = N × Dmean) with the planting density almost does not contribute to the generalized model, since it affects only rings of smaller width. Thus, it can be assumed that, for natural stands with a heterogeneous structure, the TRW(N) model will most adequately represent fast-growing and tall dominant trees with wide rings and the cell diameters that are optimal in particular growing conditions for such outstanding individuals.
The relationships between the tree-ring traits may be partly due to common size–age trends, for example, a synchronous increase in the radial growth and diameter of cells from the pith outwards in young trees [70,71,72]. However, even taking into account that these long-term trends are weakened in mature wood, their removal significantly changes the pattern of correlations. This is partly because age trends in the radial growth of spruce and pine, including these stands, are not limited to juvenile wood [48,49]. It should be emphasized that, for trees in sparse stands experiencing minimal competition for resources, the correlations between the indexed chronologies of TRW, D, and CWT are less consistent than for trees in dense stands. Apparently, this is explained by a combination of two factors: (1) the nonlinear relationship of D and CWT with N (or TRW), which has the form of a curve with saturation in wide rings upon reaching the optimal cell structure [73,74] (Figure A3b), and (2) the predominance of wide rings with an undisturbed cell structure in the sparse stands.
In addition, regarding the water conduction function and ensuring its efficiency, it should not be forgotten that the required height of water uptake (the difference between the heights of wood sampling and the top of the tree) regulates the transverse area of water-conducting elements, including the lumen diameter of earlywood tracheids in conifers [37,70,75]. It should be considered that, according to our observations, the CWT in earlywood is approximately constant and minimal. Thus, the outer radial diameter of cells (D) depends on tree height similarly to the lumen radial diameter, whether it is Dmax (making the most contribution to the water conductivity of wood) or, to a lesser extent, Dmean. Another notable possible pattern is a shift in the latewood ratio through regulation of cambial phenology, leading to respective changes in the mean values of D and CWT. Differences between plots in the timeframe of the response to climatic variables for the latewood ratio [48,49] and anatomical traits support this hypothesis. In particular, an increase in the ratio of earlywood tracheids with planting density was observed in average tracheidograms (Figure A4). A larger crown width (meaning an increase in the leaf area) and depth in the sparser stands (meaning that sampling height is closer to living crown or even within it for spruce) together with a wider root system can be part of the mechanism providing more resources and distributing them along the stem [76,77].
It turns out that the larger sizes of tracheids in sparse stands could be explained by a combination of several possible reasons, including (1) a smaller proportion of rings with deviations in the wood structure, (2) higher hydraulic requirements due to the negative dependence of tree height on stand density [48,49], and (3) a larger crown and root system providing more resources, prolonged wood formation, and a greater earlywood ratio.
Unlike the cell diameter, the CWT does not show any clear trends with planting density. Even in cases where CWTmax or CWTmean differ significantly between plots according to the ANOVA analysis (Table 2), no clear correspondence was found between this change and the planting density gradient. Apparently, this is also related to the almost complete absence of the effect of the planting density on the maximum wood density (ρmax). These patterns indicate that, unlike the efficiency of water conduction (regulated by the lumen diameter of the conducting elements), its safety from cavitation and embolism (regulated by CWT) is primarily due to adaptation to specific environmental conditions, and not to the morphometry of an individual.
On the other hand, a comparison of the average long-term tracheidograms shows that what is taking place is not so much a change in the CWT in one direction along the entire ring, but rather a redistribution of the secondary wall deposition in favor of latewood, especially in spruce, where the CWT trends in earlywood and latewood were completely opposite.
The described dependences of the wood anatomical structure on the stand density can be taken into account to plan forest management measures to provide wood products with a structure desired for particular industry in regards to both spatial patterns of earlywood/latewood and their quality. In particular, a smaller stand density for the considered conifers and biome can lead to formation of more water-permeable wood with wider strips of earlywood that contain larger tracheids.
4.2. Response of Tree-Ring Traits to Climate Variables
The low proportion of statistically significant correlations of TRW chronologies and anatomical traits with climatic variables could be partly explained by the short period of analysis (21 years), and, for the same reason, the results of the correlation analysis should be treated with caution. However, results of the pointer year analysis match patterns of dendroclimatic correlations, i.e., weather extremes leading to growth reduction or promotion occur during intra-seasonal periods when respective climatic variables correlate consistently with TRW. Such observations support at least qualitative reliability of the climatic response of pine and spruce radial growth.
The signs and seasonal intervals of the most pronounced correlations indicated that the growth of both species is weakly limited by the moisture in the first half of the growth season and by winter conditions, which is typical for the inner part of their distribution area in Siberia [78,79,80]. It is curious that, for the moisture-loving spruce, the negative effect of precipitation during the snowmelt period (April) was also clearly observed, which indicates the susceptibility of this species to spring physiological drought at positive air temperatures but frozen or just cold and wet soil [81,82]. However, in winter conditions, spruce responds more positively to the snow moisture reserve than to temperatures. More drought-resistant and less frost-resistant pine [65,66,67,68], apparently, also reacts negatively to frost in winter, but its growth depends less on snow cover. This may also be due to the fact that spruce normally grows in more humid habitats, in the floodplains of watercourses and reservoirs [65,78].
The radial cell diameter (D), primarily related to water conduction efficiency [60,83,84], is clearly regulated by the current hydrothermal regime during the period of cell growth by expansion, especially the diameter of earlywood tracheids (Dmax). Mechanistically, this is probably expressed through turgor, a factor that directly provides for tracheid enlargement [85,86]. Averaging the D over the entire ring apparently allows integrating this response during the first half of the growing season. In addition, a comparison of the TRW and D response in stands of different densities showed that, in sparse stands, transition to latewood, cessation of cambial activity, and tracheid growth processes occur later than in dense stands. However, Dmax does not have such a pattern, which indicates stability in the timing of the formation of the largest tracheids in earlywood.
The sensitivity of pine’s TRW to winter frosts is reflected more in the CWT than in the D. This reaction is not accompanied by a positive response to winter precipitation, i.e., for pine, the protective function of snow cover is less significant, which means that the above-ground part of the plant suffers from low temperatures first of all—in contrast to spruce, the root system of which is concentrated in the upper soil layer and has a higher threshold of frost resistance [65,87]. Probably, damage reduces the surface of the assimilation apparatus, its restoration spends accumulated resources (non-structural carbohydrates), and recovery of injuries is a competitor to cell wall deposition as a carbon sink [88,89]. On the other hand, drought-resistant pine tolerates the early start of vegetation in April better, i.e., it is less susceptible to physiological drought during this period, which was illustrated by a positive correlation of CWTmean with April temperatures. There are no shifts in the timing of the CWT response to climate due to stand density, which indicates that wood formation is completed under the influence of common external factors, most likely the photoperiod and/or temperature [90,91].
It should be noted that, before the period of quantitative anatomical measurements, i.e., at a biological age of less than 20 years, damage to the cambium by spring frosts in the form of clearly visible frost rings was observed in juvenile trees of both species (examples are shown in Figure A5). This damage made it extremely difficult to measure cell traits and became one of the reasons for limiting the analyzed period. Since frost rings were observed at all plots (i.e., in trees of different sizes) before 2000, and no such damage was found after 2000, we assume that vulnerability to cold is associated with biological age and cambium tissue maturity [92,93], and not with factors determined by tree size and resource availability, such as mechanical insulation of trunk wood from temperature fluctuations by thick bark [94]. In any case, it is quite possible that, during the observation period, despite the absence of frost rings in mature wood forming at the base of the trunk, winter and early spring cold damage may appear in juvenile wood forming closer to the top of the tree. On the other hand, the needles of both species have sufficient frost resistance, and their desiccation in the cold season is unlikely [95,96].
The analysis of the pointer years confirmed that fast growth of both conifers was associated with warm mild winters and sufficient precipitation during the growing season, while growth limitation of both species was typical for frosty winters with little snow and heat and drought in the spring–summer period. However, it should be taken into account that these experimental plantings are located within the taiga zone (boreal conifer forests), in the inner part of the ranges of both species, i.e., during most seasons the conditions are favorable or at least tolerable for tree growth, and even in extreme years the intensity of water deficit and winter frosts in the study area does not reach their tolerance limits. These species can grow and are growing successfully in regions with both colder winters and hotter/drier summers than in the study area. Thus, even in negative pointer years, the drought did not cause visible intra-annual density fluctuations (IADFs) within tree ring, which is typical for young trees in semiarid conditions [97,98]. In addition, even in the densest plantings, there were very few extremely narrow rings numbering 10 cells or less per radial row. Namely, in such rings, the interrelations of cell traits and growth are usually most strongly manifested [73,74]. Apparently, the weakness of limitation by season conditions is the main reason why we did not find consistent relationships of CWT with either growth or planting density. Moreover, even its relationships with the conditions of the current season were ambiguous.
In terms of silviculture and current climate change, we can see that stands of low and medium density have not only better tree survival rates but also higher resistance to or better recovery from drought and frost stresses. Forest managers should take into account that spruce has higher phenological plasticity in regard to wood formation and tends to prolong it more in sparser stands.
5. Conclusions
The radial growth and the diameters of tracheid cells of Scots pine and Siberian spruce in the southern taiga zone have clearly expressed specific patterns of relationships between each other and with the planting density and climatic variables. At the same time, the cell wall thickness (CWT) was much weaker and more ambiguously connected with both other tree-ring traits and the conditions of the forest stand and environment. Apparently, under moderate limitation of growth processes by the conditions of the growing season, the adaptation of the wood structure to the dynamics of the morphometric traits of trees, to the structure of the forest stand, and to climatic fluctuations occurs mainly via regulation of the phase of tracheid enlargement. Despite the inter-species differences, such as drought and frost tolerances or root depth, modifying their climatic responses, some patterns were common for both species: (1) a strong linear relationship between the TRW and N and their weaker correlation with the D; (2) an allometric decrease in the TRW and N and log-linear decrease in the D with increases in planting density; (3) a negative effect of harsh winters and spring–summer droughts on these tree-ring traits (the latter effect ending later in the season for sparse stands, especially in spruce). Better resistance to frost and drought stresses was observed in sparce stands, and better recovery afterwards occurred in medium-density stands. The findings of this study can be used in forest management, providing insight for long-term planning and providing wood with a desired structure and quality, and probably for prediction of differentiated effects of the increasing warm season duration due to climate change.
Author Contributions
Conceptualization, E.A.V. and E.A.B.; methodology, E.A.V. and L.V.B.; validation, N.B.M. and K.V.K.; formal analysis, Y.A.K. and L.V.B.; investigation, Y.A.K., L.V.B., D.F.Z., N.B.M. and T.V.K.; resources, D.F.Z.; data curation, Y.A.K. and T.V.K.; writing—original draft preparation, Y.A.K., L.V.B., D.F.Z., K.V.K. and E.A.V.; writing—review and editing, all authors; visualization, Y.A.K. and L.V.B.; supervision, E.A.V. and E.A.B.; project administration, D.F.Z.; funding acquisition, D.F.Z. and E.A.B. All authors have read and agreed to the published version of the manuscript.
Funding
This research was funded by the Russian Science Foundation, grant number 22-26-00232 (fieldwork) and by the Russian Ministry of Science and Higher Education, grant number FSRZ-2023-0007 (data analysis).
Data Availability Statement
Data included in this study will be available on request from the corresponding author L.V.B.
Acknowledgments
The authors thank Nataly N. Koshurnikova (Siberian Federal University, Krasnoyarsk, Russia) and Roman S. Sobachkin (V.N. Sukachev Institute of Forest, Krasnoyarsk, Russia) for contributing to collection of wood cores and providing inventory data.
Conflicts of Interest
The authors declare no conflicts of interest. The funders had no role in the design of the study; in the collection, analyses, or interpretation of data; in the writing of the manuscript; or in the decision to publish the results.
Abbreviations
The following abbreviations are used in this manuscript:
| P | Precipitation |
| T | Temperature |
| PS | Pinus sylvestris |
| PO | Picea obovata |
| TRW | Tree-ring width |
| N | Cell number per radial row in the ring |
| D | Cell radial diameter |
| CWT | Cell wall thickness |
| Dmean | Mean cell radial diameter in tree ring |
| Dmax | Maximum cell radial diameter in tree ring |
| CWTmean | Mean cell wall thickness in tree ring |
| CWTmax | Maximum cell wall thickness in tree ring |
| DENS | Stand density (current) |
| DENS0 | Planting density (initial) |
| TD | Cell tangential diameter |
| ρ | Wood density |
| ρ0 | Wood matter density |
| ρmax | Maximum wood density in tree ring |
| IADF | Intra-annual density fluctuation |
Appendix A
Table A1.
Total number of tracheids measured over 2000–2020 (five trees per plot, 21 years, five radial rows in each tree ring).
Table A1.
Total number of tracheids measured over 2000–2020 (five trees per plot, 21 years, five radial rows in each tree ring).
| Species | Plots | ||||||
|---|---|---|---|---|---|---|---|
| 2 | 5 | 7 or 8 # | 11 | 14 | 17 | All | |
| Picea obovata | 69,465 | 44,520 | 31,370 | 19,620 | 17,490 | 18,445 | 200,910 |
| Pinus sylvestris | 52,090 | 36,590 | 21,885 | 22,290 | 23,390 | 18,400 | 174,645 |
# Plot 7 for pine, plot 8 for spruce.
Table A2.
First-order autocorrelation of indexed plot tree-ring chronologies over period 2000–2020.
Table A2.
First-order autocorrelation of indexed plot tree-ring chronologies over period 2000–2020.
| Species | Tree-Ring Trait | Plots | ||||||
|---|---|---|---|---|---|---|---|---|
| 2 | 5 | 7 or 8 # | 11 | 14 | 17 | All | ||
| Picea obovata | TRW | −0.18 | 0.00 | −0.03 | −0.39 | −0.39 | −0.03 | −0.21 |
| Dmax | −0.54 * | −0.20 | −0.56 * | −0.54 * | −0.40 | −0.40 | −0.50 * | |
| Dmean | −0.07 | −0.08 | −0.17 | −0.34 | −0.26 | −0.06 | −0.15 | |
| CWTmax | −0.19 | −0.24 | −0.33 | −0.38 | −0.49 * | 0.01 | −0.36 | |
| CWTmean | −0.13 | −0.38 | −0.18 | −0.43 | −0.42 | −0.06 | −0.39 | |
| Pinus sylvestris | TRW | −0.14 | −0.09 | −0.19 | −0.10 | −0.09 | −0.35 | −0.10 |
| Dmax | −0.23 | −0.21 | −0.40 | −0.47 * | −0.09 | −0.59 * | −0.40 | |
| Dmean | −0.03 | −0.12 | −0.32 | −0.12 | −0.18 | −0.70 * | −0.26 | |
| CWTmax | −0.29 | −0.26 | −0.26 | −0.56 * | −0.05 | −0.14 | −0.38 | |
| CWTmean | −0.57 * | −0.10 | −0.33 | −0.13 | −0.14 | 0.04 | −0.28 | |
# Plot 7 for pine, plot 8 for spruce. * Values significant at p < 0.05.
Table A3.
p-values for statistical significance of differences in the cell radial diameter (D) and cell wall thickness (CWT) between tree rings formed in positive (2002, 2007) and negative (2012, 2019) pointer years.
Table A3.
p-values for statistical significance of differences in the cell radial diameter (D) and cell wall thickness (CWT) between tree rings formed in positive (2002, 2007) and negative (2012, 2019) pointer years.
| Normalized Cell | Species and Plots | |||||||||||
|---|---|---|---|---|---|---|---|---|---|---|---|---|
| Picea obovata | Pinus sylvestris | |||||||||||
| 2 | 5 | 8 | 11 | 14 | 17 | 2 | 5 | 7 | 11 | 14 | 17 | |
| Cell radial diameter, D | ||||||||||||
| 1 | 0.1461 | 0.5658 | 0.0059 * | 0.0067 * | 0.0955 | 0.0231 * | 0.0195 * | 0.0818 | 0.0115 * | 0.0088 * | 0.1088 | 0.0058 * |
| 2 | 0.0069 * | 0.5939 | 0.0024 * | 0.0009 * | 0.0272 * | 0.0120 * | 0.0043 * | 0.0161 * | 0.1162 | 0.0810 | 0.0143 * | 0.0047 * |
| 3 | 0.1093 | 0.0488 * | 0.0075 * | 0.0001 * | 0.0491 * | 0.0029 * | 0.0368 * | 0.0104 * | 0.1941 | 0.4301 | 0.0001 * | 0.0053 * |
| 4 | 0.0061 * | 0.7779 | 0.0347 * | 0.0001 * | 0.0758 | 0.0360 * | 0.0622 | 0.0147 * | 0.1626 | 0.0019 * | 0.0057 * | 0.0113 * |
| 5 | 0.1001 | 0.5239 | 0.0848 | 0.0000 * | 0.0188 * | 0.0050 * | 0.0065 * | 0.0090 * | 0.1518 | 0.0910 | 0.0027 * | 0.0260 * |
| 6 | 0.6294 | 0.9963 | 0.0198 * | 0.0000 * | 0.0003 * | 0.0002 * | 0.0026 * | 0.0022 * | 0.0771 | 0.0063 * | 0.0009 * | 0.0216 * |
| 7 | 0.7371 | 0.7338 | 0.0063 * | 0.0000 * | 0.0006 * | 0.0002 * | 0.0313 * | 0.0064 * | 0.1844 | 0.0000 * | 0.0013 * | 0.0075 * |
| 8 | 0.9842 | 0.2136 | 0.0064 * | 0.0004 * | 0.0059 * | 0.0003 * | 0.0363 * | 0.0943 | 0.1561 | 0.0153 * | 0.0029 * | 0.0009 * |
| 9 | 0.9831 | 0.1590 | 0.0837 | 0.0001 * | 0.0099 * | 0.0001 * | 0.0084 * | 0.2980 | 0.0371 * | 0.0116 * | 0.0019 * | 0.0115 * |
| 10 | 0.9397 | 0.2637 | 0.0999 | 0.0002 * | 0.1101 | 0.0007 * | 0.2863 | 0.0345 * | 0.0074 * | 0.0006 * | 0.0006 * | 0.0280 * |
| 11 | 0.6222 | 0.1887 | 0.3118 | 0.0032 * | 0.3463 | 0.0084 * | 0.2223 | 0.0556 | 0.0178 * | 0.0003 * | 0.0000 * | 0.0265 * |
| 12 | 0.6702 | 0.0542 | 0.4293 | 0.0032 * | 0.3215 | 0.0215 * | 0.0973 | 0.1240 | 0.0542 | 0.0092 * | 0.0000 * | 0.0021 * |
| 13 | 0.6319 | 0.0292 * | 0.2295 | 0.0020 * | 0.2386 | 0.0159 * | 0.0703 | 0.0362 * | 0.0218 * | 0.0867 | 0.0000 * | 0.0194 * |
| 14 | 0.4096 | 0.0439 * | 0.0691 | 0.0022 * | 0.4995 | 0.0381 * | 0.0612 | 0.1243 | 0.0036 * | 0.0267 * | 0.0000 * | 0.0152 * |
| 15 | 0.6419 | 0.0449 * | 0.0241 * | 0.0012 * | 0.8950 | 0.0894 | 0.1032 | 0.0016 * | 0.0012 * | 0.0081 * | 0.0000 * | 0.0038 * |
| 16 | 0.2768 | 0.0747 | 0.0015 * | 0.0005 * | 0.4760 | 0.0244 * | 0.7894 | 0.0010 * | 0.0006 * | 0.0042 * | 0.0000 * | 0.0014 * |
| 17 | 0.8728 | 0.1725 | 0.0013 * | 0.0007 * | 0.2597 | 0.0117 * | 0.5677 | 0.0030 * | 0.0001 * | 0.0055 * | 0.0000 * | 0.0028 * |
| 18 | 0.5624 | 0.1999 | 0.0005 * | 0.0001 * | 0.2599 | 0.0072 * | 0.3346 | 0.0010 * | 0.0002 * | 0.0024 * | 0.0000 * | 0.0031 * |
| 19 | 0.3803 | 0.4107 | 0.0103 * | 0.0000 * | 0.2389 | 0.0055 * | 0.5730 | 0.0102 * | 0.0006 * | 0.0032 * | 0.0000 * | 0.0054 * |
| 20 | 0.3338 | 0.3995 | 0.0088 * | 0.0000 * | 0.0962 | 0.0086 * | 0.4373 | 0.0060 * | 0.0011 * | 0.0007 * | 0.0000 * | 0.0383 * |
| 21 | 0.9246 | 0.1029 | 0.0100 * | 0.0001 * | 0.0321 * | 0.0050 * | 0.0140 * | 0.0032 * | 0.0053 * | 0.0148 * | 0.0011 * | 0.0426 * |
| 22 | 0.7770 | 0.0015 * | 0.0109 * | 0.0000 * | 0.0015 * | 0.0012 * | 0.0003 * | 0.0039 * | 0.0235 * | 0.0502 | 0.0006 * | 0.0086 * |
| 23 | 0.2390 | 0.0010 * | 0.0034 * | 0.0001 * | 0.0000 * | 0.0003 * | 0.0004 * | 0.0002 * | 0.0180 * | 0.2641 | 0.0013 * | 0.0017 * |
| 24 | 0.0979 | 0.0000 * | 0.0006 * | 0.0005 * | 0.0002 * | 0.0013 * | 0.0302 * | 0.0027 * | 0.0036 * | 0.2508 | 0.0018 * | 0.0007 * |
| 25 | 0.0108 * | 0.0000 * | 0.0002 * | 0.0000 * | 0.0039 * | 0.0023 * | 0.0926 | 0.0026 * | 0.0012 * | 0.8299 | 0.0059 * | 0.0026 * |
| 26 | 0.0033 * | 0.0000 * | 0.0000 * | 0.0000 * | 0.0006 * | 0.0022 * | 0.2223 | 0.0074 * | 0.0002 * | 0.8129 | 0.0100 * | 0.0070 * |
| 27 | 0.0038 * | 0.0000 * | 0.0000 * | 0.0000 * | 0.0019 * | 0.0023 * | 0.0125 * | 0.0648 | 0.0003 * | 0.4568 | 0.0094 * | 0.0071 * |
| 28 | 0.0000 * | 0.0000 * | 0.0000 * | 0.0000 * | 0.0003 * | 0.0001 * | 0.0000 * | 0.0004 * | 0.0032 * | 0.1485 | 0.0020 * | 0.0004 * |
| 29 | 0.0001 * | 0.0000 * | 0.0000 * | 0.0001 * | 0.0002 * | 0.0007 * | 0.0000 * | 0.0010 * | 0.0033 * | 0.0032 * | 0.0002 * | 0.0011 * |
| 30 | 0.0038 * | 0.0000 * | 0.0000 * | 0.3437 | 0.4712 | 0.8277 | 0.2268 | 0.0910 | 0.1687 | 0.0145 * | 0.0712 | 0.5710 |
| Cell wall thickness, CWT | ||||||||||||
| 1 | 0.0125 * | 0.6969 | 0.2429 | 0.8409 | 0.2493 | 0.3158 | 0.1070 | 0.7174 | 0.9392 | 0.0196 * | 0.3137 | 0.1728 |
| 2 | 0.0514 | 0.9475 | 0.1220 | 0.5500 | 0.7414 | 0.2522 | 0.5441 | 0.5691 | 0.4508 | 0.0017 * | 0.3675 | 0.3886 |
| 3 | 0.1096 | 0.2975 | 0.1950 | 0.6128 | 0.7274 | 0.1475 | 0.9822 | 0.2255 | 0.1759 | 0.0412 * | 0.3310 | 0.3868 |
| 4 | 0.0888 | 0.4719 | 0.3171 | 0.5277 | 0.5034 | 0.2545 | 0.5750 | 0.0110 * | 0.1450 | 0.0984 | 0.4840 | 0.3349 |
| 5 | 0.1614 | 0.8794 | 0.7841 | 0.3574 | 0.4626 | 0.5239 | 0.5198 | 0.0065 * | 0.0539 | 0.5772 | 0.9675 | 0.1192 |
| 6 | 0.7087 | 0.6215 | 0.9699 | 0.8555 | 0.6026 | 0.6804 | 0.6860 | 0.0185 * | 0.0382 * | 0.2208 | 0.8468 | 0.0305 * |
| 7 | 0.8587 | 0.6959 | 0.5762 | 0.6722 | 0.8904 | 0.8913 | 0.4203 | 0.0306 * | 0.0285 * | 0.4242 | 0.6156 | 0.2712 |
| 8 | 0.6599 | 0.8101 | 0.5268 | 0.5521 | 0.7105 | 0.8297 | 0.5210 | 0.2175 | 0.0331 * | 0.8762 | 0.5103 | 0.4026 |
| 9 | 0.8247 | 0.7117 | 0.8942 | 0.5059 | 0.6245 | 0.7334 | 0.7158 | 0.0982 | 0.0516 | 0.8231 | 0.7315 | 0.5002 |
| 10 | 0.7166 | 0.8613 | 0.9095 | 0.7943 | 0.5887 | 0.7147 | 0.7123 | 0.0396 * | 0.0311 * | 0.6066 | 0.5841 | 0.4092 |
| 11 | 0.9886 | 0.5148 | 0.5426 | 0.8726 | 0.9333 | 0.7677 | 0.7629 | 0.1042 | 0.0085 * | 0.5719 | 0.8852 | 0.5502 |
| 12 | 0.9263 | 0.1407 | 0.3422 | 0.8725 | 0.8319 | 0.6390 | 0.9349 | 0.6755 | 0.0069 * | 0.6035 | 0.8717 | 0.6541 |
| 13 | 0.8386 | 0.0503 | 0.7923 | 0.6181 | 0.9547 | 0.5011 | 0.8253 | 0.5538 | 0.0160 * | 0.6802 | 0.6206 | 0.5637 |
| 14 | 0.6253 | 0.1442 | 0.9477 | 0.3344 | 0.7364 | 0.3428 | 0.9691 | 0.1994 | 0.0547 | 0.6753 | 0.6404 | 0.3305 |
| 15 | 0.6868 | 0.0943 | 0.8844 | 0.1155 | 0.5994 | 0.5767 | 0.6651 | 0.5311 | 0.1956 | 0.4473 | 0.2846 | 0.3128 |
| 16 | 0.3054 | 0.0515 | 0.8707 | 0.0808 | 0.4065 | 0.4142 | 0.9859 | 0.3009 | 0.3317 | 0.1590 | 0.2623 | 0.2257 |
| 17 | 0.0422 * | 0.0414 * | 0.8324 | 0.0226 * | 0.3126 | 0.4150 | 0.8233 | 0.7913 | 0.3634 | 0.4485 | 0.5149 | 0.4556 |
| 18 | 0.0363 * | 0.0894 | 0.3152 | 0.0221 * | 0.2907 | 0.4164 | 0.5149 | 0.6244 | 0.5613 | 0.6918 | 0.3618 | 0.9735 |
| 19 | 0.0357 * | 0.0862 | 0.5695 | 0.0366 * | 0.3482 | 0.5603 | 0.2062 | 0.6043 | 0.9503 | 0.9599 | 0.1086 | 0.8877 |
| 20 | 0.0241 * | 0.2952 | 0.2871 | 0.0774 | 0.7083 | 0.9057 | 0.0119 * | 0.8199 | 0.6534 | 0.8941 | 0.1477 | 0.6469 |
| 21 | 0.0565 | 0.5423 | 0.3763 | 0.1351 | 0.4236 | 0.6404 | 0.0051 * | 0.3722 | 0.2323 | 0.5963 | 0.2319 | 0.8680 |
| 22 | 0.0403 | 0.6100 | 0.9240 | 0.2153 | 0.2691 | 0.3426 | 0.0037 * | 0.2637 | 0.1671 | 0.2439 | 0.1758 | 0.9243 |
| 23 | 0.0582 | 0.8985 | 0.3645 | 0.4313 | 0.2191 | 0.0773 | 0.0137 * | 0.2796 | 0.0734 | 0.1512 | 0.1077 | 0.5288 |
| 24 | 0.0338 | 0.5849 | 0.1816 | 0.7541 | 0.3438 | 0.0621 | 0.0064 * | 0.9268 | 0.0170 * | 0.1902 | 0.0721 | 0.3809 |
| 25 | 0.0277 | 0.3598 | 0.1583 | 0.3253 | 0.5328 | 0.0993 | 0.0163 * | 0.7740 | 0.0142 * | 0.4930 | 0.1654 | 0.6665 |
| 26 | 0.0734 | 0.0617 | 0.3441 | 0.1607 | 0.8538 | 0.0797 | 0.0039 * | 0.3547 | 0.0065 * | 0.5046 | 0.2023 | 0.9339 |
| 27 | 0.1213 | 0.0411 * | 0.8880 | 0.0680 | 0.3869 | 0.3191 | 0.0290 * | 0.5355 | 0.0049 * | 0.1474 | 0.0804 | 0.8128 |
| 28 | 0.3660 | 0.2307 | 0.0711 | 0.0170 * | 0.0767 | 0.6063 | 0.2355 | 0.1157 | 0.0103 * | 0.0887 | 0.0191 * | 0.3322 |
| 29 | 0.9324 | 0.3163 | 0.0001 * | 0.0030 * | 0.0065 * | 0.7592 | 0.1420 | 0.0780 | 0.0034 * | 0.0105 * | 0.0070 * | 0.4279 |
| 30 | 0.3243 | 0.1187 | 0.0002 * | 0.3368 | 0.7510 | 0.1542 | 0.2673 | 0.7725 | 0.3567 | 0.0715 | 0.9949 | 0.2224 |
* p-values < 0.05.

Figure A1.
Analysis of tracheids: (a) measurement of the tracheid cells in the Lineyka program [55], red line highlights one of the radial rows selected for measurement; (b) tracheidograms (series of measurements along radial row of tracheids within one ring) of the cell radial diameter (D, upper plot) and the cell wall thickness (CWT, lower plot) that were normalized to the average N for five measured radial rows and then averaged; dash lines represent mean values: Dmean (upper plot) and CWTmean (lower plot), solid diamonds represent maximum values: Dmax (upper plot) and CWTmax (lower plot).

Figure A2.
Dynamics of mean and maximum cell radial diameter (D) and cell wall thickness (CWT) chronologies in plots of Picea obovata (PO2, PO5, PO8, PO11, PO14, and PO17) and Pinus sylvestris (PS2, PS5, PS7, PS11, PS14, and PS17) with different planting densities over 2000–2020.

Figure A3.
Variability of maximum and mean cell radial diameter (D) depending on number of cells (N) in plots of Picea obovata (PO2, PO5, PO8, PO11, PO14, and PO17) and Pinus sylvestris (PS2, PS5, PS7, PS11, PS14, and PS17) with different planting densities based on average values for each plot (a) and individual tree rings for all plots (b).

Figure A4.
Tracheidograms normalized to N = 30 cells in a radial row, averaged over 2000–2020, and generalized for plots of Picea obovata (PO2, PO5, PO8, PO11, PO14, and PO17) and Pinus sylvestris (PS2, PS5, PS7, PS11, PS14, and PS17) with different planting densities. Solid lines represent cell radial diameter (D), dashed lines—cell wall thickness (CWT); the color intensity of the lines reflects planting density.

Figure A5.
Frost damage in earlywood of juvenile spruce (PO) and pine (PS) trees before the start of measurements of the anatomical traits (biological age of trees: 7–16 years). The lignified and non-lignified wood cells are dark pink and blue respectively, being stained by mix of pigments: safranin (red; stains only lignin) and astra blue (stains all).
References
- Butterfield, B.G. Wood anatomy in relation to wood quality. In Wood Quality and Its Biological Basis; Barnett, J.R., Jeronimidis, G., Eds.; Blackwell Publishing: Oxford, UK, 2003; pp. 30–52. [Google Scholar]
- Rowell, R.M. Handbook of Wood Chemistry and Wood Composites, 2nd ed.; CRC Press: Boca Raton, FL, USA, 2013; 688p. [Google Scholar]
- Vaganov, E.A.; Hughes, M.K.; Shashkin, A.V. Growth Dynamics of Conifer Tree Rings: Images of Past and Future Environments; Springer: Berlin, Germany, 2006; 354p. [Google Scholar] [CrossRef]
- Schweingruber, F.H. Wood Structure and Environment; Springer: Berlin, Germany, 2007; 279p. [Google Scholar] [CrossRef]
- Pimenta, E.M.; Ramalho, F.M.G.; Dambroz, G.B.V.; Couto, A.M.; Campoe, O.C.; Hein, P.R.G. Planting spacing and genotype affected the tree growth and variation of wood density and lignin content along Eucalyptus trunks. Ind. Crops Prod. 2024, 222, 119595. [Google Scholar] [CrossRef]
- Zhu, J.Y.; Scott, C.T.; Scallon, K.L.; Myers, G.C. Effects of plantation density on wood density and anatomical properties of red pine (Pinus resinosa Ait.). Wood Fiber Sci. 2007, 39, 502–512. [Google Scholar]
- Šilinskas, B.; Varnagirytė-Kabašinskienė, I.; Aleinikovas, M.; Beniušienė, L.; Aleinikovienė, J.; Škėma, M. Scots pine and Norway spruce wood properties at sites with different stand densities. Forests 2020, 11, 587. [Google Scholar] [CrossRef]
- Zhang, S.; Belien, E.; Ren, H.; Rossi, S.; Huang, J.G. Wood anatomy of boreal species in a warming world: A review. iForest–Biogeosci. For. 2020, 13, 130. [Google Scholar] [CrossRef]
- Cao, J.; Liu, H.; Zhao, B.; Li, Z.; Liang, B.; Shi, L.; Wu, L.; Cressey, E.L.; Quine, T.A. High forest stand density exacerbates growth decline of conifers driven by warming but not broad-leaved trees in temperate mixed forest in northeast Asia. Sci. Total Environ. 2021, 795, 148875. [Google Scholar] [CrossRef]
- Zobel, B.J.; Buijtenen, J.P. Wood Variation: Its Cause and Control; Springer: Berlin/Heidelberg, Germany, 1989; 363p. [Google Scholar] [CrossRef]
- Barnett, J.R.; Jeronimidis, G. Wood Quality and Its Biological Basis; CRC Press: Boca Raton, FL, USA, 2003; 226p. [Google Scholar]
- Watt, M.S.; Moore, J.R.; Facon, J.; Downes, G.M.; Clinton, P.M.; Coker, G.; Davis, M.R.; Simcock, R.; Parfitt, R.L.; Dando, J.; et al. Modelling the influence of stand structural, edaphic and climatic influences on juvenile Pinus radiata dynamic modulus of elasticity. For. Ecol. Manag. 2006, 229, 136–144. [Google Scholar] [CrossRef]
- Fernandez, M.E.; Gyenge, J.E.; de Urquiza, M.M.; Varela, S. Adaptability to climate change in forestry species: Drought effects on growth and wood anatomy of ponderosa pines growing at different competition levels. For. Syst. 2012, 21, 162–174. [Google Scholar] [CrossRef]
- Sun, S.; Zhang, J.; Zhou, J.; Guan, C.; Lei, S.; Meng, P.; Yin, C. Long-term effects of climate and competition on radial growth, recovery, and resistance in Mongolian pines. Front. Plant Sci. 2021, 12, 729935. [Google Scholar] [CrossRef] [PubMed]
- Maynard, D.S.; Bialic-Murphy, L.; Zohner, C.M.; Averill, C.; van den Hoogen, J.; Ma, H.; Mo, L.; Reuben Smith, G.; Acosta, A.T.R.; Aubin, I.; et al. Global relationships in tree functional traits. Nat. Commun. 2022, 13, 3185. [Google Scholar] [CrossRef] [PubMed]
- Zhang, S.Y.; Chauret, G. Impact of Initial Spacing on Tree and Wood Characteristics, Product Quality and Value Recovery in Black Spruce (Picea mariana); Canadian Forest Service, Forintek Canada Corp.: Fredericton, NB, Canada, 2001; 42p. [Google Scholar]
- Sharapov, E.; Demakov, Y.; Korolev, A. Effect of plantation density on some physical and technological parameters of Scots pine (Pinus sylvestris L.). Forests 2024, 15, 233. [Google Scholar] [CrossRef]
- Andrews, C.M.; D’Amato, A.W.; Fraver, S.; Palik, B.; Battaglia, M.A.; Bradford, J.B. Low stand density moderates growth declines during hot droughts in semi-arid forests. J. Appl. Ecol. 2020, 57, 1089–1102. [Google Scholar] [CrossRef]
- Astigarraga, J.; Andivia, E.; Zavala, M.A.; Gazol, A.; Cruz-Alonso, V.; Vicente-Serrano, S.M.; Ruiz-Benito, P. Evidence of non-stationary relationships between climate and forest responses: Increased sensitivity to climate change in Iberian forests. Glob. Change Biol. 2020, 26, 5063–5076. [Google Scholar] [CrossRef]
- Barbour, R.J. A Preliminary Study of the Wood Properties of Fast-Grown Black Spruce, Picea mariana, from Quebec; Canadian Forest Service, Forintek Canada Corp.: Ottawa, ON, Canada, 1987; 133p. [Google Scholar]
- Ackermann, F. The relationship between forest site and intra-ring wood density factors for Quercus robur in SW France. Ann. Sci. For. 1995, 52, 635–652. [Google Scholar] [CrossRef]
- Alteyrac, J.; Zhang, S.Y.; Cloutier, A.; Ruel, J.C. Influence of stand density on ring width and wood density at different sampling heights in black spruce (Picea mariana (Mill.) BSP). Wood Fiber Sci. 2005, 37, 83–94. [Google Scholar]
- Brand, D.G.; Magnussen, S. Asymetric, two-sided competition in even-aged monocultures of red pine. Can. J. For. Res. 1988, 18, 901–910. [Google Scholar] [CrossRef]
- Mäkinen, H.; Hynynen, J.; Penttilä, T. Effect of thinning on wood density and tracheid properties of Scots pine on drained peatland stands. For. Int. J. For. Res. 2015, 88, 359–367. [Google Scholar] [CrossRef]
- Ishiguri, F.; Takeuchi, M.; Makino, K.; Wahyudi, I.; Takashima, Y.; Iizuka, K.; Yokota, S.; Yoshizawa, N. Cell morphology and wood properties of Shorea acuminatissima planted in Indonesia. IAWA J. 2012, 33, 25–38. [Google Scholar] [CrossRef]
- Kuzmin, S.R.; Vaganov, E.A. The anatomic characteristics of Scots pine tree rings in provenances in the Angara River basin. Lesoved. Russ. J. For. Sci. 2007, 4, 3–12. (In Russian) [Google Scholar]
- Downes, G.M.; Drew, D.; Battaglia, M.; Schulze, D. Measuring and modelling stem growth and wood formation: An overview. Dendrochronologia 2009, 27, 147–157. [Google Scholar] [CrossRef]
- Buechling, A.; Martin, P.H.; Canham, C.D. Climate and competition effects on tree growth in Rocky Mountain forests. J. Ecol. 2017, 105, 1636–1647. [Google Scholar] [CrossRef]
- Girardin, M.P.; Isabel, N.; Guo, X.J.; Lamothe, M.; Duchesne, I.; Lenz, P. Annual aboveground carbon uptake enhancements from assisted gene flow in boreal black spruce forests are not long-lasting. Nat. Commun. 2021, 12, 1169. [Google Scholar] [CrossRef]
- Pisarenko, A.I.; Redko, G.I.; Merzlenko, M.D. Iskusstvennye Lesa [Forest Plantations]; Vserossiiskii Nauchno-Issledovatelskii Informatsionnyi Tsentr «Lesresurs»: Moscow, Russia, 1992; 308p. (In Russian) [Google Scholar]
- Yang, K.C.; Hazenberg, G. Impact of spacings on sapwood and heartwood thickness in Picea mariana (Mill.) B.S.P. and Picea glauca (Moench.) Voss. Wood Fiber Sci. 1992, 24, 330–336. [Google Scholar]
- Pape, R. Effects of thinning regime on the wood properties and stem quality of Picea abies. Scand. J. For. Res. 1999, 14, 38–50. [Google Scholar] [CrossRef]
- Larson, P.R.; Kretschmann, D.E.; Clark, A., III; Isebrands, J.G. Formation and Properties of Juvenile Wood in Southern Pines: A Synopsis; General Technical Report, FPL-GTR-129; Department of Agriculture, Forest Service, Forest Products Laboratory: Madison, WI, USA, 2001; 42p. [Google Scholar]
- Hébert, F.; Krause, C.; Plourde, P.Y.; Achim, A.; Prégent, G.; Ménétrier, J. Effect of tree spacing on tree level volume growth, morphology, and wood properties in a 25-year-old Pinus banksiana plantation in the boreal forest of Quebec. Forests 2016, 7, 276. [Google Scholar] [CrossRef]
- Danilov, D.A.; Zhigunov, A.V.; Zaytsev, D.A.; Butenko, O.Y. The influence of stem density on the productivity and quality of spruce (Picea abies [L.] Karst.) wood in a short rotation plantation in the boreal zone of North-West Russia. Bull. Transilv. Univ. Brasov. Ser. II For. Wood Ind. Agric. Food Eng. 2023, 16, 1. [Google Scholar] [CrossRef]
- Lasserre, J.P.; Mason, E.G.; Watt, M.S.; Moore, J.R. Influence of initial planting spacing and genotype on microfibril angle, wood density, fibre properties and modulus of elasticity in Pinus radiata D. Don corewood. For. Ecol. Manag. 2009, 258, 1924–1931. [Google Scholar] [CrossRef]
- Anfodillo, T.; Petit, G.; Crivellaro, A. Axial conduit widening in woody species: A still neglected anatomical pattern. IAWA J. 2013, 34, 352–364. [Google Scholar] [CrossRef]
- Mvolo, C.S.; Goudiaby, V.; Koubaa, A.; Stewart, J.D. Influence of four spacings between trees and four samplings heights on selected wood quality attributes of white spruce (Picea glauca (Moench) Voss). Forests 2022, 13, 1807. [Google Scholar] [CrossRef]
- Guedes, T.O.; Lima, L.C.; Hein, P.R.G.; Silva, J.R.M.D.; Santos, L.D.T. Effect of planting density on wood anatomy in Eucalyptus and Acacia from Brazil. Madera Bosques 2018, 24, 2. (In Spanish) [Google Scholar] [CrossRef]
- Mvolo, C.S.; Koubaa, A.; Beaulieu, J.; Cloutier, A.; Mazerolle, M.J. Variation in wood quality in white spruce (Picea glauca (Moench) Voss). Part I. Defining the juvenile—Mature wood transition based on tracheid length. Forests 2015, 6, 183–202. [Google Scholar] [CrossRef]
- Rathgeber, C.B. Conifer tree-ring density interannual variability–anatomical, physiological and environmental determinants. New Phytol. 2017, 216, 621–625. [Google Scholar] [CrossRef]
- Yang, K.C. Impact of spacing on juvenile wood and mature wood properties of white spruce (Picea glauca). Taiwan J. For. Sci. 2002, 17, 13–29. [Google Scholar] [CrossRef]
- Alisov, B.P. Climate of the USSR.; Moscow State University: Moscow, Russia, 1956; 128p. (In Russian) [Google Scholar]
- Rivas-Martínez, S.; Rivas-Saenz, S.; Penas, A. Worldwide bioclimatic classification system + 4 Maps. Glob. Geobot. 2011, 1, 1–634. [Google Scholar]
- Buzykin, A.I.; Pshenichnikova, L.S.; Sobachkin, D.S.; Sobachkin, R.S. Analysis of self-thinning in young Scots pine stands of different planting densities. Hvojnye Borealnoj Zony Conifers Boreal Area 2008, 25, 244–249. (In Russian) [Google Scholar]
- Buzykin, A.I.; Pshenichnikova, L.S. Influence of experimental planting density on the radial growth of Scots pine. Hvojnye Borealnoj Zony Conifers Boreal Area 2011, 28, 188–192. (In Russian) [Google Scholar]
- Sobachkin, R.S.; Sobachkin, D.S.; Buzykin, A.I.; Pshenichnikova, L.S. Influence of cenosis density on biometric indicators of Siberian spruce trees. Hvojnye Borealnoj Zony Conifers Boreal Area 2012, 29, 253–258. (In Russian) [Google Scholar]
- Kholdaenko, Y.A.; Belokopytova, L.V.; Zhirnova, D.F.; Upadhyay, K.K.; Tripathi, S.K.; Koshurnikova, N.N.; Sobachkin, R.S.; Babushkina, E.A.; Vaganov, E.A. Stand density effects on tree growth and climatic response in Picea obovata Ledeb. plantations. For. Ecol. Manag. 2022, 519, 120349. [Google Scholar] [CrossRef]
- Kholdaenko, Y.A.; Babushkina, E.A.; Belokopytova, L.V.; Zhirnova, D.F.; Koshurnikova, N.N.; Yang, B.; Vaganov, E.A. The more the merrier or the fewer the better fare? Effects of stand density on tree growth and climatic response in a Scots pine plantation. Forests 2023, 14, 915. [Google Scholar] [CrossRef]
- Cook, E.R.; Kairiukstis, L.A. (Eds.) Methods of Dendrochronology. Application in Environmental Sciences; Kluwer Academic Publishers: Dordrecht, Germany, 1990; 394p. [Google Scholar] [CrossRef]
- Rinn, F. TSAP-Win. Time Series Analysis and Presentation for Dendrochronology and Related Applications. User Reference. Version 4.64 for Microsoft Windows; RINNTECH: Heidelberg, Germany, 2011; 92p. [Google Scholar]
- Grissino-Mayer, H.D. Evaluating crossdating accuracy: A manual and tutorial for the computer program COFECHA. Tree-Ring Res. 2001, 57, 205–221. [Google Scholar]
- Vaganov, E.A.; Shashkin, A.V.; Sviderskaya, I.V.; Vysotskaya, L.G. Histometric Analysis of Woody Plant Growth; Publishing House SB RAS Nauka: Novosibirsk, Russia, 1985; 100p. (In Russian) [Google Scholar]
- Larson, P.R. The Vascular Cambium: Development and Structure; Springer: Berlin, Germany, 1994; 725p. [Google Scholar] [CrossRef]
- Silkin, P.P. Methods of Multiparameter Analysis of Conifers Tree-Rings Structure; Siberian Federal University: Krasnoyarsk, Russia, 2010; 335p. (In Russian) [Google Scholar]
- Seo, J.W.; Eckstein, D.; Jalkanen, R. Screening various variables of cellular anatomy in Scots pines in subarctic Finland for climatic signals. IAWA J. 2012, 4, 417–429. [Google Scholar] [CrossRef]
- Vaganov, E.A. The tracheidogram method in tree-ring analysis and its application. In Methods of Dendrochronology: Applications in the Environmental Sciences; Cook, E., Kairiukstis, L., Eds.; Kluwer Academic Publishers: Dordrecht, Germany, 1990; pp. 63–75. [Google Scholar] [CrossRef]
- Gryc, V.; Vavrčík, H.; Horn, K. Density of juvenile and mature wood of selected coniferous species. J. For. Sci. 2011, 57, 123–130. [Google Scholar] [CrossRef]
- Lu, C.; Wu, J.; Jiang, Q.; Liu, Y.; Zhou, L.; You, Y.; Cheng, Y.; Liu, S. Influence of juvenile and mature wood on anatomical and chemical properties of early and late wood from Chinese fir plantation. J. Wood Sci. 2021, 67, 72. [Google Scholar] [CrossRef]
- Tyree, M.T.; Ewers, F.W. The hydraulic architecture of trees and other woody plants. New Phytol. 1991, 119, 345–360. [Google Scholar] [CrossRef]
- Zauer, M.; Pfriem, A.; Wagenführ, A. Toward improved understanding of the cell-wall density and porosity of wood determined by gas pycnometry. Wood Sci. Technol. 2013, 47, 1197–1211. [Google Scholar] [CrossRef]
- Cook, E.R.; Krusic, P.J. Program ARSTAN: A Tree-Ring Standardization Program Based on Detrending and Autoregressive Time Series Modeling, with Interactive Graphics; Lamont-Doherty Earth Observatory, Columbia University: Palisades, NY, USA, 2005; 14p. [Google Scholar]
- Reineke, L.H. Perfecting a stand-density index for even-aged forest. J. Agric. Res. 1933, 46, 627–638. [Google Scholar]
- Yoda, K. Self-thinning in overcrowded pure stands under cultivated and natural conditions (Intraspecific competition among higher plants XI). J. Biol. Osaka City Univ. D 1963, 14, 107–129. [Google Scholar]
- Usoltsev, V.A.; Lin, H.; Shobairi, S.O.R.; Tsepordey, I.S.; Ye, Z. Are there differences in the reaction of the light-tolerant subgenus Pinus spp. biomass to climate change as compared to light-intolerant genus Picea spp.? Plants 2020, 9, 1255. [Google Scholar] [CrossRef] [PubMed]
- Voltas, J.; Aguilera, M.; Gutiérrez, E.; Shestakova, T.A. Shared drought responses among conifer species in the middle Siberian taiga are uncoupled from their contrasting water-use efficiency trajectories. Sci. Total Environ. 2020, 720, 137590. [Google Scholar] [CrossRef] [PubMed]
- Kharuk, V.I.; Petrov, I.Y.A.; Shushpanov, A.S.; Im, S.T.; Ondar, S.O. Scots pine at its southern range in Siberia: A combined drought and fire influence on tree vigor, growth, and regeneration. Forests 2025, 16, 819. [Google Scholar] [CrossRef]
- Kishchenko, I.T. The effect of climatic factors on the seasonal development of coniferous forest-forming species in the taiga zone (Karelia). Izv. Vyssh. Uchebn. Zaved. Lesn. Zh. News Higher Educ. Inst. Russ. J. For. 2020, 3, 375. (In Russian) [Google Scholar] [CrossRef]
- Ryabov, N.S.; Zanuzdaeva, N.V.; Isaeva, L.G. analysis of seasonal events changes of Lapland State Nature Reserve coniferous species and their relations to climate factors. Trans. Kola Sci. Cent. RAS. Ser. Nat. Sci. Humanit. 2024, 3, 51–62. (In Russian) [Google Scholar] [CrossRef]
- Schulte, P.J. Vertical and radial profiles in tracheid characteristics along the trunk of Douglas-fir trees with implications for water transport. Trees 2012, 26, 421–433. [Google Scholar] [CrossRef]
- Dahlen, J.; Nabavi, M.; Auty, D.; Schimleck, L.; Eberhardt, T.L. Models for predicting the within-tree and regional variation of tracheid length and width for plantation loblolly pine. For. Int. J. For. Res. 2021, 94, 127–140. [Google Scholar] [CrossRef]
- Held, M.; Ganthaler, A.; Lintunen, A.; Oberhuber, W.; Mayr, S. Tracheid and pit dimensions hardly vary in the xylem of Pinus sylvestris under contrasting growing conditions. Front. Plant Sci. 2021, 12, 786593. [Google Scholar] [CrossRef]
- Babushkina, E.A.; Dergunov, D.R.; Belokopytova, L.V.; Zhirnova, D.F.; Upadhyay, K.K.; Tripathi, S.K.; Zharkov, M.S.; Vaganov, E.A. Non-linear response to cell number revealed and eliminated from long-term tracheid measurements of Scots pine in Southern Siberia. Front. Plant Sci. 2021, 12, 719796. [Google Scholar] [CrossRef]
- Belokopytova, L.V.; Zhirnova, D.F.; Mehrotra, N.; Shah, S.K.; Babushkina, E.A.; Vaganov, E.A. Improving the equation of nonlinear relationships between cell anatomical parameters of conifer wood. Trees 2024, 38, 1593–1599. [Google Scholar] [CrossRef]
- Olson, M.E.; Anfodillo, T.; Gleason, S.M.; McCulloh, K.A. Tip-to-base xylem conduit widening as an adaptation: Causes, consequences, and empirical priorities. New Phytol. 2021, 229, 1877–1893. [Google Scholar] [CrossRef] [PubMed]
- Funada, R.; Kubo, T.; Fushitani, M. Early-and latewood formation in Pinus densiflora trees with different amounts of crown. IAWA J. 1990, 11, 281–288. [Google Scholar] [CrossRef]
- Kijidani, Y.; Ohshiro, N.; Matsumura, J.; Koga, S. Effects of crown length on indole acetic acid (IAA) amounts in cambial region tissues in lower and upper trunks of sugi cultivars (Cryptomeria japonica) in September. J. Wood Sci. 2014, 60, 235–242. [Google Scholar] [CrossRef]
- Skomarkova, M.V.; Vaganov, E.A.; Wirth, C.; Kirdyanov, A.V. Climatic conditionality of radial increment of conifers and hardwoods in the middle taiga subzone of Central Siberia. Geogr. Nat. Resour. 2009, 30, 167–172. [Google Scholar] [CrossRef]
- Lloyd, A.H.; Bunn, A.G.; Berner, L. A latitudinal gradient in tree growth response to climate warming in the Siberian taiga. Glob. Change Biol. 2011, 17, 1935–1945. [Google Scholar] [CrossRef]
- Tabakova, M.A.; Arzac, A.; Martínez, E.; Kirdyanov, A.V. Climatic factors controlling Pinus sylvestris radial growth along a transect of increasing continentality in southern Siberia. Dendrochronologia 2020, 62, 125709. [Google Scholar] [CrossRef]
- Mayr, S.; Hacke, U.; Schmid, P.; Schwienbacher, F.; Gruber, A. Frost drought in conifers at the alpine timberline: Xylem dysfunction and adaptations. Ecology 2006, 87, 3175–3185. [Google Scholar] [CrossRef]
- Mayr, S. Limits in water relations. In Trees at Their Upper Limit. Treelife Limitation at the Alpine Timberline; Wieser, G., Tausz, M., Eds.; Springer: Dordrecht, The Netherlands, 2007; pp. 145–162. [Google Scholar] [CrossRef]
- Pittermann, J.; Sperry, J.S.; Hacke, U.G.; Wheeler, J.K.; Sikkema, E.H. Inter-tracheid pitting and the hydraulic efficiency of conifer wood: The role of tracheid allometry and cavitation protection. Am. J. Bot. 2006, 93, 1265–1273. [Google Scholar] [CrossRef] [PubMed]
- Ren, P.; Fang, J.; Song, H.; Silvestro, R.; Li, X.; Li, Z.; Wang, Y.; Rossi, S. Cell enlargement drives xylem hydraulic efficiency and safety in Pinus tabulaeformis on the Loess Plateau. Agric. For. Meteorol. 2025, 372, 110724. [Google Scholar] [CrossRef]
- Cabon, A.; Fernández-de-Uña, L.; Gea-Izquierdo, G.; Meinzer, F.C.; Woodruff, D.R.; Martínez-Vilalta, J.; De Cáceres, M. Water potential control of turgor-driven tracheid enlargement in Scots pine at its xeric distribution edge. New Phytol. 2020, 225, 209–221. [Google Scholar] [CrossRef]
- Peters, R.L.; Steppe, K.; Cuny, H.E.; De Pauw, D.J.; Frank, D.C.; Schaub, M.; Rathgeber, C.B.K.; Cabon, A.; Fonti, P. Turgor—A limiting factor for radial growth in mature conifers along an elevational gradient. New Phytol. 2021, 229, 213–229. [Google Scholar] [CrossRef]
- Nokhsorov, V.V.; Dudareva, L.V.; Petrov, K.A. Content and composition of lipids and their fatty acids in needles of Pinus sylvestris L. and Picea obovata Ledeb. upon cold hardening in the cryolithozone of Yakutia. Russ. J. Plant Physiol. 2019, 66, 548–555. [Google Scholar] [CrossRef]
- Kosiba, A.M.; Schaberg, P.G.; Hawley, G.J.; Hansen, C.F. Quantifying the legacy of foliar winter injury on woody aboveground carbon sequestration of red spruce trees. For. Ecol. Manag. 2013, 302, 363–371. [Google Scholar] [CrossRef]
- Deslauriers, A.; Caron, L.; Rossi, S. Carbon allocation during defoliation: Testing a defense-growth trade-off in balsam fir. Front. Plant Sci. 2015, 6, 338. [Google Scholar] [CrossRef]
- Hamilton, J.A.; El Kayal, W.; Hart, A.T.; Runcie, D.E.; Arango-Velez, A.; Cooke, J.E. The joint influence of photoperiod and temperature during growth cessation and development of dormancy in white spruce (Picea glauca). Tree Physiol. 2016, 36, 1432–1448. [Google Scholar] [CrossRef]
- Mu, W.; Wu, X.; Camarero, J.J.; Fu, Y.H.; Huang, J.; Li, X.; Chen, D. Photoperiod drives cessation of wood formation in northern conifers. Glob. Ecol. Biogeog. 2023, 32, 603–617. [Google Scholar] [CrossRef]
- Lim, C.C.; Krebs, S.L.; Arora, R. Cold hardiness increases with age in juvenile Rhododendron populations. Front. Plant Sci. 2014, 5, 542. [Google Scholar] [CrossRef]
- Charrier, G.; Ngao, J.; Saudreau, M.; Améglio, T. Effects of environmental factors and management practices on microclimate, winter physiology, and frost resistance in trees. Front. Plant Sci. 2015, 6, 259. [Google Scholar] [CrossRef] [PubMed]
- Gurskaya, M.A.; Shiyatov, S.G. Distribution of frost injuries in the wood of conifers. Russ. J. Ecol. 2006, 37, 7–12. [Google Scholar] [CrossRef]
- Neuner, G. Frost resistance in alpine woody plants. Front. Plant Sci. 2014, 5, 654. [Google Scholar] [CrossRef] [PubMed]
- Korotaeva, N.E.; Oskorbina, M.V.; Gritsai, E.N.; Borovskii, G.B. Changes in the content of water-soluble sugars in needles of Scots pine and Siberian spruce growing in the south of eastern Siberia. Sib. J. Life Sci. Agric. 2022, 14, 122–141. [Google Scholar] [CrossRef]
- Campelo, F.; Vieira, J.; Battipaglia, G.; de Luis, M.; Nabais, C.; Freitas, H.; Cherubini, P. Which matters most for the formation of intra-annual density fluctuations in Pinus pinaster: Age or size? Trees 2015, 29, 237–245. [Google Scholar] [CrossRef]
- Battipaglia, G.; Campelo, F.; Vieira, J.; Grabner, M.; De Micco, V.; Nabais, C.; Cherubin, P.; Carrer, M.; Bräuning, A.; Cufar, K.; et al. Structure and function of intra–annual density fluctuations: Mind the gaps. Front. Plant Sci. 2016, 7, 595. [Google Scholar] [CrossRef] [PubMed]
Disclaimer/Publisher’s Note: The statements, opinions and data contained in all publications are solely those of the individual author(s) and contributor(s) and not of MDPI and/or the editor(s). MDPI and/or the editor(s) disclaim responsibility for any injury to people or property resulting from any ideas, methods, instructions or products referred to in the content. |
© 2025 by the authors. Licensee MDPI, Basel, Switzerland. This article is an open access article distributed under the terms and conditions of the Creative Commons Attribution (CC BY) license (https://creativecommons.org/licenses/by/4.0/).