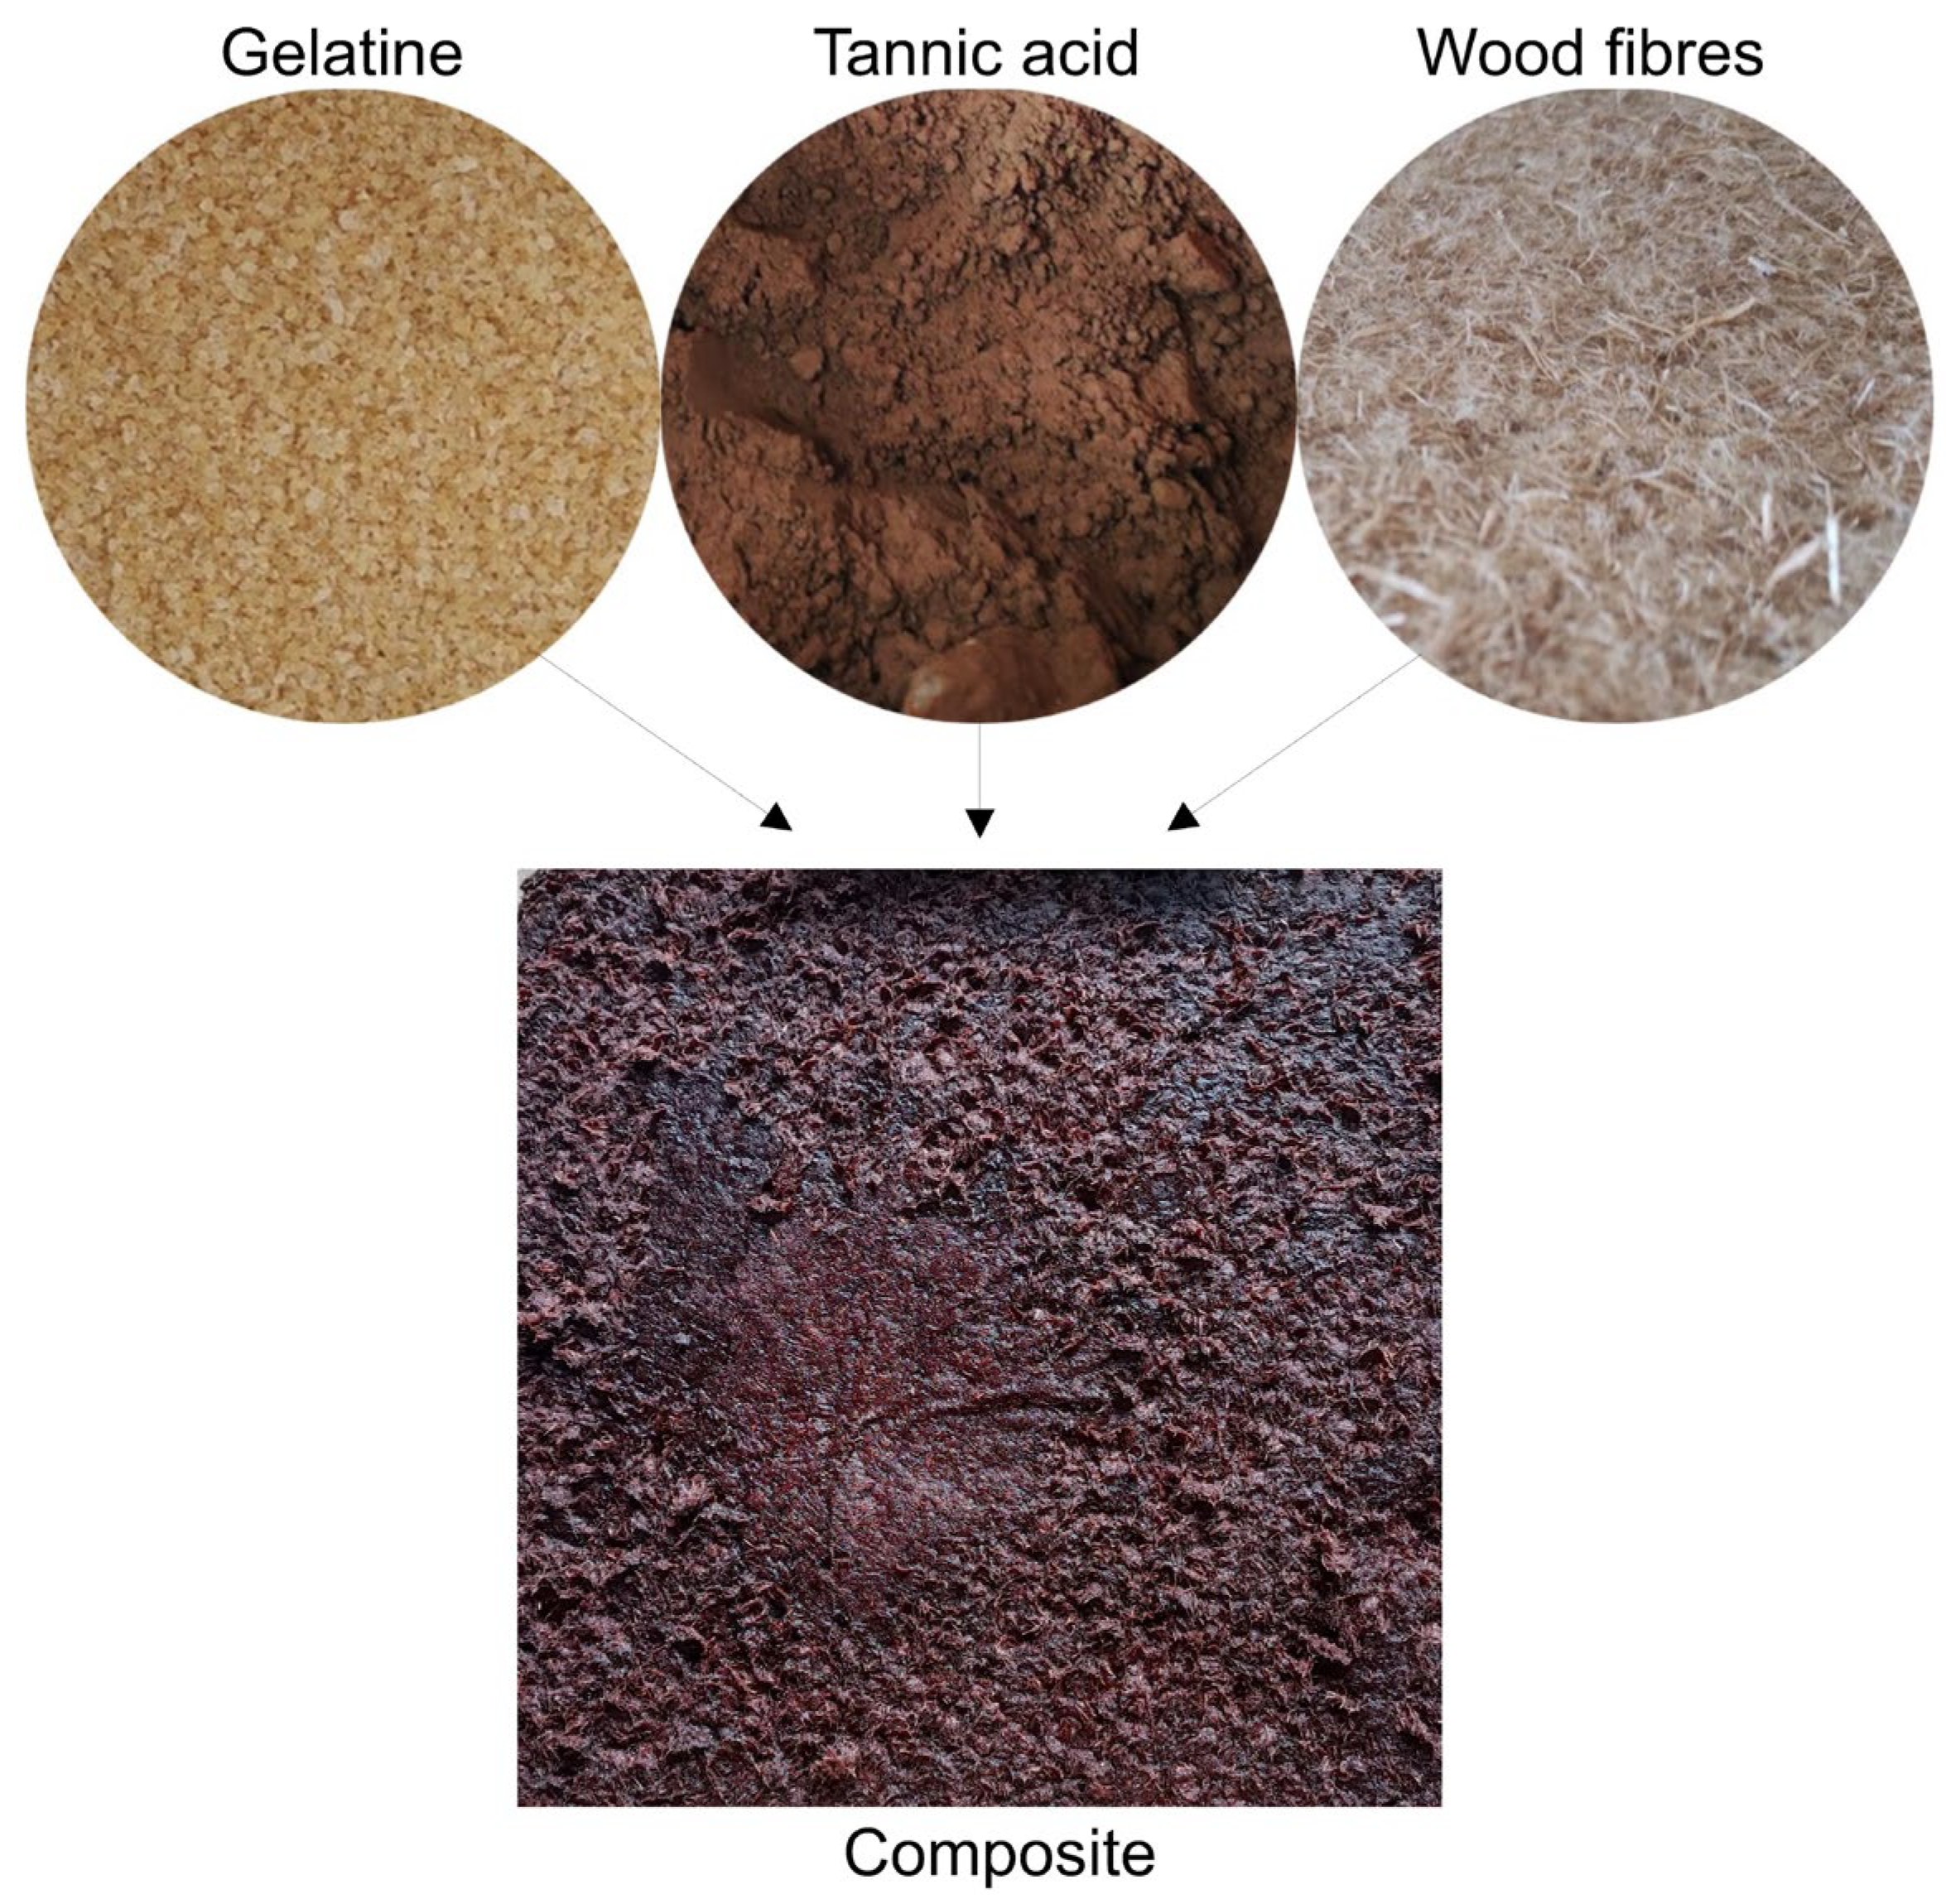
Figure 1.
The main ingredients of the composite (bottom) are gelatine (top left), tannic acid (top middle), and wood fibres (top right).
Figure 1.
The main ingredients of the composite (bottom) are gelatine (top left), tannic acid (top middle), and wood fibres (top right).
Figure 2.
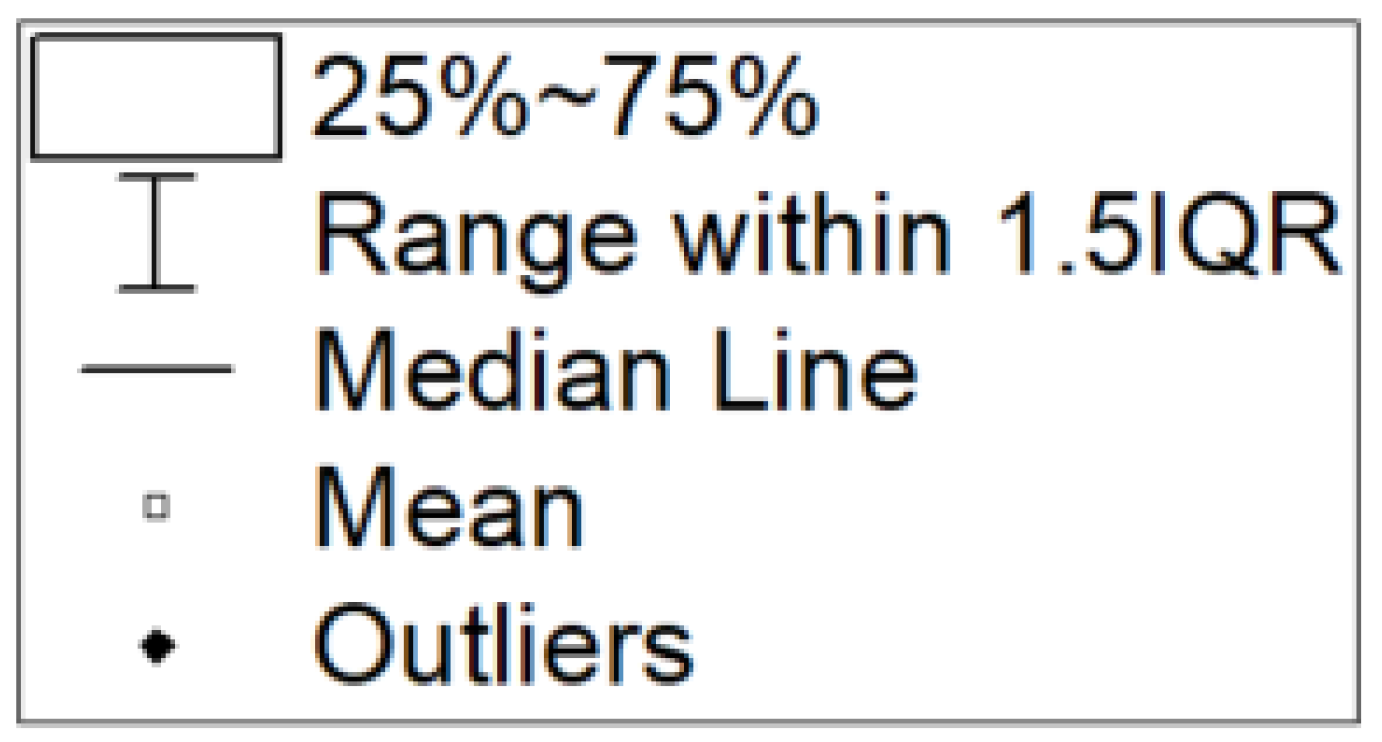
Legend for all box plots.
Figure 2.
Legend for all box plots.
Figure 3.
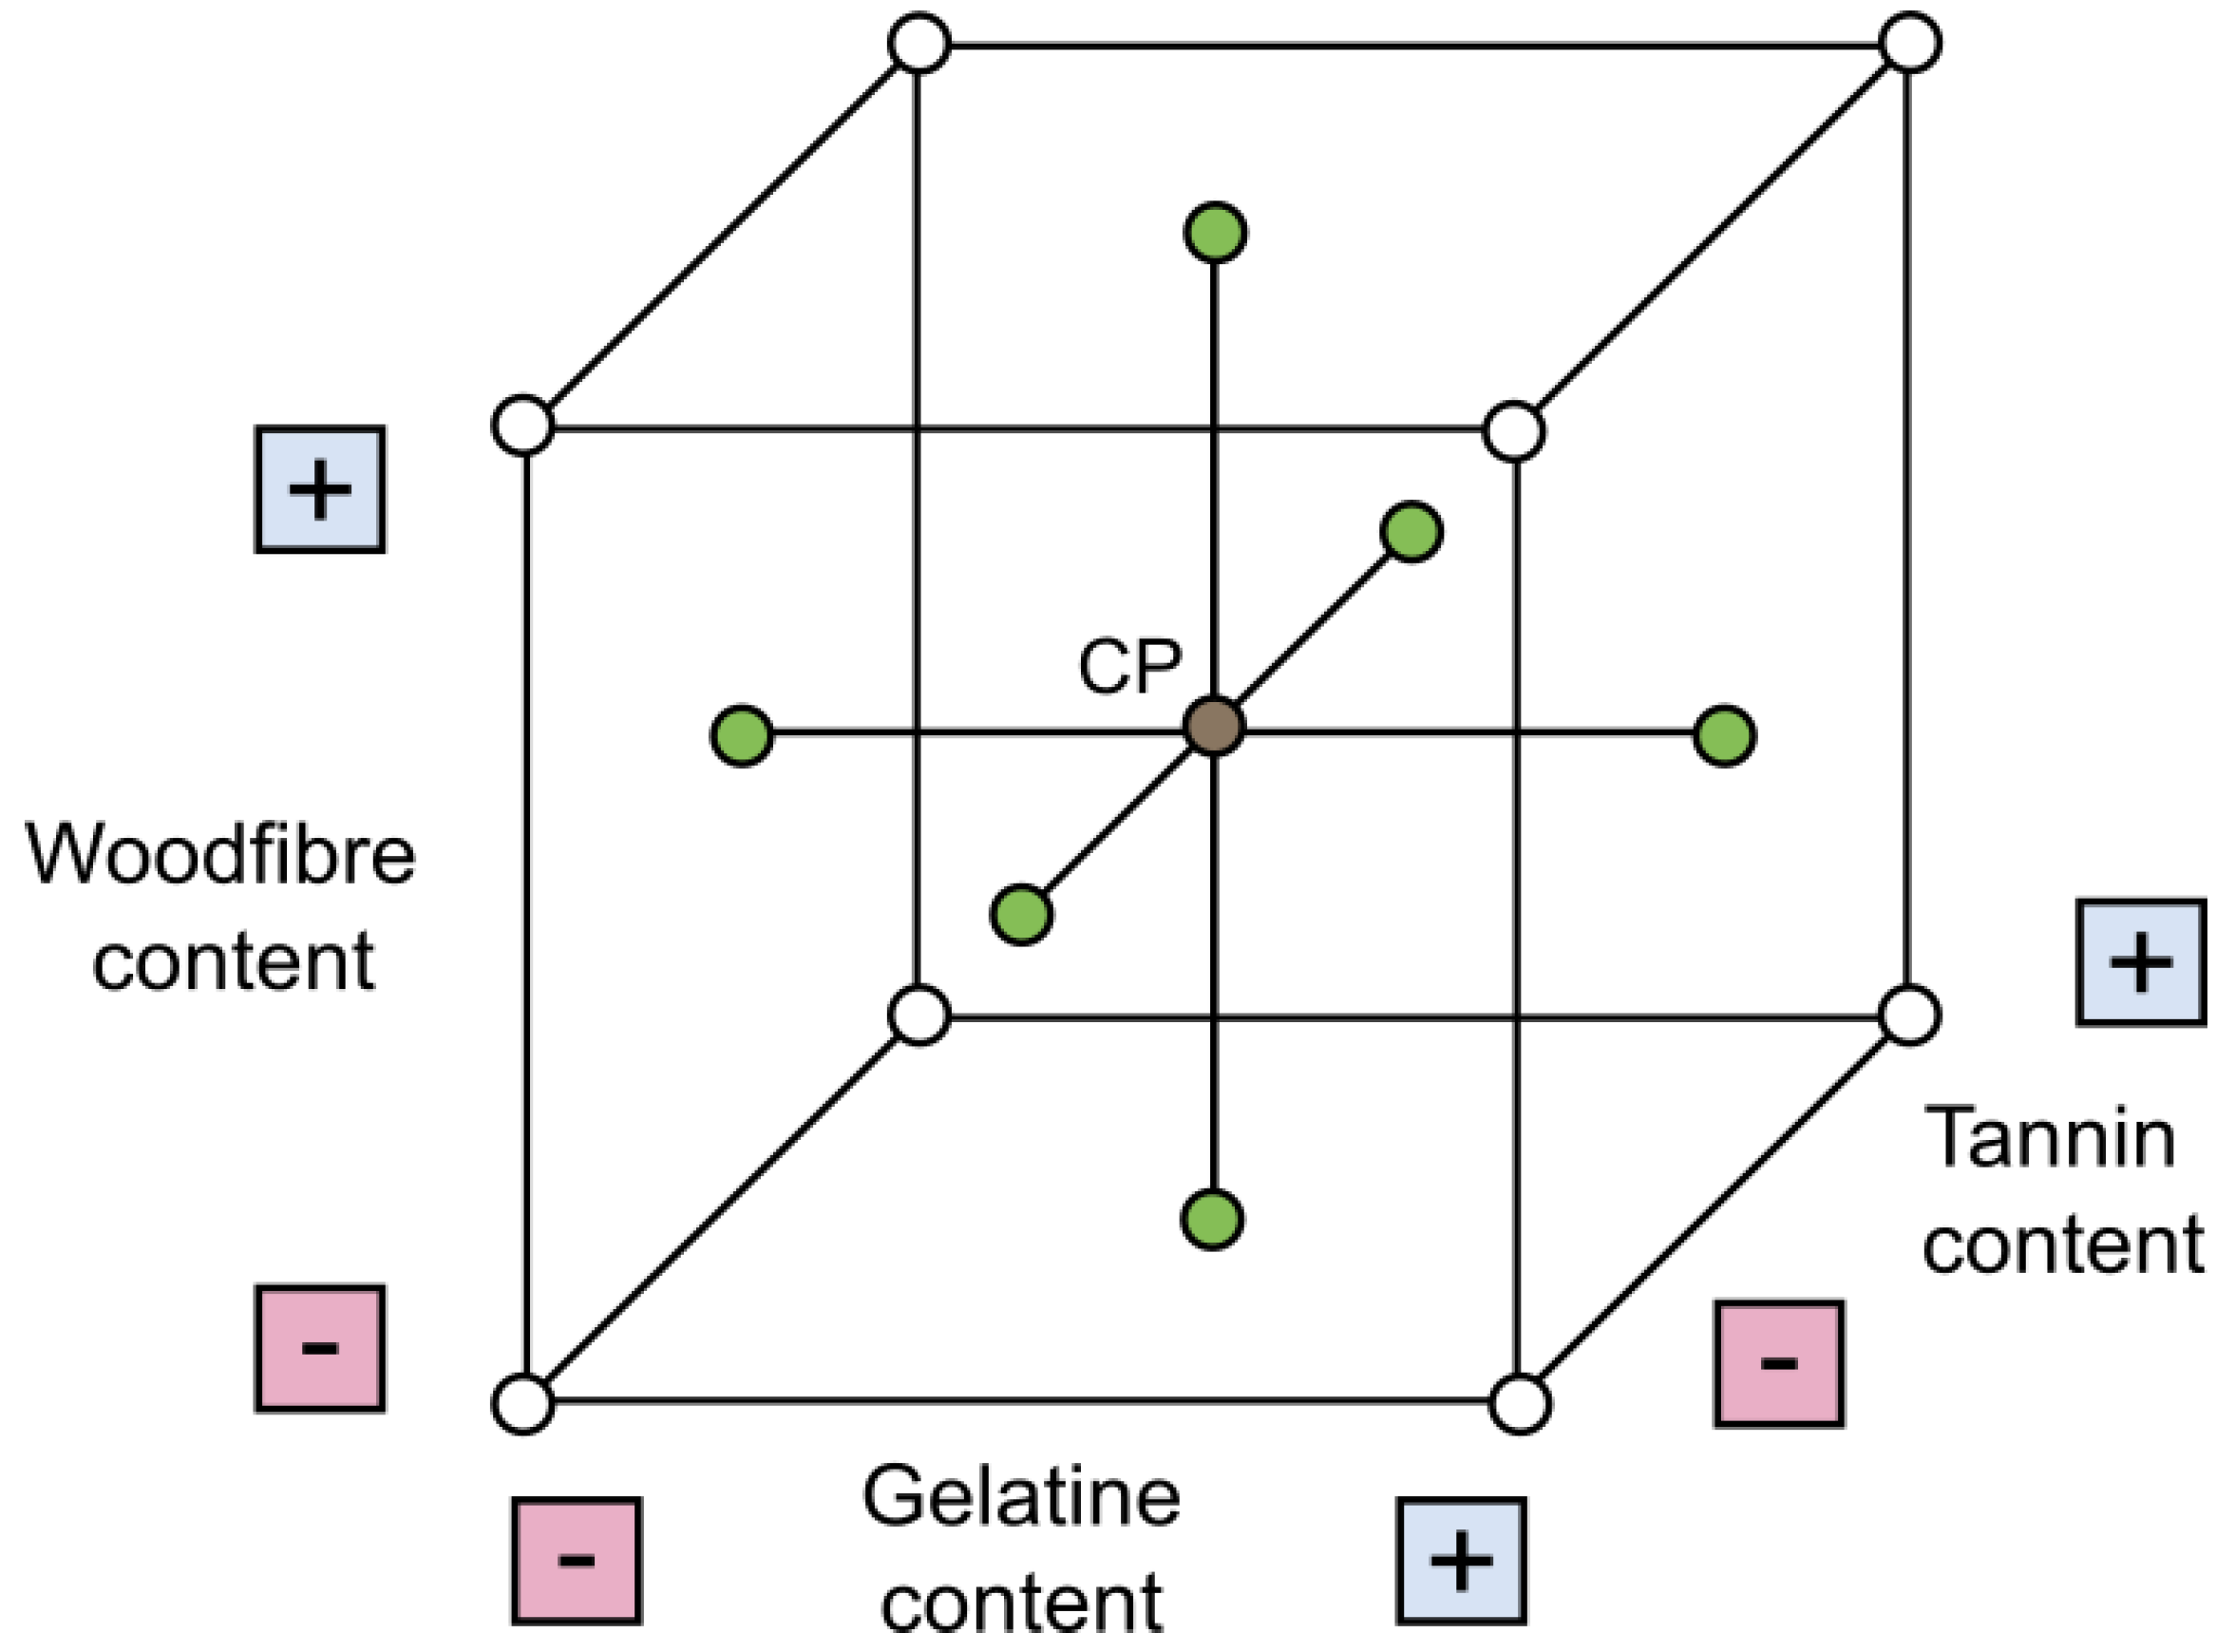
Face-centred central composite design. Variation of wood fibre, gelatine, and tannic acid contents.
Figure 3.
Face-centred central composite design. Variation of wood fibre, gelatine, and tannic acid contents.
Figure 4.
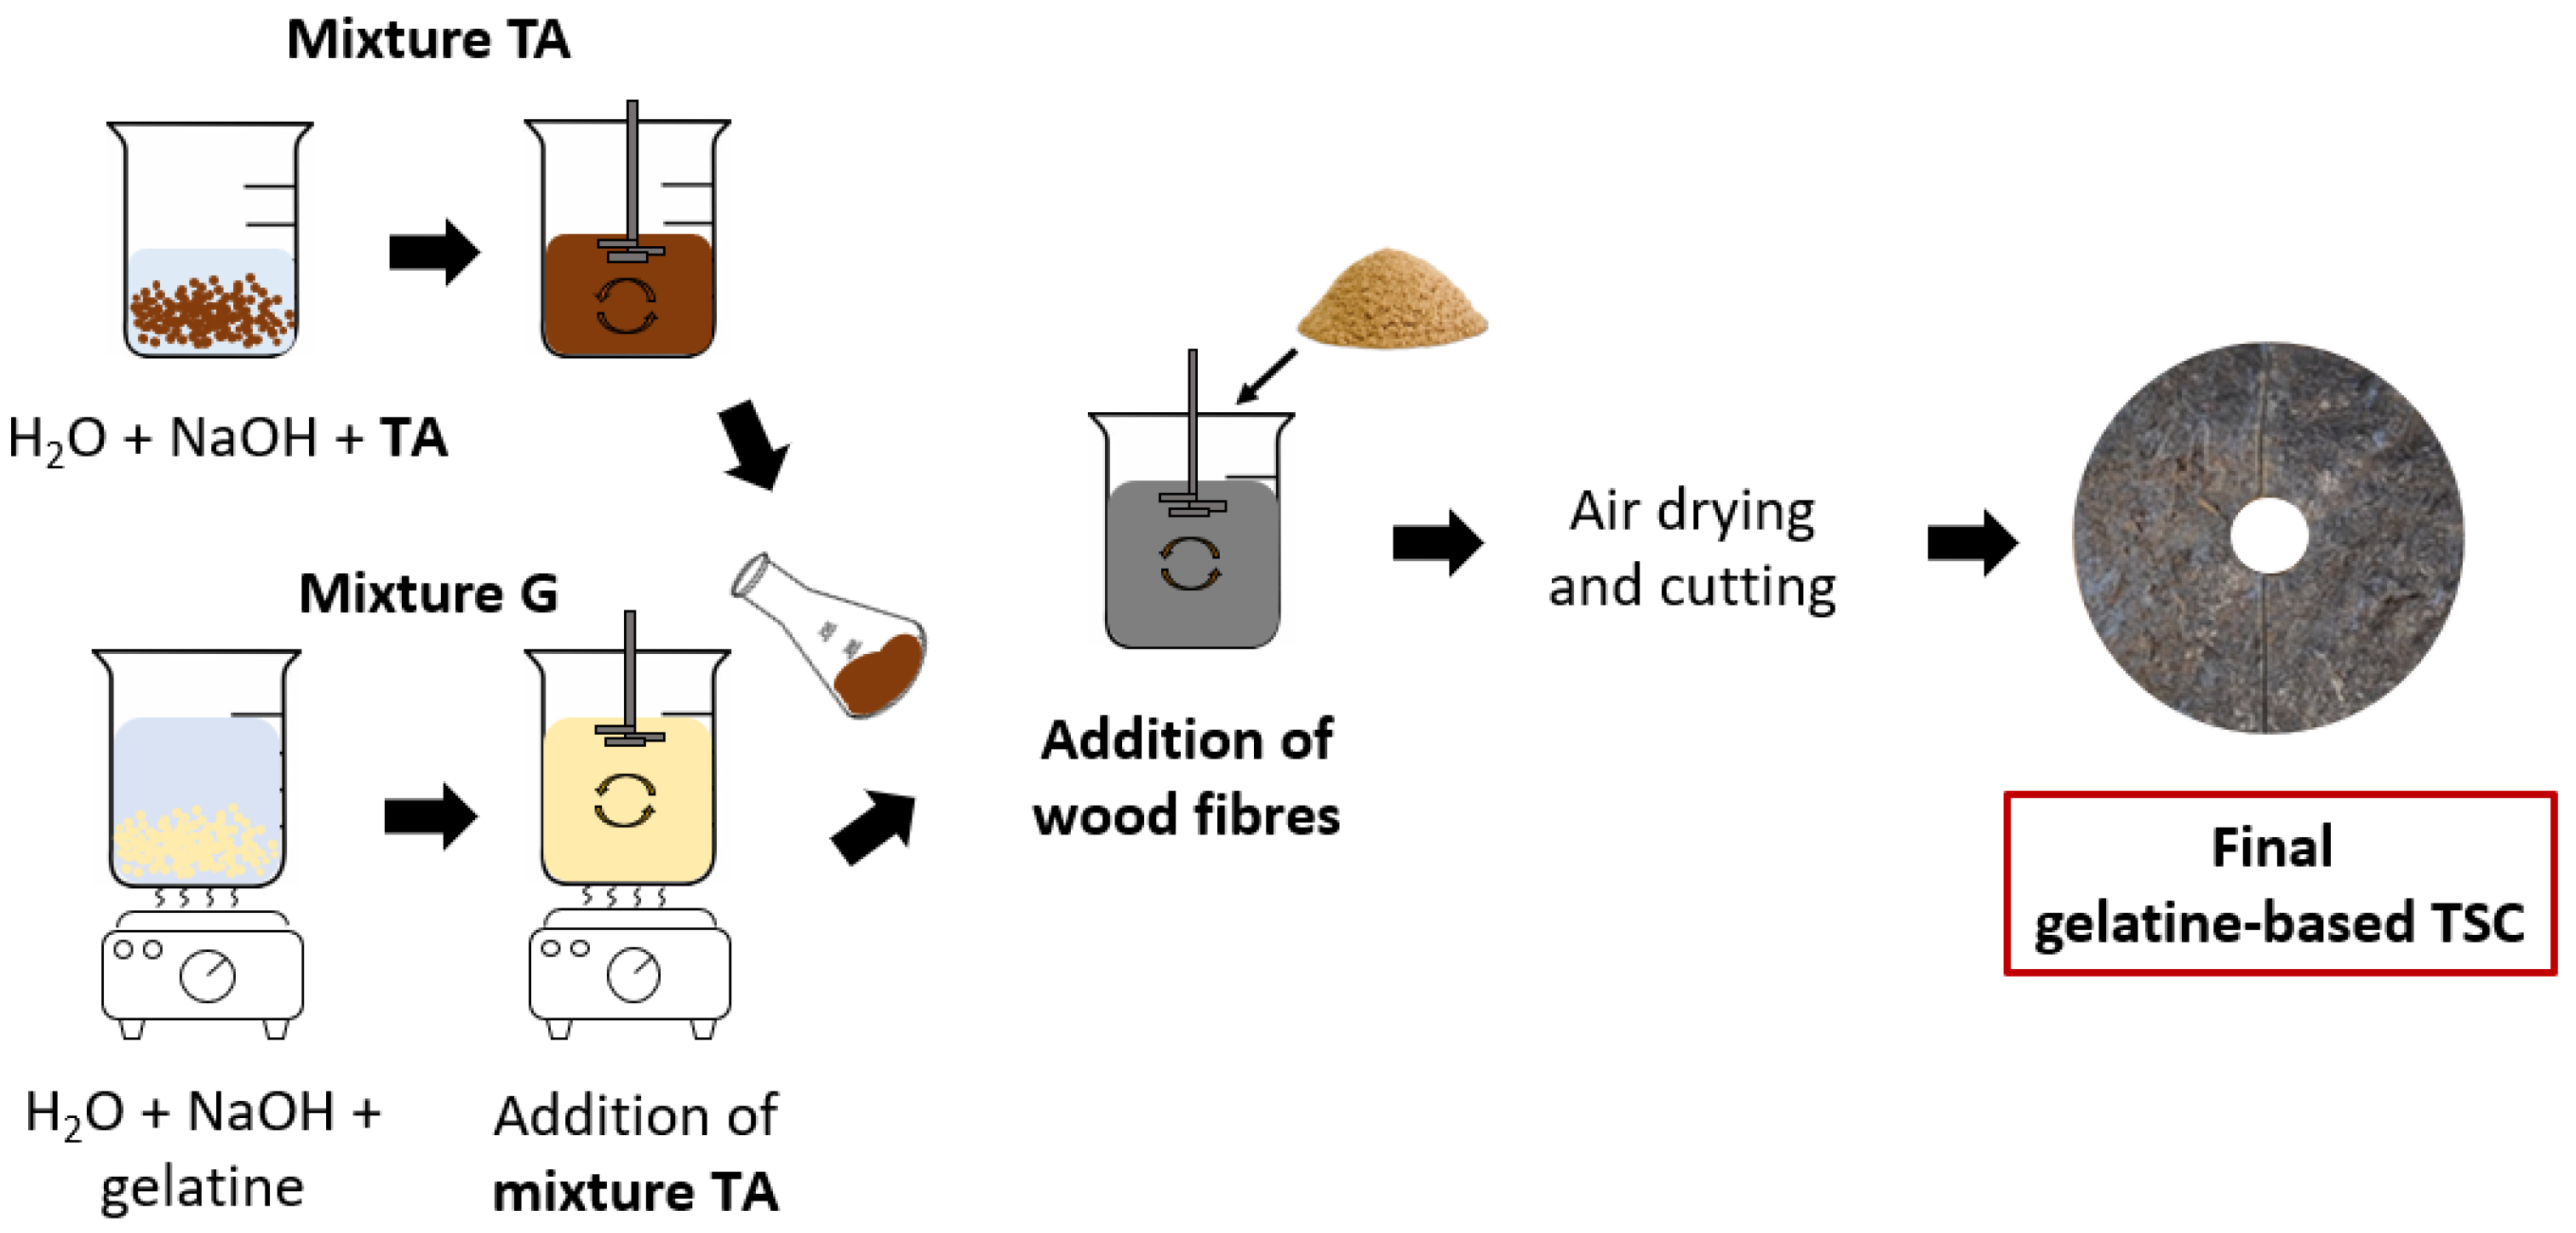
Sample preparation scheme.
Figure 4.
Sample preparation scheme.
Figure 5.
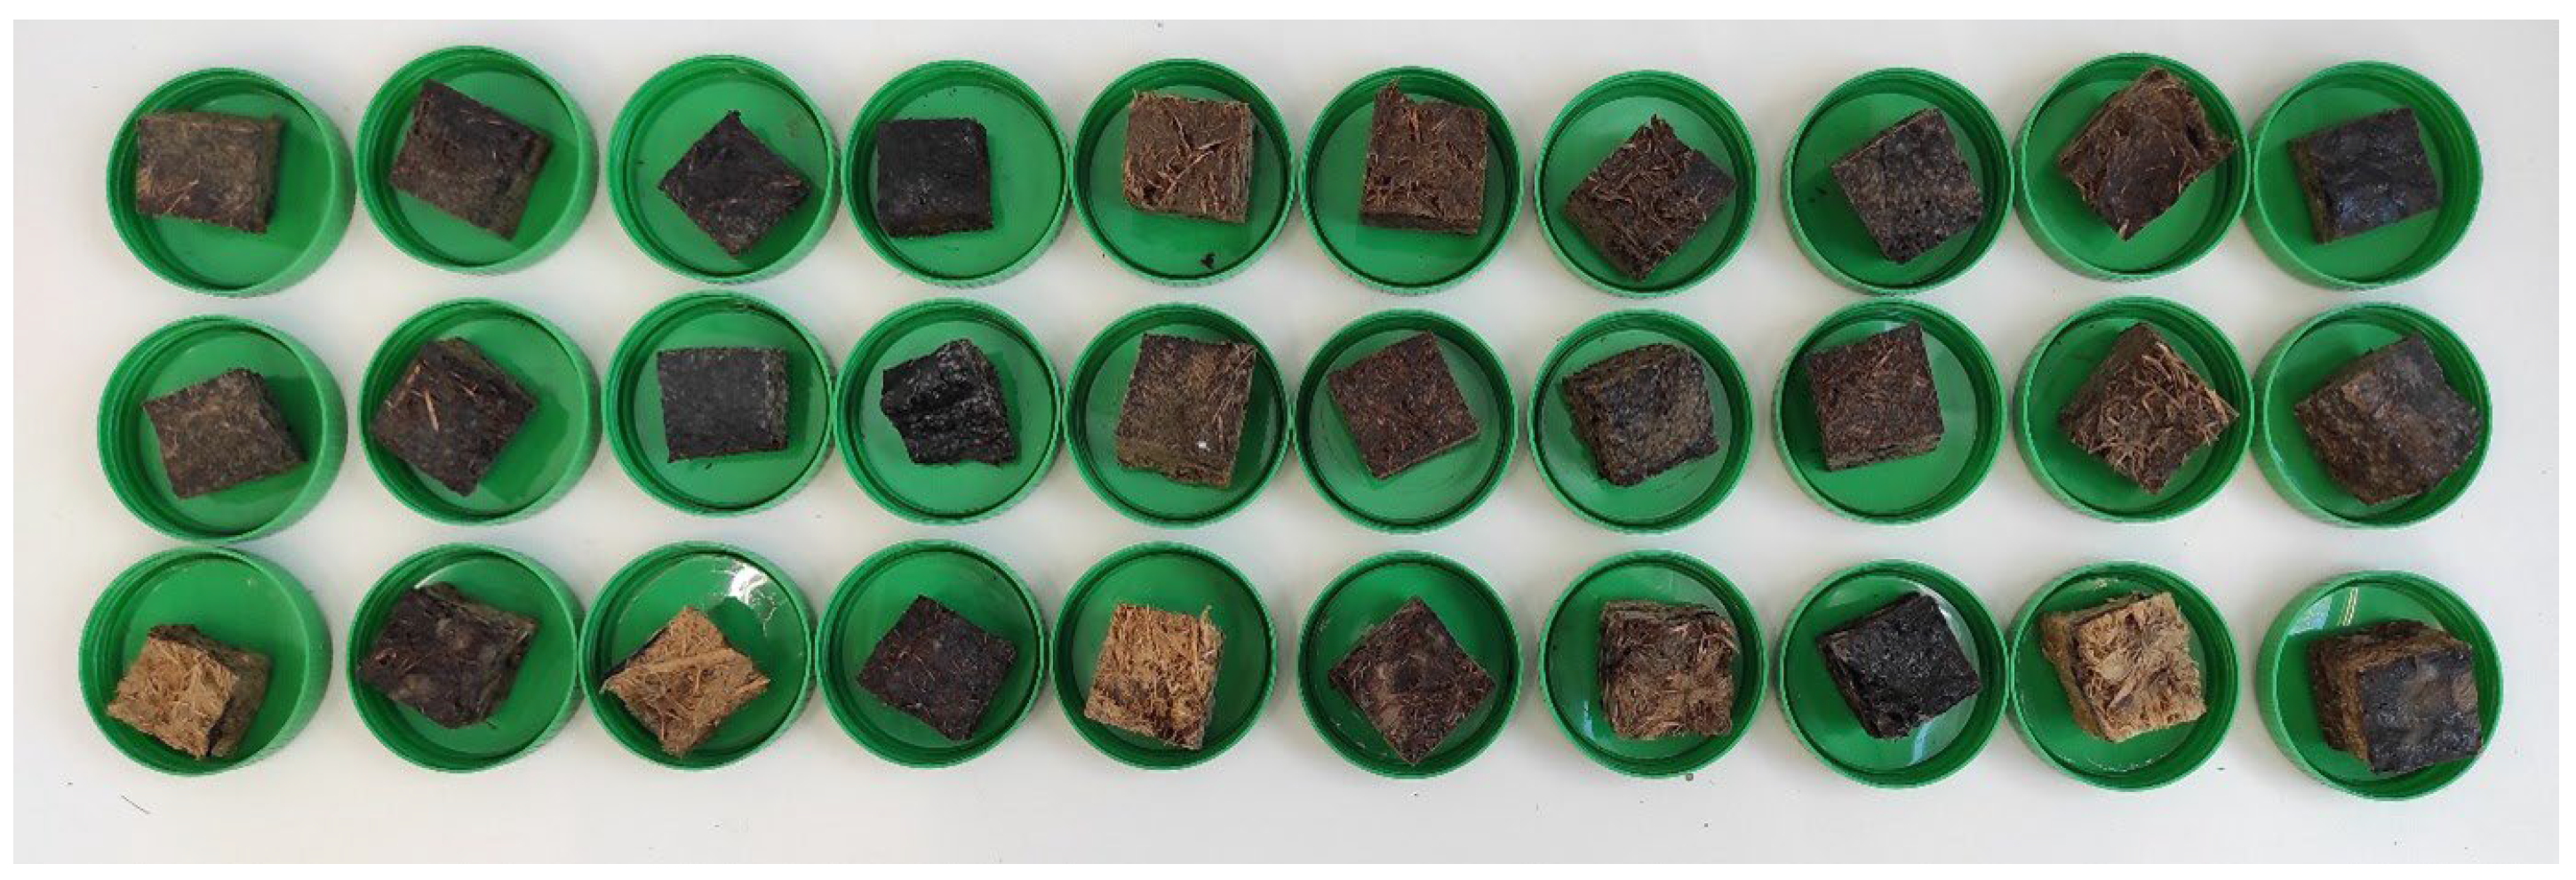
Water uptake samples after final drying; from left to right: IDs 5 R, 5 H, 6 R, 6 H, 7 R, 7 H, 8 R, 8 H, 9 R, 9 H. Top row (3 h in water), middle row (24 h in water), and bottom row (3 h at 80 °C in water).
Figure 5.
Water uptake samples after final drying; from left to right: IDs 5 R, 5 H, 6 R, 6 H, 7 R, 7 H, 8 R, 8 H, 9 R, 9 H. Top row (3 h in water), middle row (24 h in water), and bottom row (3 h at 80 °C in water).
Figure 6.
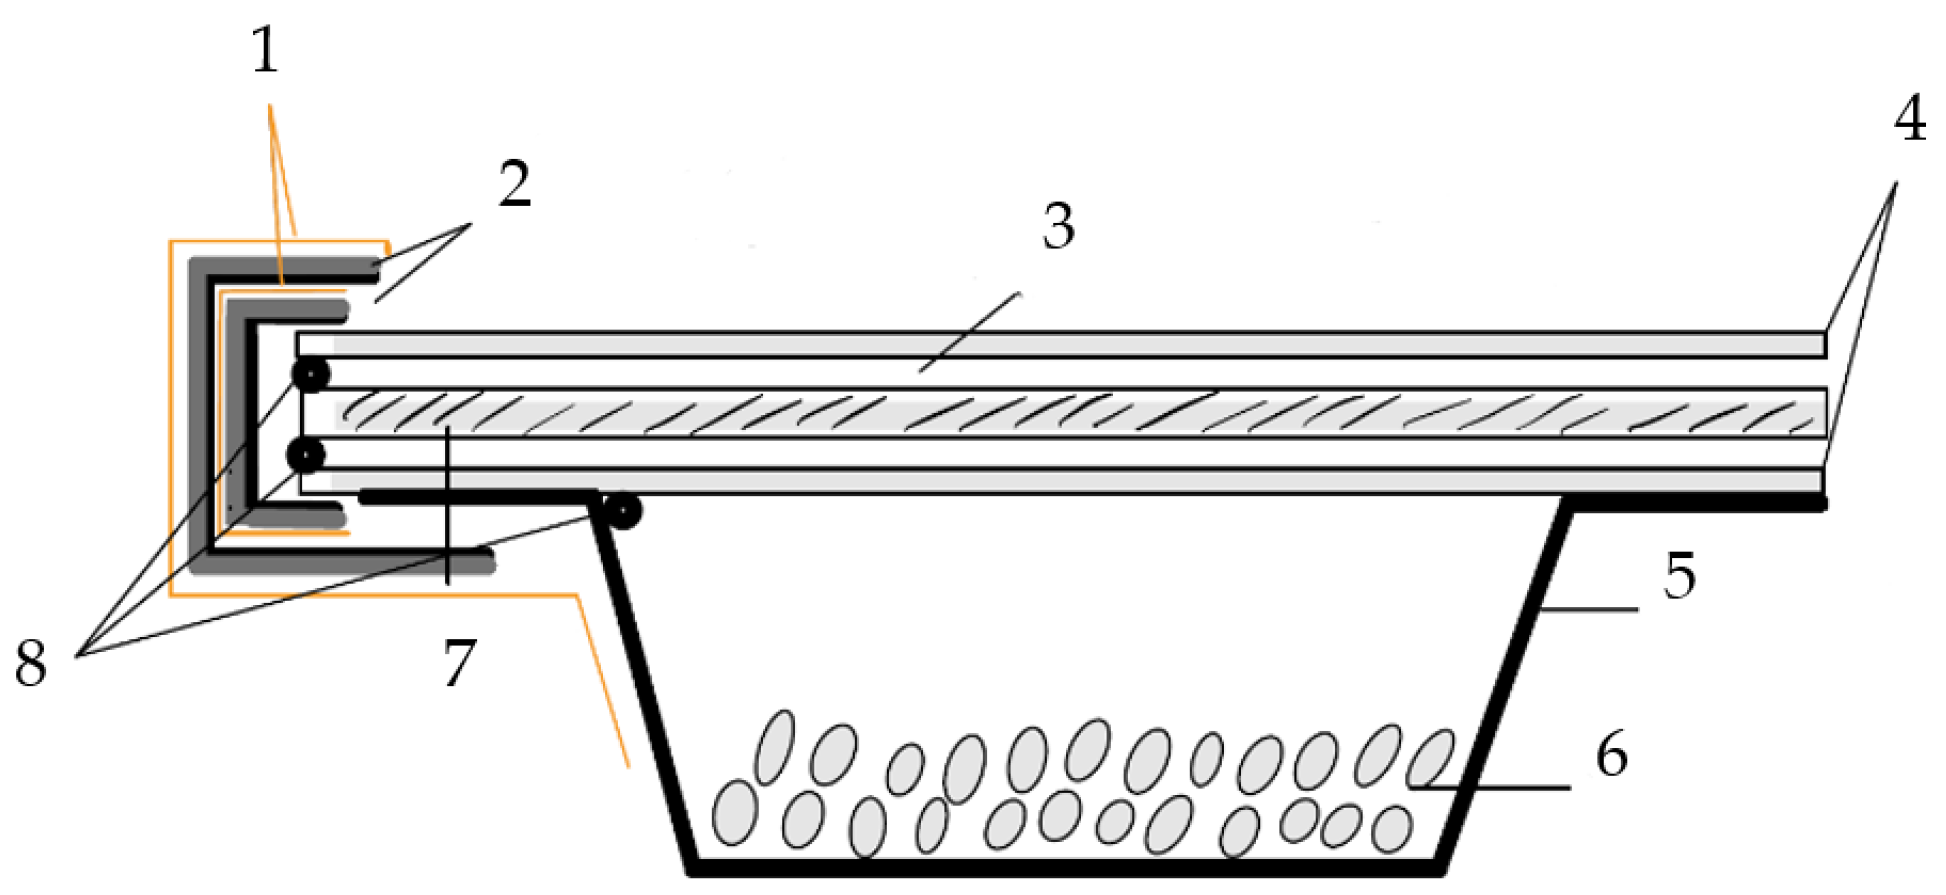
Schematic setup of WVP tests. 1: Parafilm. 2: Butyl tape with aluminium lamination. 3: Silicone joint. 4: Iron ring. 5: Aluminium dish. 6: Silica gel. 7: Test specimen. 8: Butyl sealing cord.
Figure 6.
Schematic setup of WVP tests. 1: Parafilm. 2: Butyl tape with aluminium lamination. 3: Silicone joint. 4: Iron ring. 5: Aluminium dish. 6: Silica gel. 7: Test specimen. 8: Butyl sealing cord.
Figure 7.
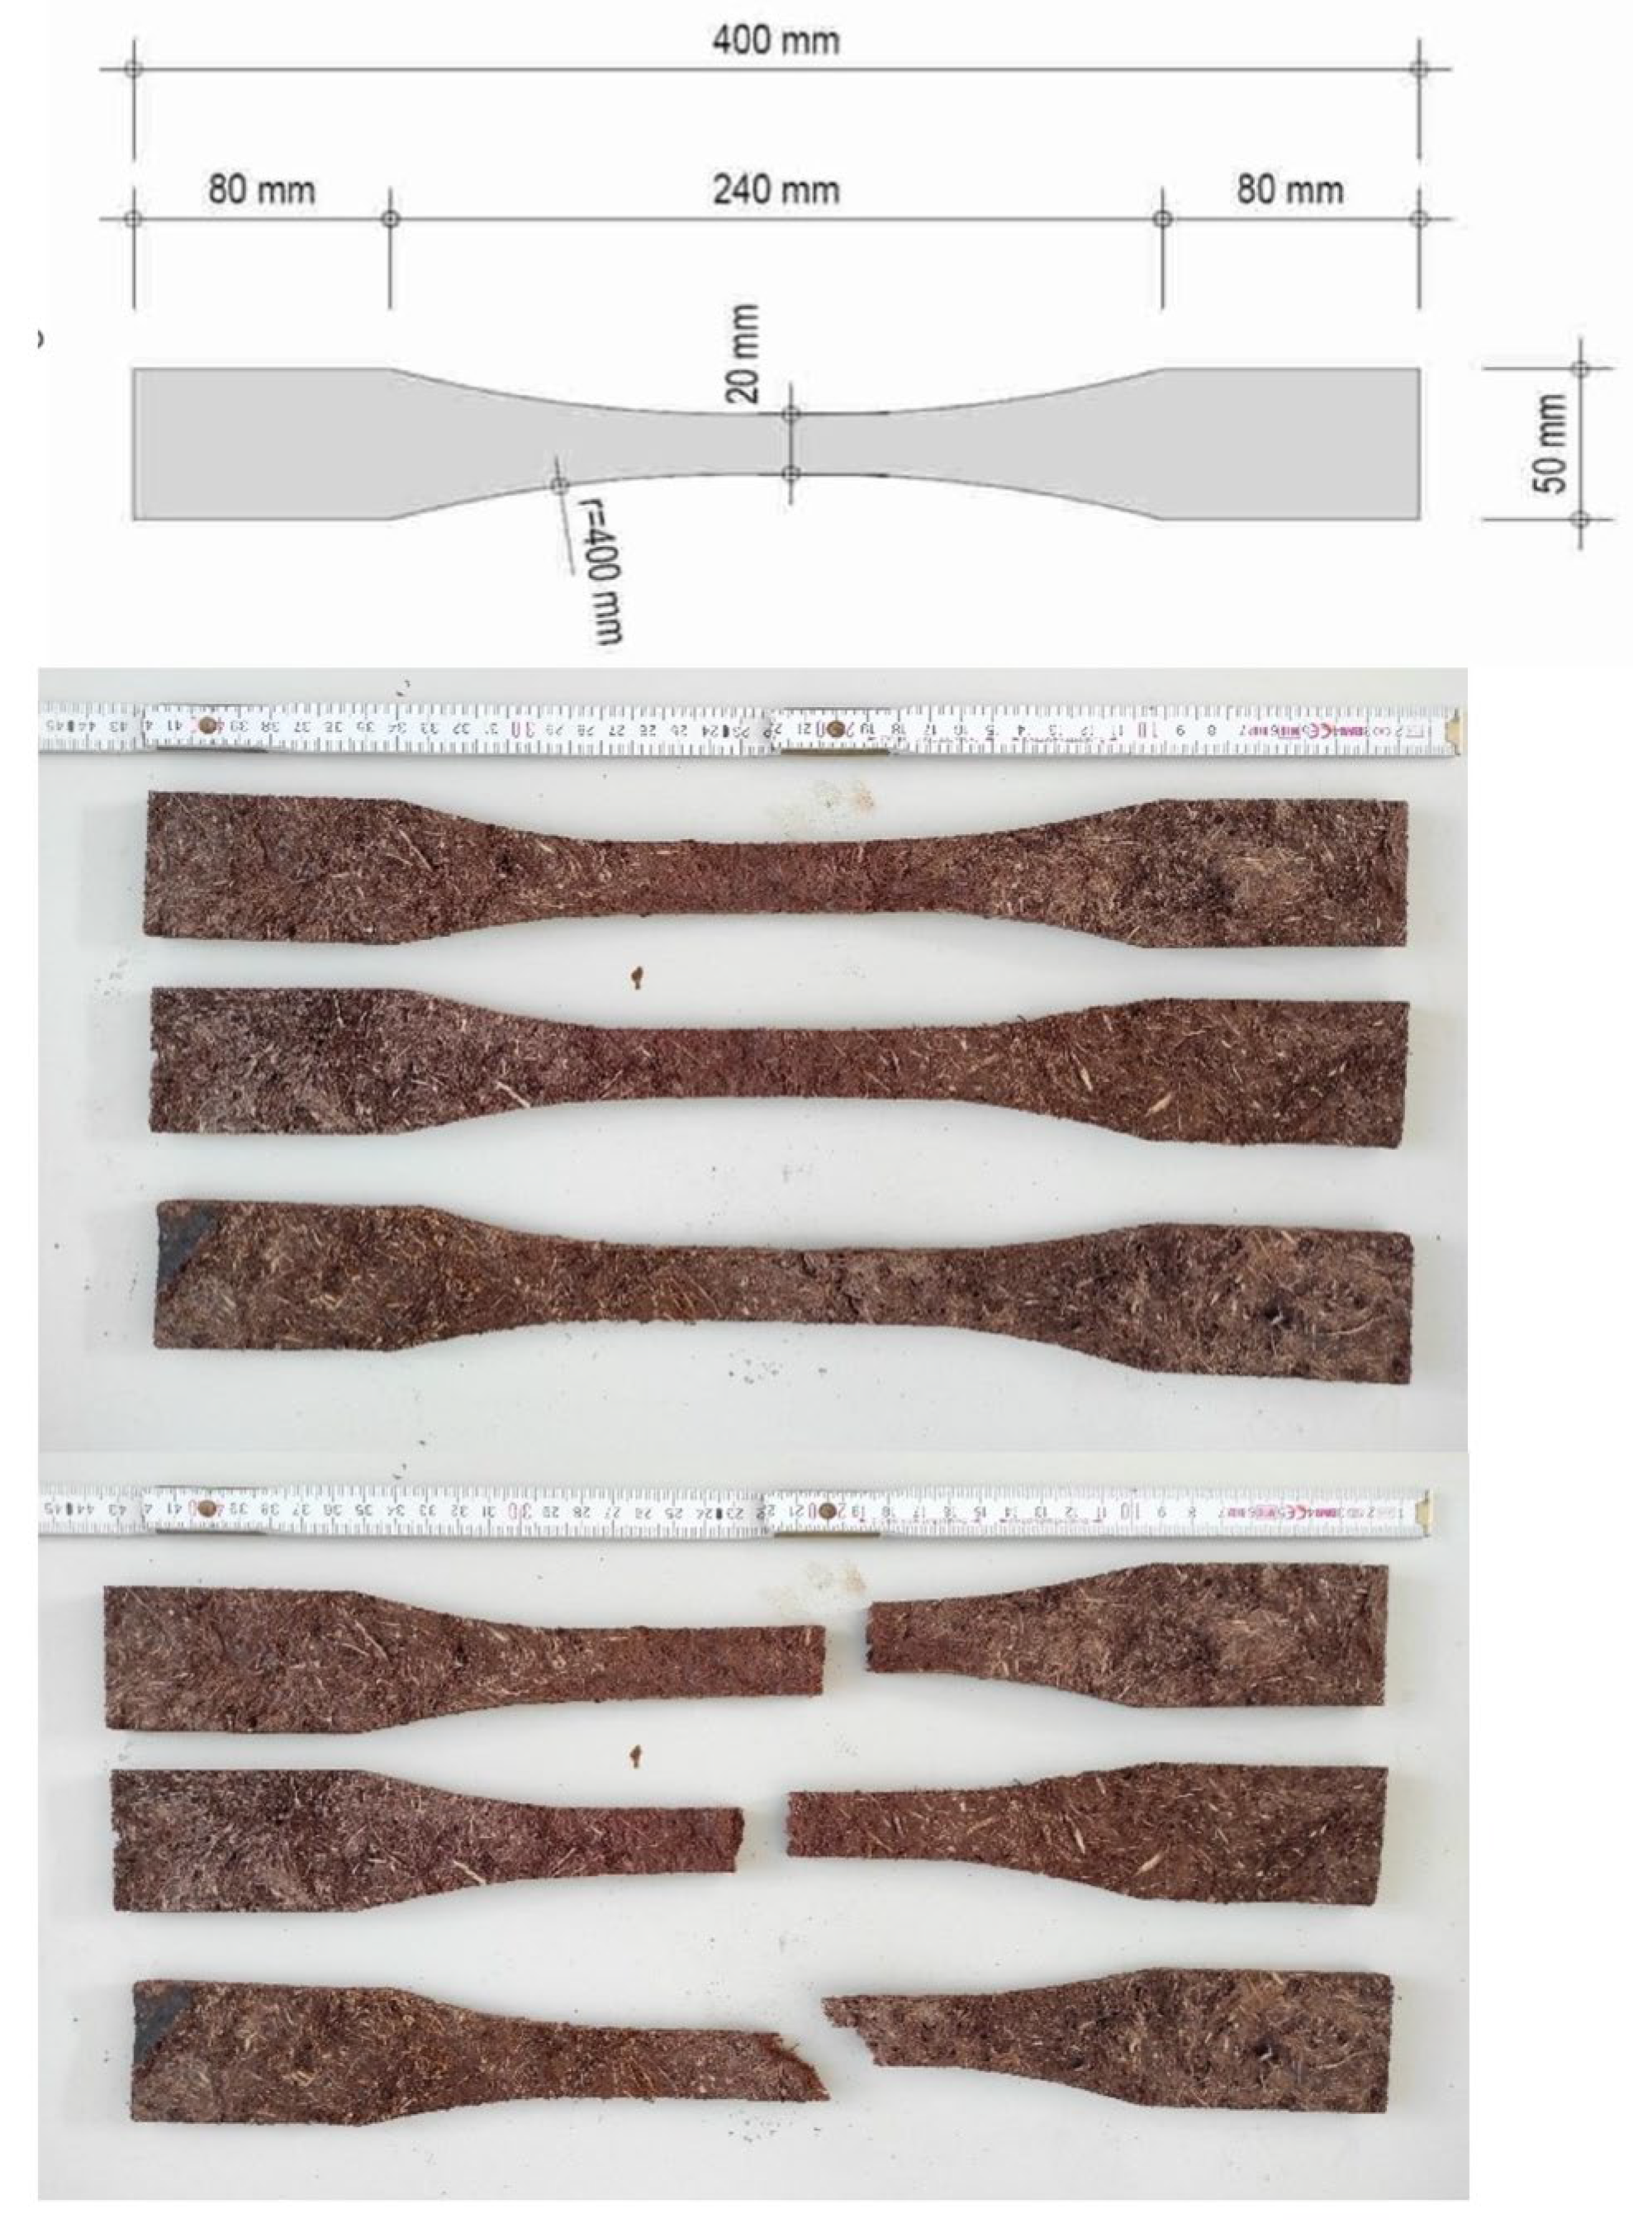
Schematic representation of a bone specimen (top), test specimens before (middle), and after the tensile test (bottom).
Figure 7.
Schematic representation of a bone specimen (top), test specimens before (middle), and after the tensile test (bottom).
Figure 8.
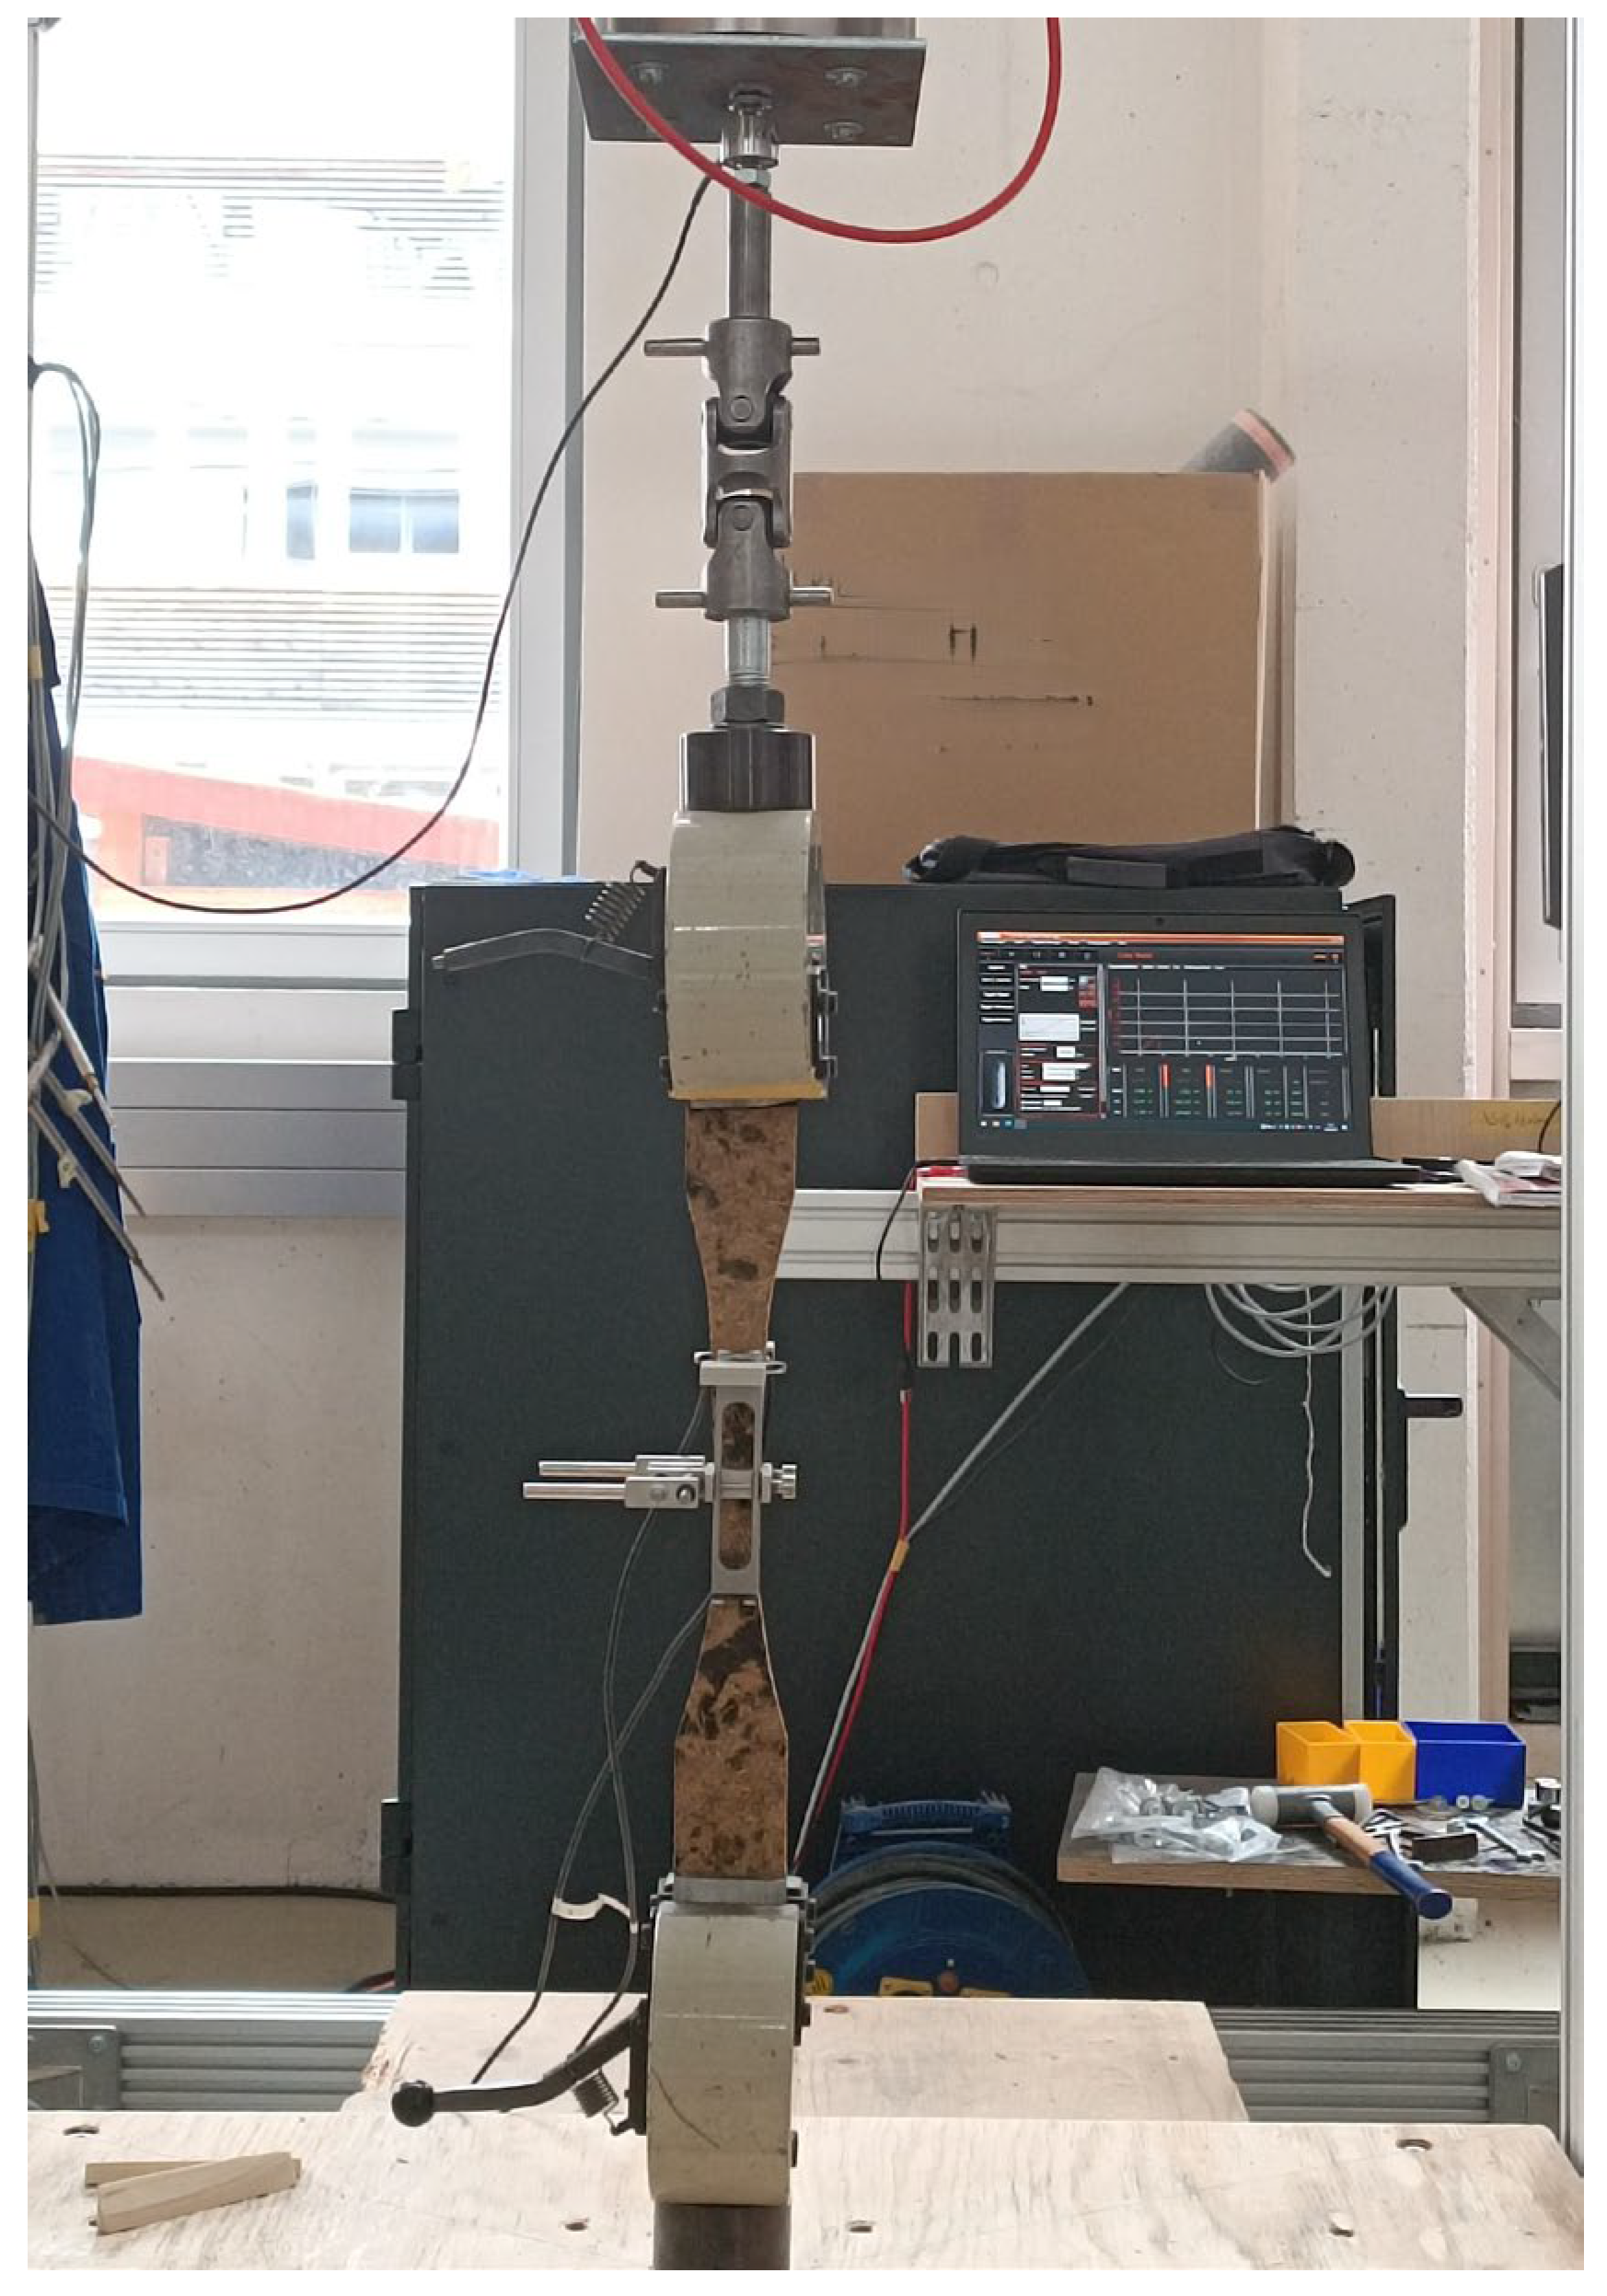
Tensile test setup.
Figure 8.
Tensile test setup.
Figure 9.
Weathering test setup after installation.
Figure 9.
Weathering test setup after installation.
Figure 10.
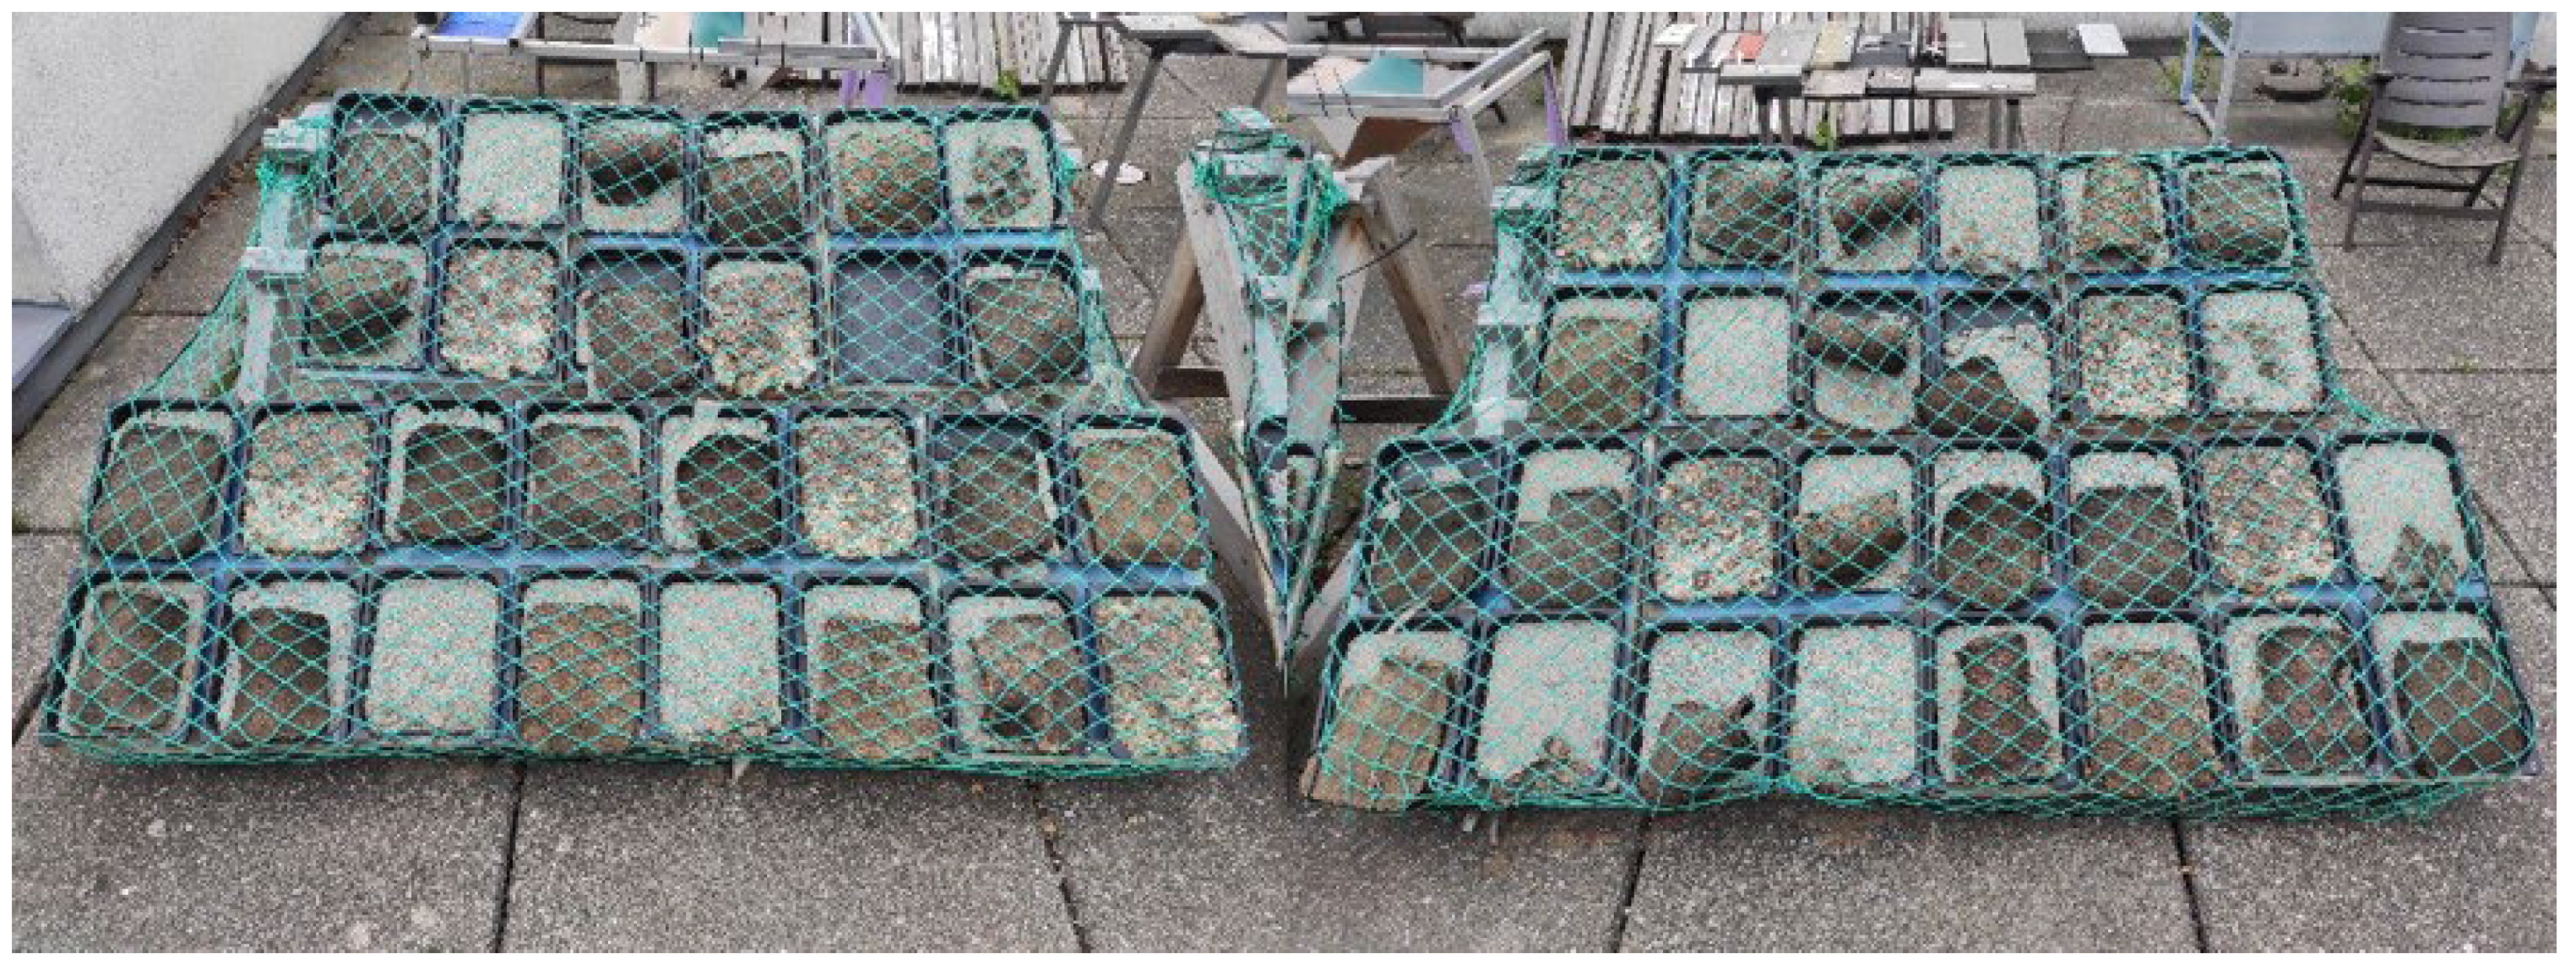
Weathering test setup at the end of the trials.
Figure 10.
Weathering test setup at the end of the trials.
Figure 11.
Layout of the weathering test setup; samples marked with * are not part of this publication.
Figure 11.
Layout of the weathering test setup; samples marked with * are not part of this publication.
Figure 12.
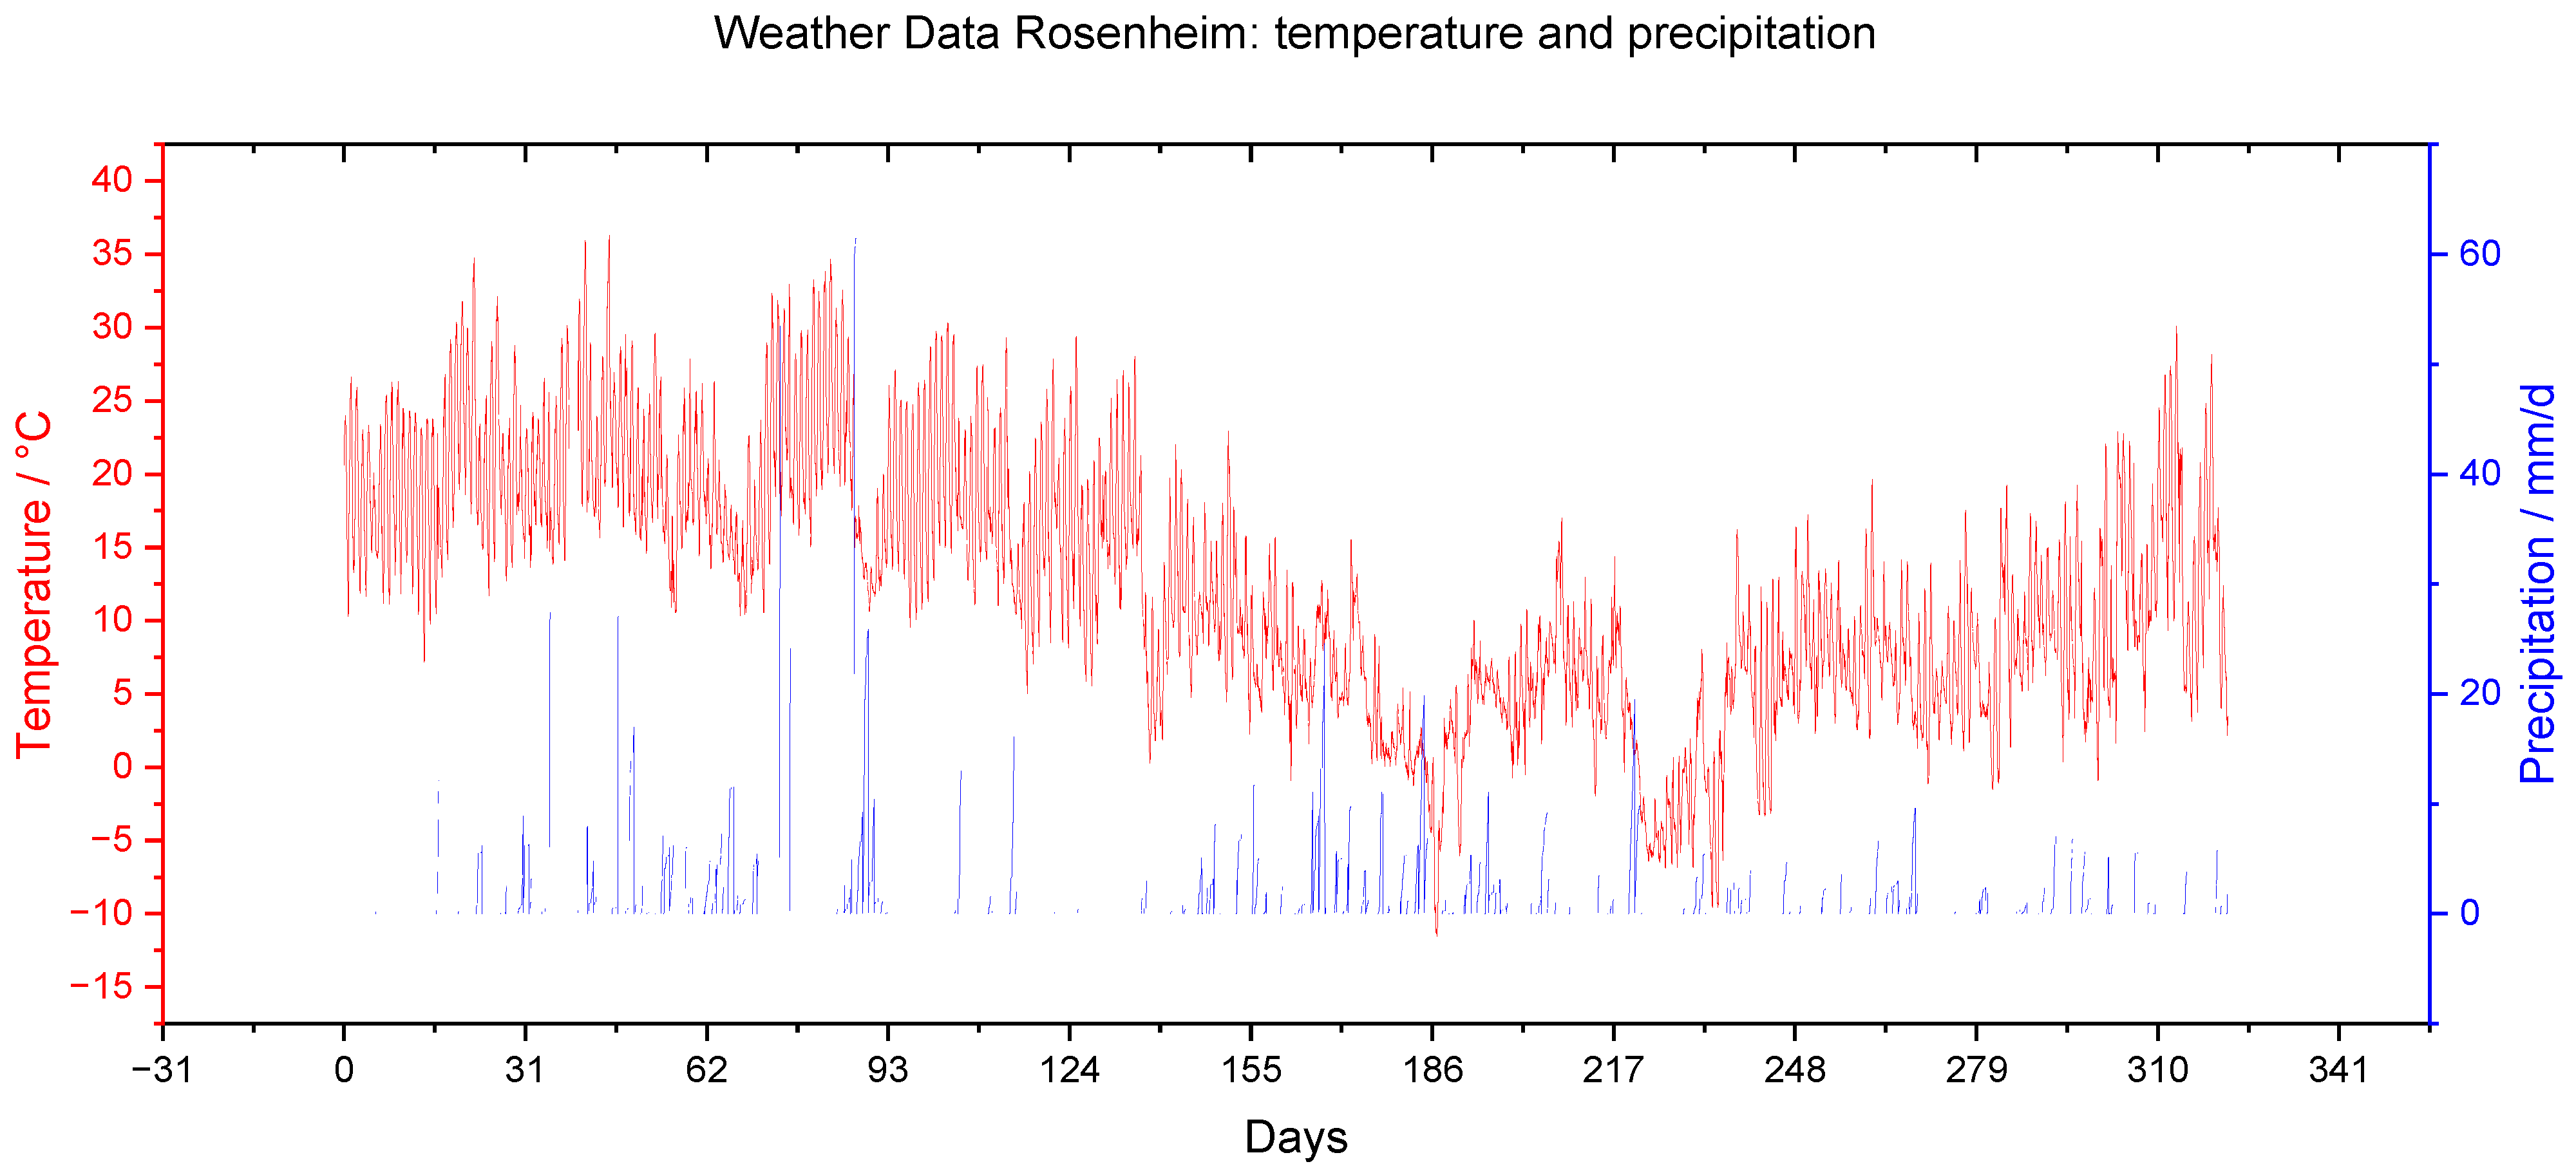
Meteorological data of the long-term study: temperature (red) in °C and precipitation (blue) in mm per day.
Figure 12.
Meteorological data of the long-term study: temperature (red) in °C and precipitation (blue) in mm per day.
Figure 13.
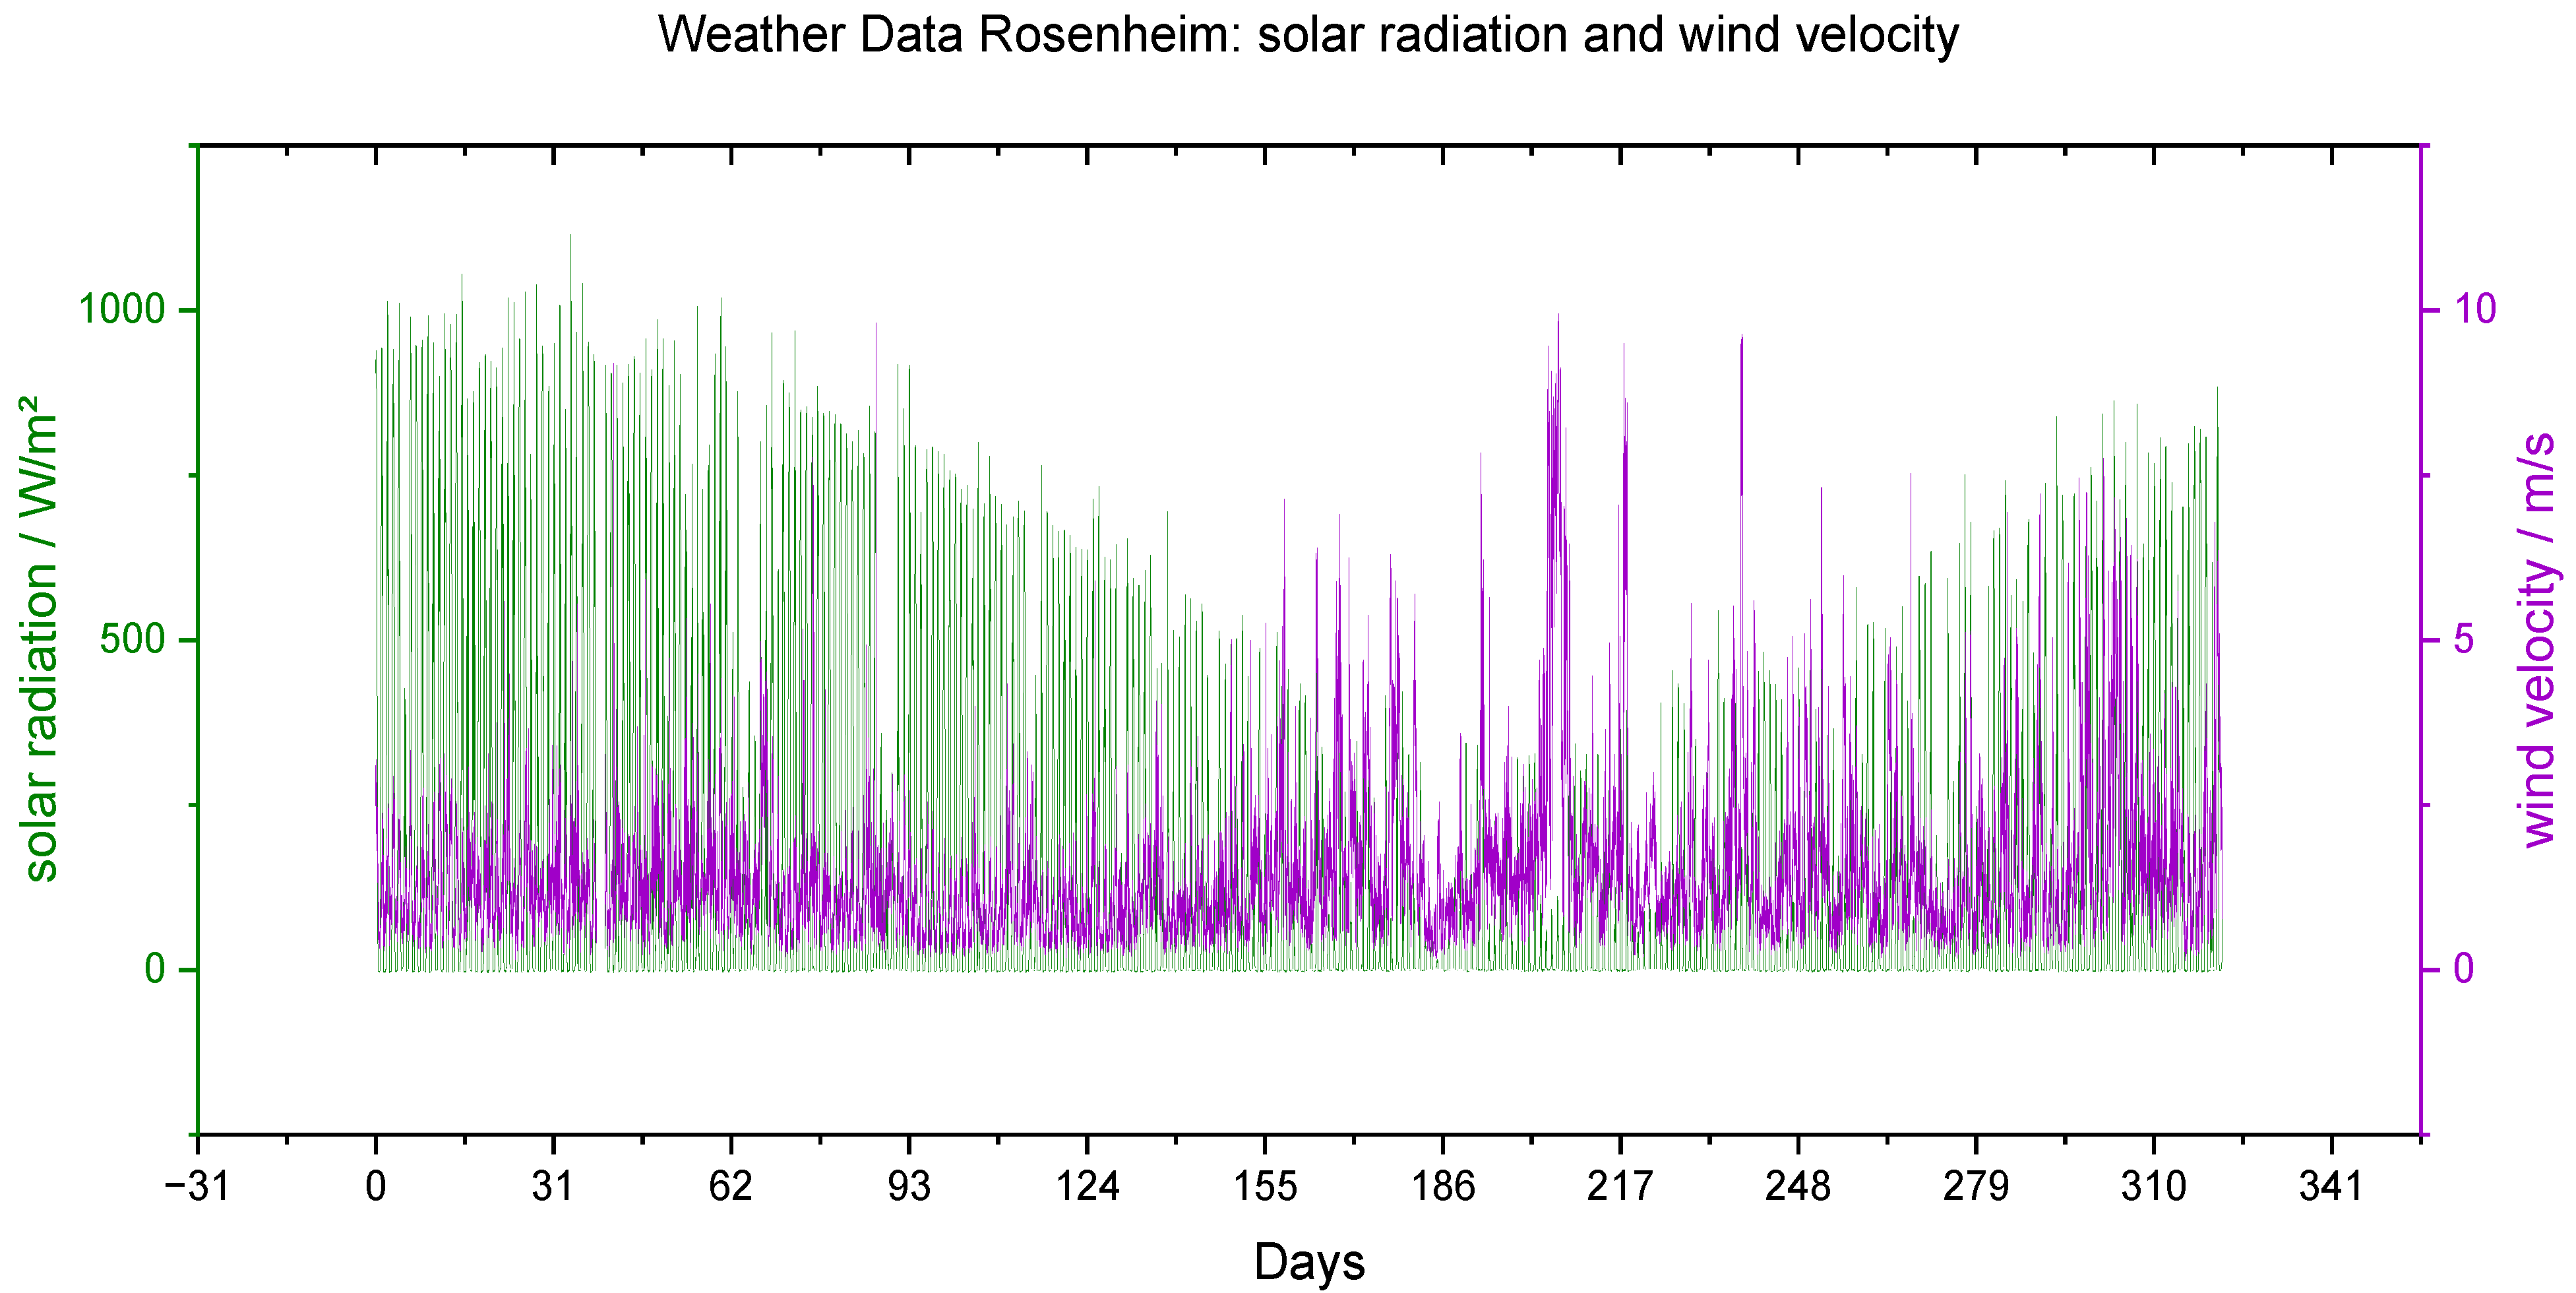
Meteorological data of the long-term study: solar radiation (green) in W/mm2 and wind velocity (purple) in m/s.
Figure 13.
Meteorological data of the long-term study: solar radiation (green) in W/mm2 and wind velocity (purple) in m/s.
Figure 14.
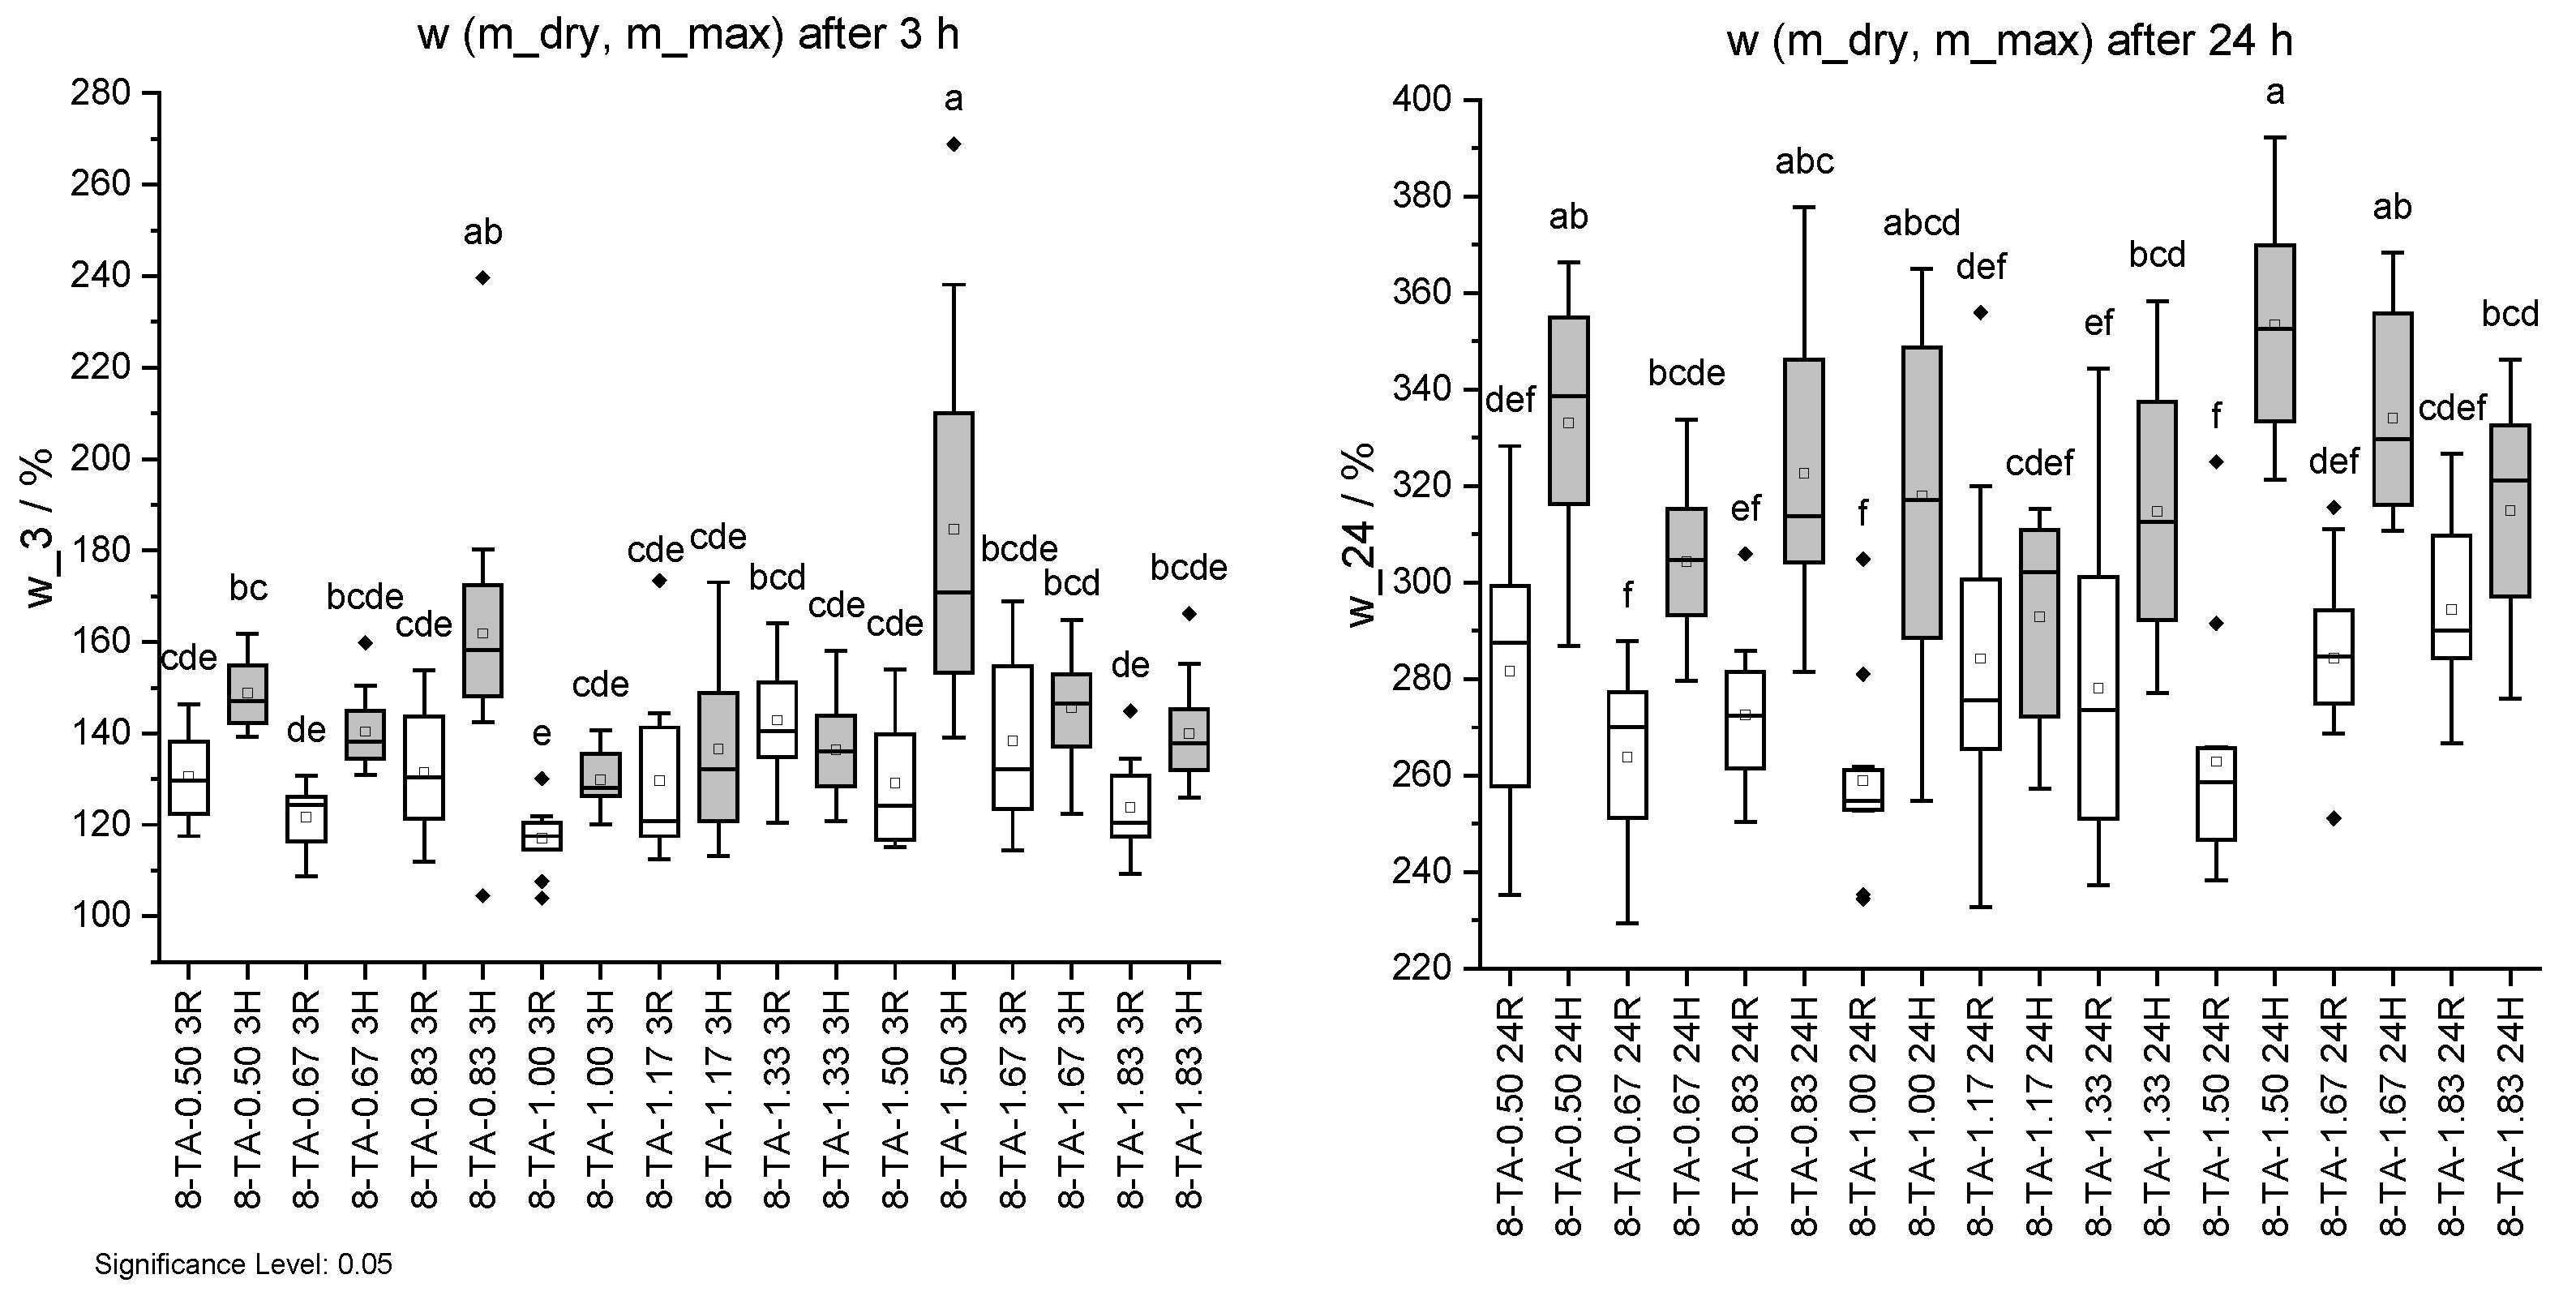
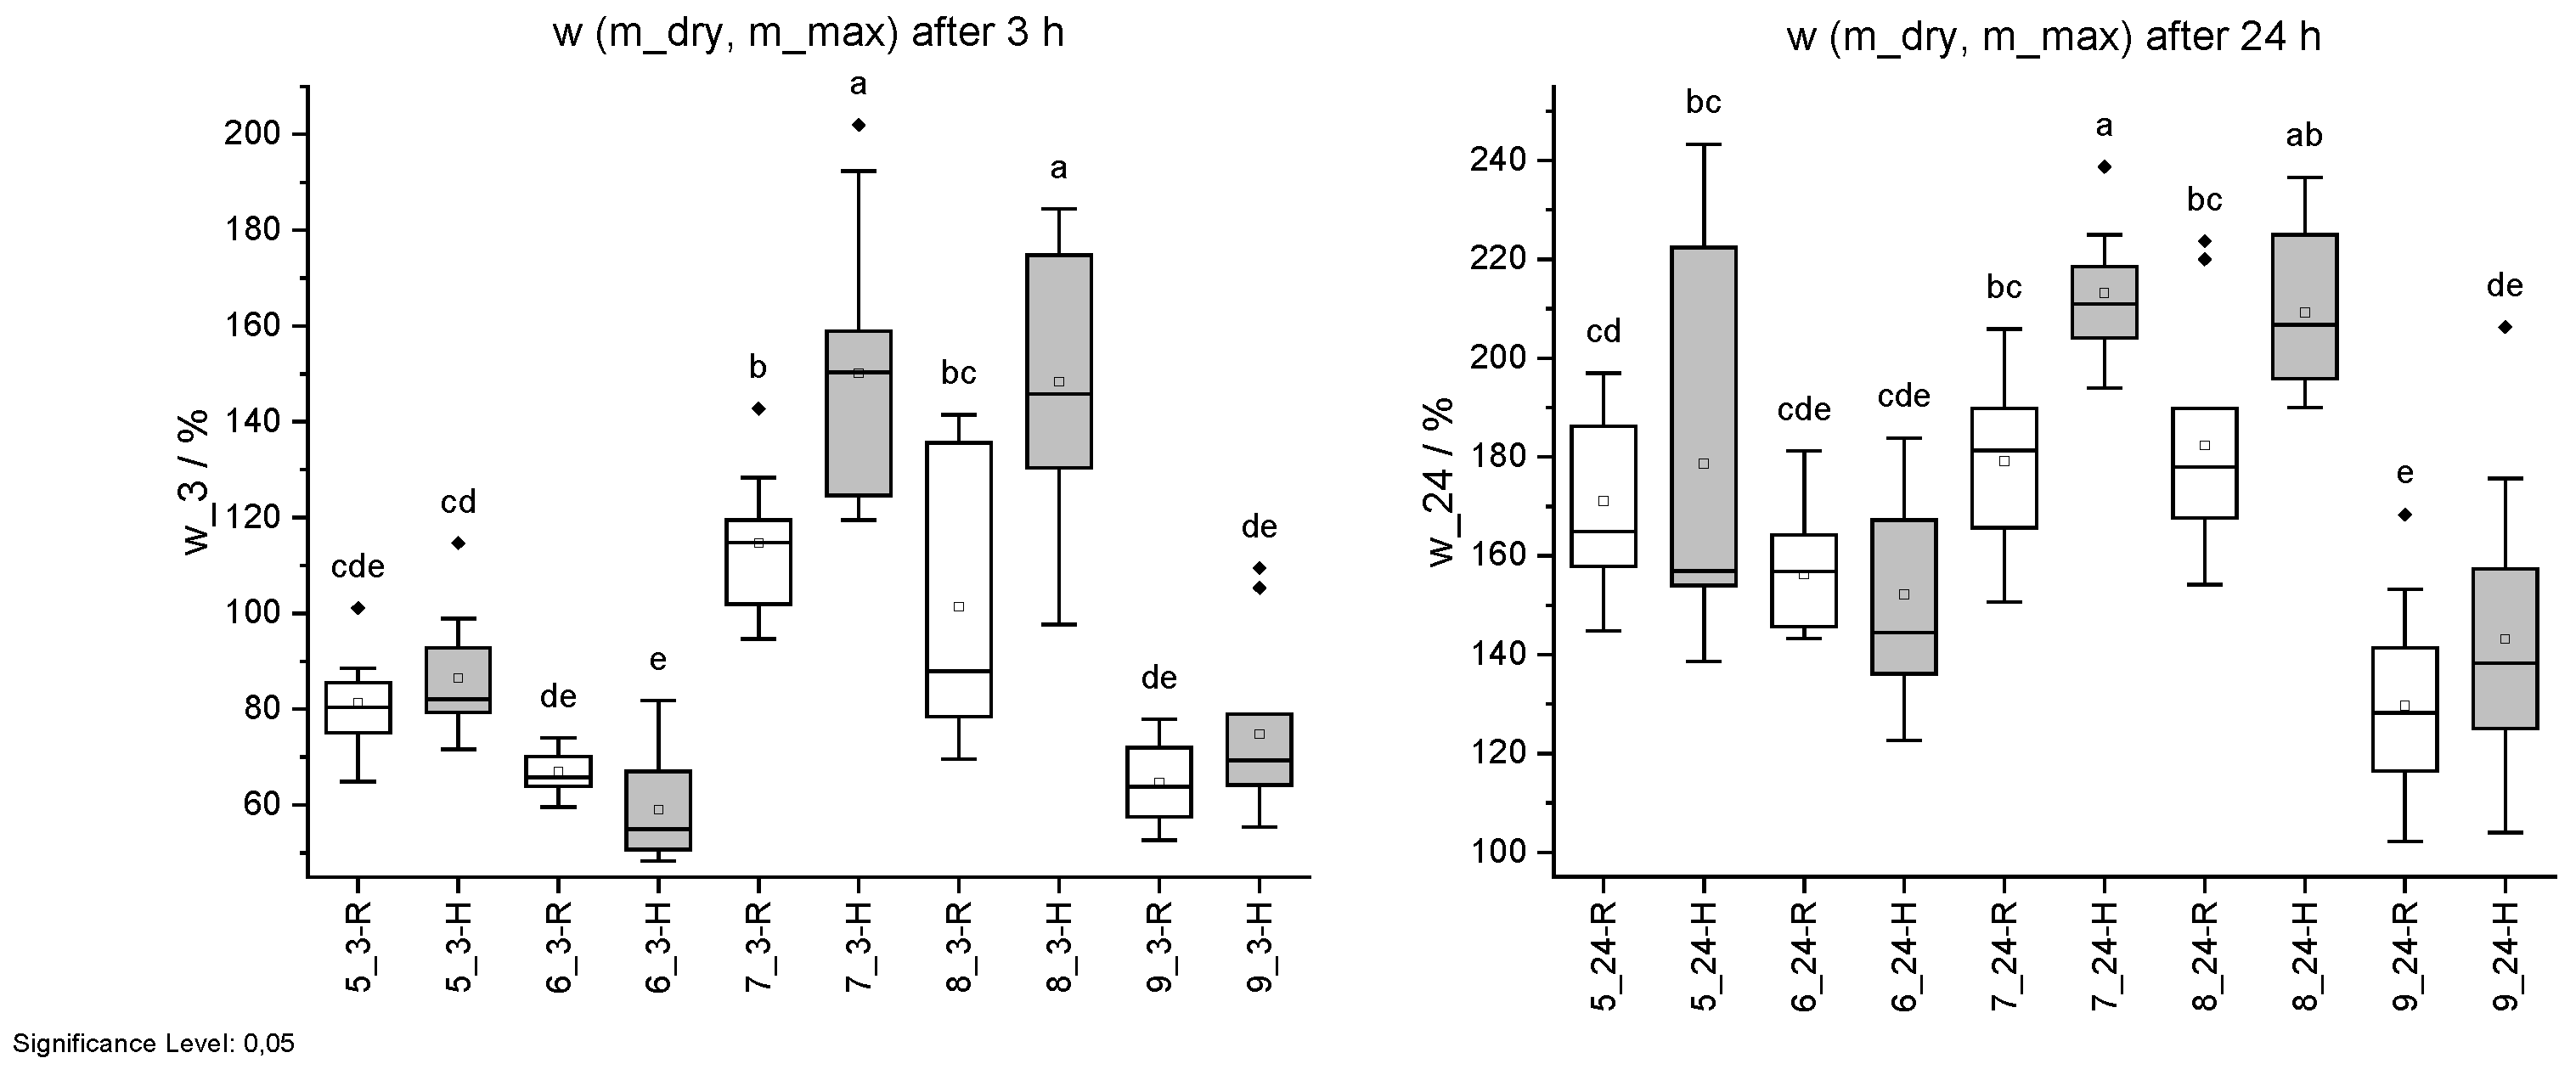
Mass change w due to water uptake. Specimens with regular (R) pH are shown in white and with higher pH (H) in grey. Water uptake after 3 h (left) and 24 h (right). Different letters indicate that the results are statistically different at the 0.05 level of significance.
Figure 14.
Mass change w due to water uptake. Specimens with regular (R) pH are shown in white and with higher pH (H) in grey. Water uptake after 3 h (left) and 24 h (right). Different letters indicate that the results are statistically different at the 0.05 level of significance.
Figure 15.
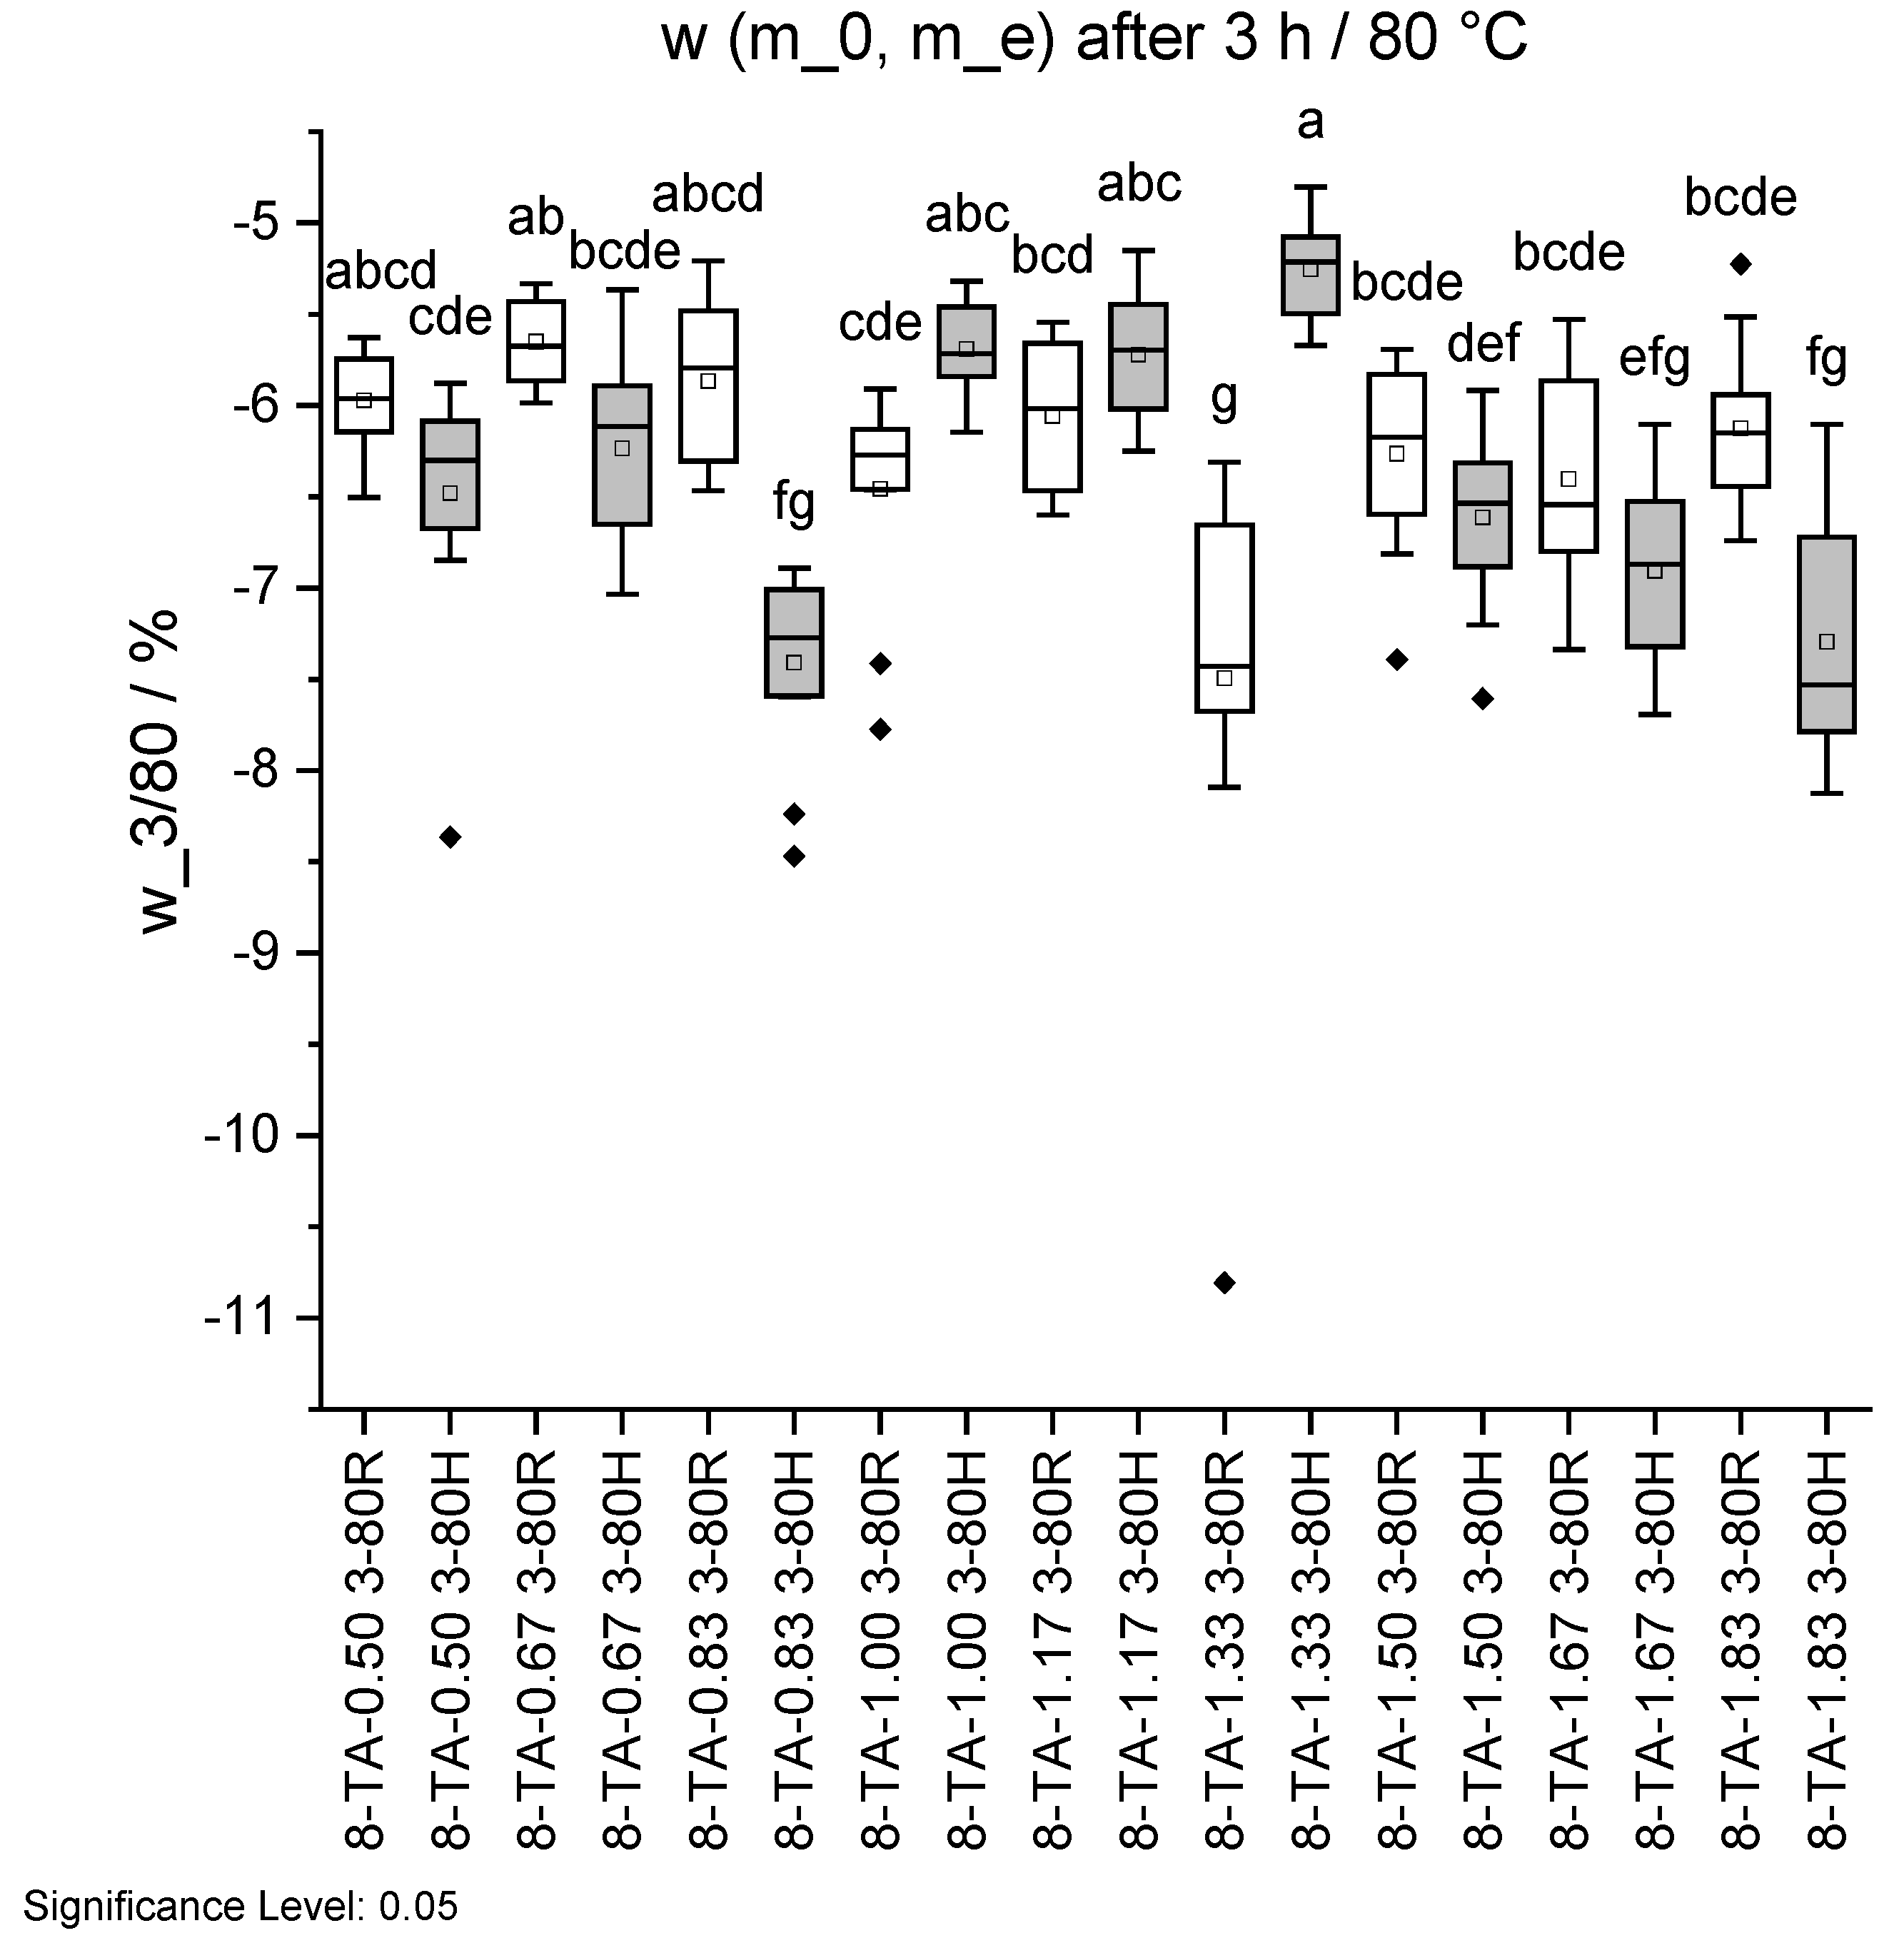
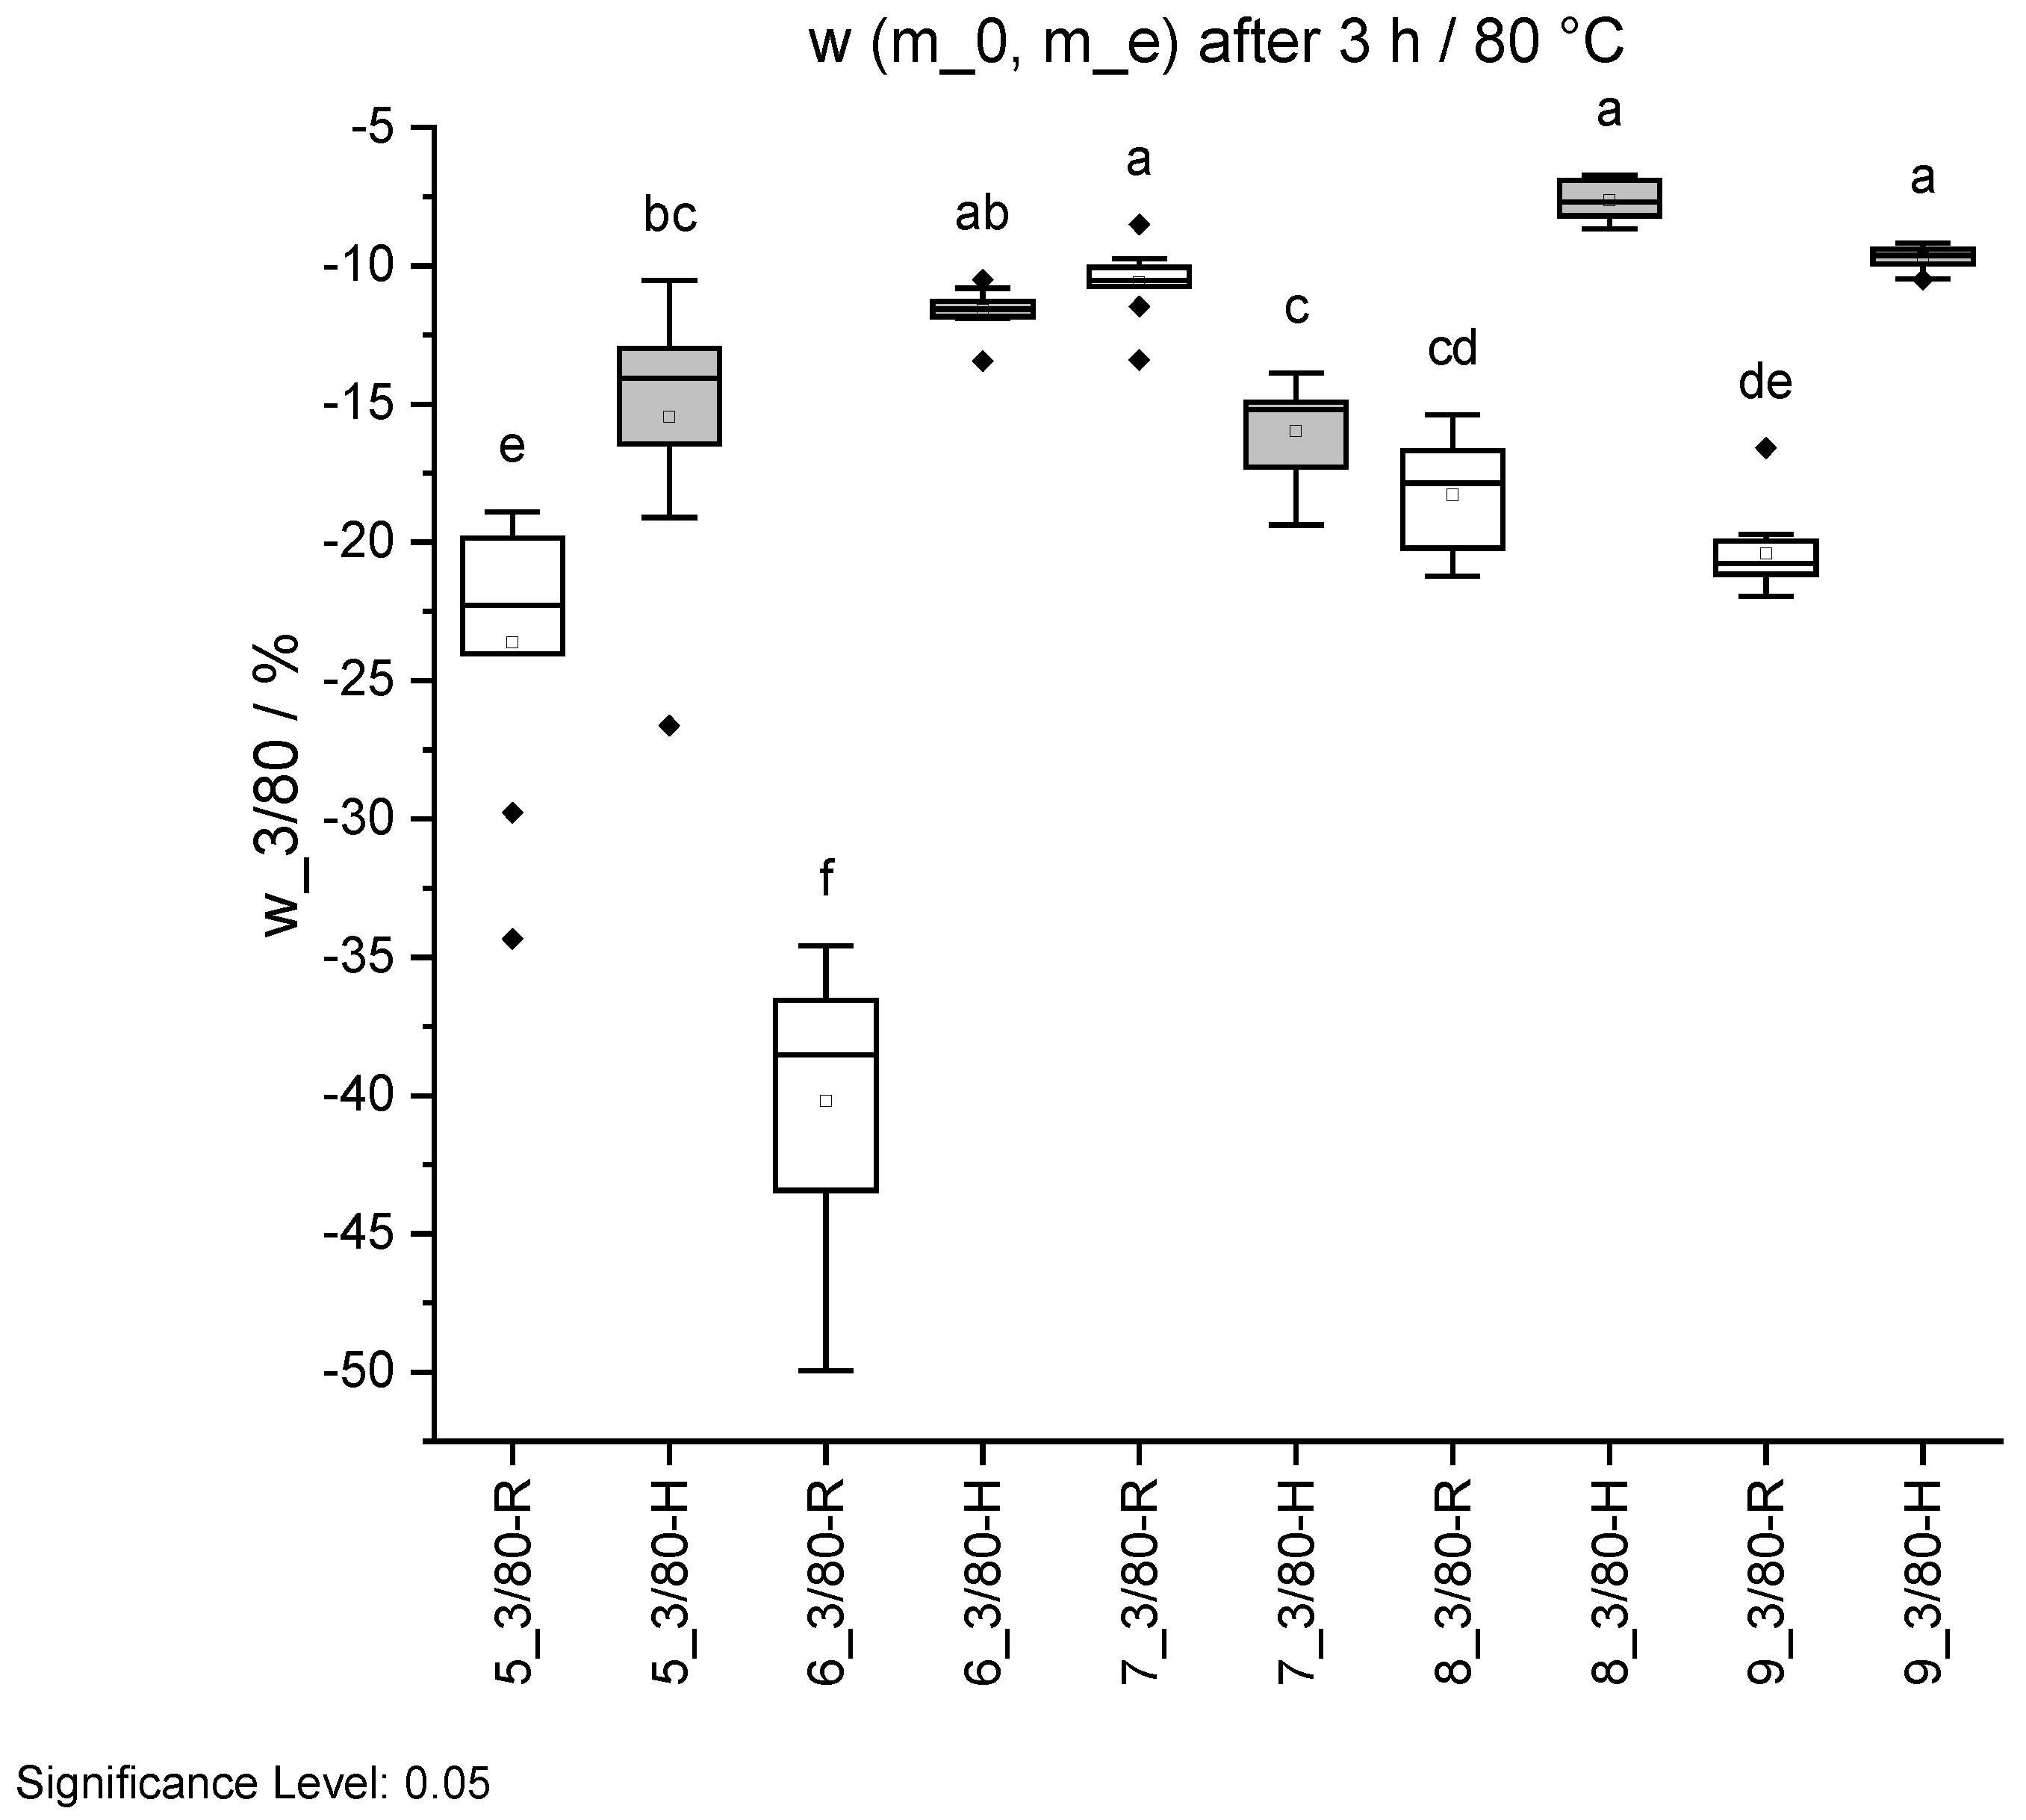
Mass change w before and after ageing 3/80 in standard climate 20/65. Specimens with regular pH are shown in white and with higher pH in grey. Different letters indicate that the results are statistically different at the 0.05 level of significance.
Figure 15.
Mass change w before and after ageing 3/80 in standard climate 20/65. Specimens with regular pH are shown in white and with higher pH in grey. Different letters indicate that the results are statistically different at the 0.05 level of significance.
Figure 16.
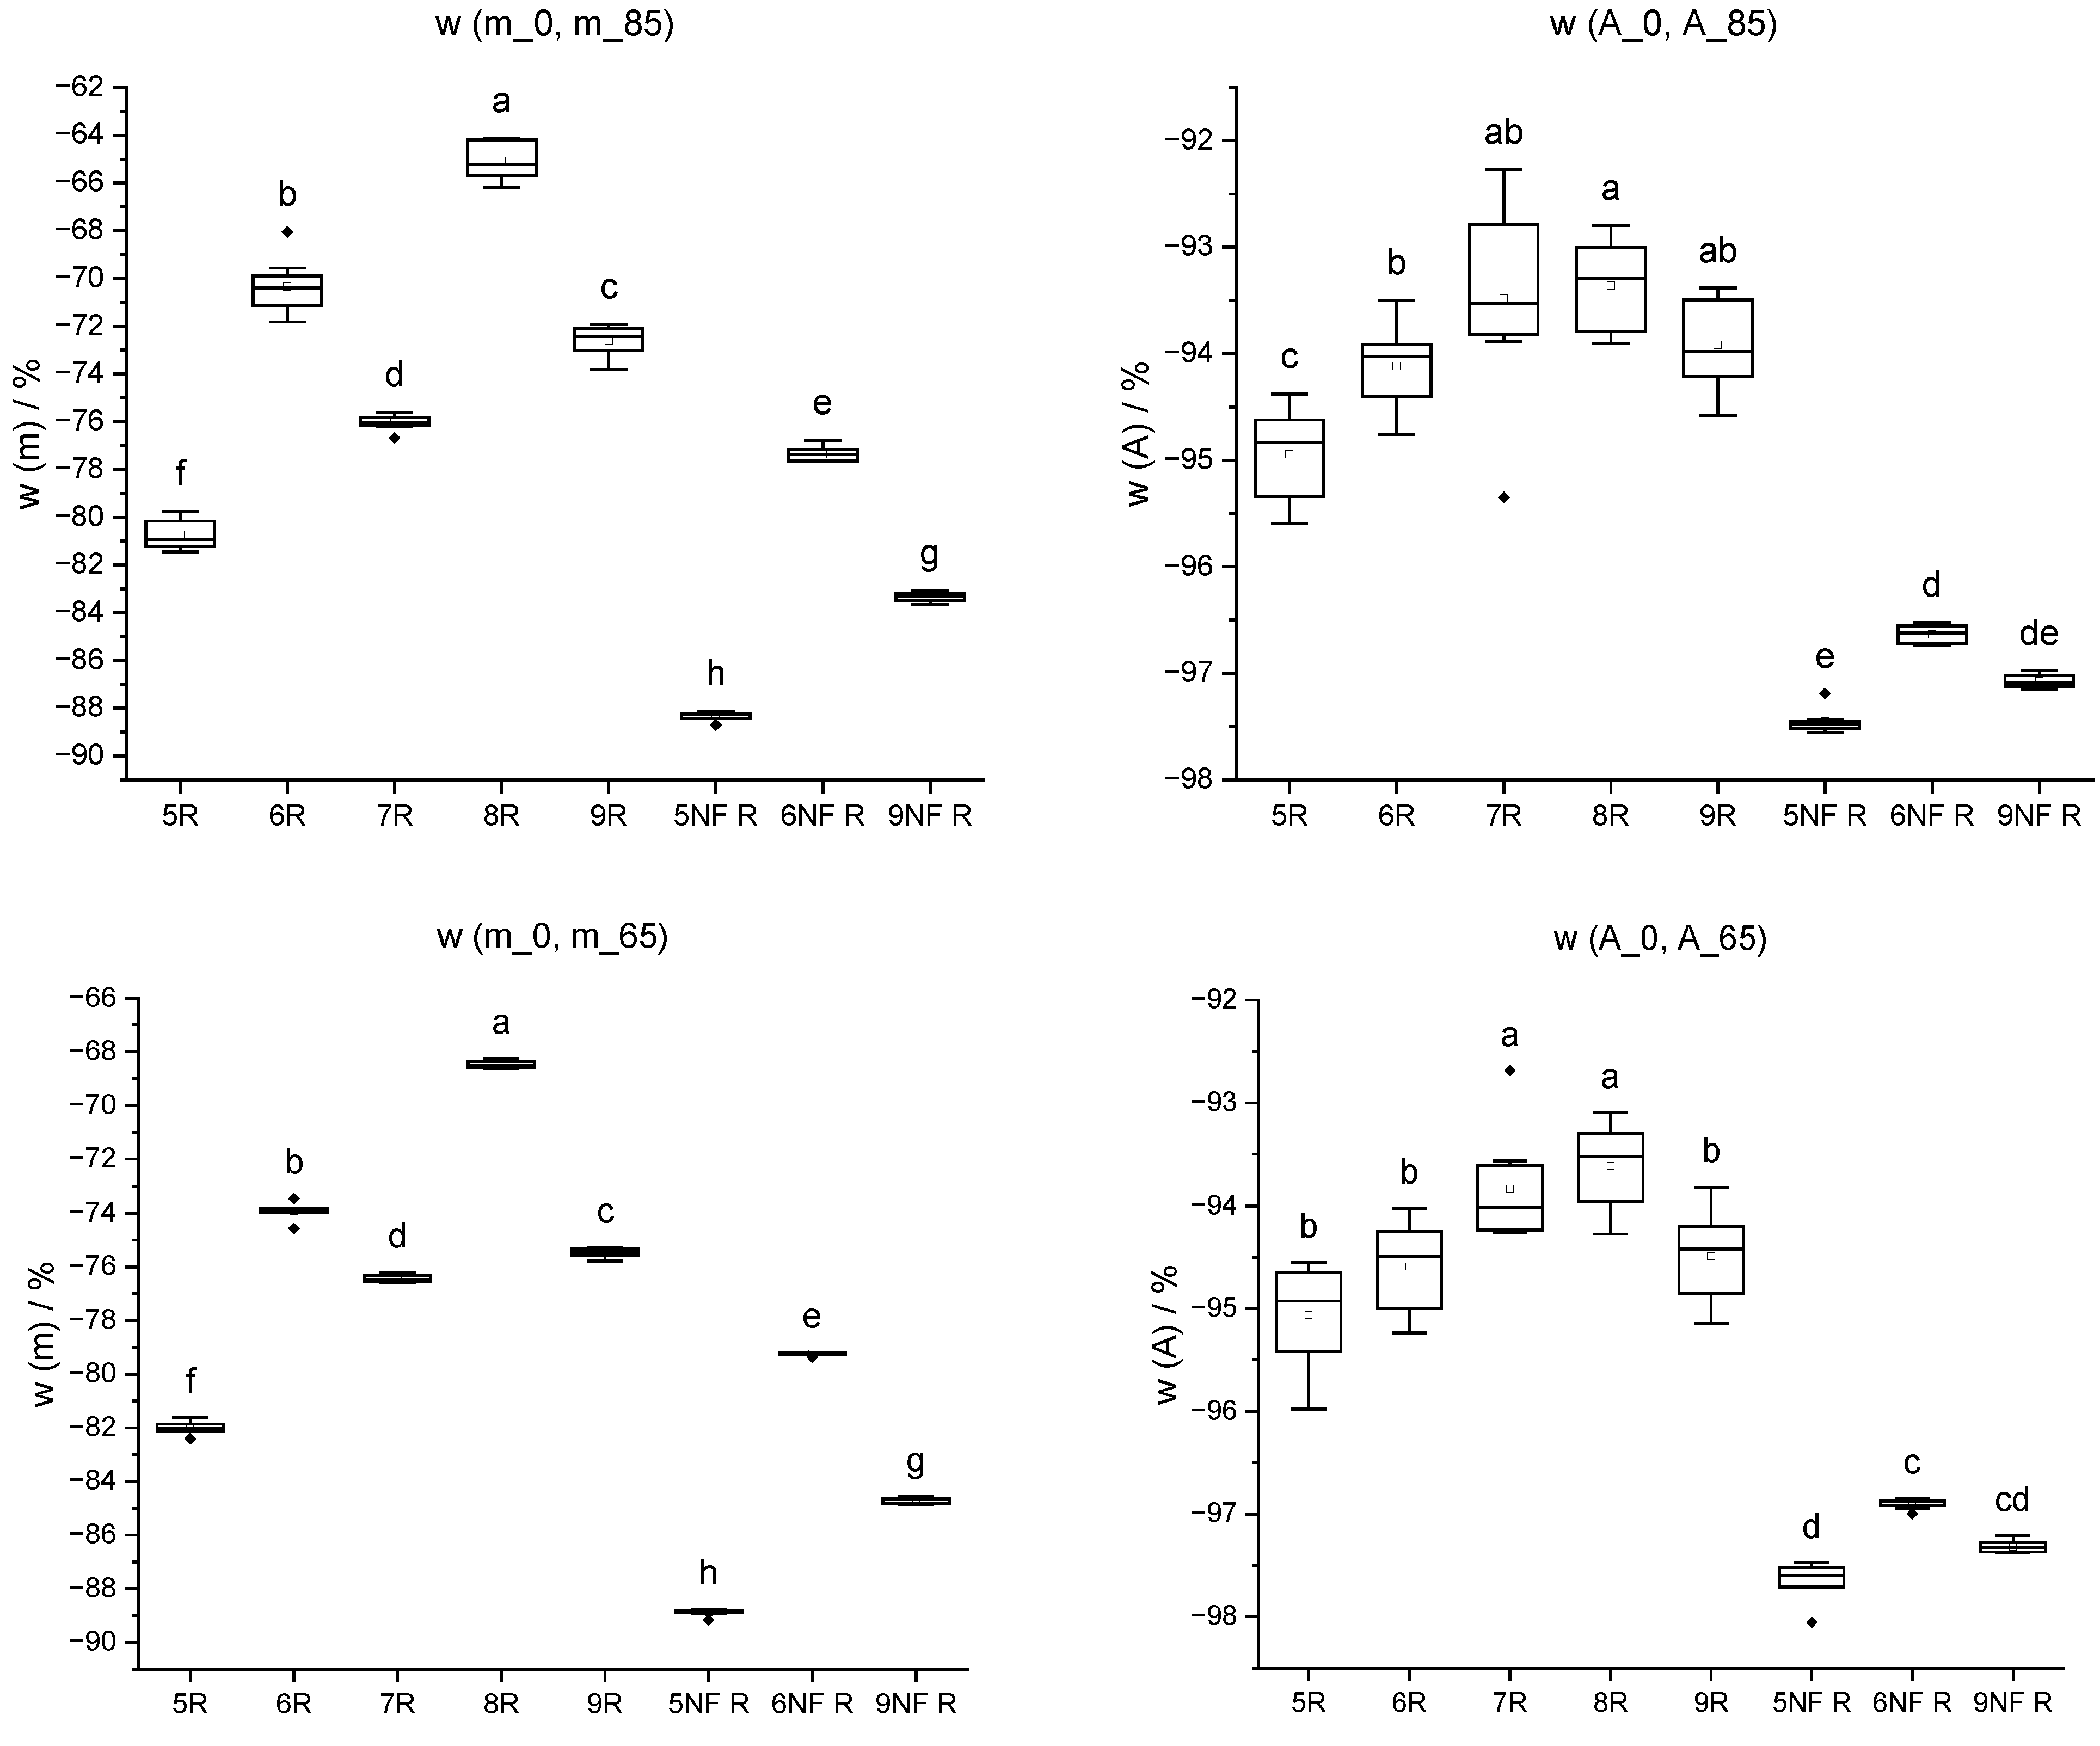
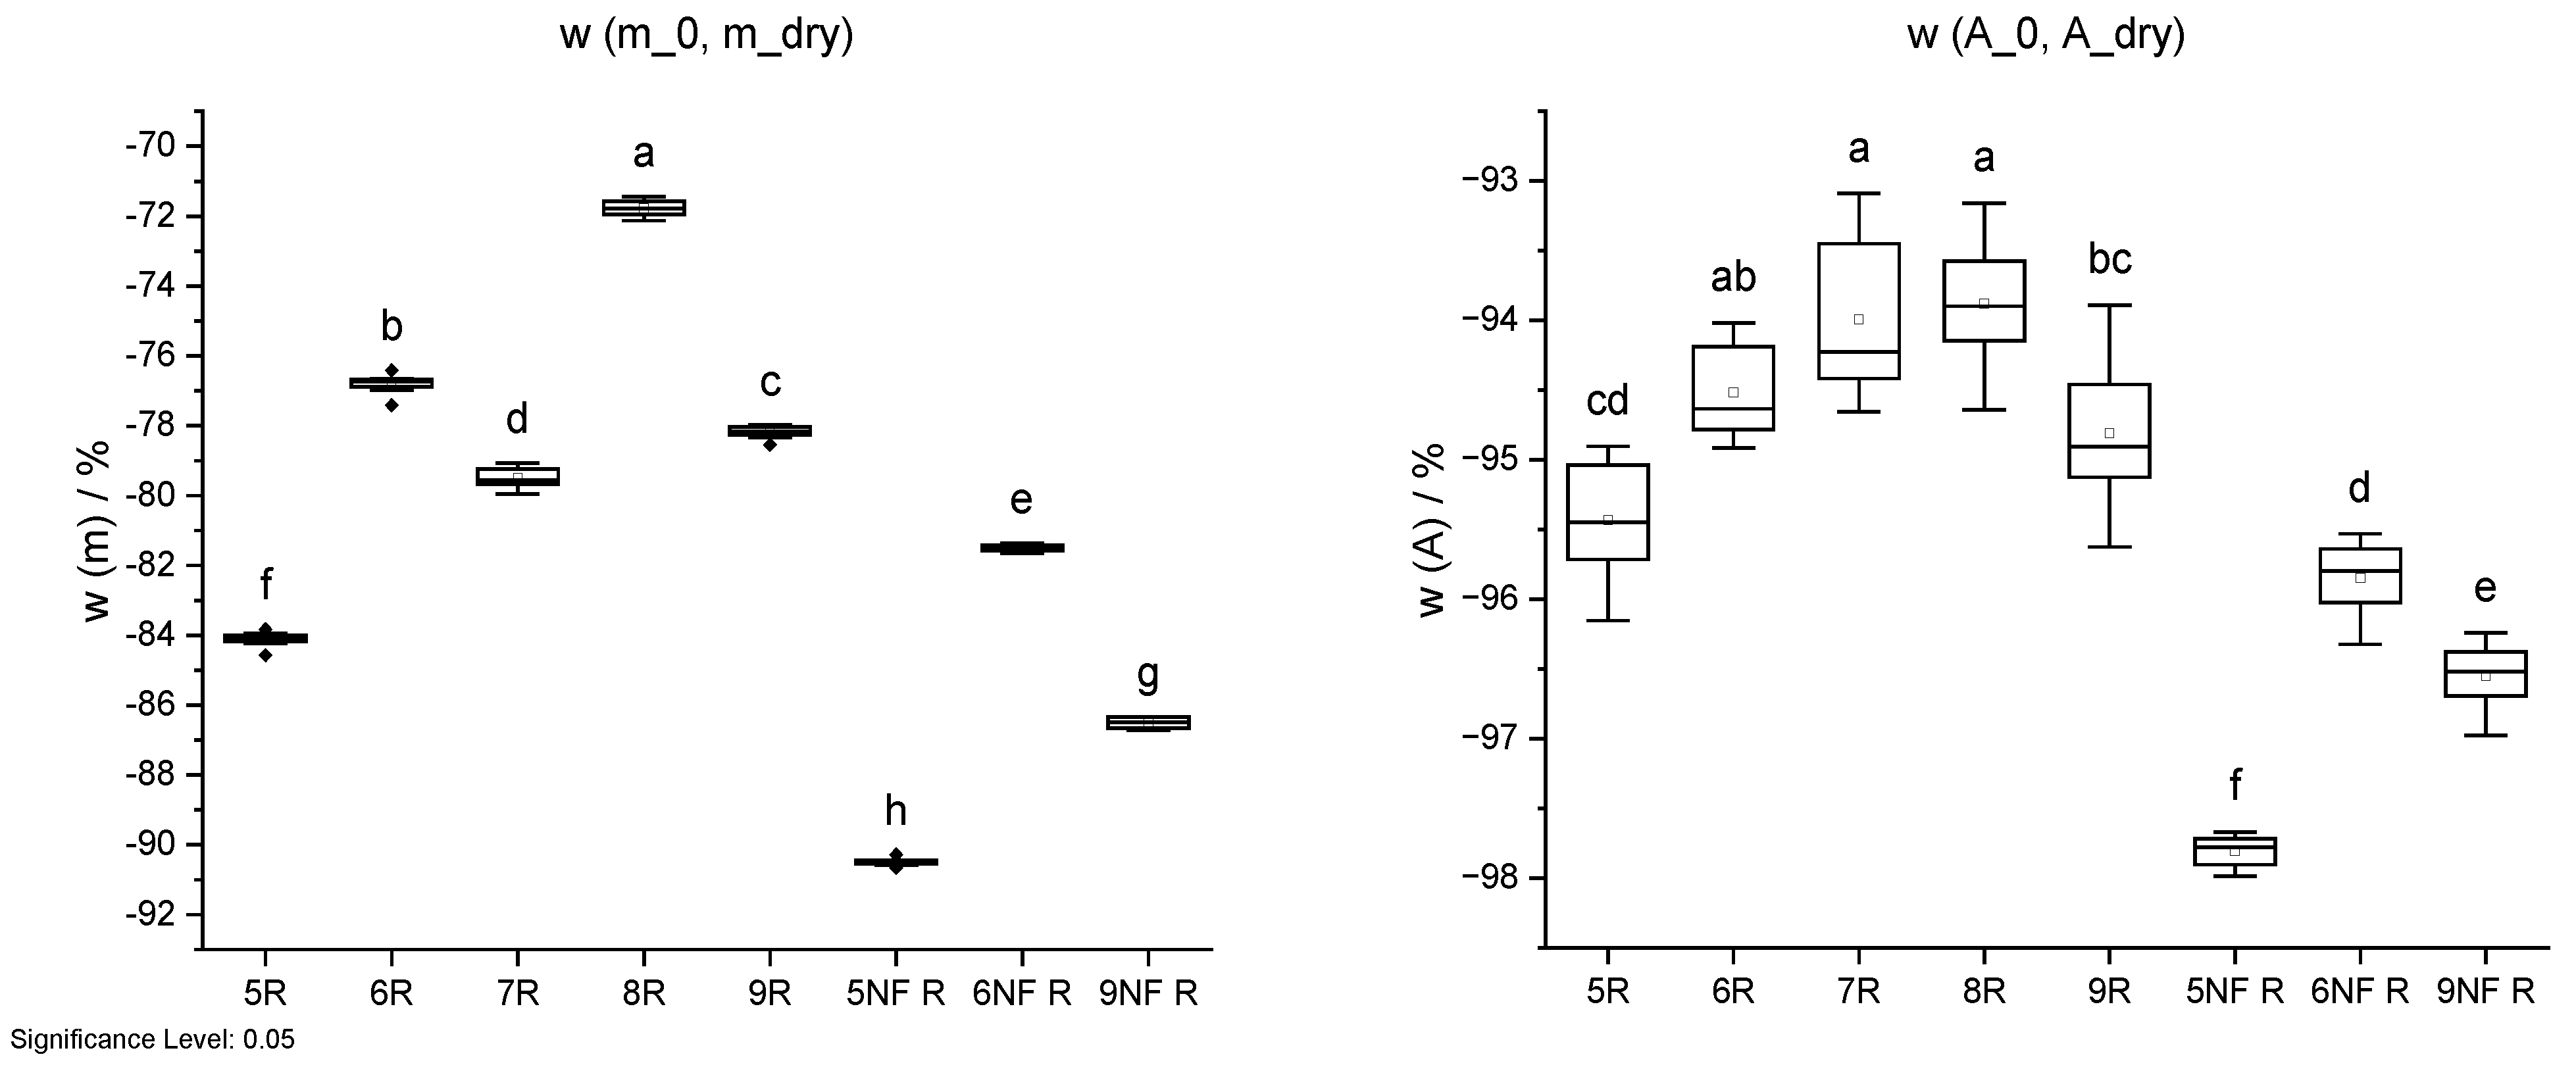
Mass change w (m) and cross-sectional shrinkage w (A) from initial state (_0) through oven-drying process (20 °C/85% RH; 20 °C/65% RH; 103 °C) of IDs 5 to 9 and IDs 5 NF to 9 NF without wood fibres. Different letters indicate that the results are statistically different at the 0.05 level of significance.
Figure 17.
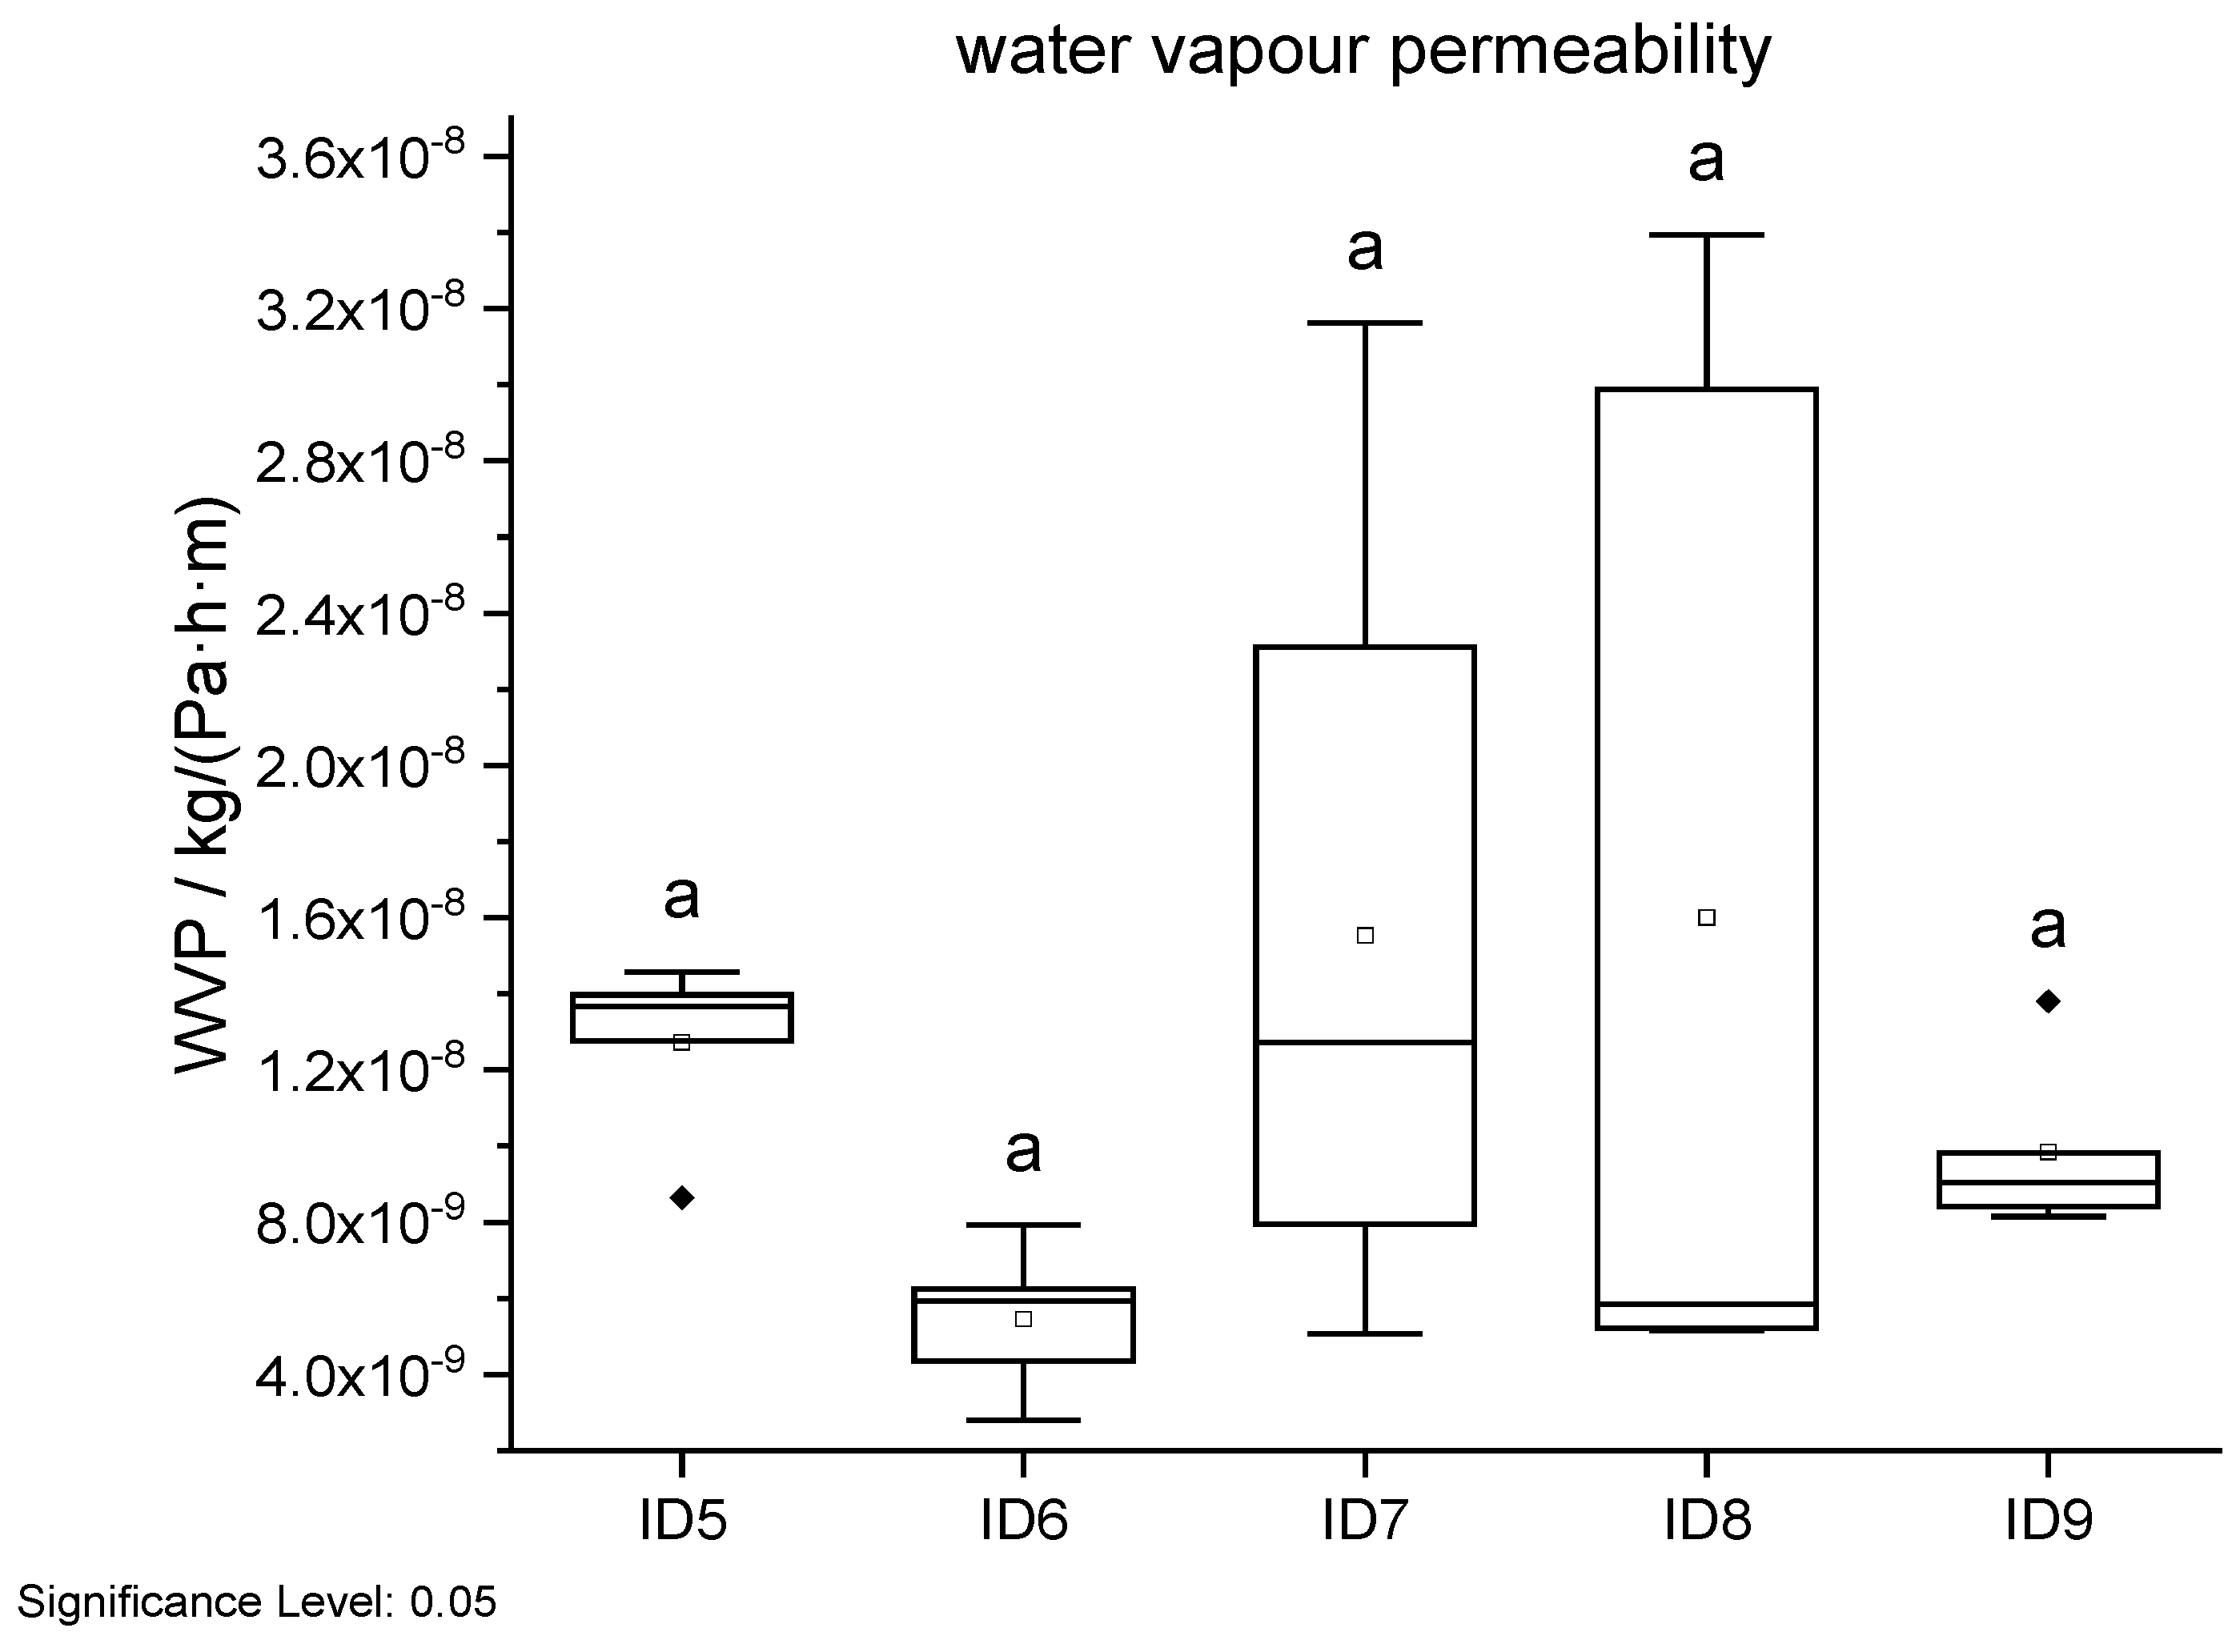
Water vapour permeability results in dependency of ID. Different letters in a column indicate that the results are statistically different at the 0.05 level.
Figure 17.
Water vapour permeability results in dependency of ID. Different letters in a column indicate that the results are statistically different at the 0.05 level.
Figure 18.
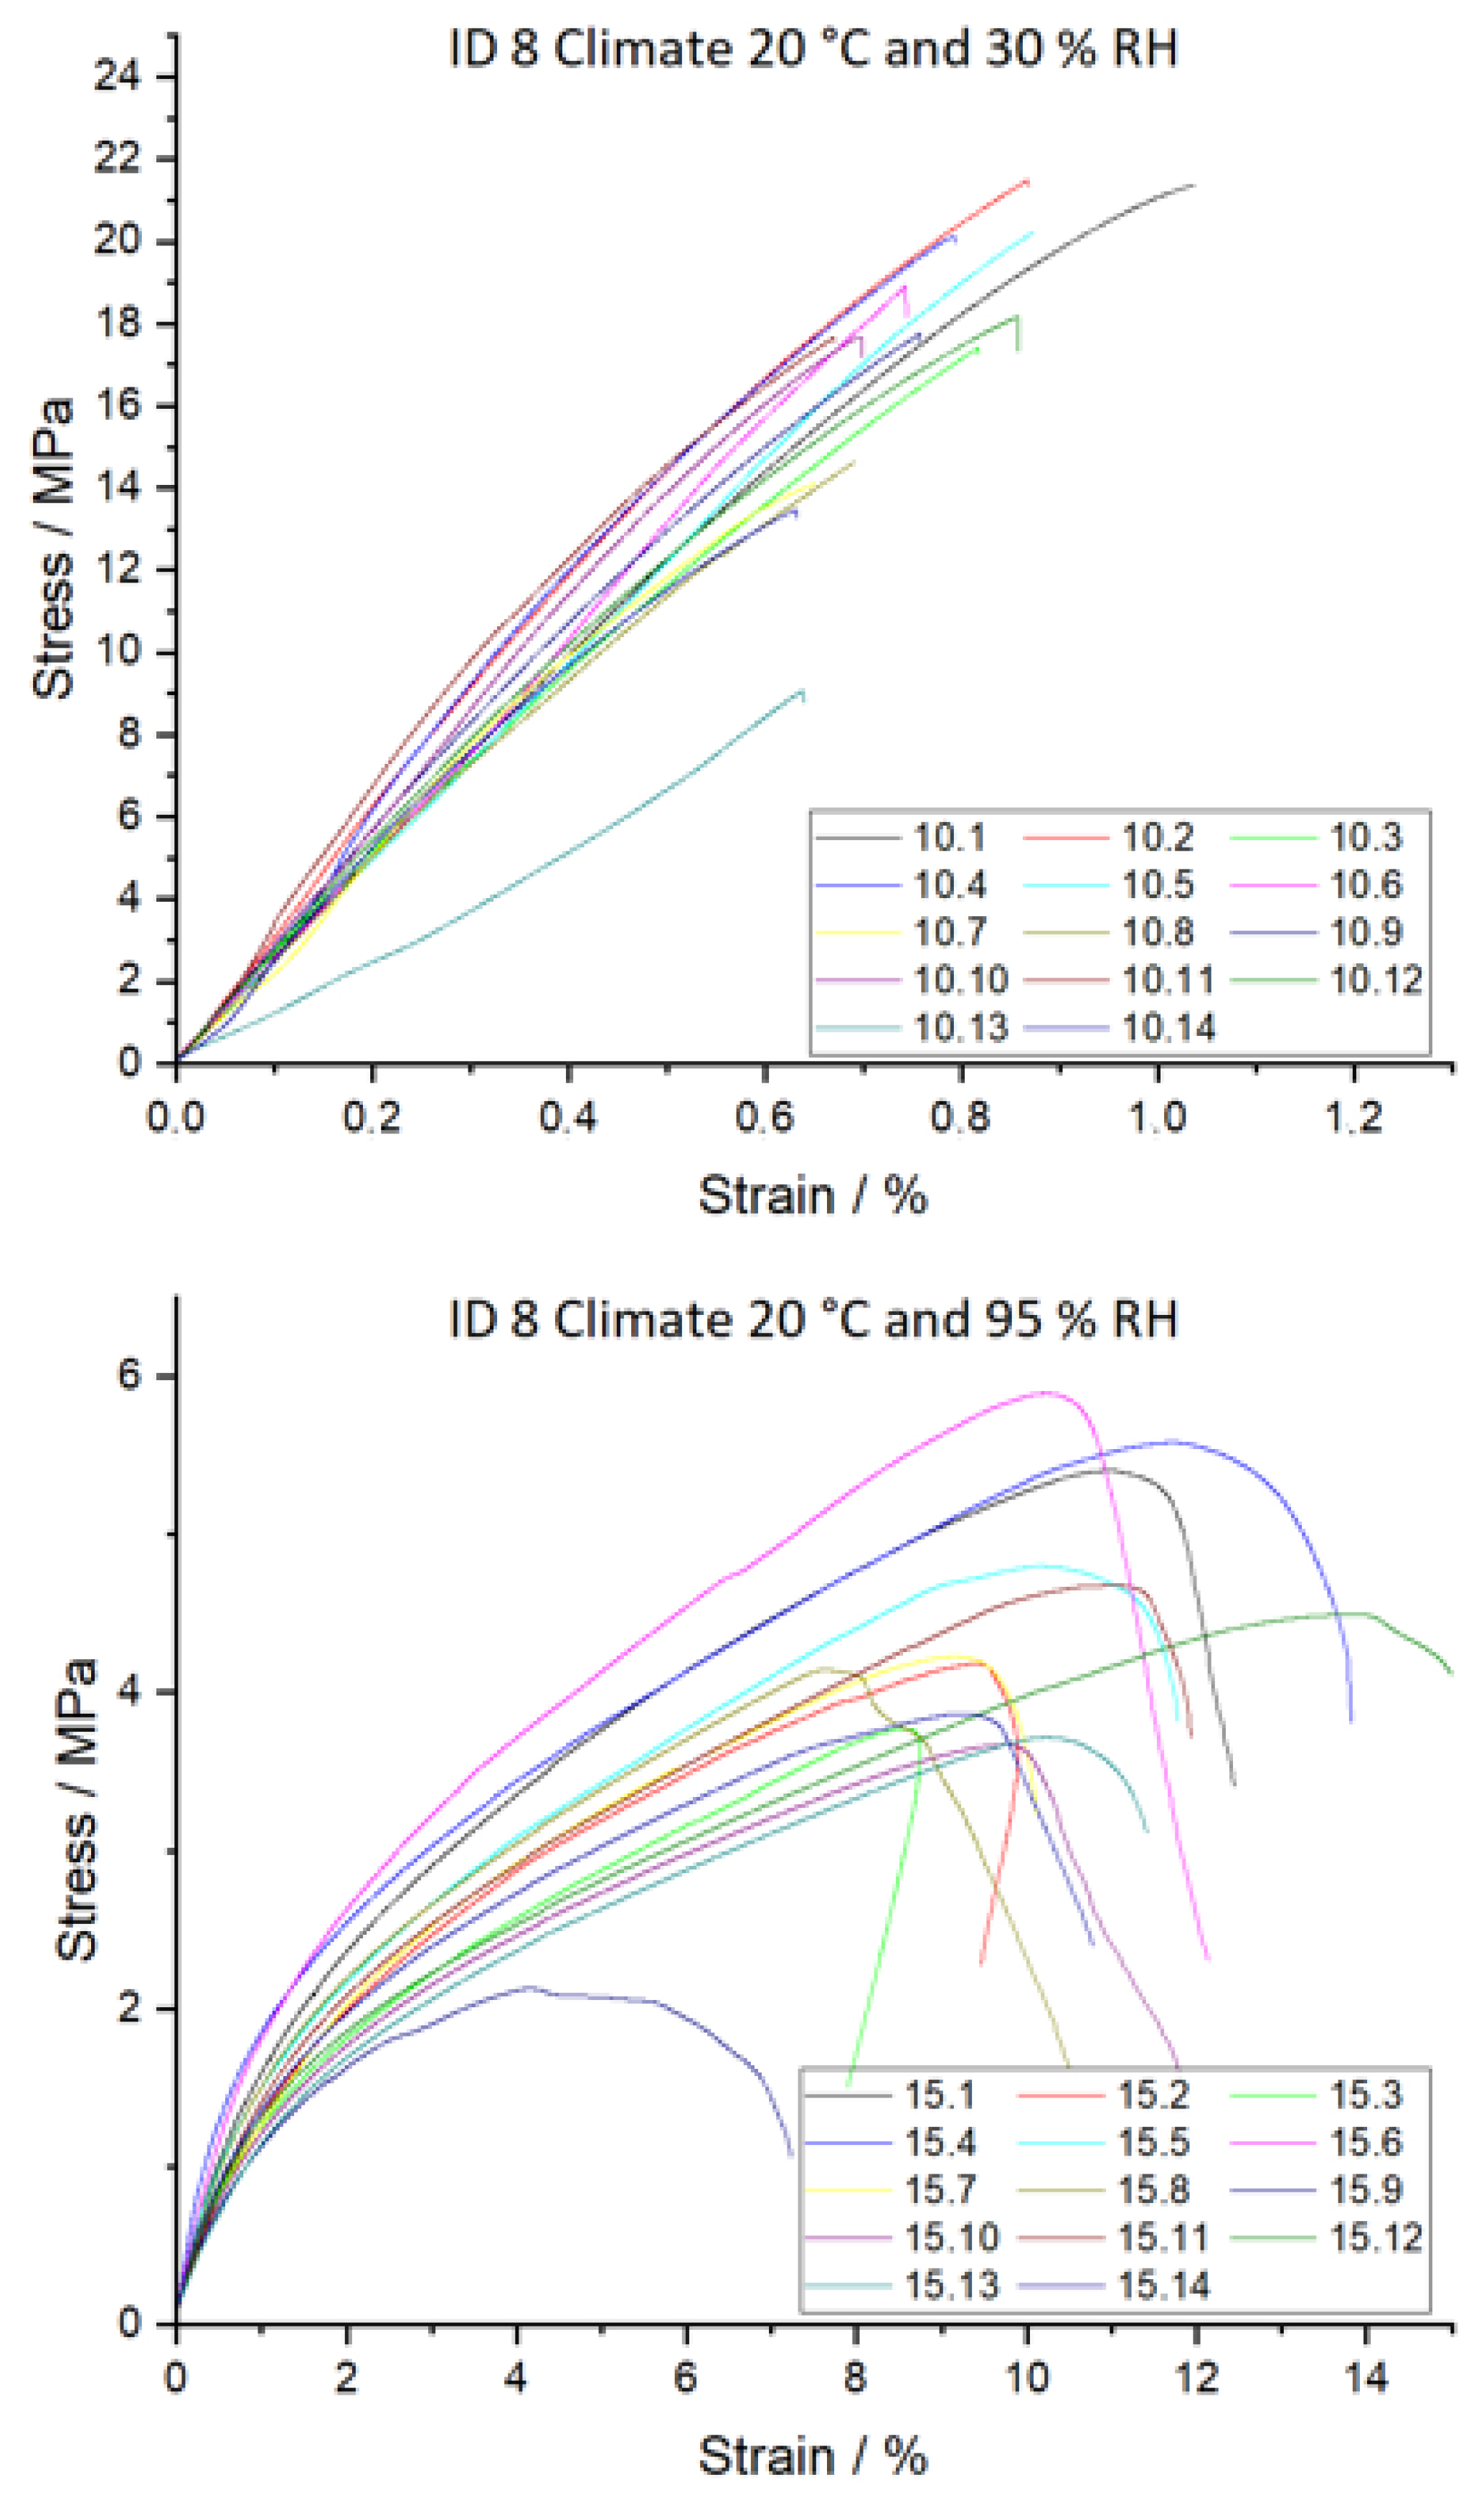
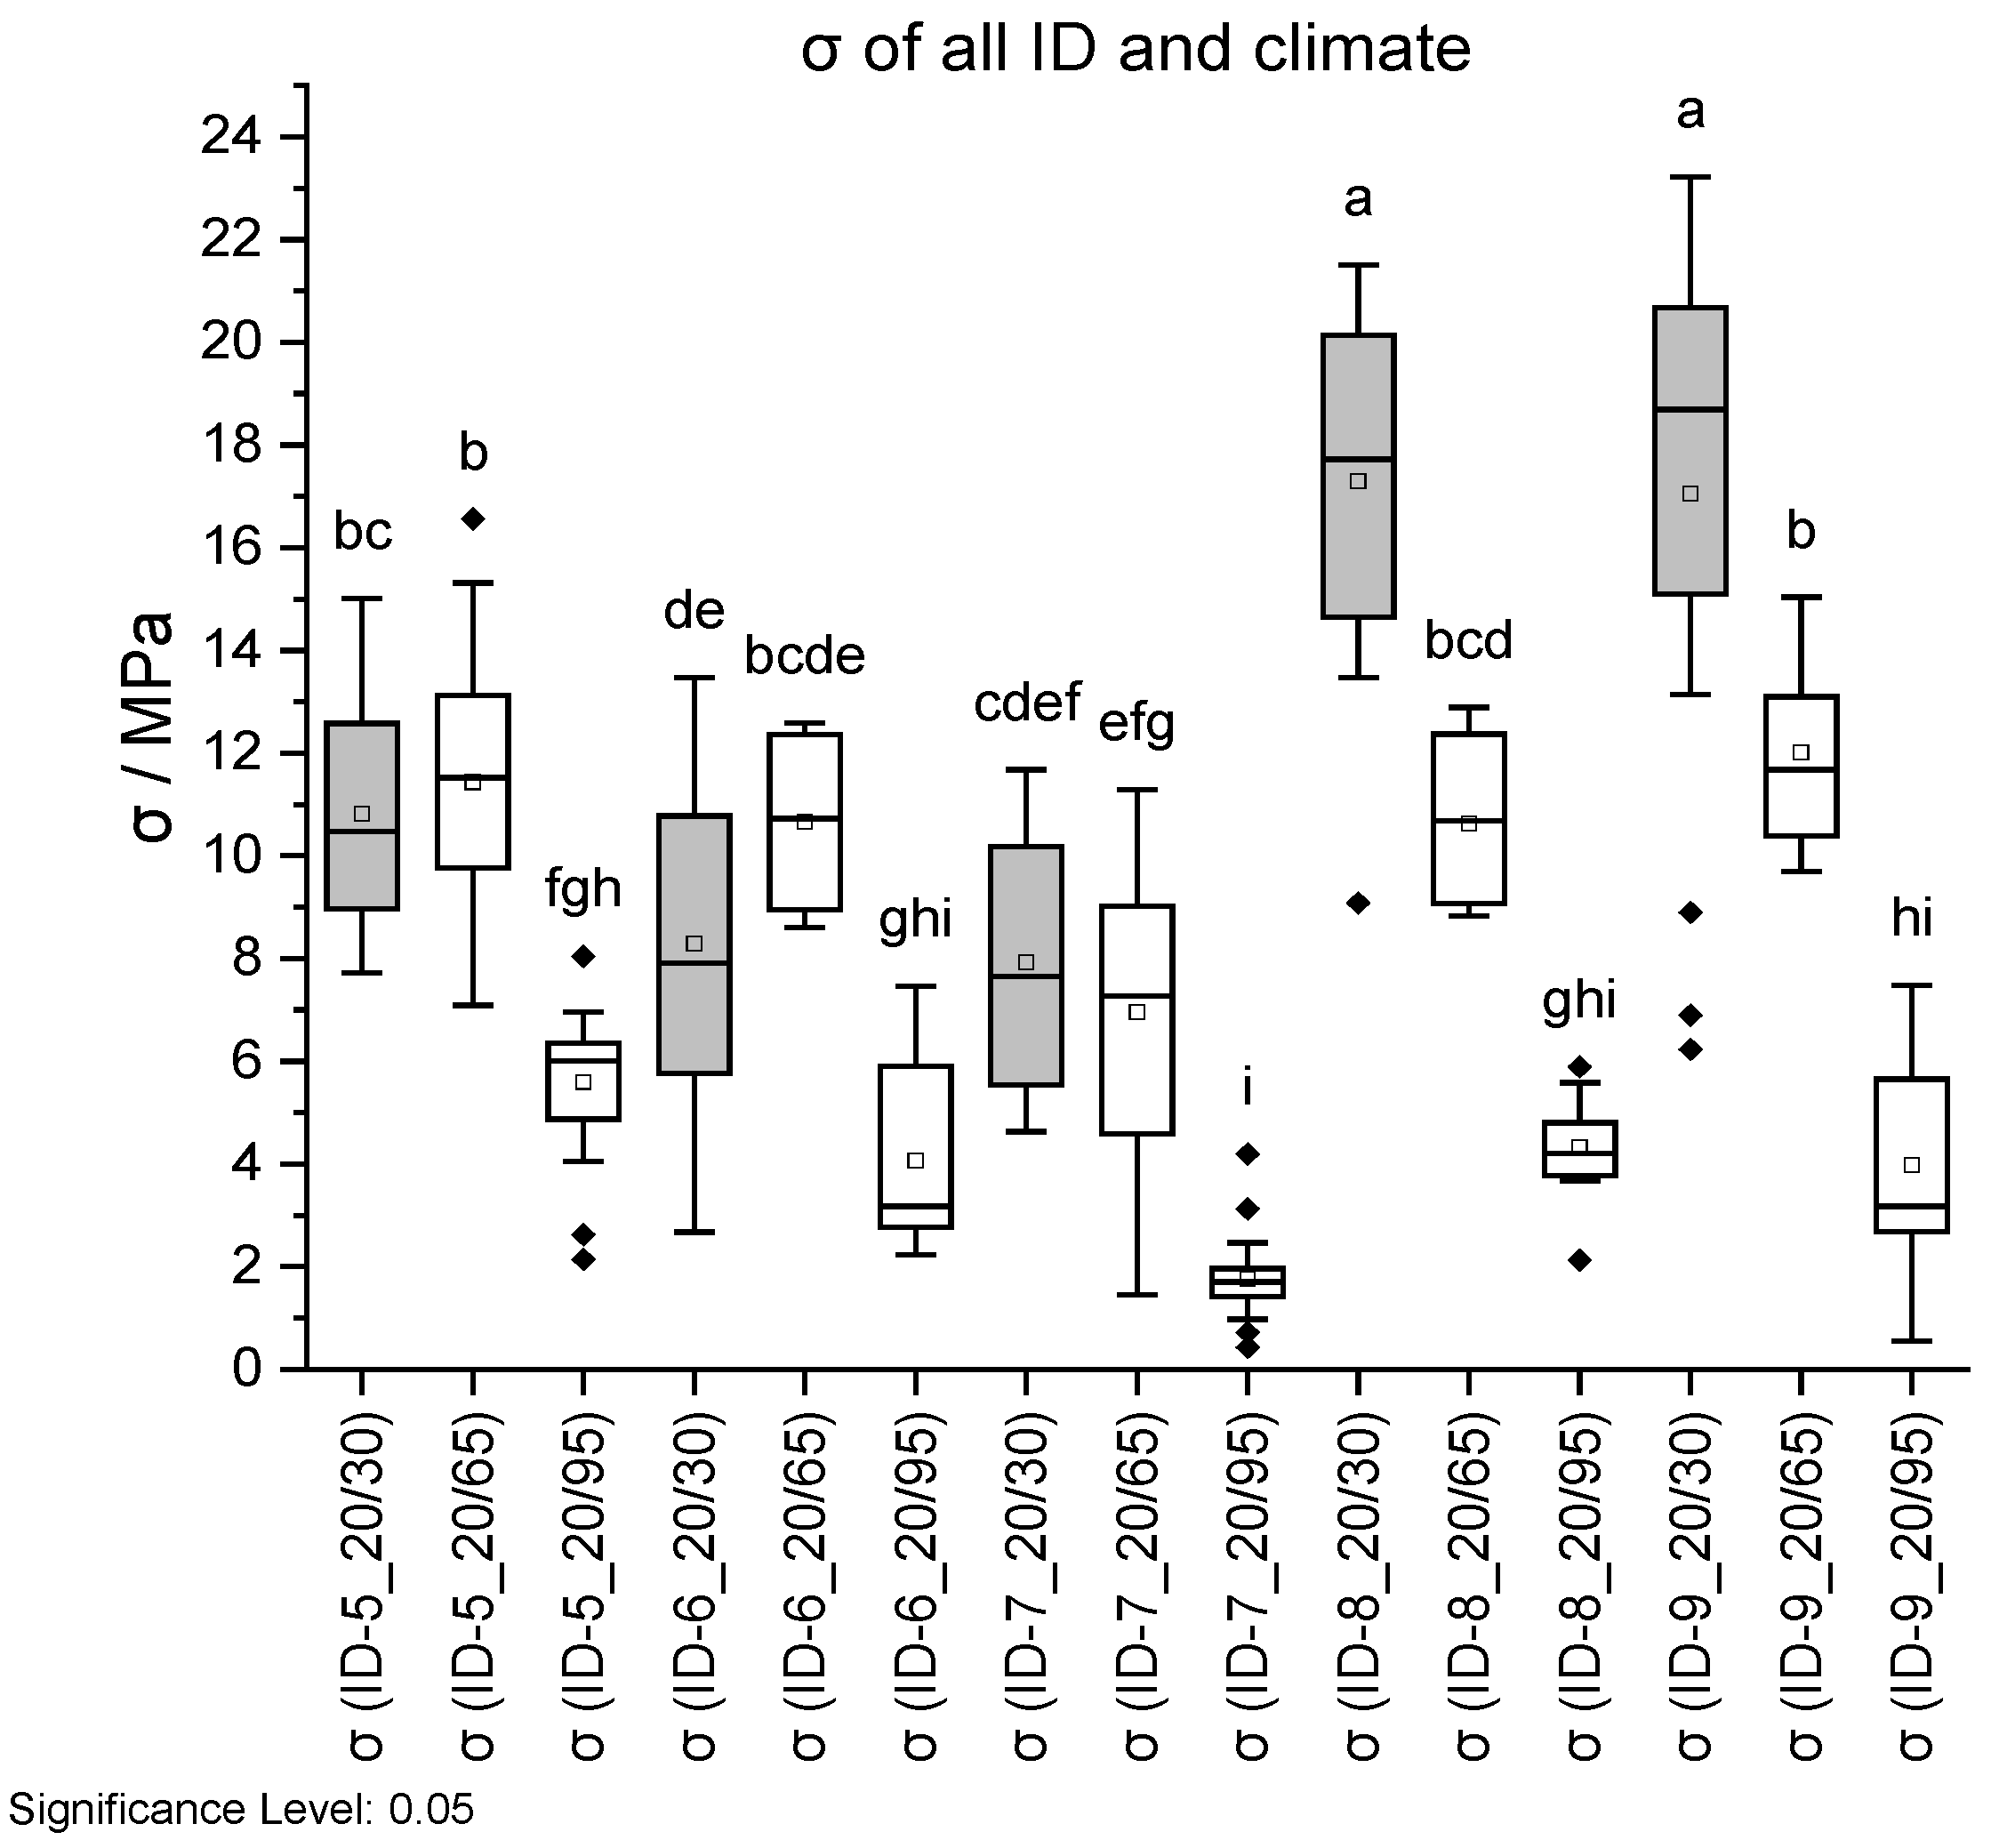
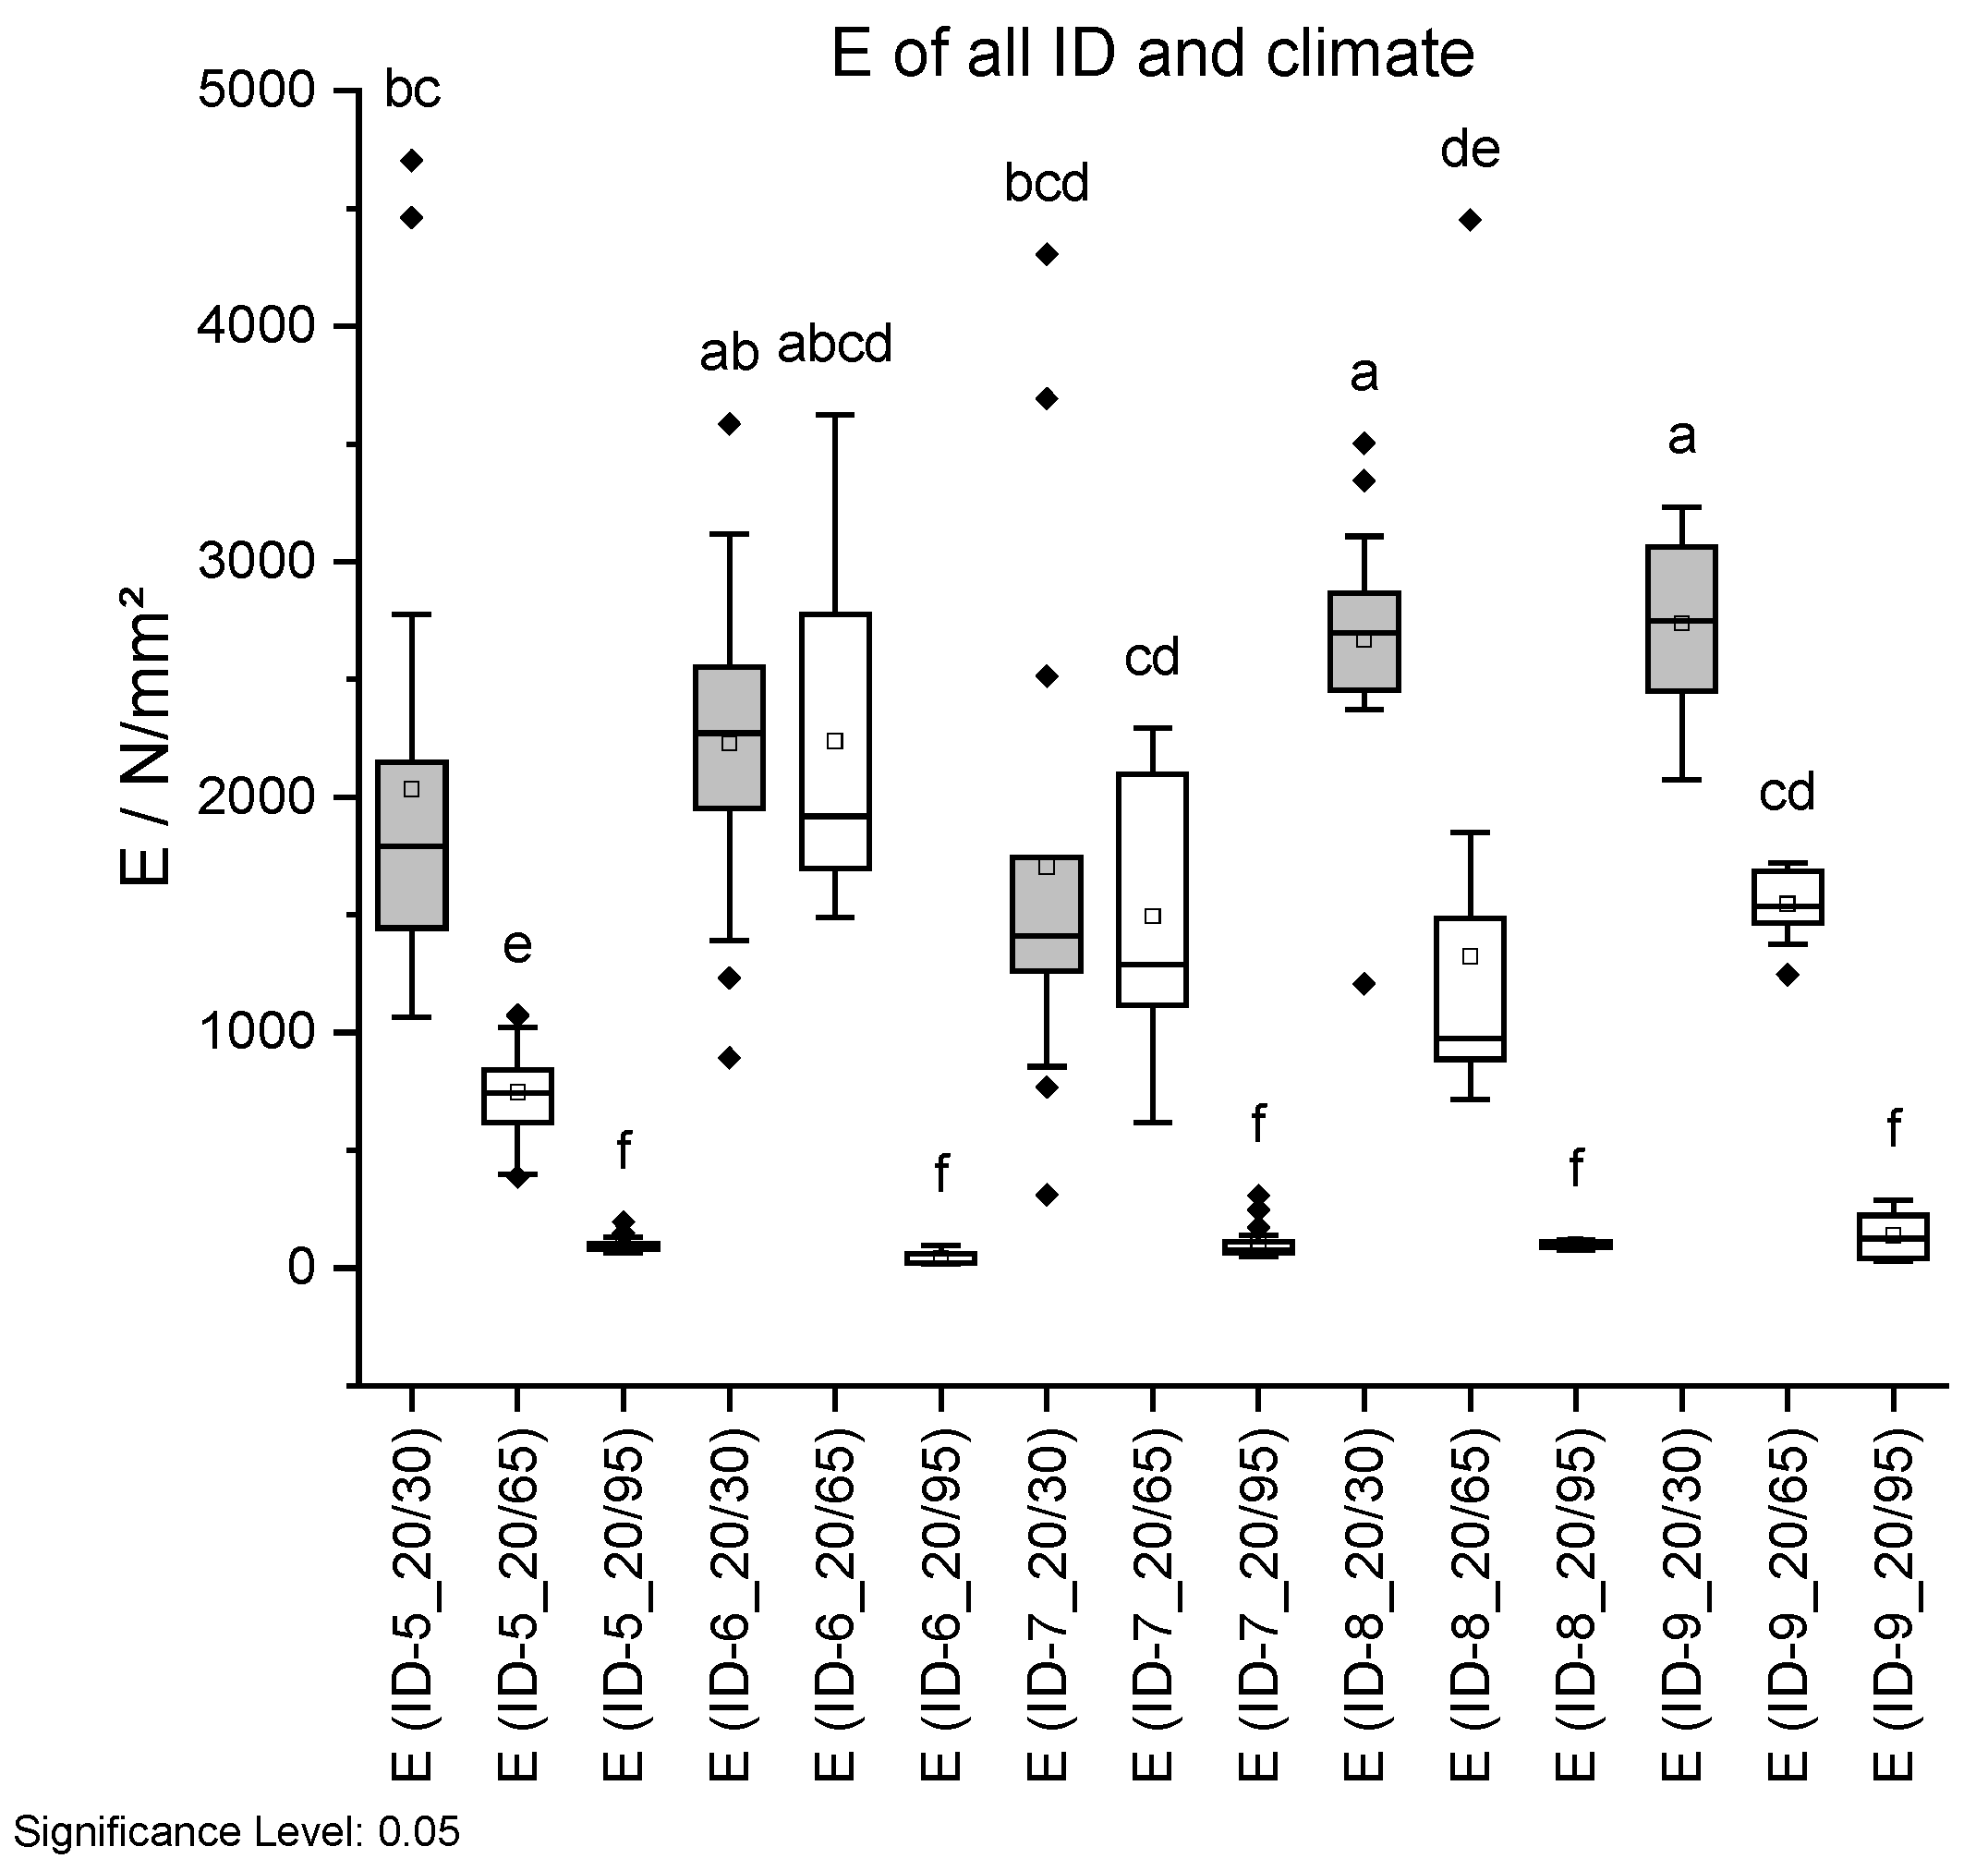
Tensile strength σ (top) and Young’s modulus E (bottom) dependent on ID and climate conditions. Climate 20 °C/30% RH is shown in grey, 20 °C/65% RH with no fill, and 20 °C/95% RH with vertical lines. Different letters in a column indicate that the results are statistically different at the 0.05 level.
Figure 19.
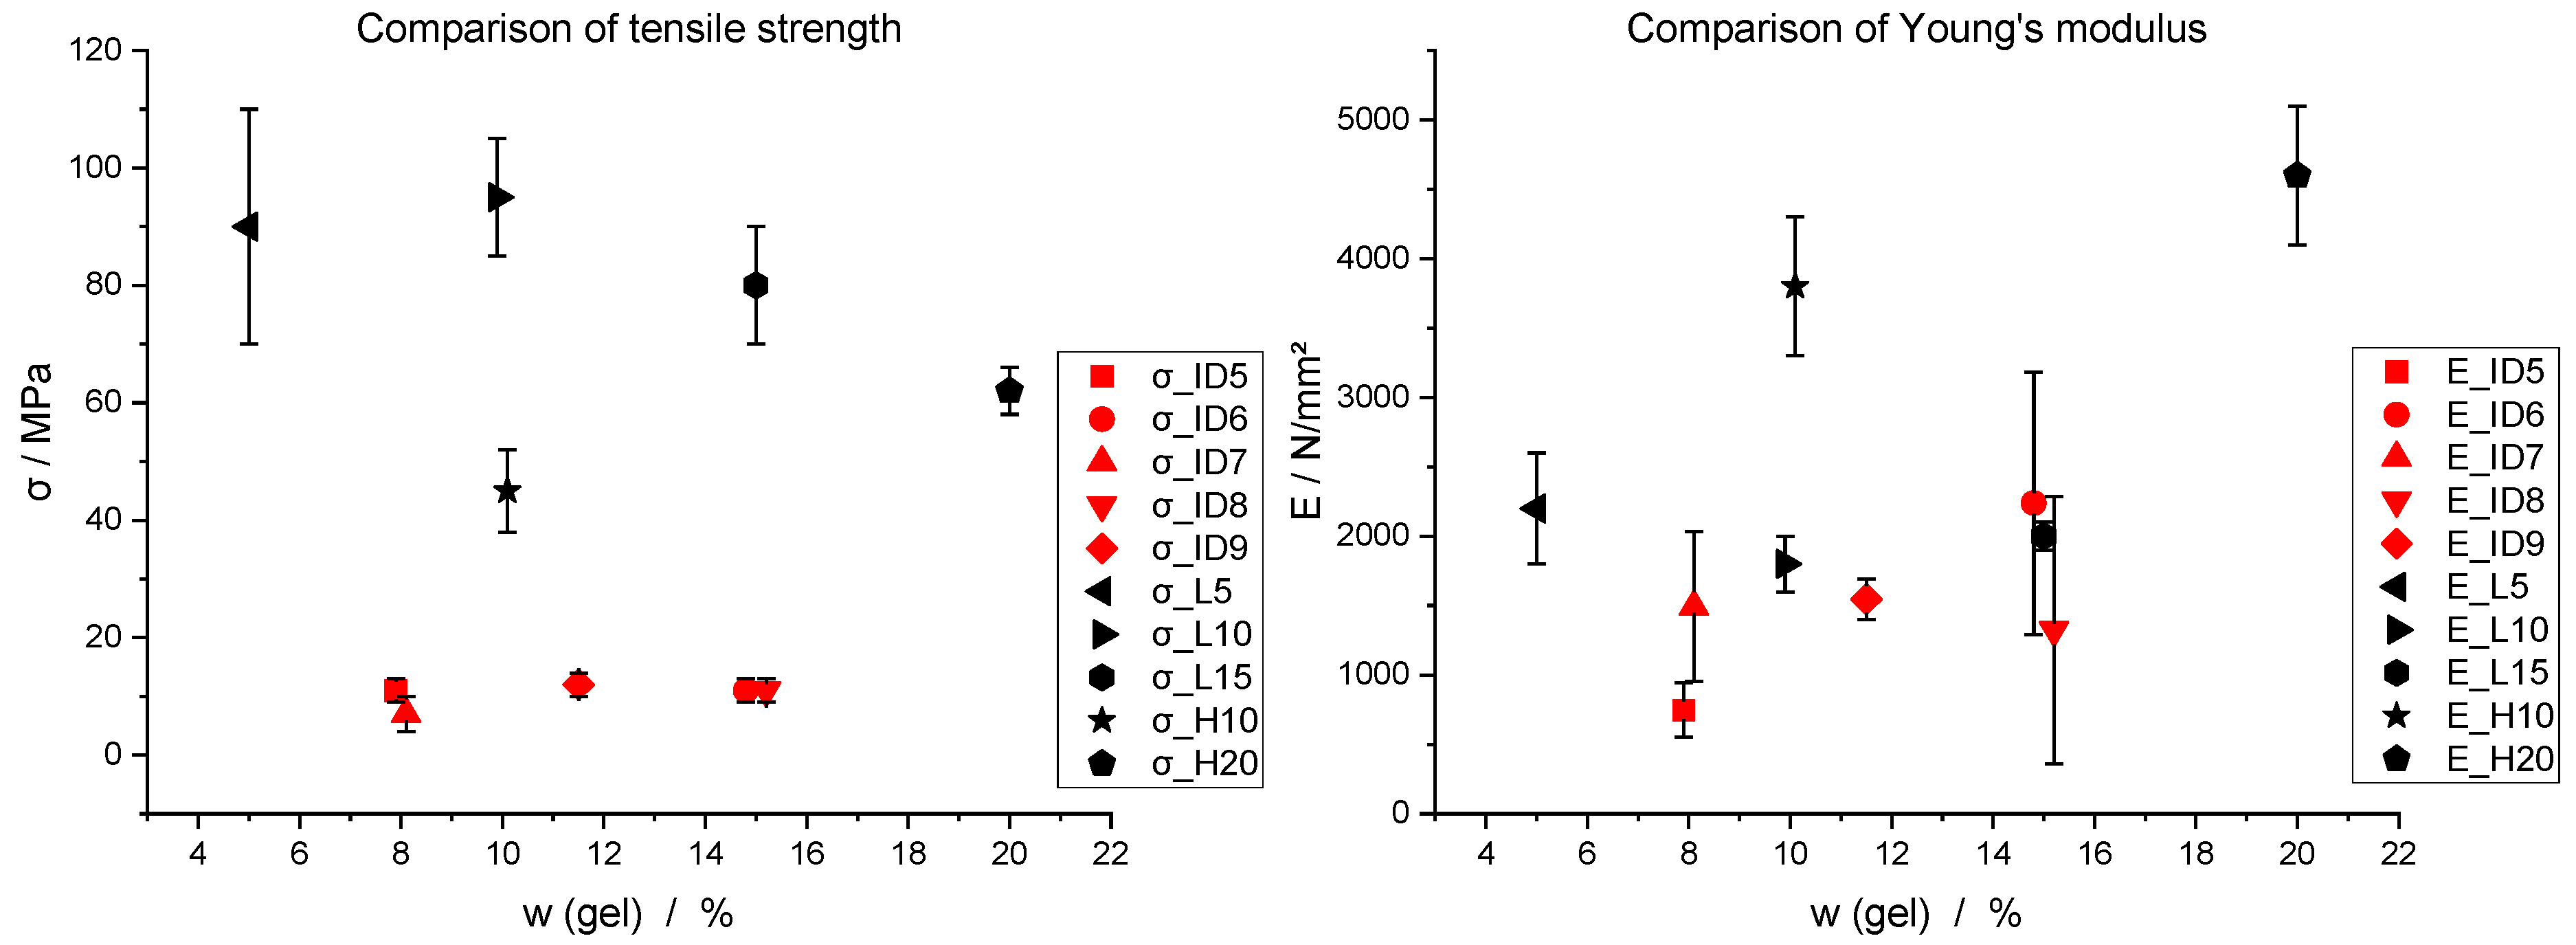
Comparison of literature values (black) of tensile strength (σ) and Young’s modulus (E) with experimental results (red) in relation to gelatine content w (gel).
Figure 19.
Comparison of literature values (black) of tensile strength (σ) and Young’s modulus (E) with experimental results (red) in relation to gelatine content w (gel).
Figure 20.
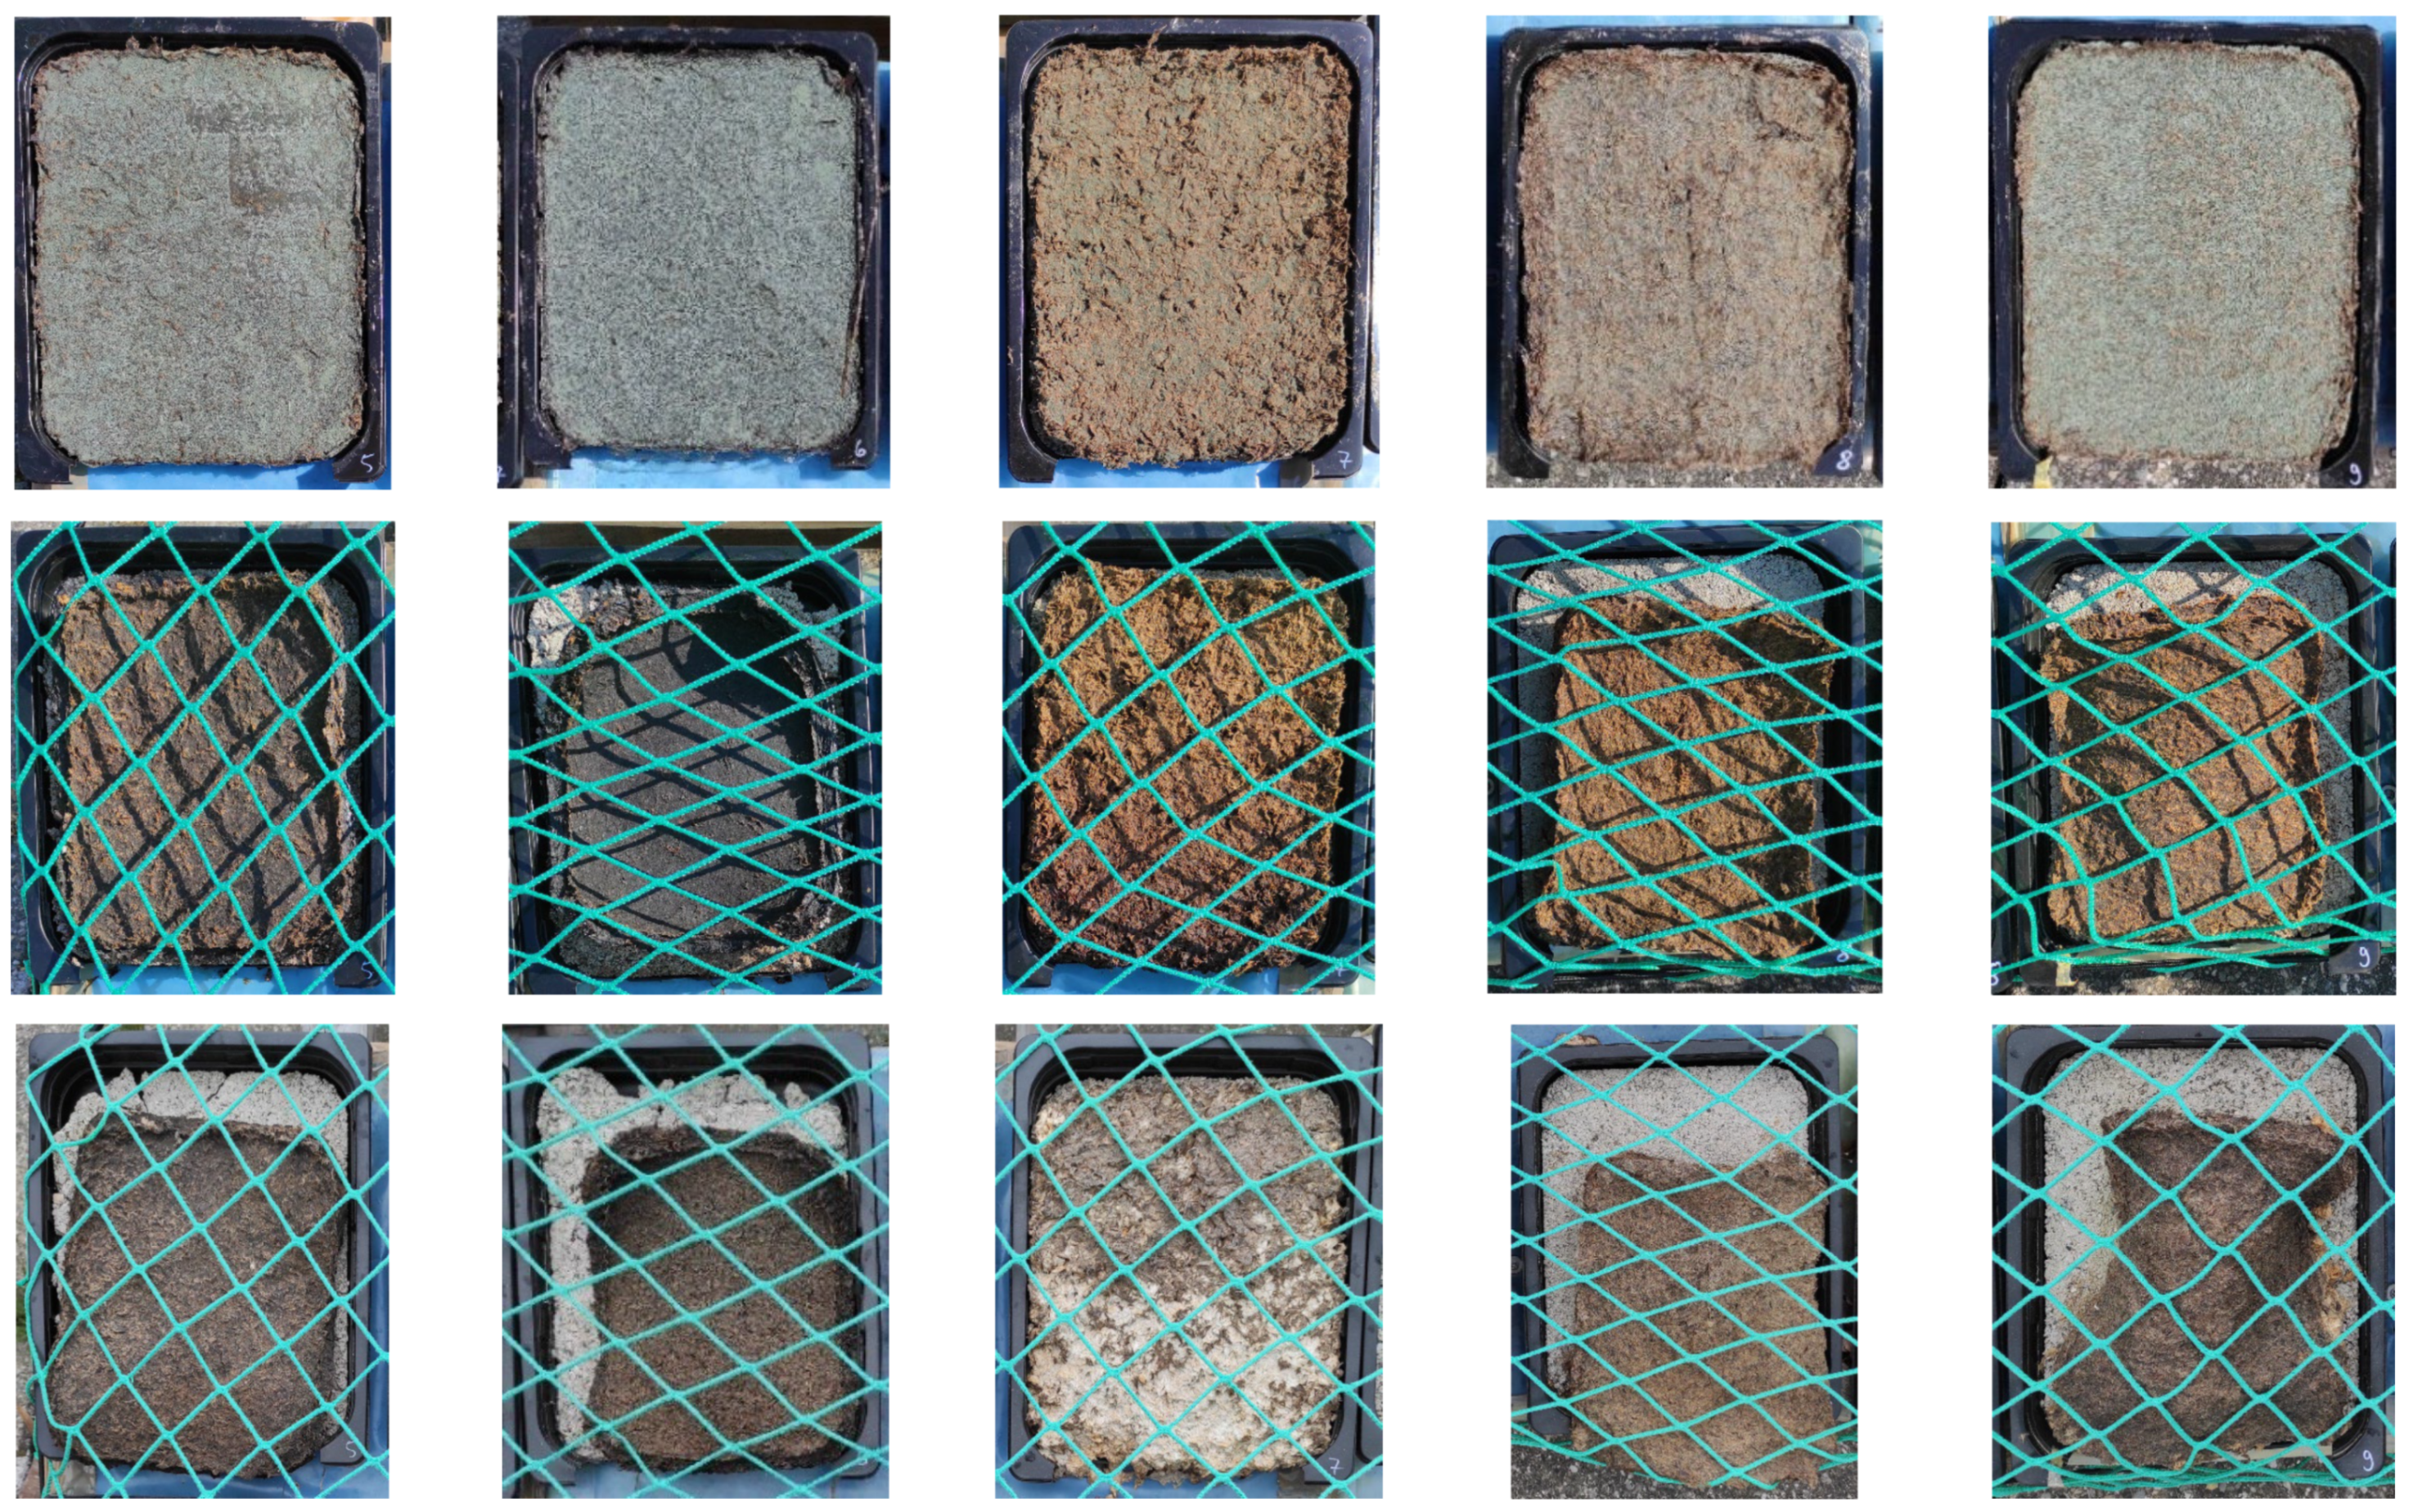
Long-term study: specimens at start of test (first row), at halfway point of 23 weeks (middle row), and at end at 46 weeks (last row). From left to right: ID 5, ID 6, ID 7, ID 8, and ID 9.
Figure 20.
Long-term study: specimens at start of test (first row), at halfway point of 23 weeks (middle row), and at end at 46 weeks (last row). From left to right: ID 5, ID 6, ID 7, ID 8, and ID 9.
Figure 21.
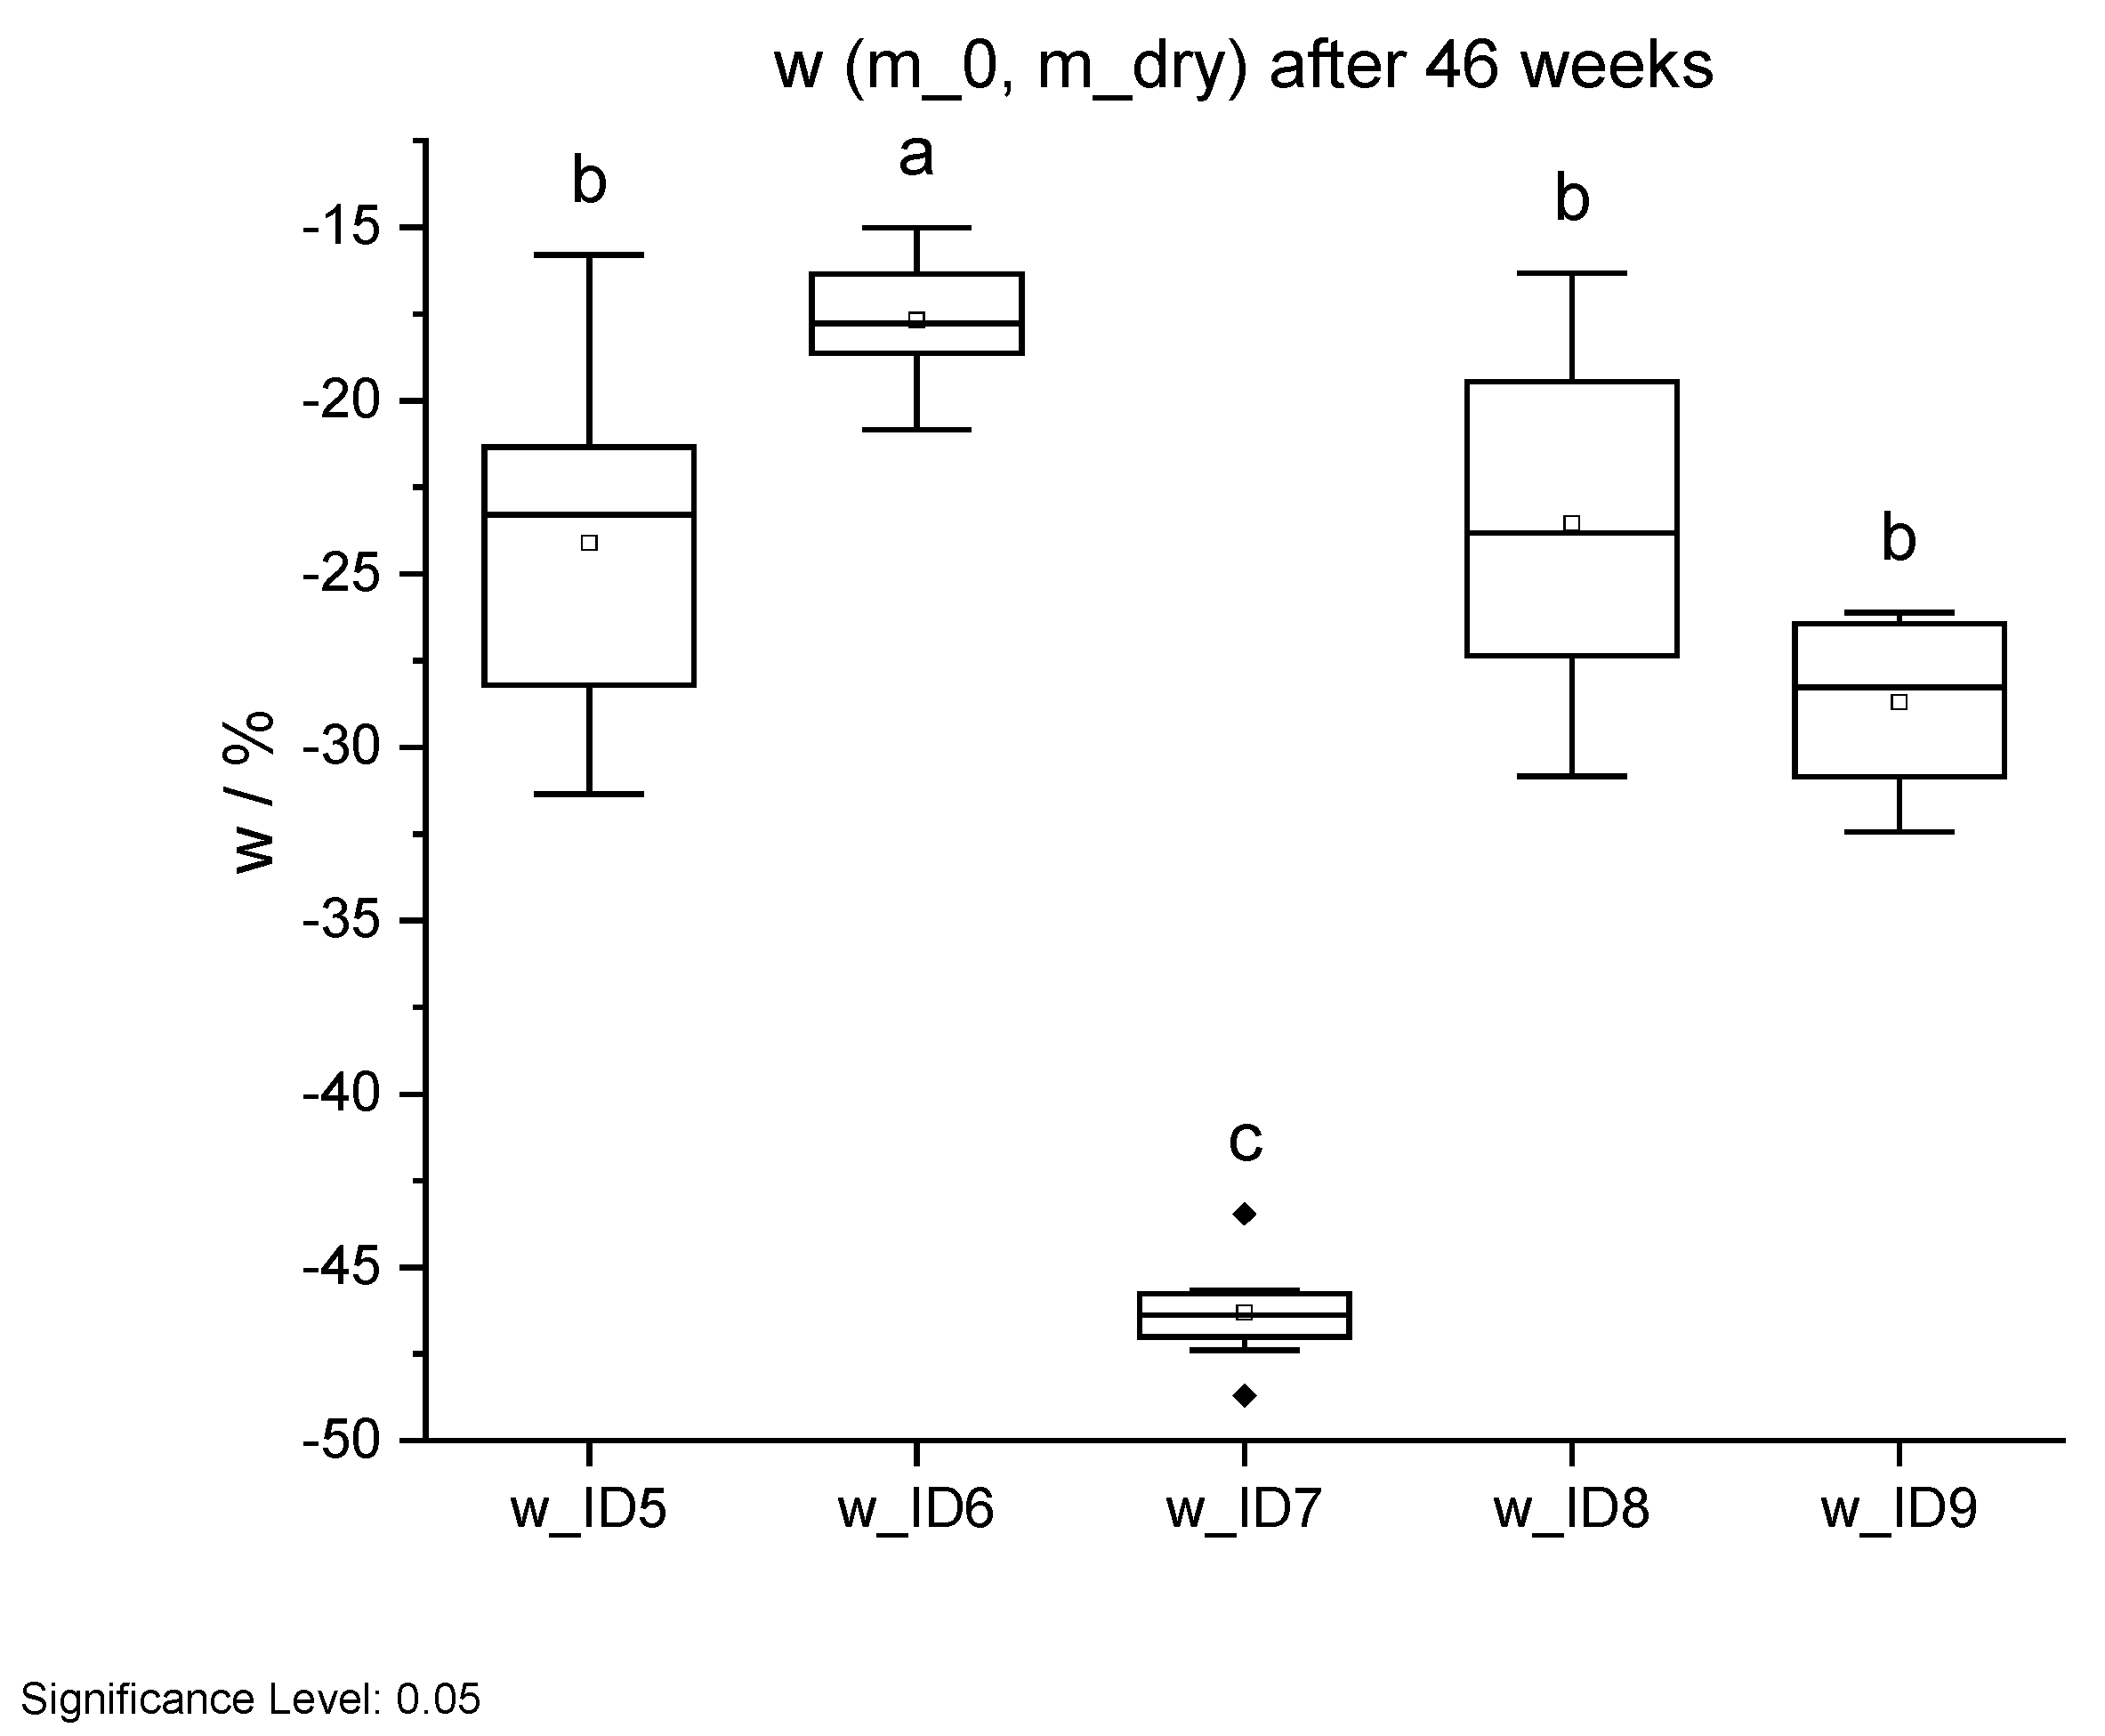
Mass change w through long-term weathering test after 46 weeks. Different letters indicate that the results are statistically different at the 0.05 level of significance.
Figure 21.
Mass change w through long-term weathering test after 46 weeks. Different letters indicate that the results are statistically different at the 0.05 level of significance.
Table 1.
Compositions of gelatine (gel), tannic acid (TA), and wood fibres of ID 1 to ID 9 in percentage w of the total mass. Additionally, less than 1% of NaOH is added to ensure a pH of 9 ± 0.2.
Table 1.
Compositions of gelatine (gel), tannic acid (TA), and wood fibres of ID 1 to ID 9 in percentage w of the total mass. Additionally, less than 1% of NaOH is added to ensure a pH of 9 ± 0.2.
| ID | w (Gel)/m–% | w (TA)/m–% | w (Fibres)/m–% | w (Water)/m–% |
|---|
| 1 | 8.0 | 0.1 | 6.0 | 85.9 |
| 2 | 15.0 | 0.2 | 6.0 | 78.8 |
| 3 | 8.0 | 0.1 | 12.0 | 79.9 |
| 4 | 15.0 | 0.2 | 12.0 | 72.8 |
| 5 | 8.0 | 1.0 | 6.0 | 85.0 |
| 6 | 15.0 | 2.0 | 6.0 | 77.0 |
| 7 | 8.0 | 1.0 | 12.0 | 79.0 |
| 8 | 15.0 | 2.0 | 12.0 | 71.0 |
| 9 (CP) | 11.5 | 1.0 | 9.0 | 78.5 |
Table 2.
Percentage of added NaOH.
Table 2.
Percentage of added NaOH.
| ID | m (NaOH)/m–% |
|---|
| 5 R | 0.28 |
| 6 R | 0.48 |
| 7 R | 0.27 |
| 8 R | 0.53 |
| 9 R | 0.28 |
| 5 H | 0.44 |
| 6 H | 0.85 |
| 7 H | 0.44 |
| 8 H | 1.13 |
| 9 H | 0.46 |
Table 3.
Variation of ID 8: tannic acid varied in relation to ID 8 with factor f.
Table 3.
Variation of ID 8: tannic acid varied in relation to ID 8 with factor f.
| ID | f (TA) |
|---|
| 8-TA-0.83 | 0.83 |
| 8-TA-0.67 | 0.67 |
| 8-TA-0.50 | 0.50 |
| 8-TA-1.00 | 1.00 |
| 8-TA-1.17 | 1.17 |
| 8-TA-1.33 | 1.33 |
| 8-TA-1.50 | 1.50 |
| 8-TA-1.67 | 1.67 |
| 8-TA-1.83 | 1.83 |
Table 4.
Summary of weather data of the long-term study.
Table 4.
Summary of weather data of the long-term study.
| | Temperature | Precipitation | Solar Radiation | Wind Velocity |
|---|
| | °C | mm/d | W/mm2 | m/s |
| Minimum | −11.6 | 0.0 | −4.5 * | 0.1 |
| Mean | 12.2 | 4.0 | 229.0 | 1.5 |
| Maximum | 36.3 | 61.4 | 1115.1 | 10.0 |
| Total | | 829.8 | | |
Table 5.
Dummy soil composition for long-term study of TSC in mass percentage w.
Table 5.
Dummy soil composition for long-term study of TSC in mass percentage w.
| w (Sand 0–8 Granulation)/m–% | w (CEM II/A-S 42.5 R)/m–% | w (Desalinated Water)/m–% |
|---|
| 85.0 | 7.5 | 7.5 |
Table 6.
Amount of TSC used in the long-term study.
Table 6.
Amount of TSC used in the long-term study.
| ID | m (TSC)/g |
|---|
| 5 R | 1740 ± 2 |
| 6 R | 1740 ± 2 |
| 7 R | 1430 ± 2 |
| 8 R | 1550 ± 2 |
| 9 R | 1680 ± 2 |
Table 7.
Number of replicates for each test.
Table 7.
Number of replicates for each test.
| ID | Number of Replicates n |
|---|
| Water uptake | 11–12 |
| Shrinkage | 8 |
| Water Vapour Permeability | 5 |
| Tensile properties | 14 |
| Long-Term Weathering | 9 |
Table 8.
Results of water uptake trials of part 1 as mean ± standard deviation.
Table 8.
Results of water uptake trials of part 1 as mean ± standard deviation.
| ID | w (m_dry, m_max) | w (m_dry, m_max) |
|---|
| | 3 h | 24 h |
| | % | % |
| 5 R | 124 ± 13 cde | 259 ± 24 cd |
| 5 H | 127 ± 16 cd | 256 ± 55 bc |
| 6 R | 109 ± 6 de | 239 ± 17 cde |
| 6 H | 97 ± 14 e | 222 ± 25 cde |
| 7 R | 166 ± 18 b | 262 ± 25 bc |
| 7 H | 210 ± 36 a | 305 ± 17 a |
| 8 R | 148 ± 35 bc | 266 ± 32 bc |
| 8 H | 206 ± 33 a | 293 ± 22 ab |
| 9 R | 102 ± 10 de | 194 ± 31 e |
| 9 H | 112 ± 22 de | 205 ± 38 de |
Table 9.
Mean ± standard deviation of mass change w before and after ageing for three hours at 80 °C.
Table 9.
Mean ± standard deviation of mass change w before and after ageing for three hours at 80 °C.
| ID | w (m_0, m_e) |
|---|
| | 3 h/80 °C |
| | % |
| 5 R | −23.6 ± 4.9 e |
| 5 H | −15.5 ± 4.5 bc |
| 6 R | −40.2 ± 4.8 f |
| 6 H | −11.6 ± 0.8 ab |
| 7 R | −10.6 ± 1.3 a |
| 7 H | −16.0 ± 1.7 c |
| 8 R | −18.3 ± 2.0 cd |
| 8 H | −7.6 ± 0.7 a |
| 9 R | −20.4 ± 1.5 de |
| 9 H | −9.7 ± 0.5 a |
Table 10.
Mass change w (m) and cross-sectional shrinkage w (A) from initial state (_0) to equilibrium moisture content at 85% RH (_85) and 65% RH (_65); values represent mean ± standard deviation.
Table 10.
Mass change w (m) and cross-sectional shrinkage w (A) from initial state (_0) to equilibrium moisture content at 85% RH (_85) and 65% RH (_65); values represent mean ± standard deviation.
| ID | w (m_0, m_85) | w (A_0, A_85) | w (m_0, m_65) | w (A_0, A_65) | w (m_0, m_dry) | w (A_0, A_dry) |
|---|
| | % | % | % | % | % | % |
| 5 R | −80.7 ± 0.6 f | −94.9 ± 0.4 c | −82.0 ± 0.2 f | −95.1 ± 0.5 b | −84.1 ± 0.2 f | −95.4 ± 0.4 cd |
| 6 R | −70.3 ± 1.2 b | −94.1 ± 0.4 b | −73.9 ± 0.3 b | −94.6 ± 0.4 b | −76.8 ± 0.3 b | −94.5 ± 0.3 ab |
| 7 R | −76.0 ± 0.3 d | −93.5 ± 0.9 ab | −76.4 ± 0.1 d | −93.8 ± 0.5 a | −79.5 ± 0.3 d | −94.0 ± 0.6 a |
| 8 R | −65.1 ± 0.8 a | −93.4 ± 0.4 a | −68.5 ± 0.1 a | −93.6 ± 0.4 a | −71.8 ± 0.2 a | −93.9 ± 0.5 a |
| 9 R | −72.6 ± 0.6 c | −93.9 ± 0.4 ab | −75.5 ± 0.2 c | −94.5 ± 0.4 b | −78.2 ± 0.2 c | −94.8 ± 0.5 bc |
| 5 NF R | −88.3 ± 0.2 h | −97.5 ± 0.1 e | −88.9 ± 0.1 h | −97.6 ± 0.2 d | −90.5 ± 0.1 h | −97.8 ± 0.1 f |
| 6 NF R | −77.4 ± 0.3 e | −96.6 ± 0.1 d | −79.3 ± 0.1 e | −96.9 ± 0.1 c | −81.5 ± 0.1 e | −95.8 ± 0.3 d |
| 9 NF R | −83.3 ± 0.2 g | −97.1 ± 0.1 de | −84.7 ± 0.1 g | −97.3 ± 0.1 cd | −86.5 ± 0.2 g | −96.6 ± 0.2 e |
Table 11.
Results of tensile strength tests as mean ± standard deviation. Tensile strength in dependence of the equilibrium moisture content after sample conditioning at 20 °C/30% RH, 20 °C/65% RH, and 20 °C/95% RH; values represent mean ± standard deviation.
Table 11.
Results of tensile strength tests as mean ± standard deviation. Tensile strength in dependence of the equilibrium moisture content after sample conditioning at 20 °C/30% RH, 20 °C/65% RH, and 20 °C/95% RH; values represent mean ± standard deviation.
| ID | 20 °C/30% RH | 20 °C/65% RH | 20 °C/95% RH |
|---|
| | σ/MPa | E/N/mm2 | σ/MPa | E/N/mm2 | σ/MPa | E/N/mm2 |
|---|
| 5 R | 11 ± 2 bc | 2034 ± 923 bc | 11 ± 2 b | 746 ± 195 e | 6 ± 1 fgh | 97 ± 28 f |
| 6 R | 8 ± 3 de | 2228 ± 619 ab | 11 ± 2 bcde | 2238 ± 946 abcd | 4 ± 2 ghi | 41 ± 28 f |
| 7 R | 8 ± 3 cdef | 1704 ± 1099 bcd | 7 ± 3 efg | 1493 ± 540 cd | 2 ± 1 i | 100 ± 60 f |
| 8 R | 17 ± 3 a | 2667 ± 543 a | 11 ± 2 bcd | 1324 ± 963 de | 4 ± 1 ghi | 99 ± 13 f |
| 9 R | 17 ± 5 a | 2738 ± 355 a | 12 ± 2 b | 1546 ± 148 cd | 4 ± 2 hi | 138 ± 94 f |
Table 12.
Literature values for tensile strength (σ) and Young’s modulus (E) of gelatine films.
Table 12.
Literature values for tensile strength (σ) and Young’s modulus (E) of gelatine films.
| ID | w (Gel)/% | σ/MPa | E/MPa | Source |
|---|
| L5 | 5 | 90 ± 20 | 2200 ± 400 | [46] |
| H10 | 10 | 45 ± 7 | 3800 ± 500 | [47] |
| L10 | 10 | 95 ± 10 | 1800 ± 200 | [46] |
| L15 | 15 | 80 ± 10 | 2000 ± 100 | [46] |
| H20 | 20 | 62 ± 4 | 4600 ± 500 | [47] |
Table 13.
Visual evaluation of long-term study results at the halfway point and the end compared to the start, scaled from very high (4) to none (0) in comparison to other IDs.
Table 13.
Visual evaluation of long-term study results at the halfway point and the end compared to the start, scaled from very high (4) to none (0) in comparison to other IDs.
| ID | Cohesion/Stiffness | Deformation/Shrinkage |
|---|
| 0 Weeks | 23 Weeks | 46 Weeks | 0 Weeks | 23 Weeks | 46 Weeks |
|---|
| 5 | 4 | 3 | 2.5 | 0 | 1 | 2 |
| 6 | 4 | 3.5 | 3 | 0 | 2 | 3 |
| 7 | 4 | 0 | 0 | 0 | 0 | 0 |
| 8 | 4 | 3 | 2 | 0 | 0 | 1 |
| 9 | 4 | 2 | 1 | 0 | 1 | 2 |
Table 14.
Mass change w through long-term weathering after 46 weeks as mean ± standard deviation.
Table 14.
Mass change w through long-term weathering after 46 weeks as mean ± standard deviation.
| ID | w (m_0, m_dry)/% |
|---|
| 5 R | −24 ± 5 b |
| 6 R | −18 ± 2 a |
| 7 R | −46 ± 2 c |
| 8 R | −24 ± 5 b |
| 9 R | −29 ± 3 b |
