Article

Moso Bamboo Invasion Enhances Soil Infiltration and Water Flow Connectivity in Subtropical Forest Root Zones: Mechanisms and Implications

School of Soil and Water Conservation, Beijing Forestry University, Beijing 100083, China
*
Author to whom correspondence should be addressed.
Forests 2025, 16(10), 1589; https://doi.org/10.3390/f16101589
Submission received: 19 September 2025 / Revised: 10 October 2025 / Accepted: 14 October 2025 / Published: 16 October 2025
(This article belongs to the Section Forest Soil)

Abstract

Plant roots influence soil infiltration by altering its properties like porosity and bulk density, which are essential for ecohydrological cycles. Moso bamboo (Phyllostachys edulis), using its well-developed underground root system, invades neighbor forest communities, thereby influencing root characteristics and soil properties. Although Moso bamboo invasion may alter soil hydrology, its specific impact on soil infiltration capacity and water flow connectivity remains unclear. This work took a fir forest (Cunninghamia lanceolata), mixed fir and bamboo forest, and a bamboo forest which represent three different degrees of invasion: uninvaded, partially invaded, and completely invaded, respectively, as study objects, using double-ring dyeing infiltration method to measure soil infiltration capacity and calculating water flow connectivity index for the root zone. To assess the effects of soil properties and root characteristics on soil infiltration capacity and water flow connectivity, we employed random forest and structural equation modeling. The analysis revealed that Moso bamboo invasion significantly enhanced soil infiltration capacity. Specifically, in partially invaded forests, the initial infiltration rate, stable infiltration rate, and average infiltration rate increased by 31.5%, 26.1%, and 28.5%, respectively. In completely invaded forests, the corresponding increases were 6.6%, 35.6%, and 28.5%. Also, Moso bamboo invasion increased water flow connectivity of root zone, compared to the uninvaded forest, the water flow connectivity index increased by 29.4% in the completely invaded forest and by 15.6% in the partially invaded forest. The marked increase in fine root biomass density (RBD1), fine root length density (RLD1), soil organic carbon (SOC), and non-capillary pores (NCP) and the decrease in soil bulk density (SBD) followed by Moso bamboo invasion effectively improved water flow connectivity and soil infiltration capacity. The analysis identified that RBD1, RLD1, NCP, and SBD as the key drivers of soil infiltration capacity, whereas the water flow connectivity index was controlled mainly by SOC, NCP, RLD1, and RBD1. These findings help clarify the mechanistic pathways of Moso bamboo’s effects on soil infiltration.

1. Introduction

The function and structure of forest ecosystems are increasingly jeopardized by severe plant invasions, a problem amplified by the drivers of global change, namely climate disruption and human activities [1,2,3]. Through vegetative reproduction facilitated by a well-developed rhizome network, Moso bamboo (Phyllostachys edulis) efficiently expands and colonizes new areas. The bamboo whip expands horizontally, constantly invading the surrounding forest community, and finally forming a pure bamboo forest [4]. According to the China Forest Resources Survey, there is an annual expansion of 2.48 million hectares in Moso bamboo forest cover [5]. Furthermore, Moso bamboo invasion is a widely observed phenomenon in Japan [6]. The invasion of Moso bamboo profoundly transforms ecological processes and functions in forest ecosystems, drawing considerable attention from ecologists due to its broad implications [7].
Soil infiltration is a key link in the forest hydrological cycle [8], which has been the subject of decades of innovative and in-depth research [9]. It can not only directly reflect the water conservation capacity of soil, but also affect the use of soil and water resources [10,11]. Soil infiltration capacity is governed by several primary factors, including vegetation root systems, topography, soil properties, and hydrological conditions [12,13,14]. The spatial heterogeneity of infiltration is further shaped by varying interactions among these factors [15,16]. The growth and death of roots facilitate the development of soil macropores [17] and alter soil properties [18,19], which can either enhance or diminish preferential flow paths. This process ultimately modulates soil infiltration capacity via multiple mechanistic pathways [13,20]. Plant diversity and distinct root characteristics lead to spatial heterogeneity in soil infiltration capacity [21,22]. Additionally, the influence of the different diameters of roots on soil infiltration capacity continues to generate considerable scholarly disagreement and ongoing discussion [23]. Soil infiltration, a complex process governed by multiple factors [24,25,26], presenting a major challenge in predicting transient flow pathways. To address this, studies have used stained area ratio, preferential flow fraction, matrix-to-preferential flow depth ratio [27], and water flow connectivity index [28] to learn the development and dynamics of soil preferential flow pathways [29] and to assess its response to vegetation restoration. The dye-tracer method provides an effective means to evaluate this connectivity [30]. As the invasion of Moso bamboo advances, it reshapes belowground environments by modifying root characteristics and soil properties [4], which affects the soil infiltration capacity. However, the effects of Moso bamboo invasion on soil infiltration processes remain poorly understood. A systematic examination of infiltration characteristics and their underlying mechanisms across different invasion stages is thus necessary to accurately evaluate its impact on regional ecohydrological functioning.
In southern subtropical China, Moso bamboo invasion most frequently affects coniferous and broad-leaved forests. Notably, fir forests are disproportionately affected, comprising 35% of documented invasions [5]. Unlike woody invaders, the spread of Moso bamboo—driven by its rhizomatous growth habit—induces distinct modifications to soil structure, leading to subsequent changes in both the capacity and spatial patterns of soil water infiltration. However, the specific impacts of Moso bamboo invasion on soil properties and root characteristics are contingent upon the intensity and typology of the invasion process [31]. Previous research has predominantly focused on the impacts of Moso bamboo invasion within Chinese fir forests on key parameters including soil pH, plant diversity, and organic carbon dynamics; however, these studies did not quantitatively assess the contribution of these soil characteristics to soil infiltration processes. This omission substantially limits a mechanistic interpretation of how Moso bamboo invasion influences infiltration capacity and hydrological connectivity. Consequently, targeted investigations examining soil infiltration dynamics and water flow pathways across distinct invasion stages are critically needed.
A limited understanding exists of the effects of varying invasion stages on soil infiltration and water flow connectivity, and their driving mechanisms. To address this, soil infiltration capacity and hydrological connectivity were quantified across three representative stages of Moso bamboo invasion (Moso bamboo forest, mixed fir and bamboo forest, and fir forest), and analyzed the effects of the changes in soil properties and root characteristics on soil infiltration capacity and water flow connectivity. In addition, we formulated and subsequently tested the following hypotheses: (1) that the facilitative effect of bamboo on soil infiltration is mediated by its fine root, and (2) that the patterns of water flow are governed by soil carbon and porosity.

2. Materials and Methods

2.1. Study Area

The study area was located in Anji County (Figure 1a), Huzhou City, Zhejiang Province, China (30°36′30.3″ N, 119°35′1.455″ E). Anji County has the reputation of being “China’s Bamboo Township”. The topography and landform of Anji County is basin-shaped, with the opening facing north and mountains and hills on all sides. It has a typical subtropical monsoon climate, with rainfall mainly concentrated from May to August with an average of 1400 mm and an average annual temperature of 16.6 °C. The soil type is mainly a yellow soil, with a thickness of 40–60 cm. After a long period of Moso bamboo invasion, three typical types of forests have gradually formed: fir forests, mixed fir and bamboo forest, and Moso bamboo forests (Figure 1b). These forest types represent three different invading stages: uninvaded, partially invaded, and completely invaded forests, respectively.

2.2. Plot Setting and Survey

The invasion stage of Moso bamboo was classified based on its relative abundance within the forest stand [32,33]. Three typical invasion stages of Moso bamboo were defined: the non-invasive stage (tree-dominated, bamboo density < 20%), the partial invasion stage (bamboo density: 20%–90%), and the complete invasion stage (bamboo-dominated, density > 90%). Therefore, we selected study areas with each of the three invasive stages that otherwise had the same site conditions along the invasion path, namely Moso bamboo forests (completely invaded), mixed Moso bamboo and Chinese fir forest (partially invaded), and pure Chinese fir forest (Uninvaded). We selected five plots at the same horizontal position to match similar intrusion studies, and 5 sampling points that 1 m away from tree trunk were randomly established within each plot for the measurement of soil infiltration properties. Spatial autocorrelation analysis revealed no significant spatial autocorrelation among the plots with the same invasion stage, which were spaced 40-120 m apart, indicating no pseudo-replication. The conditions in the plots under the three stages of Moso bamboo invasion are shown in Table 1.

2.3. Soil Infiltration Capacity and Water Flow Connectivity Measurement

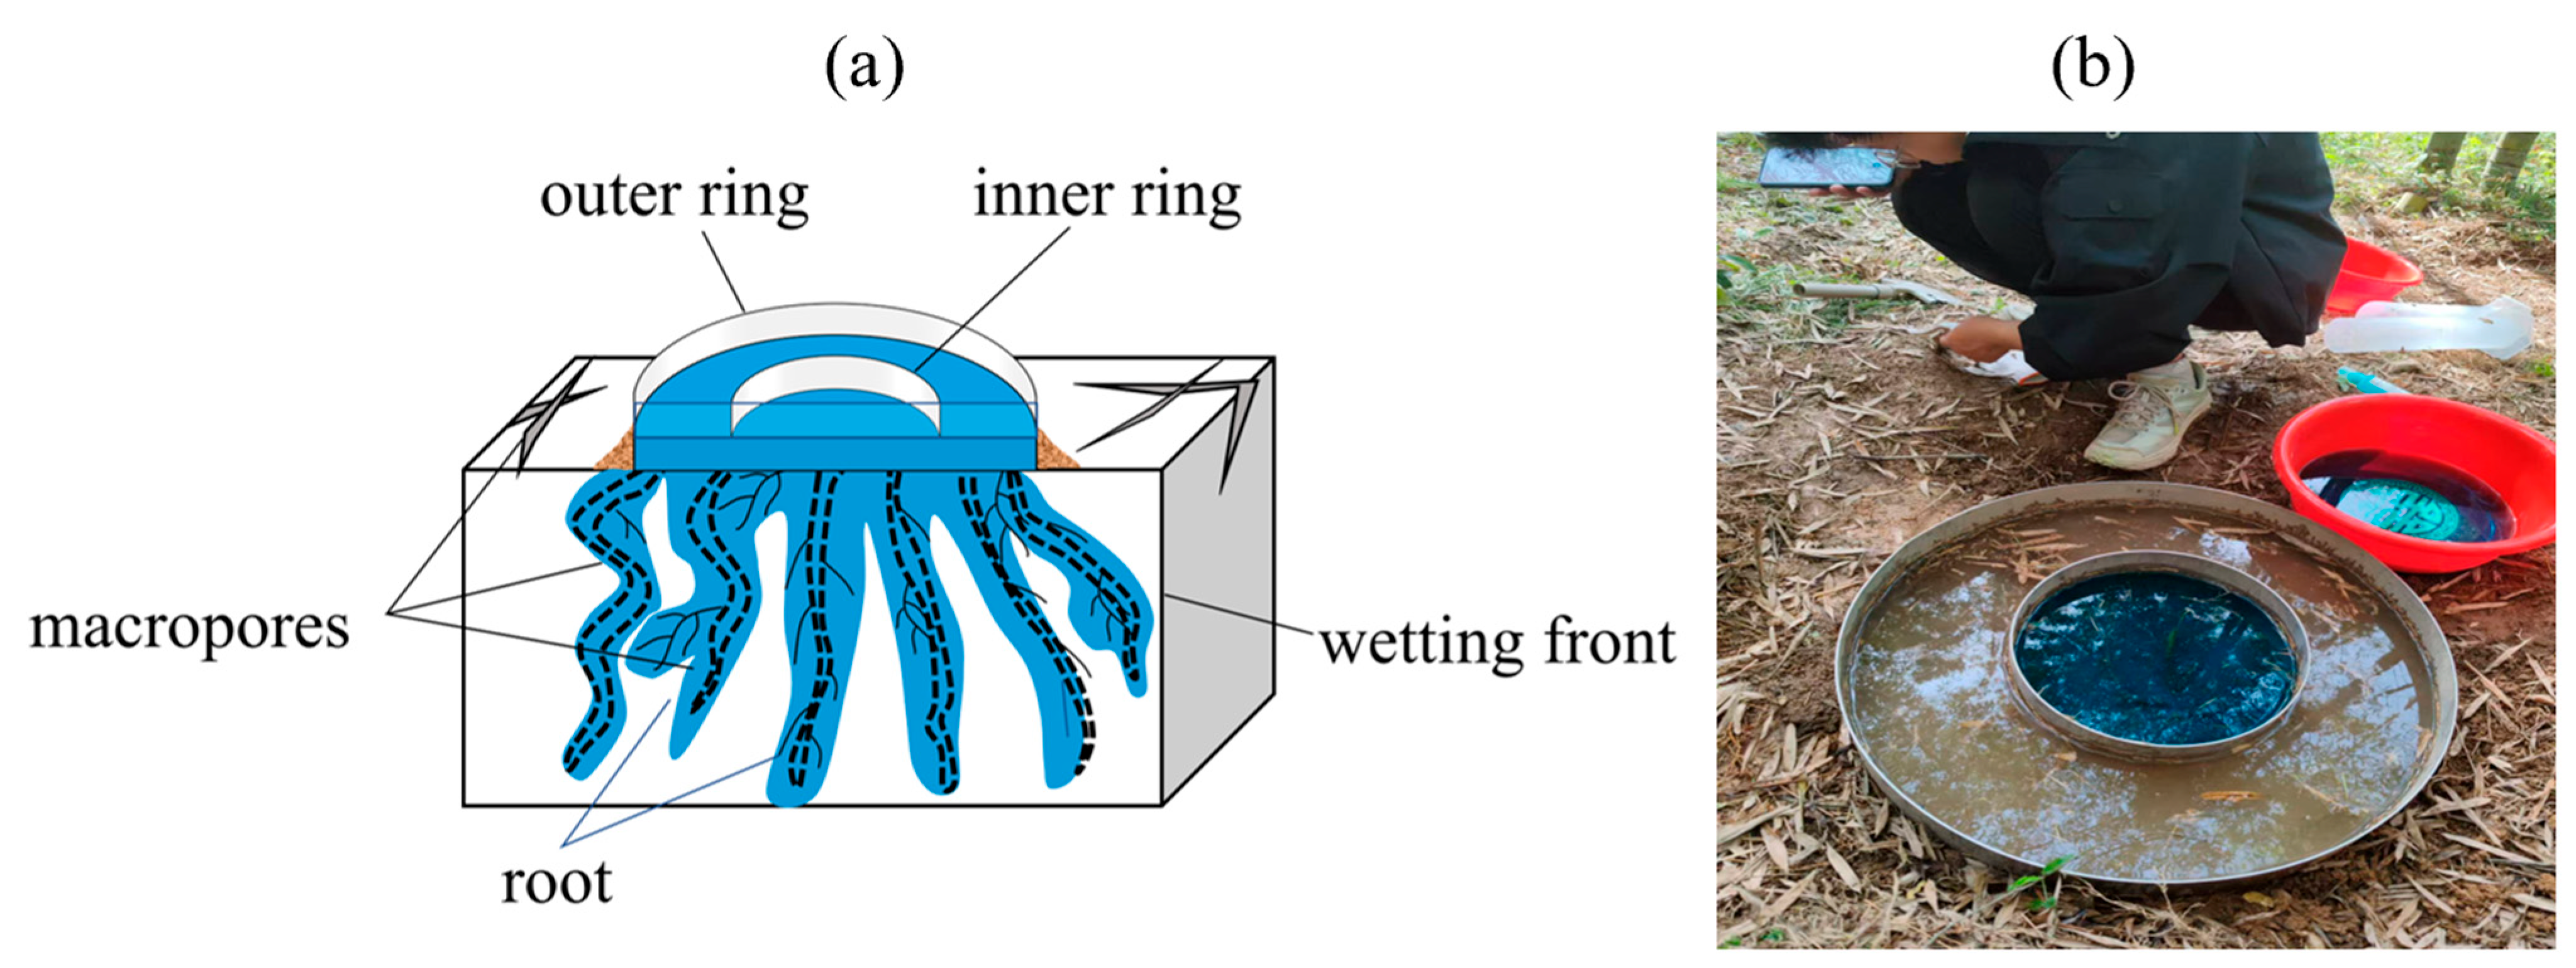
All materials on a flat area of the surface (approximately 1 × 1 m) were cleared from the selected sample points, including all dead leaves and plants. This enabled a double-ring dyeing infiltration test to be conducted. In order to eliminate the influence of the initial soil moisture on the infiltration rates, soil moisture was standardized across all plots before infiltration tests. A surface-mounted double-ring infiltrometer, with inner and outer ring diameters of 30 cm and 60 cm, respectively, was driven 3 cm into the soil using a rubber mallet (Figure 2). Care was taken to avoid damaging the original soil structure. A nylon mesh cloth and foam plate were placed between the outer and inner rings to prevent the surface soil from being directly washed out by the dye as it was poured. The compacted soil ensured that dye seepage was prevented. We used 4 g/L Brilliant Blue FCF, a common tracer, which has been applied and verified in previous study [25]. The bright blue dye solution (4 g/L) and water were quickly poured into the inner and outer rings, respectively. Both rings were supplied simultaneously to maintain a constant hydraulic head of 4 cm in both the inner and outer rings. The water head height of the outer ring consistently matched that of the inner ring, effectively preventing lateral infiltration of the inner ring solution from affecting the infiltration result. The time taken for each 0.5 cm drop in the head height of the solution was recorded. Water was replenished to maintain a constant head of 4 cm whenever the level decreased to a threshold of 1 cm (i.e., by adding solution to a further 3 cm height). Stable soil infiltration was considered to have occurred when the height consistently decreased by at least 4 cm with an unchanging interval of 0.5 cm [34]. The wetting front was considered stable 24 h after infiltration ended. Subsequently, to facilitate observation, a vertical soil profile extending 50 cm in depth was created, ensuring a tidy exposure. The dyed section was photographed to obtain images for further analysis.

2.4. Soil Sample and Root Determination

Following a 24 h stabilization period after the double-ring infiltration test, a vertical soil profile was prepared by trenching through the center of the inner ring. Soil samples were collected from stratified depth intervals of 0–10 cm, 10–20 cm, 20–30 cm, 30–40 cm, and 40–50 cm. For each interval, we took three replicates to determine total porosity, non-capillary porosity, soil texture, initial soil water content, bulk density, and other fundamental physical properties. Soil bulk density, saturated water content, and total porosity were measured using the cutting-ring method, while particle size distribution was determined using laser diffraction analysis. All retrieved root samples were promptly transported to the laboratory and air-dried in a cool, well-ventilated environment to prevent microbial degradation. All roots were then washed with clean water, and divided into fine (<2 mm) and coarse (>2 mm) roots using vernier calipers. The roots of the different diameter classes were then scanned and measured by a root scanning analysis system of WinRHIZO-pro (2022a version, Regent Instruments Inc., Québec, QC, Canada), and multiple root indexes were obtained, including root length (RL), root surface area (RSA), and root volume (RV). The three root morphological indexes of RLD, RSD, and RVD were calculated according to Formulas (1)–(3), respectively, and the biomass of the different diameter classes was calculated after drying. Abbreviations are shown in Table 2.
R L D = R L V
R S A D = R S A V
R V D = R V V
In the formula, RLD, RSAD, and RVD are the root length density, root surface area density, and root volume density, respectively; RL, RSA, and RV are the total root length (cm), total root surface area (cm2), and total root volume (cm3), respectively; and V is the total volume.

2.5. Calculation of Soil Infiltration Rate and Water Flow Connectivity

2.5.1. Calculation of the Soil Infiltration Rate

The soil infiltration rate refers to the speed of soil water infiltration per unit time. It is calculated as follows:
i = I t × 60
In the formula: i represents the soil infiltration rate (cm/h); I is the height of the infiltrating water head (cm) within the time interval t (minutes) for the inner ring; and 60 is a conversion factor used to convert the infiltration rate from a per-minute basis to a per-hour basis.

2.5.2. Calculation of Water Flow Connectivity Index

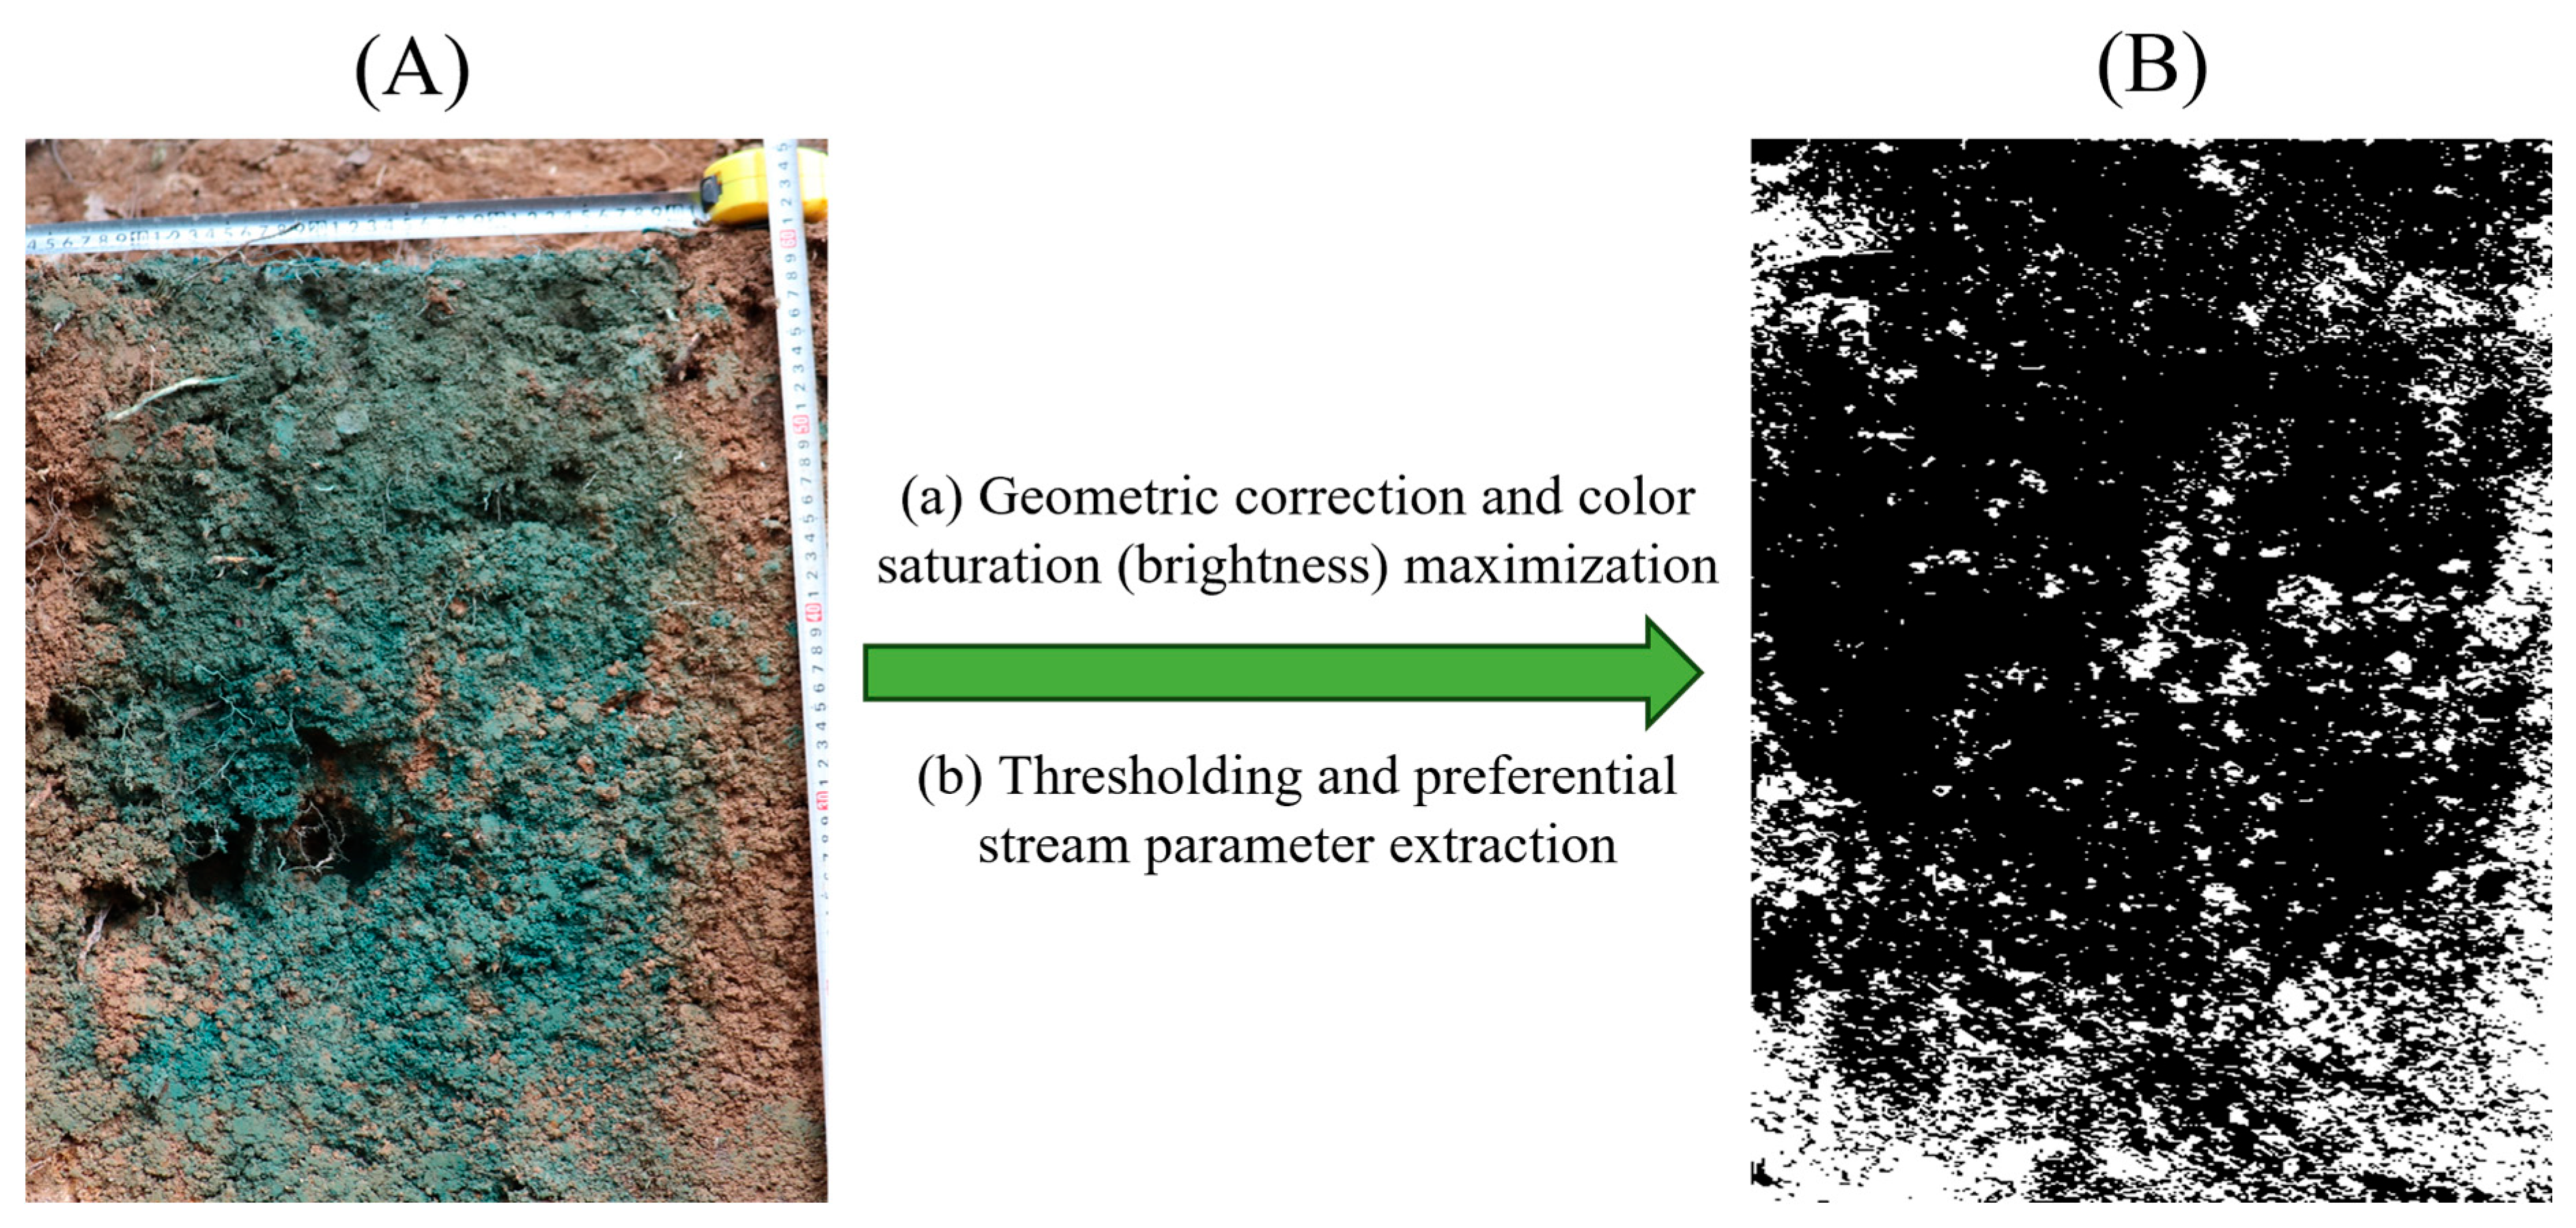
The soil water flow connectivity index is constructed based on the field preferential flow index. The preferential flow index, which includes metrics such as the stained area ratio and fractal dimension, can reveal the intensity of water movement within the soil [30], providing fundamental data for the construction of the water flow connectivity index. The soil staining images are cropped and geometrically corrected using Photoshop CS6. The processed images are then binarized in ImageJ software (1.53e version, Wayne Rasband, National institute of Health, Bethesda, MD, USA). ArcMap 10 was employed to analyze the soil profile and calculate the stained characteristic parameters. Among these parameters, the stained area ratio was calculated by dividing the area of the stained region by the total area of the selected profile section. The fractal dimension (FD) was determined through box-counting methods using ImageJ software, involving the application of grid squares over stains in order to quantify the complexity of flow [35]. The image processing process is shown in Figure 3. The stained area ratio, fractal dimension, and water flow connectivity index were calculated as follows:
D C = D N D + D × 100 %
In the formula: DC is the stained area ratio; D is the stained area, and ND is the non-stained area.
F D = lim ε 0 log N ( ε ) log 1 ε
I W F C = i = 1 n D C i F D i n
In the formula: FD denotes the fractal dimension; ε is the length of one side of a small cube; N(ε) is the number of small cubes needed to cover the measured fractal object, IWFC is the water flow connectivity index.

2.6. Statistical Analysis

The analysis of nonlinear relationships was conducted using random forests, and the direct and indirect effects were elucidated through structural equation modeling (SEM) [36], this allows for a more comprehensive analysis of the effect of the independent variable on the dependent variable. The statistical analysis comprised three distinct methods: (1) Upon confirming the assumptions of independence, normality (Shapiro–Wilk test) and homogeneity of variances (Levene’s test) were met (all p > 0.05), the data were analyzed by ANOVA followed by Tukey’s post hoc test, with a significance threshold of p < 0.05; (2) A Random Forest Model (RFM) employing 5-fold cross-validation to evaluate the model performance; and (3) Calculation of the Standard Error of the Mean (SEM), with the model fit validated by a Root Mean Square Error of Approximation (RMSEA) of <0.08. RFM and SEMs employed RStudio (R 4.4.3 version, Posit Software, PBC, Boston, MA, USA) with packages: “randomForest”, “semopy”, “ggplot2”, “dplyr”, “vegan”, and “corrplot”.

3. Results

3.1. Soil Infiltration Capacity and Water Flow Connectivity in Different Moso Bamboo Invasion Stages

Bamboo invasion boosted infiltration rates the most in completely invaded forests. The initial infiltration rate in the three stages of invasion was in the range of 94.7–122.1 cm/h, following the order of partially invaded forest > completely invaded forest > uninvaded forest. The stable infiltration rate was in the range of 27.2–36.9 cm/h, following the order of completely invaded forest > partially invaded forest > uninvaded forest. The average infiltration rate was 37.3–49.8 cm/h, following the order of partially invaded forest > completely invaded forest > uninvaded forest (Figure 4a). In contrast with the stable infiltration rate, the initial and average infiltration rates were higher in partially invaded forests than in completely invaded forests. Moso bamboo invasion increased the soil infiltration capacity, and the stable infiltration rate, and average infiltration rate increased by 35.6% in completely invaded forests. The stained area ratio of the three stages of invasion was in the range of 0.68–0.88, following the order of completely invaded forest > partially invaded forest > uninvaded forest. The fractal dimension was in the range of 1.21–1.63, following the order of uninvaded forest > partially invaded forest > completely invaded forest. The water flow connectivity index was in the range of 0.46–0.71, following the order of completely invaded forest > partially invaded forest > uninvaded forest (Figure 4b). Compared with the uninvaded fir forest, the water flow connectivity index (IWFC) increased by 15.7% in the partially invaded forest and by 29.4% in the completely invaded forest.

3.2. Soil Properties and Root Characteristics in Different Moso Bamboo Invasion Stages

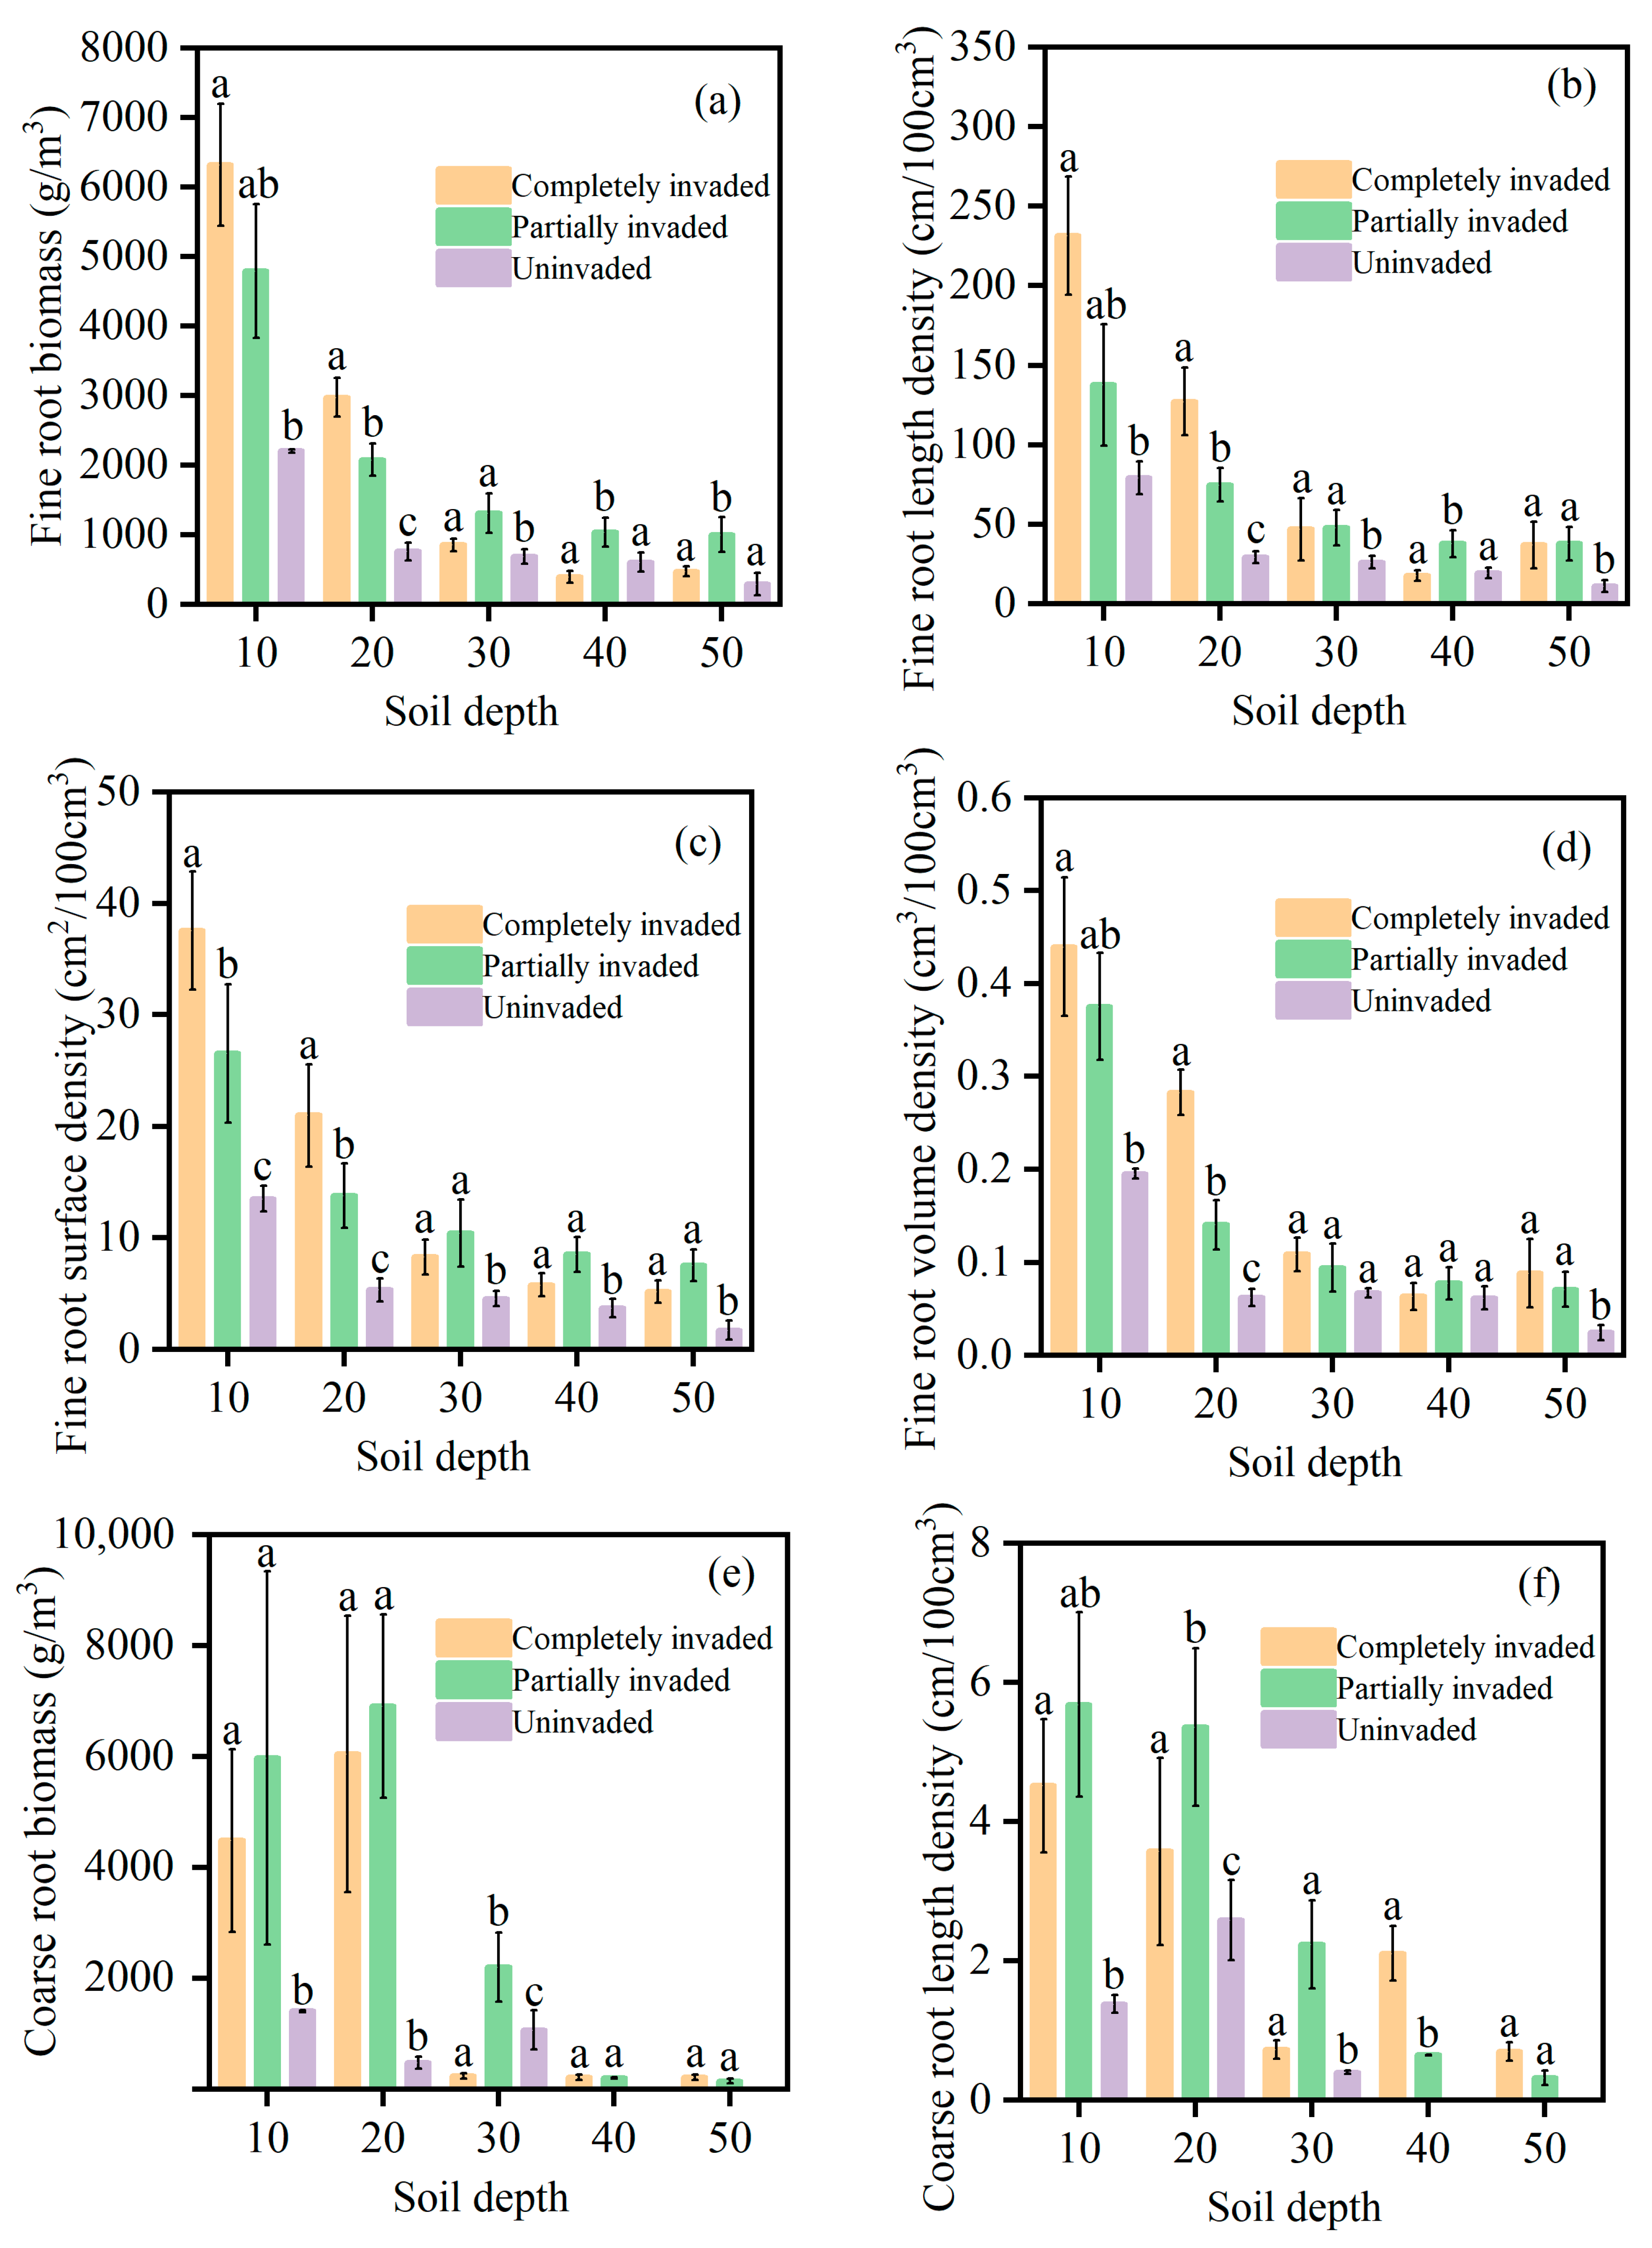
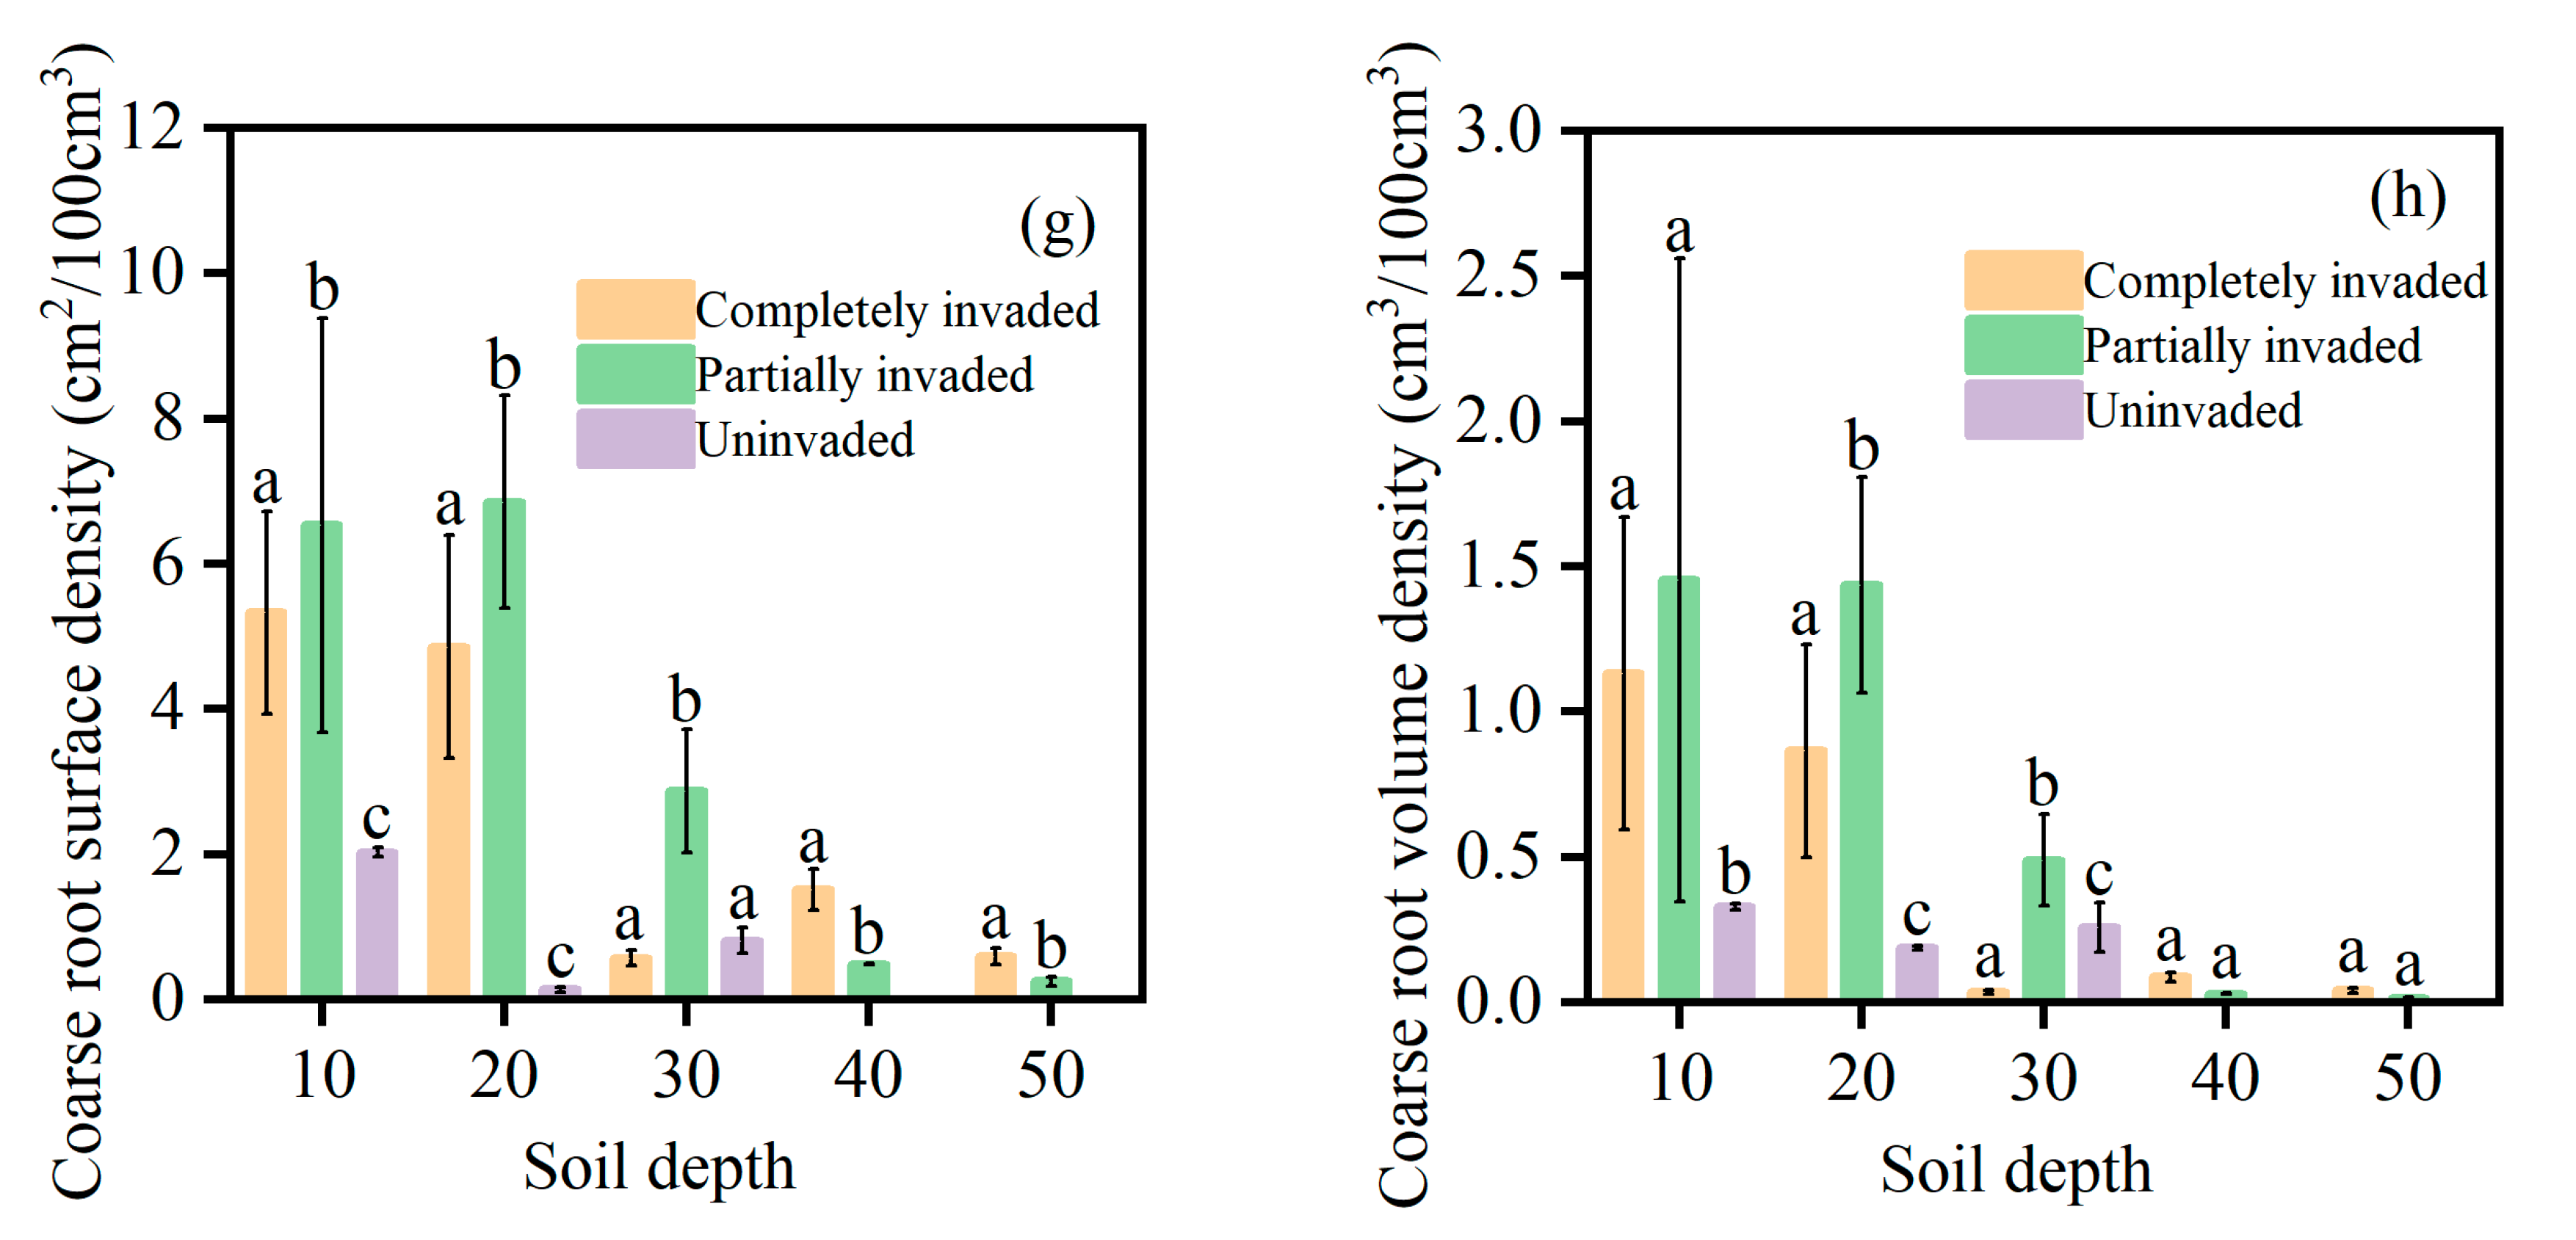
Bamboo invasion boosted fine root the most in completely invaded forests. The soil physicochemical properties under the different invasion stages are shown in Table 3. A positive correlation was observed between soil depth and both silt content and bulk density, whereas pH levels remained stable throughout the soil profile without significant variation. The other soil physical and chemical properties decreased in the deeper soil layers. The Moso bamboo invasion increased the non-capillary porosity and total porosity of the 0–20 cm soil layer, and increased the soil total nitrogen and organic carbon content by 10–30 cm. However, the Moso bamboo invasion reduced the soil bulk density in the 10–40 cm soil layer and the soil clay content in the 20–50 cm layer. Moso bamboo invasion resulted in a significant increase in fine root biomass, RLD, RSAD, and RVD within the 0–30 cm soil layer. In contrast, coarse root characteristics showed no statistically significant variations across the different invasion stages (Figure 5).

3.3. Relationship Between Soil Properties and Root Characteristics

Plant roots significantly changed the physical and chemical properties. The relationship between soil properties and root characteristics are shown in Table 4. RBD1, RLD1, and RSAD1 were significantly correlated with soil bulk density and non-capillary porosity (p < 0.01), in addition to organic carbon, pH, and total nitrogen (p < 0.05). RLD2 was also significantly associated with non-capillary porosity (p < 0.05). No other soil properties showed statistically significant relationships with the remaining root metrics (p > 0.05).

3.4. Factors Influencing Infiltration Capacity and Water Flow Connectivity

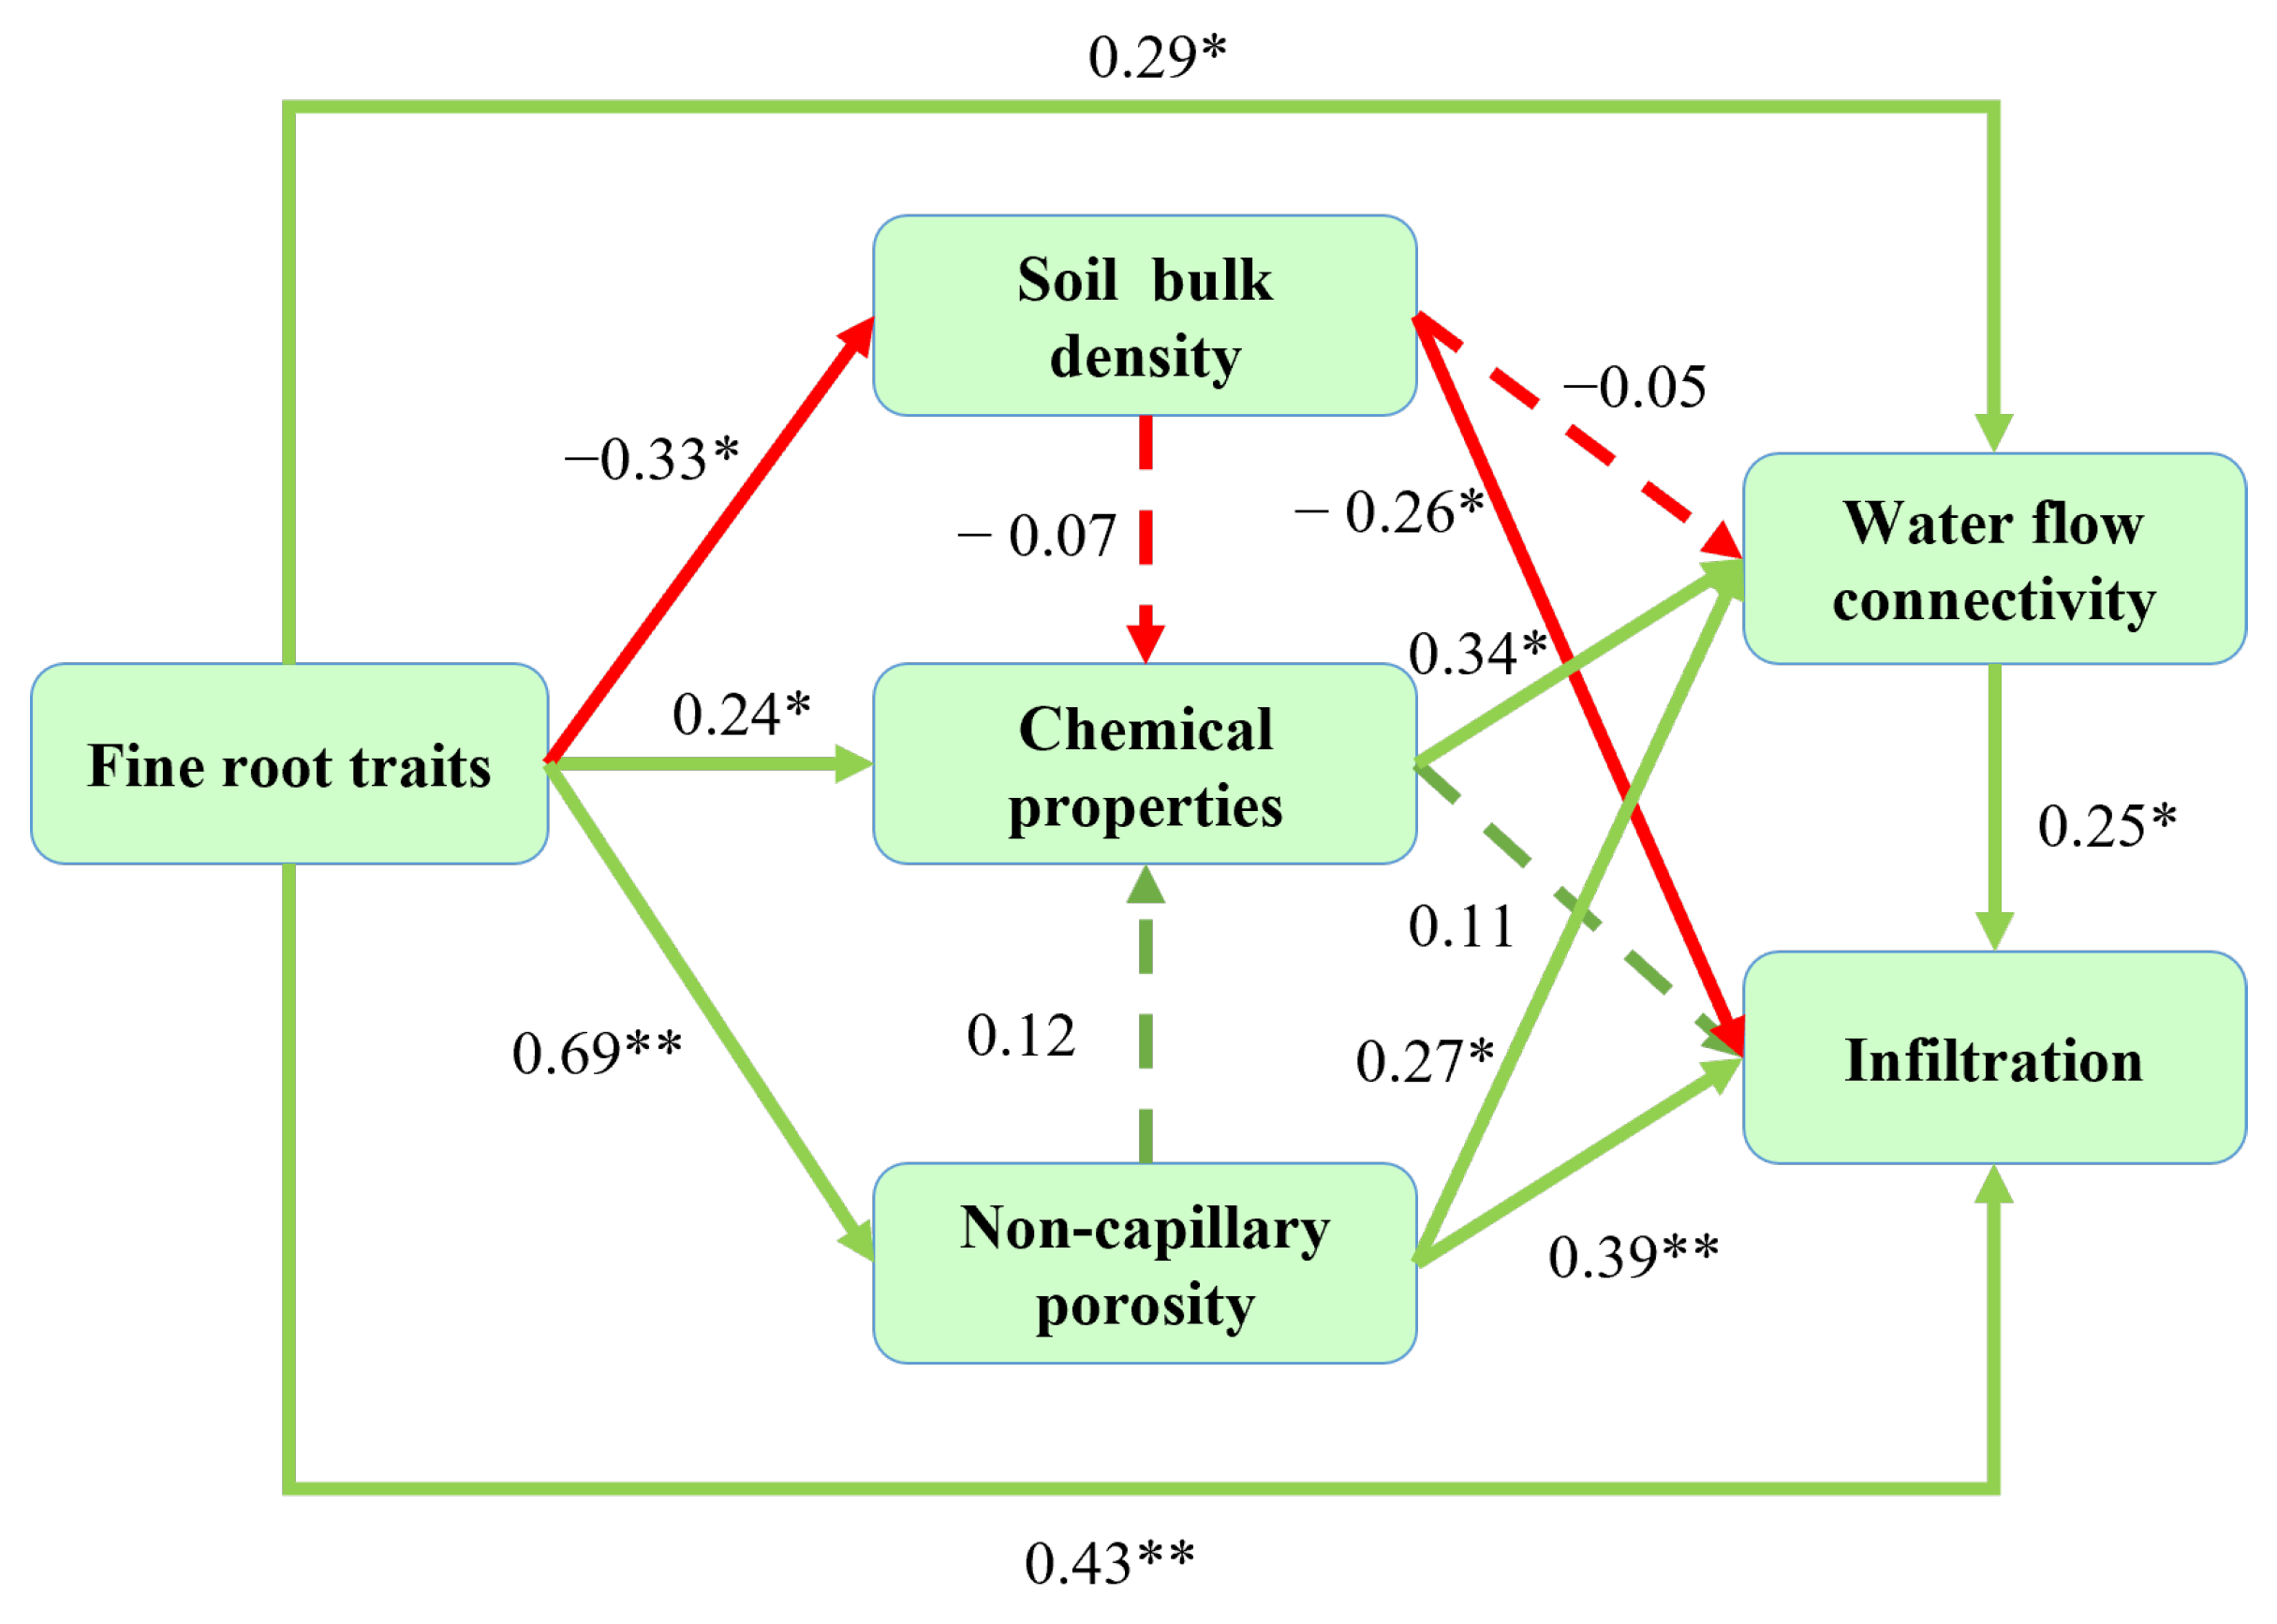
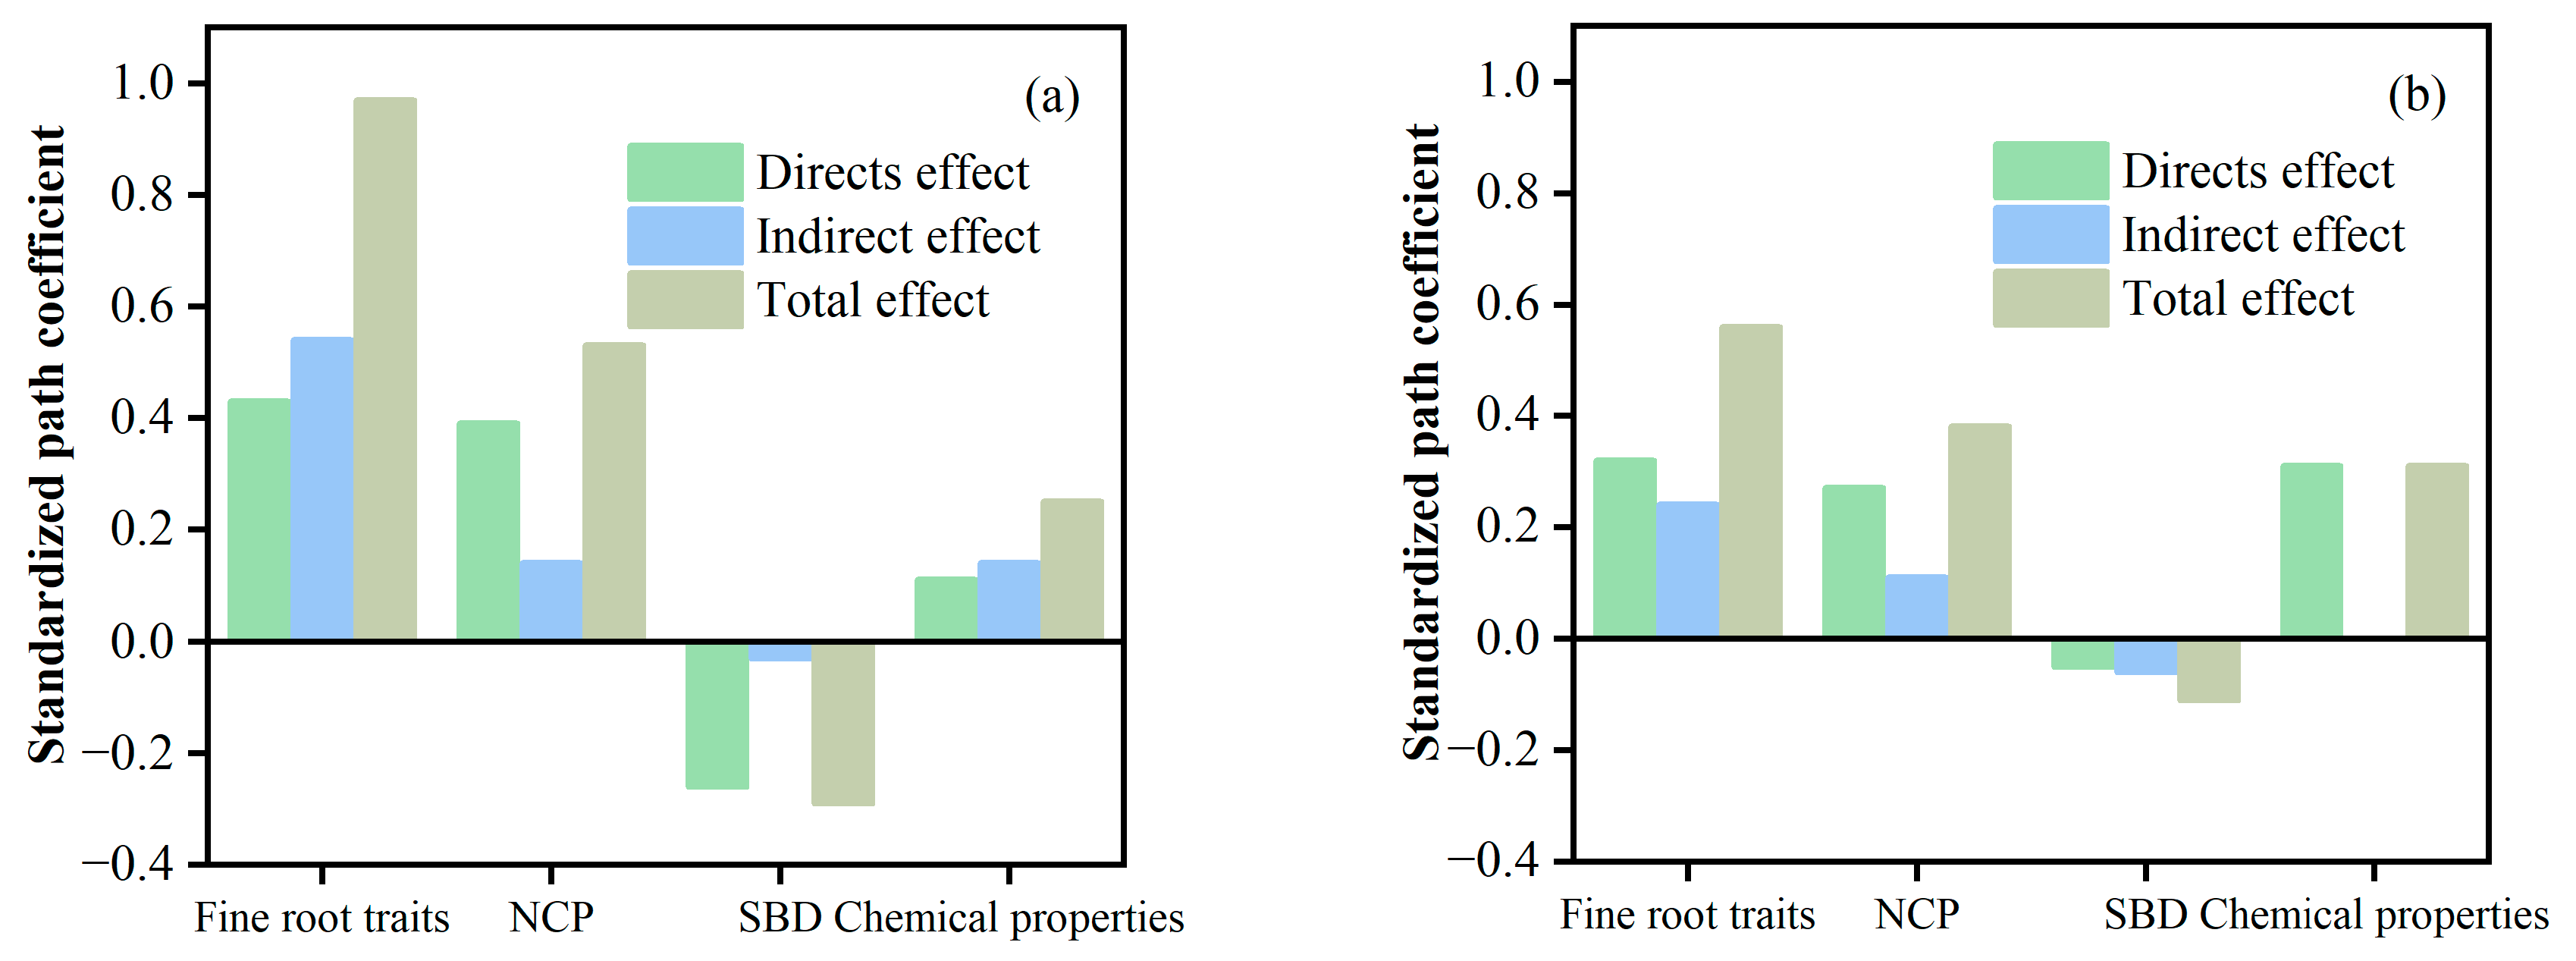
The relative contributions of soil properties and root characteristics to the initial infiltration rate, stable infiltration rate, average infiltration rate, and water flow connectivity are shown in Figure 6a–d. Among root traits, RBD1, RLD1, and RSAD1 were identified as the primary factors influencing IIR, SIR, and AIR. Regarding soil properties, non-capillary porosity and bulk density were identified as the primary factors governing the variability in infiltration parameters. The main root characteristics affecting the water flow connectivity were RBD1 and RLD1, and the main soil properties were soil non-capillary porosity and soil organic matter. As shown in Figure 7, the direct and indirect effects of fine root traits, soil non-capillary porosity, soil bulk density, and soil chemistry on soil infiltration rate and water flow connectivity were clearly illustrated, along with the underlying mechanisms. This mechanism was initiated and propagated by fine root characteristics. Changes in fine root traits exerted significant direct effects, as well as indirect effects through alterations in soil physicochemical properties (e.g., soil bulk density and non-capillary porosity), on soil infiltration rate and water flow connectivity. This result further confirmed that the enhancement of key fine root traits (RBD1, RLD1, RSAD1, RVD1) during Moso bamboo invasion significantly influenced soil infiltration and water flow connectivity, a phenomenon attributable to the species’ distinct root system. In particular, fine root traits had a positive influence on soil infiltration rate, with a direct effect coefficient of 0.43 and an indirect effect coefficient of 0.54 (Figure 8). The coefficients of the direct effects of root characteristics on soil non-capillary porosity, soil bulk density, and soil chemistry were 0.69, −0.33, and 0.24, respectively. The coefficients of the direct and indirect effects of soil chemical properties on soil infiltration were 0.11 and 0.14, respectively. Soil bulk density and non-capillary porosity mainly affected soil infiltration capacity through direct effects, with coefficients of 0.39 and −0.26, respectively. The coefficients of the direct and indirect effects of root characteristics on water flow connectivity were 0.32 and 0.24, respectively. The coefficients of the direct effects of soil chemical properties, soil bulk density, and non-capillary porosity on water flow connectivity were 0.31, 0.27, and −0.05, respectively. Soil water flow connectivity had a promoting effect on soil infiltration capacity, with a coefficient of 0.25.

4. Discussion

4.1. Effects of Moso Bamboo Invasion on Root Characteristics and Soil Properties

Although Moso bamboo invasion predominantly altered root characteristics within the 0–40 cm soil profile, a particularly pronounced increase in root biomass density (RBD1) and root length density (RLD1) was observed in the upper 0–20 cm soil layer, which followed the order of completely invaded forest > partially invaded forest > uninvaded forest. This indicated that the invading process exerted a transformational effect on stand roots. A positive correlation was observed between bamboo abundance and its influence on root biomass and root length density (RLD). This finding aligns with the results reported by Cai et al. [37]. Additionally, our results indicated that Moso bamboo invasion led to an increase in non-capillary porosity and total porosity within the 0–20 cm soil layer, while concurrently reducing soil bulk density in the 10–40 cm depth interval. Song et al. [38] reported a significant reduction in surface soil bulk density resulting from Moso bamboo invasion. They attributed this reduction to the powerful expansion of the bamboo rhizome system, which enhanced soil porosity and connectivity by increasing the proportion of non-capillary pores. For soil nutrients, the Moso bamboo invasion increased the soil organic carbon and total nitrogen content in the 10–20 cm soil layer, following the order of partially invaded forest > completely invaded forest > uninvaded forest. This was mainly because the Moso bamboo invasion increased the root biomass in the 10–20 cm layer. As an important mediator of the plant–soil-microbe interaction, root exudates play an important role in the formation of soil organic carbon and total nitrogen [30]. Additionally, during the expansion of Moso bamboo into the fir forest, the species in the shrub and herb layers continued to expand [39]. This will significantly enhance carbon and nitrogen accumulation in the shallow soil layer, thus leading to increase content of the organic carbon and total nitrogen [40]. Several studies have further indicated that rhizome turnover associated with Moso bamboo invasion contributes to the replenishment of soil organic carbon and nitrogen levels [41]. This may be due to the expansion and penetration of the Moso bamboo rhizome in completely invaded Moso bamboo forests, which lead to the soil particles becoming more dispersed [42].

4.2. Effects of Moso Bamboo Invasion on Soil Infiltration Capacity and Water Flow Connectivity

Numerous studies have established that soil properties and root characteristics are key factors modulating soil infiltration processes [43,44]. The results robustly support the first hypothesis, demonstrating that Moso bamboo invasion enhances soil infiltration capacity, primarily through fine root proliferation. This is particularly evident in a striking 35.6% increase in stable infiltration rates observed in completely invaded forests. This could be attributed to the complex and diverse network of fine roots in Moso bamboo forest, especially their horizontal distribution, which facilitates the formation of large pores and enhances horizontal connectivity within the soil pores, thereby serving as a key factor affecting the lateral water movement in soil [45]. Structural equation models revealed that fine root traits significantly were associated with the soil infiltration rate, particularly the RBD1and RLD1, which positively affected the soil infiltration rate at each stage. Plant roots influence soil infiltration capacity through direct and indirect mechanisms that alter soil pore size distribution and structural connectivity [46]. Root exudates influence soil infiltration variability by modifying aggregate stability, soil organic carbon dynamics, and microbial activity, thereby altering soil hydrological behavior [30]. Soil macropores formed by live and dead roots are key factors affecting soil infiltration capacity [47]. Zhao et al. [34] suggested that lateral preferential flow resulting from the horizontal distribution of fine roots is pivotal for accelerating soil infiltration. Furthermore, soil infiltration capacity is also substantially influenced by factors including soil texture, pore connectivity, and bulk density [48]. In this study, non-capillary pores and soil bulk density emerged as crucial determinants influencing the overall soil infiltration capacity, particularly stable infiltration rates. It was speculated that once infiltrating water reaches stability, non-capillary pores are almost the only path of infiltration [49]. However, we found that partially invaded plots sometimes show higher initial infiltration rates than fully invaded plots, this is mainly because species diversity can increase soil initial infiltration capacity [34,50]. Distinct root morphological and structural traits among invasive plant species contribute to spatial heterogeneity in soil infiltration capacity. Notably, certain invaders may suppress infiltration through specific root–soil interactions [21].
It has been widely confirmed that the dye tracer technique can effectively measure soil water flow connectivity [36,51]. Results of this study indicate that invasion by Moso bamboo significantly promoted the development of soil hydrological connectivity, which followed the order of completely invaded forest > partially invaded forest > uninvaded forest. Existing literature suggests that the spatial heterogeneity of soil hydrological connectivity is governed by variations in root architecture and soil properties [35,52]. The root characteristics of Moso bamboo diverges from the typical taproot systems of trees, a distinction rooted in its unique growth strategy and unique “rhizome-root system”. This system is characterized by extensively spreading underground rhizomes, producing a high number of fine roots. Unlike most plants, which develop their root systems and aboveground parts synchronously, Moso bamboo prioritizes the construction of an extensive, interwoven rhizome network during early growth, with delayed shoot development. This strategy results in substantial root biomass, particularly in horizontally distributed fine roots, which facilitates macropore formation and enhances the horizontal connectivity of the soil pore network [34,45]. Consequently, this root architecture emerges as a critical factor governing soil water flow connectivity. The second hypothesis—suggesting that soil organic carbon (SOC) is the dominant driver of water flow connectivity—received mixed support. Interestingly, non-capillary porosity (NCP) emerged as a stronger predicter of this connectivity. This finding aligns with Zhang et al. [27], who identified macropores as critical conduits for preferential flow in subtropical soils. Compared with coarse roots, fine roots exerted a greater influence on soil water flow connectivity, especially the RBD1and RLD1, which had extremely significant positive effects on water flow connectivity. This was mainly because during the invasion of Moso bamboo into the Chinese fir forest, RBD1and RLD1 were significantly increased. And root exudates, particularly polysaccharides, likely amplify SOC accumulation, in turn, fosters aggregate stability and pore connectivity [30]. In conclusion, invasion by Moso bamboo mainly enhanced soil infiltration and water flow connectivity by influencing root system characteristics such as RBD1and RLD1, increasing soil non-capillary porosity and soil organic carbon.

4.3. Limitations and Implications of the Study

Plant invasion and soil infiltration are dynamic and complex process, while this study elucidates interesting soil infiltration patterns in subtropical forests, future research should aim to test these mechanisms across a variety of soil types (like clay and loam) and investigate longer invasion chrono sequences to really assess the temporal dynamics involved. In addition, future studies could combine stain tracing, CT scanning, and stable isotope techniques to better investigate the mechanisms of soil infiltration and water flow connectivity. These findings extend the ‘root economics spectrum’ framework to invasive species, highlighting how fine root traits can be key mediators of ecohydrological function. For land managers out there, selectively retaining bamboo in erosion-prone areas could be a smart strategy to leverage its infiltration benefits while also mitigating risks to native biodiversity.

5. Conclusions

This study examined alterations in soil properties, root morphological characteristics, soil infiltration capacity, and hydrological connectivity across different stages of Moso bamboo invasion. Furthermore, the underlying mechanisms driving changes in infiltration dynamics and water flow pathways were investigated. Results indicated that Moso bamboo invasion significantly enhanced soil infiltration performance. The IIR, SIR, and AIR were 31.5%, 26.1%, and 28.5% higher in the partially invaded forest, respectively, and 6.6%, 35.6%, and 28.5% higher in the completely invaded forest. The soil water flow connectivity followed the order of completely invaded forest > partially invaded forest > uninvaded forest. Compared to the uninvaded forest, the IWFC increased by 29.4% in the completely invaded forest and by 15.6% in the partially invaded forest. Moso bamboo invasion increased the fine root characteristics, non-capillary porosity and soil organic carbon, and decreased the soil bulk density content. RBD1, RLD1, non-capillary porosity, and soil bulk density were the main factors affecting the soil infiltration rate. RBD1, RLD1, and SOC were identified as the predominant factors regulating soil hydrological connectivity. Fine root traits directly affected soil infiltration rate and water flow connectivity, and also exerted indirect influence on infiltration rate via its effects on water flow connectivity, which was itself altered by changes in soil non-capillary porosity, bulk density, and chemical properties. Beyond forests, these results could tweak flood models in bamboo-heavy regions. This adds fuel to the argument that invasion impacts hinge on root strategies, not just plant growth rates.

Author Contributions

Conceptualization, T.Z. and L.Z.; methodology, T.Z.; validation, T.Z., L.Z. and S.Q.; formal analysis, T.Z. and L.Z.; investigation, T.Z. and L.Z.; resources, S.Q.; data curation, L.Z.; writing—original draft preparation, T.Z.; writing—review and editing, L.Z. and S.Q.; visualization, T.Z.; funding acquisition, S.Q. All authors have read and agreed to the published version of the manuscript.

Funding

This research was funded by the National Natural Science Foundation of China, grant number [No. 32271964].

Data Availability Statement

The original contributions presented in this study are included in the article. Further inquiries can be directed to the corresponding author.

Acknowledgments

The authors are thankful to water Conservancy Bureau of Anji County, Huzhou City, Zhejiang Province for providing forestry engineering design data.

Conflicts of Interest

The authors declare no conflicts of interest.

References

  1. Landhausser, S.M.; Deshaies, D.; Lieffers, V.J. Disturbance facilitates rapid range expansion of aspen into higher elevations of the Rocky Mountains under a warming climate. J. Biogeogr. 2010, 37, 68–76. [Google Scholar] [CrossRef]
  2. Davies, K.W. Exotic plants increase and native plants decrease with loss of foundation species in sagebrush steppe. Oecologia 2011, 167, 481–491. [Google Scholar] [CrossRef]
  3. Cleland, E.; Larios, L.; Suding, K. Strengthening invasion filters to reassemble native plant communities: Soil resources and phenological overlap. Restor. Ecol. 2013, 21, 390–398. [Google Scholar] [CrossRef]
  4. Liu, J.; Yang, Q.; Song, Q.; Yu, D.; Yang, G.; Qi, H.; Shi, J. Strategy of fine root expansion of Phyllostachys pubescens population into evergreen broad- leaved forest. Chin. J. Plant Ecol. 2013, 37, 230–238. [Google Scholar] [CrossRef]
  5. Li, Y.; Feng, P. Bamboo resources in China based on the ninth National Forest Inventory Data. World Bamboo Rattan. 2019, 17, 45–48. [Google Scholar]
  6. Suzuki, S.; Nakagoshi, N. Expansion of bamboo forests caused by reduced bamboo-shoot harvest under different natural and artificial conditions. Ecol. Res. 2008, 23, 641–647. [Google Scholar] [CrossRef]
  7. Fang, H.; Liu, Y.; Bai, J.; Li, A.; Deng, W.; Bai, T.; Liu, X.; Lai, M.; Feng, Y.; Zhang, J.; et al. Impact of Moso bamboo (Phyllostachys edulis) expansion into Japanese cedar plantations on soil fungal and bacterial community compositions. Forests 2022, 13, 1190. [Google Scholar] [CrossRef]
  8. Liu, Y.; Zhang, Z.; Liu, Y.; Cui, Z.; Leite, P.; Shi, J.; Wu, G. Shrub encroachment enhances the infiltration capacity of alpine meadows by changing the community composition and soil conditions. Catena 2022, 213, 106222. [Google Scholar] [CrossRef]
  9. Beven, K. A Century of Denial: Preferential and Nonequilibrium Water Flow in Soils, 1864–1984. Vadose Zone J. 2018, 17, 180153. [Google Scholar] [CrossRef]
  10. Qiu, D.X.; Xu, R.; Gao, P. Effect of vegetation restoration type and topography on soil water storage and infiltration capacity in the Loess Plateau, China. Catena 2024, 241, 108079. [Google Scholar] [CrossRef]
  11. Wang, D.; Chen, J.; Tang, Z. Effects of Soil Physical Properties on Soil Infiltration in Forest Ecosystems of Southeast China. Forests 2024, 15, 1470. [Google Scholar] [CrossRef]
  12. Gan, F.; Shi, H.; Gou, J.; Zhang, L.; Liu, C. Effects of bedrock strata dip on soil infiltration capacity under different land use types in a karst trough valley of Southwest China. Catena 2023, 230, 107253. [Google Scholar] [CrossRef]
  13. Cai, L.; Wang, F.; Lin, Y.; Qi, L.Q.; Zhao, Y.; Han, J.; Chen, H. Changes in preferential flow caused by root effects in black locust plantations of different stand ages in the semi-arid region of the Loess Plateau. J. Hydrol. 2024, 634, 131086. [Google Scholar] [CrossRef]
  14. Wang, D.; Niu, J.; Dai, Z.; Yang, T.; Miao, Y.; Zhang, L.; Chen, X.; Ronny, B. Forest restoration effects on soil preferential flow in the paleo-periglacial eastern Liaoning mountainous regions, China. J. Clean. Prod. 2024, 467, 142974. [Google Scholar] [CrossRef]
  15. Basset, C.; Abou, N.M.; Ghezzehei, T.; Hao, X.X.; Daccache, A. How does soil structure affect water infiltration? A meta-data systematic review. Soil. Tillage Res. 2023, 226, 105577. [Google Scholar] [CrossRef]
  16. Wang, P.; Liu, Q.; Zhou, Z.; Liu, J.; Cao, L.; Wang, N.; Cao, Y. Distinct variations of soil infiltrability of contrasting root types in a temperate mosaic-pattern grassland in northern China. Catena 2024, 243, 108174. [Google Scholar] [CrossRef]
  17. Cui, Z.; Huang, Z.; Liu, Y.; López, V.M.; Wu, G. Natural compensation mechanism of soil water infiltration through decayed roots in semi-arid vegetation species. Sci. Total Environ. 2021, 819, 151985. [Google Scholar] [CrossRef] [PubMed]
  18. Dai, Y.; Guo, J.; Li, Y.; Dong, Z.; Li, H. Soil physical and chemical properties affected by long-term grazing on the desert steppe of Inner Mongolia, China. Catena 2022, 211, 105996. [Google Scholar] [CrossRef]
  19. Yang, L.; Dong, L.; Li, A.; Lv, W.; Wu, J.; Zhang, H.; Deng, L. Soil physicochemical properties and crusts regulate the soil infiltration capacity after land-use conversions from farmlands in semiarid areas. J. Hydrol. 2023, 626, 130283. [Google Scholar] [CrossRef]
  20. Hou, F.; Cheng, J.; Zhang, H.; Wang, X.; Shi, D.; Guan, N. Response of preferential flow to soil−root−rock fragment system in karst rocky desertification areas. Ecol. Indic. 2024, 165, 112234. [Google Scholar] [CrossRef]
  21. Zhu, P.; Zhang, G.; Wang, H.; Xing, S. Soil infiltration properties affected by typical plant communities on steep gully slopes on the Loess Plateau of China. J. Hydrol. 2020, 590, 125535. [Google Scholar] [CrossRef]
  22. Lukáš, J.; Alena, W.; Martin, K. Effects of different tree species on infiltration and preferential flow in soils developing at a clayey spoil heap. Geoderma 2021, 403, 115372. [Google Scholar] [CrossRef]
  23. Zhang, W.; Zhu, X.; Xiong, X.; Wu, T.; Zhou, S.; Lie, Z.; Liu, J. Changes in soil infiltration and water flow paths: Insights from subtropical forest succession sequence. Catena 2023, 221, 106748. [Google Scholar] [CrossRef]
  24. Tian, X.; Wu, W.; Zeng, S.; Li, Y.; Jiang, Y. Differences in soil water movement between the dip and anti-dip slopes of a karst trough valley. J. Hydrol. 2024, 636, 131246. [Google Scholar] [CrossRef]
  25. Guan, N.; Cheng, J.; Bi, H. Laboratory and field characterization of preferential flow under consideration of geometric fracture features in a karst region in southwest China. J. Hydrol. 2024, 631, 130851. [Google Scholar] [CrossRef]
  26. Germann, P.F. Viscosity—The weak link between Darcy’s law and Richards’ capillary flow. Hydrol. Processes 2018, 32, 1166–1172. [Google Scholar] [CrossRef]
  27. Zhang, J.; Sun, Q.; Wen, N.; Horton, R.; Liu, G. Quantifying preferential flows on two farmlands in the North China plain using dual infiltration and dye tracer methods. Geoderma 2022, 428, 116205. [Google Scholar] [CrossRef]
  28. Zhang, W.; Wang, L.; Tang, Z.; Zhang, Y. Effects of the Root System Architecture of Pinus taeda and Phyllostachys edulis on the Index of Hydrological Connectivity in Subtropical Forest Ecosystems. Forests 2022, 13, 2008. [Google Scholar] [CrossRef]
  29. Qiu, D.; Xu, R.; Wu, C.; Mu, X.; Zhao, G.; Gao, P. Effects of vegetation restoration on soil infiltrability and preferential flow in hilly gully areas of the Loess Plateau, China. Catena 2023, 211, 106770. [Google Scholar] [CrossRef]
  30. Tang, Z.; Zhang, W.; Chen, J.; Wang, L.; Zhang, Y. Contributions of soil organic carbon-induced root- and soil properties complexity to water flow in eastern China. Sci. Total Environ. 2024, 945, 174125. [Google Scholar] [CrossRef]
  31. Liu, X.; Siemann, E.; Cui, C.; Liu, Y.; Guo, X.; Zhang, L. Moso bamboo (Phyllostachys edulis) invasion effects on litter, soil and microbial PLFA characteristics depend on sites and invaded forests. Plant Soil. 2019, 439, 85–99. [Google Scholar] [CrossRef]
  32. Fukushima, K.; Usui, N.; Ogawa, R.; Tokuchi, N. Impacts of Moso bamboo (Phyllostachys pubescens) invasion on dry matter and carbon and nitrogen stocks in a broad-leaved secondary forest located in Kyoto, western Japan: Bamboo invasion impacts C and N stocks. Plant Spec. Biol. 2015, 30, 81–95. [Google Scholar] [CrossRef]
  33. Li, Y.; Li, Y.; Chang, S.; Xu, Q.; Guo, Z.; Gao, Q.; Qin, Z.; Yang, Y.; Chen, J.; Liang, X. Bamboo invasion of broadleaf forests altered soil fungal community closely linked to changes in soil organic C chemical composition and mineral N production. Plant Soil. 2017, 418, 507–521. [Google Scholar] [CrossRef]
  34. Zhao, M.; Huang, Y.; Lei, T.; Deng, Y.; Yang, G.; Ban, Y.; Huang, Y. Changes of preferential flow in short-rotation eucalyptus plantations: Field experiments and modeling. J. Hydrol. 2023, 622, 129663. [Google Scholar] [CrossRef]
  35. Zhang, Y.; Chen, J.; Zhang, J.; Zhang, Z.; Zhang, M. Novel indicator for assessing wetland degradation based on the index of hydrological connectivity and its correlation with the root-soil interface. Ecol. Indic. 2021, 133, 108392. [Google Scholar] [CrossRef]
  36. Zhang, Y.; Tang, Z.; Zhang, J.; Zhang, Z.; Zhang, M. Visualizing preferential flow paths using dye tracer and species diversity theory methods to explore their correlation to soil properties with random forest algorithm. J. Hydrol. 2024, 368, 131570. [Google Scholar] [CrossRef]
  37. Cai, C.; Fan, S.; Liu, X. Fine root adaptation strategies during the expansion of Moso bamboo to Chinese fir forest. Chin. J. Ecol. 2019, 38, 967–972. [Google Scholar]
  38. Song, Q.; Yang, Q.; Liu, J. Effects of bamboo expansion on soil nitrogen mineralization and availability in evergreen broad-leaved forest. hin. J. Appl. Ecol. 2013, 24, 338–344. [Google Scholar]
  39. Xu, D.; Liu, J.; He, Z. Community species diversity characteristics of Phyllostachys heterocycla after expansion into Cunninghamia lanceolata forest. J. For. Environ. 2019, 39, 7–41. [Google Scholar]
  40. Wu, J.; Jiang, P.; Wang, Z. Effects of bamboo expansion on soil fertility in Tianmu Mountain National Nature Reserve. Acta Agric. Univ. Jiangxi. 2008, 4, 4689–4692. [Google Scholar]
  41. Xie, Y.; Guo, Z.; Lin, S. Soil particle composition and water infiltration characteristics during the succession of understory vegetation in Moso bamboo forest. J. Nanjing For. Univ. 2024, 48, 108–116. (In Chinese) [Google Scholar]
  42. Wilcox, P.; Caldeira, C.; Leite, A. Understory shrubs improve soil infiltrability in overgrazed Mediterranean oak woodlands, but have little impact on ungrazed woodlands. For. Ecol. Manag. 2024, 26, 122186. [Google Scholar] [CrossRef]
  43. Lu, S.; Liu, M.; Yi, J. Lateral partition patterns and controlling factors of soil infiltration at a steep, near-stream, and humid hillslope scale. Catena 2024, 239, 107917. [Google Scholar] [CrossRef]
  44. Peng, J.; Wu, Y.; Geng, T. Soil pore dynamics and infiltration characteristics as affected by cultivation duration for Mollisol in northeast China. Geoderma 2024, 449, 117021. [Google Scholar] [CrossRef]
  45. Huang, Y.; Xiong, T.; Zhao, M.; Deng, Y.; Yang, G.; Ban, Y.; Huang, Y. Influence of soil properties and near-surface roots on soil infiltration process in short-rotation eucalyptus plantations in southern subtropical China. Catena 2024, 234, 107606. [Google Scholar] [CrossRef]
  46. Shi, X.; Qin, T.; Yan, D.; Tian, F.; Wang, H. A meta-analysis on effects of root development on soil hydraulic properties. Geoderma 2021, 403, 115363. [Google Scholar] [CrossRef]
  47. Wang, D.; Niu, J.; Tao, Y. Soil water infiltration characteristics of reforested areas in the paleo-periglacial eastern Liaoning mountainous regions, China. Catena 2024, 234, 107613. [Google Scholar] [CrossRef]
  48. Wei, H.; Yang, Y.; Wang, J.; Meng, Q.; Deng, Y. A comparison of preferential flow characteristics and influencing factors between two soils developed in the karst region of Southwest China. Soil. Tillage Res. 2024, 241, 106132. [Google Scholar] [CrossRef]
  49. Robinson, D.A.; Nemes, A.; Reinsch, S.; Radbourne, A.; Bentley, L.; Keith, A.M. Global meta-analysis of soil hydraulic properties on the same soils with differing land use. Sci. Total Environ. 2022, 852, 158506. [Google Scholar] [CrossRef]
  50. Su, L.; Yang, Y.; Li, X.; Wang, D.; Liu, Y.; Liu, Y.; Li, M. Increasing plant diversity and forb ratio during the revegetation processes of trampled areas and trails enhances soil infiltration. Land. Degrad. Dev. 2018, 29, 4025–4034. [Google Scholar] [CrossRef]
  51. Dai, L.; Zhang, Y.; Liu, Y.; Xie, L.; Zhao, S.; Zhang, Z.; Lv, X. Assessing hydrological connectivity of wetlands by dye-tracing experiment. Ecol. Indic. 2020, 119, 106840. [Google Scholar] [CrossRef]
  52. Tang, Z.; Zhang, W.; Chen, J.; Zhang, Y. Soil quality assessment and its response to water flow connectivity in different vegetation restoration types, eastern China. Catena 2024, 247, 108477. [Google Scholar] [CrossRef]
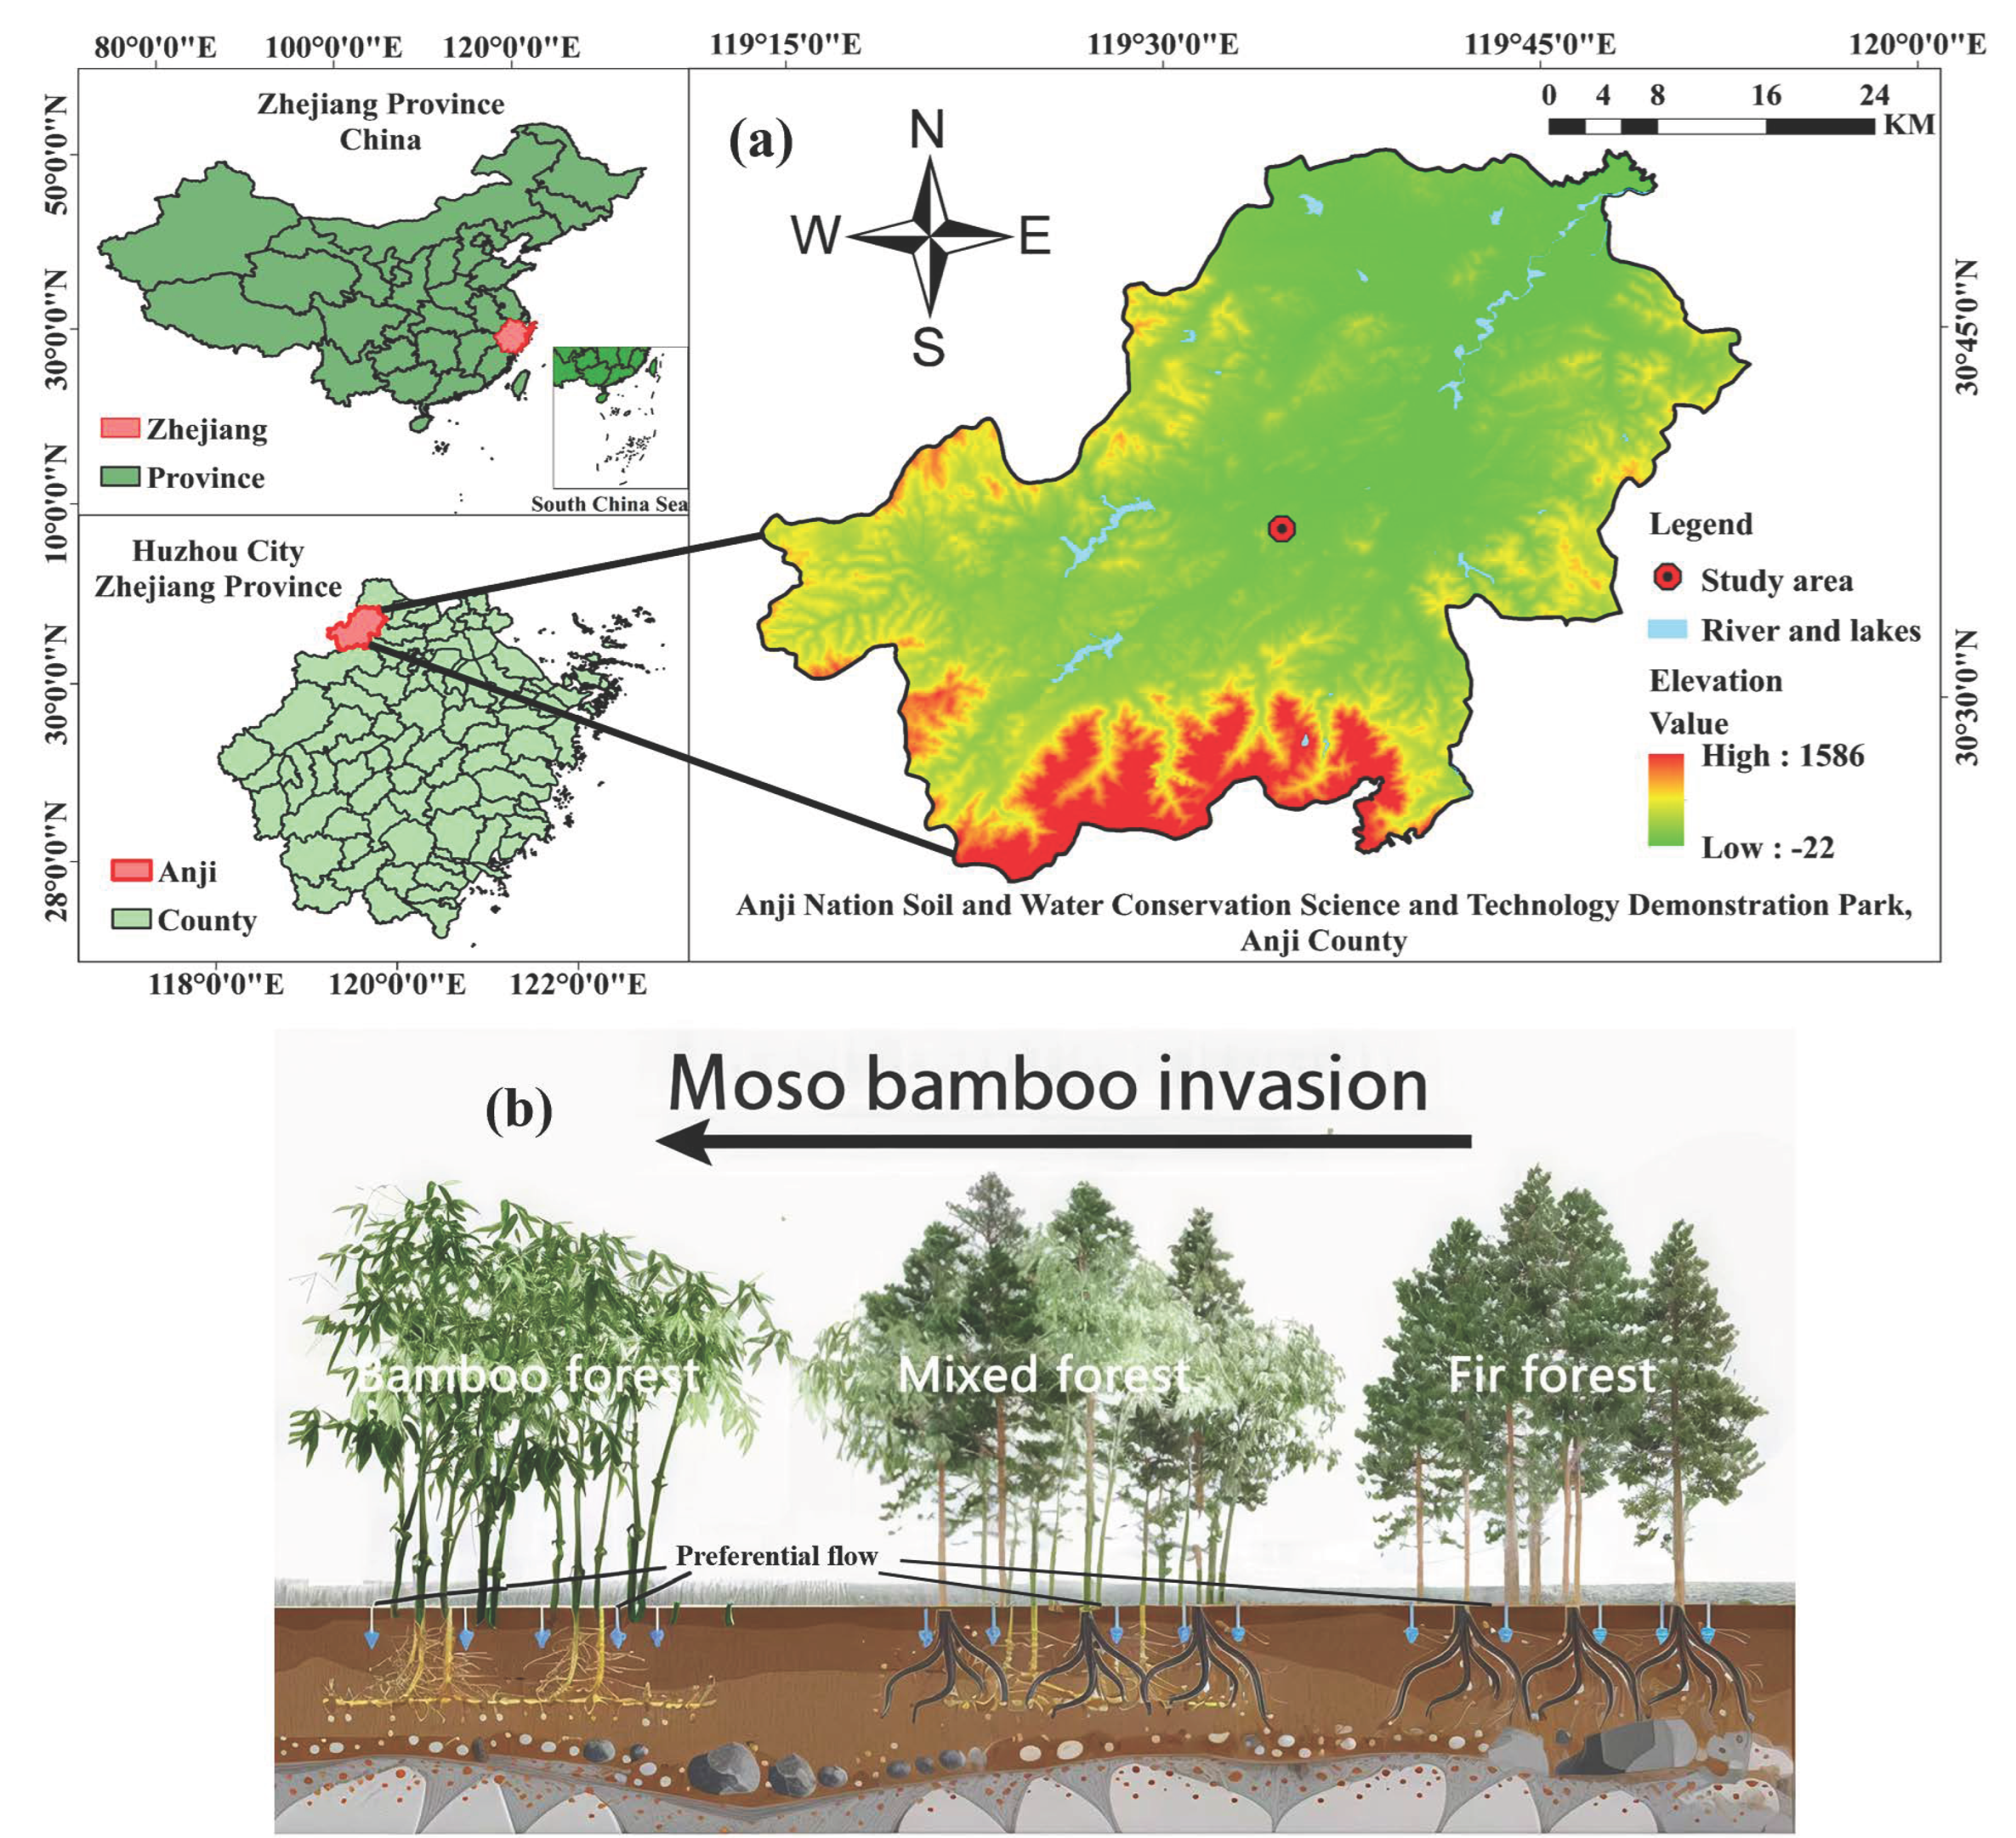
Figure 1. Location map of the study area (a) and the invasion process of Moso bamboo (b).
Forests 16 01589 g001
Figure 2. Diagram of soil infiltration measurement process. (a) schematic diagram of the experimental setup, (b) On-site photographs.
Forests 16 01589 g002
Figure 3. Dyed image processing steps and parameter extraction. (A) Original image. (B) Converted black–white binary image for preferential flow parameter extraction.
Forests 16 01589 g003
Figure 4. Soil infiltration rate (a) and water flow connectivity (b) in different Moso bamboo invasion stages. Notes: IIR means initial infiltration rate, SIR means stable infiltration rate, AIR means average infiltration rate, IWFC means water flow connectivity index. Statistically significant differences across invasion stages at the 0.05 level are indicated by different lowercase letters.
Forests 16 01589 g004
Figure 5. Fine root and coarse root characteristics. Notes: Different lowercase letters indicate differences in different invasion stages at the 0.05 level. (a) fine root biomass; (b) fine root length density; (c) fine root surface density; (d) fine root volume density; (e) coarse root biomass; (f) coarse root length density; (g) coarse root surface density; (h) coarse root volume density.
Forests 16 01589 g005aForests 16 01589 g005b
Figure 6. Random Forest analysis of relative contribution of root characteristics and soil properties on initial infiltration rate (a), stable infiltration rate (b), average infiltration rate (c) and water flow connectivity (d). *** means p < 0.001, ** means p < 0.01, * means p < 0.05. Notes: RBD1 means fine root (<2 mm) biomass, RLD1 means fine root length density, RSAD1 means fine root surface area density, RVD1 means fine root volume density, RBD2 means coarse root (>2 mm) biomass, RLD2 means coarse root length density, RSAD2 means coarse root surface area density, RVD2 means coarse root volume density.
Forests 16 01589 g006
Figure 7. Interaction between soil properties and fine root characteristics in regulating water flow connectivity and soil infiltration processes. These coefficients derived from the structural equation modeling, represent the direct effects between the factors. Solid arrows denote a significant influence of the former on the latter, while dashed arrows indicate no significant influence. Green indicates a positive influence coefficient, while red denotes a negative one. ** means p < 0.01, * means p < 0.05.
Forests 16 01589 g007
Figure 8. Standardized effects of these factors on soil infiltration (a) and water flow connectivity (b).
Forests 16 01589 g008
Table 1. Basic information of the plot at three invasion stages.
Invasion StagesMain VegetationElevation (m)SlopeStand Density
(plants/hm2)
Canopy Density
(%)
UninvadedCunninghamia lanceolata738187573
Partial invadedCunninghamia lanceolata749135071
Phyllostachys edulis
Completely invadedPhyllostachys edulis748105065
Table 2. List of Abbreviations.
AbbreviationMeaningAbbreviationMeaning
RBD1Fine root biomassRBD2Coarse root biomass
RLD1Fine root length densityRLD2Coarse root length density
RSAD1Fine root surface area densityRSAD2Coarse root surface area density
RVD1Fine root volume densityRVD2Coarse root volume density
SBDSoil bulk densityTPTotal porosity
CPCapillary poresNCPNon-capillary pores
SOCSoil organic carbonTNTotal nitrogen
Notes: fine roots (diameter ≤ 2 mm), coarse roots (diameter > 2 mm).
Table 3. Soil physical and chemical properties.
Soil Depth
(cm)
Invasion StagesSBDTPCPNCPSOCpHTNSandSiltClay
0–10Completely invaded1.11 ± 0.08 a49.11 ± 3.47 a38.64 ± 2.25 a10.47 ± 2.02 a29.02 ± 4.05 a4.91 ± 0.37 a2.46 ± 0.28 a69 ± 4.21 a19.94 ± 2.8 a11.07 ± 1.85 ab
Partially invaded1.19 ± 0.03 a42.82 ± 4.71 b21.32 ± 14.25 b8.72 ± 0.99 ab22.54 ± 2.03 a4.44 ± 0.46 ab1.71 ± 0.31 a65.03 ± 6.43 a21.29 ± 6.18 a13.69 ± 2.86 a
Uninvaded1.2 ± 0.05 a48.12 ± 3.26 ab40.78 ± 4.05 a7.34 ± 0.83 b28.22 ± 15.21 a4.28 ± 0.1 b1.64 ± 0.78 a69.66 ± 2.69 a20.47 ± 2.82 a9.88 ± 0.83 b
10–20Completely invaded1.28 ± 0.06 b42.43 ± 2.15 a35 ± 1.25 a7.43 ± 1.03 a17.7 ± 3.4 a4.78 ± 0.1 a1.32 ± 0.32 a62.81 ± 11.5 a23.31 ± 11.8 a13.88 ± 2.08 a
Partially invaded1.41 ± 0.06 b44.04 ± 5.54 a37.66 ± 5.63 b6.38 ± 0.09 b13.77 ± 3.35 a4.75 ± 0.18 a0.91 ± 0.21 a64.73 ± 2.55 a23.34 ± 2.15 b11.92 ± 3.54 b
Uninvaded1.46 ± 0.02 a44.79 ± 2.09 a38.89 ± 2.03 a5.9 ± 0.06 c12.79 ± 0.6 b4.96 ± 0.23 a0.84 ± 0.04 b62.57 ± 3 b26.41 ± 4.64 ab11.03 ± 2.04 b
20–30Completely invaded1.27 ± 0.01 b39.89 ± 4.1 a31.87 ± 2.97 a5.82 ± 1.87 a11.19 ± 1.32 a5.17 ± 0.27 a0.9 ± 0.25 a56.91 ± 8.27 a31.52 ± 6.78 a11.57 ± 3.44 a
Partially invaded1.33 ± 0.02 b39.63 ± 2.84 a27.95 ± 11.2 b7.27 ± 0.8 b11.08 ± 1.76 a5.2 ± 0.18 b0.77 ± 0.19 b60.81 ± 6.69 b26.25 ± 8.54 b12.94 ± 2.12 b
Uninvaded1.47 ± 0.1 a44.19 ± 3.27 a37.52 ± 3.3 ab6.66 ± 0.11 b8.42 ± 4.51 a5.2 ± 0.1 b0.62 ± 0.21 b59.62 ± 5.02 b26.47 ± 5.42 b13.92 ± 0.83 b
30–40Completely invaded1.37 ± 0.03 a42.14 ± 3.29 a37.59 ± 3.36 a4.56 ± 0.7 a7.35 ± 1.55 a5.43 ± 0.34 a0.53 ± 0.09 a40.89 ± 7.81 a49.3 ± 3.52 a9.81 ± 4.83 a
Partially invaded1.39 ± 0.02 b36.46 ± 2.71 a31.03 ± 2.42 ab5.43 ± 0.43 b6.68 ± 1.12 b5.24 ± 0.3 a0.48 ± 0.07 a44.05 ± 10.68 ab40.37 ± 10.56 b15.58 ± 1.2 b
Uninvaded1.45 ± 0.01 a39.69 ± 2.92 b34.43 ± 2.83 b5.26 ± 0.48 c7.65 ± 0.74 ab5.49 ± 0.18 a0.57 ± 0.07 a50.09 ± 1.06 b38.04 ± 2 b11.87 ± 2.1 b
40–50Completely invaded1.33 ± 0.06 a40.4 ± 1.32 a34.53 ± 0.93 a5.86 ± 0.45 a4.4 ± 1.01 a5.06 ± 0.06 a0.28 ± 0.06 a19.22 ± 5.5 a68.64 ± 5.26 a12.14 ± 0.88 a
Partially invaded1.47 ± 0.07 b38.7 ± 2.01 a33.05 ± 1.74 b5.66 ± 1.08 b6.39 ± 1.53 b5.26 ± 0.06 a0.46 ± 0.07 b16.37 ± 1.02 b68.57 ± 1.47 b15.05 ± 0.55 b
Uninvaded1.47 ± 0.01 a38.29 ± 0.88 a32.54 ± 0.99 b5.74 ± 0.53 b8.52 ± 1.61 a5.38 ± 0.1 b0.59 ± 0.06 a13.02 ± 4.31 b70.91 ± 3.29 b16.08 ± 1.11 b
Notes: SBD means soil bulk density, TP means total porosity, CP means capillary pores, NCP means non-capillary pores, SOC means soil organic carbon, TN means total nitrogen. Different lowercase letters indicate differences in different invasion stages at the 0.05 level.
Table 4. Correlation relationships between soil physicochemical properties and root system characteristics.
Root IndexSoil Physical IndexSoil Chemical IndexSoil Texture
WSBDTPCPNCPSOCpHTNSandSiltyClay
RBD10.249−0.713 **0.0720.1040.676 **0.4280.568 *0.398−0.1350.1090.087
RLD10.196−0.841 **0.1850.2840.671 **0.474 *0.601 *0.392−0.0830.101−0.003
RSAD10.144−0.734 **0.1970.2190.734 **0.3650.4680.371−0.1440.1340.064
RVD10.178−0.818 **0.0020.1890.616 **0.3590.4130.0160.0650.019−0.162
RBD20.101−0.067−0.275−0.0170.204−0.217−0.049−0.037−0.022−0.1780.339
RLD20.116−0.358−0.297−0.190.475 *−0.2610.114−0.003−0.083−0.080.299
RSAD20.115−0.182−0.261−0.0230.296−0.2220.003−0.026−0.029−0.1470.301
RVD20.108−0.04−0.2470.0440.149−0.204−0.053−0.032−0.008−0.1820.318
Notes: W means soil water content, RBD1 means fine root (<2 mm) biomass, RLD1 means fine root length density, RSAD1 means fine root surface area density, RVD1 means fine root volume density, RBD2 means coarse root (>2 mm) biomass, RLD2 means coarse root length density, RSAD2 means coarse root surface area density, RVD2 means coarse root volume density. ** indicates extremely significant relevance (p < 0.01); * indicates significant relevance (p < 0.05).
Disclaimer/Publisher’s Note: The statements, opinions and data contained in all publications are solely those of the individual author(s) and contributor(s) and not of MDPI and/or the editor(s). MDPI and/or the editor(s) disclaim responsibility for any injury to people or property resulting from any ideas, methods, instructions or products referred to in the content.