Article

Drivers of Bird Diversity in the Pearl River Delta National Forest Urban Agglomeration, Guangdong Province, China

1
School of Geography, South China Normal University, Guangzhou 510631, China
2
School of Ecology and Environment, Tibet University, Lhasa 850000, China
*
Author to whom correspondence should be addressed.
Forests 2025, 16(10), 1590; https://doi.org/10.3390/f16101590
Submission received: 7 September 2025 / Revised: 5 October 2025 / Accepted: 13 October 2025 / Published: 16 October 2025

Abstract

To mitigate the threats posed by habitat fragmentation due to rapid urbanization on bird diversity, this study introduces an innovative framework for analyzing the synergistic effects of habitat quality (HQ), ecological network connectivity (ENC), and bird richness (BR) in the Pearl River Delta National Forest Urban Agglomeration (PRDNFUA). The framework, based on a stratified ecological network perspective that distinguishes between urban agglomeration and urban core areas, incorporates different types of ecological corridors (interactive corridors and self-corridors), providing a novel approach for effectively quantifying and spatially visualizing the temporal and spatial evolution of the “HQ–ENC–BR” synergy. By integrating geographic detectors through ternary plot analysis combined with a zonation model, this study identified the synergetic effects of HQ and ENC on BR observed during 2015–2020 and proposed strategies for optimizing “HQ–ENC–BR” synergy. The results indicate that between 2015 and 2020, (1) the Pearl River Estuary and coastal areas are hotspots for bird distribution and also represent gaps in ecological network protection. (2) The positive synergistic effects between ecological network structure (HQ, ENC) and function (BR) have gradually strengthened and are stronger than the effects of individual factors; this synergy is especially significant in urban agglomerations and interactive corridors and is particularly pronounced in the northern cities. (3) The area overlap between the optimized ecological network and bird richness hotspots will increase by approximately 78.2%. The proposed ecological network optimization strategies are scientifically sound and offer valuable suggestions for improving bird diversity patterns in the PRDNFUA. These findings also provide empirical support for the United Nations Sustainable Development Goals (SDG 11: Sustainable Cities and Communities; SDG 15: Life on Land).

1. Introduction

The United Nations Global Biodiversity Outlook reports that global bird populations have declined by approximately 30% over the past 50 years, with habitat degradation and disruption of migratory corridors due to urban expansion being key drivers [1]. This presents a challenge to achieving United Nations Sustainable Development Goals (SDGs) 15 and 11, intensifying the conflict between urban development and nature [2,3]. In this context, constructing ecological networks, particularly ecological corridors, has been widely recognized as an important strategy to mitigate the impacts of urbanization on bird communities. Ecological corridors link fragmented habitats, enhance connectivity and provide migration and breeding routes for birds, thereby supporting their survival and reproduction [4,5]. In September 2021, China issued the “Guidelines for Ecological Protection and Restoration Projects of Mountains, Rivers, Forests, Farmlands, Lakes, and Grasslands (Trial)”, which highlights the importance of ecological corridors for restoring biodiversity and supporting ecosystem sustainability. Bird ecological corridors, as a critical part of bird diversity conservation networks, are of significant importance. They can effectively alleviate habitat fragmentation, improve bird habitats, and contribute to the formation of high-quality ecological environments [6,7].
Although previous studies have examined the impacts of HQ and ENC on bird diversity separately [8,9,10,11,12], empirical analyses on their synergistic effects remain relatively limited. This gap in the research presents three main challenges. First, while existing studies have explored ecological networks at different spatial scales and hierarchical levels, the relationship between these network structures and bird diversity has received insufficient attention [13,14]. Large ecological patches often form strong connections with surrounding fragmented patches, creating clustered distributions that can be categorized as “ecological groups” [15,16]. Based on this, ecological corridors can be divided into self-corridors (within-group corridors) and interactive corridors (between-group corridors) [14,17], but the specific effects of these different corridors on bird diversity patterns have not been systematically studied.
Second, most research treats HQ and ENC as independent variables or relies on static models [18,19], overlooking the potential nonlinear and dynamic interactions between them. Furthermore, the relative influence of HQ and ENC varies with spatial scale, land use intensity, and landscape patterns. Thus, there is a need for research methods that can dynamically and spatially quantify the joint effects of HQ and ENC [20,21,22].
Third, existing research methods make it hard to explain how the co-evolution of HQ and ENC shapes large-scale bird diversity patterns, and they do not offer clear paths for ecological network optimization. There is a need for a systematic framework that integrates HQ, ENC, and bird diversity within a multi-scale and hierarchical ecological network perspective, thereby offering practical insights for urban bird conservation strategies [23].
The “forest urban agglomeration” concept is a new model of ecological urban planning in China, with no mature international cases for reference. The Pearl River Delta region is the first and only National Demonstration Zone for Forest Urban Agglomeration Development in China. Since its initiation in 2015 and partial completion in 2020, the PRDNFUA has aimed to create an integrated ecological network that spans administrative boundaries and different spatial scales. This initiative addresses ecological challenges arising from rapid urbanization and seeks to promote harmony between urban development and nature [24,25]. The key outcomes of the PRDNFUA initiative have emerged: first, the interweaving of ecological spaces and urban development pressures with important bird habitats overlaps significantly with dense urban areas [26,27]; second, there is considerable overlap between bird congregation zones and policy implementation areas, which offers valuable opportunities to evaluate the effectiveness of real-world policies on bird diversity [28]. However, ecological construction in urban cores often receives insufficient attention, raising the critical question: Has the development of ecological networks at both urban agglomeration and urban core scales actually enhanced bird diversity [29]?
This study focuses on the ecological evolution of the PRDNFUA from 2015 to 2020 and seeks to address the following three scientific questions: (1) What are the spatiotemporal patterns of bird diversity in the PRDNFUA during this period? (2) How do HQ and ENC impact bird diversity at different spatial scales and hierarchical levels? Do they exhibit synergistic effects? (3) How can HQ, ENC, and bird diversity be integrated to guide the design of urban ecological networks that improve bird diversity, particularly by aligning structural and functional aspects across urban agglomerations and core areas?
To answer these questions, we use bird richness (BR) as the core indicator of bird diversity and develop a multi-scale, hierarchical analytical framework that combines ecological network structures with multiple modeling approaches. The “HQ–ENC–BR” synergy framework is applied at both urban agglomeration and urban core scales, distinguishing between interactive corridors and self-corridors. This framework quantifies the independent and synergistic effects of HQ and ENC on BR, then identifies spatiotemporal clustering patterns in their synergy. Based on these findings, we propose targeted strategies for optimizing ecological networks to enhance bird diversity. This approach highlights how the relative importance and synergistic effects of HQ and ENC vary across spatial scales and corridor types, providing spatially explicit guidance for ecological network optimization. Our results offer a regional case study that supports global biodiversity targets, including the “30 by 30” goal in the Convention on Biological Diversity (CBD) [30] and the achievement of SDGs 15 and 11 [31].

2. Study Area and Data

2.1. Study Area

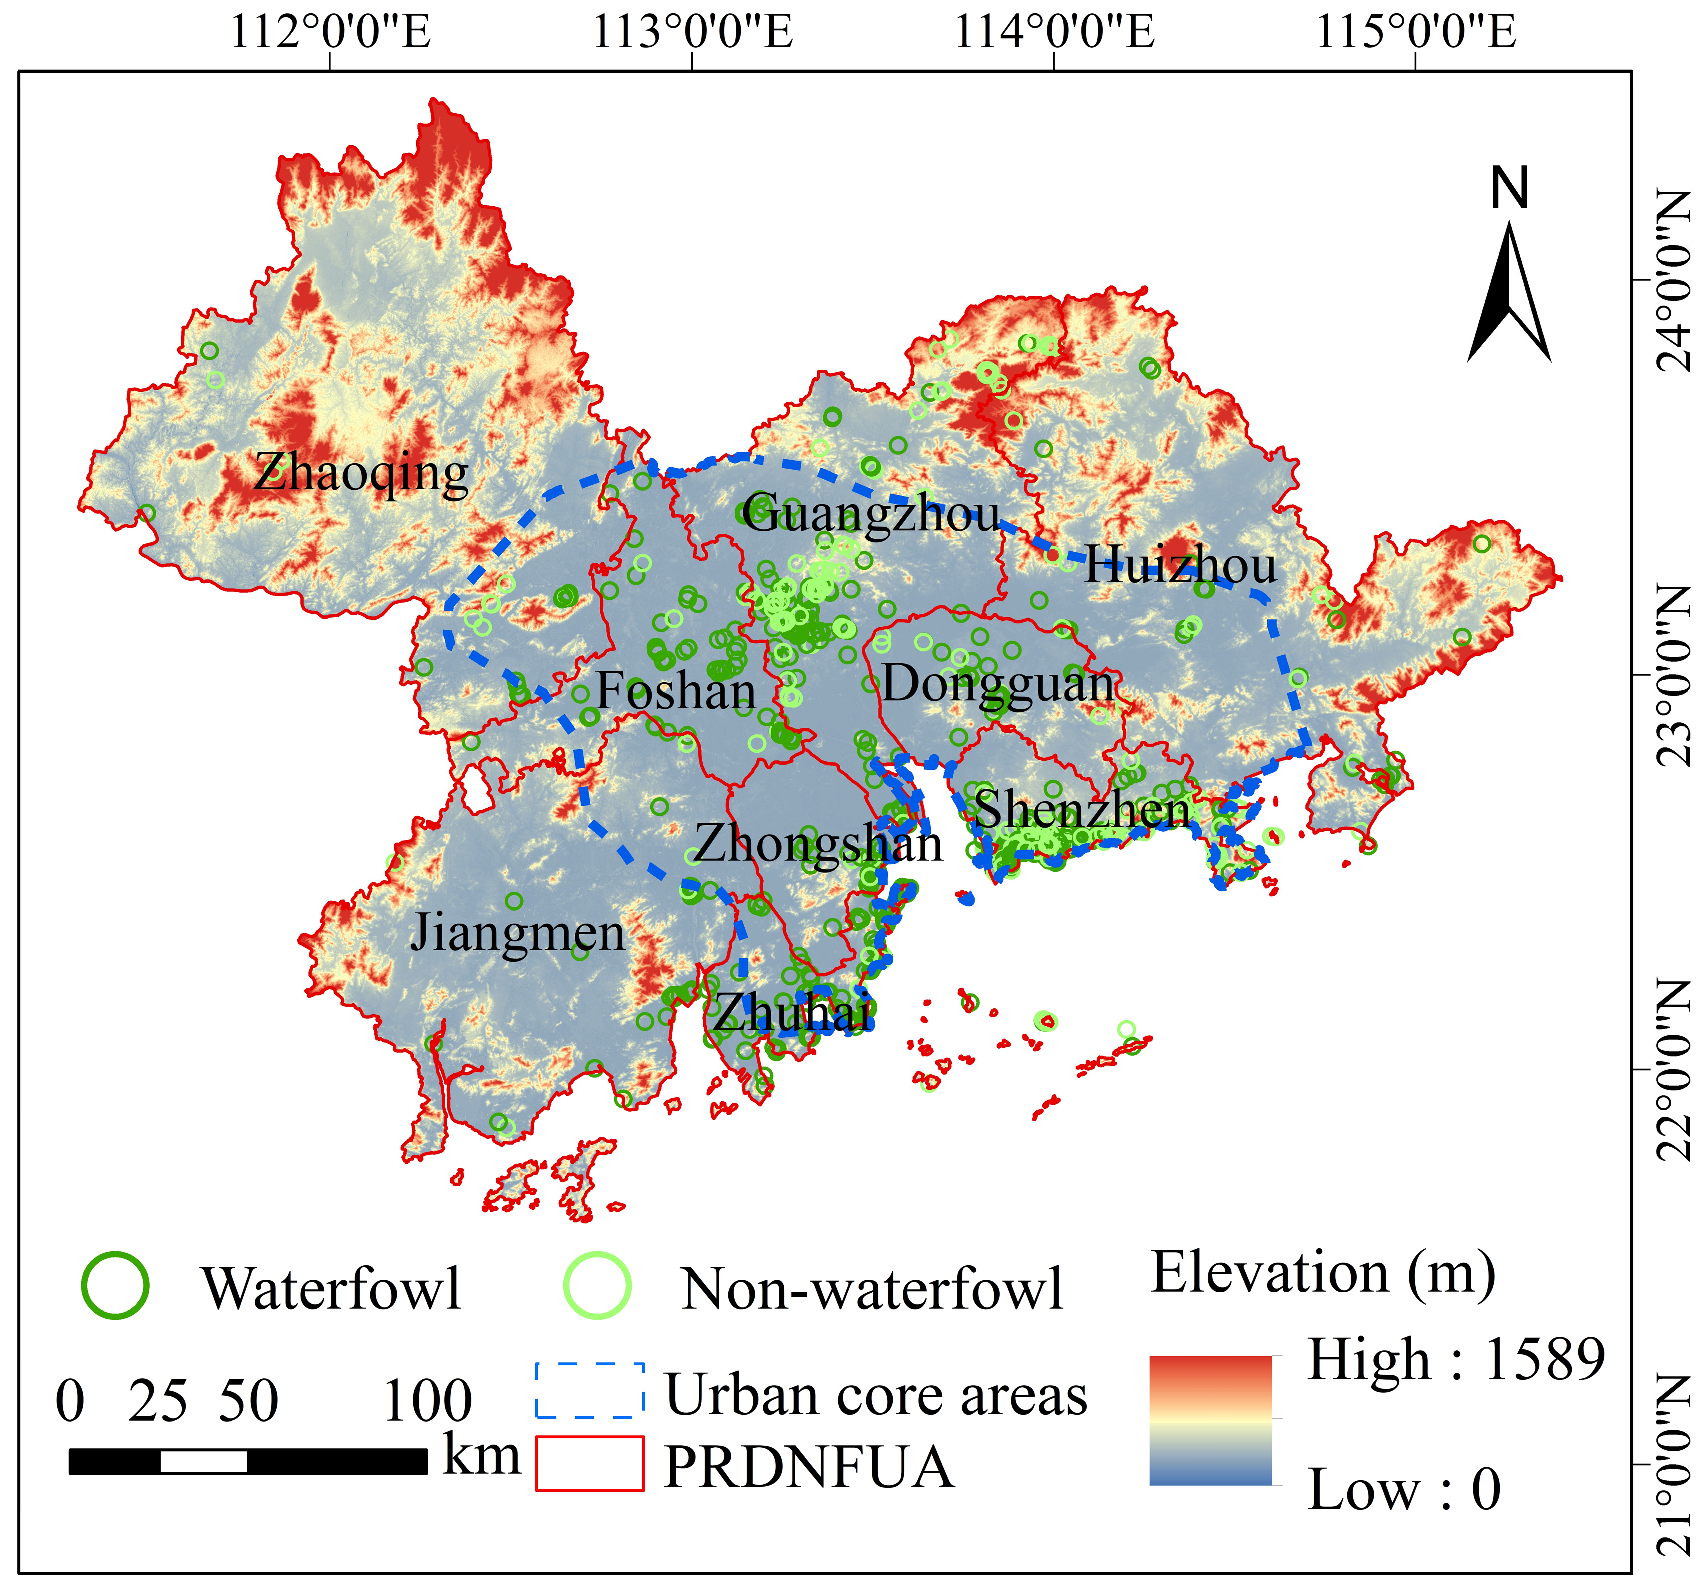
The Pearl River Delta National Forest Urban Agglomeration (PRDNFUA) is situated in south-central Guangdong Province, China, bordering Hong Kong and Macao. It comprises nine cities: Guangzhou, Shenzhen, Zhuhai, Foshan, Jiangmen, Zhaoqing, Huizhou, Dongguan, and Zhongshan, spanning 21°34′–24°34′ N and 111°21′–115°23′ E, with a total area of approximately 56,000 km2 (Figure 1) [25]. Rapid urbanization, accompanied by the expansion of built-up areas, has resulted in the occupation of ecological lands such as forests, grasslands, and wetlands, leading to habitat fragmentation and biodiversity loss [32,33].
The PRDNFUA contains numerous urban and wetland parks, dense river networks, and abundant vegetation, providing crucial habitats for urban bird species. It is also located along the East Asian–Australasian Flyway, serving as a major stopover for tens of thousands of migratory birds each year. Over the past 40 years, with the exception of some specific areas, the area of coastal natural wetlands and waterbird resources has declined by over 60%, highlighting the urgent need for the protection and restoration of coastal wetlands and waterbird resources [27,34,35].

2.2. Data Source and Processing

The main data used in this study and their details are provided in Table 1. Data on the central area of the Pearl River Delta urban agglomeration comes from the 2020 Global Urban Area Dataset [36]. A 5 km buffer zone was created based on this dataset to define the urban core area of the Pearl River Delta [37]. Land use data were used to extract ecological spaces [38].
Bird species occurrence point data were obtained from the Global Biodiversity Information Facility (GBIF Occurrence Download. Available online: https://doi.org/10.15468/dl.a3ufca, accessed on 12 October 2023), which is widely used in global biodiversity research [39,40,41]. The data sources include specimens and fossils from natural history museums, field observations by researchers and citizen scientists, and automated data collected from camera traps and remote sensing satellites. Although GBIF offers extensive data coverage (GBIF Occurrence Download. Available online: https://doi.org/10.15468/dl.a3ufca, accessed on 12 October 2023), spatial and temporal imbalances in records may exist due to observer biases and differences in effort intensity.
To minimize data bias and improve the reliability of our results, the bird species data were processed as follows: (1) The quality of species occurrence data directly impacts the reliability of model predictions. Only records with clear geographic information (latitude and longitude) were retained. Bird species with at least 10 observation points were selected for modeling potential distribution. This approach is based on the fact that as the sample size increases, the reliability and accuracy of species distribution models improve. Specifically, when there are more than 10 observation points, the model can better capture the distribution characteristics of species, avoiding errors caused by insufficient data [42]. (2) To reduce the impact of dense point clusters on model training, spatial distance screening was applied to occurrence points. For each species, only one observation point was retained within a 300 m radius. This process helps mitigate the disturbance caused by densely clustered points [43].
The bird species studied in this research were selected from the “List of Key Protected Terrestrial Vertebrate Wildlife Species in Guangdong Province,” focusing primarily on waterbirds. A total of 2280 valid occurrence records were selected for the period 2011–2020, covering 52 bird species (Figure 1). Among them, 11 species with 184 valid records from 2011 to 2015 were used to predict bird richness in 2015, while 41 species with 2280 valid records from 2016 to 2020 were used to predict bird richness in 2020. Additionally, environmental variables, including climate factors and habitat factors, were used to construct ecological resistance surfaces and predict habitat suitability for birds [44,45].

3. Methodology

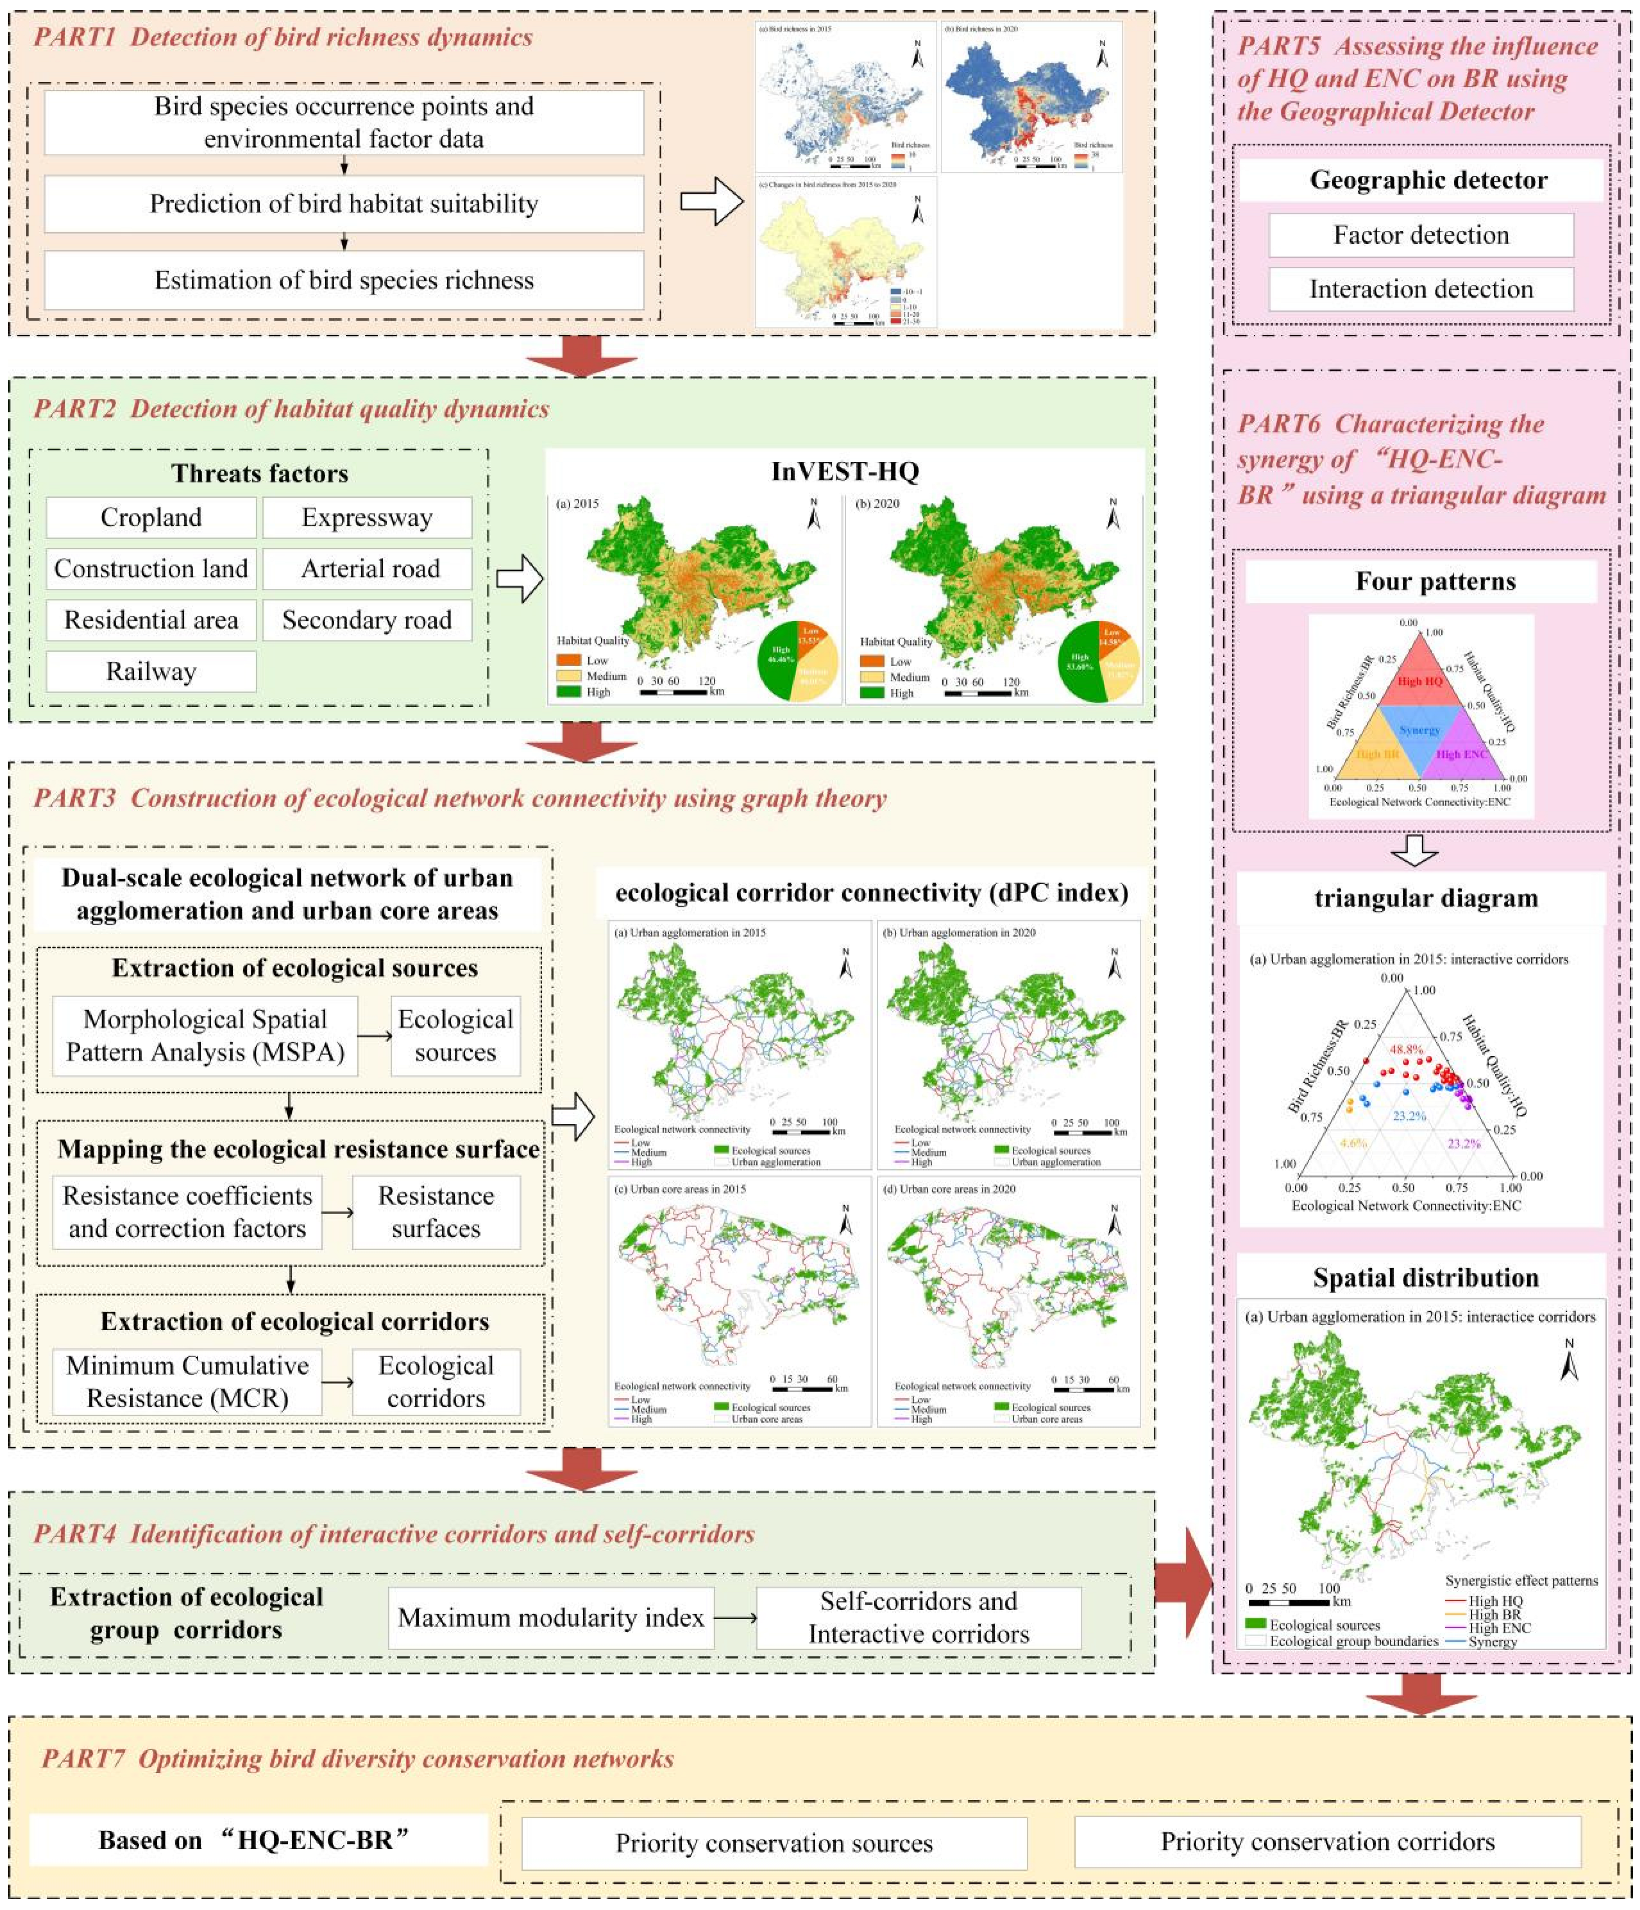
The methodological framework of this study is illustrated in Figure 2. The main steps include: (1) predicting bird richness (BR) using the Maximum Entropy (MaxEnt, version 3.4.4) model, assessing habitat quality (HQ) with the Integrated Valuation of Ecosystem Services and Tradeoffs (InVEST, version 3.14.1) model, and evaluating ecological network connectivity (ENC) using the graph-theoretic approach; (2) identifying interactive corridors and self-corridors within both the urban agglomeration and urban core areas, and extracting mean values of HQ, ENC, and BR for each corridor; (3) employing the geographical detector model to quantify the independent and interactive effects of HQ and ENC on the spatial distribution of BR; (4) clustering the synergy patterns among HQ, ENC, and BR using a ternary plot and visualizing their spatiotemporal dynamics in a spatially explicit manner; and (5) proposing targeted ecological network optimization strategies based on the observed synergistic relationships to enhance urban bird diversity.

3.1. Evaluation of the “HQ–ENC–BR” System

3.1.1. Bird Richness Prediction

In bird diversity studies, choosing the appropriate modeling method is crucial for accurately predicting bird richness and its spatial distribution. Compared to other machine learning methods, the MaxEnt model offers significant advantages in terms of data adaptability, interpretability, spatial prediction capability, computational efficiency, and ecological applicability. MaxEnt is particularly well-suited for cases with only species presence data and can generate reliable predictions even with relatively small sample sizes. The model can handle multiple environmental variables and is not sensitive to data scarcity. Its reliability and accuracy in ecological modeling have been widely validated [46]. Therefore, this study uses the MaxEnt model to predict habitat suitability for key protected bird species and estimate the spatial distribution of bird richness.
Species distribution models were constructed for the periods 2011–2015 and 2016–2020 using species occurrence records and environmental variables (Table 1). To minimize multicollinearity, environmental variables with Pearson correlation coefficients > 0.9 were excluded [47]. Variable importance was assessed using jackknife analysis, and 6–15 key predictors were retained for final modeling. Model performance was evaluated through 10-fold cross-validation, with 75% of the data for training and 25% for testing. The Area Under the Receiver Operating Characteristic Curve (AUC) served as the main accuracy metric, with AUC > 0.9 indicating strong performance [48]. Binary habitat suitability maps were generated using the Equal Training Sensitivity and Specificity Threshold (ETSST) method [49]. Using the average threshold from cross-validation, raster cells with suitability values above the threshold were classified as potential habitats (assigned 1), and others were excluded (assigned 0). BR was calculated by stacking binary presence maps of all modeled species, resulting in a spatial distribution map of key protected bird richness.

3.1.2. Habitat Quality Assessment

The InVEST model is widely used for ecosystem service assessments, including habitat quality (HQ) [50]. In this study, the Habitat Quality Module of InVEST was applied to generate HQ maps based on land use/land cover (LULC) data and threat factors to biodiversity. Higher values indicate better habitat quality, while lower values represent degraded areas.
The model accounts for the impact distance, weight, and sensitivity of various land cover types to specific threats. Given the high economic and population density of the Pearl River Delta, major threat sources included built-up land, cropland, transport infrastructure (railways, highways, primary and secondary roads), and residential areas. Parameter values (e.g., weight, maximum distance, decay function) were set based on previous studies [51,52], regional ecological characteristics, and the official InVEST user guide. Habitat suitability scores ranged from 0 (least suitable) to 1 (most suitable) and were assigned to each LULC type based on regional biodiversity conditions (Table 2). To minimize the subjectivity of sensitivity parameters, which are typically defined by expert judgment, Kendall correlation analysis was applied to assign sensitivity values for different LULC types (Table 2) [52,53].

3.1.3. Ecological Network Connectivity Evaluation

Ecological networks were constructed at both the urban agglomeration and urban core scales. The ecological network structure of the urban agglomeration served as the framework to define the overall conservation pattern, while the network of the urban core areas was incorporated as a refinement and supplement [51]. Following the principle of coupled and nested ecological networks [54], we constructed ecological networks at both scales (Figure 2).
Morphological Spatial Pattern Analysis (MSPA) was used to quantify the spatial structure of ecological land and identify core habitat patches. MSPA is advantageous for visualizing landscape structure and distinguishing functional elements of ecological land. Using Guidos Toolbox (Version 3.0), MSPA was applied to forestland, grassland, and wetlands, and core patches were extracted as ecological sources [55].
For large-scale landscape connectivity, graph theory provides a robust method that integrates species dispersal behavior and habitat data to assess both structural and functional connectivity. The Degree of Probability of Connectivity Change (dPC) index is a graph-based metric that incorporates patch attributes (e.g., area, quality), species dispersal capabilities, and overall network topology. In this study, Graphab 2.8.2 was used to construct the network and compute dPC values based on the Minimum Cumulative Resistance (MCR) model (Version 2.8.2) [56]. Corridor values ranged from 0 to 1, with higher dPC values indicating better connectivity [57].

3.2. Identification of Interactive Corridors and Self-Corridors

To classify ecological groups within the network, we applied modularity analysis and a greedy optimization algorithm using Graphab 2.8.2 [14]. The modularity index measures the strength of division of a network into clusters, with higher values indicating a more meaningful grouping of nodes based on their connectivity structure [58]. The greedy algorithm iteratively merges nodes or groups to maximize the modularity score, converging to a locally optimal clustering solution [59]. The modularity index is calculated as follows:
Q = 1 2 m i j A i j k i k j 2 m δ c i , c j
where Q is the Modularity index, ranging from [−1, 1]. A i j represents the connection weight between node i and node j . If nodes i and node j are connected by an edge, A i j = 1 , otherwise, A i j = 0 . m   is the total number of edges in the network. k i and k j are the number of edges connected to nodes i and j , respectively. δ c i , c j = 1 is an indicator function, if nodes i and j belong to the same ecological group c , then δ c i , c j = 1 ; otherwise, δ c i , c j = 0 .
Interactive corridors refer to ecological connections linking nodes from different ecological groups. Self-corridors refer to corridors that connect nodes within the same ecological group. Using ArcGIS 10.8, we extracted and calculated the mean HQ, ENC, and BR for each identified corridor within both the urban agglomeration and the urban core areas. These values served as input variables for analyzing the synergistic “HQ–ENC–BR” effects.

3.3. Assessing the Influence of HQ and ENC on BR Using the Geographical Detector

To assess the independent and interactive effects of HQ and ENC on BR and to capture their scale-dependent and corridor-type-specific characteristics, we employed the geographical detector model [60]. Unlike traditional correlation analysis, regression models, coupling coordination models, or some machine learning approaches, the geographical detector excels in: (1) quantifying the relative contribution (q-value) of each factor; (2) detecting interactions (enhancing, nonlinear, or suppressing effects); and (3) identifying whether HQ and ENC exhibit synergistic or independent impacts on BR [21,61,62]. This method provides a statistically robust framework for spatially explicit factor analysis and is especially well-suited for ecological pattern recognition.

3.4. Clustering Synergistic Patterns of “HQ–ENC–BR” Using the Ternary Plot

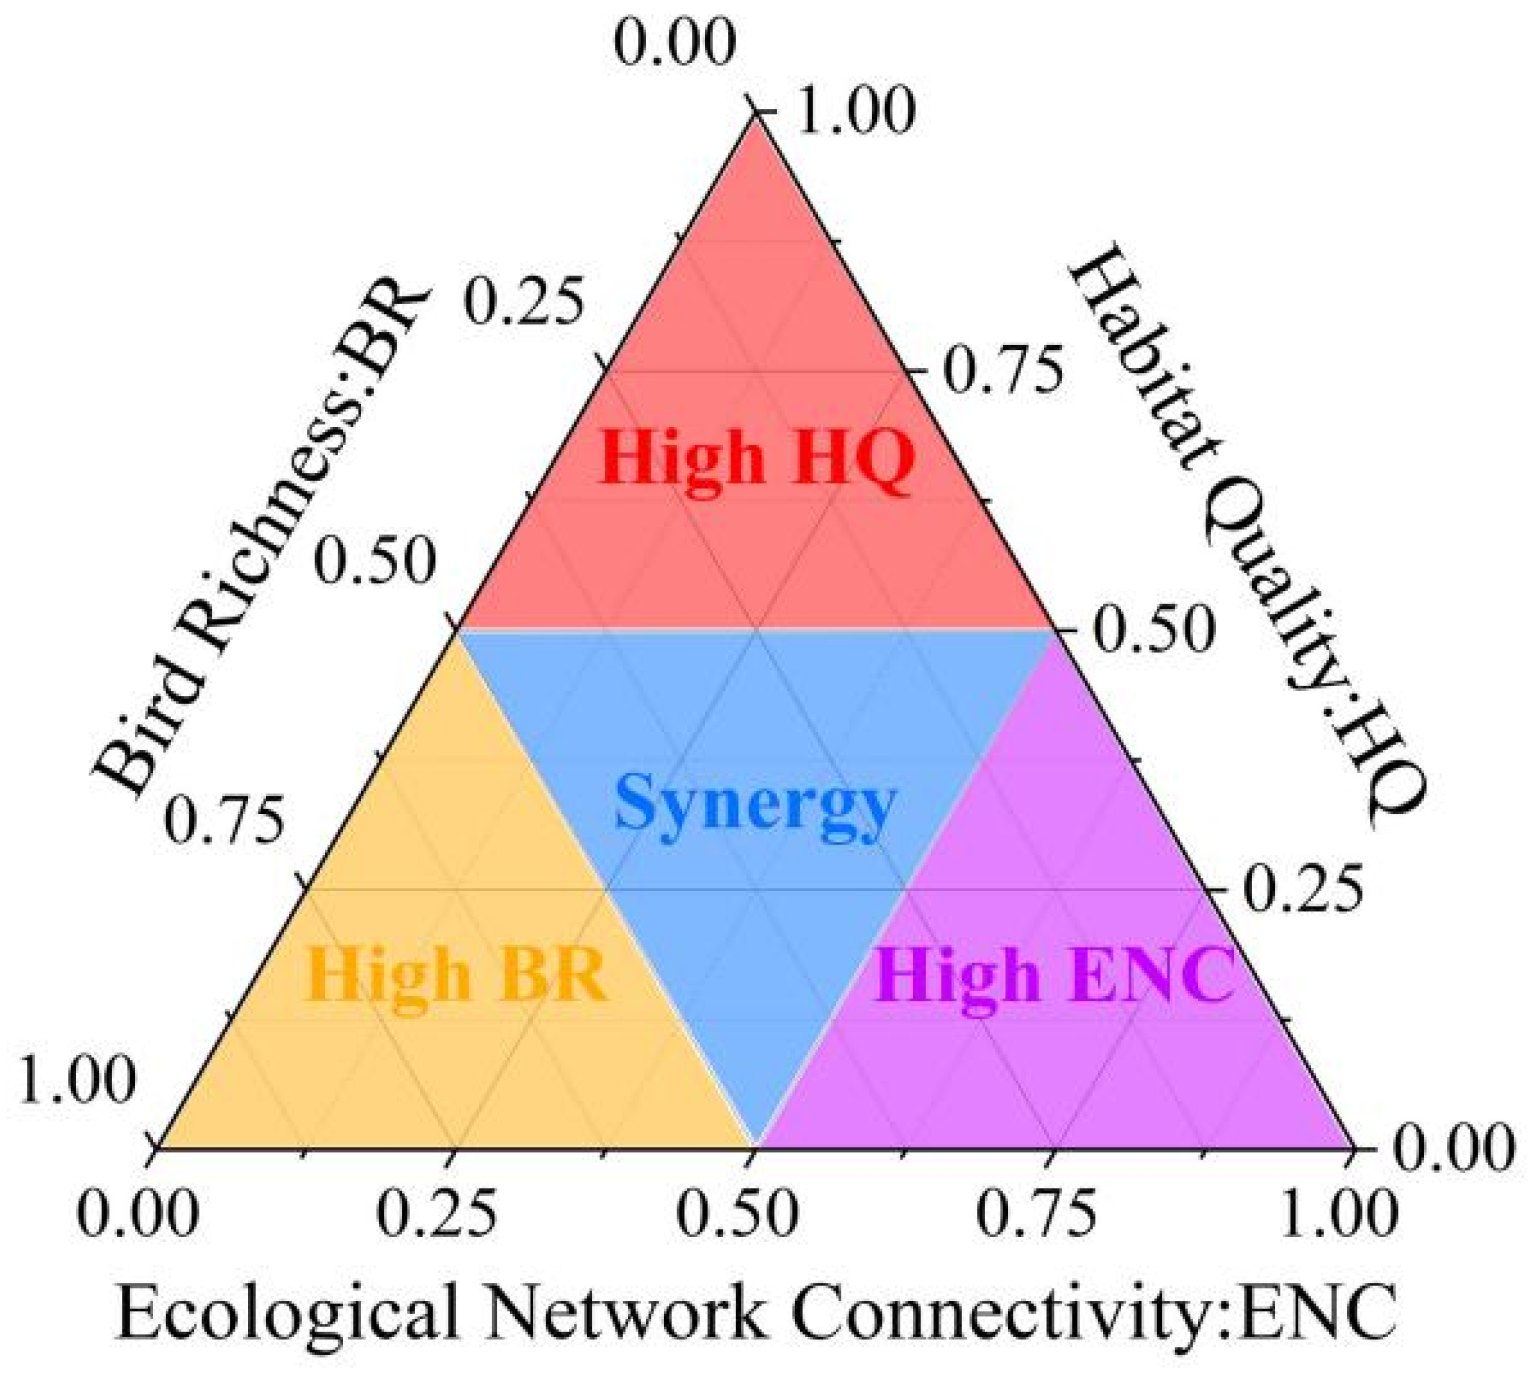
Current methods for synergy analysis are primarily temporal and lack spatial resolution. To visualize the spatial distribution of synergistic relationships among HQ, ENC, and BR, we constructed ternary plots to cluster ecological corridors into four distinct patterns (Figure 3): (1) High HQ: corridors where HQ contributes >50% of the total influence; (2) High ENC: corridors dominated by ENC (>50%); (3) High BR: corridors where BR is the dominant factor; and (4) Synergy: all three variables contribute < 50% individually, indicating a balanced and positive synergistic interaction [63,64]. Each corridor was assigned to one of these four types. The first three patterns reflect imbalanced, single-factor dominance, while the Synergy pattern represents corridors where all three elements interact positively and evenly. Spatial visualization of these patterns was performed using ArcGIS 10.8, enabling comparative analysis between the urban agglomeration and the urban core areas.

3.5. Optimizing the Ecological Network for Bird Diversity Conservation

Based on the original ecological network, we proposed two key strategies to optimize the network for enhancing bird diversity.
(1)
Identification of priority conservation sources: We applied the Zonation model (Version 4.0), a spatial conservation planning tool, to identify areas of high importance for maintaining multi-species HQ and ENC [65]. Species distribution predictions were used as biodiversity input layers, and 2020 land use data served as the condition layer. The relative influence of HQ and ENC on BR, obtained from the geographical detector analysis, was incorporated into the model weighting scheme. The Zonation output was a continuous raster map with values ranging from 0 to 1, where higher values indicate greater conservation priority. Following the CBD, which recommends protecting at least 17% of terrestrial and inland water areas, we designated the top 17% of areas as priority conservation sources [66]. Ecological sources within these areas were defined as primary sources, representing core areas requiring urgent protection. Ecological sources outside these areas were classified as secondary sources, serving as potential areas for future conservation.
(2)
Identification of priority corridors: We first extracted Synergy corridors identified through ternary plot analysis and designated them as primary corridors. We then identified potential interactive corridors and self-corridors by incorporating existing corridors into the resistance surface and assigning them the maximum resistance value. This procedure allowed us to model new potential pathways using the updated MCR framework. Corridor widths were assigned according to bird movement requirements at different spatial scales, with 100 m for corridors in the urban agglomeration and 60 m for corridors in the urban core areas [67]. These widths were selected to reduce human disturbance and ensure ecological functionality.
Finally, this study utilized the hotspot analysis tool (Getis-Ord Gi*) in ArcGIS 10.8 to identify areas with high bird richness in 2020. The scientific validity of the optimization scheme was evaluated by comparing the changes in areal overlap between the pre- and post-optimized networks and these hotspot regions.

4. Results

4.1. Spatial Distribution of BR, HQ, and ENC

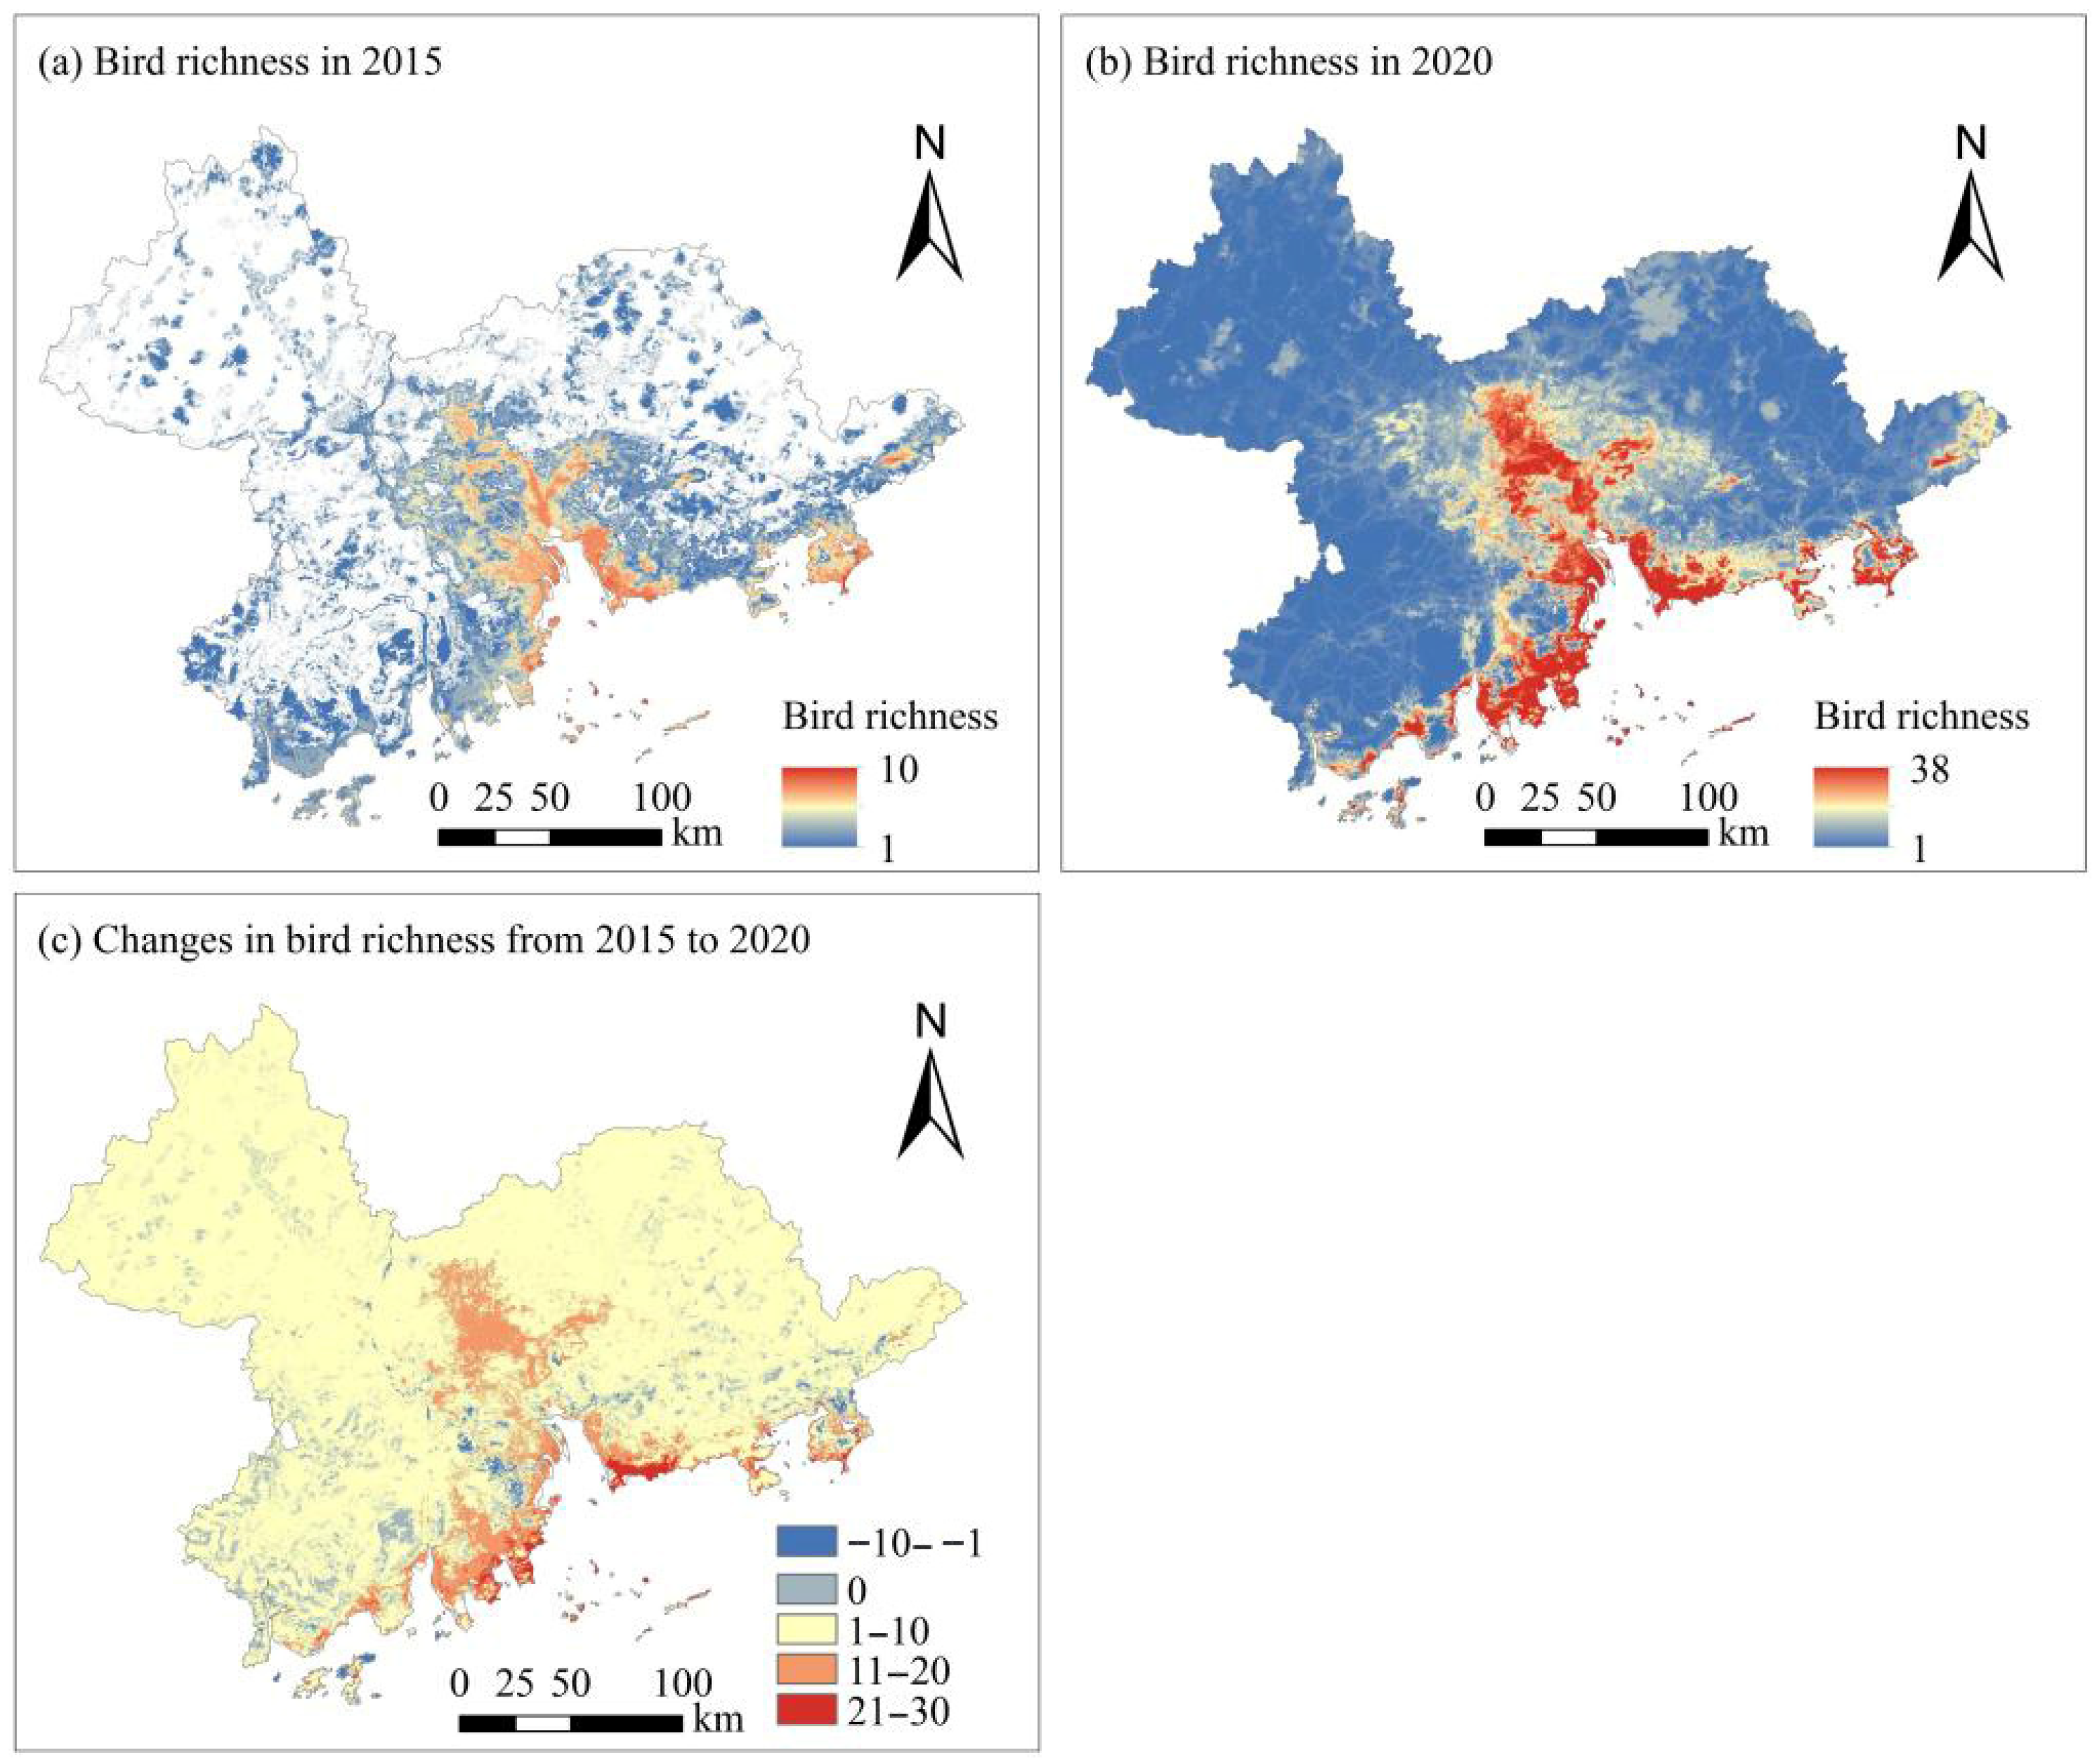
The MaxEnt model achieved high prediction accuracy, with a mean AUC value of 0.90 (±0.08) for the 2011–2015 period and 0.925 (±0.032) for 2016–2020, indicating robust model performance. As shown in Figure 4a,b, the spatial distribution of BR was similar in 2015 and 2020, with high values concentrated along the Pearl River Estuary and coastal zones. Overall, BR gradually decreased from the southeastern coastal areas to the northwestern inland regions. This pattern aligns with the habitat preferences of the dominant waterbird species, which are key protected species in the region. Between 2015 and 2020, notable changes in BR were observed along the coastal areas of Guangzhou, Jiangmen, Zhuhai, Zhongshan, Shenzhen, Dongguan, and Huizhou, as well as at the junction of Guangzhou, Dongguan, and Foshan (Figure 4c).
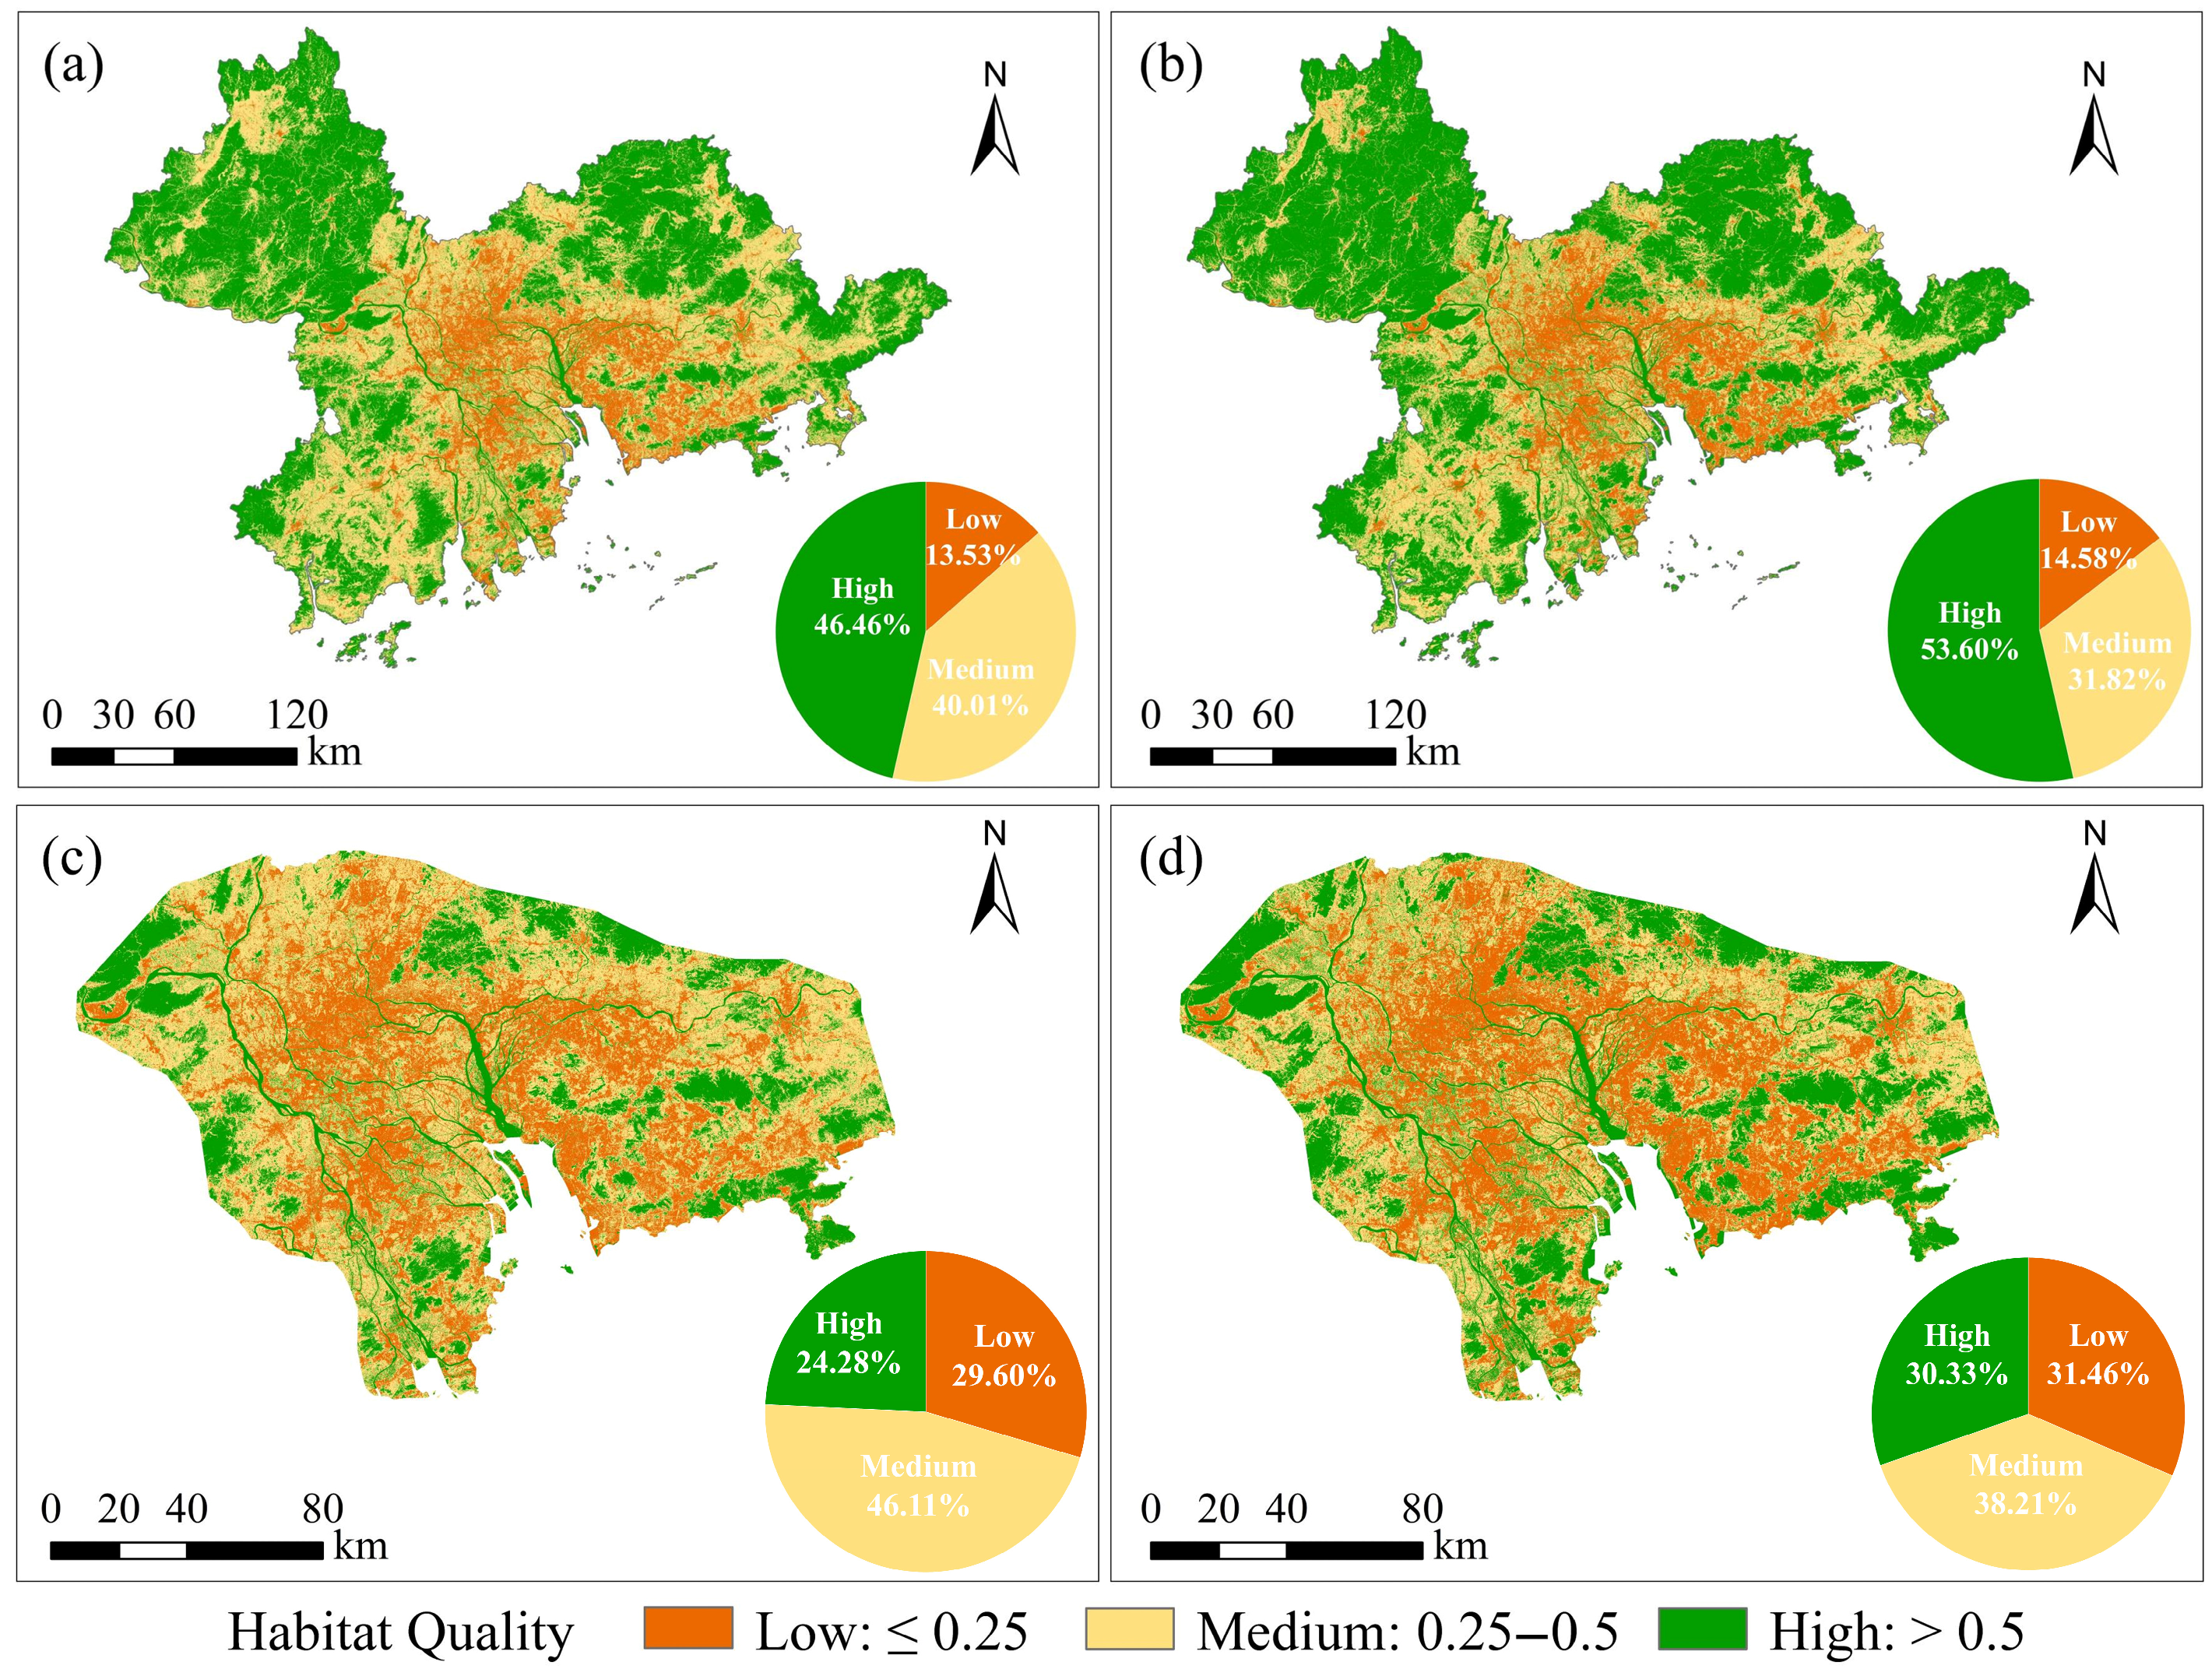
As illustrated in Figure 5a–d, HQ increased from the urban core areas toward the periphery. High-quality habitats were primarily located in large patches of forests, grasslands, and wetlands, while medium-quality habitats were mainly associated with impervious surfaces. We also observed an increase in the total area of high-quality habitats across all nine cities within the PRDNFUA, with particularly notable expansion in Zhaoqing, Huizhou, and Guangzhou. Between 2015 and 2020, the area percentage of high-quality habitats in the urban agglomeration increased from 46.46% to 53.60% (Figure 5a,b). In the core built-up areas, the percentage of areas with high-quality habitats increased from 24.28% to 30.33% (Figure 5c,d), indicating an overall improvement in habitat quality in the Pearl River Delta.
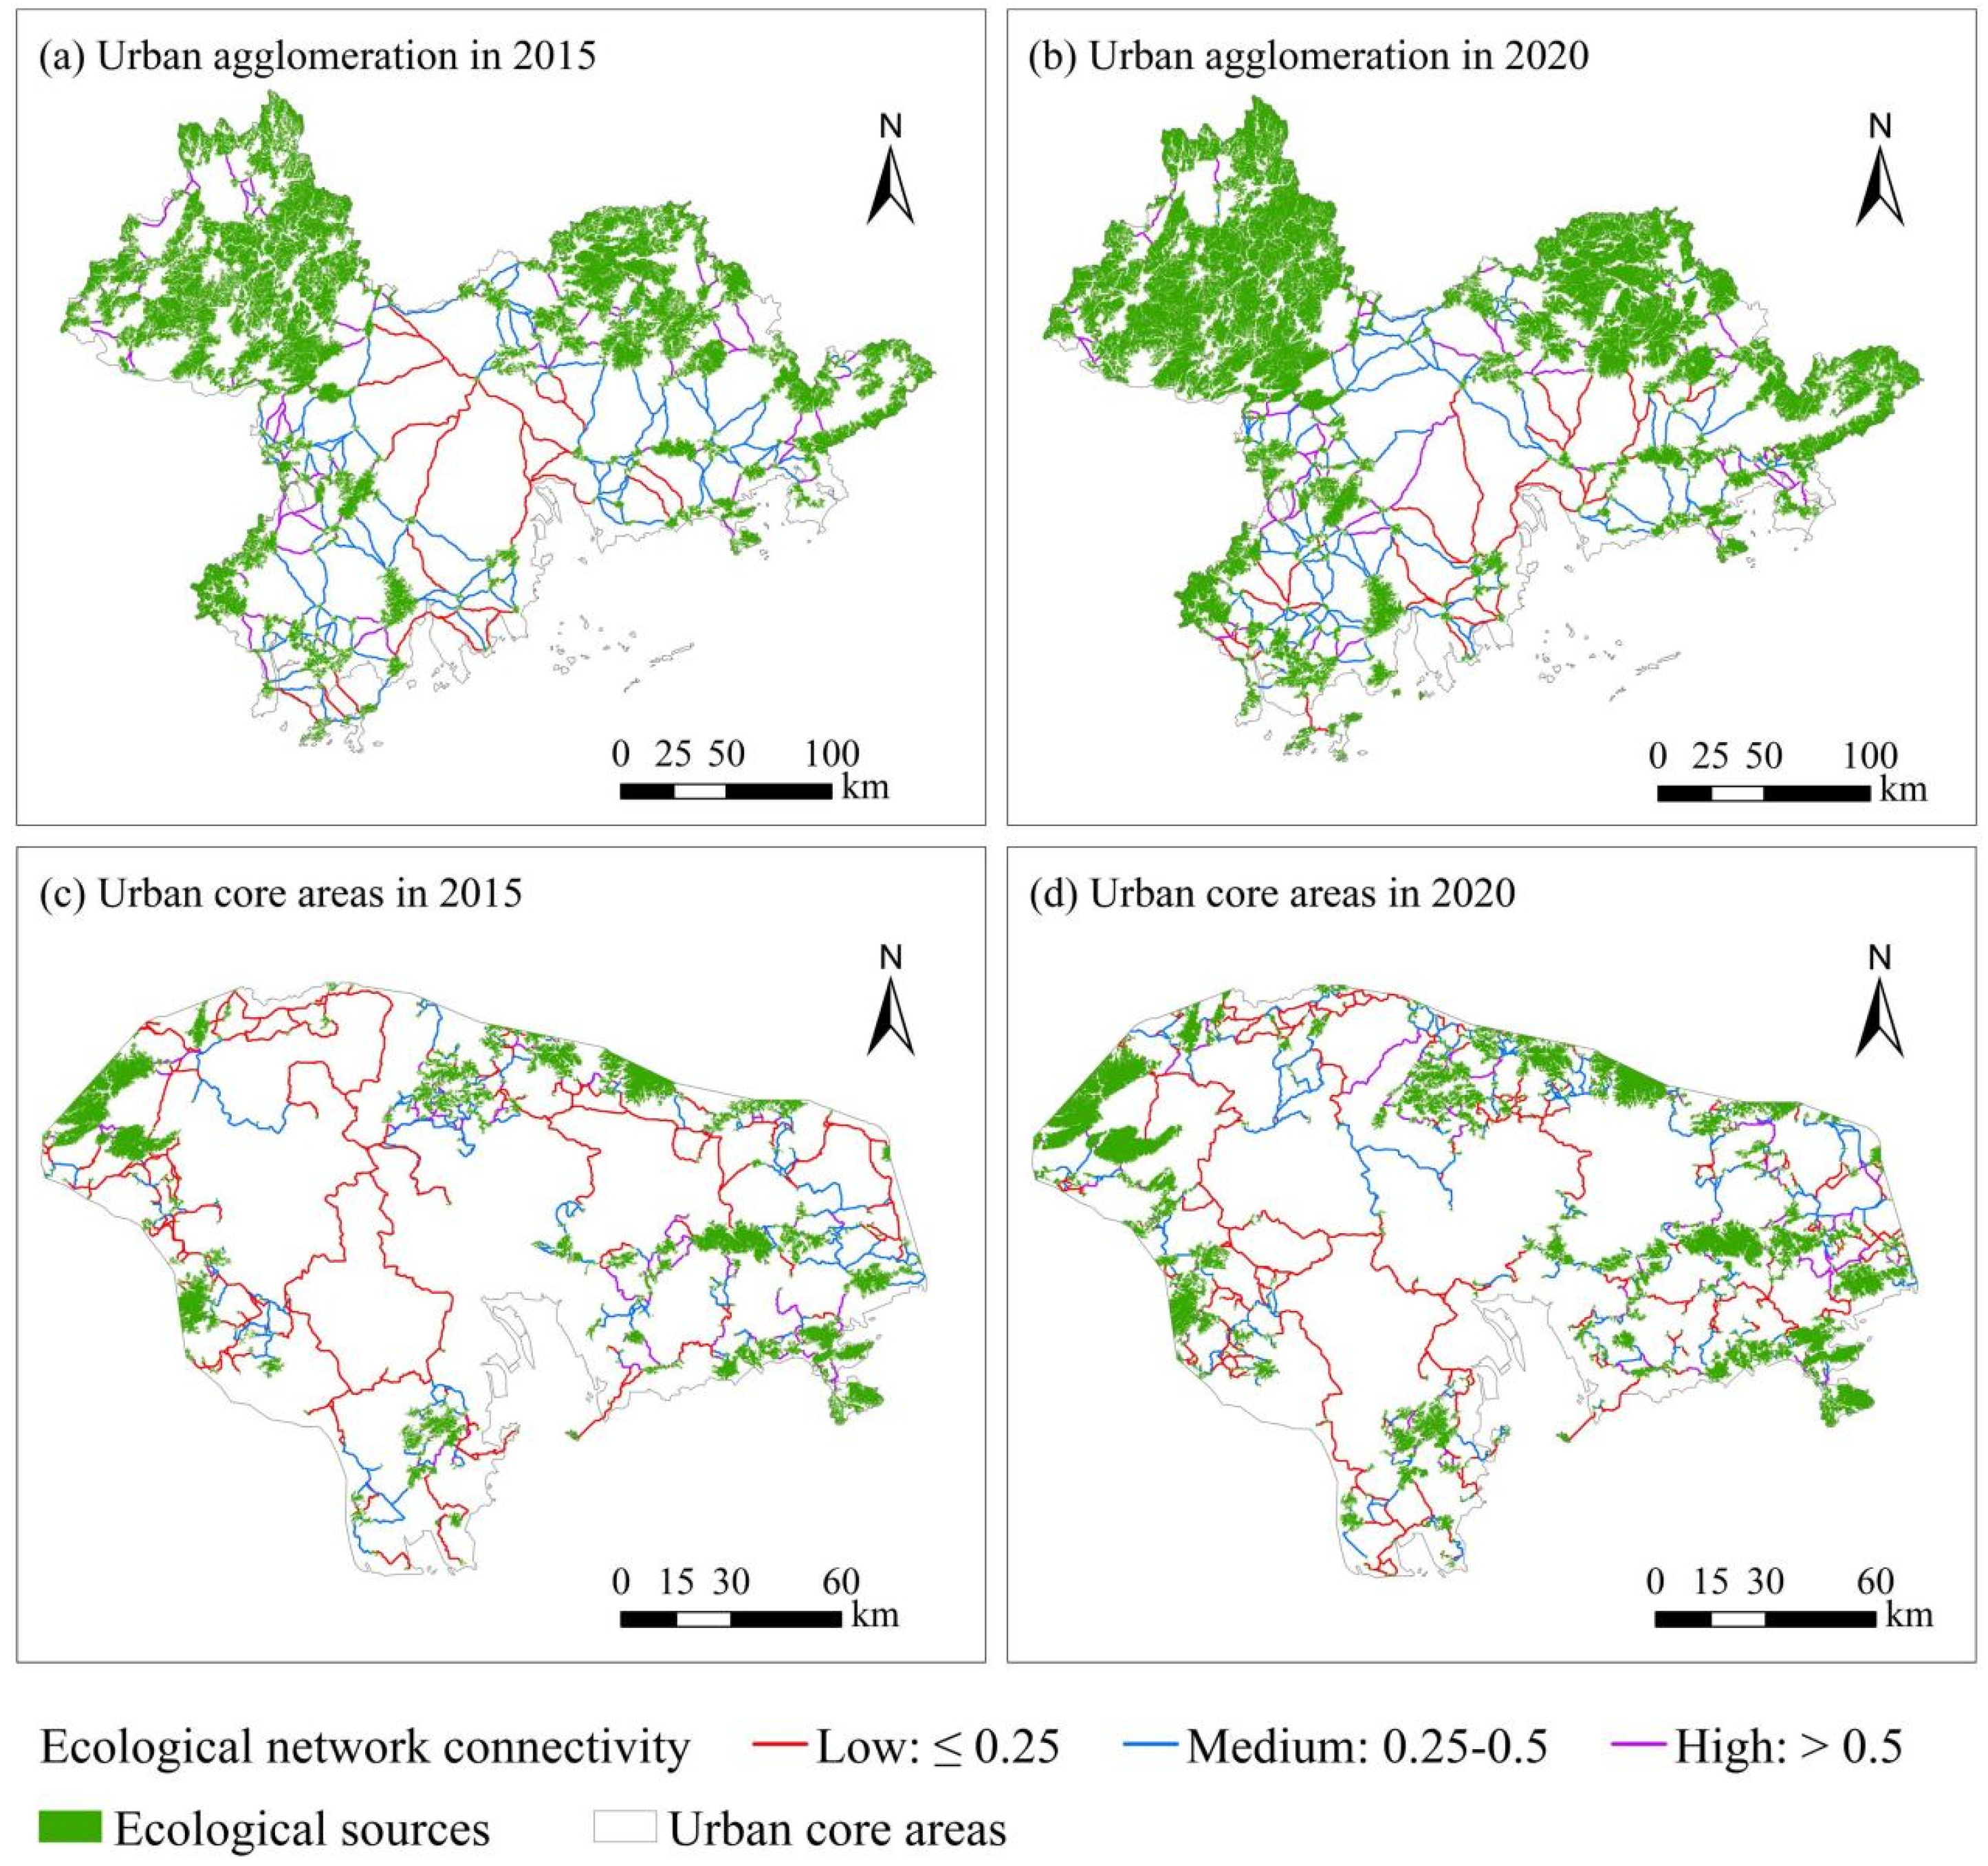
As shown in Figure 6, the area of ecological source sites in the Pearl River Delta was 14,306.79 km2 in 2015 and 19,315.80 km2 in 2020, mainly distributed in the peripheral areas of the urban agglomeration. Ecological corridors with high connectivity were concentrated in the northwestern and northeastern ecological regions of the Pearl River Delta (Figure 6a,b). The spatial distribution of connectivity in urban core areas showed similar patterns (Figure 6c,d). Between 2015 and 2020, the average connectivity of urban agglomeration decreased from 0.5 to 0.46, while the connectivity of urban core areas remained stable at 0.32, indicating that the overall change in ecological network connectivity was minimal. Notably, the ecological connectivity between the northern part of Guangzhou and cities such as Zhaoqing, Huizhou, and Shenzhen became stronger over this period.

4.2. Independent and Synergistic Effects of HQ and ENC

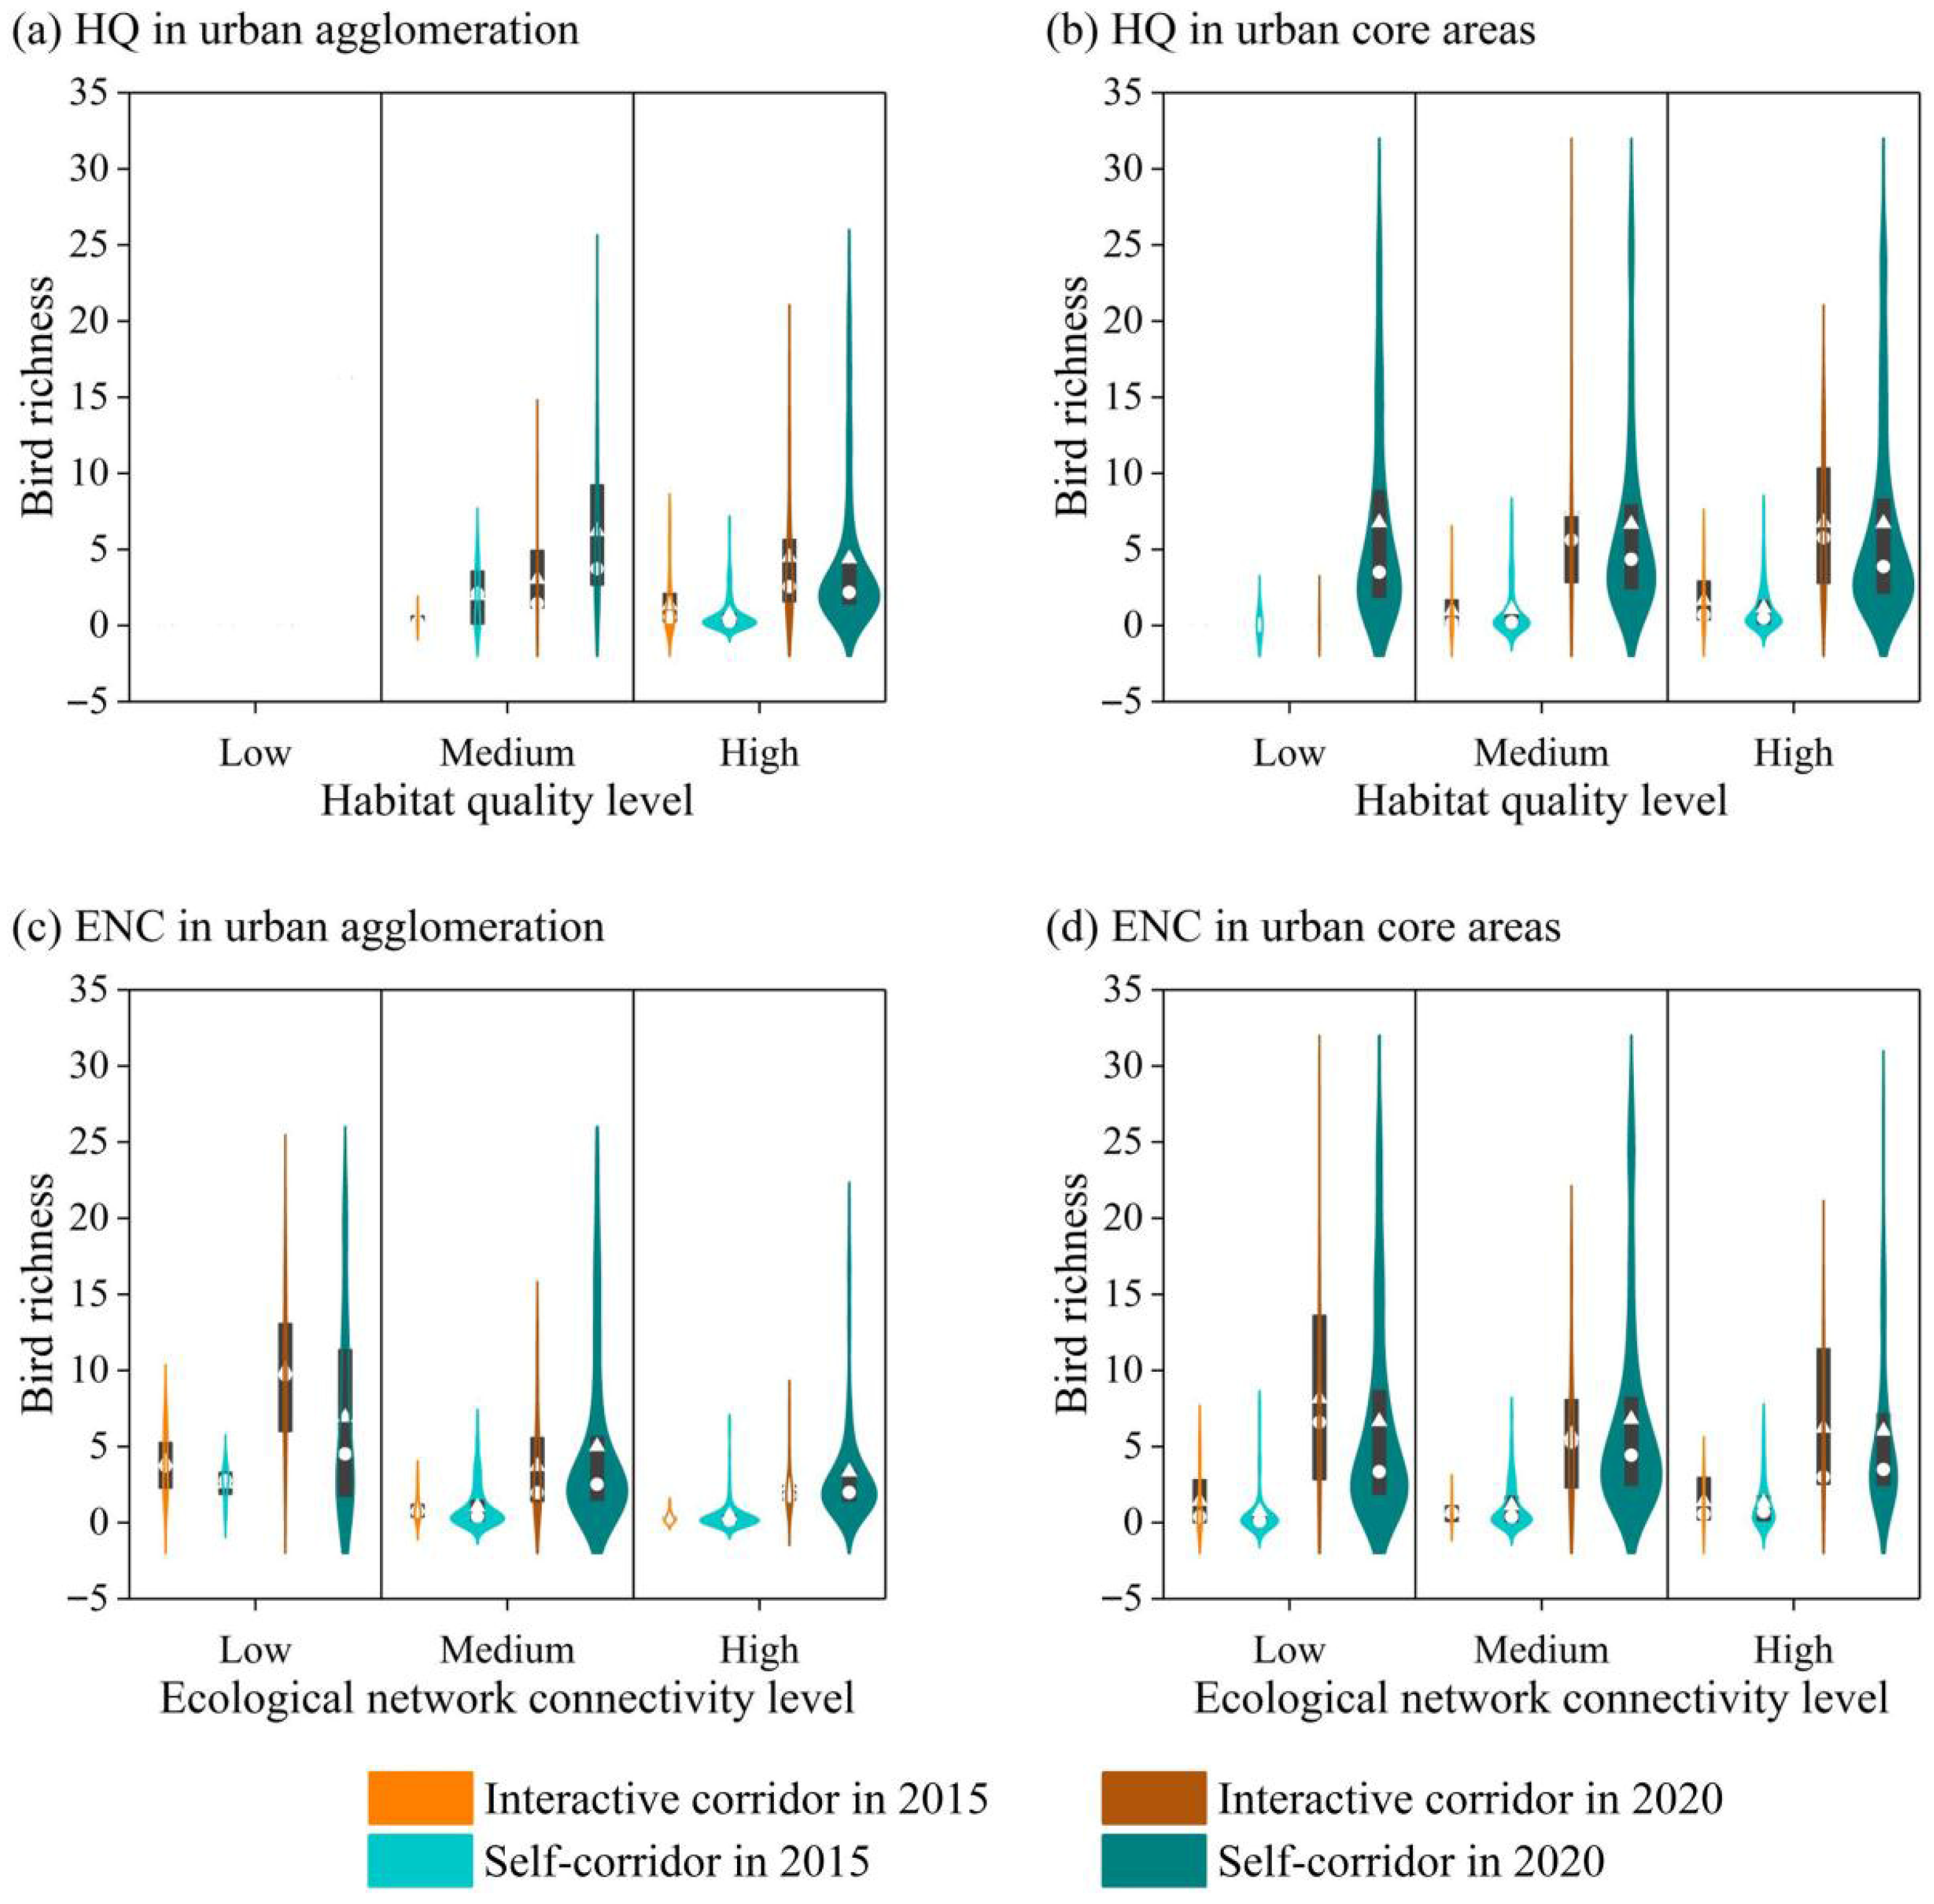
The factor detector results (Table 3) indicated that, in both 2015 and 2020, ENC had a greater influence on the spatial distribution of BR than HQ, particularly within interactive corridors. BR generally increased with improved HQ across both the urban agglomeration and urban core areas (Figure 7a,b), confirming the positive role of HQ in promoting bird diversity. In both interactive corridors and self-corridors, ENC exhibited a potentially negative effect on BR (Figure 7c). In the urban core areas, HQ emerged as the dominant factor influencing BR, especially within interactive corridors, highlighting the importance of HQ in highly urbanized contexts. Variations in ENC had limited effects in the urban core areas (Figure 7d), although the influence of interactive corridor connectivity gradually increased.
The interaction detector results (Table 3) revealed that the interaction between HQ and ENC was characterized by nonlinear enhancement, meaning their combined effect exceeded the sum of their individual effects. The synergy was positive and likely involved threshold effects, where significant synergy occurred only when both HQ and ENC exceeded specific values. The synergistic effect of HQ and ENC was 2.4 to 3.8 times stronger in the urban agglomeration than in the urban core areas. In terms of corridor types, the synergy within interactive corridors was 3 to 7 times stronger than that within self-corridors.

4.3. Spatiotemporal Patterns of “HQ–ENC–BR” Synergy Clustering

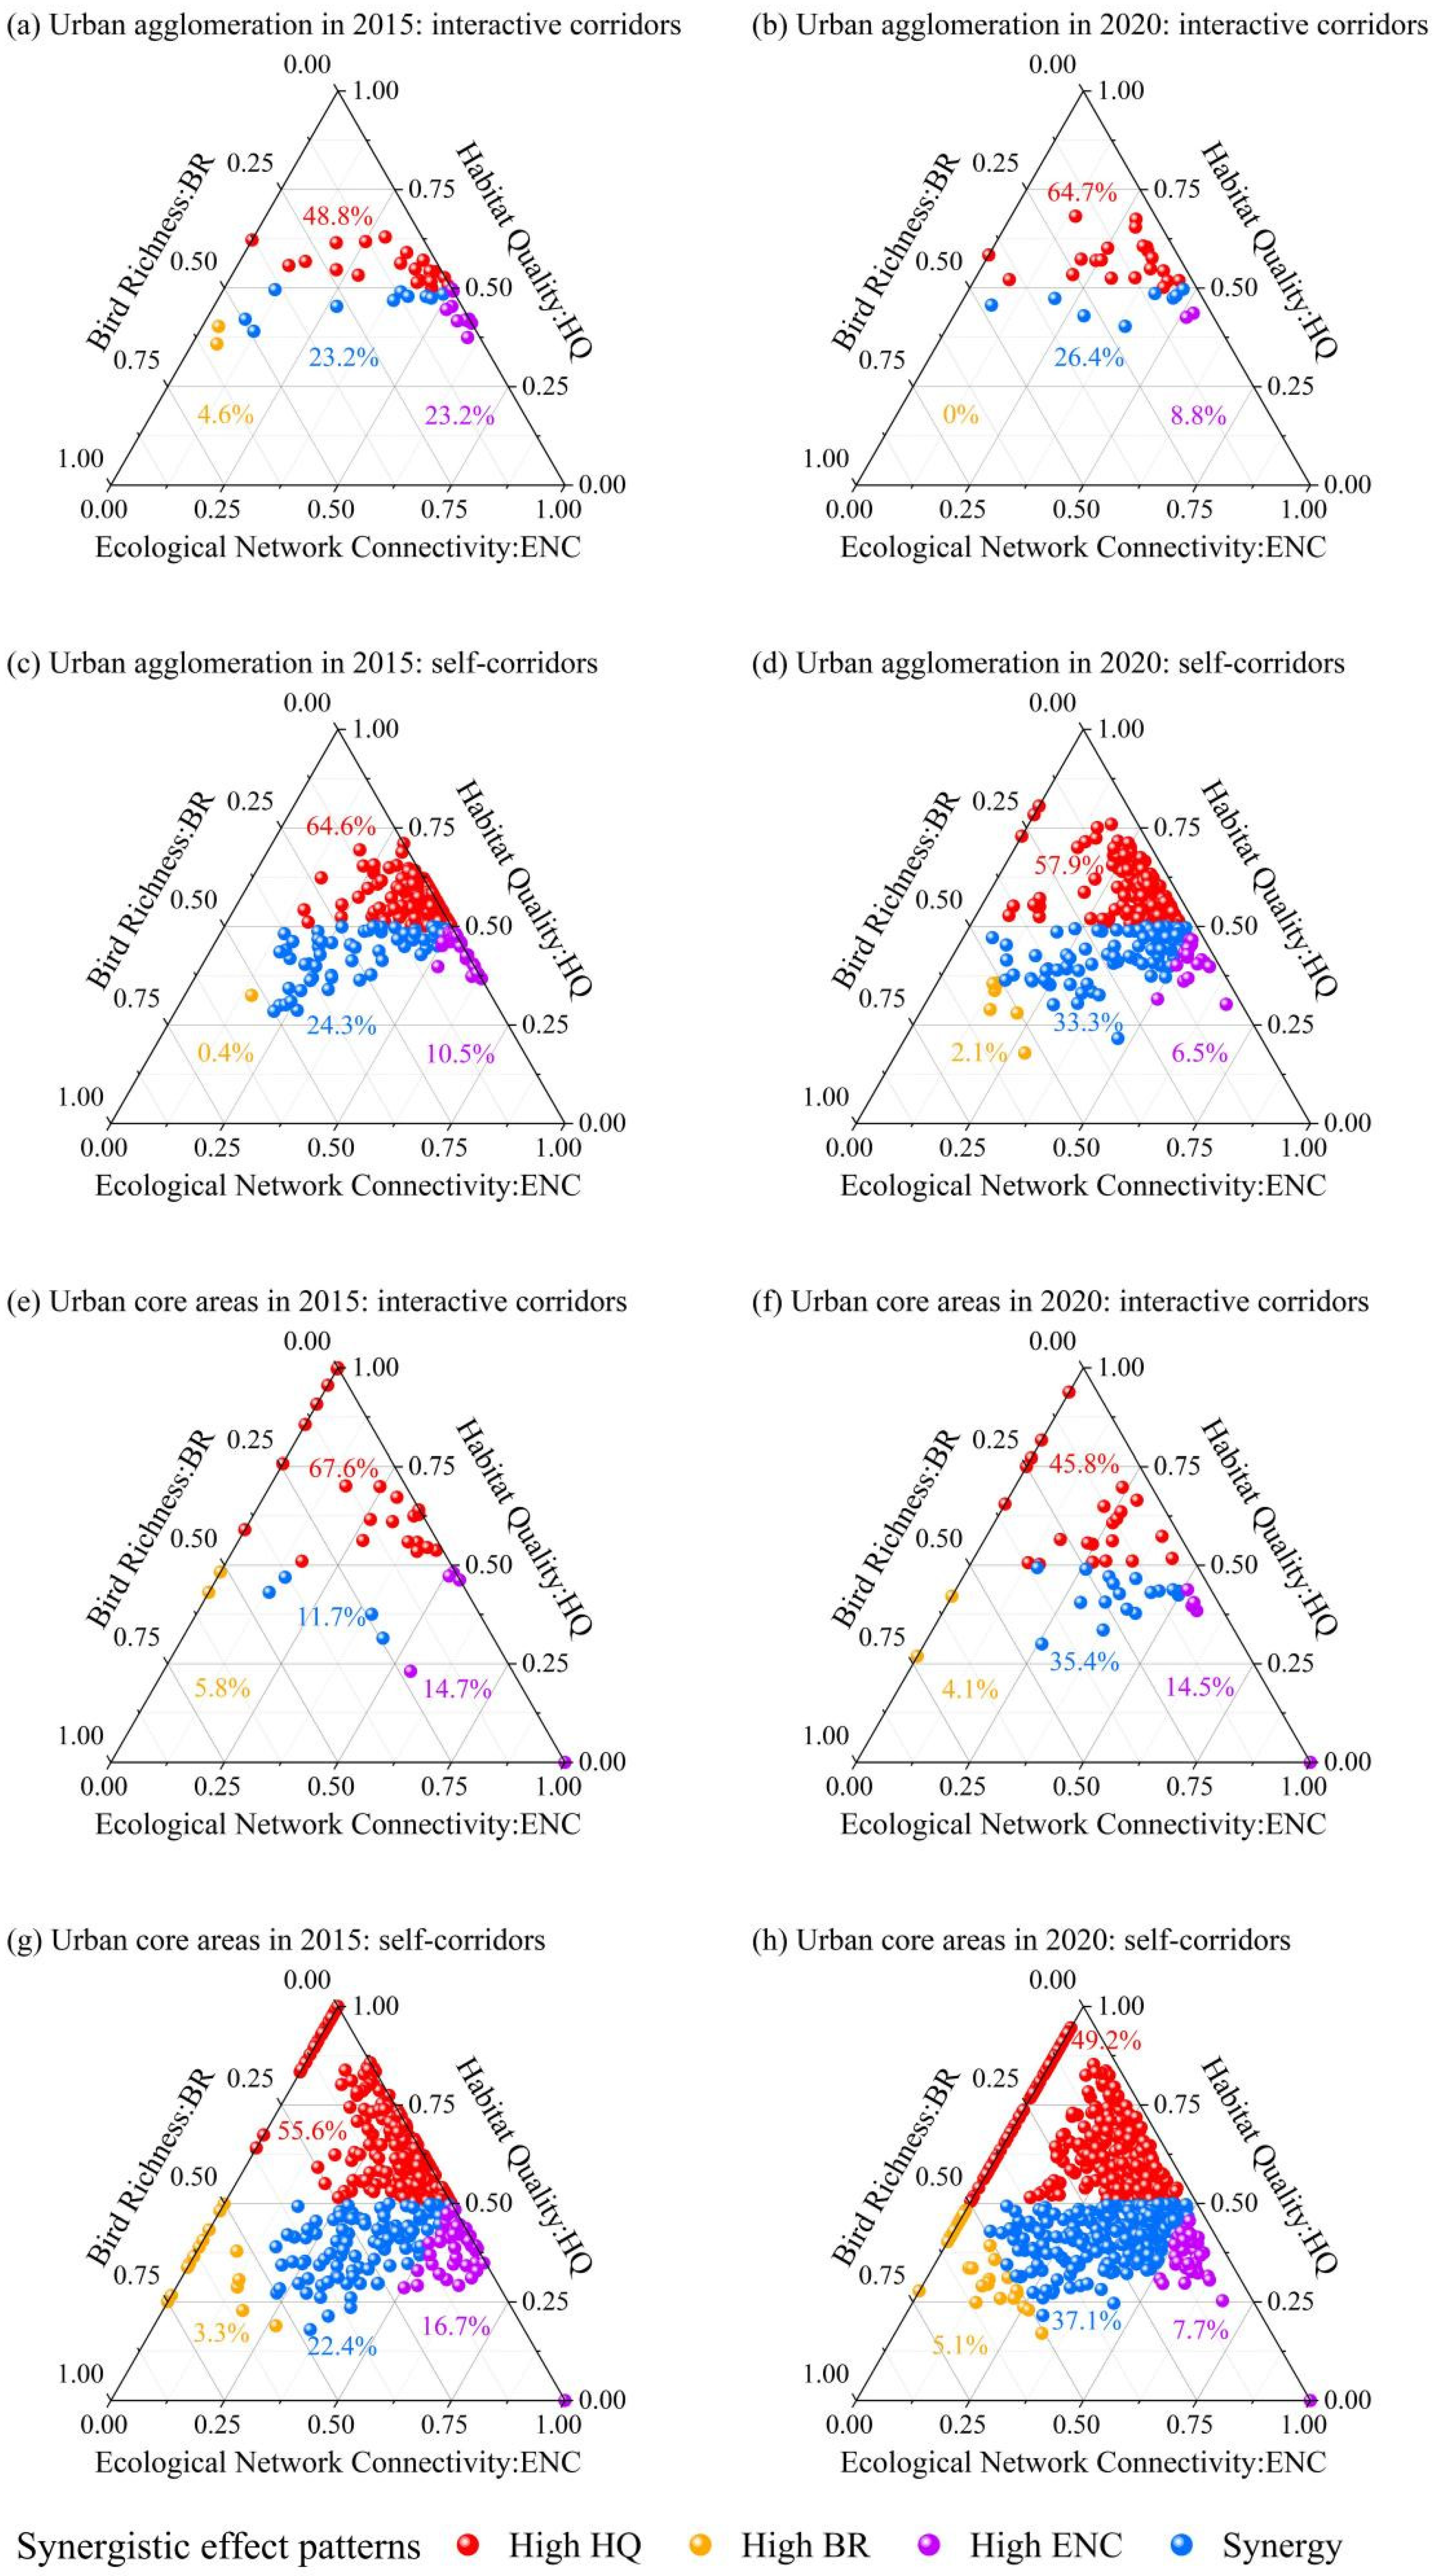
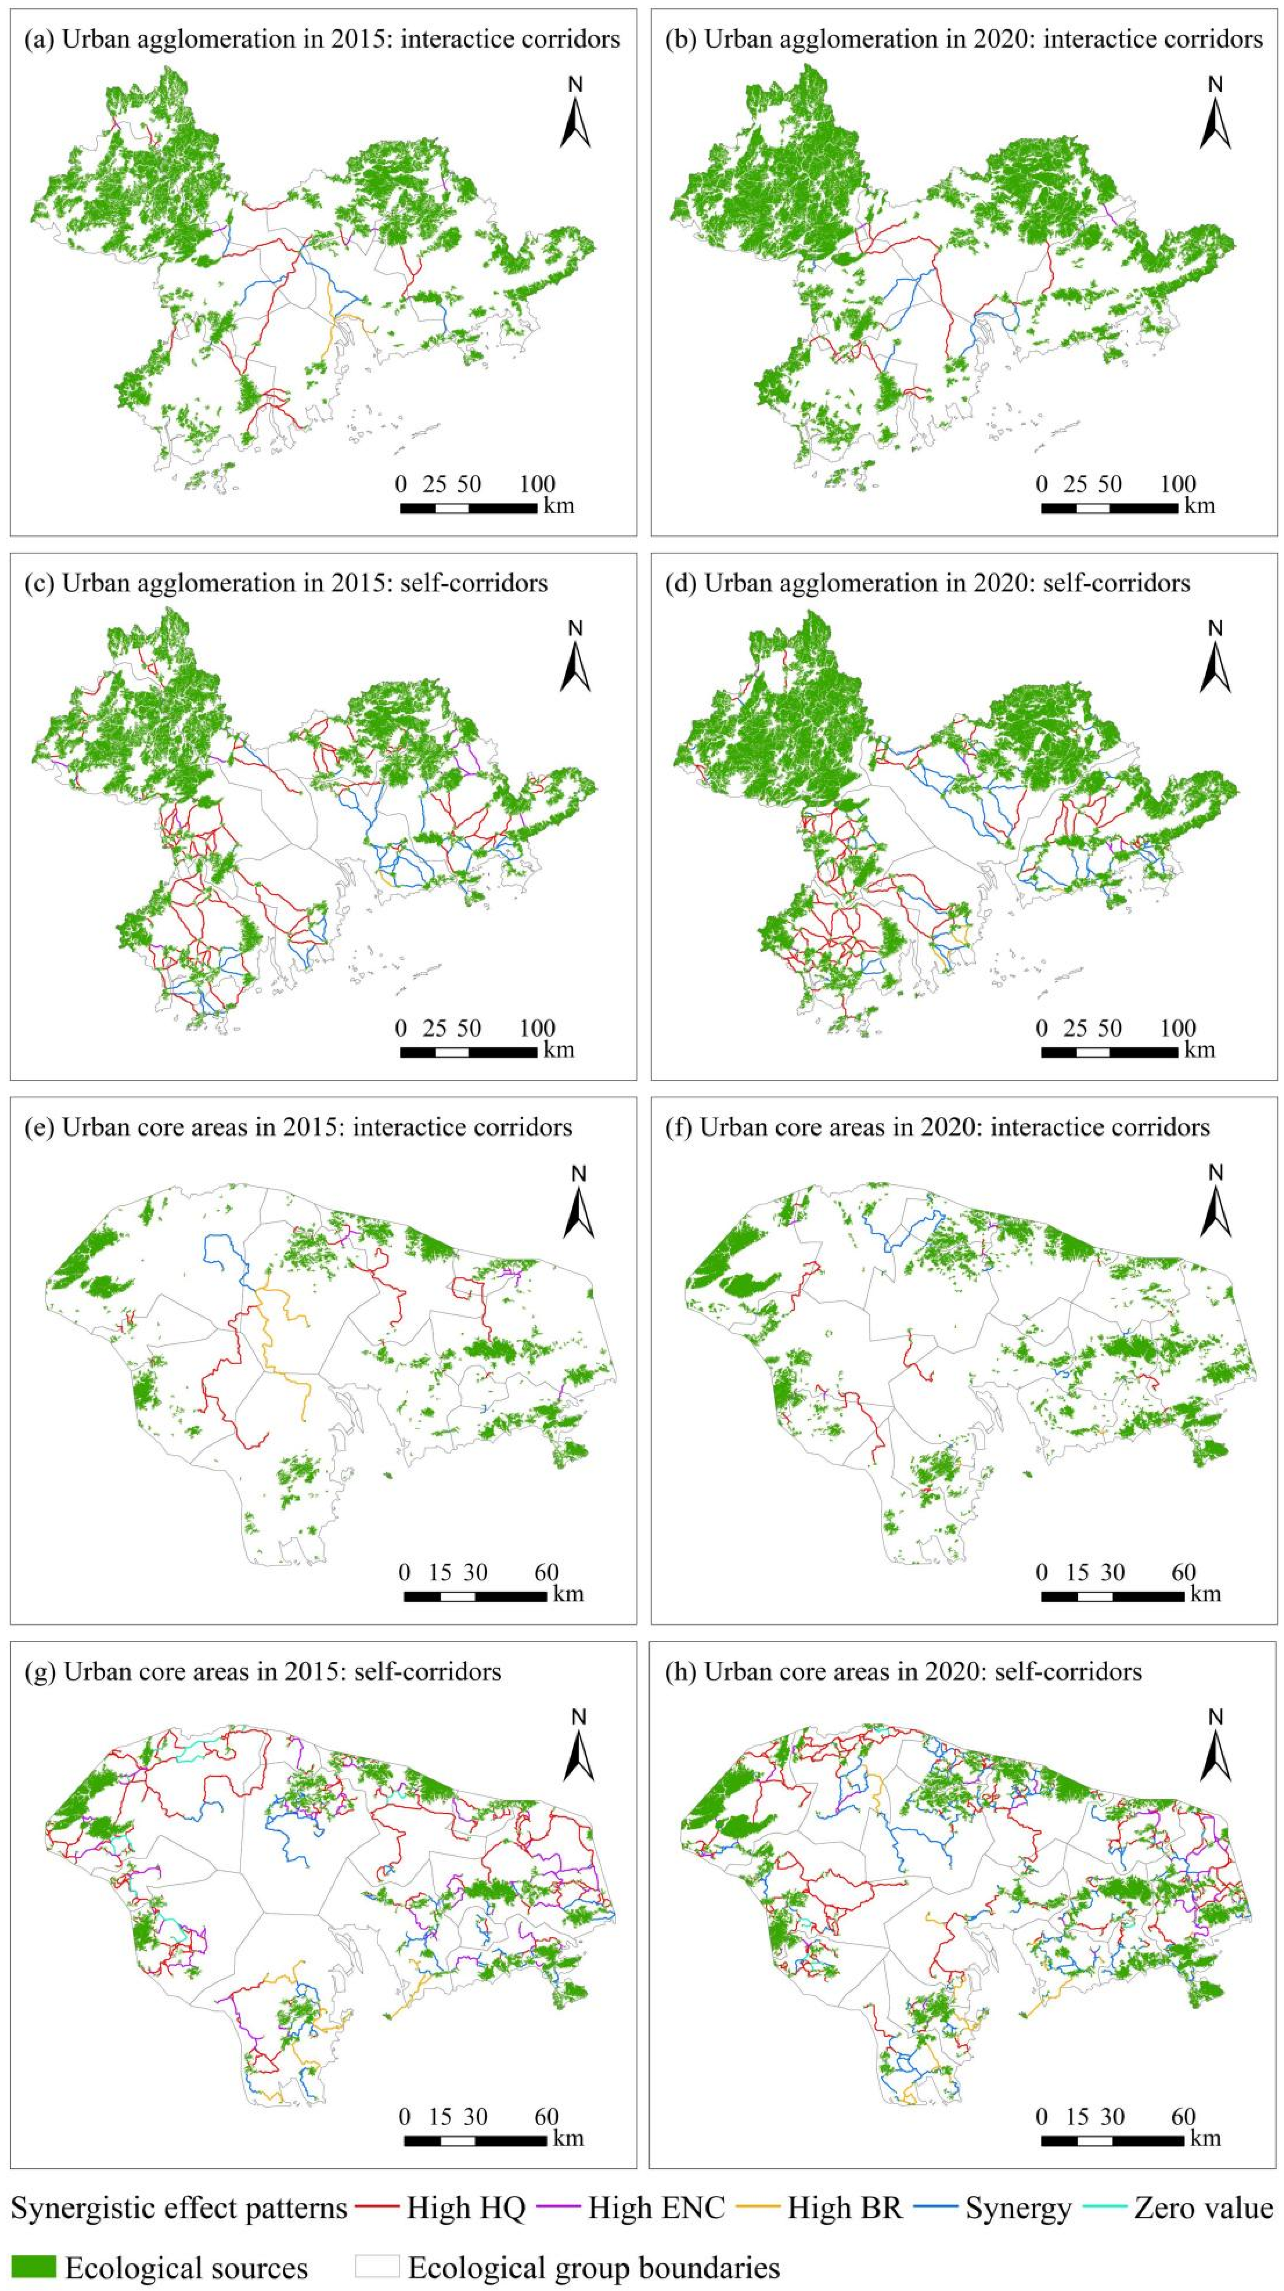
As shown in Figure 8a–h, the four effect patterns in the ecological corridors of both the Pearl River Delta urban agglomeration and urban core areas exhibit similar proportions. The High HQ pattern has the highest proportion, indicating that most corridors focus on habitat quality protection while neglecting ecological connectivity construction. The Synergy pattern comes second, suggesting that some ecological corridors are in a “HQ–ENC–BR” synergy state. The High BR pattern has the lowest proportion (<10%), meaning that very few high bird richness areas are related to both habitat quality and ecological network connectivity. Between 2015 and 2020, the proportion of the Synergy pattern increased overall in the latter stages of the development of the PRDNFUA. This indicates that ecological projects have effectively promoted the positive synergy between HQ, ENC, and BR, which corresponds to the positive synergy revealed by the geographic detector in Table 3.
The interactive corridors in the urban agglomeration are mainly located in the inner areas (Figure 9a,b), while the self-corridors are mainly found in the outer areas (Figure 9c,d). In the urban core areas, interactive corridors are concentrated in the inner areas (Figure 9e,f), while self-corridors are distributed more evenly across the urban core (Figure 9g,h).
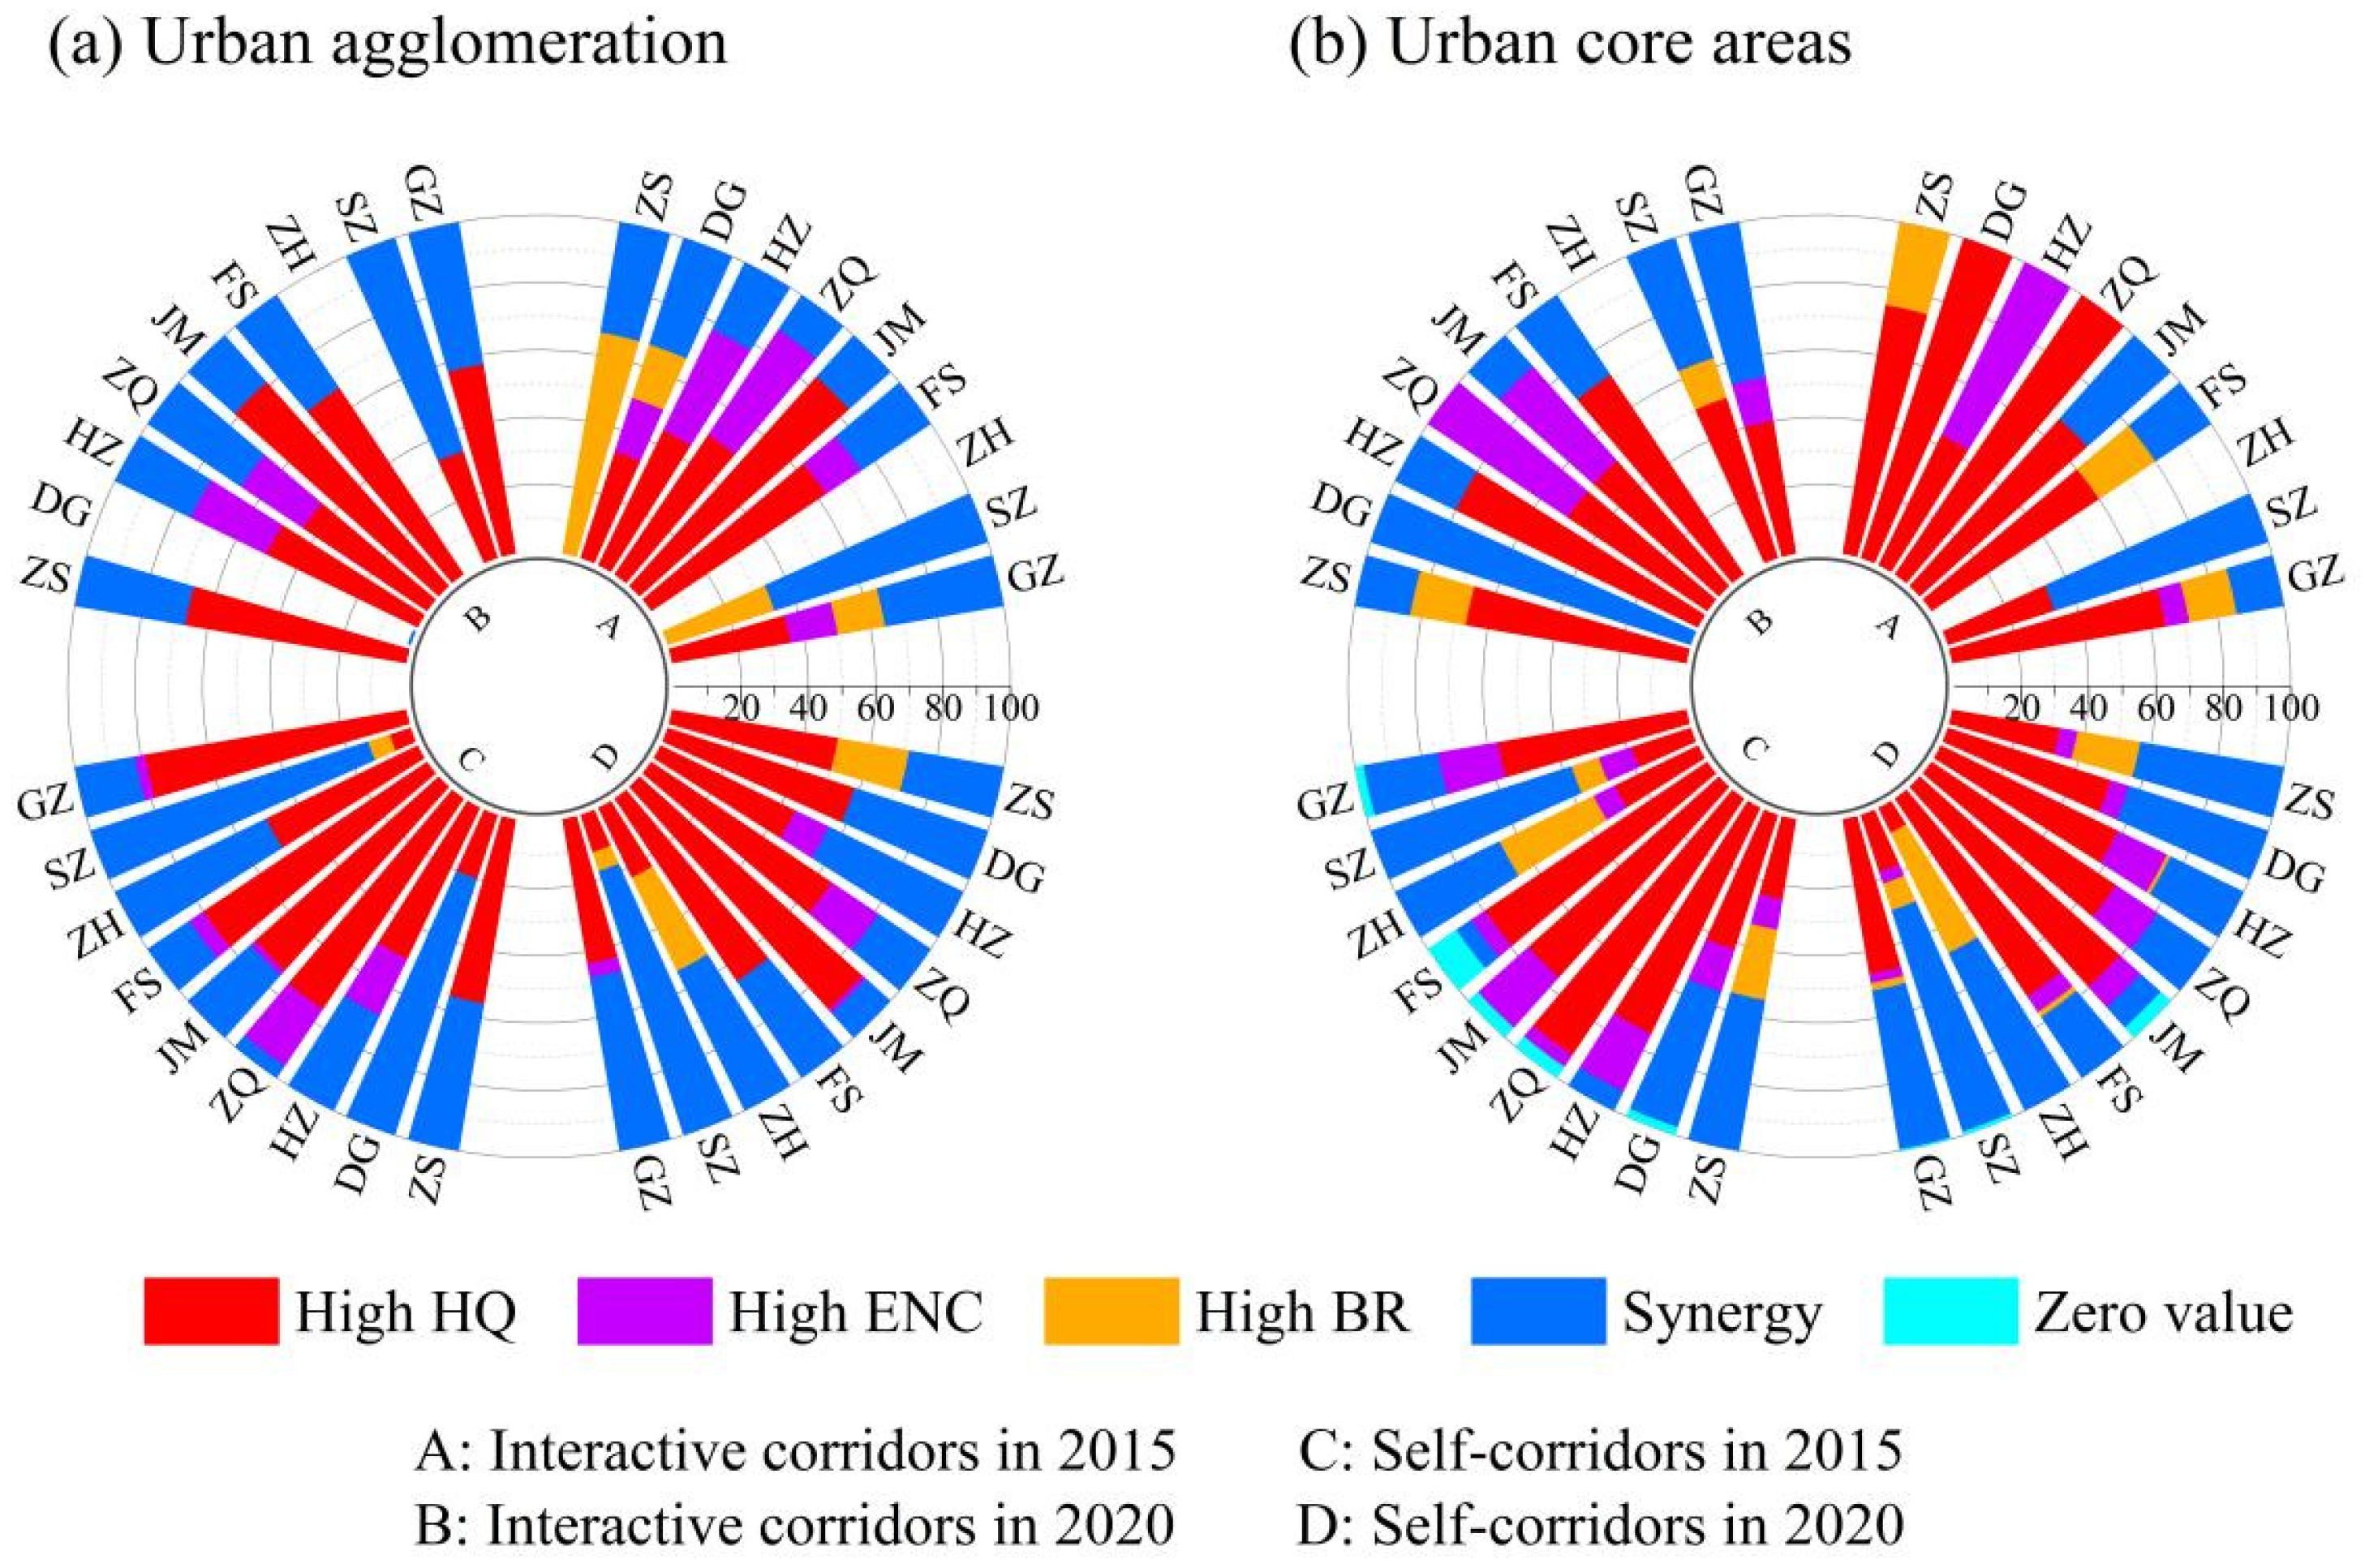
In the urban agglomeration’s interactive corridors, the proportion of the Synergy pattern increased in Guangzhou, Foshan, Jiangmen, Zhaoqing, Huizhou, and Dongguan, while it remained almost unchanged in Shenzhen, Zhuhai, and Zhongshan (Figure 10a). In the urban agglomeration’s self-corridors, the proportion of the Synergy pattern increased in Guangzhou, Foshan, Jiangmen, Zhaoqing, and Huizhou, but decreased in Shenzhen, Zhuhai, Dongguan, and Zhongshan (Figure 10a).
In the urban core areas’ interactive corridors, the proportion of the Synergy pattern increased in Guangzhou, Foshan, Huizhou, Dongguan, and Zhongshan, while it decreased in Shenzhen and Jiangmen, and remained nearly unchanged in Zhuhai and Zhaoqing (Figure 10b). In the urban core areas’ self-corridors, the proportion of the Synergy pattern decreased in Zhongshan, while it increased in the other eight cities (Figure 10b). Additionally, our study found that there are zero-value corridors in the urban core’s self-corridors, and the proportion of these zero-value corridors increased in Shenzhen, while it decreased in Guangzhou, Foshan, Zhaoqing, and Dongguan, and remained stable in Zhuhai, Jiangmen, Huizhou, and Zhongshan (Figure 10b).
Overall, as shown in Figure 10, the “HQ–ENC–BR” synergy increased in the ecological corridors of northern cities in both the urban agglomeration and urban core areas (such as Guangzhou, Foshan, Zhaoqing, and Huizhou), while showing a downward trend in Shenzhen. In Zhuhai, Dongguan, and Zhongshan, the synergy showed an overall downward trend at the urban agglomeration scale but increased at the urban core scale. Jiangmen exhibited the opposite pattern.

4.4. Optimization of Bird Diversity Conservation Network

Although the development of the forest urban agglomeration has strengthened the ecological network structure and bird diversity conservation functions in the Pearl River Delta, issues such as uneven distribution of ecological spaces and incomplete structural connectivity still persist, highlighting the urgent need for further optimization of the ecological network in the region. This study revealed that the synergistic effects of HQ and ENC are key factors enhancing BR in urban agglomerations (Table 3). Accordingly, the Zonation model was applied using the core-area cell removal rule to retain zones with high HQ (HQ > 0.5) during the cell removal process in the 2020 urban agglomeration, while minimizing biodiversity loss. The edge removal rule was also applied to remove cells from the periphery of the remaining landscape, thereby enhancing the connectivity of core areas throughout the removal process.
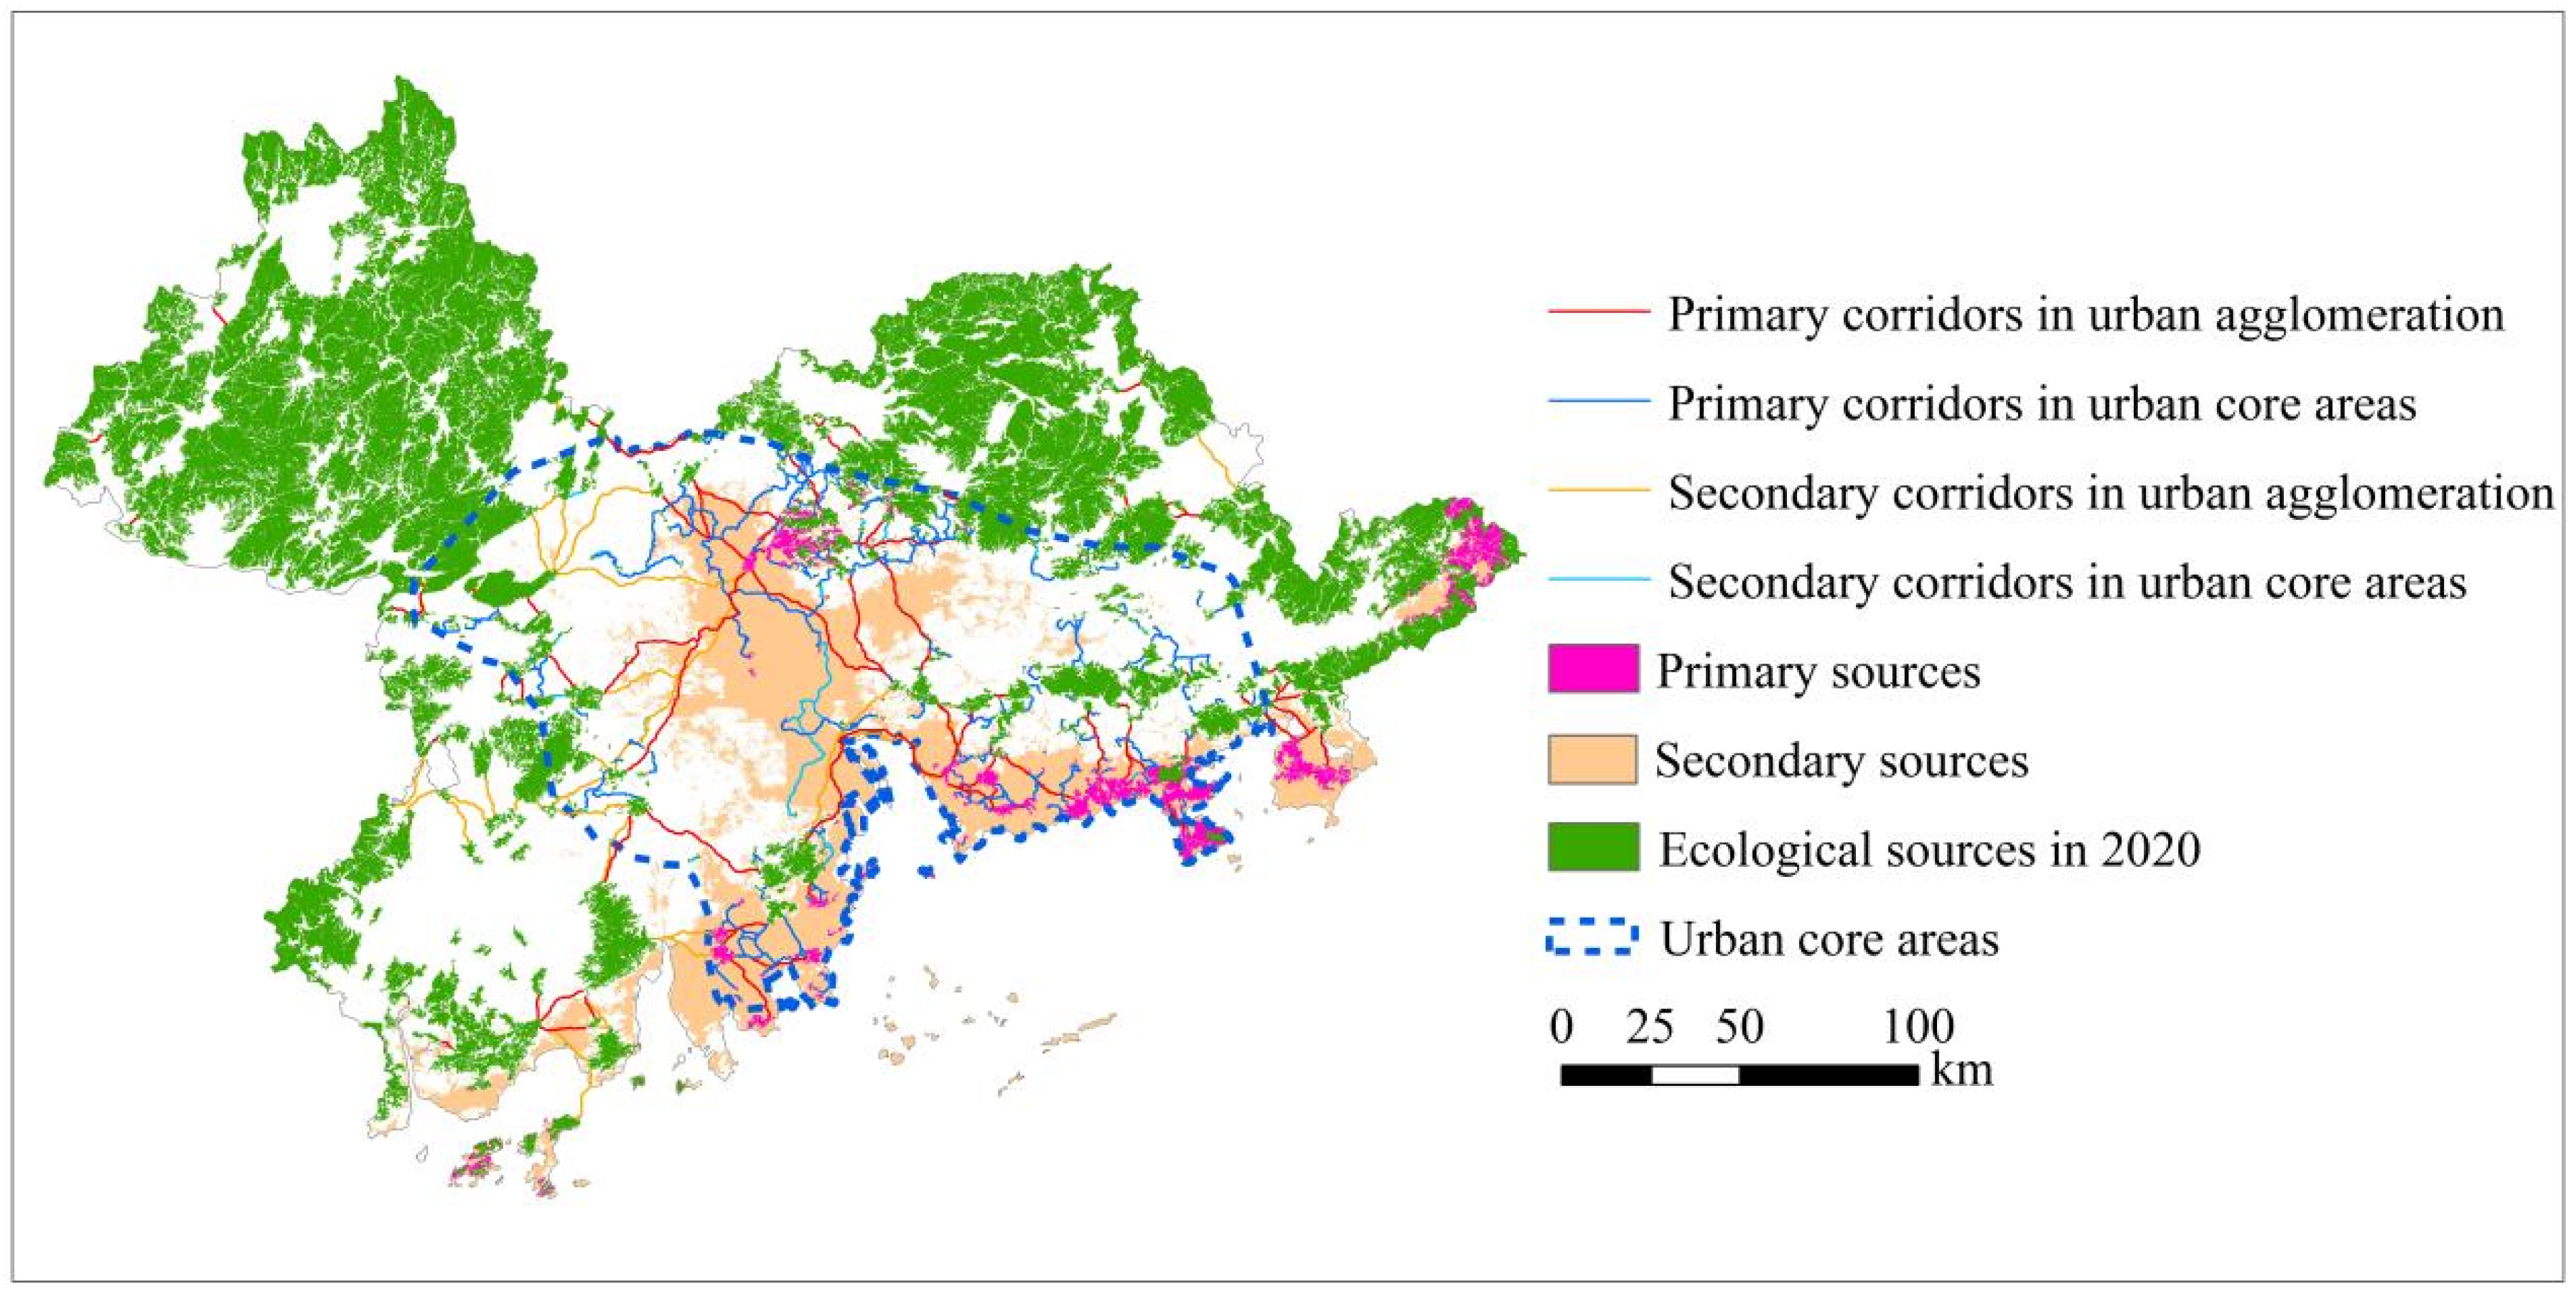
The final identification of priority conservation sources for key bird species within the urban agglomeration showed that these areas were predominantly distributed along the coastal regions of the Pearl River Delta, the Pearl River Estuary, and areas with dense urban water systems (Figure 11). The primary priority conservation sources covered an area of 941 km2, while secondary priority conservation areas spanned 8254.76 km2.
Additionally, this study identified 373 primary priority corridors with a total length of 2549.3 km (Figure 11 and Figure 12a). Given that interactive corridors exhibited stronger synergistic effects than self-corridors (Figure 8), potential interactive corridors were designated as secondary priority corridors, totaling 66 corridors with a combined length of 953.0 km (Figure 11 and Figure 12a). As shown in Figure 12b, no overlapping priority corridors were found between the urban agglomeration and urban core areas in terms of count or total length, though the overlapping area was 4.4 km2, accounting for 2.4% of the total corridor area in the urban agglomeration and 4.3% in the urban core areas. These overlapping corridors serve as critical connectors supporting ecological continuity across scales and require special conservation attention. The overlap between all priority corridors and secondary priority conservation areas (potential sources) was 128.0 km2, accounting for 45.7% of the total corridor area, indicating significant potential for ecological spatial development.
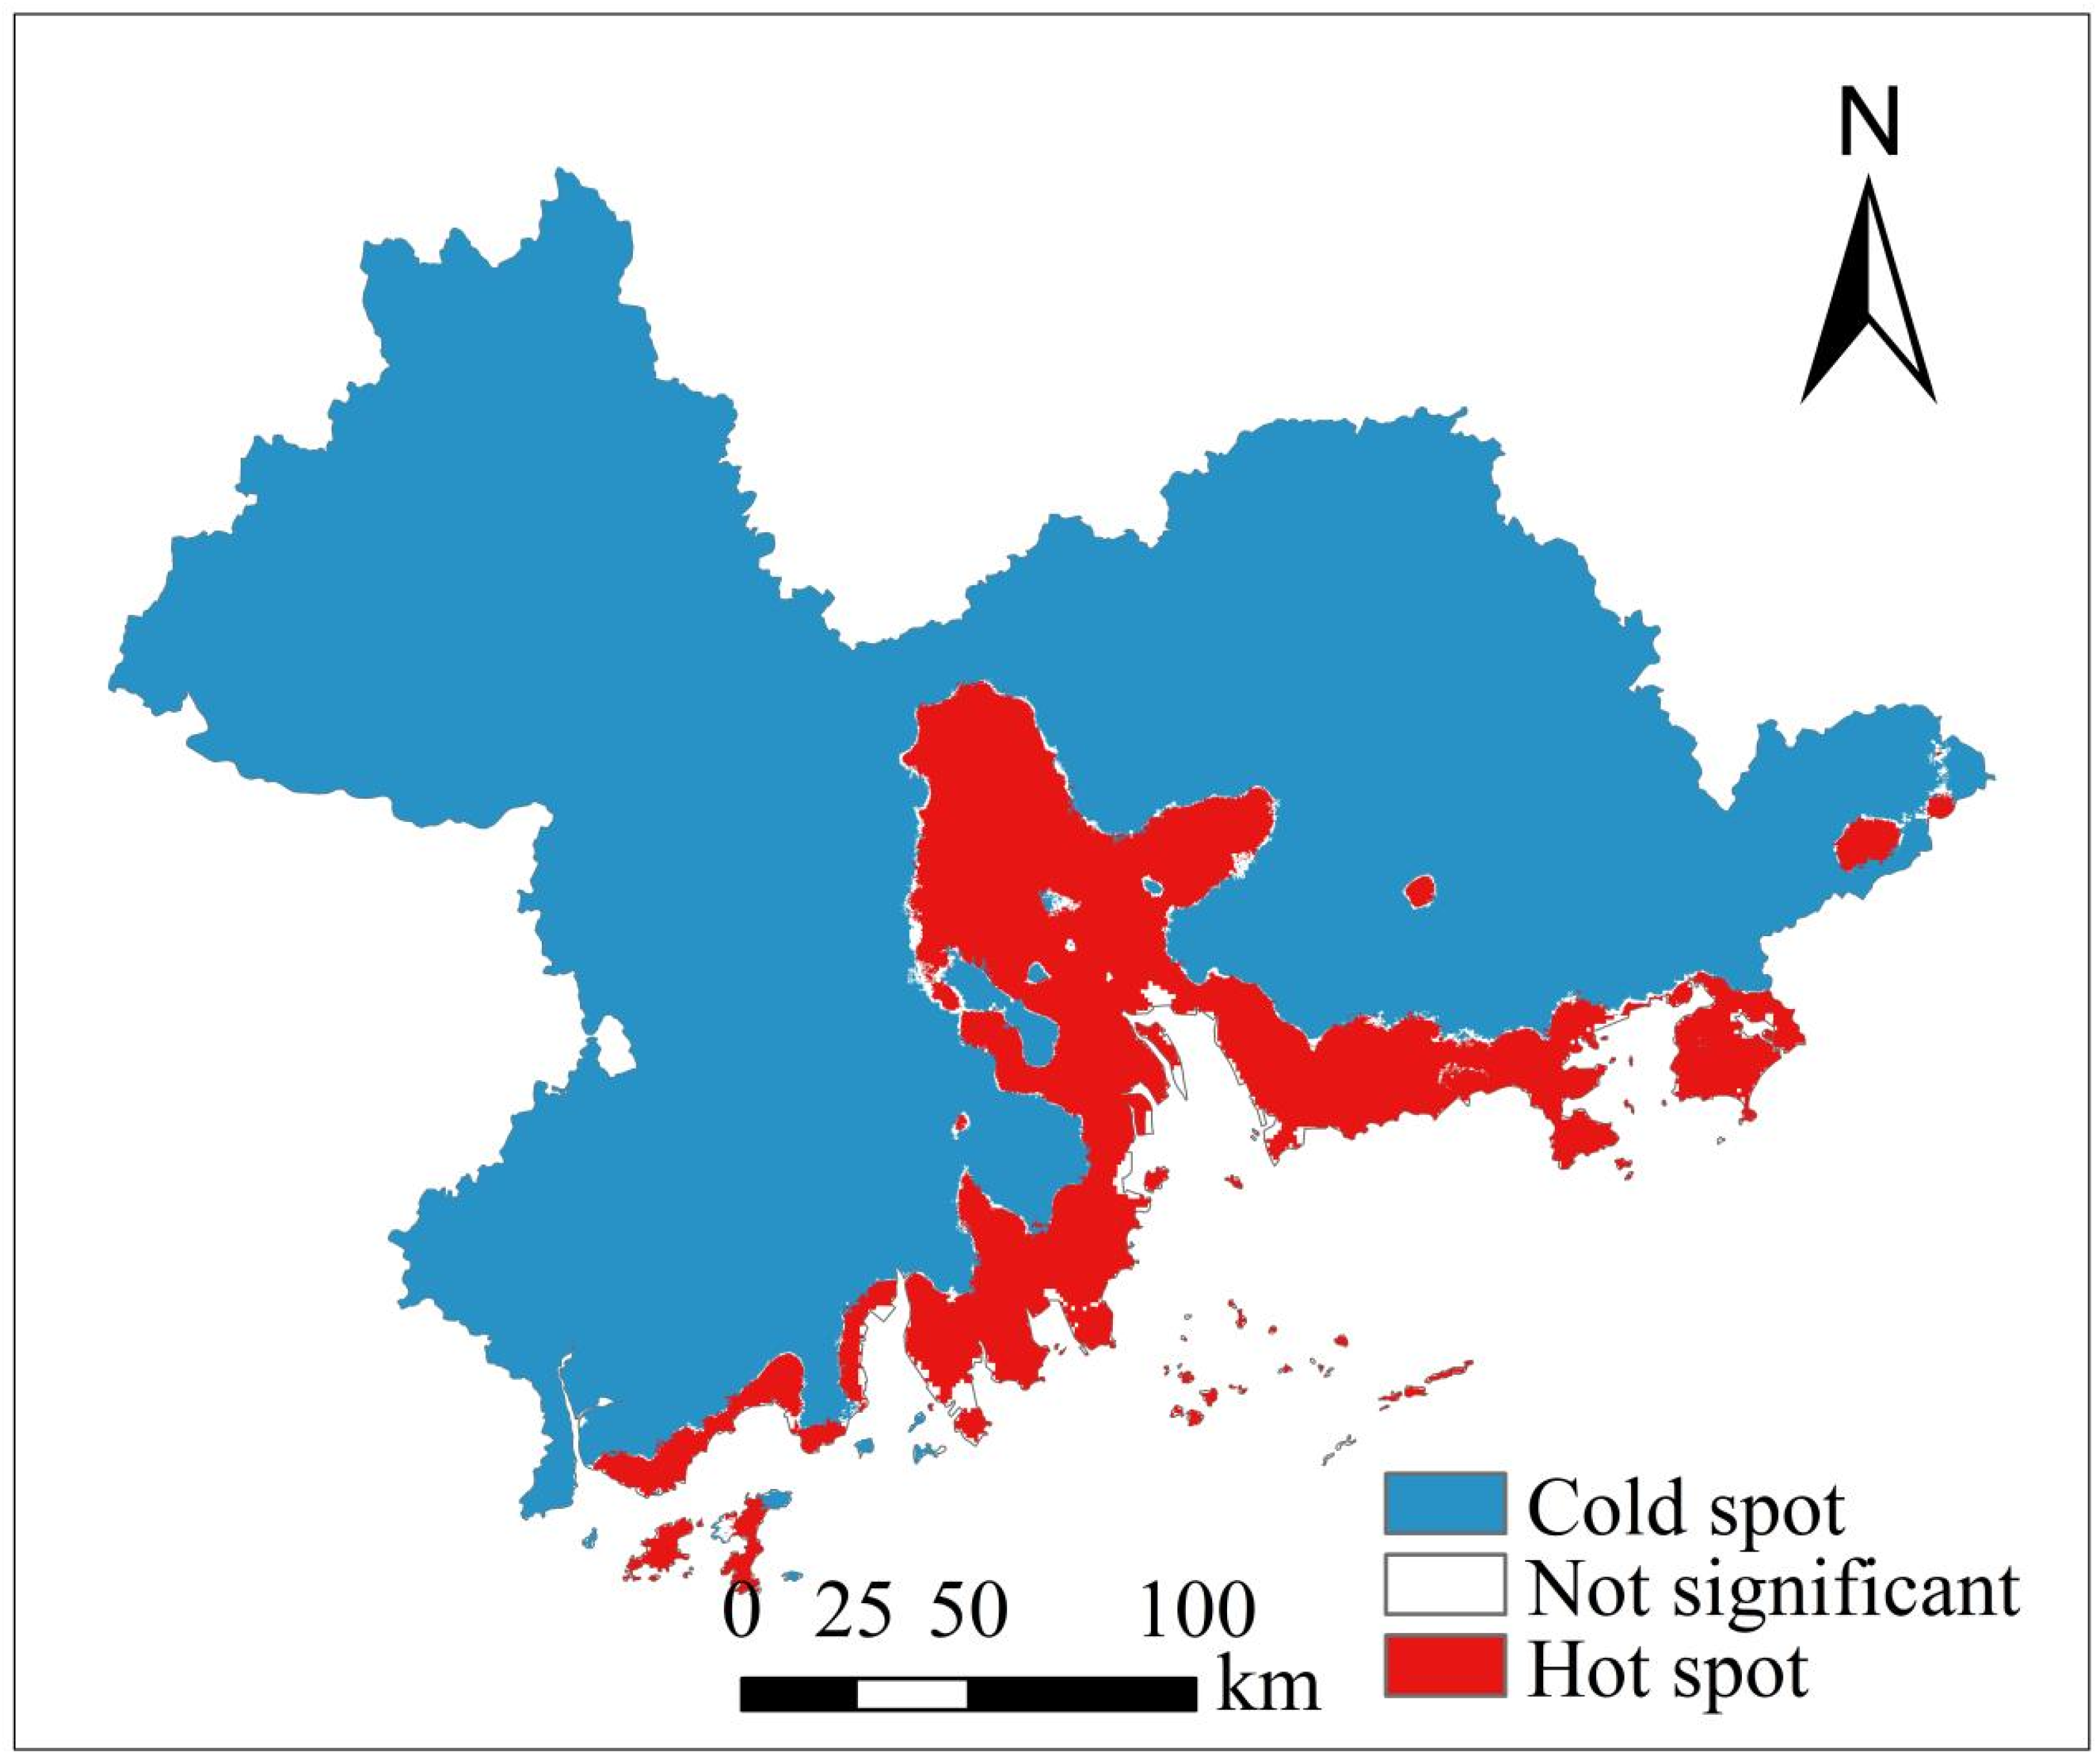
As shown in Figure 13, the area of bird richness hotspots was 8738.74 km2. The overlapping area between these hotspots and ecological sources increased from 9.7% before optimization to 87.9% after optimization, demonstrating that the priority conservation sources identified in this study effectively cover key areas of high bird richness.

5. Discussion

5.1. Evolutionary Trends of the “HQ–ENC–BR” Pattern in the Urban Agglomeration

A comparison of our results with bird occurrence records compiled from field surveys, the literature, and online biodiversity databases reveals strong consistency across sources. Each dataset indicates that bird occurrences in the Pearl River Delta are highly clustered in areas of high ecological quality, such as urban parks, riparian zones along the Pearl River, and coastal areas [35,68,69]. This spatial agreement confirms the reliability and applicability of the filtered GBIF dataset within the study area (GBIF Occurrence Download. Available online: https://doi.org/10.15468/dl.a3ufca, accessed on 12 October 2023).
In this study, bird richness (BR) was used as the core indicator of bird diversity. However, we acknowledge that species richness mainly reflects the “breadth” of diversity, i.e., the number of species, but does not fully capture its “depth,” which includes the distribution patterns of individuals within species (evenness). From a theoretical ecological perspective, diversity indices would be a better choice. However, in macroecological studies at the landscape and regional scales, using species richness derived from occurrence data as a proxy for overall biodiversity patterns is a widely accepted method due to the difficulty of obtaining consistent abundance data [40,70,71]. In many cases, the spatial pattern of species richness is highly correlated with the overall diversity index. That is, areas with higher species richness typically also have higher overall diversity [72,73]. The high habitat quality and strong connectivity of the “priority protection areas” identified in this study are valuable, as they have the potential to provide the necessary living space and ecological processes to maintain healthy population sizes and diversity. These areas contribute to the development of conservation measures to maintain bird diversity.
This study confirms the importance of habitat quality (HQ) and ecological network connectivity (ENC) in influencing urban bird diversity [8,9,10,11,12]. The positive synergistic effect of “HQ–ENC–BR” in the Pearl River Delta is largely attributed to the region’s efforts in forest city construction. Between 2015 and 2020, the Pearl River Delta implemented key projects such as forest quality improvement, precise forest quality enhancement, and pure forest restoration, which improved the quality of ecological spaces in artificial and degraded forests. Additionally, the PRDNFUA emphasized the construction of regional biological corridors, creating forest communities and migration corridors between cities. This has linked mountain forests in the northern areas of Guangzhou with those in Zhaoqing, Jiangmen, Huizhou, and Shenzhen. Our findings are consistent with the objectives outlined in the “Overall Planning for the Construction of the Pearl River Delta National Forest Urban Agglomeration (2016–2025),” which aims to establish ecological barriers in the northern mountainous areas and coastal protection in the south [25]. This validates the spatial effectiveness and practical feasibility of the PRDNFUA construction project in terms of bird habitat area, quality, connectivity, bird richness, and the synergistic effects of “HQ–ENC–BR.”
In the Pearl River Delta, the negative correlation between habitat connectivity (ENC) and bird richness (BR) may be attributed to factors such as bird dispersal abilities, resource needs, habitat quality, fragmentation, and niche competition. Low connectivity creates migration barriers, leading to lower species richness [74]. On the other hand, high connectivity may promote bird migration from high-diversity areas (sources) to low-diversity areas (sinks), which is consistent with wildlife migration theory [75]. However, excessive connectivity can lead to the over-concentration of species, increasing competition for resources and suppressing diversity, especially in high-density regions with limited resources [76]. Additionally, habitat fragmentation and high connectivity may co-occur, where overly connected habitats restrict species distribution and resource availability, further reducing species richness [76].

5.2. Advantages of the Ternary Plot Analysis for “HQ–ENC–BR”

The development of the PRDNFUA has reconfigured both HQ and ENC across ecological sources, resulting in a coupled shift in these variables. Building on insights from the geographical detector analysis, which revealed the dual influence of HQ and ENC on BR, this study introduced an analytical framework to examine “HQ–ENC–BR” synergy through the lens of ecological groups and their associated corridors. This framework offers two major contributions:
(1)
Introduction of interactive indicators and self-corridor indicators. Conventional corridor analyses tend to overlook ecological heterogeneity [7,17]. By differentiating between interactive and self-corridors, our approach allows a more nuanced interpretation of how corridor quality and connectivity influence bird richness. This helps elucidate functional variations within ecological networks across scales and hierarchical levels.
(2)
Application of ternary plot-based clustering for synergy mapping. Ternary plots provide an effective means of detecting nonlinear synergies among heterogeneous variables. This study categorized “HQ–ENC–BR” relationships into four distinct patterns: High HQ, High ENC, High BR, and Synergy [63,64]. Coupled with the corridor typology, this method revealed spatiotemporal variations in synergy clusters and supported the identification of optimal zones for conservation interventions.
Compared to traditional coupling coordination models [18], our approach more effectively incorporates spatiotemporal dynamics of factor weights [77] and captures ecological complexity through network-based analysis. This demonstrates the significant advantage of ternary plotting for large-scale ecological network evaluation. In particular, ternary plots serve as a powerful visual tool for prioritizing ecological restoration actions and offer a scientific foundation for optimizing ecological network planning.

5.3. Limitations and Future Research

Although this study offers valuable insights into optimizing bird diversity conservation networks in the PRDNFUA, several limitations should be acknowledged. Future research could address the following aspects:
(1)
Expanded indicator system. This study relied primarily on BR, HQ, and the dPC index as core indicators. While these are representative and practical, they do not fully encompass broader ecological functions. This study relied on species richness data; instead, diversity data could give a different picture of the independent and synergistic effects of habitat quality and ecological network connectivity, as well as priority conservation sources and corridors. Future studies could integrate additional metrics such as ecosystem services, urban ecological resilience, and habitat multifunctionality to better align with the United Nations Sustainable Development Goals and enable more holistic urban biodiversity assessment and conservation.
(2)
Incorporation of urban environmental and species-specific factors. The current framework did not account for key urban environmental variables such as microclimate, wind patterns, and air pollution that increasingly affect bird habitats under rapid urbanization and climate change. Furthermore, the assumption of uniform dispersal capacity across all bird species overlooks species-specific sensitivities to HQ and ENC. Future research should incorporate urban environmental drivers and species-specific functional traits to develop more resilient and tailored conservation strategies, thereby enabling fine-scale management and precision restoration of urban ecological networks.

6. Conclusions

This study established a research framework to examine the evolution of bird diversity patterns within a stratified ecological network of forest urban agglomerations and urban core areas. Geographic detectors revealed that habitat quality and ecological network connectivity exert a positive synergistic influence on bird diversity. Ternary plots were then used to quantify and visualize the spatiotemporal dynamics of the “HQ–ENC–BR” synergy corridors during ecological construction projects. The results demonstrate that the PRDNFUA project effectively enhanced positive “HQ–ENC–BR” synergy within the urban agglomeration and interactive corridors. However, the Pearl River Estuary and coastal areas, which are critical habitats for bird conservation, remain insufficiently covered by the ecological network. The optimized network identified in this study overlaps with bird diversity hotspots by 78.2%, highlighting its importance for avian conservation in the region. Overall, the integrated multi-scale framework, which combines spatial analysis, synergy assessment, and visualization, provides solid scientific support for urban biodiversity conservation.

Author Contributions

Conceptualization, N.B., T.H. and Y.F.; methodology, N.B., T.H. and Y.F.; software, N.B. and T.H.; validation, N.B.; formal analysis, N.B.; investigation, N.B.; resources, N.B.; data curation, N.B., T.H. and J.S.; writing—original draft preparation, N.B. and T.H.; writing—review and editing, N.B., Y.F. and D.Z.; visualization, N.B. and S.Z.; supervision, Y.F. and Z.Y.; project administration, Y.F.; funding acquisition, Y.F. All authors have read and agreed to the published version of the manuscript.

Funding

This work was supported by the National Natural Science Foundation of China (Grant No. 42071399) and Basic and Applied Basic Research Foundation of Guangdong Province (Grant No. 2025A1515011807).

Data Availability Statement

The data that support the findings of this study are available on request from the corresponding author.

Acknowledgments

We would like to acknowledge Min Wang from the State Key Laboratory of Resources and Environmental Information System, Institute of Geographic Sciences and Natural Resources Research, Chinese Academy of Sciences, Beijing 100101, China and the University of Chinese Academy of Sciences, Beijing 100049, China. We are particularly grateful for her provision of the preliminary dataset, her intellectual input in shaping the initial research concept, and her support in securing the project funding.

Conflicts of Interest

The authors declare no conflicts of interest.

References

  1. IPBES. Global Assessment Report on Biodiversity and Ecosystem Services; IPBES/7/10/Add.1; Intergovernmental Science-Policy Platform on Biodiversity and Ecosystem Services: Bonn, Germany, 2019. [Google Scholar]
  2. Monaco, S. SDG 15: Protect, restore, and promote sustainable use of terrestrial ecosystems, sustainably manage forests, combat desertification, halt and reverse land degradation, and halt biodiversity loss. In Identity, Territories, and Sustainability: Challenges and Opportunities for Achieving the UN Sustainable Development Goals; Emerald Publishing Limited: Leeds, UK, 2024; pp. 145–155. [Google Scholar]
  3. United Nations Economic and Social Commission for Asia and the Pacific (ESCAP). SDG 11: Sustainable Cities and Communities: Make Cities and Human Settlements Inclusive, Safe, Resilient and Sustainable; United Nations Economic and Social Commission for Asia and the Pacific (ESCAP): Bangkok, Thailand, 2018. [Google Scholar]
  4. Xie, J.; Xie, B.; Zhou, K.; Li, J.; Xiao, J.; Liu, C.; Zhang, X. Evolution of bird habitat quality driving mechanisms and ecological network weights. Glob. Ecol. Conserv. 2023, 46, e02618. [Google Scholar] [CrossRef]
  5. Li, X.; Ou, X.; Sun, X.; Li, H.; Li, Y.; Zheng, X. Urban biodiversity conservation: A framework for ecological network construction and priority areas identification considering habit differences within species. J. Environ. Manag. 2024, 365, 121512. [Google Scholar] [CrossRef] [PubMed]
  6. Ding, G.Q.; Yi, D.; Yi, J.L.; Guo, J.; Ou, M.H.; Ou, W.X.; Tao, Y.; Pueppke, S.G. Protecting and constructing ecological corridors for biodiversity conservation: A framework that integrates landscape similarity assessment. Appl. Geogr. 2023, 160, 103098. [Google Scholar] [CrossRef]
  7. Chen, R.N.; Carruthers-Jones, J.; Carver, S.; Wu, J.Y. Constructing urban ecological corridors to reflect local species diversity and conservation objectives. Sci. Total Environ. 2024, 907, 167987. [Google Scholar] [CrossRef]
  8. Wang, X.; Ren, Z.; Wang, C.; Dong, Y.; Guo, Y.; Zhang, P.; Hong, S.; Ma, Z.; Hong, W. Changes in spatio-temporal patterns of urban habitat quality and their associations with bird species diversity under China’s rapid urban expansion. Landsc. Ecol. 2025, 40, 144. [Google Scholar] [CrossRef]
  9. Yang, H.; Zhang, H.; Wang, Y.; Jia, X.; Hao, L.; Jin, K.; Song, J. Urban bird diversity conservation plan based on the MaxEnt model and InVEST model: A case study of Jinan, China. Ecol. Indic. 2025, 174, 113463. [Google Scholar] [CrossRef]
  10. Salgueiro, P.A.; Valerio, F.; Silva, C.; Mira, A.; Rabaca, J.E.; Santos, S.M. Multispecies landscape functional connectivity enhances local bird species’ diversity in a highly fragmented landscape. J. Environ. Manag. 2021, 284, 112066. [Google Scholar] [CrossRef]
  11. Shen, Z.; Yin, H.; Su, J.; Sun, H.; Gai, Z.; Liu, H. Assessing connectivity contributions of urban green spaces for avian species conservation: Insights of a surrogate approach in Nanjing. Urban For. Urban Green. 2025, 105, 128687. [Google Scholar] [CrossRef]
  12. Yu, H.; Xiao, H.; Gu, X. Impact of urban environmental matrices on bird diversity: Mediating effects and ecological thresholds. Appl. Geogr. 2025, 174, 103476. [Google Scholar] [CrossRef]
  13. Shen, Z.; Wu, W.; Tian, S.; Wang, J. A multi-scale analysis framework of different methods used in establishing ecological networks. Landsc. Urban Plan. 2022, 228, 104579. [Google Scholar] [CrossRef]
  14. Wu, J.; Zhang, S.; Wen, H.; Fan, X. Research on Multi-Scale Ecological Network Connectivity-Taking the Guangdong-Hong Kong-Macao Greater Bay Area as a Case Study. Int. J. Environ. Res. Public Health 2022, 19, 15268. [Google Scholar] [CrossRef]
  15. Vieira, M.V.; Almeida-Gomes, M.; Delciellos, A.C.; Cerqueira, R.; Crouzeilles, R. Fair tests of the habitat amount hypothesis require appropriate metrics of patch isolation: An example with small mammals in the Brazilian Atlantic Forest. Biol. Conserv. 2018, 226, 264–270. [Google Scholar] [CrossRef]
  16. Maseko, M.S.T.; Zungu, M.M.; Ehlers Smith, D.A.; Ehlers Smith, Y.C.; Downs, C.T. Effects of habitat-patch size and patch isolation on the diversity of forest birds in the urban-forest mosaic of Durban, South Africa. Urban Ecosyst. 2020, 23, 533–542. [Google Scholar] [CrossRef]
  17. Luo, Y.; Wu, J.; Wang, X.; Zhao, Y.; Feng, Z. Understanding ecological groups under landscape fragmentation based on network theory. Landsc. Urban Plan. 2021, 210, 104066. [Google Scholar] [CrossRef]
  18. Yin, H.; Xiao, R.; Fei, X.; Zhang, Z.; Gao, Z.; Wan, Y.; Tan, W.; Jiang, X.; Cao, W.; Guo, Y. Analyzing “economy-society-environment” sustainability from the perspective of urban spatial structure: A case study of the Yangtze River delta urban agglomeration. Sustain. Cities Soc. 2023, 96, 104691. [Google Scholar] [CrossRef]
  19. Yang, R.; Liu, R. Functional evolution and collaboration/trade-off relationship of urban agriculture in the Pearl River Delta urban agglomeration. Geogr. Res. 2022, 41, 1995–2015. [Google Scholar] [CrossRef]
  20. Aznarez, C.; Svenning, J.-C.; Taveira, G.; Baro, F.; Pascual, U. Wildness and habitat quality drive spatial patterns of urban biodiversity. Landsc. Urban Plan. 2022, 228, 104570. [Google Scholar] [CrossRef]
  21. Gu, Z.; Gong, J.; Wang, Y. Construction and evaluation of ecological networks among natural protected areas based on “quality-structure-function”: A case study of the Qinghai-Tibet area. Ecol. Indic. 2023, 151, 110228. [Google Scholar] [CrossRef]
  22. Mu, H.; Guo, S.; Li, X.; Zhou, Y.; Lu, Y.; Du, X.; Huang, J.; Ma, C.; Zhang, X.; Xia, Z.; et al. Quantifying landscape connectivity gaps between protected area and natural habitat. J. Clean. Prod. 2024, 437, 140729. [Google Scholar] [CrossRef]
  23. Jiang, H.; Peng, J.; Liu, M.; Dong, J.; Ma, C. Integrating patch stability and network connectivity to optimize ecological security pattern. Landsc. Ecol. 2024, 39, 54. [Google Scholar] [CrossRef]
  24. Li, Z.; Zhan, G.; Guo, Q.; Feng, C.; Zhang, C. Construction Concept and Strategy of National Forest City Cluster in Pearl River Delta. For. Inventory Plan. 2019, 44, 194–199+205. [Google Scholar] [CrossRef]
  25. Guangdong Forestry Department. Master Plan for the Construction of the National Forest Urban Agglomeration in the Pearl River Delta (2016–2025)—Approval Version; Guangdong Forestry Department: Guangzhou, China, 2017. (In Chinese) [Google Scholar]
  26. Bi, M.; Xie, G.; Yao, C. Ecological security assessment based on the renewable ecological footprint in the Guangdong-Hong Kong-Macao Greater Bay Area, China. Ecol. Indic. 2020, 116, 106432. [Google Scholar] [CrossRef]
  27. Yang, X.; Liu, W.; Li, S.; Ma, Z.; Chen, C.; Gu, W.; Qu, M.; Zhang, C.; Tao, J.; Ding, Z.; et al. Restoration of urban waterbird diversity: A case study of the construction of a waterbird ecological corridor in the Guangdong-Hong Kong-Macao Greater Bay Area, Southern China. Glob. Ecol. Conserv. 2022, 39, e02277. [Google Scholar] [CrossRef]
  28. Chen, C.; Zhang, Q.; Yang, X.; Li, R.; Xin, C. Habitat Quality Assessment of Waterfowl Ecological Corridors in the Pearl River Delta Based on InVEST Model. For. Environ. Sci. 2021, 37, 25–30. [Google Scholar] [CrossRef]
  29. Chen, H.; Yang, K.; Wang, J.; Qin, L. The Characteristics and High-Quality Development Strategies of the Pearl River Delta Forest City Agglomeration Construction. For. Grassl. Resour. Res. 2024, 2, 149–154. [Google Scholar] [CrossRef]
  30. Convention on Biological Diversity. First draft of the post-2020 global biodiversity framework (CBD/WG2020/3/3). In Proceedings of the Open Ended Working Group on The Post-2020 Global Biodiversity Framework Third Meeting, Online, 23 August–3 September 2021. [Google Scholar]
  31. Fu, B.; Liu, Y.; Zhao, W.; Wu, J. The emerging “pattern-process-service-sustainability” paradigm in landscape ecology. Landsc. Ecol. 2025, 40, 54. [Google Scholar] [CrossRef]
  32. Zhang, X.; Liu, L.; Chen, X.; Gao, Y.; Xie, S.; Mi, J. GLC_FCS30: Global land-cover product with fine classification system at 30 m using time-series Landsat imagery. Earth Syst. Sci. Data Discuss. 2021, 13, 2753–2776. [Google Scholar] [CrossRef]
  33. Zhang, Z.M.; Peng, J.; Xu, Z.H.; Wang, X.Y.; Meersmans, J. Ecosystem services supply and demand response to urbanization: A case study of the Pearl River Delta, China. Ecosyst. Serv. 2021, 49, 101274. [Google Scholar] [CrossRef]
  34. National Forestry and Grassland Administration. National Action Plan for the Protection of Bird Migration Channels (2021–2035); National Forestry and Grassland Administration: Beijing, China, 2021. [Google Scholar]
  35. Forest Administration of Guangdong Province. Waterbird Ecological Corridor Construction Plan in the Pearl River Delta Region (2020–2025); Forest Administration of Guangdong Province: Guangzhou, China, 2020. Available online: https://lyj.gd.gov.cn/government/Information/plan/content/post_3045912.html (accessed on 13 April 2025). (In Chinese)
  36. Zhao, M.; Cheng, C.; Zhou, Y.; Li, X.; Shen, S.; Song, C. A global dataset of annual urban extents (1992–2020) from harmonized nighttime lights. Earth Syst. Sci. Data 2021, 14, 517–534. [Google Scholar] [CrossRef]
  37. Wei, S.; Yu, T.; Ji, P.; Xiao, Y.; Li, X.; Zhang, N.; Liu, Z. Analysis on Ecological Network Pattern Changes in the Pearl River Delta Forest Urban Agglomeration from 2000 to 2020. Remote Sens. 2024, 16, 3800. [Google Scholar] [CrossRef]
  38. Soille, P.; Vogt, P. Morphological segmentation of binary patterns. Pattern Recognit. Lett. 2009, 30, 456–459. [Google Scholar] [CrossRef]
  39. García-Peña, G.E.; Rubio, A.V.; Mendoza, H.; Fernández, M.; Milholland, M.T.; Aguirre, A.A.; Suzán, G.; Zambrana-Torrelio, C. Land-use change and rodent-borne diseases: Hazards on the shared socioeconomic pathways. Philos. Trans. R. Soc. B 2021, 376, 20200362. [Google Scholar] [CrossRef]
  40. Sun, B.; Lu, Y.; Yang, Y.; Yu, M.; Yuan, J.; Yu, R.; Bullock, J.; Stenseth, N.; Li, X.; Cao, Z.; et al. Urbanization affects spatial variation and species similarity of bird diversity distribution. Sci. Adv. 2022, 8, eade3061. [Google Scholar] [CrossRef]
  41. Zhu, K.; Song, Y.L.; Lesage, J.C.; Luong, J.C.; Bartolome, J.W.; Chiariello, N.R.; Dudney, J.; Field, C.B.; Hallett, L.M.; Hammond, M.; et al. Rapid shifts in grassland communities driven by climate change. Nat. Ecol. Evol. 2024, 8, 2252–2264. [Google Scholar] [CrossRef]
  42. Pearson, R.G.; Raxworthy, C.J.; Nakamura, M.; Peterson, A.T. Predicting species distributions from small numbers of occurrence records: A test case using cryptic geckos in Madagascar. J. Biogeogr. 2007, 34, 102–117. [Google Scholar] [CrossRef]
  43. Hu, J.; Hu, H.; Jiang, Z. The impacts of climate change on the wintering distribution of an endangered migratory bird. Oecologia 2010, 164, 555–565. [Google Scholar] [CrossRef] [PubMed]
  44. Jiang, L.; Gao, J.; Wan, J. Potential habitat and priority protection area of cranes with climate change in the Great Xing’an Mountains, China. Chin. J. Appl. Ecol. 2019, 30, 2457–2469. [Google Scholar] [CrossRef]
  45. Fu, A.; Gao, E.; Tang, X.; Liu, Z.; Hu, F.; Zhan, Z.; Wang, J.; Luan, X. MaxEnt Modeling for Predicting the Potential Wintering Distribution of Eurasian Spoonbill (Platalea leucorodia) under Climate Change in China. Animals 2023, 13, 856. [Google Scholar] [CrossRef] [PubMed]
  46. Phillips, S.J.; Anderson, R.P.; Dudik, M.; Schapire, R.E.; Blair, M.E. Opening the black box: An open-source release of Maxent. Ecography 2017, 40, 887–893. [Google Scholar] [CrossRef]
  47. Yang, J.; Guan, X.; Li, J.; Liu, J.; Hao, H.; Wang, H. Spatial Patterns and Interrelationships Between Biodiversity and Ecosystem Services in the Wujiang River Basin; Chinese Research Academy of Environmental Sciences: Beijing, China, 2023. [Google Scholar]
  48. Sun, Z.; Lu, S. Influence of Beijing Suburban Railway on Bird Habitat Connectivity in Rural Areas and Optimization Thereof. Landsc. Archit. 2023, 30, 50–57. [Google Scholar] [CrossRef]
  49. Jimenez-Valverde, A.; Lobo, J.M. Threshold criteria for conversion of probability of species presence to either-or presence-absence. Acta Oecol. 2007, 31, 361–369. [Google Scholar] [CrossRef]
  50. Zhang, D.; Wang, X.; Qu, L.; Li, S.; Lin, Y.; Yao, R.; Zhou, X.; Li, J. Land use/cover predictions incorporating ecological security for the Yangtze River Delta region, China. Ecol. Indic. 2020, 119, 106841. [Google Scholar] [CrossRef]
  51. Zhu, C.; Zhang, X.; Zhou, M.; He, S.; Gan, M.; Yang, L.; Wang, K. Impacts of urbanization and landscape pattern on habitat quality using OLS and GWR models in Hangzhou, China. Ecol. Indic. 2020, 117, 106654. [Google Scholar] [CrossRef]
  52. Wu, L.; Sun, C.; Fan, F. Estimating the Characteristic Spatiotemporal Variation in Habitat Quality Using the InVEST Model—A Case Study from Guangdong-Hong Kong-Macao Greater Bay Area. Remote Sens. 2021, 13, 1008. [Google Scholar] [CrossRef]
  53. Zheng, J.; Xie, B.; You, X. Spatio-temporal characteristics of habitat quality based on land-use changes in Guangdong Province. Acta Ecol. Sin. 2022, 42, 6997–7010. [Google Scholar] [CrossRef]
  54. Zhang, Y. Study on the Coupling Construction and Optimization of City-Downtown Ecological Network—A Case Study of Changsha. Master’s Thesis, Nanjing University, Nanjing, China, 2019. [Google Scholar]
  55. Zhou, Y.; Chen, M.; Li, B.; Li, P.; Yu, J.; Chen, J. Optimization of Urban Green Space Ecological Network Based on Dynamic Change of Spatial Connectivity. J. Chin. Urban For. 2023, 21, 23–32. [Google Scholar] [CrossRef]
  56. Yu, K.; Yuan, H. Regional Ecological Security Pattern: A Case Study of Beijing. In Proceedings of the 5th National Environmental Art Design Exhibition and Forum, Beijing, China, 28 September–22 October 2012; pp. 166–168. [Google Scholar]
  57. Xu, Y.; Si, Y.; Takekawa, J.; Liu, Q.; Prins, H.H.T.; Yin, S.; Prosser, D.J.; Gong, P.; de Boer, W.F. A network approach to prioritize conservation efforts for migratory birds. Conserv. Biol. 2020, 34, 416–426. [Google Scholar] [CrossRef]
  58. Newman, M.E.J.; Girvan, M. Finding and evaluating community structure in networks. Phys. Rev. E 2004, 69, 026113. [Google Scholar] [CrossRef]
  59. Newman, M.E.J. Modularity and community structure in networks. Proc. Natl. Acad. Sci. USA 2006, 103, 8577–8582. [Google Scholar] [CrossRef]
  60. Wang, J.; Xu, C. Geodetector: Principle and prospective. Acta Geogr. Sin. 2017, 72, 116–134. [Google Scholar] [CrossRef]
  61. Chen, J.; Wang, K.; Du, P.; Zang, Y.; Zhang, P.; Xia, J.; Chen, C.; Yu, Z. Quantifying the main and interactive effects of the dominant factors on the diurnal cycles of land surface temperature in typical urban functional zones. Sustain. Cities Soc. 2024, 114, 105727. [Google Scholar] [CrossRef]
  62. Zhang, C.; Chen, W.; Huang, F. Effects of grassland connectivity on plant diversity in Poyang Lake. Acta Geogr. Sin. 2024, 79, 259–278. [Google Scholar] [CrossRef]
  63. Buchholz, S.; Kossmann, M. Research note. Visualisation of summer heat intensity for different settlement types and varying surface fraction partitioning. Landsc. Urban Plan. 2015, 144, 59–64. [Google Scholar] [CrossRef]
  64. Mu, H. Land Cover Change and Ecological Network Security of the China’s Three-North Shelterbelt. Master’s Thesis, Lanzhou Jiaotong University, Lanzhou, China, 2021. [Google Scholar]
  65. Moilanen, A.; Anderson, B.J.; Eigenbrod, F.; Heinemeyer, A.; Roy, D.B.; Gillings, S.; Armsworth, P.R.; Gaston, K.J.; Thomas, C.D. Balancing alternative land uses in conservation prioritization. Ecol. Appl. 2011, 21, 1419–1426. [Google Scholar] [CrossRef] [PubMed]
  66. Convention on Biological Diversity. Aichi Biodiversity Targets. In Proceedings of the Meeting of the Conference of the Parties to the Convention on Biological Diversity, Nagoya, Japan, 18–29 October 2010. [Google Scholar]
  67. Zhu, Q.; Yu, K.; Li, D. The width of ecological corridor in landscape planning. Acta Ecol. Sin. 2005, 25, 2406–2412. [Google Scholar] [CrossRef]
  68. Luo, Q.; Hu, H.; Xu, Z.; Ding, Z.; Yang, X.; Chen, Q.; Zhang, C.; Li, A.; Zou, J.; Ye, D. Hotspots of the waterbirds diversity in Guangdong-Hong Kong-Macao Greater Bay Area based on Maxent model. Acta Ecol. Sin. 2021, 41, 7589–7598. [Google Scholar]
  69. Ye, J.; Liu, Z.; Fan, Y.; Lai, W.; Yi, Z. The spatiotemporal pattern and driving force of resident bird biodiversity in the urban agglomeration area in the Pearl River Delta. Acta Sci. Nat. Univ. Sunyatseni 2025, 64, 218–227. [Google Scholar] [CrossRef]
  70. Cheng, Y.; Liu, H.; Du, J.; Yi, Y. Quantifying biodiversity’s present and future: Current potentials and SSP-RCP-driven land use impacts. Earth’s Future 2025, 13, e2024EF005191. [Google Scholar] [CrossRef]
  71. Ding, C.; Cai, J.; Hu, Y.; Liang, Y. Modeling the effects of urban park 3D environmental features on bird diversity with interpretable machine learning: A case study of Harbin, northeastern China. Avian Res. 2025, 16, 100304. [Google Scholar] [CrossRef]
  72. Corbera, G.; Dominguez-Carrió, C.; Grange, L.; Ambroso, S.; Corbera, J.; Gili, J.-M. The role of arborescent octocorals as ecosystem engineers in shaping the diversity and composition of shelf-dwelling benthic assemblages. Mar. Biol. 2025, 172, 162. [Google Scholar] [CrossRef]
  73. Qian, H. Diversification rates in large-scale moss assemblages along latitudinal and climatic gradients across the world. Plant Divers. 2025, 47, 833–838. [Google Scholar] [CrossRef]
  74. Fahrig, L. Effects of habitat fragmentation on biodiversity. Annu. Rev. Ecol. Evol. Syst. 2003, 34, 487–515. [Google Scholar] [CrossRef]
  75. Liang, J.; He, X.; Zeng, G.; Zhong, M.; Gao, X.; Li, X.; Li, X.; Wu, H.; Feng, C.; Xing, W. Integrating priority areas and ecological corridors into national network for conservation planning in China. Sci. Total Environ. 2018, 626, 22–29. [Google Scholar] [CrossRef]
  76. Fletcher, R.J., Jr.; Burrell, N.S.; Reichert, B.E.; Vasudev, D.; Austin, J.D. Divergent perspectives on landscape connectivity reveal consistent effects from genes to communities. Curr. Landsc. Ecol. Rep. 2016, 1, 67–79. [Google Scholar] [CrossRef]
  77. Li, J.; Yu, H.; Fu, Y.; Zhao, Y. Spatial-temporal changes of population-economy-land-society-ecology coordination level of urbanization and clustering: A case of Guangdong Province, China. Prog. Geogr. 2018, 37, 287–298. [Google Scholar] [CrossRef]
Figure 1. Geographical location of the PRDNFUA and urban core areas in China. Bird occurrence points are classified into waterbirds (species that inhabit or frequently use aquatic or wetland environments) and non-waterbirds. Elevation distribution is shown using a Digital Elevation Model (DEM).
Forests 16 01590 g001
Figure 2. Technical roadmap of the study. The figure illustrates the process of establishing the “HQ–ENC–BR” synergy analysis framework in the PRDNFUA.
Forests 16 01590 g002
Figure 3. Cluster identification of the “HQ–ENC–BR” synergy patterns based on ternary plots. The ternary plot maps the relative contributions of three variables in a two-dimensional equilateral triangle, with each vertex representing one variable. Axis values indicate the percentage contribution (total = 100%), and the position of each point is determined by the proportion of the three variables (points closer to a vertex indicate a higher contribution of the corresponding variable).
Forests 16 01590 g003
Figure 4. Spatial distribution patterns and changes in BR of key protected species in the PRDNFUA.
Forests 16 01590 g004
Figure 5. Spatial distribution of habitat quality in the Pearl River Delta urban agglomeration and urban core areas. (a) Urban agglomeration in 2015; (b) urban agglomeration in 2020; (c) urban core areas in 2015; (d) urban core areas in 2020. Habitat quality values range from 0 to 1: Low (≤0.25), Medium (0.25–0.5), High (>0.5).
Forests 16 01590 g005
Figure 6. Spatial distribution of ecological network connectivity in the Pearl River Delta urban agglomeration and urban core areas. Connectivity index values are normalized to a range of 0–1: Low (≤0.25), Medium (0.25–0.5), High (>0.5).
Forests 16 01590 g006
Figure 7. BR statistics for different ecological construction periods and corridor types in urban agglomeration and urban core areas. After normalizing HQ and ENC, they were classified into three categories: Low (≤0.25), Medium (0.25–0.5), and High (>0.5). White dots represent the median, triangles represent the mean, and black bars represent the interquartile range.
Forests 16 01590 g007
Figure 8. Clustering patterns of the “HQ–ENC–BR” synergy. The figure shows the proportions of four clustering patterns of ecological corridors across eight scenarios.
Forests 16 01590 g008
Figure 9. Spatial distribution of the “HQ–ENC–BR” synergy patterns. The figure displays the spatial distribution of four clustering patterns across eight ecological corridor scenarios. Zero-value corridors represent ecological corridors where the mean values of HQ, ENC, and BR are all equal to zero.
Forests 16 01590 g009
Figure 10. Polar stacked percentage bar chart of synergy patterns in ecological corridors across nine cities within the urban agglomeration and urban core areas. The 9 cities are Guangzhou (GZ), Shenzhen (SZ), Zhuhai (ZH), Foshan (FS), Jiangmen (JM), Zhaoqing (ZQ), Huizhou (HZ), Dongguan (DG), and Zhongshan (ZS).
Forests 16 01590 g010
Figure 11. Optimized dual-scale bird diversity conservation network for the urban agglomeration and urban core areas in the PRDNFUA. Primary sources: original ecological sources within priority conservation sources; Secondary sources: potential ecological sources; Primary corridors: synergistic “HQ–ENC–BR” corridors; Secondary corridors: potential interactive corridors.
Forests 16 01590 g011
Figure 12. Overlay analysis of dual-scale priority conservation corridors for the urban agglomeration and urban core areas in the PRDNFUA.
Forests 16 01590 g012
Figure 13. Spatial distribution of bird richness hotspots in the Pearl River Delta region. Cold Spot—90% Confidence, Cold Spot—95% Confidence, and Cold Spot—99% Confidence are merged as Cold Spot. Hot Spot—90% Confidence, Hot Spot—95% Confidence, and Hot Spot—99% Confidence are merged as Hot Spot.
Forests 16 01590 g013
Table 1. Main data types and detailed information used in this study.
DataTimeSpatial ResolutionSource
Administrative boundary data2020-National Catalogue Service For Geographic Information (https://www.webmap.cn/, accessed on 12 October 2023)
Urban extent data20201000A global dataset of annual urban extents (1992–2020) from harmonized nighttime lights [36] (https://doi.org/10.6084/m9.figshare.16602224.v1, accessed on 12 October 2023)
Land use data201530Earth Big Data Science Engineering Data Sharing Service System (http://data.casearth.cn/, accessed on 12 October 2023)
2020
Elevation201530Geospatial Data Cloud website (https://www.gscloud.cn/, accessed on 12 October 2023)
2020
Road network data2015-National Catalogue Service For Geographic Information (https://www.webmap.cn/, accessed on 12 October 2023)
2020
Tourist attraction data2015-BIGEMAP (http://www.bigemap.com/, accessed on 12 October 2023)
2020
Bird occurrence point data2011–2020-Global Biodiversity Information Facility (GBIF Occurrence Download. Available online: https://doi.org/10.15468/dl.a3ufca, accessed on 12 October 2023)
Bioclimatic data1970–20001000WorldClim (https://www.worldclim.org/, accessed on 12 October 2023)
Table 2. Sensitivity parameter values of each land use type to bird species threat factors and the suitability scores of each land use type as bird habitats in the PRDNFUA.
Land Cover TypeHabitat SuitabilityThreat Factors
CroplandCLRARailwayExpresswayARSR
1Cropland0.3510.210.020.010.050.070.03
2Grassland0.400.080.060.020.020.020.030.03
3Forest10.550.410.20.210.230.250.25
4Shrub10.600.700.600.210.240.260.26
5Wetland10.120.090.020.010.0100
6Construction land00.2110.290.310.290.30.36
7Water0.900.080.060.010.020.040.030.01
8Unutilized land00.010.0100.01000
Note: Construction land (CL), residential area (RA), arterial road (AR), and secondary road (SR).
Table 3. Independent and interactive effects of HQ and ENC on BR.
RegionYearEcological Corridor TypeHQ
(q Value)
ENC
(q Value)
Interaction
(q Value)
Interaction Types
Urban agglomeration2015Interactive corridors0.030.670.68V
Self-corridors0.080.140.23V
2020Interactive corridors0.010.460.51V
Self-corridors0.030.050.08V
Urban core areas2015Interactive corridors0.060.030.24V
Self-corridors0.030.020.06V
2020Interactive corridors0.110.040.21V
Self-corridors0.030.000.03V
Note: The geographical detector model defines five interaction types: (I) Nonlinear weakening. (II) Single-factor nonlinear attenuation. (III) Two-factor enhancement. (IV) Independence. (V) Nonlinear enhancement.
Disclaimer/Publisher’s Note: The statements, opinions and data contained in all publications are solely those of the individual author(s) and contributor(s) and not of MDPI and/or the editor(s). MDPI and/or the editor(s) disclaim responsibility for any injury to people or property resulting from any ideas, methods, instructions or products referred to in the content.