Article

Comparing Spatial Analysis Methods for Habitat Selection: GPS Telemetry Reveals Methodological Bias in Raccoon Dog (Nyctereutes procyonoides) Ecology

1
Division of Life Science, Incheon National University, 119 Academy-ro, Yeonsu-gu, Incheon 22012, Republic of Korea
2
Space and Environment Laboratory, Chungnam Institute, 73-26 Institute Road, Gongju 32589, Republic of Korea
3
Bio-Resource and Environmental Center, Incheon National University, 119 Academy-ro, Yeonsu-gu, Incheon 22012, Republic of Korea
*
Author to whom correspondence should be addressed.
These authors contributed equally to this work.
Forests 2025, 16(10), 1588; https://doi.org/10.3390/f16101588
Submission received: 1 September 2025 / Revised: 7 October 2025 / Accepted: 14 October 2025 / Published: 16 October 2025
(This article belongs to the Section Forest Biodiversity)

Abstract

Recent issues that have emerged in regard to raccoon dog (Nyctereutes procyonoides) include interaction with humans and disease transmission. Therefore, understanding their habitat characteristics and preferences is crucial in the effort to limit conflicts with humans. A total of thirteen raccoon dogs were captured from three regions in South Korea, each with distinct habitat characteristics. GPS trackers were attached for tracking the raccoon dogs’ movements. Utilizing GPS tracking data, Kernel Density Estimation (KDE), Minimum Convex Polygon (MCP), and Jacobs Index were applied to learn more about the habitat preferences of the raccoon dogs. According to the results, the habitat composition ratios for KDE and MCP showed that forests had the largest proportion. However, a habitat composition ratio similar to the land proportion of the area that they inhabit indicated that raccoon dogs had the ability to adapt to various habitats. Jacobs Index analysis revealed different habitat selection patterns compared to KDE and MCP, with forests showing neutral to negative selection despite comprising large proportions of home ranges. Our results highlight important methodological considerations when inferring habitat preferences from spatial data, suggesting that multiple analytical approaches provide complementary insights into animal space use.

1. Introduction

Wildlife habitats are generally composed of home ranges, areas where populations engage in survival activities such as foraging, reproduction, and raising offspring, and where they share resources with conspecifics or heterospecifics [1,2,3]. These habitats may also include territory, defined as area that an individual defends from conspecifics for resources and reproductive activities [1,4].
Habitat selection is considered a hierarchical process consisting of a series of innate and learned behavioral choices by which an individual determines whether to utilize a specific habitat at various spatial scales of the environment [5]. Factors influencing habitat selection can include the presence or absence of shelter, the quality and quantity of food, and the availability of resting and breeding sites [6]. Therefore, understanding the definition, area, and structure of habitats, as well as the factors influencing them, is essential for elucidating the interactions between animals and their environment [7,8,9].
Recently, GPS tracking technology has played a crucial role in collecting data on animal movement and habitat use patterns [10]. GPS tracking methods are generally effective for tracking animal movement patterns and analyzing behavioral characteristics [11], and GPS collars are used to identify habitats by determining the seasonal location and movement paths of animals based on actual coordinate information [12]. In Korea, wildlife habitat studies using GPS technology are actively underway [13,14,15,16].
Kernel Density Estimation (KDE) and Minimum Convex Polygon (MCP) techniques, both based on GPS data, are widely used methodologies for assessing habitat area and land cover characteristics. KDE is a utilization distribution (UD) technique that calculates the relative frequency distribution of coordinate data and can be applied to estimate the boundaries of core areas where individuals most frequently visit or reside [17,18]. MCP is a polygon created by connecting the outermost observed coordinates and is a widely recommended method for measuring habitat areas [19]. However, because KDE and MCP differ in their methods of estimating habitat area, the resulting habitat components (e.g., forest, urban, grassland, etc.) may also show different results depending on the analysis method. In particular, because both methods estimate home ranges based on coordinates at specific time intervals or points in time, they may include points on simple movement paths rather than actual habitats. Therefore, it can be difficult to determine whether areas formed solely from these coordinates are composed of essential habitats. Numerous studies have shown that range-based estimates of habitat use may misrepresent or fail to accurately reflect habitat availability [20,21]. To overcome this limitation, habitat selection indices that incorporate resource availability are sometimes employed [22,23]. Food preferences and habitat variability significantly influence the assessment of an animal’s habitat affinity [24].
Raccoon dog (Nyctereutes procyonoides), an omnivorous, medium-sized canid predator endemic to East Asia, has gained global attention as a widely recognized invasive species following its introduction to Europe in the early twentieth century [25,26,27,28]. Traditionally, this species is classified into six subspecies based on morphological and geographical distribution [29]. However, the taxonomy of N. procyonoides remains contested, as contemporary genetic and phylogenetic studies frequently report limited differentiation among the proposed subspecies, challenging established classifications [26,30].
The invasive European population is predominantly derived from the Siberian/Ussurian raccoon dog, N.P. ussuriensis, and is characterized by a relatively homogenous genetic background in its introduced range [25,26]. In contrast, this study focuses specifically on the native population of the Korean Peninsula, classified as N.P. koreensis. Given the recognized morphological variation among subspecies and the complex taxonomic history of the species, investigating the ecological and genetic characteristics of specific native subspecies, such as N.P. koreensis, is essential for establishing the baseline evolutionary potential and ecological traits of the species within its original geographical distribution. Raccoon dogs are commonly observed in both forest and rural environments and are classified as Least Concern (LC) by the IUCN, owing to their high adaptability to diverse environments. The raccoon dog is an intermediate predator in both Asian and European regions which helps maintain the equilibrium of forest and suburban ecosystem by preying on amphibians, rodents, and variety of fruits and grains [31,32,33,34,35]. Raccoon dogs are known to rest in dens during the day and are active during the night [36]. Significant differences in habitat size are reported between raccoon dog populations in Asia and Europe. The home range of the raccoon dog is highly variable, ranging from 2 to 10 km2. Notably, individuals inhabiting diverse environments, such as agricultural landscapes, tend to utilize smaller territories compared to those residing in continuous forest habitats [37]. This phenomenon is driven not only by geographical factors but primarily by the availability of resources: abundant resources within the habitat—including sufficient food availability, suitable shelter, and denning sites—can lead to a reduction in the required home range size. Consequently, the distribution of usable resources across a region ultimately determines the spatial distribution of individuals [25,38,39,40]. Raccoon dogs are known to inhabit forested and grassland areas [41]; however, ongoing urbanization has led them to expand their activities into human-dominated landscapes, with adverse impacts on human life and society. Furthermore, they contribute to agricultural losses and economic damage as they expand their territory to suburban and agricultural areas in search of abundant food resources [42,43]. In Asia, they are commonly observed near rural households or urban areas, causing roadkill and damage to farms [43,44,45]. Kim [45] reported that raccoon dogs accounted for 27% of wildlife-vehicle collisions on highways in South Korea. Moreover, raccoon dogs are considered as major vectors for various parasites, such as scabies and the rabies virus [46,47,48,49], and have been reported to pose a potential risk of human casualties. In addition, medium to large-sized predators, including raccoon dogs, can also serve as intermediate hosts for parasites [50,51,52]. Recently, raccoon dogs have expanded their range from forests to urban areas, leading to increased interactions with humans. This indicates a possibility of mutual influence among livestock, wildlife, agricultural practices, and human populations [44]. Yoon [43] documented cases of raccoon dogs causing damage to poultry (chickens, ducks) and crops, including corn, sweet potatoes, and cabbage. Intermittent reports of threats to small pets have been documented [53]. Hence, it is crucial to gather fundamental information regarding the geographic range and habitat preferences of raccoon dogs.
In this study, we assessed the habitat range and land use characteristics of raccoon dogs through the following hypotheses. (1) Raccoon dogs would show stronger selection for edge habitats and agricultural areas relative to their availability, (2) forest habitats would be used proportionally to availability rather than showing strong preference, and (3) habitat selection patterns inferred from Jacobs Index would differ from those suggested by KDE and MCP spatial analysis.

2. Materials and Methods

2.1. Study Area

The study area comprised three locations, namely Okcheon-myeon, Yangpyeong-gun, Gyeonggi-do (37°32′ N 127°28′ E), Ocheon-myeon, Boryeong-si, Chungcheongnam-do (36°25′ N 126°31′ E), and Hwachon-myeon, Hongcheon-gun, Gangwon-do (37°44′ N 127°58′ E) in South Korea (Figure 1). Yangpyeong is an inland region covered predominantly by forests, with minimal human interference. It is located near the Hangang River, and has the lowest number of grassland patches within the study area. Among the study areas, the largest agricultural patch is located in Boryeong, which features undulating hills, and a lower proportion of forests than the other study sites. Among all the study areas, the largest forest patch is located in Hongcheon, an inland region with dense forests, higher elevations, and minimal human intervention.

2.2. GPS Data

GPS trackers [(KoEco, Korea Institute of Environmental Ecology) WT-300 Mammal)] were attached to 13 raccoon dogs captured in Yangpyeong, Boryeong and Hongcheon (Table 1). Total 11 baited live traps (800 × 900 × 2000 mm) were set in each location. All traps were consistently baited with canned mackerel and supplemented with an attractant three times a week. The traps were strategically placed in areas with optimal cellular signal reception, such as the edges of agricultural fields, to facilitate the use of a real-time camera system to immediately confirm the capture status. The cameras monitoring the traps were checked periodically throughout the day to ensure captured animals were identified and handled immediately, minimizing the time animals spent in the traps. The animals were anesthetized with ketamine, and their sex was determined by a veterinarian. To minimize the impact of trackers on the behavior of the raccoon dogs, trackers weighing less than 5% of their body weight [54], with a product weight of 140 g, were used. The attachment and handling of the GPS trackers were conducted with permission from the local authorities (4251000-2023-3). The trackers collected data five times a day at 18:00, 21:00, 00:00, 03:00, and 06:00, aligning with the raccoon dogs’ key activity periods. Since the raccoon dogs are nocturnal animals, nighttime data were primarily collected [55,56]. Communication with the trackers was initiated the next day at 10:00, allowing for retrieval of data. Coordinates and distances that were physically impossible to traverse due to error, such as those indicating locations outside the defined region or recorded at distances beyond feasible travel, along with zero values where no point was recorded, were excluded from the analysis.
Testing on the error of the GPS trackers was conducted under two conditions: high canopies and open spaces. Results revealed that the detection and discrepancy rates of the trackers under these two conditions were not significantly different. Specifically, an error of approximately 16 m was found in both open space and high canopies. Furthermore, the duration between capture and the period over which data was transmitted varied for each individual (Table 1).

2.3. Habitat Analysis

For habitat analysis, seven major land cover categories—urban area, agricultural area, forest, grassland, wetland, bare land, and water—classified according to the habitat classification system of the Ministry of Environment in South Korea, were selected as the entire study area. Using ArcGIS version 10.8, an analysis of habitat composition was performed, incorporating point, KDE, and MCP based on the GPS coordinates obtained from raccoon dogs. Points, which refer to GPS coordinates recorded in locations utilized by the raccoon dogs, were classified into seven land cover categories based on the obtained data.
For KDE, KernelUD in R 4.3.1 was used to set the intervals of KDE 95%, 70%, and 50%. In the analysis, the habitat composition of the study area was compared with the habitat utilization of points, KDE, and MCP generated from the GPS coordinates of raccoon dogs within the study area. Kernel bandwidth was determined using the least-squares cross-validation (LSCV) method, which provides a data-driven smoothing parameter. Resource Selection Function (RSF) is a statistical model used to analyze the pattern of selection of specific resources or habitats by an individual animal or species [57]. It allowed the evaluation of the habitat preferences of an individual or groups located within the geographic range. For second-order selection, the habitat range within a specific geographical area was evaluated, while preferences for components within a habitat were assessed during third-order selection [24]. An analysis of preference of habitat selection was performed using Jacobs index [58]. Jacobs index is typically used to estimate an animal’s preference for a habitat, which indicates the degree of preference and avoidance. In this study, vailable habitat was defined as areas within the study region that were accessible to individuals and located within a sufficient distance for utilization throughout the tracking period. The formula for Jacobs index is as follows:
D = (r − p)/(r + p − 2rp),
where D varies from −1 to +1, where −1 to 0 indicates negative preference, and 0 to +1 indicates positive preference for the habitat. Values close to −1 indicate strong non-preference and values close to 1 indicate strong preference. ‘r’ is the proportion of habitat use and ‘p’ is the proportion of habitat available to raccoon dog.

2.4. Sign-Test Analysis of Jacobs Index

For each habitat k, we assessed whether the median Jacobs index equaled zero (indicating no selection) using a two-sided exact sign test. Individual animals served as the units of analysis, with one Jik value assigned to each animal i within habitat k. Values precisely equal to zero (ties) were excluded from the analysis. To control the family-wise error rate across the set of habitats within each analytical stratum, the Holm correction (α = 0.05) was applied within each KDE level (50, 70, and 95). We report Holm-adjusted p-values (p_adj). As measures of effect size, we also report the mean Jk accompanied by 95% percentile bootstrap confidence intervals (based on 2000 resamples; random seed set for reproducibility). Bootstrap resampling was conducted on individuals, stratified according to the corresponding analysis stratum. Jacobs index was calculated using the proportions of use and availability as follows:
Jik= rik − pk/(rik + pk) − 2rikpk, J ∈ [−Jp]
where rik represents the proportional use of habitat k by animal i (within the specified KDE for third-order selection, or within the study area for second-order selection), and pk corresponds to the Sign-test analysis of Jacobs index. Proportions were normalized to sum to one across habitats for each individual; zero values were replaced with a small ε prior to normalization to prevent undefined values in J.
All analyses were performed using R software (version 4.5.1). The sign test employed exact binomial probabilities; multiple testing adjustments were performed using p.adjust (method = “holm”); and bootstrapping was conducted with the boot package (R = 2000, percentile confidence intervals).

3. Results

A total of 2711 GPS points were collected from the 13 raccoon dogs that were captured in Yangpyeong, Boryeong, and Hongcheon (Table 1). The average speed of each raccoon dog was measured as 1 km/h, leading to low autocorrelation among the coordinates delineating their home range. Low autocorrelation was an expected result for raccoon dogs who only move within their home range.
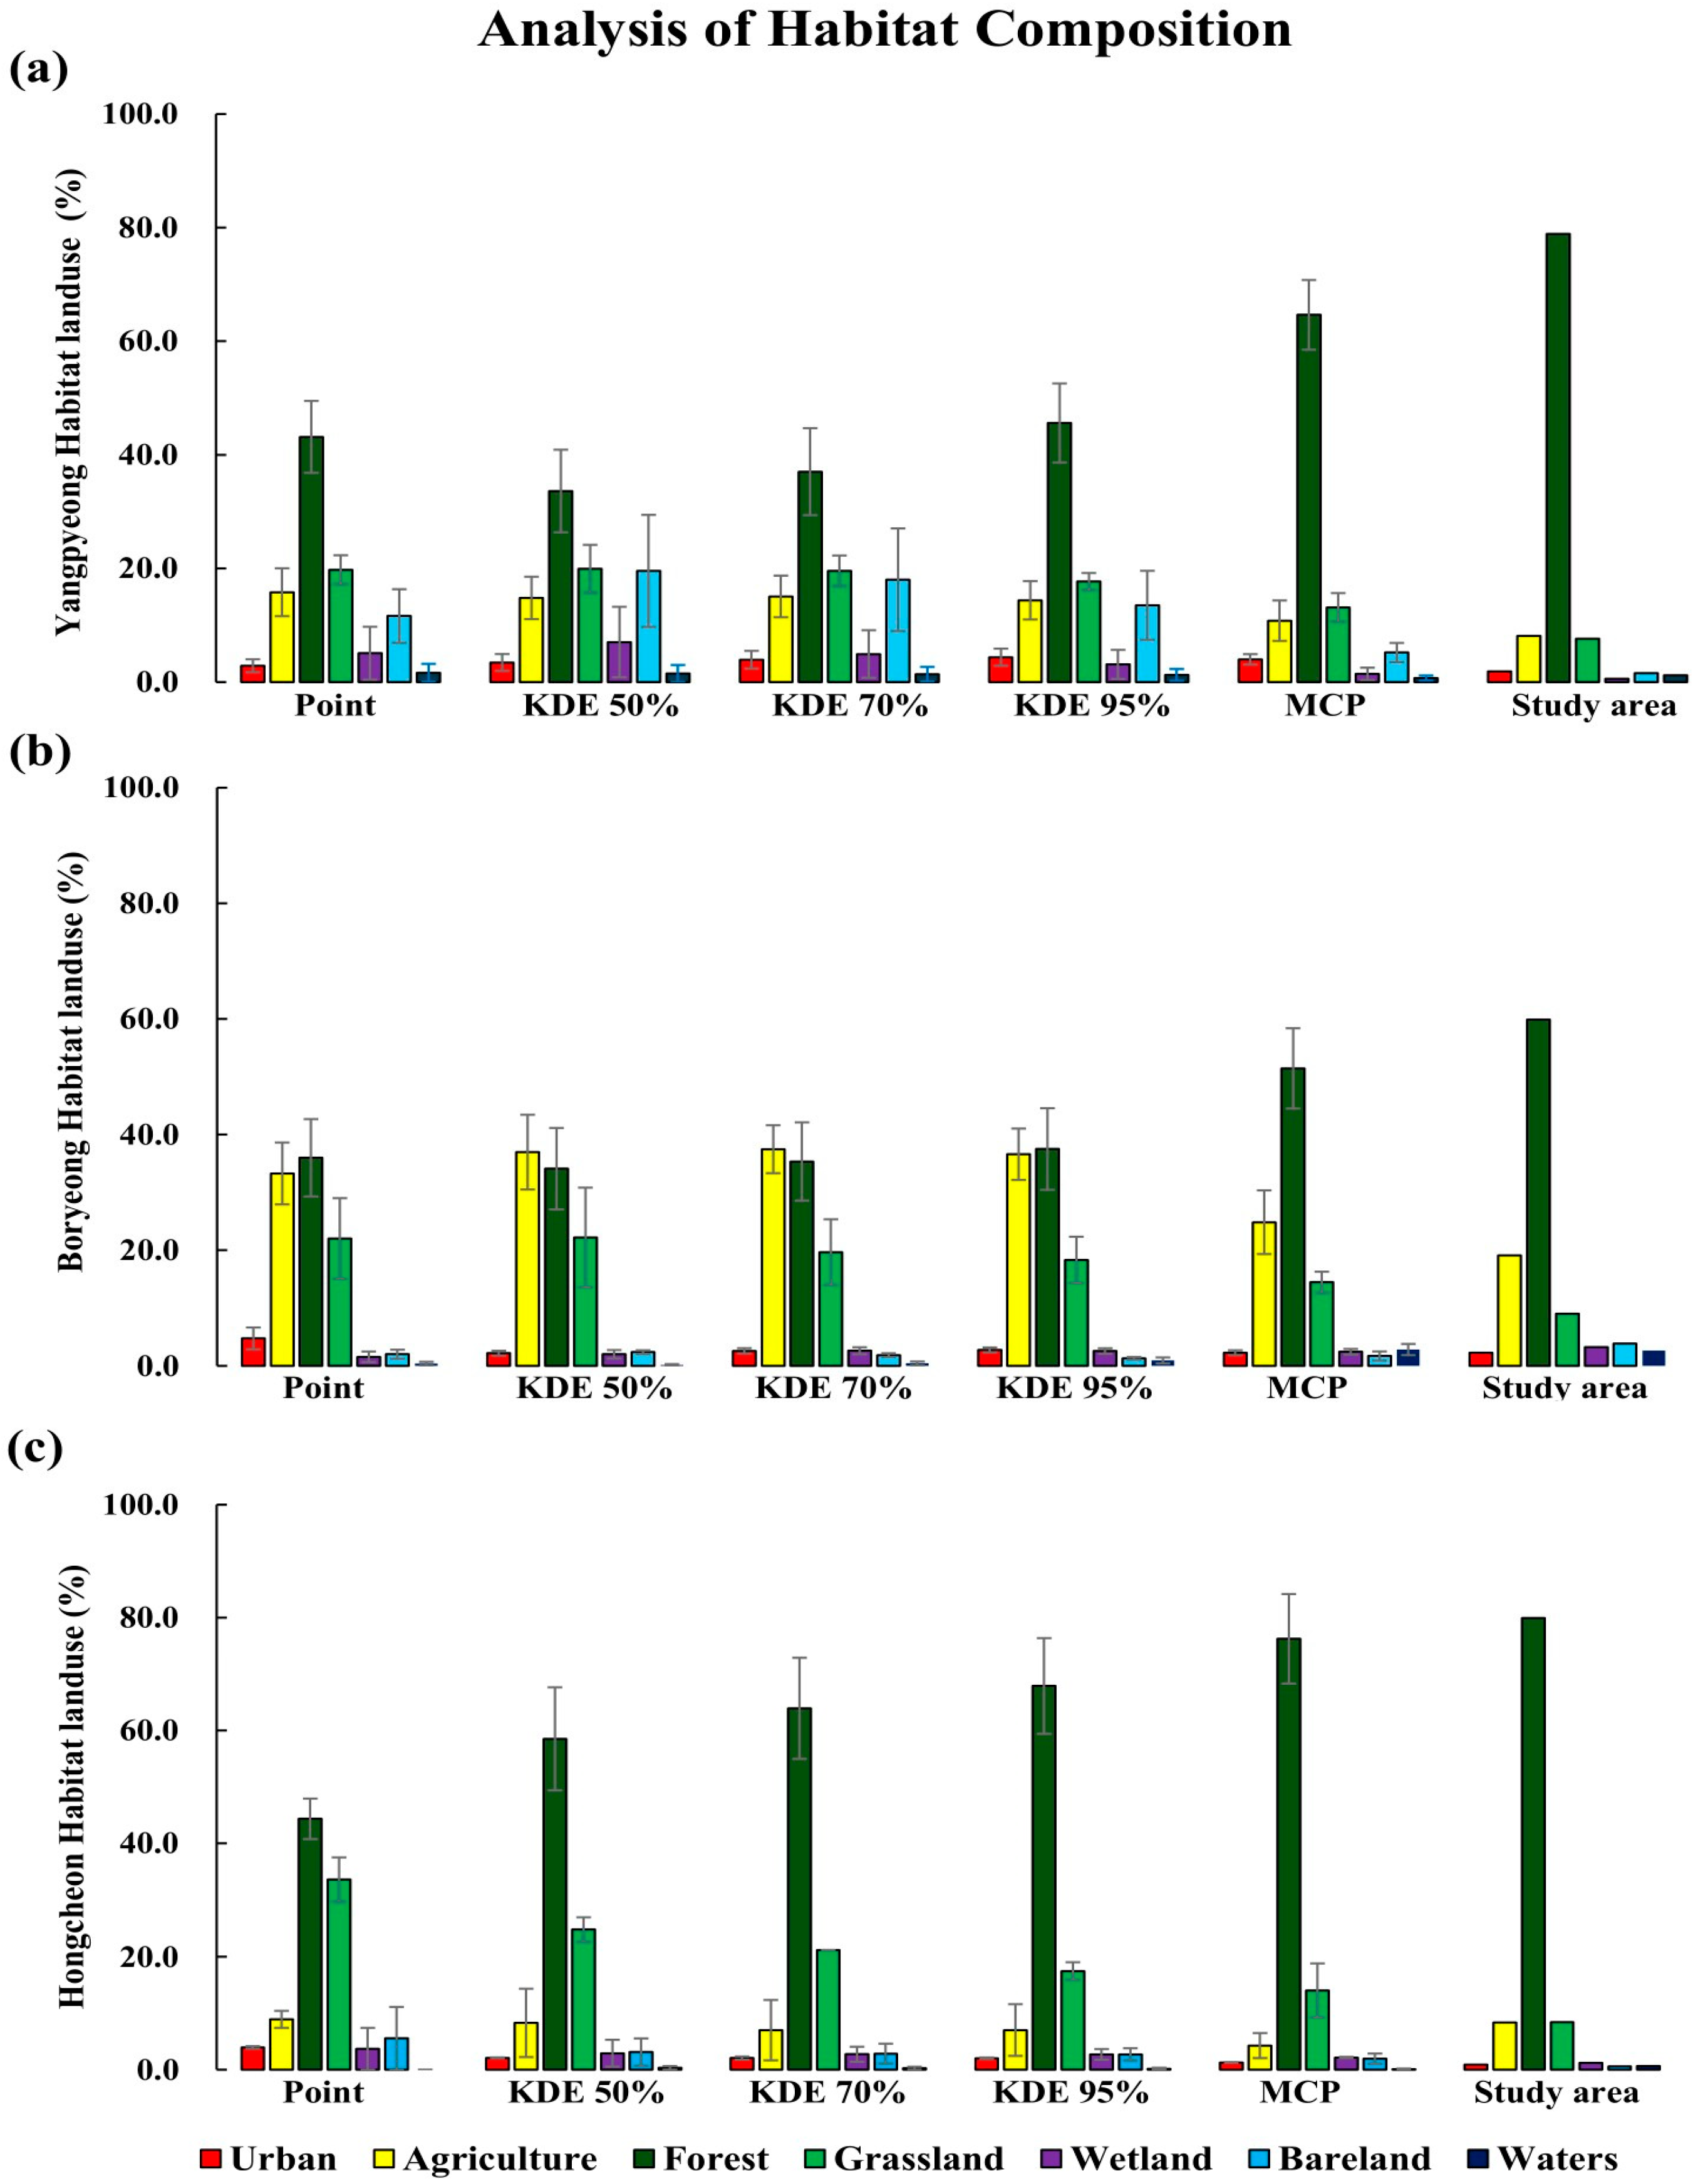
The average area for KDE 50% was 0.075 km2, KDE 70% was 0.147 km2, KDE 95% was 0.35 km2, while the MCP was 1.365 km2 (Table 2). The GPS points were most frequently generated in forest, grassland, and agricultural areas, with preferences in the order: forest (n = 1262), grassland (n = 622), and agricultural areas (n = 532). The forest, grassland, and agricultural areas also dominated the total area in KDE 50%, KDE 70%, KDE 95%, and MCP. Notably, an analysis of the GPS points, KDE, and MCP for raccoon dog habitat components in Yangpyeong, Boryeong, and Hongcheon showed that the proportion of habitat components varied according to the methods employed (Figure 2).
In Yangpyeong, as the KDE range expanded, the proportion of forest increased, and when compared to other land use types, the proportion of forest within the MCP was the highest (Figure 2a). The MCP showed a trend similar to that of the forest ratio observed in the study area. Conversely, the proportion of coordinates in the grassland decreased as the range of KDE widened, and the lowest proportion was observed for the MCP. The proportions of grassland, bareland, and agricultural area showed a gradual decrease from KDE 50% to 95%, and the lowest proportions observed for MCP.
In Boryeong, similar proportions of forest and agricultural areas were observed in Point and KDE, and the agricultural areas occupied larger proportion than the forest in KDE 50% and KDE 70% (Figure 2b). The highest proportion of grassland in Boryeong was observed for Point and decreased as the range of KDE widened. The lowest proportion of grassland was observed for MCP compared to all the ranges of KDE.
In Hongcheon, the forest showed the highest proportion in all cases. The lowest proportion of forest was observed for point and the highest proportion was observed in the study area (Figure 2c). Furthermore, as the range of KDE widened, the proportion of the forest increased, and a higher proportion of forest was observed for MCP compared to KDE. There was a tendency for the proportion of grassland to decrease from point to the study area. This finding contrasts with the result indicating an increasing proportion of forest from point to study area. In all three regions, the land use proportions for KDE 50%, KDE 70%, and KDE 95% were observed to be similar; however, MCP followed the land use proportions observed in the study area. Analyzing habitat preference using the Jacobs index revealed distinct differences between the Jacobs index and both KDE and MCP. This disparity was particularly evident in habitat types that constituted a significantly high proportion in both KDE and MCP, with notable differences observed in the forest across the three regions.
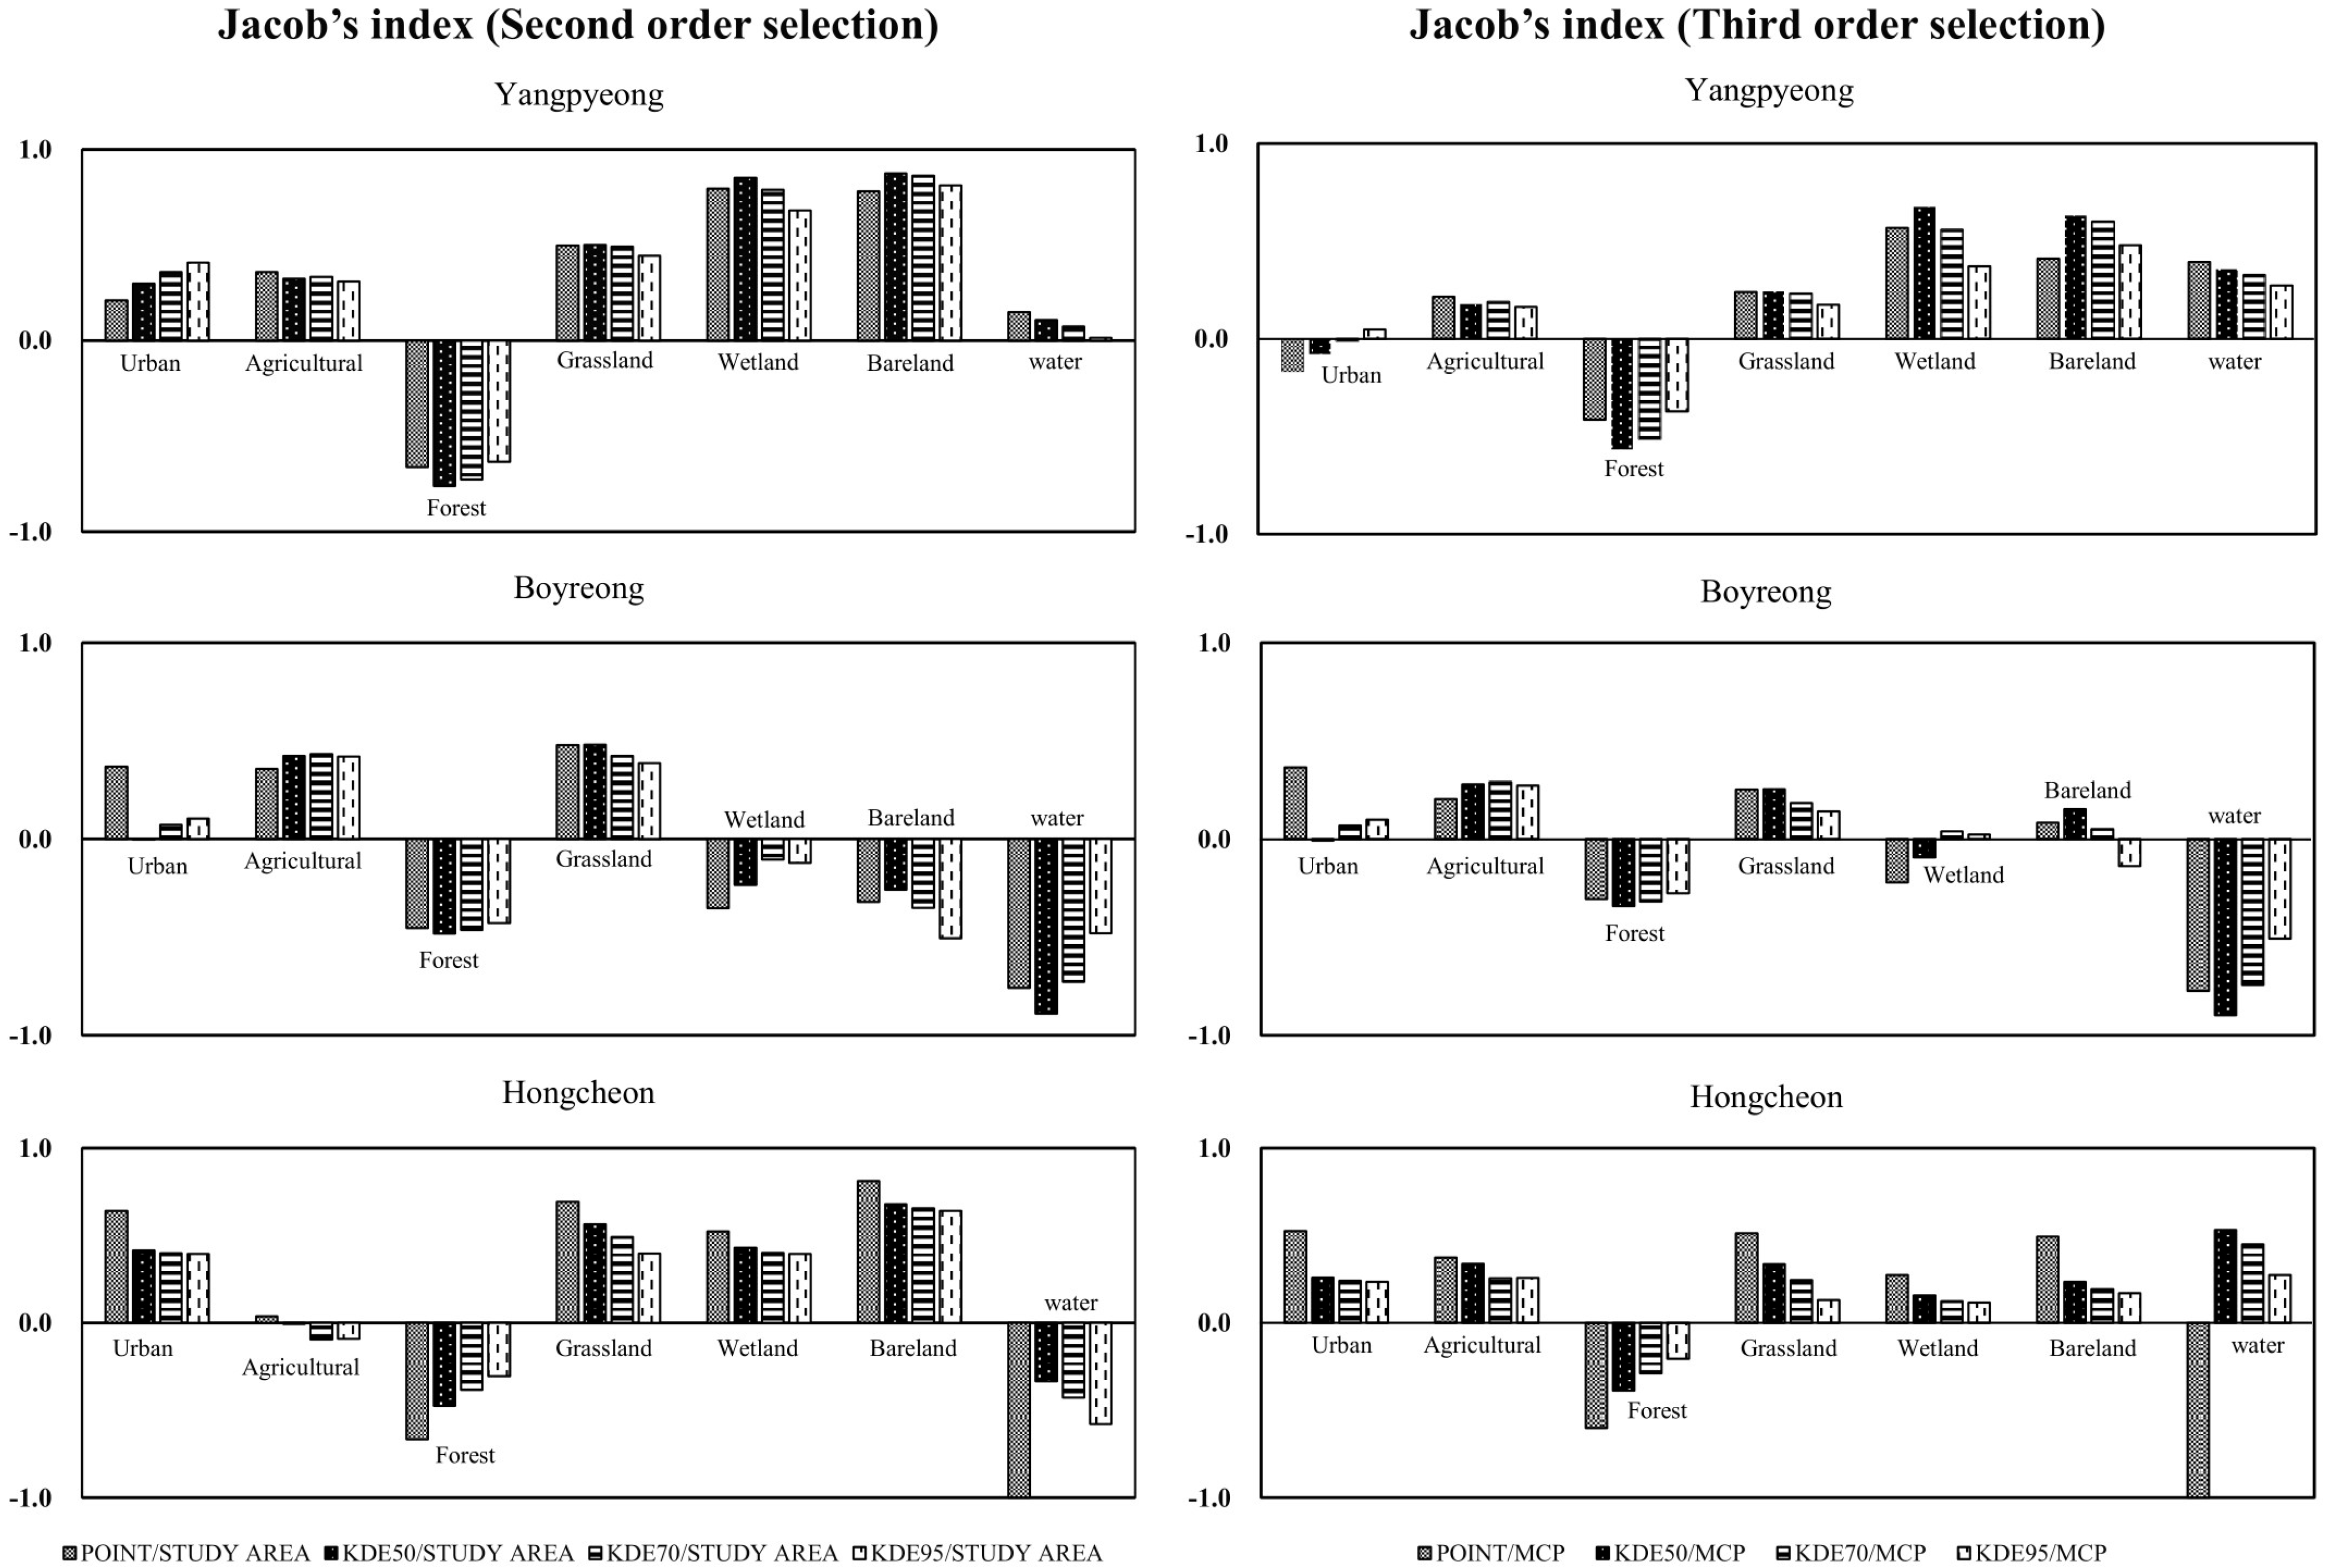
In all three regions, the forest comprised the highest proportion in both KDE and MCP, especially apparent in the latter, (Figure 2a,c); thus forest can be considered as important habitat. However, subsequent analysis using the Jacobs index to determine habitat preference revealed a negative index for forests in all regions for both second and third-order selections (Figure 3). In the second-order selection, the forests were not preferred in all instances, while grasslands were preferred. In contrast, bareland was preferred in Yangpyeong and Hongcheon, but not in Boryeong. In Boryeong, the second-order selection indicated a stronger preference for areas primarily occupied by humans, such as the agricultural and urban areas, compared to the other regions. In the third-order selection, there was a general preference for agricultural areas, grasslands, and barelands. Yangpyeong showed the highest preference for barelands, while in Boryeong, the agricultural areas were preferred over the barelands. By contrast, in Hongcheon, the three land uses were similarly preferred. Therefore, it was found that the forests were non-preferred habitats in all three study areas, contrary to the results obtained from the KDE and MCP calculations.
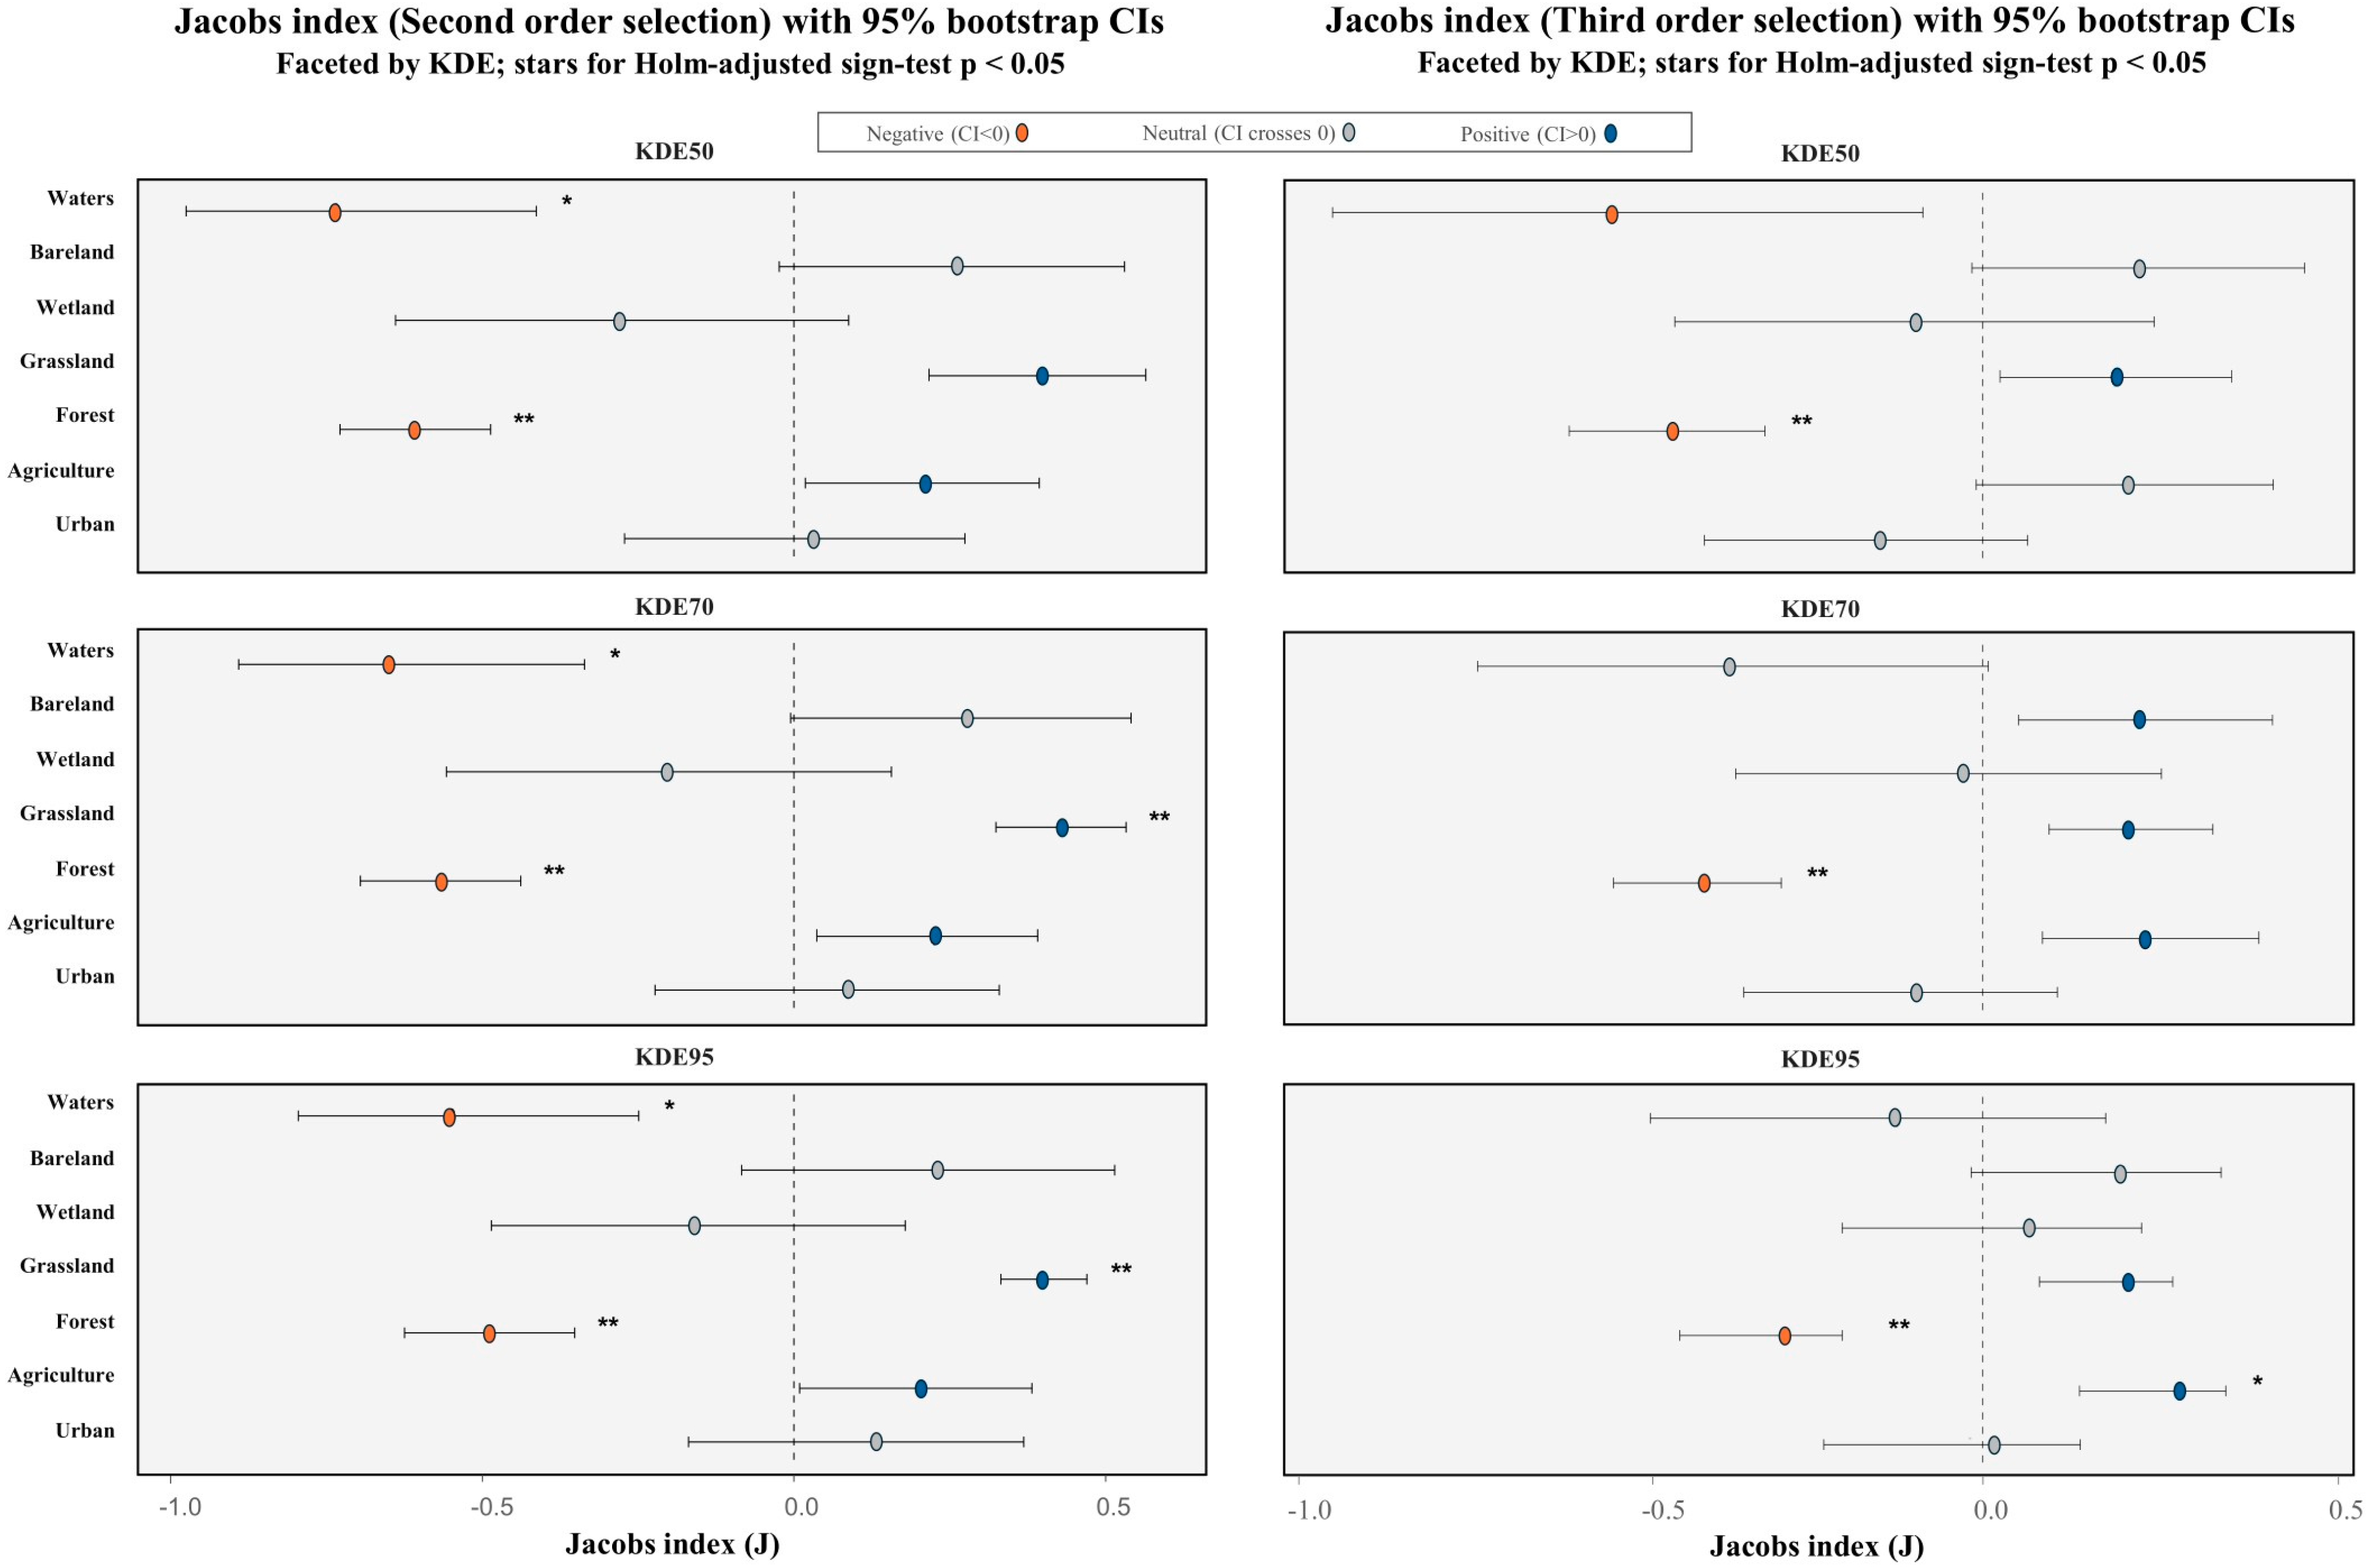
We analyzed Jacobs index (J) for 13 individuals using a two-sided exact sign test, applying Holm correction to control for multiple comparisons across habitats (Figure 4).
Second-order selection (land use/study area). Forest exhibited a consistently negative preference (avoidance; J < 0) across all KDE levels (50, 70, and 95), with results that were highly significant (p < 0.01, Holm-adjusted). Waters also demonstrated a significant negative trend across all KDE levels (p < 0.05, Holm-adjusted). Agriculture exhibited a positive trend (J > 0) across all KDE levels, although this trend did not attain statistical significance. Grassland similarly exhibited positive values (J > 0) across all KDE levels, reaching statistical significance only at KDE70 and KDE95 (p < 0.01, Holm-adjusted).
Third-order selection (land use/MCP). The forest consistently exhibited avoidance behavior (J < 0) across all KDE levels, with this effect remaining highly significant throughout (p < 0.01, Holm-adjusted). Among habitats exhibiting positive trends, only Agriculture at KDE95 remained statistically significant (p < 0.05, Holm-adjusted); the other positively trending habitats (Grassland and Bareland) were not statistically significant after adjustment.

4. Discussion

The results of the study of raccoon dog habitat areas were found akin to other studies performed in South Korea. However, the habitat areas of the raccoon dogs observed in this study research were smaller than the habitat areas reported in studies from other countries [38,59]. The results of the current study showed that the average area for KDE 50% was 0.08 km2 (ranging from 0.01 km2 to 0.22 km2), and the average area for MCP was 1.37 km2 (ranging from 0.14 km2 to 4.36 km2). Previous studies on the home range of raccoon dogs in South Korea reported an MCP of 100% within 0.5 to 3 km2, with the majority showing around 1 km2 [44,60,61]. There were no significant trend differences between the results of our study and those of prior research. The habitat areas observed in this study for international cases were relatively smaller than the reported range of 0.3 to 9.5 km2 for raccoon dogs in Japan and Finland [38,59,62].
The spatial ecology of the Raccoon Dog exhibits substantial variation across geographical regions. Home range size for raccoon dogs in rural areas of South Korea has been reported to be remarkably small, averaging 0.61 ± 0.50 km2 [44,63]. This is in stark contrast to populations in Europe, such as those in the forests of Finland, where home ranges are significantly larger, measuring 3.29 ± 0.22 km2 [64]. The smaller territory size in Korea is likely attributed to the distinct environmental characteristics of the study areas. The Korean rural landscape, composed of rice paddies, fields, orchards, and grasslands, provides a highly diverse array of food resources for the species [63]. As an opportunistic generalist known for its high adaptability, the Raccoon Dog efficiently forages in environments where food is readily available [65]. The increasing frequency of wildlife damage in these agricultural areas [66,67] further suggests that the Korean rural landscape acts as a highly productive environment, offering concentrated and abundant food resources. This high resource availability allows individuals to meet their energetic needs within a smaller area, thus resulting in the observed restricted home range size.
The smaller habitat areas of raccoon dogs in South Korea compared to those in other countries are likely due to the environmental characteristics of the study areas. Since a habitat must provide adequate resources for sustenance [68], the size of a habitat is influenced by the types of patches with high food resource availability, such as agricultural and grassland areas [69,70]. According to Kauhala [71], the home range size of raccoon dogs tends to decrease when grasslands are included. Raccoon dogs primarily feed on invertebrates, seeds, insects and fruits [40,72,73], and they can forage food resources in human habitats, rice paddies, fields, and orchards. The Patches that provide diverse food resources influence the distribution of neighboring raccoon dogs, thereby controlling their population density [69]. The results of analysis of preferred habitat land types using the Jacobs Index showed differences depending based on the region; however, a general preference for urban and agricultural areas was observed. This finding can be attributed to the accessibility of food resources in human-impacted areas, including urban and agricultural regions. Several European studies focused on forested areas rather than suburban or agricultural regions, while some studies considered areas in the vicinity of suburbs. The habitat sizes reported in the later study were found to be similar to those observed in our study, with habitat radius of approximately 1 km2. The result of these studies also indicated that diet of the raccoon dogs consisted of food resources from human-impacted areas [38,74,75,76]. Certain forests in South Korea, including our study area, contain small forest patches situated near residential areas and farmland, enabling the raccoon dogs to access diverse food resources. Therefore, it is likely that raccoon dogs dwelling in these areas have relatively small habitats [70,77]. This provides evidence that the size of the habitat area for raccoon dogs can be influenced by the type of habitat.
KDE and MCP, which are based on recorded animal locations at specific times or intervals, may show significant differences between locations recorded while the animal is in motion and those obtained from less frequented or peripheral areas. Specifically, although KDE 50% is often used for identification of core habitats [78], it cannot provide precise information by itself [79,80]. Given that a high proportion of forest is located within the research areas of this study, it appears that the role of the forest in both core and overall habitats is significant. However, results from the Jacobs index showed that areas other than the forest, specifically those influenced by humans, are preferred. However, the Jacobs Index results demonstrated a clear preference for non-forested habitats, particularly those within human-influenced landscapes. This finding suggests a heightened potential for human-raccoon dog contact, which raises significant concern, especially regarding the transmission of zoonotic diseases and parasites mediated by the species. This increased spatial overlap between human settlements and wildlife directly contributes to elevated risks of disease dispersal and associated contact conflicts [53,81,82,83].
There were no significant differences in the ranking of habitat components between KDE and MCP; however, variations were apparent in composition ratios. KDE can provide a more accurate reflection of the environment around the GPS points, and the components calculated via KDE follow the estimated ratios from the GPS points. KDE is more effective as a core area representing the actual usage areas in line with the GPS points. In MCP, the home range size may be observed in exaggerated form for some individuals due to extreme GPS points, representing areas that they use infrequently. A compositional analysis using MCP, which includes unused areas, may lead to overemphasis of the characteristics of land use and introduce bias [78,84]. Furthermore, calculating the area by connecting the outermost points of an organism’s habitat range can significantly influence the perceived habitat pattern of the region where the organism resides. In some instances, the KDE was disproportionately small compared to the MCP area for certain individuals. This discrepancy may arise because the data, primarily collected during the active periods of the individuals, encompasses both frequently utilized core areas and exploratory forays into more distant regions. A smaller KDE area, relative to the MCP area, can thus be interpreted as indicative of concentrated use of specific resource patches or habitat types. As the results for KDE and MCP may vary based on environmental conditions and individual movements, appropriate interpretation and use of both techniques are necessary.
The analysis of habitat preference using Jacobs index showed that raccoon dogs in Yangpyeong and Boryeong showed a preference for agricultural areas and urban spaces. However, in the second-order selection for Hongcheon, agricultural areas appeared to be the non-preferred regions. In the Hongcheon study area, the farmland is located approximately 6 km away from the territories occupied by raccoon dogs. Given the typical home range of raccoon dogs covers approximately 1 km2, it is likely that the farmland was situated at a considerable distance, leading to its categorization as an undesirable location. However, in the third-order selection, raccoon dogs were found in all three areas, which showed a preference for agricultural areas. Although there are few agricultural areas located within their home range in Hongcheon, it can be inferred that the raccoon dogs showed a preference for the agricultural areas. Past studies have reported that raccoon dogs tend to avoid coniferous forests or other wooded areas, but prefer open spaces, such as agricultural lands, grasslands, and barelands where there is availability of diverse foods, such as small mammals [85,86]. The raccoon dogs also showed a preference for urban environments attributed to the convenient access to diverse food sources [76,87]. The variation in habitat types and preferences for each patch observed among raccoon dogs across different regions reflects their ability to structure and adapt habitats according to the environmental characteristics of the area.
Analysis of the Jacobs index using the sign-test revealed that forests were consistently unfavored across all regions. Conversely, agricultural land and urban areas, which were assessed as favored based on the Jacobs index, did not yield statistically significant results. While the limited sample size within each study area precluded the demonstration of statistical significance, an overarching trend at the species level was discerned through the analysis of the entire population. According to the KDE and MCP area analysis methods, forests occupied the largest area, which could be interpreted as a favored region. However, when habitat utilization was evaluated concurrently, forests were ultimately assessed as the least favored areas. Also, the apparent avoidance of water should be interpreted with caution, as its small spatial extent combined with the 3 h GPS sampling interval may have limited our ability to detect its true use.
In conclusion, the results of raccoon dog habitat preference using the Jacobs index revealed tendencies that diverged from those estimated via Kernel Density Estimation (KDE) and Minimum Convex Polygon (MCP) methods. This suggests that a high proportion of a particular land cover type within an animal’s home range does not necessarily indicate a strong preference for that habitat. Various results have been derived from analysis of species’ preferred areas using various habitat preference indices and methods of analysis [88,89]. Therefore, to achieve a more precise estimation of habitat preference, a comprehensive approach is required, integrating habitat preference indices with methodologies such as KDE and MCP.

5. Conclusions

This study aimed to compare habitat use patterns by employing home range analysis methods (Kernel Density Estimation, Minimum Convex Polygon) and habitat selection analysis methods (Jacobs Index, Sign Test) using GPS tracking data from raccoon dogs. The results revealed a discrepancy between the land cover composition obtained from home range analyses and the actual habitat use preferences, taking habitat availability into account. Specifically, forest areas, which comprised the largest proportion of raccoon dog home ranges in both KDE and MCP analyses, exhibited a significant non-preference according to statistical tests using Jacobs Index and the Sign Test.
These findings clearly indicate that the mere proportion of land cover within an animal’s home range does not necessarily reflect habitat preference. Consequently, when interpreting raccoon dog habitat use, it is essential to employ habitat selection analysis methods that compare habitat availability within the home range to the actual proportion of use, and to interpret the results appropriately. This paper holds academic significance as a reference, particularly due to the limited research on raccoon dog home ranges in East Asia (N.P. koreensis), by comparing various analytical methodologies and emphasizing considerations for their interpretation.
However, a limitation of this study is the limited generalizability of the findings, attributable to the small sample size (n = 13) and the uneven geographical distribution of the samples. Future research should address these limitations by undertaking more comprehensive studies involving a larger sample size and a wider geographic scope, thereby complementing these findings and more clearly elucidating the mechanisms underlying raccoon dog habitat selection.

Author Contributions

Writing, Conceptualization and Formal analysis, S.J.; Writing, Conceptualization and Visualization, S.K.H.; Investigation, Y.W.L.; Investigation, J.S.; Investigation, H.J.L.; Investigation, C.W.Y.; Investigation, J.Y.L.; Investigation, D.K.Y.; Writing—review and editing, O.-S.C.; Supervision, J.K.L. All authors have read and agreed to the published version of the manuscript.

Funding

This research was supported by the Korea Forest Service (Korea Forest Promotion Institute) through the “Forest Science and Technology Research and Development Project” (Project No. 2021336B10-2323-CD02).

Data Availability Statement

The data presented in this study are available on request from the corresponding author due to restrictions ethical reasons.

Conflicts of Interest

The authors declare no conflicts of interest.

Abbreviations

The following abbreviations are used in this manuscript:
MCPMinimum convex polygon
KDEKernel Density Estimation

References

  1. Burt, W.H. Territoriality and home range concepts as applied to mammals. J. Mammal. 1943, 24, 346–352. [Google Scholar] [CrossRef]
  2. Powell, R.A. Animal home ranges and territories and home range estimators. Res. Tech. Anim. Ecol. Controv. Conseq. 2000, 442, 65–110. [Google Scholar]
  3. Rosenberg, D.K.; McKelvey, K.S. Estimation of habitat selection for central-place foraging animals. J. Wildl. Manag. 1999, 63, 1028–1038. [Google Scholar] [CrossRef]
  4. Noble, G.K. The role of dominance in the social life of birds. Auk 1939, 56, 263–273. [Google Scholar] [CrossRef]
  5. Hutto, R.L. Habitat selection by nonbreeding migratory land birds. In Habitat Selection in Birds; Cody, M.L., Ed.; Academic Press: Orlando, FL, USA, 1985; pp. 455–476. [Google Scholar]
  6. Krausman, P.R. Some basic principles of habitat use. In Grazing Behavior of Livestock and Wildlife; University of Idaho: Moscow, ID, USA, 1999; Volume 70, pp. 85–90. [Google Scholar]
  7. McGuinness, K.A.; Underwood, A.J. Habitat structure and the nature of communities on intertidal boulders. J. Exp. Mar. Biol. Ecol. 1986, 104, 97–123. [Google Scholar] [CrossRef]
  8. Mitchell, M.S.; Powell, R.A. Foraging optimally for home ranges. J. Mammal. 2012, 93, 917–928. [Google Scholar] [CrossRef]
  9. Suchant, R.; Baritz, R.; Braunisch, V. Wildlife habitat analysis–A multidimensional habitat management model. J. Nat. Conserv. 2003, 10, 253–268. [Google Scholar] [CrossRef]
  10. Thomas, B.; Holland, J.D.; Minot, E.O. Wildlife tracking technology options and cost considerations. Wildl. Res. 2011, 38, 653–663. [Google Scholar] [CrossRef]
  11. Latham, A.D.M.; Latham, M.C.; Anderson, D.P.; Cruz, J.; Herries, D.; Hebblewhite, M. The GPS craze: Six questions to address before deciding to deploy GPS technology on wildlife. N. Z. J. Ecol. 2015, 39, 143–152. [Google Scholar]
  12. Aebischer, N.J.; Robertson, P.A.; Kenward, R.E. Compositional analysis of habitat use from animal radio-tracking data. Ecology 1993, 74, 1313–1325. [Google Scholar] [CrossRef]
  13. Cho, C.U.; Gyun, G.H.; Yang, J.J.; Lim, S.J.; Lee, A.N.; Park, H.B.; Lee, B.K. Home range and behavioral characteristics of the endangered Korea Gorals (Naemorhedus caudatus) with GPS collar. Korean J. Environ. Ecol. 2014, 28, 1–9. [Google Scholar] [CrossRef]
  14. Cho, H.J.; Kim, D.H.; Choi, J.D.; Chung, W.S.; Kim, H.J.; Lee, H.S.; Moon, U.K. Analysis of raccoon dog home range according to habitat environment [Abstract]. J. Korean Soc. Environ. Ecol. Conf. Proc. 2014, 2014, 35. [Google Scholar]
  15. Choi, T.; Park, C. The effects of land use on the frequency of mamma roadkills in Korea. J. Korean Inst. Landsc. Archit. 2006, 34, 52–58. [Google Scholar]
  16. Kim, B.J.; Lee, S.D. Home range study of the Korean water deer (Hydropotes inermis agyropus) using radio and GPS tracking in South Korea: Comparison of daily and seasonal habitat use pattern. J. Ecol. Environ. 2011, 34, 365–370. [Google Scholar] [CrossRef]
  17. Barg, J.J.; Jones, J.; Robertson, R.J. Describing breeding territories of migratory passerines: Suggestions for sampling, choice of estimator, and delineation of core areas. J. Anim. Ecol. 2005, 74, 139–149. [Google Scholar] [CrossRef]
  18. Worton, B.J. A review of models of home range for animal movement. Ecol. Model. 1987, 38, 277–298. [Google Scholar] [CrossRef]
  19. Burgman, M.A.; Fox, J.C. Bias in species range estimates from minimum convex polygons: Implications for conservation and options for improved planning. In Animal Conservation Forum; Cambridge University Press: Cambridge, UK, 2003; Volume 6, pp. 19–28. [Google Scholar]
  20. Downs, J.A.; Horner, M.W. Effects of point pattern shape on home-range estimates. J. Wildl. Manag. 2008, 72, 1813–1818. [Google Scholar]
  21. Mitchell, M.S.; Powell, R.A. Estimated home ranges can misrepresent habitat relationships on patchy landscapes. Ecol. Model. 2008, 216, 409–414. [Google Scholar] [CrossRef]
  22. Hayward, M.W.; Hofmeyr, M.; O’brien, J.; Kerley, G.I. Prey preferences of the cheetah (Acinonyx jubatus) (Felidae: Carnivora): Morphological limitations or the need to capture rapidly consumable prey before kleptoparasites arrive? J. Zool. 2006, 270, 615–627. [Google Scholar]
  23. Johnson, C.J.; Nielsen, S.E.; Merrill, E.H.; Mcdonald, T.L.; Boyce, M.S. Resource selection functions based on use-availability data: Theoretical motivation and evaluation methods. J. Wildl. Manag. 2006, 70, 347–357. [Google Scholar] [CrossRef]
  24. Johnson, D.H. The comparison of usage and availability measurements for evaluating resource preference. Ecology 1980, 61, 65–71. [Google Scholar] [CrossRef]
  25. Kauhala, K.; Saeki, M. Raccoon dog Nyctereutes procyonoides. In Status Survey and Conservation Action Plan. Canids: Foxes, Wolves, Jackals and Dogs; Sillero-Zubiri, C., Hoffmann, M., Macdonald, D.W., Eds.; IUCN Publication Services: Cambridge, UK, 2004; pp. 136–142. [Google Scholar]
  26. Pitra, C.; Schwarz, S.; Fickel, J. Going west—Invasion genetics of the alien raccoon dog Nyctereutes procynoides in Europe. Eur. J. Wildl. Res. 2010, 56, 117–129. [Google Scholar] [CrossRef]
  27. Hong, Y.; Kim, K.-S.; Lee, H.; Min, M.S. Population genetic study of the raccoon dog (Nyctereutes procyonoides) in South Korea using newly developed 12 microsatellite markers. Genes Genet. Syst. 2013, 88, 69–76. [Google Scholar] [CrossRef]
  28. Tedeschi, L.; Biancolini, D.; Capinha, C.; Rondinini, C.; Essl, F. Introduction, spread, and impacts of invasive alien mammal species in Europe. Mammal Rev. 2022, 52, 252–266. [Google Scholar] [CrossRef]
  29. Ellerman, J.R.; Morrison-Scott, T.C.S.S. Checklist of Palaearctic and Indian Mammals 1758 to 1946; British Museum: London, UK, 1966. [Google Scholar]
  30. Paulauskas, A.; GriciuvienĖ, L.; Radzijevskaja, J.; Gedminas, V. Genetic characterization of the raccoon dog (Nyctereutes procyonoides), an alien species in the Baltic region. Turk. J. Zool. 2016, 40, 933–943. [Google Scholar] [CrossRef]
  31. Kauhala, K. Habitat use of raccoon dogs (Nyctereutes procyonoides) in southern Finland. Z. Saeugetierkd. 1996, 61, 269–275. [Google Scholar]
  32. Sidorovich, V.E.; Solovej, I.A.; Sidorovich, A.A.; Dyman, A.A. Seasonal and annual variation in the diet of the raccoon dog Nyctereutes procyonoides in northern Belarus: The role of habitat type and family group. Acta Theriol. 2008, 53, 27–38. [Google Scholar] [CrossRef]
  33. Sasaki, H.; Kawabata, M. Food Habits of the raccoon dog Nyctereutes procyonoides viverrinus in a mountainous area of Japan. J. Mammal. Soc. Jpn. 1994, 19, 1–8. [Google Scholar]
  34. Akihito, S.T.; Teduka, M.; Kawada, S.-I. Long-term trends in food habits of the raccoon dog, Nyctereutes viverrinus, in the Imperial Palace, Tokyo. Bull. Natl. Mus. Nat. Sci. Ser. A 2016, 42, 143–161. [Google Scholar]
  35. Enomoto, T.; Suzuki, M.; Honda, S.; Watanabe, K.; Aikawa, E.; Nakane, A.; Saito, M.U. Early autumn diet of introduced raccoon dogs on Okushiri Island, Hokkaido, Japan. Nat. Environ. Sci. Res. 2022, 35, 19–22. [Google Scholar]
  36. Wooldridge, B.; Svenning, J.C.; Pagh, S. Habitat selection and movement patterns of the Raccoon dog (Nyctereutes procyonoides) in Denmark using GPS telemetry data. Eur. J. Wildl. Res. 2024, 70, 64. [Google Scholar] [CrossRef]
  37. Sutor, A.; Schwarz, S. Home ranges of raccoon dogs (Nyctereutes procyonoides, Gray, 1834) in Southern Brandenburg, Germany. Eur. J. Wildl. Res. 2012, 58, 85–97. [Google Scholar] [CrossRef]
  38. Saeki, M.; Johnson, P.J.; Macdonald, D.W. Movements and habitat selection of raccoon dogs (Nyctereutes procyonoides) in a mosaic landscape. J. Mammal. 2007, 88, 1098–1111. [Google Scholar] [CrossRef]
  39. Brown, J.L.; Orians, G.H. Spacing patterns in mobile animals. Ann. Rev. Ecolog. Syst. 1970, 1, 239–262. [Google Scholar] [CrossRef]
  40. Sutor, A.; Kauhala, K.; Ansorge, H. Diet of the raccoon dog Nyctereutes procyonoides—A canid with an opportunistic foraging strategy. Acta Theriol. 2010, 55, 165–176. [Google Scholar] [CrossRef]
  41. Drygala, F.; Stier, N.; Zoller, H.; Boegelsack, K.; Mix, H.M.; Roth, M. Habitat use of the raccon dog (Nyctereutes procyonoides) in north-eastern Germany. Mammal. Biol. 2008, 73, 371–378. [Google Scholar] [CrossRef]
  42. Cerkasskij, V.L. The role of the racoon dog in the epizootiology of rabies. Rabies Bull. Eur. 1981, 4, 11–13. [Google Scholar]
  43. Yoon, S.I. Crop loss survey by wildlife in national parks of Korea. Korean J. Environ. Biol. 2007, 25, 223–227. [Google Scholar]
  44. Choi, T.Y.; Park, C.H. Home-range of raccoon dog Nyctereutes procyonoides living in the rural area of Korea. J. Ecol. Environ. 2006, 29, 259–263. [Google Scholar]
  45. Kim, Y.J. Pattern Analysis of the Wildlife Casualties in Korea. Master’s Thesis, Seoul National University, Seoul, Republic of Korea, 2006; p. 16. [Google Scholar]
  46. Cha, S.Y.; Kim, E.J.; Kang, M.; Jang, S.H.; Lee, H.B.; Jang, H.K. Epidemiology of canine distemper virus in wild raccoon dogs (Nyctereutes procyonoides) from South Korea. Comp. Immunol. Microbiol. Infect. Dis. 2012, 35, 497–504. [Google Scholar] [CrossRef]
  47. Deplazes, P.; Hegglin, D.; Gloor, S.; Romig, T. Wilderness in the city: The urbanization of Echinococcus multilocularis. Trends Parasitol. 2004, 20, 77–84. [Google Scholar] [CrossRef]
  48. Sutor, A.; Schwarz, S.; Conraths, F.J. The biological potential of the raccoon dog (Nyctereutes procyonoides, Gray 1834) as an invasive species in Europe—New risks for disease spread? Acta Theriol. 2014, 59, 49–59. [Google Scholar] [CrossRef] [PubMed]
  49. Duscher, T.; Hodžić, A.; Glawischnig, W.; Duscher, G.G. The raccoon dog (Nyctereutes procyonoides) and the raccoon (Procyon lotor)—Their role and impact of maintaining and transmitting zoonotic diseases in Austria, Central Europe. Parasitol. Res. 2017, 116, 1411–1416. [Google Scholar] [CrossRef] [PubMed]
  50. Petavy, A.F.; Deblock, S.; Walbaum, S. Life cycles of Echinococcus multilocularis in relation to human infection. J. Parasitol. 1991, 77, 133–137. [Google Scholar] [CrossRef]
  51. Schantz, P.M.; Chai, J.; Craig, P.S.; Eckert, J.; Jenkins, D.J.; Macpherson, C.N.L.; Thakur, A. Epidemiology and control of hydatid disease. In Echinococcus and Hydatid Disease; Thompson, R.C.A., Lymbery, A.J., Eds.; CAB International: Boston, MA, USA, 1995; pp. 233–331. [Google Scholar]
  52. Craig, P.S.; Giraudoux, P.; Shi, D.; Bartholomot, B.; Barnish, G.; Delattre, P.; Quere, J.P.; Harraga, S.; Bao, G.; Wang, Y.; et al. An epidemiological and ecological study on human alveolar echinococcosis transmission in Gansu, China. Acta Trop. 2000, 77, 167–177. [Google Scholar] [CrossRef]
  53. Kim, M.K. A Study on the Status and Management Plan of Urban Raccoon Dogs in Seoul; Seoul Institute: Seoul, Republic of Korea, 2023; Report No.: 2023-TR-05. [Google Scholar]
  54. Brigham, R.M. Load carrying and maneuverability in an insectivorous bat: A test of the 5% “rule” of radio-telemetry. J. Mammal. 1988, 69, 379–382. [Google Scholar] [CrossRef]
  55. Lee, H.J.; Ha, J.W.; Park, S.J.; Kim, W.Y.; Cha, J.Y.; Park, J.Y.; Choi, S.S.; Chung, C.-U.; Oh, H.S. A study on the analysis of mammals’ activity patterns and the effect of human hiker interference using camera trapping. J. Asia-Pac. Biodivers. 2019, 12, 57–62. [Google Scholar] [CrossRef]
  56. Zoller, H.; Drygala, F. Activity patterns of the invasive raccoon dog (Nyctereutes procyonoides) in North East Germany. Folia Zool. 2013, 62, 290–296. [Google Scholar] [CrossRef]
  57. Boyce, M.S.; Vernier, P.R.; Nielsen, S.E.; Schmiegelow, F.K. Evaluating resource selection functions. Ecol. Model. 2002, 157, 281–300. [Google Scholar] [CrossRef]
  58. Jacobs, J. Quantitative measurement of food selection: A modification of the forage ratio and Ivlev’s electivity index. Oecologia 1974, 14, 413–417. [Google Scholar] [CrossRef] [PubMed]
  59. Kauhala, K.; Helle, E.; Taskinen, K. Home range of the raccoon dog (Nyctereutes procyonoides) in southern Finland. J. Zool. 1993, 231, 95–106. [Google Scholar] [CrossRef]
  60. Hwang, G.Y. Ecological Characteristics of Raccoon Dog (Nyctereutes procyonoides) of Korea. Master’s Thesis, Kangwon University, Chuncheon, Republic of Korea, 2007. [Google Scholar]
  61. Woo, D.G. Wildlife Habitat Conservation Plan of Leopard Cats and Raccoon Dogs in Gang-Seo Ecological Park. Master’s Thesis, Seoul National University, Seoul, Republic of Korea, 2010. [Google Scholar]
  62. Schwemmer, P.; Weiel, S.; Garthe, S. Spatio-temporal movement patterns and habitat choice of red foxes (Vulpes vulpes) and racoon dogs (Nyctereutes procyonoides) along the Wadden Sea coast. Eur. J. Wildl. Res. 2021, 67, 49. [Google Scholar] [CrossRef]
  63. Kim, B.J.; Choi, T.Y.; Park, C.H.; Kim, Y.J.; Lee, H. A brief report of the short-term home range study of a pair of raccoon dogs (Nyctereutes procyonoides koreensis) in a rural area of Gurye, Chonnam province, South Korea using radiotracking method. Korean J. Environ. Ecol. 2008, 22, 230–240. [Google Scholar]
  64. Drygala, F.; Stier, N.; Zoller, H.; Mix, H.M.; Bögelsack, K.; Roth, M. Spatial organisation and intra-specific relationship of the raccoon dog Nyctereutes procyonoides in Central Europe. Wildl. Biol. 2008, 14, 457–466. [Google Scholar]
  65. Woo, C.; Kumari, P.; Eo, K.Y.; Lee, W.-S.; Kimura, J.; Yamamoto, N. Using DNA metabarcoding and a novel canid-specific blocking oligonucleotide to investigate the composition of animal diets of raccoon dogs (Nyctereutes procyonoides) inhabiting the waterside area in Korea. PLoS ONE 2022, 17, e0271118. [Google Scholar] [CrossRef] [PubMed]
  66. Park, S.H. A Study on the Compensation Plan for Wildlife Damage to Mountain Villagers. Master’s Thesis, Seoul National University, Seoul, Republic of Korea, 2016. [Google Scholar]
  67. Kim, K.B. An Efficiency Evaluation Study Based on Resident’s Perceived Effectiveness of the Wild Animal Damage Prevention Facility Support Program in National Parks. Master’s Thesis, Sangji University, Wonju-si, Republic of Korea, 2020. [Google Scholar]
  68. Harestad, A.S.; Bunnel, F.L. Home range and body weight—A reevaluation. Ecology 1979, 60, 389–402. [Google Scholar] [CrossRef]
  69. Saïd, S.; Servanty, S. The influence of landscape structure on female roe deer home-range size. Landsc. Ecol. 2005, 20, 1003–1012. [Google Scholar] [CrossRef]
  70. Beasley, J.C.; Rhodes, O.E. Influence of patch-and landscape-level attributes on the movement behavior of raccoons in agriculturally fragmented landscapes. Can. J. Zool. 2010, 88, 161–169. [Google Scholar] [CrossRef]
  71. Kauhala, K.; Kowalczyk, R. Invasion of the raccoon dog Nyctereutes procyonoides in Europe: History of colonization, features behind its success, and threats to native fauna. Curr. Zool. 2011, 57, 584–598. [Google Scholar] [PubMed]
  72. Hirasawa, M.; Kanda, E.; Takatsuki, S. Seasonal food habits of the raccoon dog at a western suburb of Tokyo. Mammal. Study 2006, 31, 9–14. [Google Scholar]
  73. Pagh, S.; de Jonge, N.; Østergaard, S.K.; Pertoldi, C.; Wooldridge, B.; Laustsen, A.M.; Svenning, J.-C.; Pedersen, M.F.; Larsen, H.L.; Nielsen, J.L.; et al. Diet of raccoon dogs (Nyctereutes procyonoides) in Danish wetlands with focus on ground-nesting birds and amphibians. Eur. J. Wildl. Res. 2025, 71, 14. [Google Scholar] [CrossRef]
  74. Kauhala, K.; Kaybusti, M.; Helle, E. Diet of the raccoon dog, Nyctereutes procyonoides, in Finland. Zeitschrift für Säugetierkunde 1993, 58, 129–136. [Google Scholar]
  75. Enomoto, T.; Saito, M.U.; Yoshikawa, M.; Kaneko, Y. Winter diet of the raccoon dog (Nyctereutes procyonoides) in urban parks, central Tokyo. Mammal. Study 2018, 43, 275–280. [Google Scholar] [CrossRef]
  76. Takatsuki, S.; Kobayashi, K. Seasonal changes in the diet of urban raccoon dogs in Saitama, eastern Japan. Mammal. Study 2023, 48, 203–213. [Google Scholar] [CrossRef]
  77. Šálek, M.; Drahníková, L.; Tkadlec, E. Changes in home range sizes and population densities of carnivore species along the natural to urban habitat gradient. Mammal. Rev. 2015, 45, 1–14. [Google Scholar] [CrossRef]
  78. Baghli, A.; Verhagen, R. Home ranges and movement patterns in a vulnerable polecat Mustela putorius population. Acta Theriologica 2004, 49, 247–258. [Google Scholar] [CrossRef]
  79. Downs, J.A.; Horner, M.W. Analysing infrequently sampled animal tracking data by incorporating generalized movement trajectories with kernel density estimation. Comput. Environ. Urban Syst. 2012, 36, 302–310. [Google Scholar] [CrossRef]
  80. Row, J.R.; Blouin-Demers, G. Kernels are not accurate estimators of home-range size for herpetofauna. Copeia 2006, 2006, 797–802. [Google Scholar] [CrossRef]
  81. Kauhala, K.; Holmala, K.; Lammers, W.; Schregel, J. Home ranges and densities of medium-sized carnivores in south-east Finland, with special reference to rabies spread. Acta Theriol. 2006, 51, 1–13. [Google Scholar] [CrossRef]
  82. Holmala, K.; Kauhala, K. Habitat use of medium-sized carnivores in southeast Finland—Key habitats for rabies spread? Ann. Zoo. Fenn. 2009, 46, 233–246. [Google Scholar] [CrossRef]
  83. Schwarz, S.; Sutor, A.; Staubach, C.; Mattis, R.; Tackmann, K.; Conraths, F.J. Estimated prevalence of Echinococcus multilocularis in raccoon dogs Nyctereutes procyonoides in northern Brandenburg, Germany. Curr. Zool. 2011, 57, 655–661. [Google Scholar] [CrossRef]
  84. Harris, S.; Cresswell, W.J.; Forde, P.G.; Trewhella, W.J.; Woollard, T.; Wray, S. Home-range analysis using radiotracking data: A review of problems and techniques particularly as applied to the study of mammals. Mammal. Rev. 1990, 20, 97–123. [Google Scholar] [CrossRef]
  85. Novikov, G.A.; Novikov, G.A. Carnivorous Mammals of the Fauna of the USSR; Israel Program for Scientific Translations: Jerusalem, Israel, 1962; Volume 62. [Google Scholar]
  86. Stroganov, S.V. Carnivorous Mammals of Siberia; Israel Program for Scientific Translations: Jerusalem, Israel, 1969; pp. 65–73. [Google Scholar]
  87. Mitsuhashi, I.; Sako, T.; Teduka, M.; Koizumi, R.; Saito, M.U.; Kaneko, Y. Home range of raccoon dogs in an urban green area of Tokyo, Japan. J. Mammal. 2018, 99, 732–740. [Google Scholar] [CrossRef]
  88. Lechowicz, M.J. The sampling characteristics of electivity indices. Oecologia 1982, 52, 22–30. [Google Scholar] [CrossRef]
  89. Kauhala, K.; Auttila, M. Estimating habitat selection of badgers—A test between different methods. Folia Zool. 2010, 59, 16–25. [Google Scholar] [CrossRef]
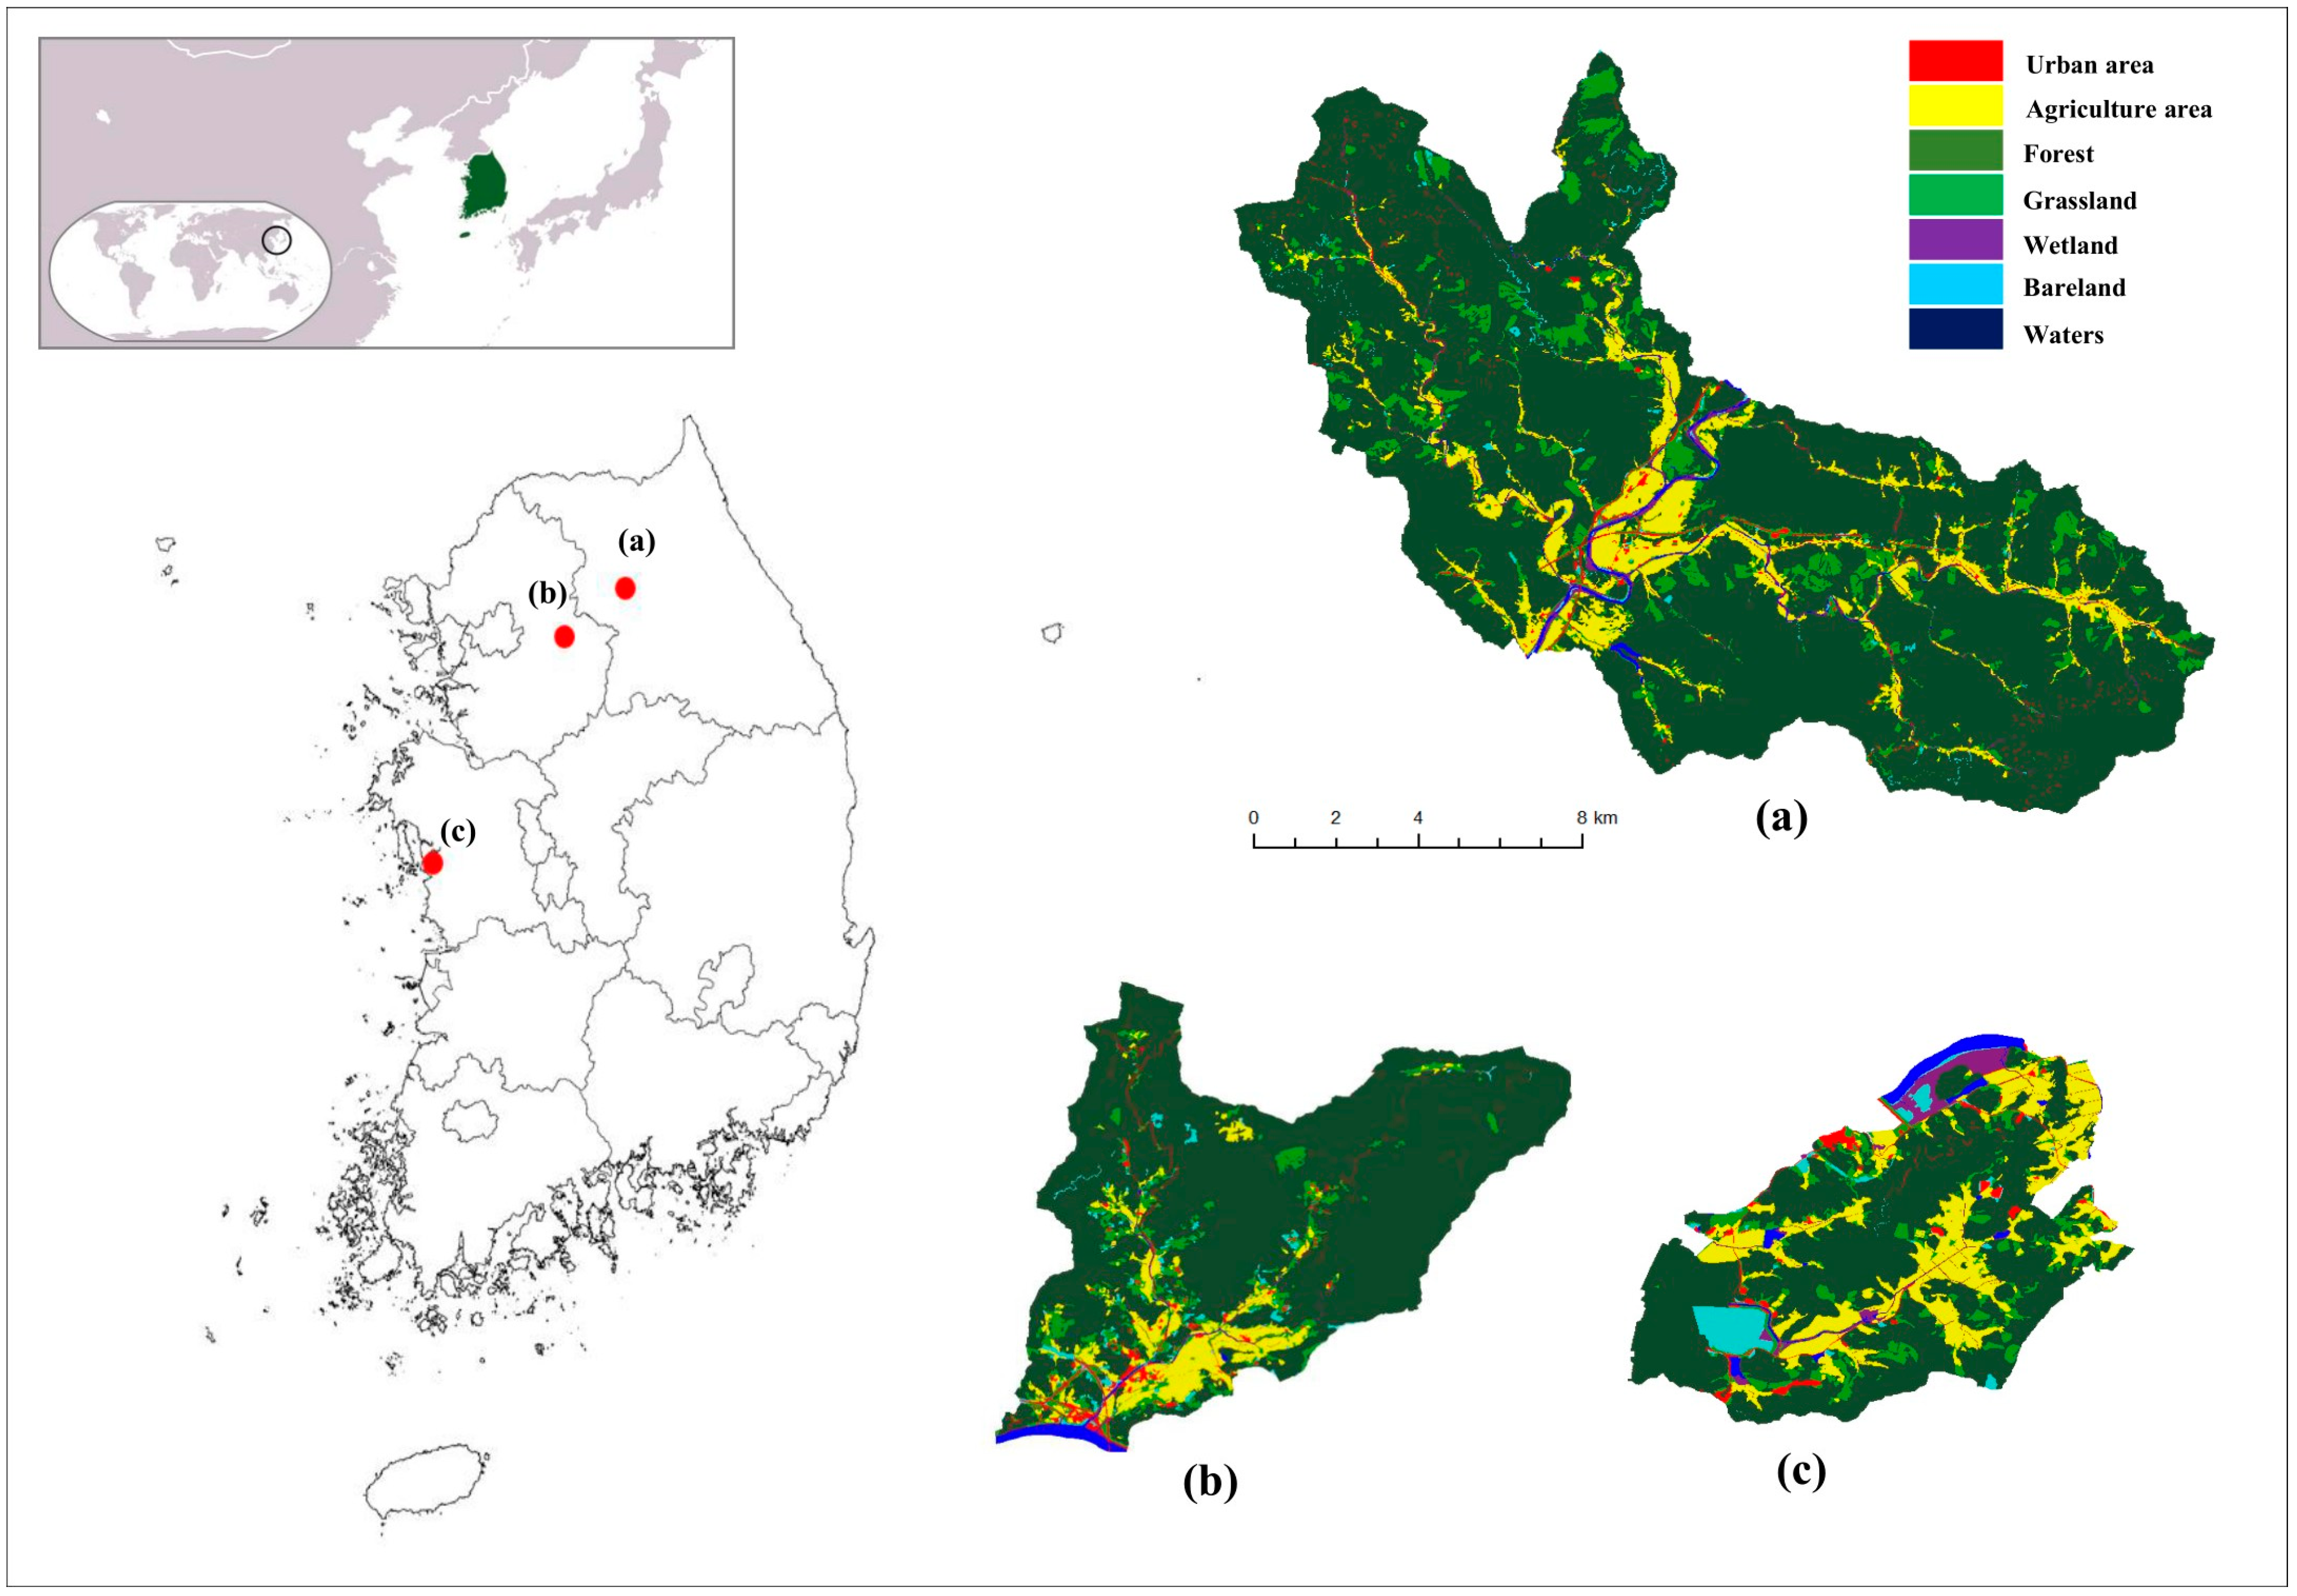
Figure 1. Study Areas: (a) Hwachon-myeon, Hongcheon-gun (37°44′ N, 127°58′ E), (b) Okcheon-myeon, Yangpyeong-gun (37°32′ N, 127°28′ E), and (c) Ocheon-myeon, Boryeong-si (36°25′ N, 126°31′ E). The land use and land cover proportions for each area are presented.
Forests 16 01588 g001
Figure 2. Land use distribution in the study area based on GPS data points. Land use is represented as a percentage for kernel density estimation (KDE) and minimum convex polygon (MCP) method. Kernel 50% = 50% fixed kernel home range, Kernel 70% = 70% fixed kernel home range, Kernel 95% = 95% fixed kernel home range. Values are presented as mean ± standard error (SE). Point refers to the percentage of land use for the measured GPS points (a) Yangpyeong (n = 1528), (b) Boryeong (n = 1108), and (c) Hongcheon (n = 75).
Forests 16 01588 g002
Figure 3. Habitat preferences of raccoon dogs within the study area, as determined by the Jacob index (second-order selection, third-order selection). Values approaching 1 indicate higher preference, while values closer to −1 suggest avoidance.
Forests 16 01588 g003
Figure 4. Mean Jacobs index (J) with 95% bootstrap CIs by KDE 50, 70 and 95 (Second-order selection, Third-order selection). Points indicate habitat-specific mean J; horizontal bars are 95% percentile bootstrap Cis (R = 2000). J entirely below 0 indicate avoidance and those entirely above 0 indicate preference; Land use classes that remained statistically significant in a two-sided exact sign test after Holm correction are marked with * (* p < 0.05, ** p < 0.01).
Forests 16 01588 g004
Table 1. Individual information for each raccoon dog includes tracker ID, location, sex, capture date, duration, total number of points and GPS acquisition rate. All captured raccoon dogs were adults. ‘Location’ indicates where the raccoon dog was captured, ‘capture date’ is the date of capture, ‘total number of points’ refers to the total number of points recorded for the raccoon dogs. ‘GPS acquisition rate’ represents the actual GPS acquisition rate of each individual.
Tracker IDLocationSexCaptured DateDurationTotal Number of PointGPS Acquisition Rate (%)
H01HongcheonM29 June 202230 June 2022–1 October 20224829.96
H02HongcheonF18 June 202219 June 2022–1 October 20225335.07
Y01YangpyeongF3 November 20214 November 2021–7 December 202117450.57
Y02YangpyeongM10 November 202111 November 2021–30 November 202110578.10
Y03YangpyeongM24 November 202125 November 2021–23 April 202274861.96
Y04YangpyeongM8 December 20219 December 2021–25 July 2022116310.92
Y05YangpyeongM12 February 202213 February 2022–13 March 202215438.96
Y06YangpyeongM10 March 202211 March 2022–29 June 202256965.91
Y07YangpyeongF11 March 202212 March 2022–12 June 202247471.73
B01BoryeongF23 November 202124 November 2021–1 October 2022136861.04
B02BoryeongF5 June 20226 June 2022–1 October 20225984.85
B03BoryeongF26 August 202227 August 2022–1 October 202219077.89
B04BoryeongF5 September 20226 September 2022–1 October 202213372.18
Table 2. Average home range size (km2) for GPS tracked raccoon dogs (Nyctereutes procyonoides). A total of 2711 GPS points were utilized for measuring the home range of raccoon dogs. Home range was determined using the kernel density estimation (KDE) technique at levels of 50%, 70%, and 95% and the minimum convex polygon (MCP) method at the 100% level. The actual measured area and the percentage area are expressed as mean ± standard error (SE). Point refers to the number of points marked based on GPS coordinates. Land use, which was assessed based on points, KDE, and MCP measurements, included urban, agricultural, forest, grassland, wetland, bareland, and water area.
All (Mean ± SE)PointKernel 50%Kernel 70%Kernel 95%MCP 100%
Land Use-ValueCount%Area (Km2)%Area (Km2)%Area (Km2)%Area (Km2)%
Urban area6.00 ± 2.373.62 ± 0.830.00 ± 0.002.71 ± 0.800.00 ± 0.002.90 ± 0.850.01 ± 0.003.20 ± 0.840.04 ± 0.012.65 ± 0.58
Agricultural area40.92 ± 15.5120.13 ± 3.730.06 ± 0.0120.48 ± 4.200.030 ± 0.0119.57 ± 4.040.06 ± 0.0217.86 ± 3.940.16± 0.0511.46 ± 3.24
Forest97.08 ± 32.5441.14 ± 3.920.03 ± 0.0145.81 ± 5.070.07 ± 0.0250.65 ± 5.340.20 ± 0.0656.19 ± 5.080.94 ± 0.2768.51 ± 4.51
Grassland47.85 ± 16.5022.59 ± 2.760.08 ± 0.0122.31 ± 3.290.03 ± 0.0119.11 ± 2.120.06 ± 0.0115.99 ± 1.370.15 ± 0.0311.30 ± 1.51
Wetland4.23 ± 2.183.79 ± 2.510.00 ± 0.003.19 ± 3.310.00 ± 0.002.75 ± 2.210.01 ± 0.002.31 ± 1.340.02 ± 0.011.54 ± 0.59
Bareland11.38 ± 3.467.74 ± 2.830.00 ± 0.004.93 ± 5.680.01 ± 0.004.37 ± 5.210.01 ± 0.003.61 ± 3.580.04 ± 0.012.92 ± 1.03
Waters1.08 ± 0.681.00 ± 0.840 ± 0.000.57 ± 0.800.00 ± 0.000.66 ± 0.690.00 ± 0.000.85 ± 0.570.02 ± 0.011.62 ± 0.47
total208.541000.081000.151000.351001.37100
Disclaimer/Publisher’s Note: The statements, opinions and data contained in all publications are solely those of the individual author(s) and contributor(s) and not of MDPI and/or the editor(s). MDPI and/or the editor(s) disclaim responsibility for any injury to people or property resulting from any ideas, methods, instructions or products referred to in the content.