Article

Landscape Metric-Enhanced Vegetation Restoration: Improving Spatial Suitability on Loess Plateau

College of Landscape Architecture and Art, Northwest A&F University, Yangling 712100, China
*
Author to whom correspondence should be addressed.
Forests 2025, 16(10), 1569; https://doi.org/10.3390/f16101569
Submission received: 31 July 2025 / Revised: 26 September 2025 / Accepted: 9 October 2025 / Published: 11 October 2025
(This article belongs to the Section Forest Ecology and Management)

Abstract

Ecological restoration of the Loess Plateau plays a pivotal role in mitigating land degradation and promoting regional sustainability. In this study, landscape pattern metrics were integrated into the MaxEnt model to evaluate the influence of landscape configuration on restoration planning. Nine representative species from three vegetation strata—herbs, shrubs, and trees—were selected based on ecological suitability. A comprehensive set of variables, including environmental, anthropogenic, and landscape metrics, was constructed for modeling. Results demonstrate that incorporating landscape metrics significantly enhanced the spatial explanatory power, providing a robust supplement to traditional ecological restoration assessments. Distinct responses to landscape structure were observed among vegetation types: herb species were more sensitive to patch aggregation and connectivity, shrubs preferred regular edges and larger patch size, while tree species favored extensive, low-fragmentation core habitats. Vertical structure optimization revealed that while large areas were suitable for single vegetation layers, composite vegetation configurations were more appropriate in certain central and southern subregions. These findings underscore the importance of landscape structure in guiding restoration strategies and serve as a basis for designing ecologically coherent and spatially targeted vegetation restoration plans on the Loess Plateau.

1. Introduction

Amidst accelerating global environmental change, ecosystem restoration and sustainable management have emerged as central themes in ecology and landscape science [1,2]. The Loess Plateau of China—characterized by extreme ecological vulnerability—faces ongoing problems of vegetation degradation, soil erosion, and habitat fragmentation, posing significant threats to regional ecological security [3,4]. A critical step toward effective restoration is the spatial identification of suitable species and the optimization of vegetation configuration at the landscape scale, which is essential for enhancing ecosystem stability, strengthening ecological services, and enabling sustainable land-use planning [5,6].
Species Distribution Models (SDMs) provide a robust framework for predicting the potential spatial distribution of plant species [7]. Among these, the MaxEnt model—based on the principle of maximum entropy—has gained widespread adoption due to its high predictive accuracy and suitability for presence-only data [8,9,10]. However, traditional MaxEnt applications often emphasize climatic, topographic, edaphic, and anthropogenic variables [11,12], while largely neglecting the structural role of landscape structure in influencing species survival, dispersal, and establishment.
Landscape metrics, which quantitatively depict spatial patterns of landscape structure, are useful for examining the relationships between ecological processes and landscape attributes such as patch number, size, edge complexity, and connectivity [13,14]. Key indicators—such as Patch Density (PD) [15], Largest Patch Index (LPI) [16], Landscape Shape Index (LSI) [17], and Edge Density (ED) [18]—have been increasingly integrated into SDMs to improve ecological realism and spatial explanatory power. In the context of ecological restoration, growing evidence suggests that incorporating landscape metrics can improve the ecological relevance and spatial accuracy of species distribution modeling. For example, Hasui et al. [14] reported that fragmentation indices (e.g., Patch area, Patch Number, Percentage of forest) significantly influenced habitat suitability in mosaic landscapes, while Pei et al. [19] demonstrated that landscape metrics (e.g., PD, LPI, CONTAG) helped delineate restoration priority zones in degraded ecosystems. Similarly, Goicolea et al. [20] emphasized that landscape connectivity and core area indices are critical in guiding species selection and planting layout in large-scale revegetation projects. These findings point to the critical role of landscape spatial patterns in guiding restoration planning, as a necessary step toward aligning spatial simulation outputs with real-world ecological processes and restoration targets [21,22,23].
Studies often focus on single species or treat landscape metrics merely as background layers [24,25,26], without systematically examining how different vegetation types (trees, shrubs, herbs) respond to landscape structure. This gap hinders the development of an integrated “nature–society–landscape” framework [27,28]. To fill this gap, we propose a multidimensional framework that links natural factors, human activities, and landscape structure. In the Loess Plateau, where ecosystems are fragile and human pressures are strong, such an approach provides a more complete understanding of vegetation recovery and supports restoration planning that balances ecological potential with social needs. Due to the distinct ecological functions, resource use strategies, and structural adaptations across vegetation types, a stratified approach is required [29,30,31]. Tree species, with high biomass accumulation and long lifespans, are typically suited to stable, core habitat patches; shrub species are more sensitive to edge effects, making them suitable for transitional zones; herb species, due to their rapid response to microenvironmental changes and landscape connectivity, often serve as pioneers in early restoration phases.
This study aims to develop a multidimensional SDM framework that integrates natural factors at landscape level (e.g., precipitation, temperature, radiation), anthropogenic influences (e.g., population density, gross domestic product), and a group of ten landscape metrics (e.g., PD, LPI, LSI). Herb, shrub, and tree species constitute the three primary functional vegetation types driving ecological restoration on the Loess Plateau. These groups perform complementary roles—herbs stabilize soil and retain moisture, shrubs improve soil structure, and trees provide long-term ecosystem stability. Their selection enables a comprehensive assessment of how distinct plant life forms respond to landscape configuration and environmental gradients, while reflecting the region’s stratified restoration paradigm of integrated grass–shrub–tree assemblages. We focus on nine representative species widely used in restoration efforts across the Loess Plateau, and this landscape-enhanced modeling approach has demonstrated significant potential in previous ecological and restoration studies [32,33,34].
This study is built upon the following hypotheses: (1) Landscape metrics reveal the critical influence of landscape configuration on vegetation restoration, demonstrating that increasing landscape integrity drives transitions from fragmented and dispersed habitats to more continuous and aggregated distributions. (2) Different vegetation types exhibit distinct ecological responses to landscape structural attributes, reflecting their varying ecological strategies and habitat dependencies. (3) Examining vertical vegetation assemblages is expected to identify additional areas with high restoration potential, as species-specific suitability patterns across multiple layers can reveal opportunities for ecologically compatible configurations.
These hypotheses are tested using a multidimensional species distribution modeling framework that integrates natural, anthropogenic, and landscape-structural variables to guide spatially explicit vegetation restoration planning within the Loess Plateau region.

2. Materials and Methods

2.1. Study Area

Situated in northern China, the Loess Plateau is globally recognized as a paradigmatic region of severe soil erosion and ecological fragility. Spanning approximately 640,000 square kilometers, it stretches from 33°30′ to 41°30′ N and 100°54′ to 114°33′ E, encompassing parts of seven provincial-level administrative regions: Shaanxi, Shanxi, Gansu, Ningxia, Inner Mongolia, Henan, and Qinghai (Figure 1a). The landscape consists mainly of croplands interspersed with forests and grasslands (Figure 1b). This region experiences a temperate continental monsoon climate with marked seasonal changes: mean annual temperatures generally fall between −9.6 °C and 15.3 °C, decreasing from the southeast toward the northwest (Figure 1c), and annual rainfall spans roughly 130–915 mm (Figure 1d; National Tibetan Plateau Data Center, http://data.tpdc.ac.cn, accessed on 4 February 2025). Owing to its unique topographic and environmental conditions, the Loess Plateau serves as a critical model system for studying vegetation restoration, species distribution, and landscape pattern dynamics. A growing body of evidence highlights that vegetation recovery in this region is not solely governed by climatic and edaphic factors, but is also profoundly shaped by the spatial configuration of landscapes [35,36].

2.2. Research Framework

In this work, we develop a MaxEnt-based analytical framework (Figure 2) that evaluates how landscape metrics, together with anthropogenic influences and environmental conditions, influence habitat suitability for vegetation restoration across the Loess Plateau. Initially, distribution point data for nine species (three species each from herb, shrub, and tree layers) were obtained, along with relevant natural environmental, human activity, and land-use data. The nine selected species are widely recognized in both research and practice as dominant taxa well-suited for ecological restoration of the Loess Plateau, owing to their strong environmental adaptability and extensive application in regional vegetation recovery projects. Based on species-specific growth conditions (e.g., temperature, precipitation, soil), distribution point data and land-use information were integrated in R 4.5.0, where landscape metrics were calculated at the class level using the landscapemetrics package, resulting in the development of a factor indicator system. A total of 43 environmental factors (Table A1) across four categories were pre-processed to ensure consistent data range, pixel size, and row/column alignment. These data were then input into the MaxEnt model for preliminary predictions, providing species suitability maps, factor contribution rates, and response curves. Due to correlations among factors (Figure A1), a factor selection process was performed before applying MaxEnt for secondary validation. Cross-grid comparisons of land suitability for the three vegetation layers were conducted, and based on the principle of maximum suitability, the most suitable species for each layer were selected. The horizontal spatial distribution of herb, shrub, and tree species were then mapped, and their overlap was used to construct the vertical vegetation structure, thereby enhancing how species are spatially arranged to support vegetation restoration throughout the Loess Plateau.

2.3. Data Collection and Processing

In this study, species distribution records were obtained from the Global Biodiversity Information Facility via the Global Resources Data Cloud (http://www.gis5g.com, accessed on 3 January 2025). Occurrence data for nine representative species across three vegetation layers were obtained—herb species (Agropyron cristatum (L.) Gaertn [37], Avena sativa L. [38], and Medicago sativa L. [39]); shrub species (Forsythia suspensa (Thunb.) Vahl [40], Caragana korshinskii Kom. [41], and Hippophae rhamnoides L. [42]) and tree species (Robinia pseudoacacia L. [43], Salix matsudana Koidz. [44], and Pinus tabuliformis Carr. [45]). Records outside the study area and spatial autocorrelation or duplicate records were removed, and the remaining data were formatted as CSV for MaxEnt modeling.
Drawing on an extensive survey of published studies and available datasets, this study selected 43 environmental, social, and spatial structural factors. Among these, 29 ecological factors were included, subdivided into climate factors (19), topographic and vegetation factors (5), and soil factors (5). Climate information was obtained from the WorldClim 2020 global climate dataset (https://worldclim.org, accessed on 12 January 2025), including variables such as mean annual temperature, seasonal precipitation, and temperature seasonality. Topographic and vegetation data, including elevation, slope, aspect, and NDVI, were obtained from the Resource and Environmental Science Data Center of the Chinese Academy of Sciences. Soil data, including pH, total nitrogen (TN), total phosphorus (TP), and total potassium (TK), were derived from the FAO global soil database and the Chinese Soil Grid Database from the “Spatiotemporal Environmental Big Data Platform.” Social factors included population density (POP), per capita GDP (GDP), and the distances from forestland to roads (RW) and water sources (WW). Socioeconomic indicators (e.g., GDP, population density) reflect human influences such as investment capacity, infrastructure development, and land-use decisions, all of which shape vegetation restoration potential. Luo et al. [46] demonstrated that incorporating anthropogenic variables significantly improved predictions of unsuitable restoration areas in the Loess Plateau, indicating that environmental factors alone are insufficient to explain restoration feasibility.
This study employs ten landscape metrics to assess landscape structure, namely patch number, area, shape complexity, and connectivity. These include Class Area (CA), Patch Number (NP), Patch Density (PD), Percent Landscape Area (PLAND), Largest Patch Index (LPI), Edge Density (ED), Landscape Shape Index (LSI), Mean Patch Area (AREA_MD), Aggregation Index (AI) and Nearest Neighbor Distance (ENN_MN).
Landscape metrics were calculated using the landscapemetrics R 4.5.0 package at class level. Ten indices were selected, including CA, NP, PD, PLAND, LPI, ED, LSI, AREA_MD, AI and ENN_MN. We tested the sensitivity of buffer scales (500, 1000, 2000 m) by regressing landscape metrics against species distribution probability. Model performance was evaluated using R2 and significance levels, allowing us to identify the buffer radius that best represented species–landscape relationships. (Table A2). The localized buffer approach was applied, assigning buffer radii of 500 m for herbs, 1000 m for shrubs, and 2000 m for trees. Raster interpolation was performed using IDW in ArcGIS 10.8, and all layers were resampled to 1 km resolution and projected to WGS_1984_UTM_Zone_49N. All variables were exported in ASCII format for integration into MaxEnt 3.4.1 and ENMTools 1.1.5.

2.4. MaxEnt Prediction

2.4.1. MaxEnt Model Construction

First, the pre-processed species occurrence data for the nine species and the 43 environmental factors were input into MaxEnt version 3.4.1 for initial model construction and prediction. This step provided the contribution rates of each factor to the species’ distribution. Next, pairwise correlations among the 43 variables were assessed using the correlation tool in ENMTools 1.1.5, producing a correlation matrix and identifying those with absolute correlation coefficients greater than 0.8. To further address multicollinearity, variance inflation factor (VIF) analysis was conducted, and variables with VIF values exceeding 10 were excluded, following established ecological modeling guidelines [47]. In addition, the ecological relevance of variables was considered by evaluating their contributions to species distribution in the initial model. For correlated sets of variables, the one with the lower contribution was removed, while the dominant variable was retained. Finally, the refined set of dominant variables, together with the species occurrence records, was reintroduced into MaxEnt 3.4.1 for a second round of model construction and validation.
To evaluate the ecological validity of the model predictions, a field survey was conducted at 20 sampling plots strategically distributed across high-, medium-, and low-suitability zones predicted by the model. A stratified sampling approach was adopted to ensure adequate representation of varying landscape structures and habitat conditions [48,49].
At each plot, field measurements included dominant species composition, vegetation type, canopy cover, patch boundary configuration, and visible human disturbances, following protocols widely applied in species distribution modeling validation [50,51].

2.4.2. Vegetation Restoration Suitability Distribution Assessment and Structural Optimization

Within this research, the ASCII-format outputs generated by MaxEnt 3.4.1 were transformed into raster layers through ArcGIS 10.8.1’s “ASCII to Raster” tool. The pixel values (p) indicate predicted species-suitability probabilities, which span the 0–1 range. Using the “Reclassify” function in Spatial Analyst and adhering to the classification system of [52], habitat suitability was classified into four levels—unsuitable (p < 0.05), marginally suitable (0.05 ≤ p < 0.33), moderately suitable (0.33 ≤ p < 0.66), and highly suitable (p ≥ 0.66).
Three representative species from each vegetation layer (trees, shrubs, herbs) were chosen with the objective of optimizing the spatial structure of vegetation. Using the “Raster Calculator,” pixel-wise comparisons were performed to identify the species with the highest suitability value within each layer. This process generated optimal distribution maps for each vegetation group.
Finally, the suitability maps of the three layers were overlaid to determine the optimal vertical planting structure. Each pixel was assigned to one of seven structural types: single-layer (herb, shrub, or tree), two-layer (herb + shrub, herb + tree, shrub + tree), or three-layer composite (herb + shrub + tree). This framework supports the spatial design of multi-layered vegetation restoration across the Loess Plateau.

3. Results

3.1. Evaluation of the Improvement in Model Predictions by Incorporating Landscape Metrics as Predictive Variables

The close agreement between the predicted omission rate and the cross-validation results indicated that the MaxEnt model possessed strong spatial generalization ability. ROC curve analysis further demonstrated that the AUC values for all nine representative species exceeded 0.90, confirming the model’s high capacity to discriminate between suitable and unsuitable habitats [53]. In addition, to avoid overfitting, we compared omission rates across two models and selected the more stable one. The results showed that the model incorporating landscape pattern indices was more stable.
Building on this baseline performance, the inclusion of landscape metrics further enhanced the models. When combined with environmental and anthropogenic variables, the Area Under Curve values for all species increased from the initial range of 0.91–0.97 to 0.97–0.99, indicating improved predictive accuracy (Table 1).
Jackknife analysis (Figure 3) revealed that landscape metrics contributed significantly to model performance. In contrast, the training gain associated with soil variables (SOM, TN, TP, TK) was reduced after introducing landscape metrics, though their removal still decreased overall gain. This indicates their continued relevance under certain spatial conditions.

3.2. Comparison of Species Suitability Spatial Patterns with and Without Landscape Metrics

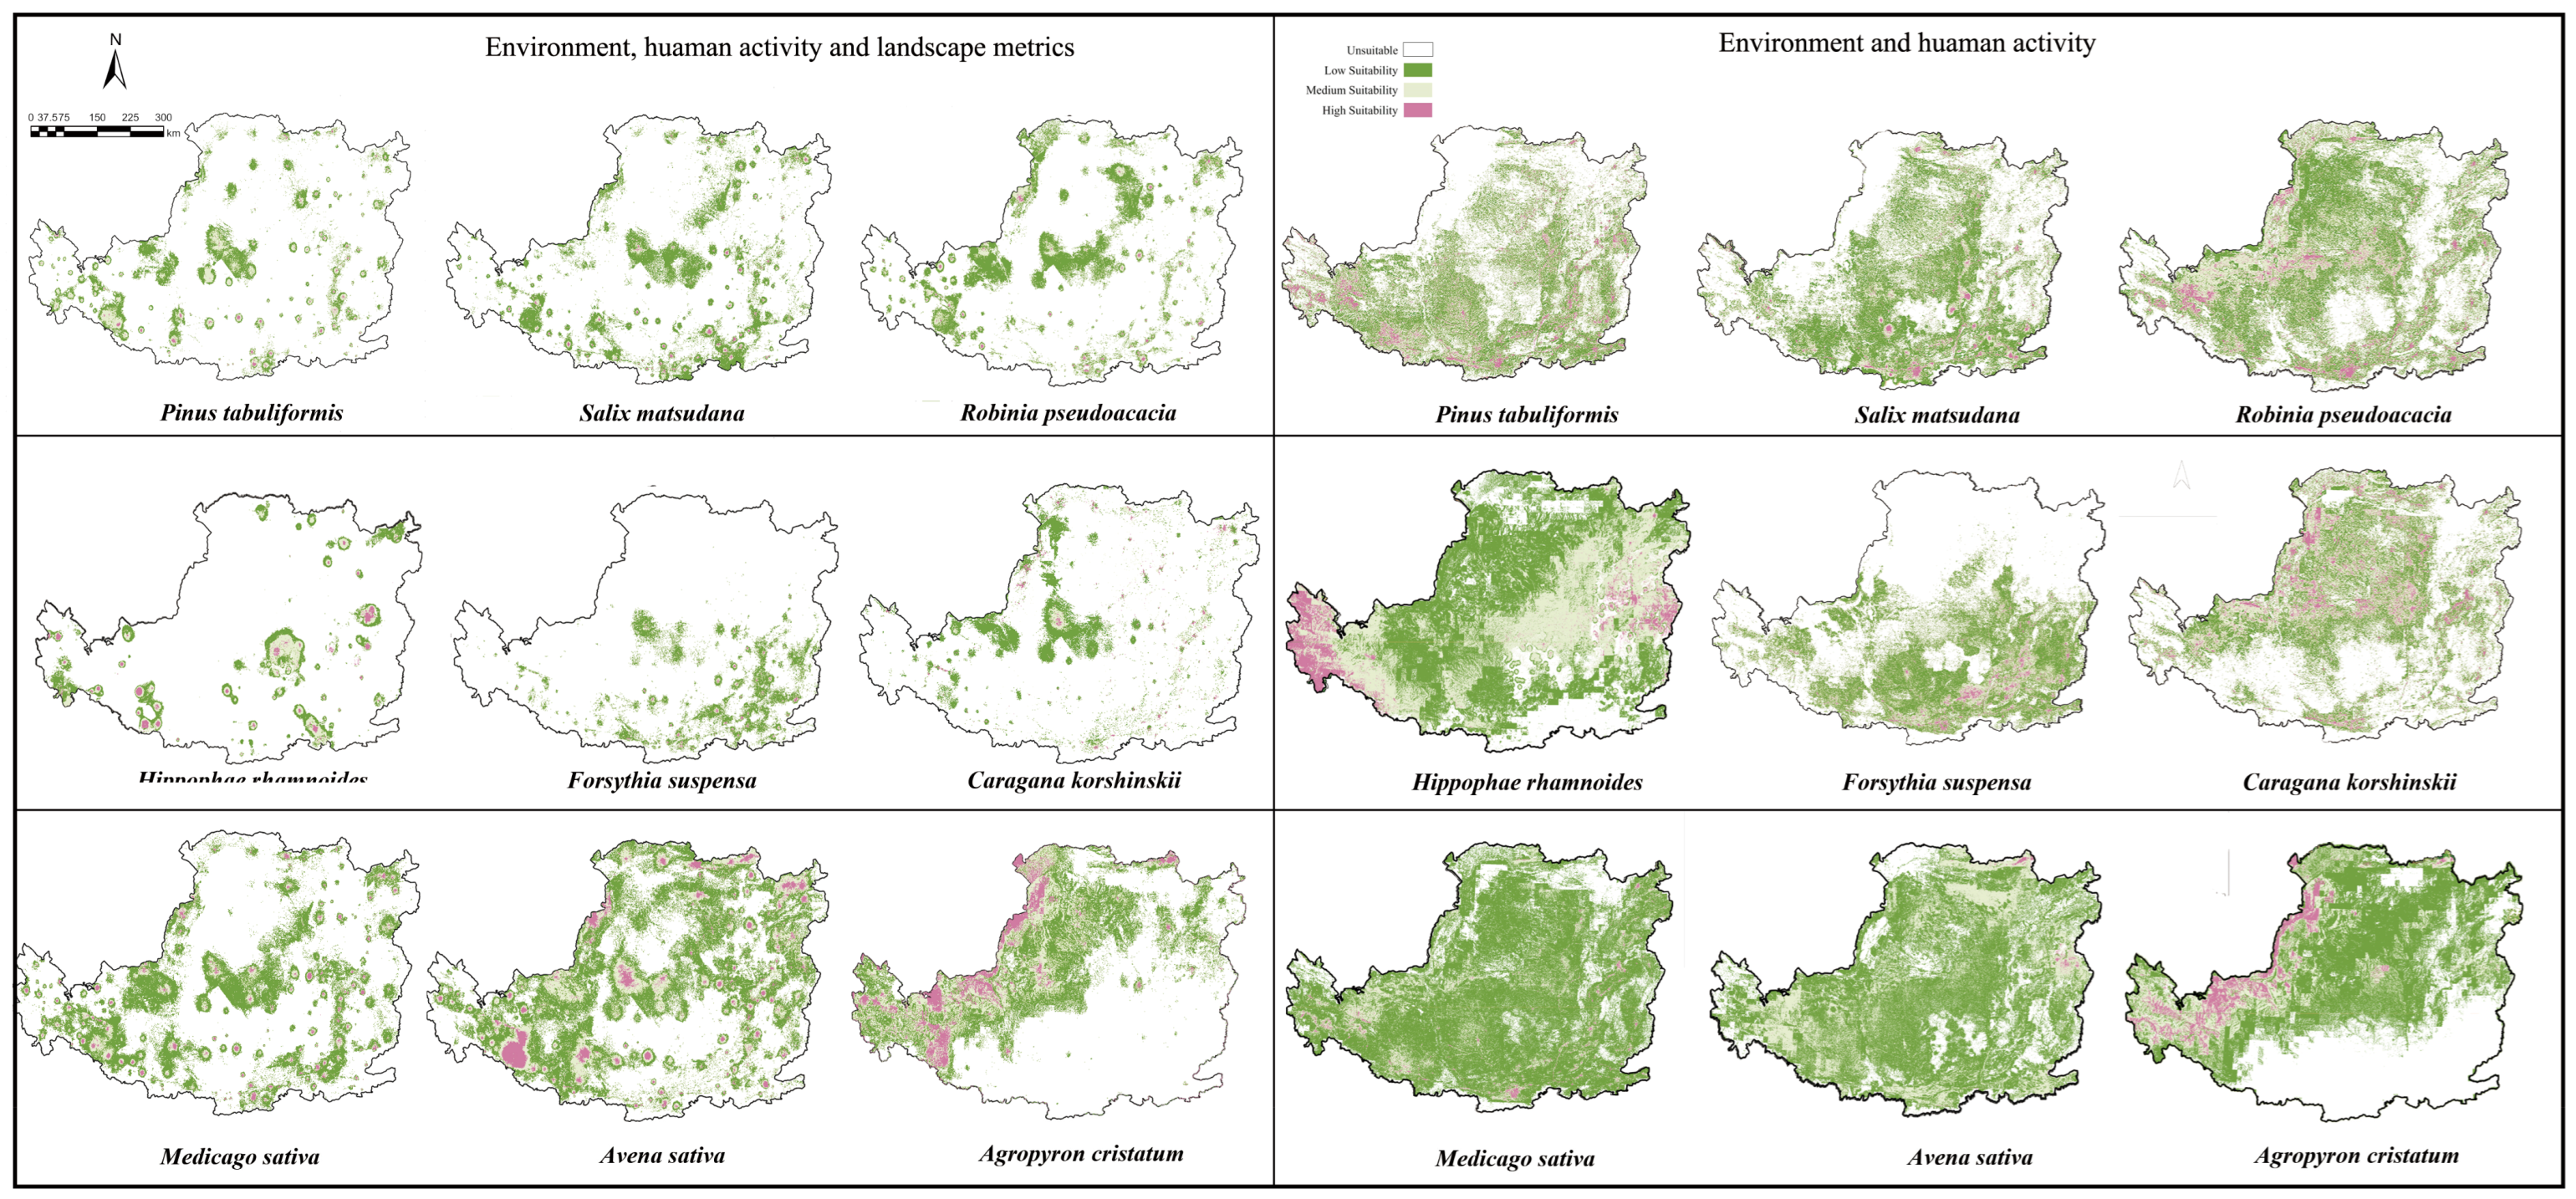
When landscape metrics were incorporated as predictive variables, notable modifications emerged in the spatial patterns of vegetation suitability. Compared with models that relied only on environmental and human factors, models with landscape metrics gave more cohesive and structured spatial outputs. Areas of high suitability became more clustered, with smoother boundaries and more regular patch shapes across most species.
As shown in Figure 4, the contrast is particularly pronounced for herb species such as M. sativa, A. sativa, and A. cristatum. Under the conventional model, these species exhibited widespread and dispersed high-suitability patches. After landscape metrics were added, these areas contracted and concentrated in continuous regions, showing the importance of landscape connectivity and core patch integrity.
Similarly, shrub species (H. rhamnoides, F. suspensa, and C. korshinskii) also showed notable spatial consolidation. Their suitable areas became less fragmented and more structured, reflecting an improved match between model predictions and known ecological preferences. In contrast, tree species (P. tabuliformis, S. matsudana, and R. pseudoacacia) displayed relatively smaller spatial changes; however, the high-suitability zones became more confined to large, intact forest patches, with clearer exclusion of marginal or fragmented areas.
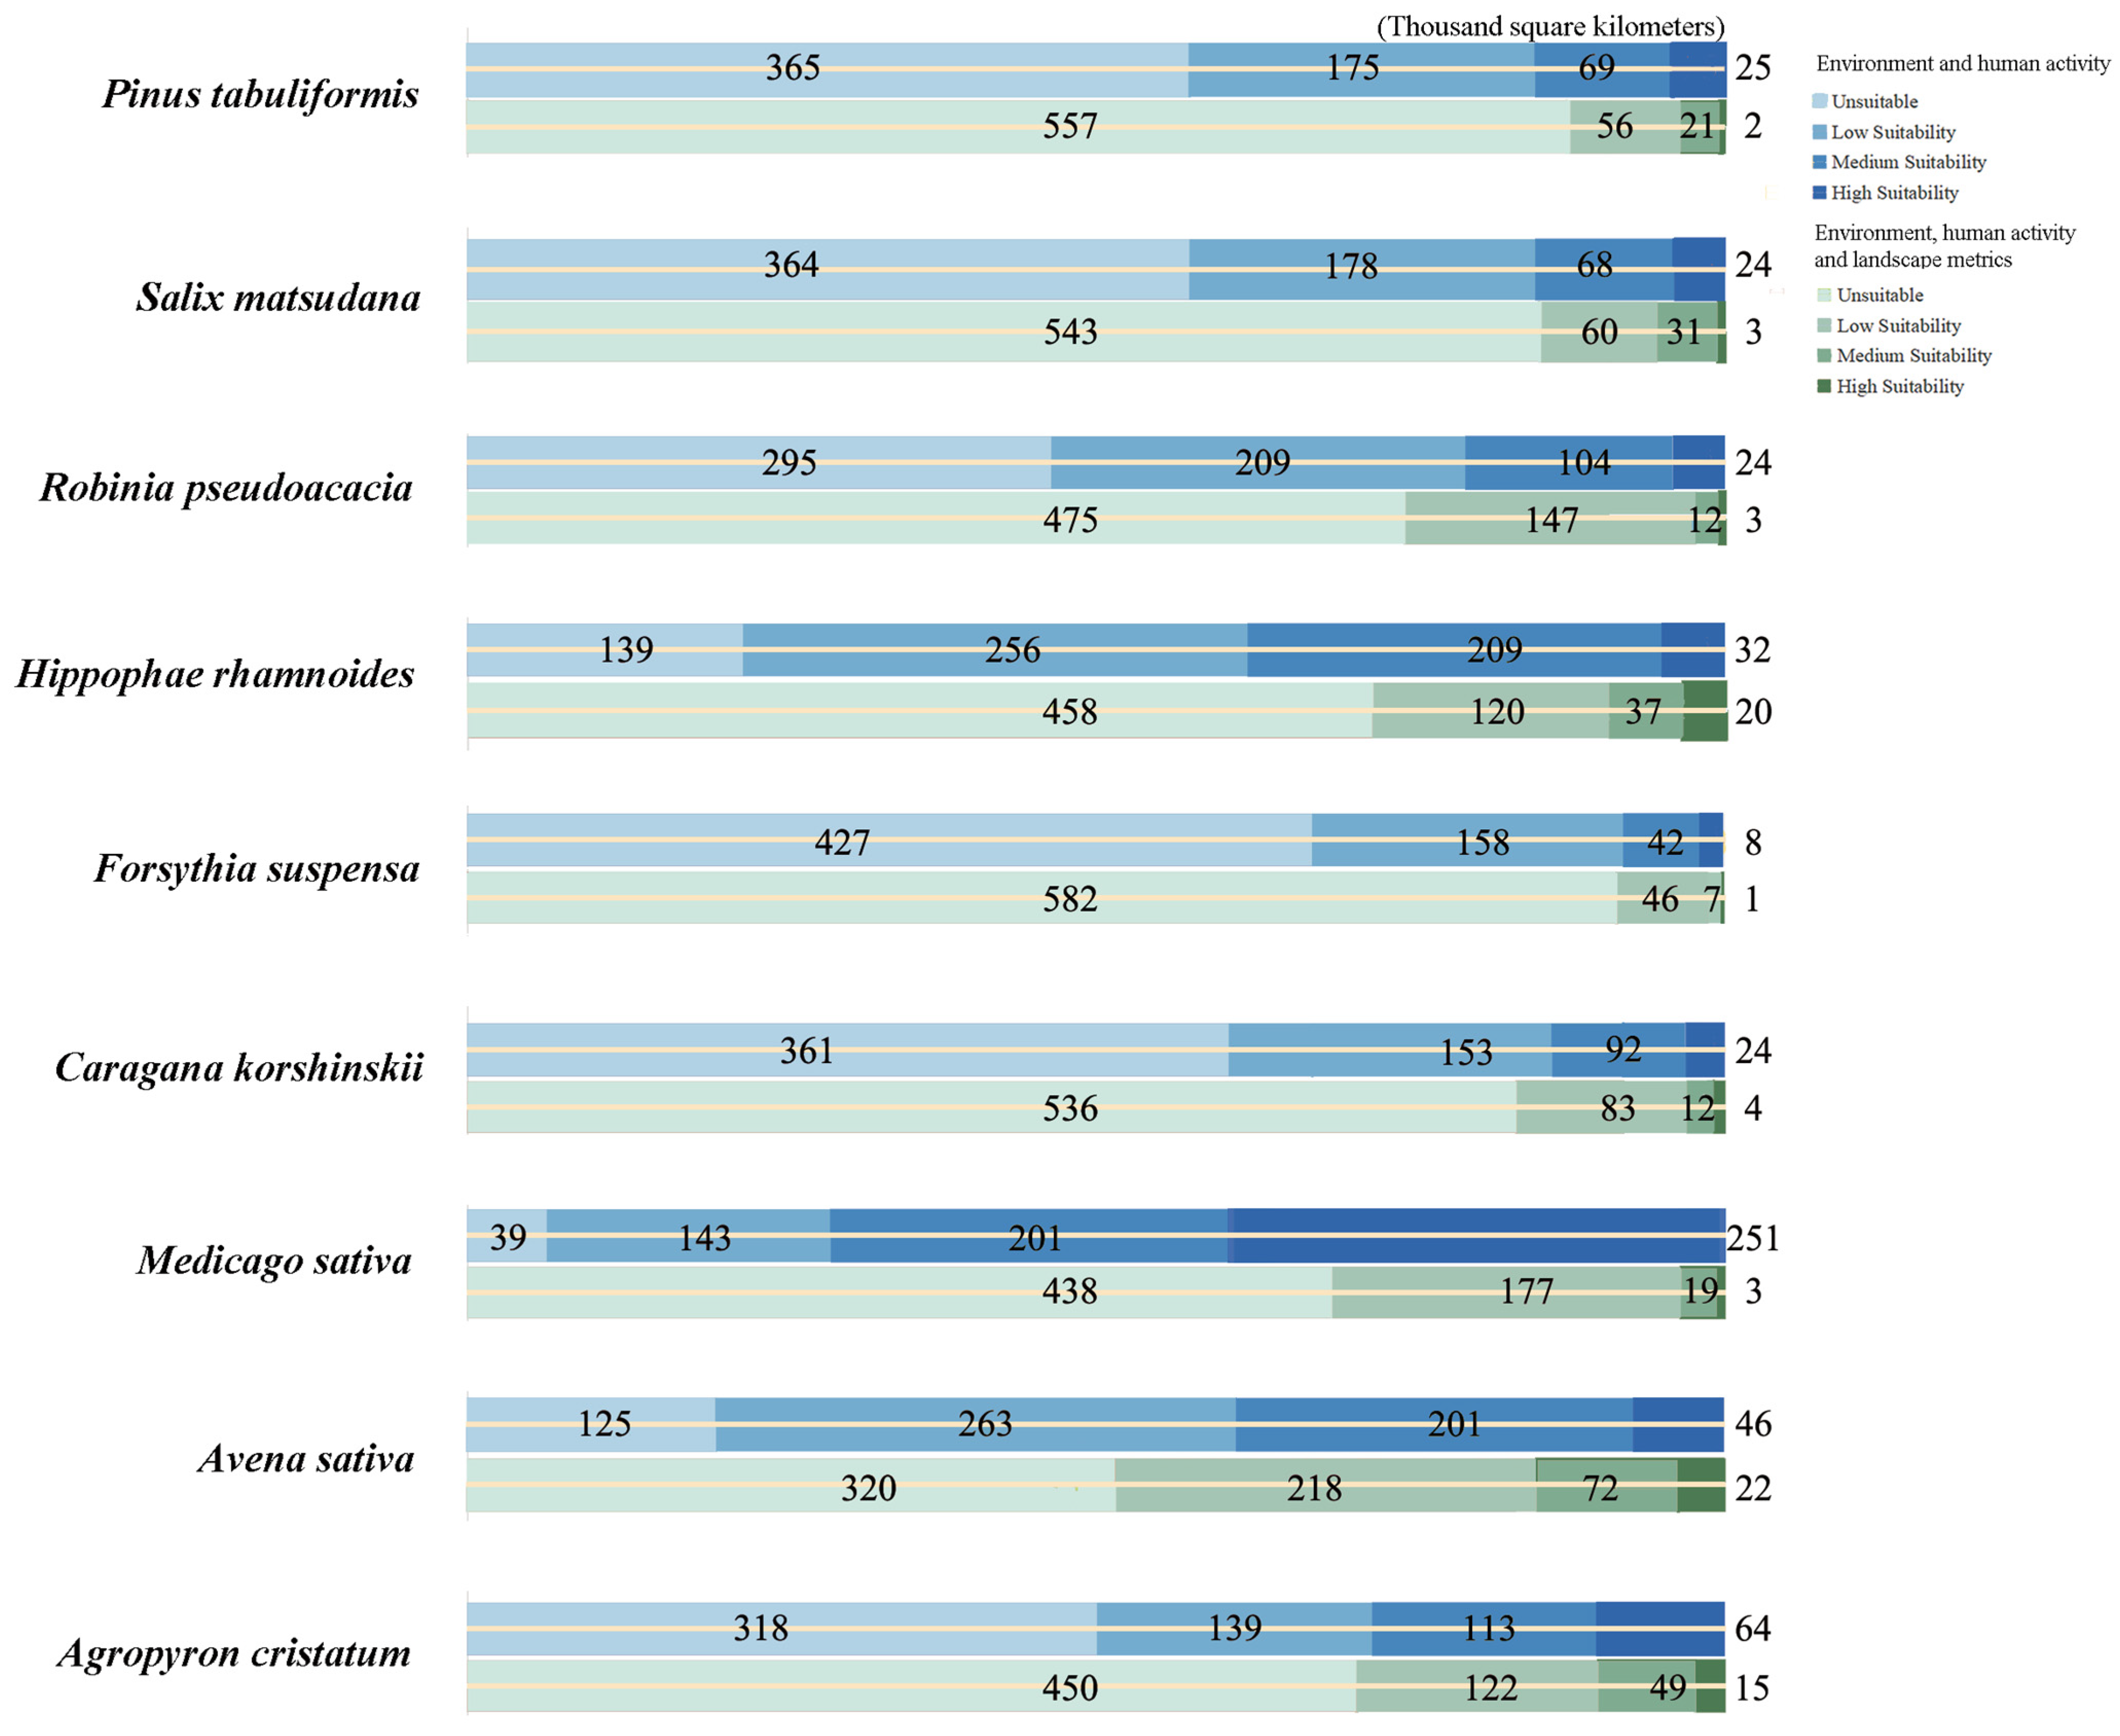
Quantitatively, herb species showed the largest contractions in high-suitability areas. For A. sativa, the high-suitability zone decreased from 46,200 km2 to 23,000 km2, while its unsuitable area expanded to 328,200 km2. M. sativa’s high-suitability area dropped from 251,700 km2 to 3300 km2, and A. cristatum decreased to 14,400 km2, both with corresponding increases in unsuitable zones exceeding 430,000 km2.
Among shrub species, H. rhamnoides’s high-suitability area declined from 32,100 km2 to 20,300 km2, while F. suspensa and C. korshinskii decreased to 1200 km2 and 4100 km2, respectively. Unsuitable areas for all shrub species showed substantial expansion.
Tree species exhibited moderate but consistent reductions in high-suitability zones. R. pseudoacacia, S. matsudana, and P. tabuliformis recorded suitable areas measuring 2800 km2, 2000 km2, and 3300 km2 respectively, with unsuitable zones expanding to over 500,000 km2 (Figure 5).

3.3. Species Spatial Distribution Identification

3.3.1. Vertical Vegetation Structure Layout Optimization

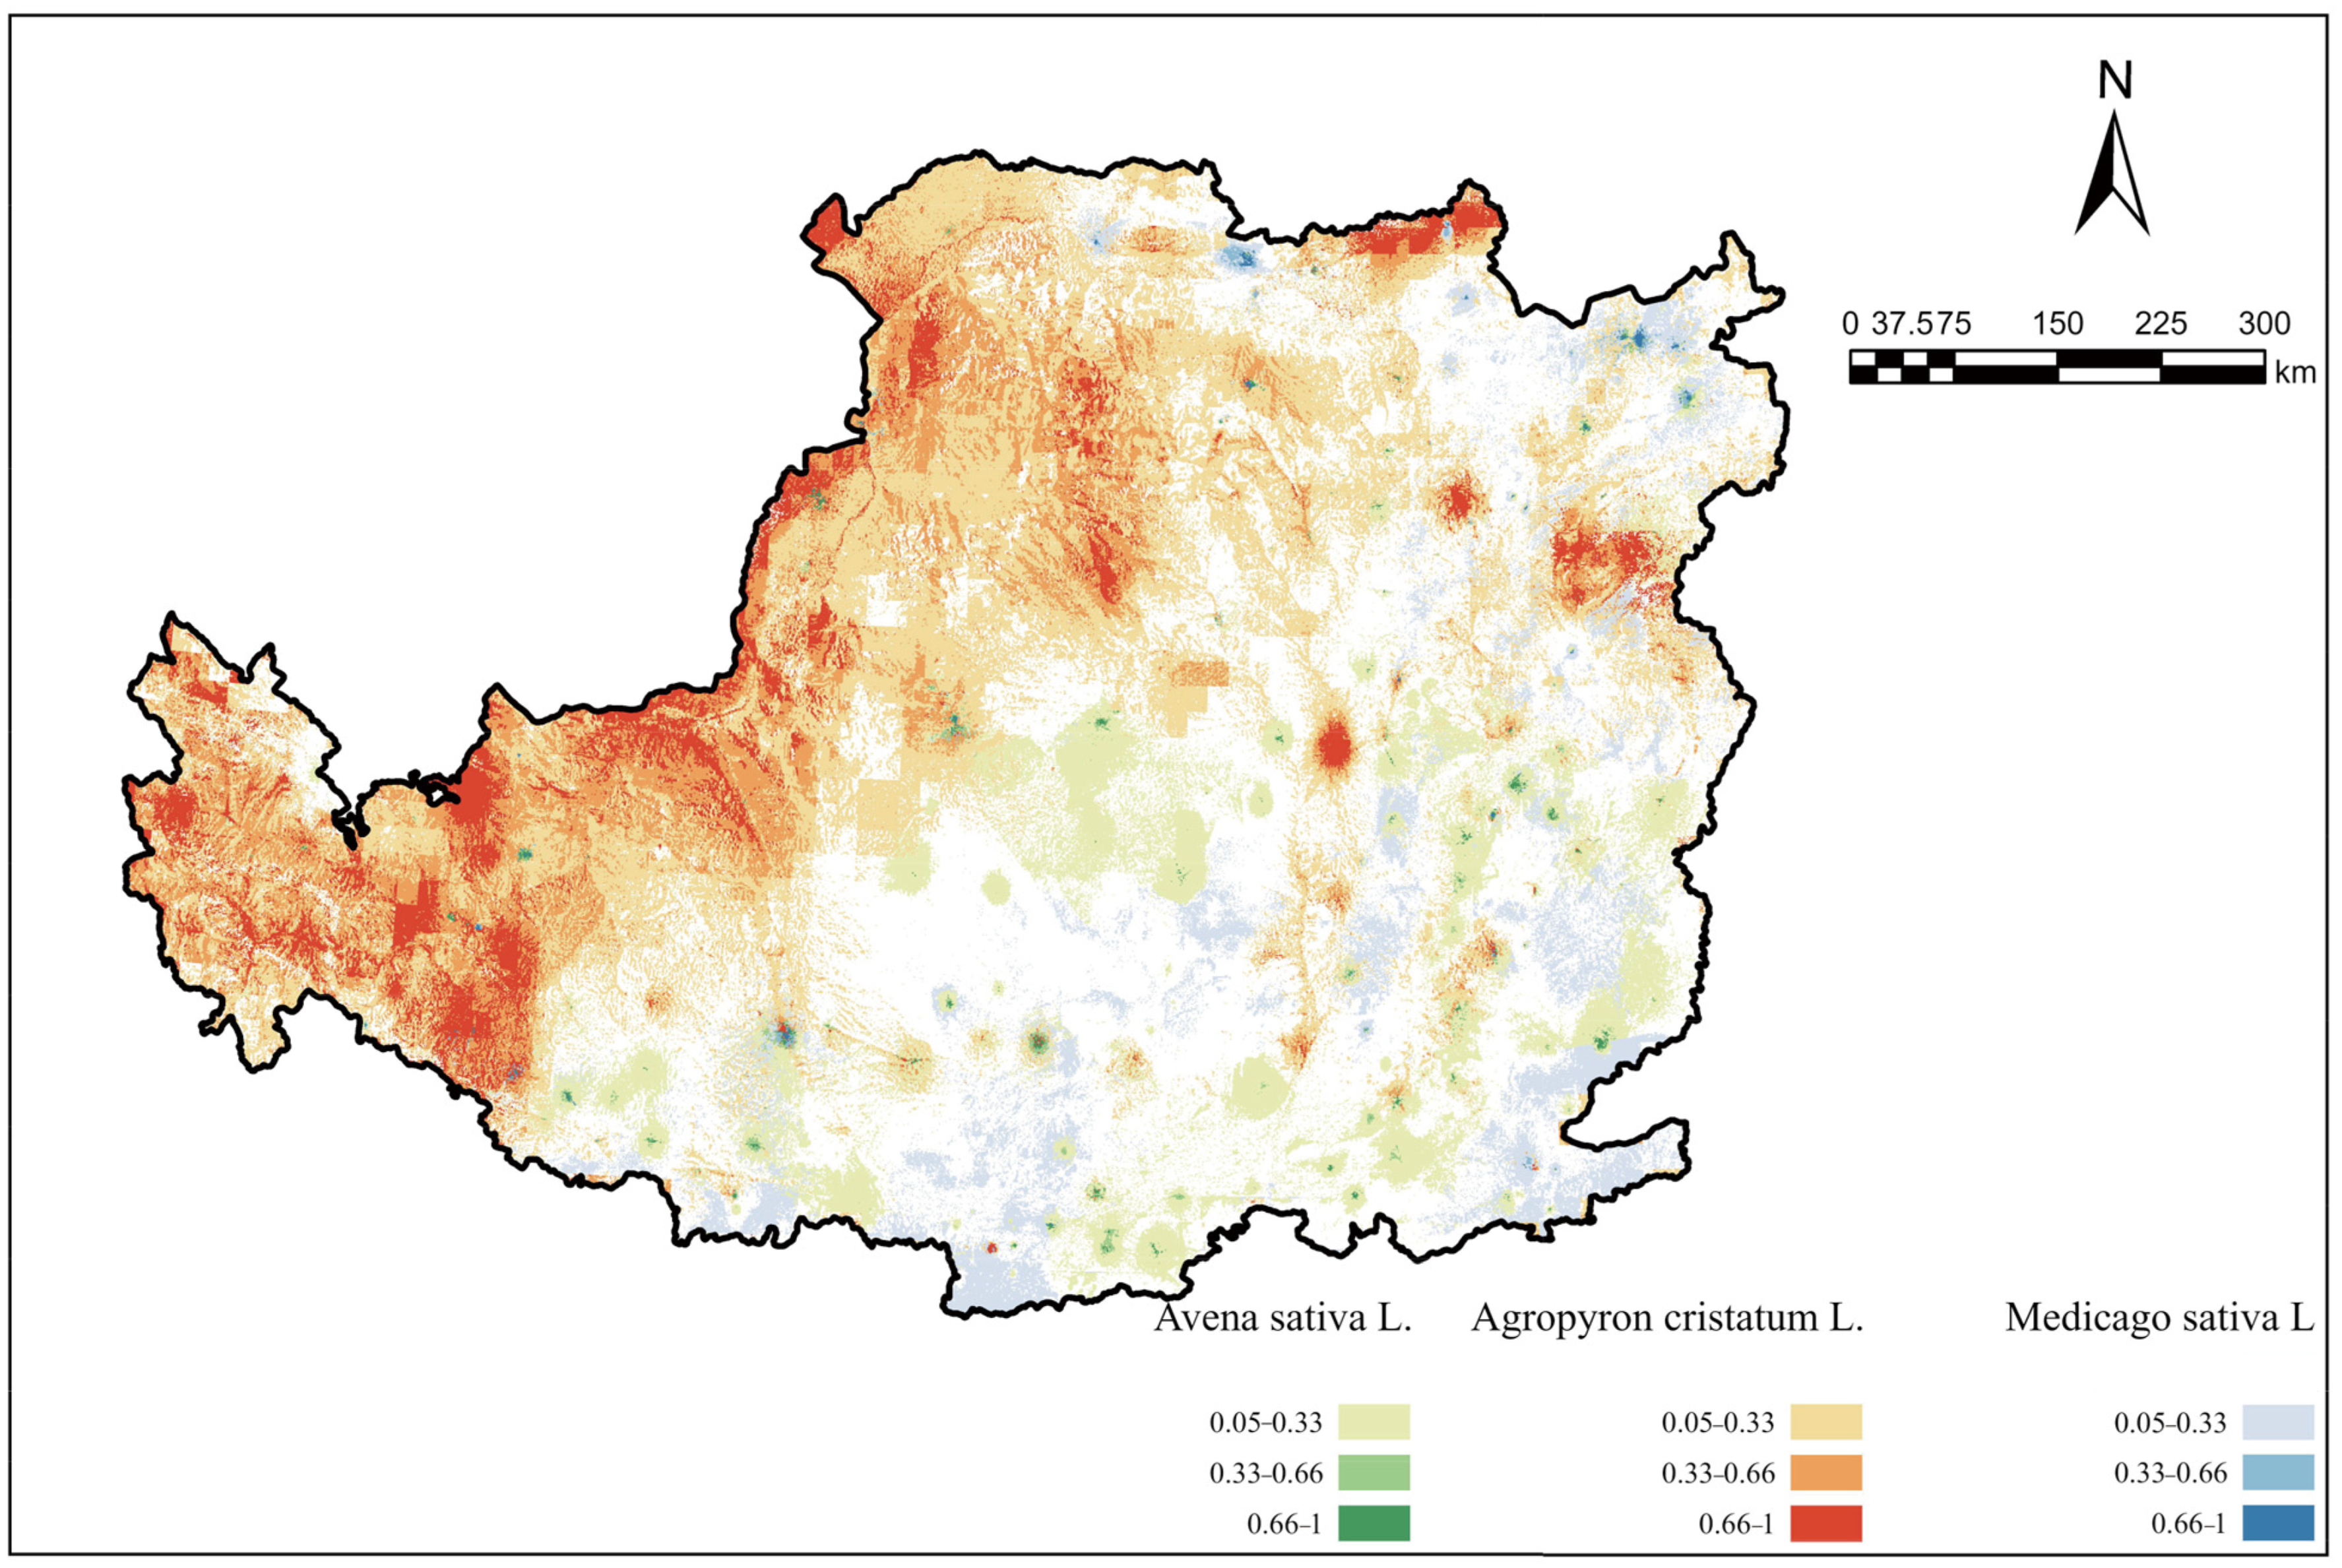
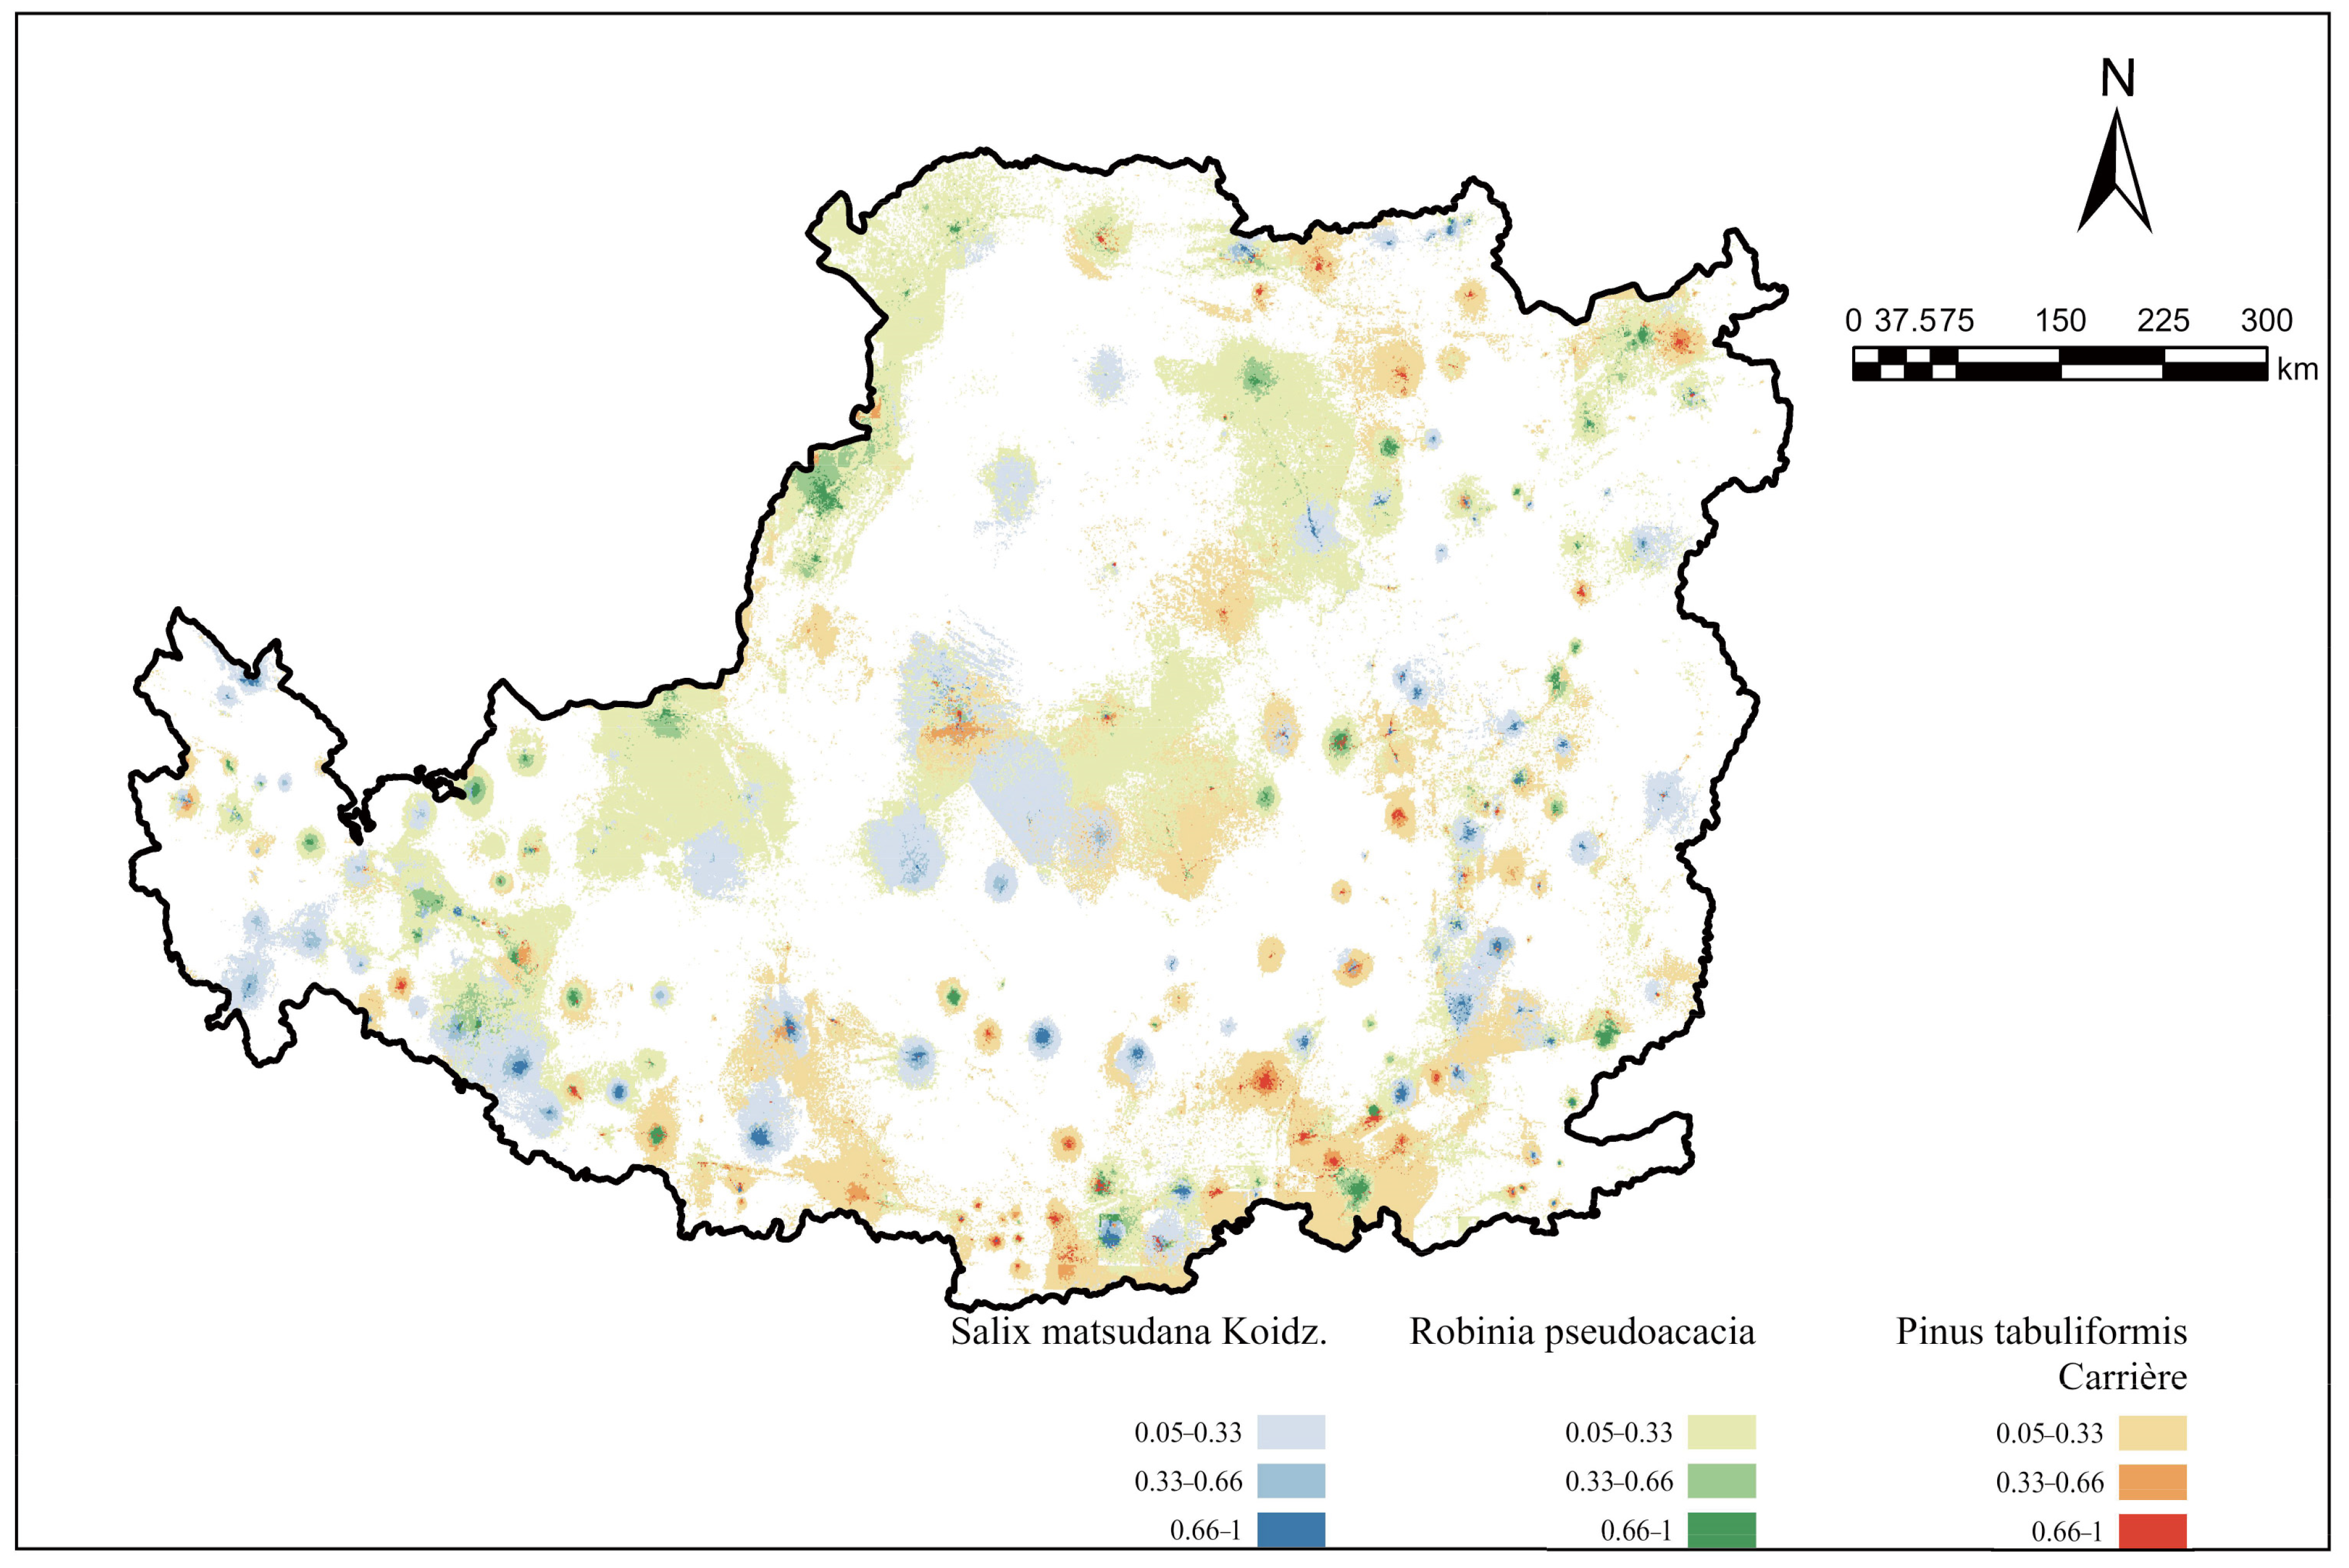
The spatial distribution of suitable habitats across the Loess Plateau showed notable differences among vegetation types. Herb species were mainly located in the arid northwestern and high-altitude regions, exhibiting broad ecological adaptability. Shrubs were primarily concentrated in central hilly and transitional zones, with more spatially clustered distributions. Tree species were restricted to the southeastern area with more favorable ecological conditions and demonstrated a narrower distribution range.
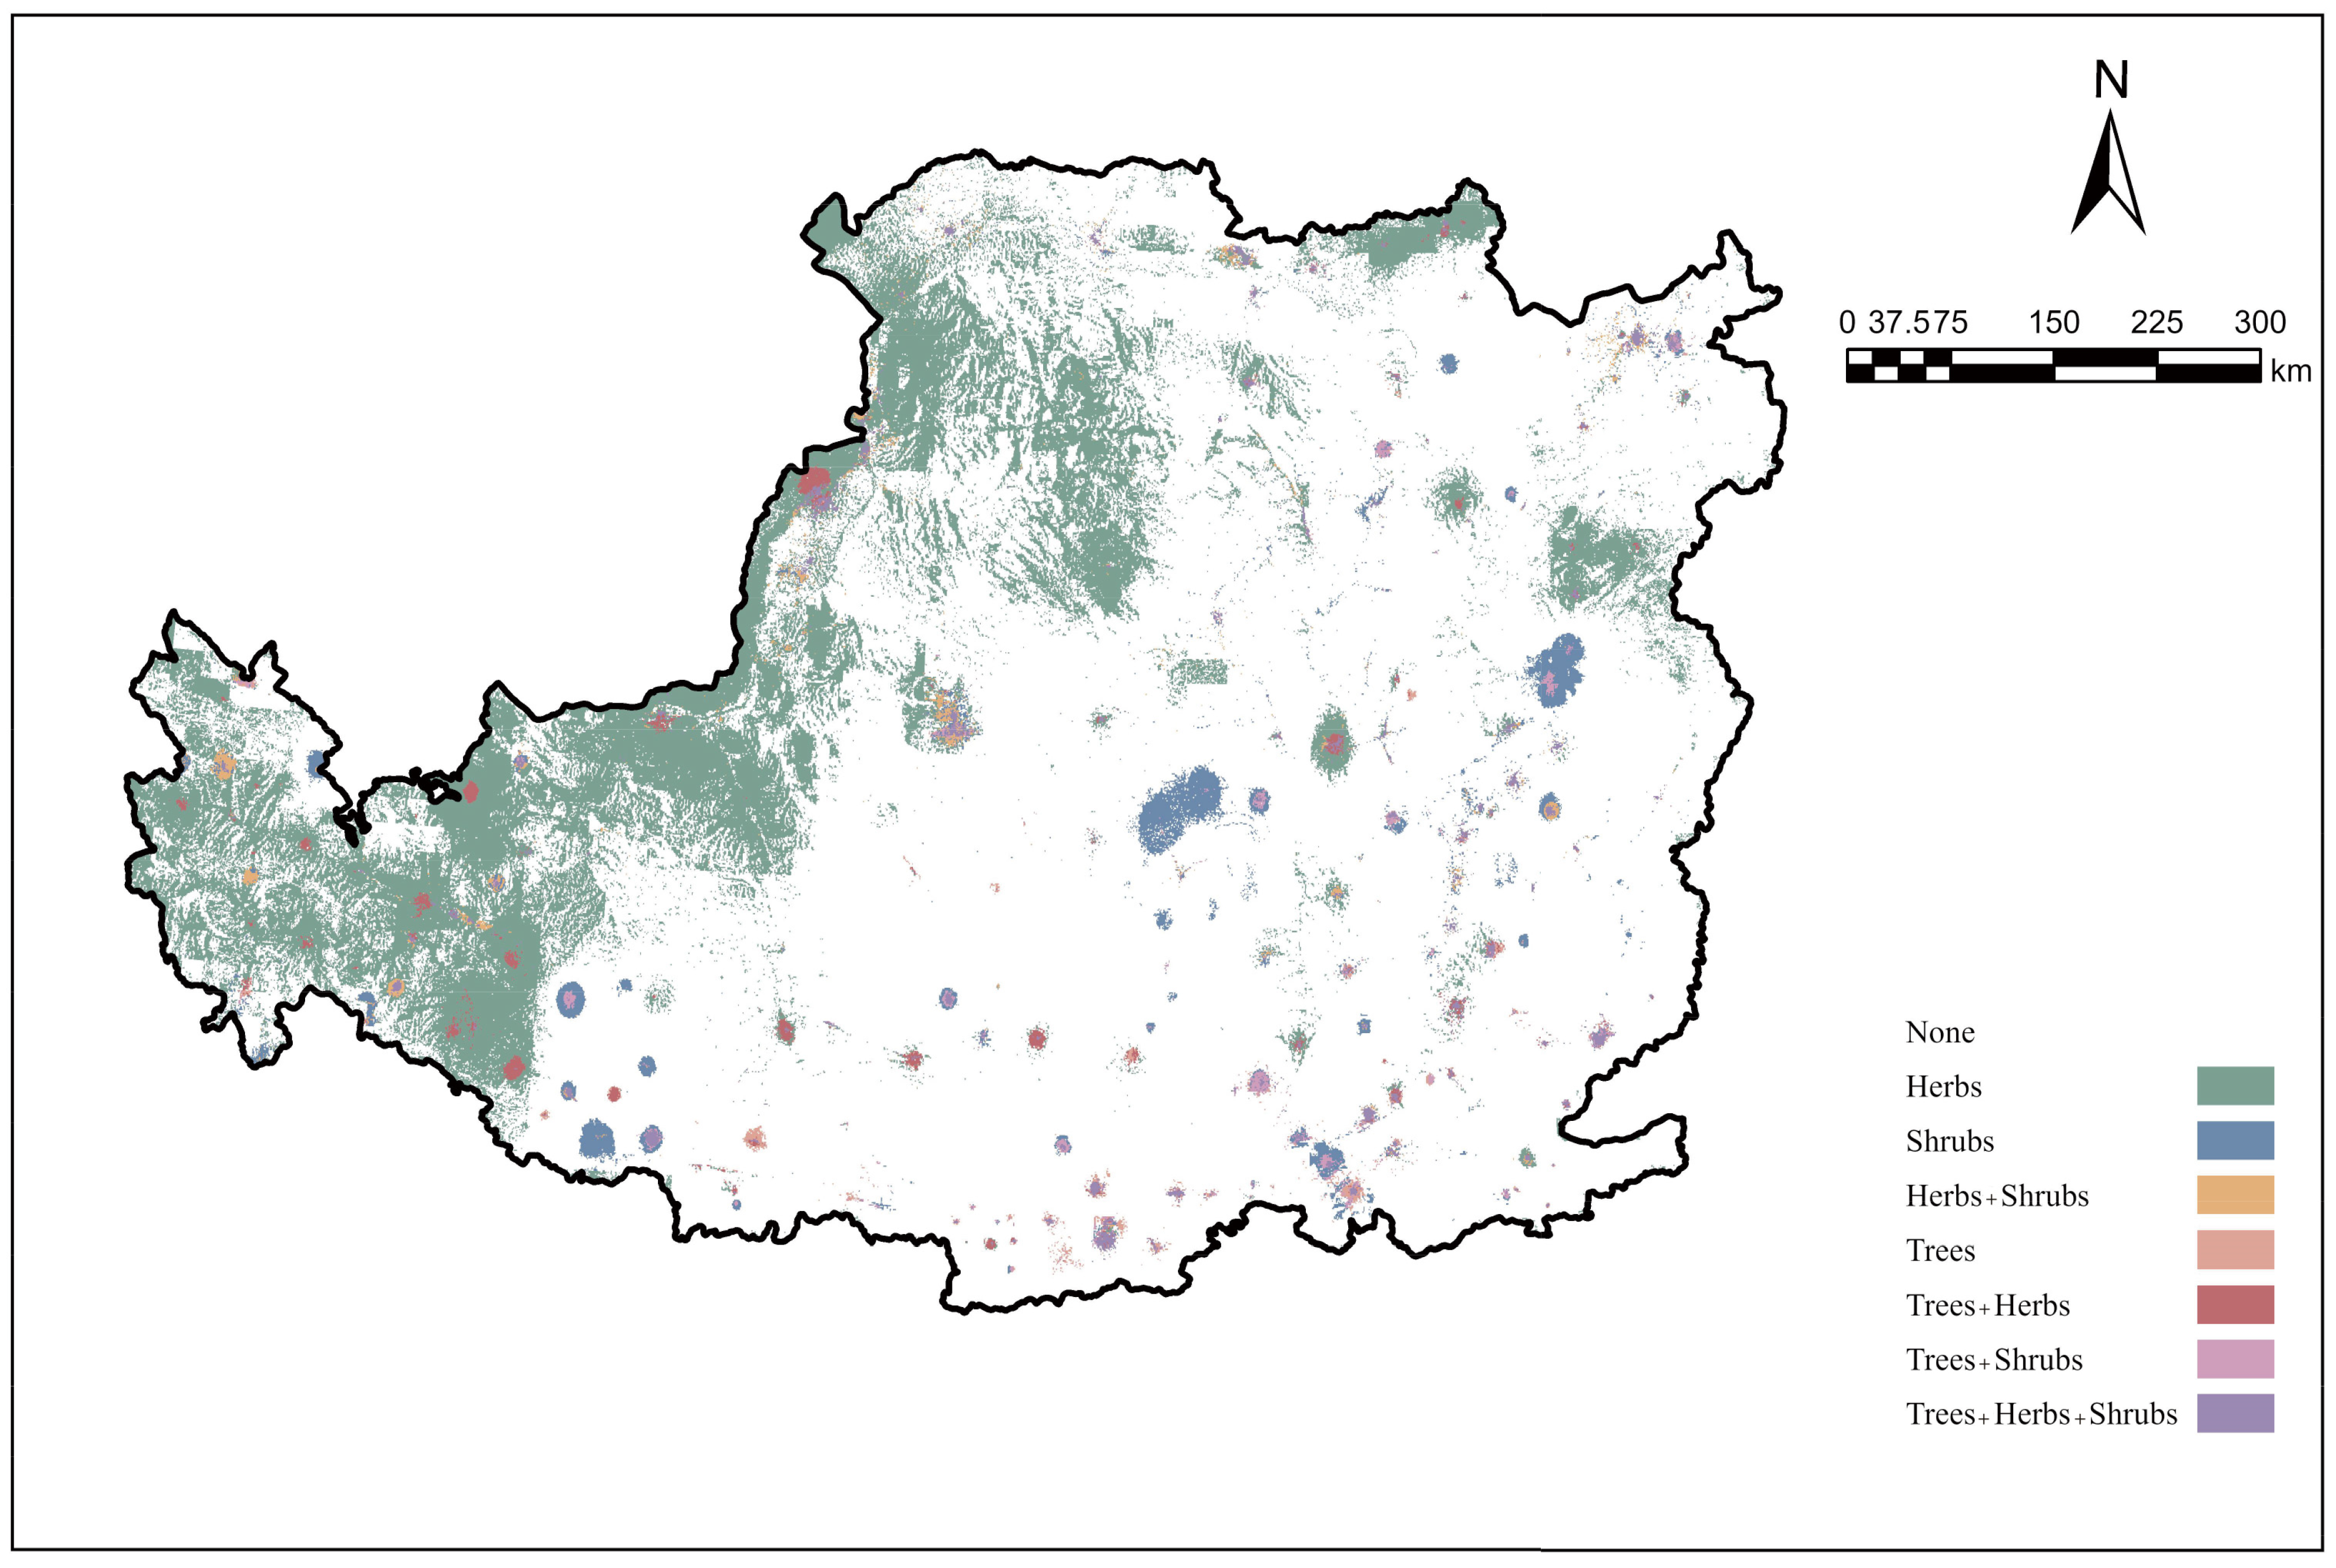
Based on this, the most suitable species distribution maps for the three vegetation layers were integrated to construct a vertical vegetation structure map for vegetation restoration in the Loess Plateau (Figure 6, Figure 7, Figure 8 and Figure 9). Most regions were suitable for single-layer vegetation restoration, while herb–shrub, shrub–tree, or three-layer combinations were observed in parts of the central and southern plateau, suggesting higher ecological carrying capacity and better landscape connectivity in these regions.

3.3.2. Identification of Key Influencing Factors

Ecological validity of the model predictions was evaluated through surveys of 100 field plots (10 × 10 km each) were surveyed across high-, medium-, and low-suitability zones. Stratified sampling ensured representation across varying landscape structures and habitat conditions. Field observations recorded dominant species, vegetation type, canopy cover, boundary shape, and human disturbance. Among the 100 plots, 94 (90%) were located in model-predicted high or medium suitability zones, and 88 of these fully matched the predicted dominant species. Patch connectivity, shape complexity, and edge structure in these plots were also consistent with the landscape metrics incorporated into the model. In two cases, recent land-use changes explained the absence of target species in predicted suitable areas, while in four cases anthropogenic disturbances accounted for species absence.
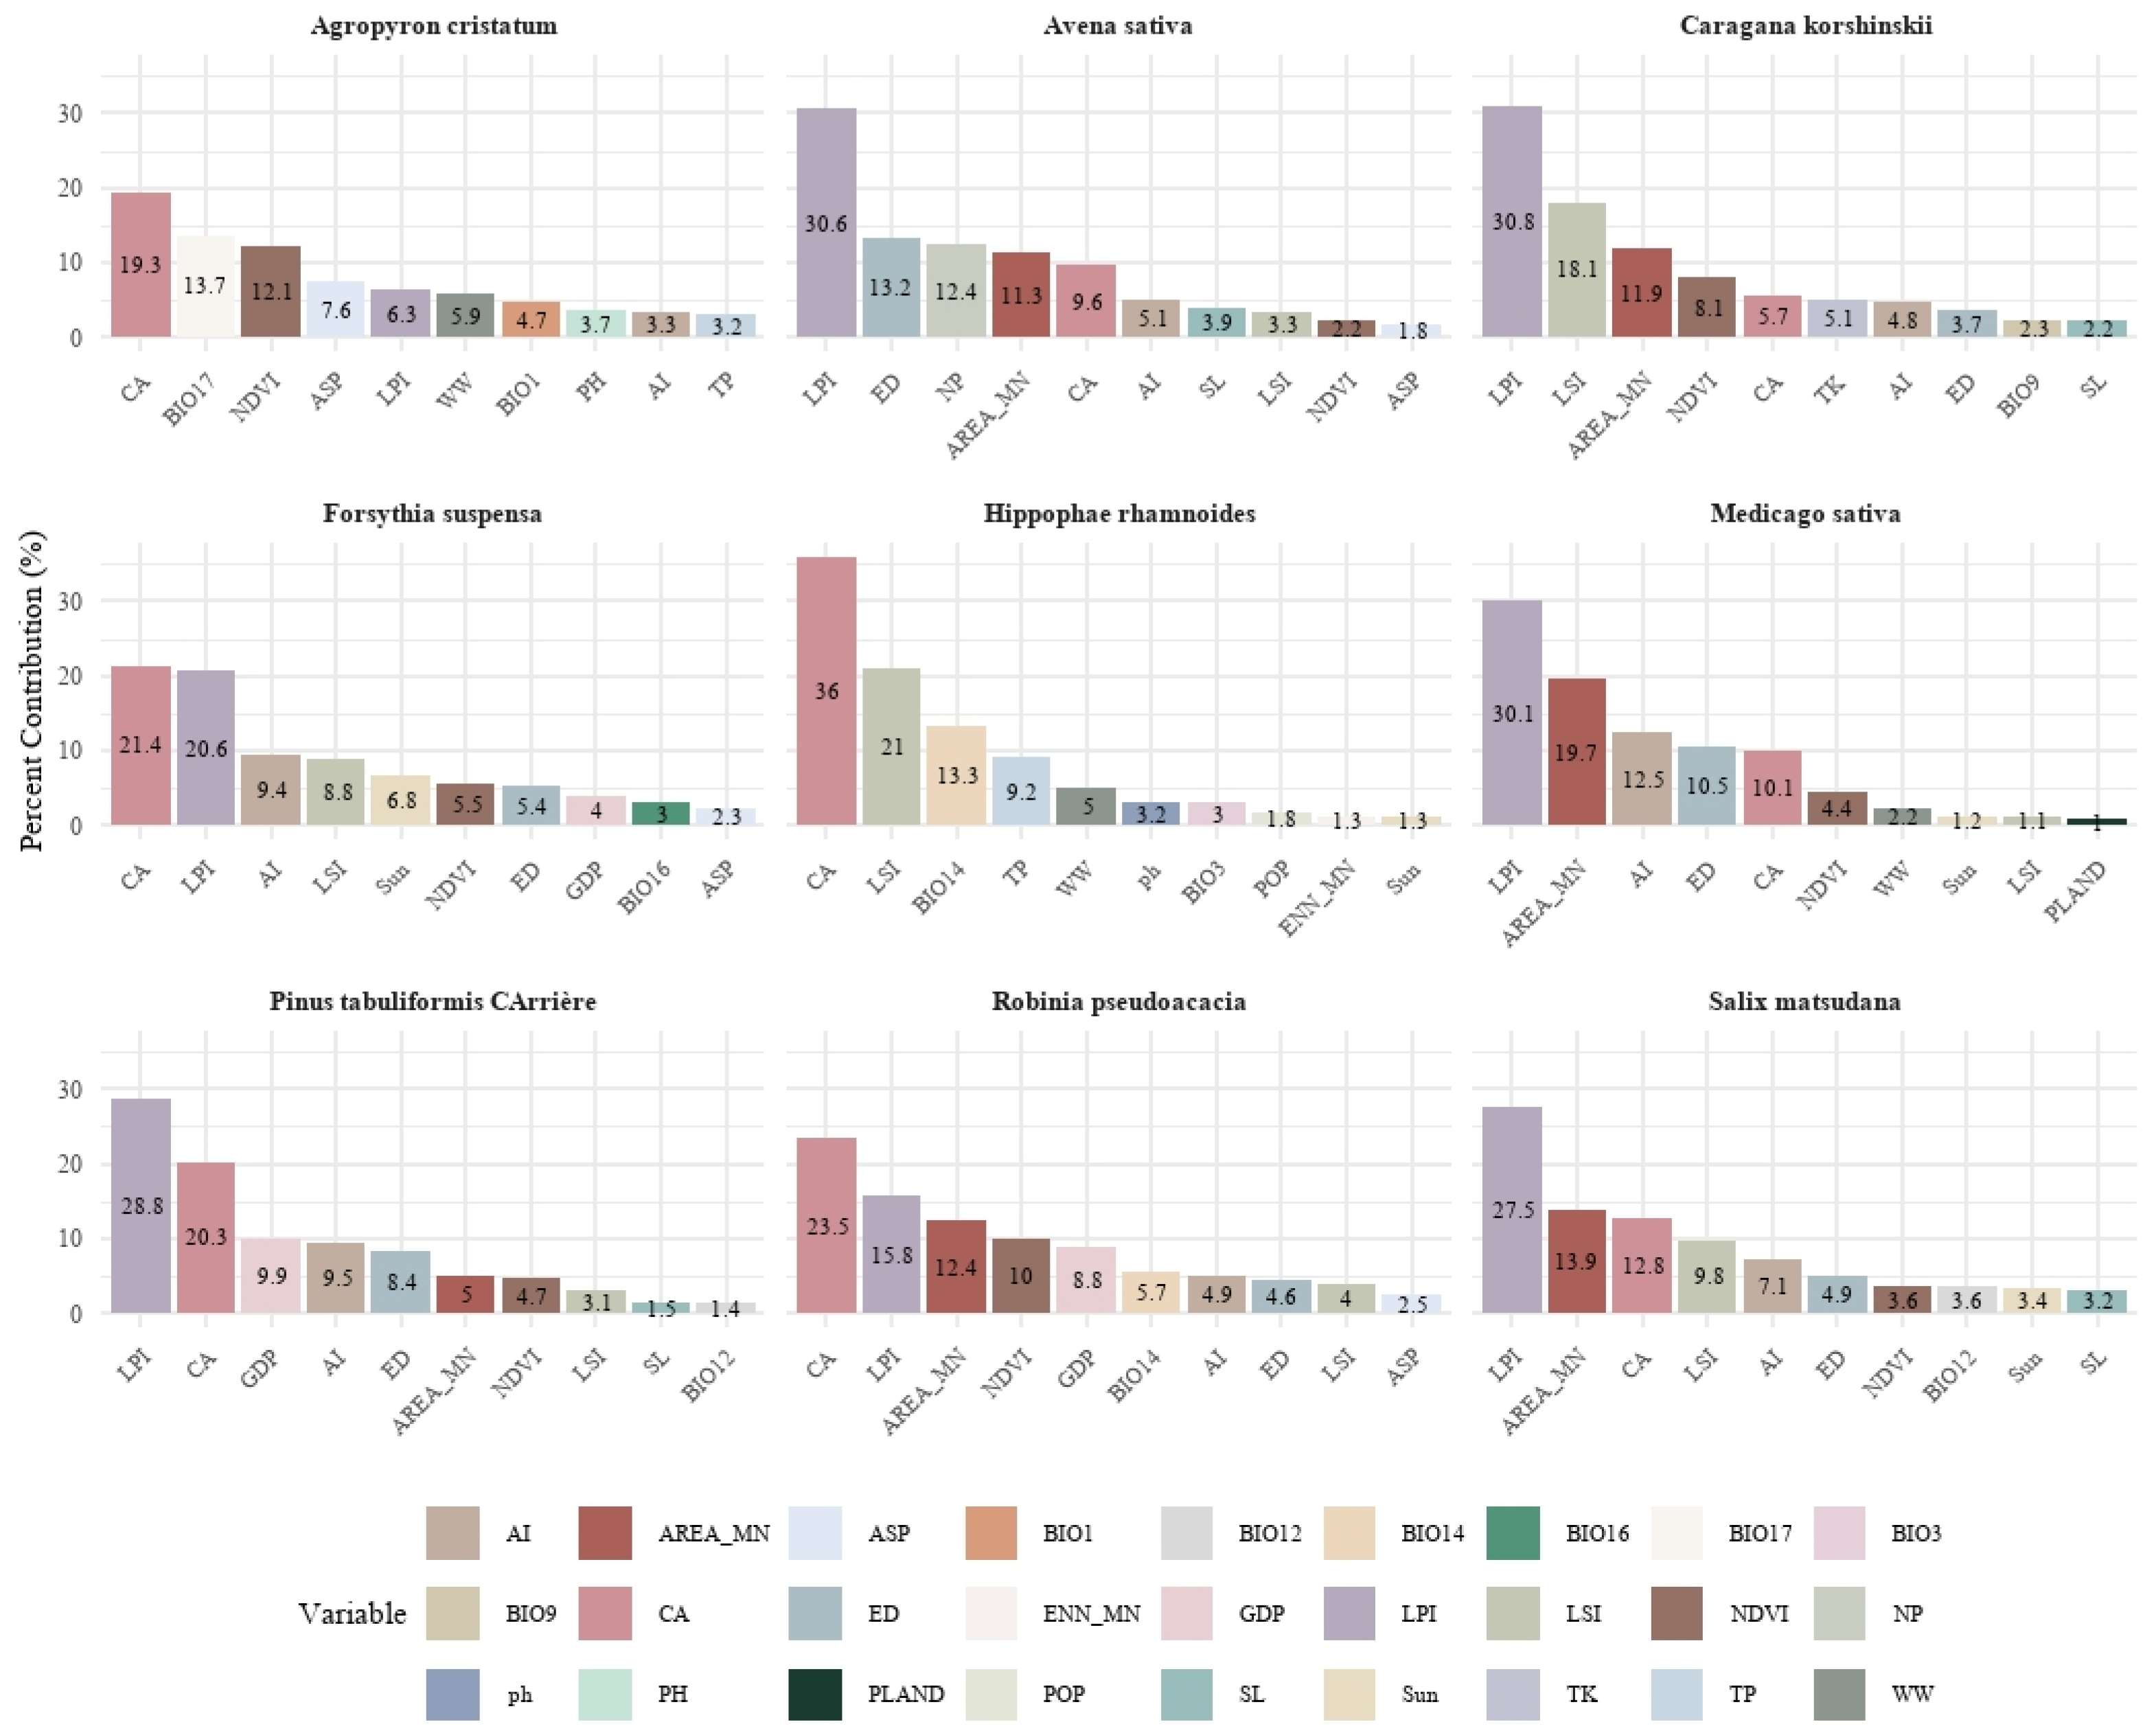
The top ten influencing factors for each species were identified based on contribution rates from the MaxEnt model (Figure 10). Notably, landscape metrics such as CA, LPI, AI, AREA_MN, and LSI were frequently ranked among the top predictors. In contrast, climatic (e.g., BIO17), vegetation (e.g., NDVI), and anthropogenic or edaphic variables varied in importance across species.
For P. tabuliformis, R. pseudoacacia, S. matsudana, key variables included CA, AREA_MN, and LPI. For C. korshinskii, F. suspensa, H. rhamnoides, high-ranking metrics included LSI, CA, and AI. For A. cristatum, A. sativa, M. sativa, NDVI, LPI, and Sl were dominant.
Additionally, the distribution of some species (e.g., M. sativa and F. suspensa) was influenced to a certain extent by anthropogenic factors and soil variables. This reflects that in areas with significant human disturbance, socio-economic factors and soil resources are also important determinants of plant distribution patterns.

4. Discussion

4.1. The Role of Landscape Configuration in Vegetation Restoration

The results of this study indicate that incorporating landscape metrics into the MaxEnt model significantly improved the spatial accuracy and ecological plausibility of species suitability predictions. The AUC values for all species were in the high-precision range (above 0.90), and after the inclusion of landscape metrics, the values generally increased, with the highest reaching 0.996. This result is consistent with the findings of Isaac et al. [54], confirming the critical role of landscape configuration variables in predicting vegetation restoration patterns.
Compared with traditional modeling framework, which predominantly relies on soil and climate factors, landscape metrics exhibited stronger spatial explanatory power in this study. Results from training gain and Jackknife analyses further indicated that these metrics emerged as dominant predictors for many species. By characterizing spatial properties such as patch connectivity, fragmentation, and edge complexity, landscape metrics provided a more accurate representation of habitat integrity, accessibility, and dispersal pathways. Such dimensions are difficult to capture using conventional environmental factors, particularly in regions like the Loess Plateau, where high spatial heterogeneity and intensive human disturbance prevail.

4.2. Differences in Vegetation Response Patterns to Landscape Structure

Different vegetation types exhibited distinct spatial responses to landscape structure, reflecting their varying ecological sensitivities to patch configuration, connectivity, and fragmentation.
Herb species showed the most pronounced shifts. Their suitability patterns changed from dispersed to highly clustered distributions, indicating strong dependence on contiguous, well-connected patches. These species typically rely on rapid regeneration within a single growing season, leaving little time to adapt to habitat fragmentation or environmental fluctuations [55]. Moreover, their dispersal is often dependent on wind or animal vectors, which restricts effective colonization when patches become isolated [56]. Shallow root systems further constrain their access to soil moisture and nutrients, making them highly sensitive to microhabitat variability caused by increased edge effects and reduced core area integrity [57]. Consequently, their suitability patterns shifted from widely dispersed to tightly clustered distributions around large, cohesive patches. Similar findings have been reported for early-successional herbaceous species on the Loess Plateau, which are highly sensitive to habitat fragmentation and require cohesive patches for population persistence [58,59]. For example, M. sativa’s suitable areas became confined to large, compact patches, reflecting its preference for low-division landscapes with high core area integrity.
Shrubs demonstrated moderate spatial restructuring. H. rhamnoides, F. suspensa, and C. korshinskii showed more cohesive suitability zones with reduced edge irregularity, suggesting a degree of edge adaptability. However, in highly fragmented landscapes, their suitable areas declined, indicating a fragmentation threshold beyond which population stability cannot be maintained. This is consistent with studies highlighting shrubs’ intermediate ecological strategies—capable of tolerating some edge influence but constrained by excessive patch division [60].
Tree species showed relatively mild changes in the suitability spatial patterns, yet their spatial preferences reflected a clear ecological strategy. Their high-suitability areas remained concentrated within large, continuous patches, indicating strong dependencies on patch integrity and habitat stability. The increased importance of metrics such as LPI, CA, and AREA_MN in tree modeling further supports this ecological response pattern. Compared with herbs and shrubs, trees exhibit deeper root systems, longer life cycles, and greater physiological resilience, enabling them to buffer short-term habitat fragmentation [61]. This explains why reductions in their high-suitability areas were moderate, whereas herbs and shrubs showed more pronounced contractions.
Despite the valuable insights provided, several limitations should be acknowledged. The landscape metrics primarily relied on single-year land cover data, which constrains the ability to fully capture the dynamic processes of landscape evolution. While such a “snapshot” approach is commonly adopted in landscape-scale restoration studies and can effectively characterize current spatial patterns, it inevitably overlooks temporal variability and long-term trends that may influence restoration outcomes. In addition, the model results require further validation through field monitoring and remote-sensing inversion data to enhance their reliability and practical applicability. Future research should therefore incorporate multi-temporal datasets and long-term monitoring to better account for landscape dynamics in ecological restoration planning.

4.3. Key Factors Influencing Species Distribution Predictions

The MaxEnt model was employed to determine the primary factors affecting the distribution of nine representative vegetation restoration species. Compared to traditional studies that focus on climate, terrain, or soil factors, this research underscores the importance of landscape metrics in characterizing habitat spatial structure and depicting landscape heterogeneity.
This study demonstrates that the distribution of vegetation types on the Loess Plateau is strongly influenced by landscape structure. The widespread contribution of metrics such as CA, LPI, AREA_MN, and LSI across all species highlights their essential function in defining habitat configuration and spatial integrity. These results suggest that these plants have a strong dependence on habitat stability and continuity, tending to be distributed in regions with concentrated core patches and well-defined boundaries. This aligns with the ecological characteristics of tree species, which generally have long life cycles, weak dispersal abilities, and strong habitat specialization [62].
In contrast, herb plants exhibit higher sensitivity to landscape fragmentation and connectivity. Their suitability distribution is highly dependent on factors such as AI, indicating their sensitivity to diffusion paths between patches and habitat accessibility. This corresponds with their short life cycles and dispersal mechanisms that rely on wind or animal-mediated transport [63].
For certain species, the contribution of human activity factors to model performance was relatively low, which may reflect the spatial heterogeneity of human disturbances within the study area, or the fact that landscape structure inherently incorporates the effects of human activities. In regions like the Loess Plateau, which are highly degraded and ecologically heterogeneous, reliance on a single factor is insufficient to adequately represent habitat quality. Instead, landscape metrics are required to provide a multidimensional and comprehensive characterization.
The identification of key factors not only reveals the differences in ecological niche adaptation strategies among different plant functional groups but also provides scientific support for developing multi-species collaborative ecological restoration strategies. Future ecological restoration efforts should place more emphasis on optimizing landscape structure and coordinating spatial configuration, rather than relying solely on single-factor environmental resource selection logic.

4.4. Management Implications and Ecological Application Prospects

The landscape-enhanced vegetation restoration developed in this study provides a spatially targeted and structurally informed framework for vegetation configuration in ecological restoration on the Loess Plateau. The findings suggest that priority should be given to planting herb or shrub species in fragmented and patchy landscapes to promote rapid vegetation recovery and short-term ecological stabilization, while tree species should be focused on core areas with intact landscape structure and high connectivity, where they contribute to long-term ecosystem functions such as carbon sequestration and soil conservation [64]. Furthermore, in ecological transition zones, the design of complex vertical vegetation structures that integrate various plant functional types will help enhance regional biodiversity and improve ecosystem stability and resilience [65]. This spatial zoning configuration strategy balances ecological functionality and landscape structure, reflecting the systematic and scientific nature of ecological restoration.
From a policy perspective, this study shows that restoration strategies need to be different for different areas. Landscape structure should guide how these strategies are made. Each plan should follow local planning rules and mark clear vegetation types for core, buffer, and transition zones. These zones should match the ecological redline policy and the goals of regional sustainability. Financial tools, such as ecological payments or special subsidies, can guide land managers to use vegetation patterns that improve landscape links and support ecosystem services.
For practitioners, the study provides actionable recommendations: (1) prioritize fast-growing herbaceous and shrub species for early-stage rehabilitation of degraded, highly fragmented sites; (2) focus tree planting efforts on large, contiguous patches where soil moisture and habitat stability are sufficient for long-term growth; and (3) design restoration layouts that include corridors or stepping-stone habitats to ensure functional connectivity across fragmented landscapes.
However, practical constraints must also be considered. Restoration outcomes may be influenced by limited availability of native seeds, insufficient funding for large-scale planting, or competing land-use demands. Another limitation is that the model depends on static land cover data, which constrains its capacity to reflect future land-use dynamics and climate variability, thereby emphasizing the necessity of adaptive management and scenario-oriented planning.
Additionally, the modeling framework proposed in this study can serve as a vital tool for ecological restoration planning in other ecologically vulnerable regions, offering wide application potential. By coupling natural environment, socio-economic, and landscape pattern factors, it enables multi-dimensional scientific guidance for species selection and spatial layout [66]. This integrated analysis not only enhances the accuracy of species distribution predictions but also provides solid decision-making support for green land spatial governance and high-quality ecological restoration, contributing to the sustainable development of regional ecosystems [67].

5. Conclusions

This study integrates a variety of environmental factors, including climate, soil, topography, and NDVI, alongside human activity factors such as population density and GDP, using the MaxEnt model. landscape metrics, including CA, LPI, and LSI, are innovatively incorporated to assess the suitability distribution patterns of nine typical herb, shrub, and tree species for vegetation restoration in the Loess Plateau. The main conclusions are as follows: (1) The incorporation of landscape metrics further highlighted the critical role of landscape configuration in vegetation restoration. The results demonstrated that, with increasing landscape integrity, suitable distribution areas shifted from fragmented and dispersed patterns to more continuous and aggregated ones, reflecting higher ecological suitability and restoration potential. (2) The response mechanisms to landscape metrics differ significantly among plant types: herb species are more dependent on patch aggregation and connectivity, shrubs are more influenced by boundary regularity and patch size, while trees show a stronger preference for large, low-fragmentation core habitats. (3) Most areas are suitable for single-layer vegetation restoration, with herb species showing the broadest suitability. However, in certain central and southern subregions, multi-layered vegetation configurations exhibit superior ecological compatibility. This study demonstrates that landscape configuration, as a key spatial proxy for ecological processes, provides an important complement to traditional environmental variables. The findings underscore its value in supporting more precise restoration strategies and spatial optimization in degraded ecosystems, with meaningful theoretical and practical implications for ecological restoration planning and sustainable land management.

Author Contributions

All authors contributed to the study conception and design. Material preparation and data collection were conducted by S.D. and J.L. Data analysis and validation were performed by S.D. The first draft of the manuscript was written by S.D. and J.L. The valuable suggestions for revising this article are put forward by X.L. and all authors commented on previous versions of the manuscript. All authors have read and agreed to the published version of the manuscript.

Funding

This research was funded by National Natural Science Foundation of China, grant number 32201429.

Data Availability Statement

The datasets generated during and/or analyzed during the current study are available from the corresponding author on reasonable request.

Acknowledgments

This work was supported by the National Natural Science Foundation of China Ministry (No. 32201429), and thanks to College of Landscape Architecture and Art, Northwest A&F University for the equipment.

Conflicts of Interest

The authors declare no conflicts of interest.

Appendix A

Table A1. System of factor indicators used in the analysis.
TypeFactorsAbbreviationData SourceYearResolution Ratio
climateAnnual Mean TemperatureBIO1WorldClim v2.0 dataset
(https://worldclim.org, accessed on 12 January 2025)
20201 km × 1 km
Mean Diurnal Range (Mean of monthly (max temp–min temp))BIO2
Isothermality (BIO2/BIO7) (×100)BIO3
Temperature Seasonality (standard deviation ×100)BIO4
Max Temperature of Warmest MonthBIO5
Min Temperature of Coldest MonthBIO6
Temperature Annual Range (BIO5-BIO6)BIO7
Mean Temperature of Wettest QuarterBIO8
Mean Temperature of Driest QuarterBIO9
Mean Temperature of Warmest QuarterBIO10
Mean Temperature of Coldest QuarterBIO11
Annual PrecipitationBIO12
Precipitation of Wettest MonthBIO13
Precipitation of Driest MonthBIO14
Precipitation Seasonality (Coefficient of Variation)BIO15
Precipitation of Wettest QuarterBIO16
Precipitation of Driest QuarterBIO17
Precipitation of Warmest QuarterBIO18
Precipitation of Coldest QuarterBIO19
landscapeClass AreaCACalculated using R (landscapemetrics) and interpolated via IDW in ArcGIS 10.8.120201 km × 1 km
Percent of landscapePLAND
Number of patchesNP
Patch densityPD
Largest patch indexLPI
Edge DensityED
Landscape shape indexLSI
Mean Patch sizeAREA_MD
Aggregation IndexAI
Mean of Euclidean nearest-neighbor distanceENN_MN
natureDigital elevation modelDEMResource and Environmental Science Data Platform
(https://www.resdc.cn/Default.aspx, accessed on 2 February 2025)
20201 km × 1 km
SlopeSI
AspectAsp
Sunshine durationSunGlobal Resources Data Cloud (http://www.gis5g.com,
accessed on 3 January 2025)
20201 km × 1 km
Normalized Difference Vegetation IndexNDVIResource and Environmental Science Data Platform
(https://www.resdc.cn/Default.aspx, accessed on 1 January 2025)
20191 km × 1 km
phphFood and Agriculture Organization of the United Nations
(https://www.fao.org, accessed on 3 February 2025)
20131 km × 1 km
Total nitrogenTNA Big Earth Data Platform for Three Poles (http://poles.tpdc.ac.cn/zh-hans/, accessed on 3 February 2025)20181 km × 1 km
Total phosphorusTP
Total potassiumTK
Soil Organic MatterSOMNational Tibetan Plateau/Third Pole Environment Data Center
(http://data.tpdc.ac.cn, accessed on 4 February 2025)
20201 km × 1 km
humanDistance from water source to woodlandWWUsing Euclidean distance to calculate the distance between woodland and road, and woodland and water source, respectively, in ArcGIS 10.8.120211 km × 1 km
Distance from road to woodlandRW
Population densityPOPResource and Environmental Science Data Platform
(https://www.resdc.cn/Default.aspx, accessed on 2 February 2025)
20201 km × 1 km
Gross domestic productGDP
Table A2. Sensitivity analysis.
TypeBuffer (m)R2Significance
herb5000.3380.012 *
10000.3010.001 **
20000.2240.078
shrub5000.2860.018
10000.3120.003 **
20000.2690.085
tree5000.1850.094
10000.2260.001 **
20000.3250.001 **
Dependent variable: Species distribution probability. * represents a significant difference, ** represents a more significant diference.
Figure A1. (a) Pearson correlation analysis among factors. (b) VIF distribution analysis.
Forests 16 01569 g0a1

References

  1. Elo, M.; Kareksela, S.; Ovaskainen, O.; Abrego, N.; Niku, J.; Taskinen, S.; Aapala, K.; Kotiaho, J.S. Restoration of forestry-drained boreal peatland ecosystems can effectively stop and reverse ecosystem degradation. Commun. Earth Environ. 2024, 5, 680. [Google Scholar] [CrossRef]
  2. McAlpine, C.A.; Seabrook, L.M.; Rhodes, J.R.; Maron, M.; Smith, C.; Bowen, M.E.; Butler, S.A.; Powell, O.; Ryan, J.G.; Fyfe, C.T.; et al. Can a problem-solving approach strengthen landscape ecology’s contribution to sustainable landscape planning? Landsc. Ecol. 2010, 25, 1155–1168. [Google Scholar] [CrossRef]
  3. Xu, H.; Qu, Q.; Li, P.; Guo, Z.; Wulan, E.; Xue, S. Stocks and Stoichiometry of Soil Organic Carbon, Total Nitrogen, and Total Phosphorus after Vegetation Restoration in the Loess Hilly Region, China. Forests 2019, 10, 27. [Google Scholar] [CrossRef]
  4. Guo, Z.T.; Ruddiman, W.F.; Hao, Q.Z.; Wu, H.B.; Qiao, Y.S.; Zhu, R.X.; Peng, S.Z.; Wei, J.J.; Yuan, B.Y.; Liu, T.S. Onset of Asian desertification by 22 Myr ago inferred from loess deposits in China. Nature 2002, 416, 159–163. [Google Scholar] [CrossRef]
  5. Yu, H.; Hu, X.; Yao, L. Vegetation restoration reduces landscape ecological risk in the Loess Plateau. Geogr. Sustain. 2025, 6, 100320. [Google Scholar] [CrossRef]
  6. Rey, P.L.; Adde, A.; Külling, N.; Petitpierre, B.; Vittoz, V.; Lehmann, A.; Guisan, A. Predicting current and future spatial patterns of nature’s contributions to people from species distribution models. Ecol. Indic. 2025, 175, 113528. [Google Scholar] [CrossRef]
  7. Boral, D.; Moktan, S. Predictive distribution modeling of Swertia bimaculata in Darjeeling-Sikkim Eastern Himalaya using MaxEnt: Current and future scenarios. Ecol. Process. 2021, 10, 26. [Google Scholar] [CrossRef]
  8. Wang, F.; Yuan, X.; Sun, Y.; Liu, Y. Species distribution modeling based on MaxEnt to inform biodiversity conservation in the Central Urban Area of Chongqing Municipality. Ecol. Indic. 2024, 158, 111491. [Google Scholar] [CrossRef]
  9. Dong, J.; Bai, T.; Gao, Z.-S.; Yang, S.-W.; Zhang, J.-L.; Wu, Y.-W. Prediction of potential habitat areas of Rhododendron delavayi in China based on maximum entropy model MaxEnt. Front. For. Glob. Change 2024, 7, 1360823. [Google Scholar] [CrossRef]
  10. Dyderski, M.K.; Paz, S.; Frelich, L.E.; Jagodzinski, A.M. How much does climate change threaten European forest tree species distributions? Glob. Change Biol. 2018, 24, 1150–1163. [Google Scholar] [CrossRef]
  11. Phillips, S.J.; Anderson, R.P.; Schapire, R.E. Maximum entropy modeling of species geographic distributions. Ecol. Model. 2006, 190, 231–259. [Google Scholar] [CrossRef]
  12. Yang, S.; Wang, H.; Tong, J.; Bai, Y.; Alatalo, J.M.; Liu, G.; Fang, Z.; Zhang, F. Impacts of environment and human activity on grid-scale land cropping suitability and optimization of planting structure, measured based on the MaxEnt model. Sci. Total Environ. 2022, 836, 155356. [Google Scholar] [CrossRef]
  13. Riva, F.; Martin, C.J.; Galán Acedo, C.; Bellon, E.N.; Keil, P.; Morán-Ordóñez, A.; Fahrig, L.; Guisan, A. Incorporating effects of habitat patches into species distribution models. J. Ecol. 2024, 112, 2162–2182. [Google Scholar] [CrossRef]
  14. Hasui, É.; Silva, V.X.; Cunha, R.G.T.; Ramos, F.N.; Ribeiro, M.C.; Sacramento, M.; Coelho, M.T.P.; Pereira, D.G.S.; Ribeiro, B.R. Additions of landscape metrics improve predictions of occurrence of species distribution models. J. For. Res. 2017, 28, 963–974. [Google Scholar] [CrossRef]
  15. Hou, B.; Wei, C.; Liu, X.; Meng, Y.; Li, X. Assessing Forest Landscape Stability through Automatic Identification of Landscape Pattern Evolution in Shanxi Province of China. Remote Sens. 2023, 15, 545. [Google Scholar] [CrossRef]
  16. Zhang, J.; Qu, M.; Wang, C.; Zhao, J.; Cao, Y. Quantifying landscape pattern and ecosystem service value changes: A case study at the county level in the Chinese Loess Plateau. Glob. Ecol. Conserv. 2020, 23, e01110. [Google Scholar] [CrossRef]
  17. Yang, H.; Chu, S.; Zeng, H.; Zhao, Y. Relationship Between Urban Forest Structure and Seasonal Variation in Vegetation Cover in Jinhua City, China. Forests 2025, 16, 1129. [Google Scholar] [CrossRef]
  18. Li, G.; Wang, H.; Zhang, S.; Ge, C.; Wu, J. Influence of climate and landscape structure on soil erosion in China’s Loess Plateau: Key factor identification and spatiotemporal variability. Sci. Total Environ. 2024, 957, 177471. [Google Scholar] [CrossRef]
  19. Pei, Y.; Wei, W.; Wei, X.; Yang, X.; Xie, B.; Zhou, J.; Zhang, Y.; Liu, C. Ecological risk assessment and ecological restoration zoning based on nature-society-landscape systems: A case study of Hexi Corridor, Northwest China. Hum. Ecol. Risk Assess. Int. J. 2025, 31, 1040–1061. [Google Scholar] [CrossRef]
  20. Goicolea, T.; Mateo, R.G.; Aroca-Fernández, M.J.; Gastón, A.; García-Viñas, J.I.; Mateo-Sánchez, M.C. Considering plant functional connectivity in landscape conservation and restoration management. Biodivers. Conserv. 2022, 31, 1591–1608. [Google Scholar] [CrossRef]
  21. Curd, A.; Chevalier, M.; Vasquez, M.; Boyé, A.; Firth, L.B.; Marzloff, M.P.; Bricheno, L.M.; Burrows, M.T.; Bush, L.E.; Cordier, C.; et al. Applying landscape metrics to species distribution model predictions to characterize internal range structure and associated changes. Glob. Change Biol. 2023, 29, 631–647. [Google Scholar] [CrossRef]
  22. Ortner, O.; Wallentin, G. Integration of landscape metric surfaces derived from vector data improves species distribution models. Ecol. Model. 2020, 431, 109160. [Google Scholar] [CrossRef]
  23. Xu, C.; Silliman, B.R.; Chen, J.; Li, X.; Thomsen, M.S.; Zhang, Q.; Lee, J.; Lefcheck, J.S.; Daleo, P.; Hughes, B.B.; et al. Herbivory limits success of vegetation restoration globally. Science 2023, 382, 589–594. [Google Scholar] [CrossRef] [PubMed]
  24. Waldén, E.; Öckinger, E.; Winsa, M.; Lindborg, R. Effects of landscape composition, species pool and time on grassland specialists in restored semi-natural grasslands. Biol. Conserv. 2017, 214, 176–183. [Google Scholar] [CrossRef]
  25. Song, S.; Chen, X.; Song, Y.; Chi, Y. Vegetation Restoration Patterns Influence the Supply and Interrelations of Grassland Ecosystem Services in Karst Desertification Control. Land 2024, 13, 2023. [Google Scholar] [CrossRef]
  26. Vasiliev, D.; Greenwood, S. The role of landscape connectivity in maintaining pollinator biodiversity needs reconsideration. Biodivers. Conserv. 2023, 32, 3765–3790. [Google Scholar] [CrossRef]
  27. Morzillo, A.T. Challenges of and opportunities for integrating social science into landscape ecology research. Landsc. Ecol. 2024, 39, 169. [Google Scholar] [CrossRef]
  28. Reed, J.; Kusters, K.; Barlow, J.; Balinga, M.; Borah, J.R.; Carmenta, R.; Chervier, C.; Djoudi, H.; Gumbo, D.; Laumonier, Y.; et al. Re-integrating ecology into integrated landscape approaches. Landsc. Ecol. 2021, 36, 2395–2407. [Google Scholar] [CrossRef]
  29. Lavorel, S.; Garnier, E. Predicting changes in community composition and ecosystem functioning from plant traits: Revisiting the Holy Grail. Funct. Ecol. 2002, 16, 545–556. [Google Scholar] [CrossRef]
  30. Wang, G.-H.; Ni, J. Responses of plant functional types to an environmental gradient on the Northeast China Transect. Ecol. Res. 2005, 20, 563–572. [Google Scholar] [CrossRef]
  31. Olthoff, A.E.; Martínez-Ruiz, C.; Alday, J.G. Niche Characterization of Shrub Functional Groups along an Atlantic-Mediterranean Gradient. Forests 2021, 12, 982. [Google Scholar] [CrossRef]
  32. Cardoso, F.C.G.; Capellesso, E.S.; de Britez, R.M.; Inague, G.; Marques, M.C.M. Landscape conservation as a strategy for recovering biodiversity: Lessons from a long-term program of pasture restoration in the southern Atlantic Forest. J. Appl. Ecol. 2022, 59, 2309–2321. [Google Scholar] [CrossRef]
  33. Pinto-Ledezma, J.N.; Cavender-Bares, J. Predicting species distributions and community composition using satellite remote sensing predictors. Sci. Rep. 2021, 11, 16448. [Google Scholar] [CrossRef]
  34. Liu, W.; Fritz, C.; Nonhebel, S.; Everts, H.F.; Grootjans, A.P. Landscape-level vegetation conversion and biodiversity improvement after 33 years of restoration management in the Drentsche Aa brook valley. Restor. Ecol. 2022, 30, e13601. [Google Scholar] [CrossRef]
  35. Li, W.; Kang, J.; Wang, Y. Seasonal changes in ecosystem health and their spatial relationship with landscape structure in China’s Loess plateau. Ecol. Indic. 2024, 163, 112127. [Google Scholar] [CrossRef]
  36. Liang, X.; Jia, H.; Chen, H.; Liu, D.; Zhang, H. Landscape Sustainability in the Loess Hilly Gully Region of the Loess Plateau: A Case Study of Mizhi County in Shanxi Province, China. Sustainability 2018, 10, 3300. [Google Scholar] [CrossRef]
  37. Zheng, S.X.; Shangguan, Z.P. Foliar δ13C values of nine dominant species in the Loess Plateau of China. Photosynthetica 2007, 45, 110–119. [Google Scholar] [CrossRef]
  38. Wang, Z.K.; Jiang, H.L.; Shen, Y.Y. Forage production and soil water balance in oat and common vetch sole crops and intercrops cultivated in the summer-autumn fallow season on the Chinese Loess Plateau. Eur. J. Agron. 2020, 115, 126042. [Google Scholar] [CrossRef]
  39. Yuan, Z.Q.; Yu, K.L.; Guan, X.K.; Fang, C.; Li, M.; Shi, X.Y.; Li, F.M. Medicago sativa improves soil carbon sequestration following revegetation of degraded arable land in a semi-arid environment on the Loess Plateau, China. Agric. Ecosyst. Environ. 2016, 232, 93–100. [Google Scholar] [CrossRef]
  40. Wang, E.; Lu, Z.; Rohani, E.R.; Ou, J.; Tong, X.; Han, R. Current and future distribution of Forsythia suspensa in China under climate change adopting the MaxEnt model. Front. Plant Sci. 2024, 15, 1394799. [Google Scholar] [CrossRef] [PubMed]
  41. Chai, Q.L.; Ma, Z.Y.; An, Q.Q.; Wu, G.L.; Chang, X.F.; Zheng, J.Y.; Wang, G.J. Does Caragana korshinskii plantation increase soil carbon continuously in a water-limited landscape on the Loess Plateau, China? Land Degrad. Dev. 2019, 30, 1691–1698. [Google Scholar] [CrossRef]
  42. Zhu, P.Z.; Zhang, G.H.; Wang, H.X.; Xing, S.K. Soil infiltration properties affected by typical plant communities on steep gully slopes on the Loess Plateau of China. J. Hydrol. 2020, 590, 125535. [Google Scholar] [CrossRef]
  43. Keyimu, M.; Li, Z.S.; Fu, B.J.; Chen, W.L.; Wei, J.S.; Jiao, L.; Gao, G.Y.; Lu, Y.H. Spatial differences in the radial growth responses of black locust (Robinia pseudoacacia Linn.) to climate on the Loess Plateau, China. Dendrochronologia 2021, 67, 125832. [Google Scholar] [CrossRef]
  44. Yang, Q.; Fan, J.; Xing, Y.Z.; Tong, B.Y.; Luo, Z.B. Water use strategies for three dominant tree species in pure plantations of the semi-arid Chinese Loess Plateau. J. Hydrol. 2025, 654, 132844. [Google Scholar] [CrossRef]
  45. Wang, J.X.; Zhang, H.Q.; Yang, R.; Gao, J.; Liu, Y.Q.; Zhang, H.J.; Wang, Y.Y.; Tang, M. Contribution of Suillus variegatus to the ecological restoration of 10-year-old Pinus tabuliformis on the Loess Plateau. Appl. Soil Ecol. 2021, 167, 104044. [Google Scholar] [CrossRef]
  46. Luo, J.; Chen, Y.; Wu, Y.; Xie, G.; Jia, W.; Sardar, M.F.; Binobead, M.A.; Li, X. Suitability and Structural Optimization of Vegetation Restoration on the Loess Plateau: A MaxEnt Model-Based Study of Environmental and Anthropogenic Impacts. Forests 2024, 15, 1528. [Google Scholar] [CrossRef]
  47. Hair, J.F. Multivariate Data Analysis, 7th ed.; Pearson: London, UK, 2009; ISBN 0138132631. [Google Scholar]
  48. Guisan, A.; Thuiller, W.; Zimmermann, N. Habitat Suitability and Distribution Models: With Applications in R; Cambridge University Press: Cambridge, UK, 2017; 478p. [Google Scholar]
  49. Franklin, J. Species distribution models in conservation biogeography: Developments and challenges. Divers. Distrib. 2013, 19, 1217–1223. [Google Scholar] [CrossRef]
  50. Pearce, J.; Ferrier, S. Evaluating the predictive performance of habitat models developed using logistic regression. Ecol. Model. 2000, 133, 225–245. [Google Scholar] [CrossRef]
  51. Elith, J.; Leathwick, J.R. Species Distribution Models: Ecological Explanation and Prediction Across Space and Time. Annu. Rev. Ecol. Evol. Syst. 2009, 40, 677–697. [Google Scholar] [CrossRef]
  52. Swets, J.A. Measuring the Accuracy of Diagnostic Systems. Science 1988, 240, 1285–1293. [Google Scholar] [CrossRef]
  53. Phillips, S.J.; Anderson, R.P.; Dudík, M.; Schapire, R.E.; Blair, M.E. Opening the black box: An open-source release of Maxent. Ecography 2017, 40, 887–893. [Google Scholar] [CrossRef]
  54. Isaac, N.J.B.; Jarzyna, M.A.; Keil, P.; Dambly, L.I.; Boersch-Supan, P.H.; Browning, E.; Freeman, S.N.; Golding, N.; Guillera-Arroita, G.; Henrys, P.A.; et al. Data Integration for Large-Scale Models of Species Distributions. Trends Ecol. Evol. 2020, 35, 56–67. [Google Scholar] [CrossRef]
  55. Shi, S.; Li, Z.; Wang, H.; von Arx, G.; Lü, Y.; Wu, X.; Wang, X.; Liu, G.; Fu, B. Roots of forbs sense climate fluctuations in the semi-arid Loess Plateau: Herb-chronology based analysis. Sci. Rep. 2016, 6, 28435. [Google Scholar] [CrossRef] [PubMed]
  56. Van Daele, F.; Honnay, O.; Janssens, S.; De Kort, H. Habitat fragmentation affects climate adaptation in a forest herb. J. Ecol. 2024, 112, 246–264. [Google Scholar] [CrossRef]
  57. Zhang, M.; Yu, S.; Zhao, Z. The Role of Spatial Morphology in Forest Landscape Fragmentation: Insights From Planted and Natural Forests of the Chinese Loess Plateau. Land Degrad. Dev. 2024, 35, 5100–5114. [Google Scholar] [CrossRef]
  58. Sun, C.; Chai, Z.; Liu, G.; Xue, S. Changes in Species Diversity Patterns and Spatial Heterogeneity during the Secondary Succession of Grassland Vegetation on the Loess Plateau, China. Front. Plant Sci. 2017, 8, 1465. [Google Scholar] [CrossRef]
  59. Jian, X.; Li, L.; Wang, Z.; Ai, L.; Cheng, W.; Li, X. Effects of landscape edge heterogeneity on biodiversity in grassland restoration context. J. Environ. Manag. 2025, 376, 124508. [Google Scholar] [CrossRef]
  60. Wang, N.; Jing, Y.; Ren, X.; Qiao, H.; Zhang, H.; Dang, X.; Meng, Z. Fine-scale analysis of edge effect of shrub patch in different grassland types. Front. Environ. Sci. 2022, 10, 2022. [Google Scholar] [CrossRef]
  61. Schlaepfer, D.R.; Braschler, B.; Rusterholz, H.-P.; Baur, B. Genetic effects of anthropogenic habitat fragmentation on remnant animal and plant populations: A meta-analysis. Ecosphere 2018, 9, e02488. [Google Scholar] [CrossRef]
  62. Dalling, J.W.; Muller-Landau, H.C.; Wright, S.J.; Hubbell, S.P. Role of dispersal in the recruitment limitation of neotropical pioneer species. J. Ecol. 2002, 90, 714–727. [Google Scholar] [CrossRef]
  63. Thomson, F.J.; Moles, A.T.; Auld, T.D.; Kingsford, R.T. Seed dispersal distance is more strongly correlated with plant height than with seed mass. J. Ecol. 2011, 99, 1299–1307. [Google Scholar] [CrossRef]
  64. Huang, A.; Shen, R.; Jia, G.; Xu, X. Reforestation enhanced landscape connectivity for thermal buffering in China. Environ. Res. Lett. 2022, 17, 014056. [Google Scholar] [CrossRef]
  65. Wang, T.; Dong, L.; Liu, Z. Stand structure is more important for forest productivity stability than tree, understory plant and soil biota species diversity. Front. For. Glob. Change 2024, 7, 1354508. [Google Scholar] [CrossRef]
  66. Zamorano-Elgueta, C.; Orsi, F.; Geneletti, D.; Cayuela, L.; Hamer, R.; Lara, A.; Benayas, J.M.R. Integrating Ecological Suitability and Socioeconomic Feasibility at Landscape Scale to Restore Biodiversity and Ecosystem Services in Southern Chile. Environ. Manag. 2025, 75, 588–605. [Google Scholar] [CrossRef]
  67. Meerow, S.; Newell, J.P. Spatial planning for multifunctional green infrastructure: Growing resilience in Detroit. Landsc. Urban Plan. 2017, 159, 62–75. [Google Scholar] [CrossRef]
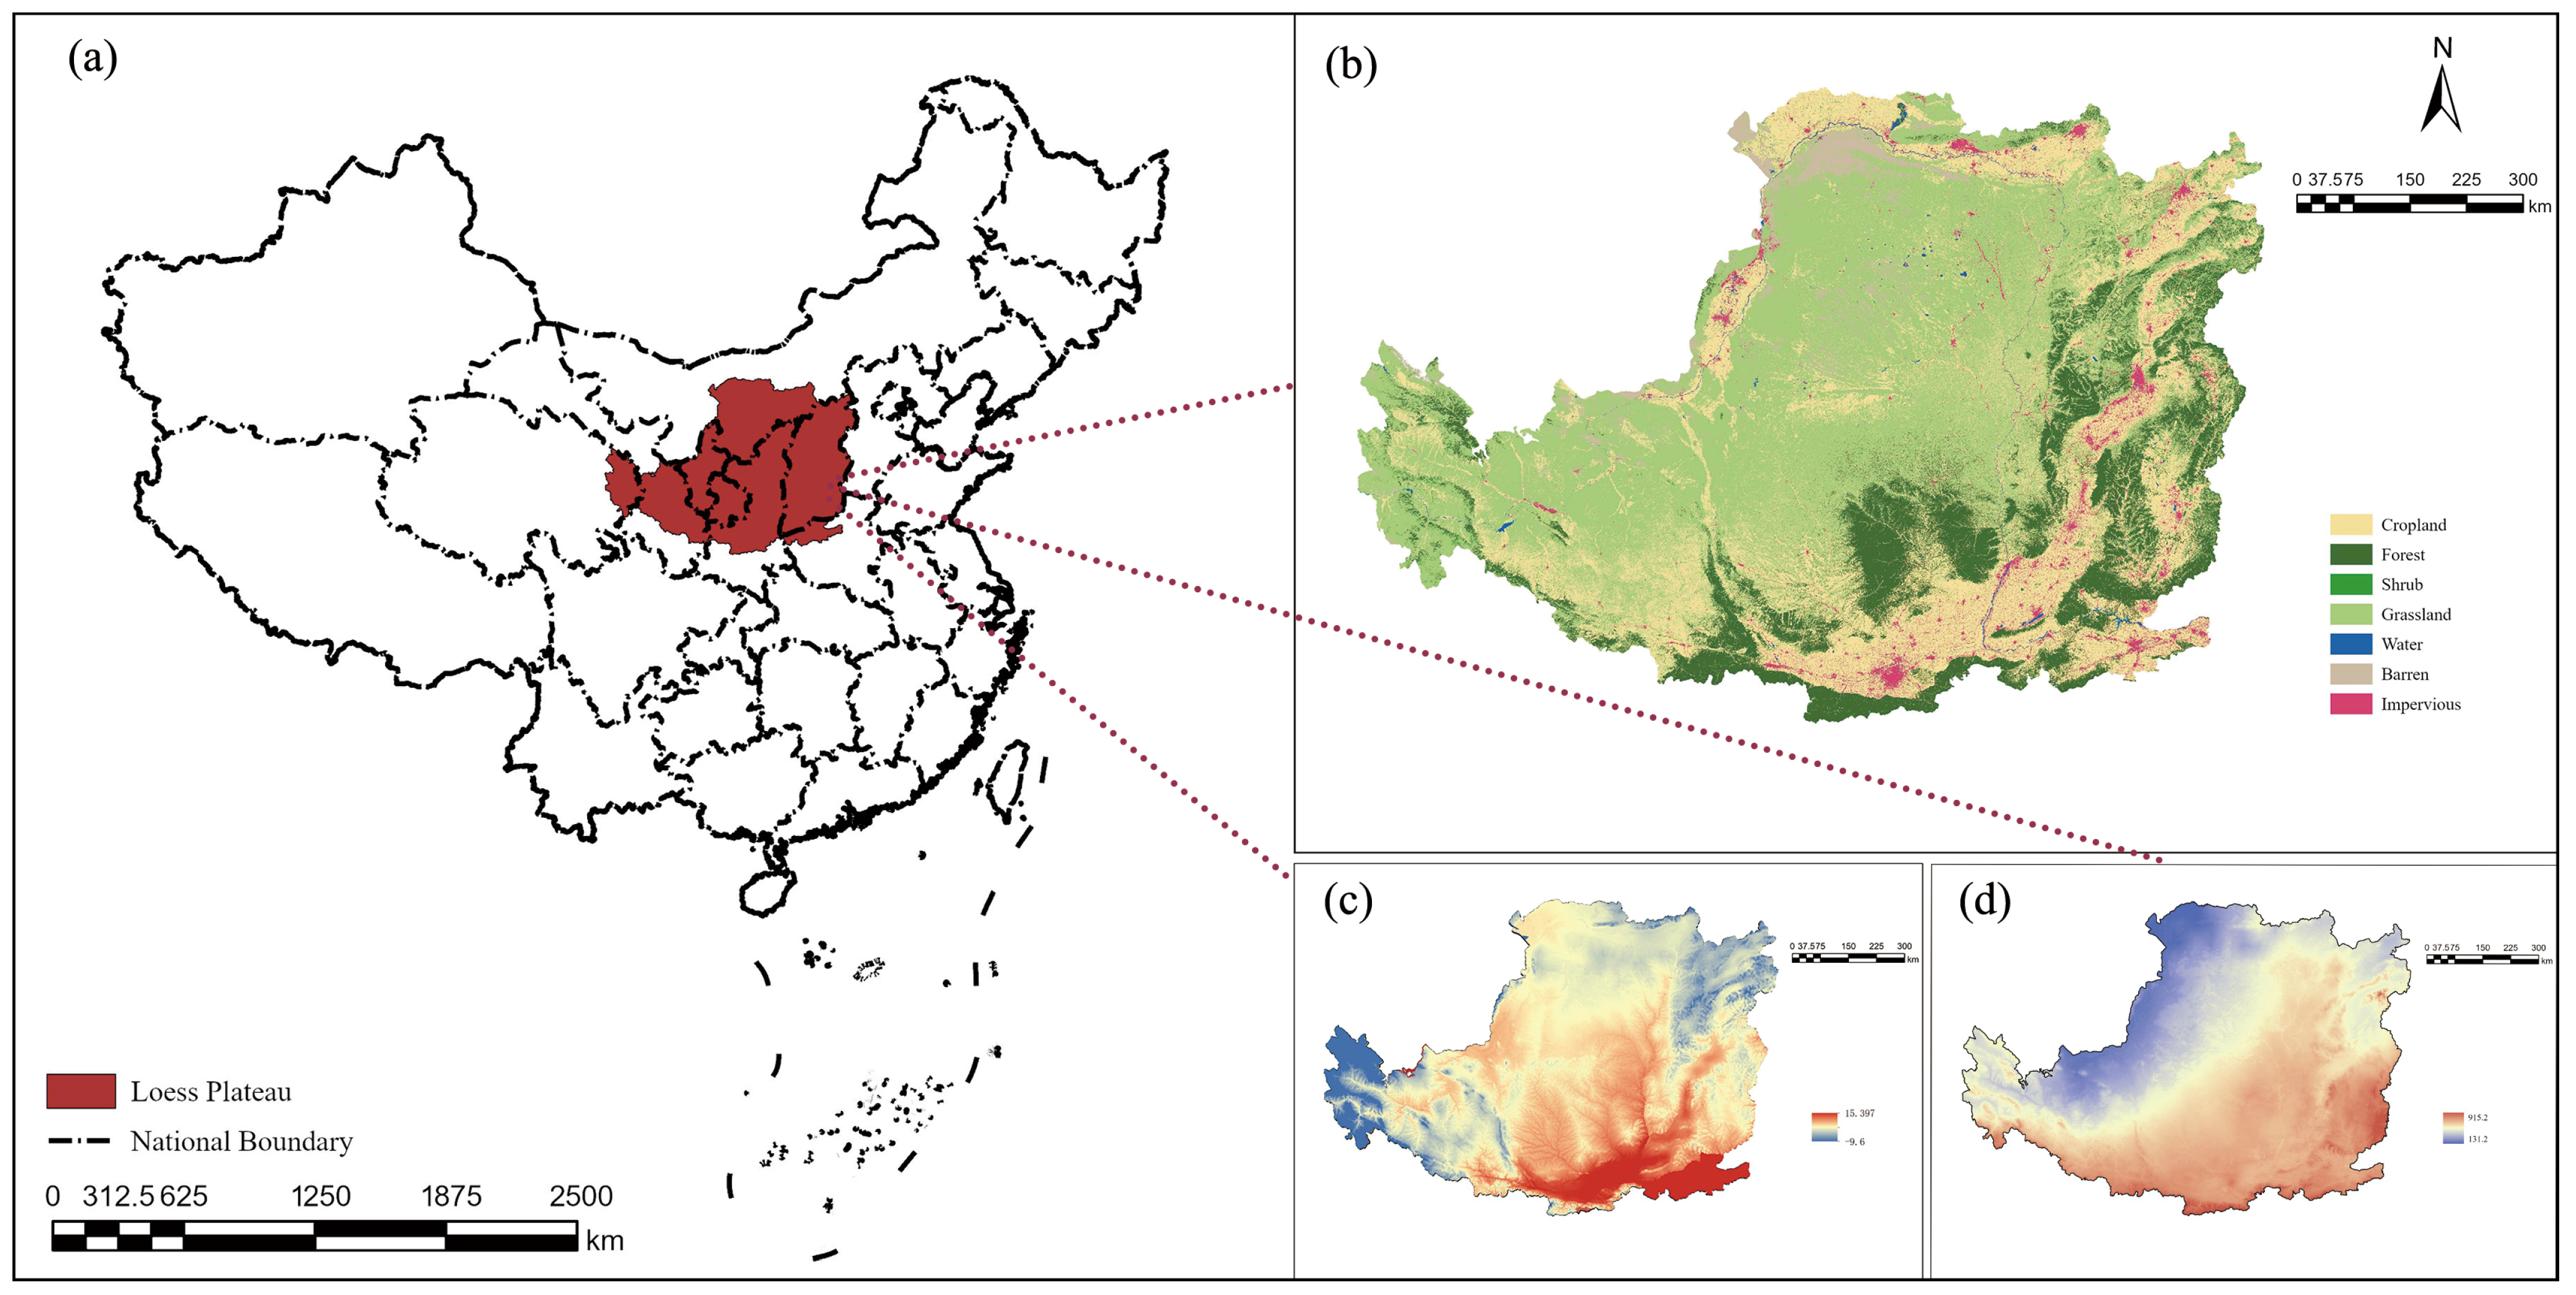
Figure 1. Overview map of the research area. (a) Geographic location of the Loess Plateau, (b) Current land-use status, (c) Annual temperature, (d) Annual precipitation.
Forests 16 01569 g001
Figure 2. Research framework.
Forests 16 01569 g002
Figure 3. Jackknife analysis of regularized training gain. The picture shows the results of the jackknife test of variable importance. The values are presented as averages over replicate runs.
Forests 16 01569 g003
Figure 4. Comparison of potential suitable planting areas before and after incorporating landscape pattern factors into the three species layers.
Forests 16 01569 g004
Figure 5. The suitable area under two scenarios. Values denote the area (103 km2) corresponding to each habitat suitability class.
Forests 16 01569 g005
Figure 6. Optimal suitability distribution of herb layer species on the Loess Plateau.
Forests 16 01569 g006
Figure 7. Optimal suitability distribution of shrub layer species on the Loess Plateau.
Forests 16 01569 g007
Figure 8. Optimal suitability distribution of tree layer species on the Loess Plateau.
Forests 16 01569 g008
Figure 9. Vertical structure of species in vegetation restoration on the Loess Plateau.
Forests 16 01569 g009
Figure 10. Top 10 contributing factors influencing the distribution of each species. The values represent the percentage contribution of each factor.
Forests 16 01569 g010
Table 1. Area under the curve (AUC) values for nine species under two scenarios.
SpeciesEnvironment and Human ActivityEnvironment, Human Activity and Landscape Metrics
TreesSalix matsudana0.9340.99
Robinia pseudoacacia0.9610.988
Pinus tabuliformis Carrière0.9380.994
ShrubsCaragana korshinskii0.9160.981
Forsythia suspensa0.9730.996
Hippophae rhamnoides0.9140.99
HerbsMedicago_sativa0.9320.988
Avena sativa0.9530.992
Agropyron cristatum0.9240.974
Disclaimer/Publisher’s Note: The statements, opinions and data contained in all publications are solely those of the individual author(s) and contributor(s) and not of MDPI and/or the editor(s). MDPI and/or the editor(s) disclaim responsibility for any injury to people or property resulting from any ideas, methods, instructions or products referred to in the content.