Article

Enhancing Distance-Independent Forest Growth Models Using National-Scale Forest Inventory Data

1
Department of Forest Resources, Kookmin University, 77 Jeongneung-ro, Seongbuk-gu, Seoul 02707, Republic of Korea
2
Department of Forest, Environment, and Systems, Kookmin University, 77 Jeongneung-ro, Seongbuk-gu, Seoul 02707, Republic of Korea
3
Forest Carbon Graduate School, Kookmin University, 77 Jeongneung-ro, Seongbuk-gu, Seoul 02707, Republic of Korea
4
Forest Ecology Division, National Institute of Forest Science, 57 Hoegi-ro, Dondeamun-gu, Seoul 02455, Republic of Korea
5
Department of Forest Science, Kongju National University, Yesan 32439, Republic of Korea
*
Author to whom correspondence should be addressed.
Forests 2025, 16(10), 1567; https://doi.org/10.3390/f16101567
Submission received: 13 August 2025 / Revised: 3 October 2025 / Accepted: 7 October 2025 / Published: 10 October 2025
(This article belongs to the Section Forest Inventory, Modeling and Remote Sensing)

Abstract

National-scale long-term forest ecosystem surveys based on systematic sampling offer a robust framework for detecting temporal growth trends of specific tree species across regions. The National Forest Inventory (NFI) of the Republic of Korea serves as a vital source for analyzing long-term forest dynamics on a national scale by providing regularly collected large-scale forest data. However, various limitations, such as the lack of individual-level and spatial interaction data, restrict the development of reliable individual tree growth models. To overcome this, distance-independent models, compatible with the structure and data resolution of the NFI, provide a practical alternative for simulating individual tree and stand-level growth by utilizing straightforward attributes, such as diameter at breast height (DBH). This study aimed to analyze the growth patterns and construct species-specific models for two major plantation species in South Korea, Pinus koraiensis and Larix kaempferi, using data from the 5th (2006–2010), 6th (2011–2015), and 7th (2016–2020) NFI survey cycles. The sampling points included 117 and 171 plots for P. koraiensis and L. kaempferi, respectively. An additional matching process was implemented to improve species identification and tracking across multiple survey years. The final models were parameterized using a distance-independent model, integrating the estimation of potential diameter growth (PG) and a modifier (MOD) function to adjust for species- and site-specific variabilities. Consequently, the models for each species demonstrated strong performance, with P. koraiensis showing an R2 of 0.98 and RMSE of 1.15 (cm), and L. kaempferi showing an R2 of 0.98 and RMSE of 1.14 (cm). This study provides empirical evidence for the development of generalized and scalable growth models using NFI data. As the NFI increases in volume, the framework can be expanded to underrepresented species to improve the accuracy of underperforming models. Ultimately, this study lays a scientific foundation for the future development of tree-level simulation algorithms for forest dynamics, encompassing mortality, harvesting, and regeneration.

1. Introduction

A decision support system (DSS) for forest ecosystems serves as a tool to support decision-making for predicting forest dynamics under various management strategies. It typically comprises a knowledge-based database, simulation model, and user interface. The forest DSS can be used to develop forest management strategies that simulate forest dynamics under various management practices, including planting, thinning, and harvesting [1,2]. The forest DSS employs various simulation-based approaches that include multiple processes in forestry, including growth, mortality, regeneration, harvest, and disturbances [3,4]. Forest DSS possess the strength to customize management practices by integrating spatiotemporal harvest intensity and frequency while evaluating both short- and long-term risks associated with disturbances, such as fire, wind, landslides, and insect outbreaks [5,6,7]. In particular, NED-2 and 3 are designed to evaluate the multi-functionality of forest ecosystem dynamics using a user-friendly interface [8].
The design and application of forest DSSs require precise forest growth algorithms, which underpin the simulation of diverse forest ecosystem processes, including growth, mortality, harvesting, reproduction, and disturbance [9]. The growth algorithms evaluate the effectiveness of different management scenarios and facilitate optimal decision-making in forest planning [10]. A nationally applicable and large-scale tree growth algorithm requires a hybrid modeling approach. This approach combines mechanistic models that are generalizable across diverse environmental conditions with empirical models that often provide higher accuracy under stable site conditions [11,12]. The integration leverages the strengths of both model types to ensure reliability and precision in growth simulations across multiple spatial and ecological scales. In contrast to localized growth models, which fail to account for species-specific growth variations across latitudes and elevations, the National Forest Inventory (NFI) can be used to parameterize species-specific growth patterns at broader landscape or national scales by incorporating diverse climatic and environmental conditions [13].
Individual tree growth is influenced by various factors, including growth patterns, competition, and topographic features [9,14,15]. In the context of climate change, predicting the long-term forest dynamics that occur through individual tree growth has become increasingly challenging owing to the complex interplay of ecological factors. Modeling forest dynamics offers a robust approach for integrating multiple biotic and abiotic factors while simulating long-term scenarios [16]. Distance-independent and distance-dependent forest dynamic models are commonly employed via individual tree growth models. Distance-dependent models explicitly account for spatial interactions among individual trees, such as crown overlap, light competition, and proximity-based effects. These models are suitable for detailed structural analysis and spatially explicit forest dynamic simulations. Notable examples include the Spatially Explicit, Individual-Based Model of Forest Dynamics (SORTIE), Silvicultural Simulator for Uneven-aged Mixed Forests (SILVA), and individual-based forest Landscape and disturbance model (iLand) [17,18,19]. Conversely, distance-independent models estimate tree growth without considering the spatial arrangement of neighboring trees. The assessment is based on tree- or stand-level attributes, including diameter at breast height (DBH), height, age, and site index (SI). These models are computationally efficient and well-suited for large-scale applications using NFI data. Representative distance-independent models include the Forest Vegetation Simulator (FVS) and Physiological Principles Predicting Growth (3-PG) [4,20].
National-level forest policy and decision-making for sustainable forest management necessitate reliable vegetation information to inform scientific solutions to the current climate crisis [21,22]. Individual tree growth models are essential for sustainable and comprehensive forest management practices. However, developing reliable models often requires the long-term and periodic monitoring of species-level tree growth data [4,18,23]. The NFI provides consistent, long-term, standardized, and spatially extensive data on forest structure, species composition, and growth dynamics, thereby aiding national forest policy, ecological research, and climate change mitigation strategies [24,25,26,27,28]. Its systematic fixed-plot design enables the detection of temporal trends, while its broad-scale geographic coverage guarantees national representativeness. The strengths of the NFI render it a crucial data source for forest modeling, policy planning, and ecosystem service assessment.
The NFI datasets in South Korea identify forest structures and ecological characteristics, thereby providing essential data for sustainable forest management and policy development [29,30,31]. The NFI has been operational since 1972 and established nationwide sample plots at the beginning of the 5th NFI survey cycle (2006–2010). However, the NFI in South Korea does not provide accurate location data for individual trees in the plot, and tree heights are primarily surveyed for standard trees based on DBH distribution [32]. Therefore, constructing individual tree-growth models, particularly distance-dependent models, is challenging due to the necessity for precise input data.
The distance-independent growth model predicts individual tree growth without explicitly incorporating spatial interactions, such as competition or tree-to-tree distances. Instead, it indirectly accounts for competitive influences via stand-level indicators derived from the DBH, such as basal area in larger trees (BAL), basal area (BA), and stand density index (SDI) [33]. This strength enhances compatibility, although it presents some gaps in vegetation information. Nevertheless, an integrated modeling framework linking NFI and distance-independent growth simulations has not yet been established in South Korea.
In this study, we aimed to develop a distance-independent growth model optimized for forest ecosystems in South Korea using NFI data and extend it into a forest management DSS in the future. To this end, the following detailed process was performed: (1) individual tree information was refined and individual tree growth was tracked using the 5th, 6th, and 7th NFI for major domestic forest tree species; (2) the parameters of the distance-independent growth model were estimated based on the preprocessed NFI individual tree information for each tree species; (3) evaluation was conducted using national (NFI) and regional field data to review the reliability and applicability of the developed growth model. The findings of this study are anticipated to advance our understanding of species-specific growth dynamics in South Korean forests and provide a theoretical basis for scalable, inventory-integrated simulation frameworks in forest management DSS.

2. Materials and Methods

2.1. Study Area and Target Species

The mainland of South Korea (124.5–132.0° E, 33.0–38.9° N), excluding island regions, was used as the study area. This region exhibits diverse climatic conditions shaped by its complex topography, which includes an average elevation of 253 m and a maximum elevation of 1939 m (Figure 1). The Taebaek Mountain Range, which traverses the country from north to south, contributes to steep altitudinal gradients across the landscape.
We extracted individual-level Pinus koraiensis and Larix kaempferi species data through the NFI to parameterize coefficients for developing growth predictions based on a distance-independent model. P. koraiensis and L. kaempferi are key coniferous species in South Korea, along with Pinus densiflora and Quercus spp. In 2020, these two species were distributed over approximately 152,000 ha and 260,000 ha, respectively, of the total national forest area of 6.29 million ha [34].

2.2. Data Collection and Preprocessing

The NFI developed a systematic sampling method using a 4 km × 4 km grid to encompass the whole country and established vegetation databases for 70 items through more than 4500 fixed sample plots across South Korea (Figure 1). In addition, it has been used to assess changes in tree growth over time through rotational surveys of various forest types. These fixed sample plots, surveyed at five-year intervals, comprise four sub-sample plots arranged in a cluster. Each subsample plot features a multiple concentric circle structure (e.g., large tree, soil, and sapling plots). In this study, we focused on three key attributes from the NFI vegetation database. First, DBH is measured for every individual tree within the plots, which enabled the identification of individual tree ID, subsequently used for parameterizing potential growth (PG) and modifier (MOD) functions. Second, tree height is measured only for standard trees, while the heights of dominant and codominant trees are provided as estimates, with crown class information recorded in the NFI dataset. We used the estimated heights of dominant and subdominant trees to calculate the SI. Third, tree age is recorded for all individual trees and was also incorporated into SI estimation. Furthermore, starting from the 5th NFI, it has been accessible on the Korea Forest Service Forestry Statistics Platform (https://kfss.forest.go.kr/stat/ptl/article/articleList.do?curMenu=11694&bbsId=microdataboard, accessed on 1 October 2024). However, this data is only available in Korean, and the exponential increase in detailed vegetation data from numerous plots over time substantially increases the time-consuming nature of data processing. To address this limitation, we used the “knfi” R package (https://github.com/SYOUNG9836/knfi, accessed on 1 October 2024), which provides a standardized and automated workflow optimized for South Korea’s NFI dataset. The package streamlines the handling of tree- and plot-level data by integrating extraction, preprocessing, and analysis functions, and it further enables spatial and temporal visualization of forest ecosystem dynamics. Vegetation data (DBH and tree height) were extracted from sample plots in which the target species accounted for more than 75% of the total BA. This resulted in 158 plots for P. koraiensis and 207 plots for L. kaempferi based on the 7th NFI (Table 1).
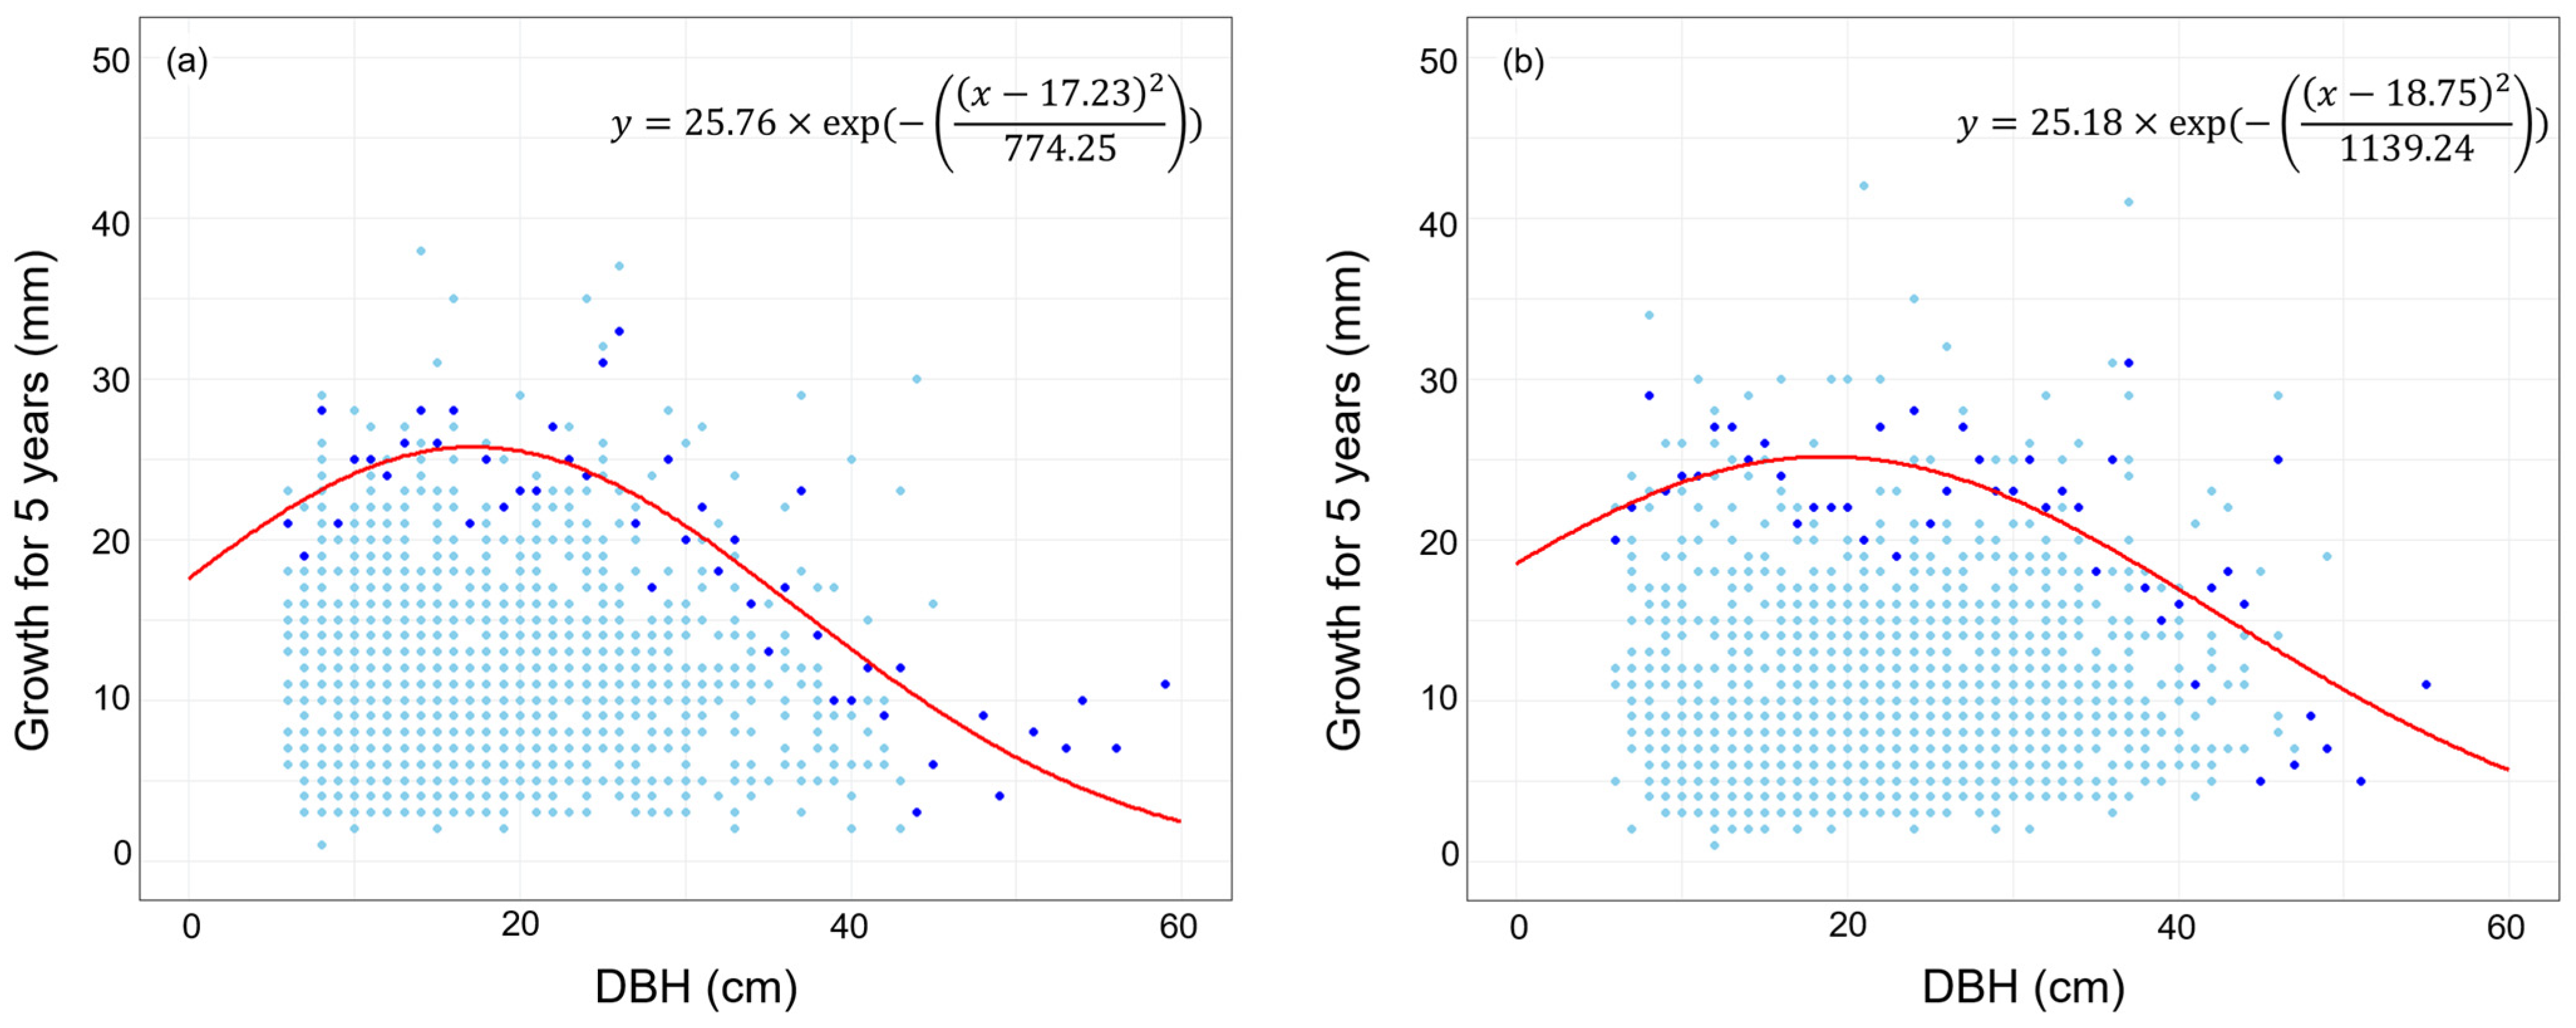
The NFI is intended for estimating national or district-level statistics on forest resources. However, it has limitations in monitoring the dynamics of individual trees over time because they are not identified. The uncertainty in matching individual trees across survey cycles, which occurs when IDs are assigned based on the rank order of DBH within each plot, may result in biologically implausible growth patterns, such as unrealistically large or negative increments for some trees. These inconsistencies complicate individual tree matching and impede accurate growth increment estimation. To solve this problem, we developed an individual tree matching procedure. We first assumed that the rank order of tree growth rates (increments) remained consistent over time and that DBH increased only with positive increments, excluding negative growth [35]. The maximum allowable growth rate was estimated utilizing individual tree-level DBH and tree-ring data from the 5th NFI survey cycle. In particular, for each 1 cm DBH class at the species level, the second-largest increment value was extracted and used to fit a nonlinear least squares (NLS) regression model using “nls.multstart” R package (ver. 2.0.0) [36,37,38]. The species-specific maximum DBH increment thresholds were employed as matching criteria for individual trees across the NFI cycles (Figure 2). Based on these thresholds, individual trees were matched from the 5th to 7th NFIs. The following plots were excluded from the analysis [37]:
(1)
Plots in which forest management activities were implemented more than twice across the three survey cycles (5th to 7th NFIs), which complicated the tracking of individual tree growth over time.
(2)
Plots with missing individual tree data owing to survey omissions (including cases where dead trees were identified), which resulted in decreased total DBH and hindered the confirmation of accurate growth.
Finally, 5469 individual trees from 117 plots were selected for P. koraiensis, while 3511 individual trees from 171 reclassified plots were selected for L. kaempferi (Table S1).

2.3. Distance Independent Model Fitting

The dependent variable was the DBH growth of individual trees, while the independent variables included the potential diameter growth (PG) and modifier (MOD) functions [39,40,41]. The model equation is as follows:
D B H   G r o w t h = P G × M O D
Based on the NFI dataset with individual tree matching, we estimated the PG and MOD functions to calibrate the growth algorithm parameters of the distance-independent model. For each species, the dataset was randomly split at the plot level, with 70% of the plots used for model parameterization and 30% for validation.
First, PG represents the annual diameter increment of an individual tree under the assumption of no competition from neighboring trees. The dependent variable was the potential diameter growth of the dominant and codominant trees in each stand, while the independent variables were DBH, crown ratio (CR), and SI. The PG, reflecting the potential growth of dominant trees, was determined by calculating the mean and standard deviation of DBH increments and then adding 1.65 times the standard deviation to the mean DBH increment for each stand [40]. The SI reflects the site-specific environmental conditions of the stand, while the DBH and CR denote individual tree characteristics.
P G = b 1 + b 2 × D B H b 3 + b 4 × S I × C R × D B H b 5
The SI was estimated using classification curves derived from the Stand Yield Table developed for South Korea’s natural forests [42], whereas the CR was estimated based on prior research conducted on the same species in South Korea [43]. The MOD function adjusts the PG of individual trees within a stand, with a value of 0 indicating no growth and a value of 1 representing growth equal to PG [41]. The five-year diameter increment of each tree was used as the dependent variable in the model to ensure compatibility with the NFI cycles. The independent variables included DBH, stand average diameter (AD), maximum basal area (BAmax), and basal area per unit area (BA) [41].
M O D = 1 e x p ( f R × g A D × B A B A B A 0.5
f R = b 1 × 1 exp b 2 × D B H A D b 3 + b 4
g A D = b 5 × A D + 1 b 6
BAmax was an essential parameter for estimating the MOD function and was derived from the maximum stand number (MSN) theory [44,45]. This theory posits that the stand BA reaches its maximum when the stand density reaches its biological limit. Species-specific BAmax values were estimated based on the relationships among dominant tree height, stand density, and average DBH derived from the NFI and the Stand Yield Table. Following this approach, BAmax values for P. koraiensis and L. kaempferi were estimated at 57.91 m2/ha and 65.01 m2/ha, respectively. We estimated the PG (b1b5) and MOD (b1b6) parameters for each tree species using “nls.multstart” R package (ver. 2.0.0) to develop a growth algorithm [45].

2.4. Model Evaluation and Validation

Model accuracy was assessed using the coefficient of determination (R2) and root mean square error (RMSE), which quantify the degree of agreement between the predicted and observed DBH. Model evaluation was conducted by predicting five-year DBH increments from the preceding NFI cycle data, adding the predicted increment to the initial DBH to obtain the expected DBH after five years, and then comparing these values with the observed DBH from the subsequent cycle. Specifically, when the 6th NFI was used for evaluation, DBH growth predictions were derived from the 5th NFI survey cycle data and subsequently evaluated against observations from the 6th NFI survey cycle. To further examine the model’s performance, we conducted validation to determine whether it accurately simulated the growth changes under different thinning intensities. The test site for this analysis was a P. koraiensis forest (37°52′49.0″ N, 127°52′30.0″ E) located in Mt. Garisan, Chuncheon-si, Gangwon-do Province, South Korea, managed by the Korea Forest Service (KFS). These stands were planted in the 1960s and remained without managements until 2005. In 2007, three distinct thinning treatments were implemented: light, intensive, and no thinning (Table 2). Tree-level DBH and height measurements were obtained from 2006 to 2021 with the support of the National Institute of Forest Science (NIFoS) [46]. We simulated the DBH changes from 2006 to 2051 for each treatment group using the developed growth algorithm. These simulations were compared with the observed DBH data (2006, 2011, 2016, and 2021) to validate the accuracy of the model. Validation of L. kaempferi was not performed due to the lack of long-term thinning-specific monitoring data at the individual tree level in the fixed plots. All data analyses were performed using R version 4.2.2. [47].

3. Results

3.1. Growth Model Based on a Potential Diameter Growth and a Modifier Function

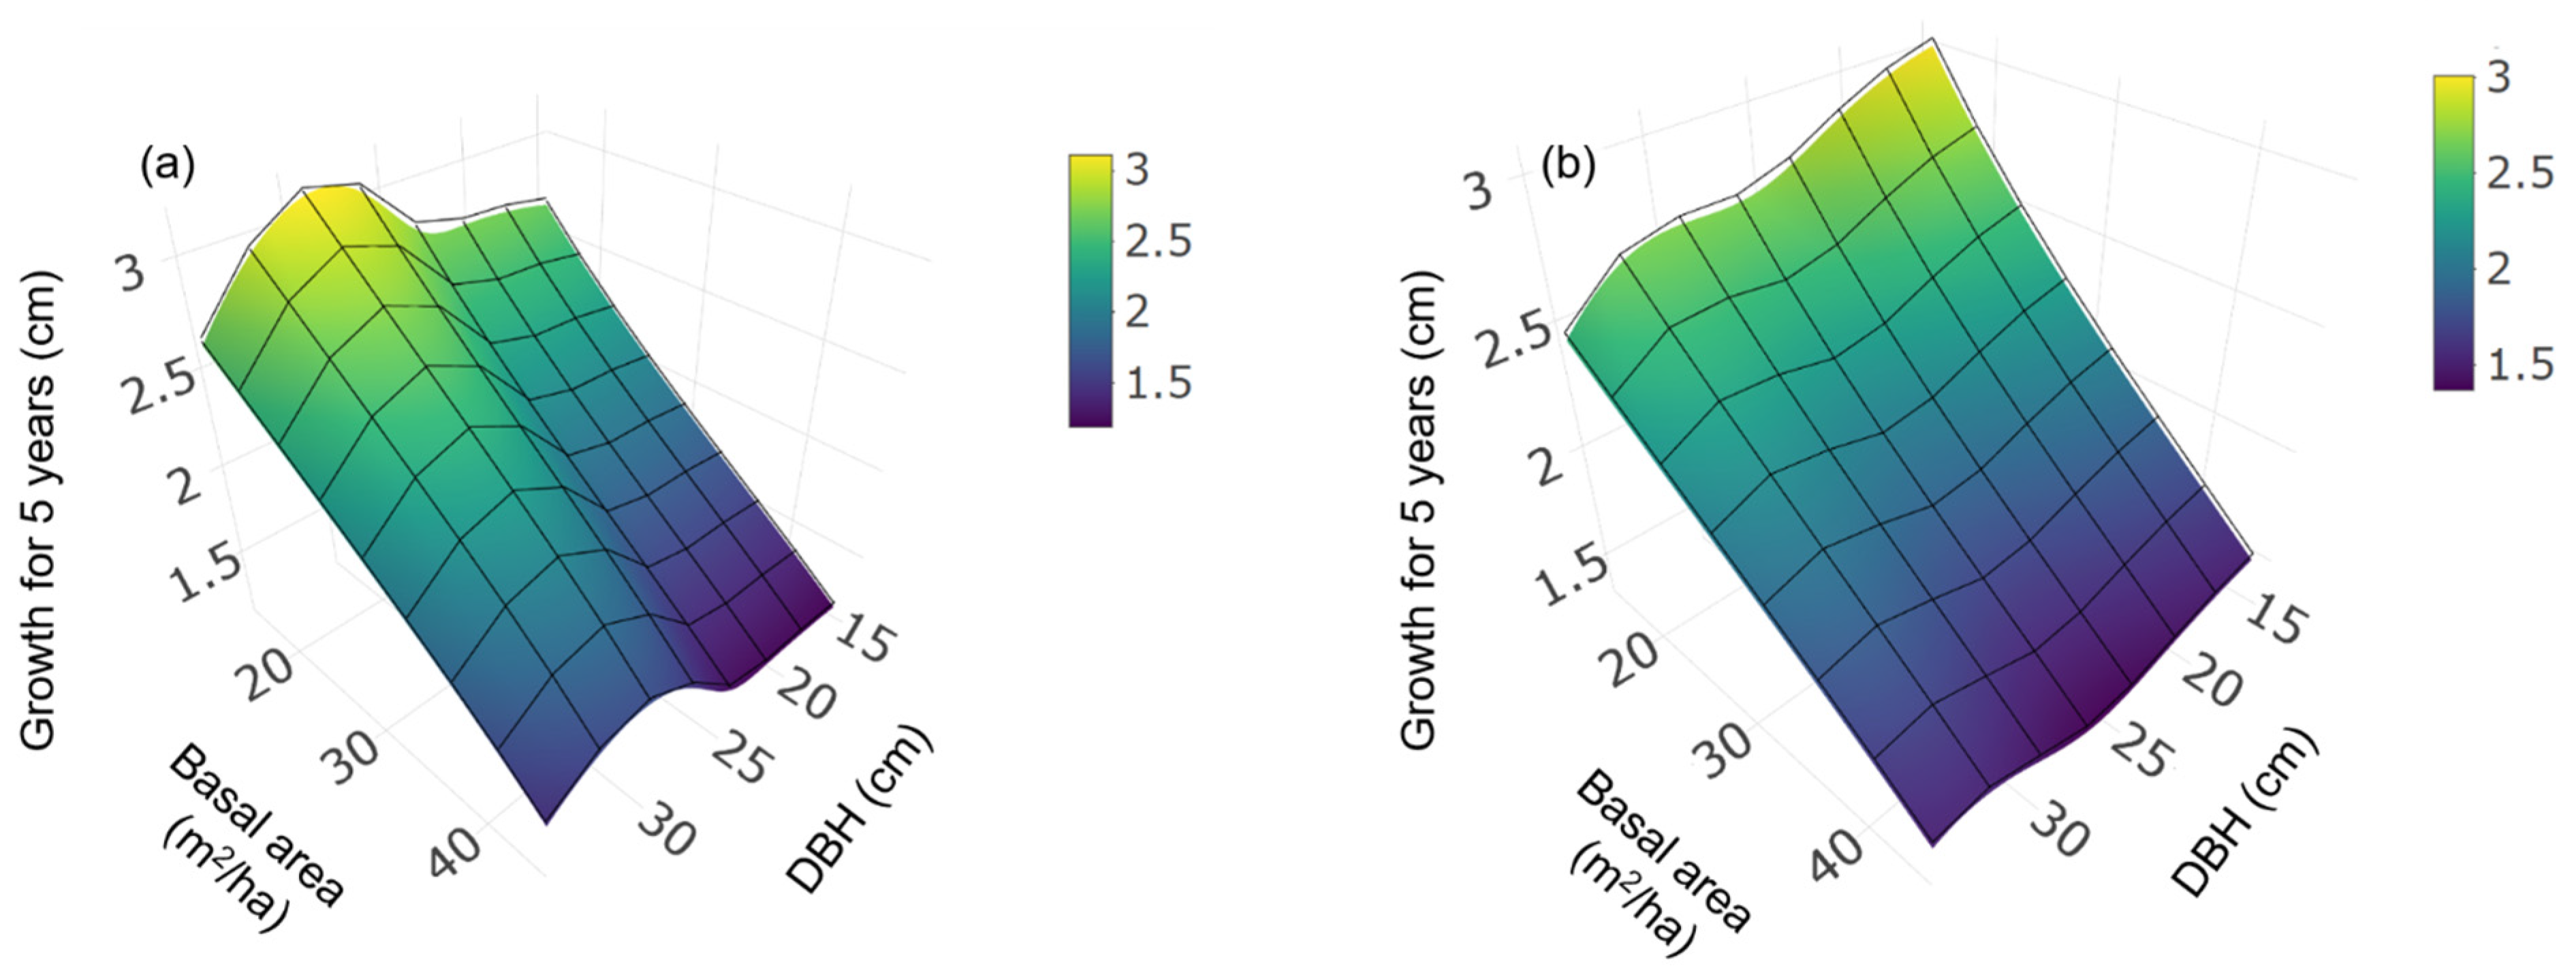
The growth model developed in this study estimated the actual DBH growth by multiplying the potential diameter growth by the MOD. Figure 3 illustrates the DBH growth in relation to the DBH and BA for the growth models of the representative P. koraiensis and L. kaempferi stands. The CR, SI, and AD for representative P. koraiensis stands derived from the NFI were 13, 0.52, and 23, respectively, whereas those for L. kaempferi were 19, 0.34, and 24, respectively. The model showed that DBH growth increased as BA decreased in both species. A low BA indicated reduced competition among trees, allowing individual trees to grow under favorable conditions. DBH increased from 25 cm onwards for both species, followed by a decrease after reaching 30 cm. In contrast to P. koraiensis, which showed minimal growth at a low DBH, L. kaempferi exhibited relatively high growth at low DBH and BA.
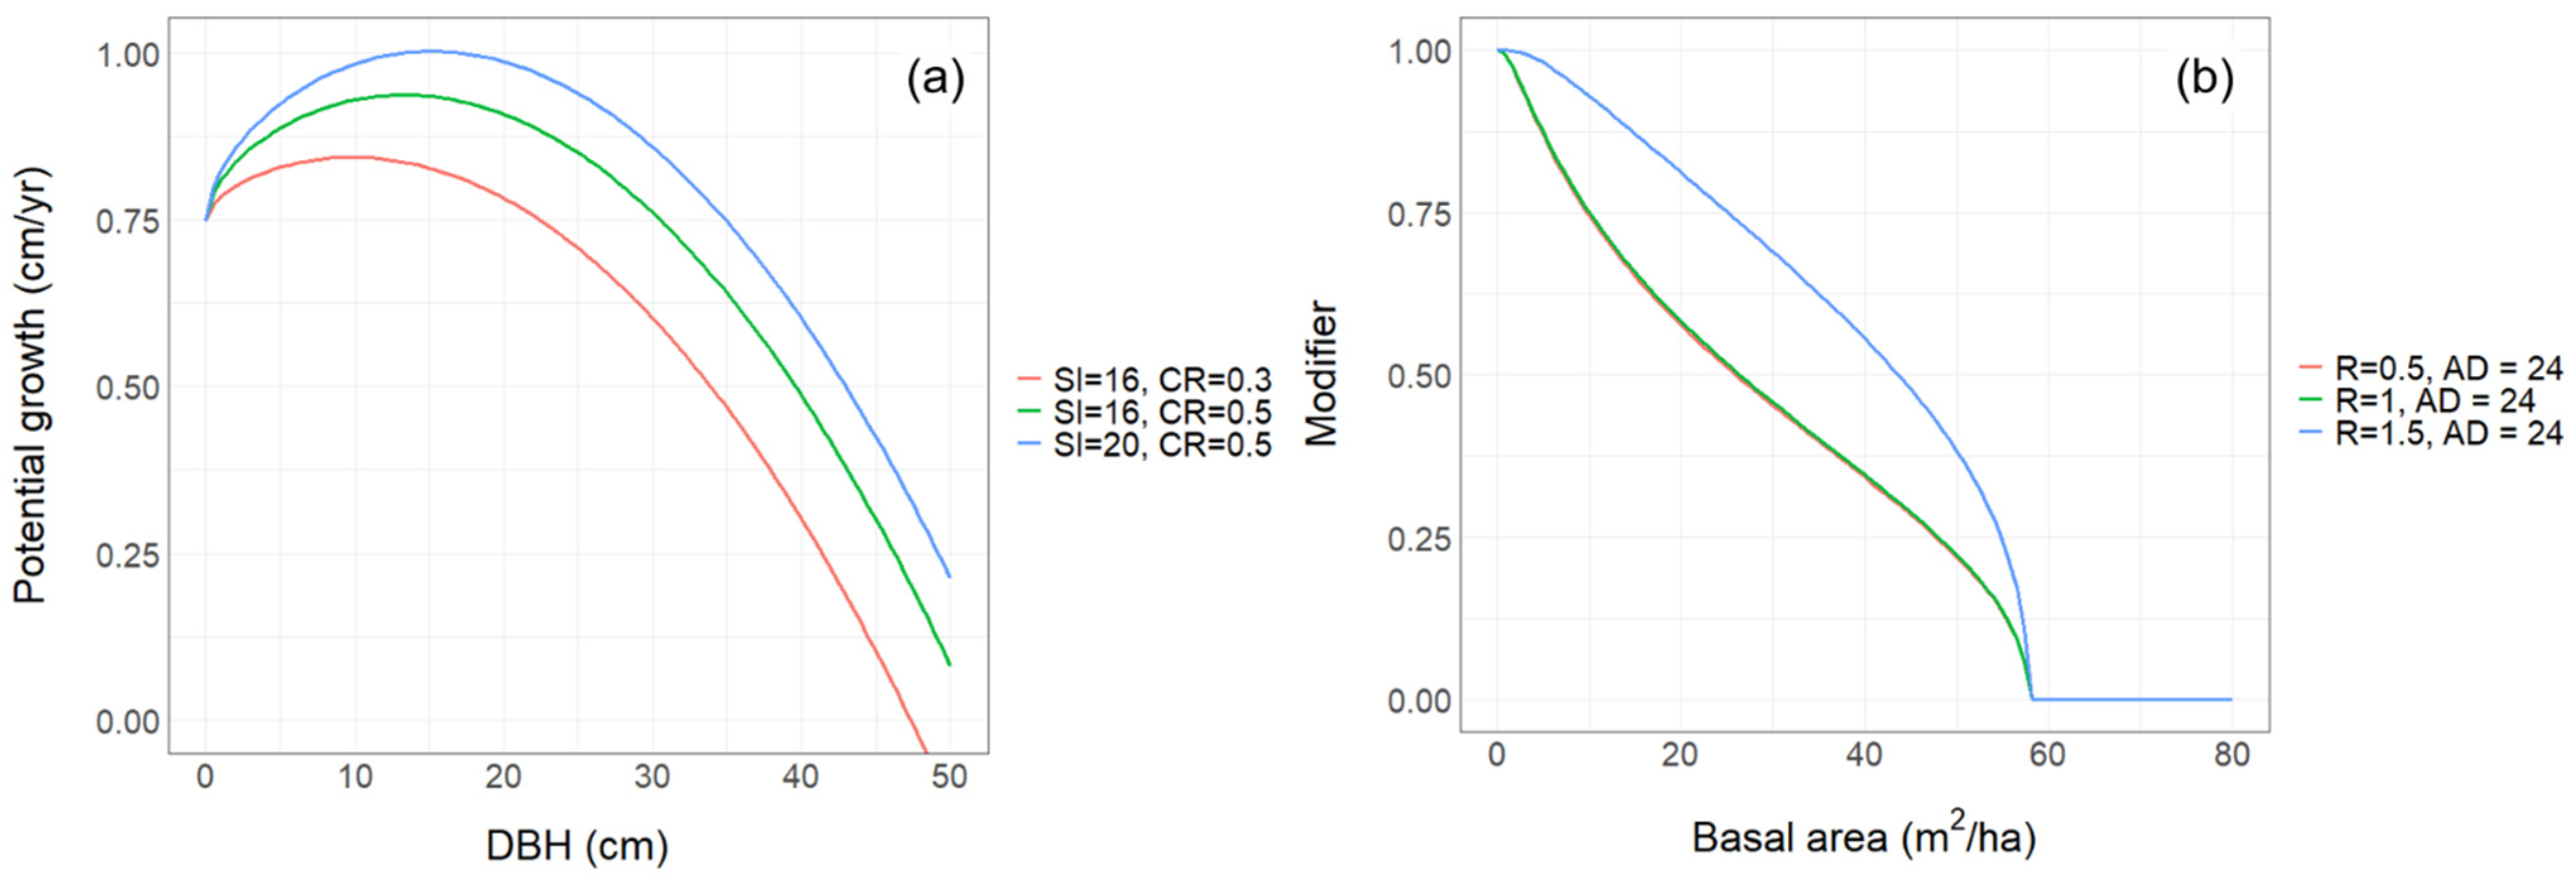
The PG curves for P. koraiensis increased gradually with DBH until peaking at approximately 25 cm (Figure 4a). Higher SI and CR values correlated with greater PG. The MOD function decreased with increasing BA, whereas the relative diameter (R = DBH/AD) positively influenced MOD values (Figure 4b). The model indicated that the reduction rate of the MOD function accelerated with increasing density (BA), thereby suggesting a more pronounced growth-suppression effect resulting from competition. Additionally, dominant trees (R = 1.5) were simulated to exhibit a relatively higher growth potential than that of suppressed trees. Both the PG and MOD curves of L. kaempferi showed patterns similar to those of P. koraiensis (Figure 5). The PG effectively captured growth patterns representative of actual forest conditions. Although the potential growth value in the early stages was low, it provided a more accurate depiction of actual forest growth trends by incorporating a gradual decline following the peak.

3.2. Model Evaluation and Validation

The initial evaluation of model performance was performed using the NFI dataset, followed by an additional evaluation in diverse thinning forests. The R2 values of 0.98 for P. koraiensis and 0.98 for L. kaempferi indicated outstanding predictive performance for both species (Table 3). The RMSE was approximately 1 cm over the five-year growth period, indicating that the estimated growth algorithm performed well. Notably, the PG coefficient b2 for P. koraiensis was exceptionally low. Similar results were also observed for L. kaempferi. Although b2 was intended to amplify potential growth with increasing DBH, its influence was limited in this model.
The model was validated for different thinning intensities (light thinning, intensive thinning, and no thinning) in the P. koraiensis forest on Mt. Garisan by comparing the estimated and observed DBH values from 2006 to 2051 at five-year intervals (Table 4, Figure 6). Across all treatments, the model exhibited consistently high predictive accuracy, with R2 values exceeding 0.86. In the light-thinning plot, the predicted DBH values were closely aligned with the observed values during the measurement period. The RMSE remained below 2.0 cm, while the bias ranged from −0.80 to −0.35, demonstrating stable predictions. The growth acceleration following the 2007 thinning was well captured, with the predicted trajectories showing a gradual increase until 2021. The mean DBH in the no thinning stand increased only slightly from 25.9 cm in 2026 to 26.8 cm in 2046. In contrast, both thinning treatments showed more significant diameter growth, with mean DBH rising from 35.0 to 38.4 cm (+3.4 cm) under light thinning and from 38.6 to 42.8 cm (+4.2 cm) under intensive thinning. The model reproduced this trend, achieving an R2 of 0.90, an RMSE below 1.8 cm, and a bias between −0.42 and +0.25. In contrast, the no-thinning stand showed limited forest growth from 2006, despite the BA not exceeding the maximum threshold (BAmax). While the model consistently overestimated DBH across all periods, both RMSE and the bias increased over time, reaching 2.81 cm and −2.40, respectively, in 2021.

4. Discussion

4.1. Applicability of the Distance-Independent Growth Model

Several instances of dynamic growth models integrating NFI and distance-independent models have emerged in South Korea. Previous studies have been limited to developing distance-independent models for individual tree species at a regional scale [48,49,50]. In this study, we successfully predicted the DBH for each tree species by applying a distance-independent model that incorporates PG and MOD based on NFI without the need for complex spatial data between individual trees (Figure 3). Competition between trees or species substantially affects growth; however, the underlying processes are physiologically and spatially complex, complicating the explanation of the mechanisms involved [51]. A distance-independent model possesses the structural advantage of demonstrating the overall effect of competition on growth via competition indicators, such as CR and BA, without requiring location data for individual trees [4,33]. Its structure allows for straightforward application to the South Korean NFI, specifically where spatial data is limited. The DBH growth model, integrated with the NFI, demonstrated a higher R2 and lower RMSE for both tree species (Table 3). Therefore, the average growth pattern was improved by developing reliable PG and MOD coefficients for the target species at the national level (Figure 4 and Figure 5).
Applying the growth model developed for P. koraiensis to experimental forests showed distinct differences between managed and non-managed stands in long-term simulations (Figure 6). DBH increased continuously in light and intensive thinning plots throughout the simulation period, with relatively larger-diameter trees observed particularly in the intensive thinning treatment plots (Figure 6a,b). However, in no thinning plot, DBH growth was predicted to be significantly suppressed after 2031 (Figure 6c). These results confirm that the MOD function effectively reflects competition based on stand density. Furthermore, this model can be utilized in designing various forest management strategies aimed at promoting the growth of large-diameter trees.
Integrating NFI and distance-independent models is applicable in various fields, such as analyzing changes in forest structure and ecosystem services due to climate change, evaluating national disaster risks, and implementing sustainable forest management [37,52,53]. Individual tree-level models facilitate precise management aimed at enhancing forest stability and optimizing carbon storage absorption through selective thinning. For example, simulating biomass changes in high-density forests allows for identifying wildfire-prone areas based on future fuel accumulation, thereby contributing to risk management through proactive thinning [54]. In addition, forest growth simulations across various thinning treatments, considering both intensity and frequency, can be integrated with long-term landslide models to pinpoint potentially hazardous areas [55]. Simulation studies integrating various forest management scenarios with forest growth models can provide a scientific basis for decision-making in sustainable forest management, such as establishing restoration strategies and conserving biodiversity. Therefore, the growth model developed in this study may serve as a core module for forest management DSSs pertinent to national objectives, including forest disaster management, ecosystem service assessment, and carbon neutrality strategies.

4.2. Sustainable Individual-Level Growth Model Based on NFI

The NFI provides independent datasets that evaluate the simulation outcomes. However, the NFI in South Korea currently lacks a system for tracking individual trees, complicating the identification of the same trees across measurement cycles. Therefore, we established the maximum allowable growth rate and categorized individual trees exhibiting acceptable growth based on existing tree-ring data (Figure 2). This data preprocessing enables the construction of time-series information solely using DBH from the NFI, where height data are provided exclusively for some trees and individual tree ID information is limited [35].
In this study, growth models were developed for P. koraiensis and L. kaempferi, two dominant forest tree species in South Korea, using data from 5469 and 3511 individual trees, respectively, collected from 117 and 171 plots in the 5th to 7th NFI survey cycles. Although the tree species-specific growth model was parameterized using relatively fewer plots than those used in previous NFI studies, it yielded an acceptable and reliable model [56,57]. At this stage, models targeting even-aged and single-species forests were developed. The study was limited to specific tree species because it utilized data exclusively from the 5th to 7th NFIs, which were constructed within the same framework. Species-specific models can be developed despite the limited availability of single-species stands in the NFI; however, their performance remains uncertain. As NFI data continue to accumulate over time, we anticipate the generation of a vast amount of vegetation data for various tree species. Furthermore, by combining a robust approach with a DBH-based distance-independent model, we expect to substantially advance the development of a national-scale growth algorithm applicable to multiple tree species.

4.3. Limitations and Future Studies

In this study, we aimed to present an individual-tree diameter growth model representative of major forest tree species at the national scale (Table 3). The proposed growth model consistently demonstrated high predictive performance, with an R2 value remaining above 0.85 under various thinning intensity conditions (Table 4). In the no-thinning stand, the RMSE showed a gradual increase, while also demonstrating relatively high stand age, tree density, and BA, despite remaining below the BAmax threshold defined in this study. This underrepresentation is partly due to the steep altitudinal gradients and complex topography of South Korea [58], which result in plots dominated by the target species being concentrated within specific altitudinal or latitudinal ranges (Figure 1). Additionally, BAmax may vary for new forest types that were not represented in the current NFI, requiring re-estimation under such conditions [44]. To develop a nationally applicable and generalized individual tree growth equation, long-term NFI data distributed across diverse regions should also be considered. Nevertheless, many of these plots exhibit heterogeneous species composition, and the presence of mixing effects—including interspecific complementarity and competition—may lead to biased estimates of single-species growth and were therefore excluded from the current study. This study utilized only NFI plots where the target species dominated at least 75% to construct a growth algorithm for a single tree species. P. koraiensis and L. kaempferi are major plantation tree species in South Korea, with most stands being artificial forests. The preprocessed NFI plots included some natural forests but were predominantly confirmed as artificial forests. With the future accumulation of long-term NFI data from mixed-species and structurally complex stands, the single-species growth equations developed in this study could be advanced into a national-scale growth modeling framework that explicitly incorporates interspecific interactions, such as competition effects [33]. This expansion would enable simulations of diverse forest types under various climate change and management scenarios, as well as projections of associated changes in ecosystem services.
The maximum allowable growth–based individual-tree ID linkage method applied in this study contributed to understanding forest dynamics using the NFI in South Korea. While some trees may have been excluded due to irregular growth patterns or missing data, refining the ID matching procedure with supplementary field measurements could further improve the accuracy of BA estimation and competition modeling. In the future, AI hybrid models could be used to detect diameter increment outliers, reassess excluded observations, and adjust BA estimates by comparing observed and predicted values, thereby enabling the construction of more precise and reliable time-series growth datasets [59,60]. This effort is also expected to yield time-series growth data for species that are less abundant in the NFI than the target species. We estimated the coefficients of the PG function using a traditional approach, in which potential DBH growth was defined from the mean and standard deviation of dominant and co-dominant trees [40]. Although the Chapman–Richards-type potential–modifier framework remains one of the most widely used and effective structures for individual-tree growth models, the parameterization of potential growth values could be further improved by incorporating more recent techniques, such as percentile-based definitions, quantile regression, or AI techniques. Furthermore, the growth model should be integrated with mortality, harvest, reproduction, and disturbance modules to form a comprehensive forest management DSS. More specifically, incorporating tree mortality from major disturbances such as competition, age-related decline, drought, and wildfires into the model could improve its performance by considering key processes that strongly influence growth dynamics, particularly in the context of climate change.

5. Conclusions

In this study, we developed a distance-independent individual-tree growth model for P. koraiensis and L. kaempferi using the South Korean NFI dataset from the 5th to 7th survey cycles. By applying a growth-limit criterion to match individual trees across measurement periods, we utilized the NFI dataset to parameterize species-specific growth functions, which comprised PG and MOD. The model demonstrated high predictive accuracy (R2 > 0.85) for P. koraiensis and L. kaempferi in both NFI-based and external validation across different thinning intensities, outperforming previously developed growth functions. These findings highlight the potential of integrating systematically collected NFI data with distance-independent modeling approaches to produce reliable, nationally applicable growth algorithms without requiring detailed spatial data.
Despite its strong predictive performance, several limitations remain. The model was primarily developed for even-aged and single-species stands, and stand conditions that are rarely observed in the NFI were not fully captured. As NFI data continues to accumulate, there will be opportunities to expand the framework to incorporate interspecific competition, variable mortality processes, and disturbance regimes. Such advancements will further enhance the robustness, accuracy, and applicability of the model, enabling its use as a core module in national-scale DSS.

Supplementary Materials

The following supporting information can be downloaded at: https://www.mdpi.com/article/10.3390/f16101567/s1, Table S1: Summary statistics of preprocessed individual tree for Pinus koraiensis and Larix kaempferi. Variables include the number of plots, age, tree height, diameter at breast height (DBH), tree density, basal area, site index and crown ratio (mean ± standard deviation). Table S2: Actual forest’s site index for Pinus koraiensis and Larix kaempferi based on dominant height (m) at given stand ages (15–70 years). Values correspond to different site index (SI) classes derived from the 5th and 6th cycles of the South Korea NFI. The dataset is available from the Korea Forest Services’ website (NIFoS, 2023). Table S3: Equations and parameter estimates of site index and crown ratio models for Pinus koraiensis and Larix kaempferi, derived from previous studies. Variables are described in the table, and coefficients (b1–b4) are species-specific. References indicate the original sources of each model [42,43,61].

Author Contributions

Conceptualization, B.H., D.W.K. and W.C.; methodology, B.H., K.L., A.-R.K., D.W.K. and W.C.; investigation, and writing, B.H., S.P., H.K. and W.C.; software, S.P. and H.K.; project administration, writing—review and editing, D.W.K. and W.C.; and funding acquisition, D.W.K. and W.C. All authors have read and agreed to the published version of the manuscript.

Funding

This work was supported by a grant (Project no.: FE0100-2021-01) from the National Institute of Forest Science, Republic of Korea. It was also funded by the ‘R&D Program for Forest Science Technology (Project No. RS-2024-00404816)’ provided by the Korea Forest Service (Korea Forestry Promotion Institute).

Data Availability Statement

The National Forest Inventory (NFI) of South Korea, which was mainly used in this study, is available on the Forest Statistical System (FoSS) website, but it is not available in English. If you wish to access it in English, please use the “knfi” R package. Some of the validation dataset is restricted. Requests to access the datasets should be directed to the corresponding author.

Conflicts of Interest

The authors declare no conflicts of interest.

Abbreviations

The following abbreviations are used in this manuscript:
ADAverage Diameter
BABasal Area
BAmaxMaximum Basal Area
CRCrown Ratio
DBHDiameter at Breast Height
MODModifier Function
NFINational Forest Inventory
PGPotential Growth
SISite Index

References

  1. Lämås, T.; Sängstuvall, L.; Öhman, K.; Lundström, J.; Årevall, J.; Holmström, H.; Nilsson, L.; Nordström, E.-M.; Wikberg, P.-E.; Wikström, P.; et al. The Multi-Faceted Swedish Heureka Forest Decision Support System: Context, Functionality, Design, and 10 Years Experiences of Its Use. Front. For. Glob. Change 2023, 6, 1163105. [Google Scholar] [CrossRef]
  2. Nguyen, D.; Henderson, E.; Wei, Y. PRISM: A Decision Support System for Forest Planning. Environ. Model. Softw. 2022, 157, 105515. [Google Scholar] [CrossRef]
  3. Söderbergh, I.; Ledermann, T. Algorithms for Simulating Thinning and Harvesting in Five European Individual-Tree Growth Simulators: A Review. Comput. Electron. Agric. 2003, 39, 115–140. [Google Scholar] [CrossRef]
  4. Crookston, N.L.; Dixon, G.E. The Forest Vegetation Simulator: A Review of Its Structure, Content, and Applications. Comput. Electron. Agric. 2005, 49, 60–80. [Google Scholar] [CrossRef]
  5. Thrippleton, T.; Temperli, C.; Krumm, F.; Mey, R.; Zell, J.; Stroheker, S.; Gossner, M.M.; Bebi, P.; Thürig, E.; Schweier, J. Balancing Disturbance Risk and Ecosystem Service Provisioning in Swiss Mountain Forests: An Increasing Challenge under Climate Change. Reg. Environ. Chang. 2023, 23, 29. [Google Scholar] [CrossRef]
  6. Mutterer, S.; Schweier, J.; Bont, L.G.; Pezzatti, G.B.; Conedera, M.; Temperli, C.; Griess, V.C.; Blattert, C. Integrating Fire Predisposition Assessment into Decision Support Systems for Mountain Forest Management. MethodsX 2025, 14, 103332. [Google Scholar] [CrossRef]
  7. Seidl, R.; Rammer, W. Climate Change Amplifies the Interactions between Wind and Bark Beetle Disturbances in Forest Landscapes. Landsc. Ecol. 2017, 32, 1485–1498. [Google Scholar] [CrossRef] [PubMed]
  8. Twery, M.J.; Knopp, P.D.; Thomasma, S.A.; Rauscher, H.M.; Nute, D.E.; Potter, W.D.; Maier, F.; Wang, J.; Dass, M.; Uchiyama, H.; et al. NED-2: A Decision Support System for Integrated Forest Ecosystem Management. Comput. Electron. Agric. 2005, 49, 24–43. [Google Scholar] [CrossRef]
  9. Weiskittel, A.R.; Hann, D.W.; Kershaw, J.A., Jr.; Vanclay, J.K. Forest Growth and Yield Modeling; John Wiley & Sons: Hoboken, NJ, USA, 2011. [Google Scholar] [CrossRef]
  10. Pretzsch, H.; Grote, R.; Reineking, B.; Rötzer, T.; Seifert, S. Models for Forest Ecosystem Management: A European Perspective. Ann. Bot. 2008, 101, 1065–1087. [Google Scholar] [CrossRef]
  11. Pretzsch, H.; Forrester, D.I.; Rötzer, T. Representation of Species Mixing in Forest Growth Models: A Review and Perspective. Ecol. Model. 2015, 313, 276–292. [Google Scholar] [CrossRef]
  12. Boukhris, I.; Marano, G.; Dalmonech, D.; Valentini, R.; Collalti, A. Modeling Forest Growth under Current and Future Climate. Curr. For. Rep. 2025, 11, 17–36. [Google Scholar] [CrossRef]
  13. Henttonen, H.M.; Nöjd, P.; Mäkinen, H. Environment-Induced Growth Changes in Forests of Finland Revisited—A Follow-Up Using an Extended Data Set from the 1960s to the 2020s. For. Ecol. Manag. 2024, 551, 121515. [Google Scholar] [CrossRef]
  14. Lu, J. Individual Tree Diameter Growth Modelling for Natural Secondary Forest in Changbai Mountains, Northeast China. Sci. Rep. 2024, 14, 18695. [Google Scholar] [CrossRef]
  15. Zhang, Z.; Papaik, M.J.; Wang, X.; Hao, Z.; Ye, J.; Lin, F.; Yuan, Z. The Effect of Tree Size, Neighborhood Competition and Environment on Tree Growth in an Old-Growth Temperate Forest. J. Plant Ecol. 2017, 10, 970–980. [Google Scholar] [CrossRef]
  16. Ma, P.; Han, X.H.; Lin, Y.; Moore, J.; Guo, Y.X.; Yue, M. Exploring the Relative Importance of Biotic and Abiotic Factors That Alter the Self-Thinning Rule: Insights from Individual-Based Modelling and Machine-Learning. Ecol. Model. 2019, 397, 16–24. [Google Scholar] [CrossRef]
  17. Pacala, S.W.; Canham, C.D.; Saponara, J.; Silander, J.A., Jr.; Kobe, R.K.; Ribbens, E. Forest Models Defined by Field Measurements: Estimation, Error Analysis and Dynamics. Ecol. Monogr. 1996, 66, 1–43. [Google Scholar] [CrossRef]
  18. Pretzsch, H.; Biber, P.; Ďurský, J. The Single Tree-Based Stand Simulator SILVA: Construction, Application and Evaluation. For. Ecol. Manag. 2002, 162, 3–21. [Google Scholar] [CrossRef]
  19. Seidl, R.; Rammer, W.; Scheller, R.M.; Spies, T.A. An Individual-Based Process Model to Simulate Landscape-Scale Forest Ecosystem Dynamics. Ecol. Model. 2012, 231, 87–100. [Google Scholar] [CrossRef]
  20. Landsberg, J.J.; Waring, R.H. A Generalised Model of Forest Productivity Using Simplified Concepts of Radiation-Use Efficiency, Carbon Balance and Partitioning. For. Ecol. Manag. 1997, 95, 209–228. [Google Scholar] [CrossRef]
  21. Hansen, M.C.; Potapov, P.V.; Moore, R.; Hancher, M.; Turubanova, S.A.; Tyukavina, A.; Thau, D.; Stehman, S.V.; Goetz, S.J.; Loveland, T.R.; et al. High-Resolution Global Maps of 21st-Century Forest Cover Change. Science 2013, 342, 850–853. [Google Scholar] [CrossRef]
  22. Hoover, C.M.; Bush, R.; Palmer, M.; Treasure, E. Using Forest Inventory and Analysis Data to Support National Forest Management: Regional Case Studies. J. For. 2020, 118, 313–323. [Google Scholar] [CrossRef]
  23. Shannon, E.S.; Finley, A.O.; Domke, G.M.; May, P.B.; Andersen, H.-E.; Gaines, G.C., III; Banerjee, S. Toward Spatio-Temporal Models to Support National-Scale Forest Carbon Monitoring and Reporting. Environ. Res. Lett. 2024, 20, 014052. [Google Scholar] [CrossRef]
  24. Combaud, M.; Cordonnier, T.; Dupire, S.; Vallet, P. Climate Change Altered the Dynamics of Stand Dominant Height in Forests during the Past Century—Analysis of 20 European Tree Species. For. Ecol. Manag. 2024, 553, 121601. [Google Scholar] [CrossRef]
  25. McRoberts, R.E.; Winter, S.; Chirici, G.; LaPoint, E. Assessing Forest Naturalness. For. Sci. 2012, 58, 294–309. [Google Scholar] [CrossRef]
  26. Domke, G.M.; Walters, B.F.; Giebink, C.L.; Greenfield, E.J.; Smith, J.E.; Nichols, M.C.; Knott, J.A.; Ogle, S.M.; Coulston, J.W.; Steller, J. Greenhouse Gas Emissions and Removals from Forest Land, Woodlands, Urban Trees, and Harvested Wood Products in the United States, 1990–2021; Resource Bulletin WO-101; U.S. Department of Agriculture, Forest Service, Washington Office: Washington, DC, USA, 2023. [CrossRef]
  27. Breidenbach, J.; Astrup, R. Small Area Estimation of Forest Attributes in the Norwegian National Forest Inventory. Eur. J. For. Res. 2012, 131, 1255–1267. [Google Scholar] [CrossRef]
  28. Borghi, C.; Francini, S.; McRoberts, R.E.; Parisi, F.; Lombardi, F.; Nocentini, S.; Maltoni, A.; Travaglini, D.; Chirici, G. Country-Wide Assessment of Biodiversity, Naturalness and Old-Growth Status Using National Forest Inventory Data. Eur. J. For. Res. 2024, 143, 271–303. [Google Scholar] [CrossRef]
  29. Ryu, D.; Park, M.; Park, J.; Moon, M.; Yim, J.; Kim, H.S. Quantification of Tree Growth Change under Climate Change Using National Forest Inventory of Korea. For. Ecol. Manag. 2024, 568, 122112. [Google Scholar] [CrossRef]
  30. Kim, M.; Kraxner, F.; Son, Y.; Jeon, S.W.; Shvidenko, A.; Schepaschenko, D.; Ham, B.-Y.; Lim, C.-H.; Song, C.; Hong, M.; et al. Quantifying Impacts of National-Scale Afforestation on Carbon Budgets in South Korea from 1961 to 2014. Forests 2019, 10, 579. [Google Scholar] [CrossRef]
  31. Hong, M.; Song, C.; Kim, M.; Kraxner, F.; Ko, Y.; Son, J.; Lee, W.-K. Realizing Climate Resilient Development Pathways in Forestry: A Focus on Carbon Management in Republic of Korea. Environ. Impact Assess. Rev. 2025, 110, 107665. [Google Scholar] [CrossRef]
  32. Shin, J.; Chang, Y.; Lee, K.; Kim, D.; Han, H. Sample Selection Bias Due to Omitting Short Trees for Tree Height Estimation in Forest Inventories: A Case Study on Pinus koraiensis Plantations in South Korea. PLoS ONE 2025, 20, e0321160. [Google Scholar] [CrossRef]
  33. Wykoff, W.R. A basal area increment model for individual conifers in the northern Rocky Mountains. For. Sci. 1990, 36, 1077–1104. [Google Scholar] [CrossRef]
  34. Korea Forest Service. Statistical Yearbook of Forestry 2024; Korea Forest Service: Daejeon, Republic of Korea, 2023. Available online: https://kfss.forest.go.kr/ (accessed on 1 October 2024).
  35. Ryu, D. Estimation of Growth and Mortality Rate of Major 6 Tree Species Using NFI 5–7th. Ph.D. Thesis, Seoul National University, Seoul, Republic of Korea, 2022. [Google Scholar]
  36. Bragg, D.C. Potential Relative Increment (PRI): A New Method to Empirically Derive Optimal Tree Diameter Growth. Ecol. Model. 2001, 137, 77–92. [Google Scholar] [CrossRef]
  37. Härkönen, S.; Mäkinen, A.; Tokola, T.; Rasinmäki, J.; Kalliovirta, J. Evaluation of Forest Growth Simulators with NFI Permanent Sample Plot Data from Finland. For. Ecol. Manag. 2010, 259, 573–582. [Google Scholar] [CrossRef]
  38. Padfield, D.; Matheson, G.; Windram, F. nls.multstart: Robust Non-Linear Regression Using AIC Scores, R Package, version 2.0.0; R Foundation for Statistical Computing: Vienna, Austria, 2025; Available online: https://CRAN.R-project.org/package=nls.multstart (accessed on 1 January 2025).
  39. Monserud, R.A.; Sterba, H. A Basal Area Increment Model for Individual Trees Growing in Even- and Uneven-Aged Forest Stands in Austria. For. Ecol. Manag. 1996, 80, 57–80. [Google Scholar] [CrossRef]
  40. Hahn, J.T.; Leary, R.A. Potential Diameter Growth Functions; USDA Forest Service; General Technical Report NC-49; U.S. Department of Agriculture, Forest Service, North Central Forest Experiment Station: St. Paul, MN, USA, 1979.
  41. Leary, R.A.; Holdaway, M.R. Modifier Function. In A Generalized Forest Growth Projection System Applied to the Lake States Region; General Technical Report NC-49; USDA Forest Service: St. Paul, MN, USA, 1979. [Google Scholar]
  42. National Institute of Forest Science (NIFoS). 2023 Tree Volume, Biomass, and Stand Yield Table (Research Report No. 1092); National Institute of Forest Science: Seoul, Republic of Korea, 2023. [Google Scholar]
  43. Kwon, S.D.; Lee, K.H.; Kim, H.H.; Chung, J.S. Development of Individual-Tree/Distance-Independent Growth-and-Mortality Prediction Equations for Pinus koraiensis Stands. J. Korean For. Soc. 2003, 92, 590–597. [Google Scholar]
  44. Sterba, H. Estimating Potential Density from Thinning Experiments and Inventory Data. For. Sci. 1987, 33, 1022–1034. [Google Scholar] [CrossRef]
  45. Kim, M.; Lee, W.-K.; Choi, G.-M.; Song, C.; Lim, C.-H.; Moon, J.; Piao, D.; Kraxner, F.; Shvidenko, A.; Forsell, N. Modeling Stand-Level Mortality Based on Maximum Stem Number and Seasonal Temperature. For. Ecol. Manag. 2017, 386, 37–50. [Google Scholar] [CrossRef]
  46. Lee, K.; Yun, S.J.; Kim, M.; Yang, H.M.; Kim, A.R. The Effect of Thinning on Trade-Offs in Ecosystem Services: The Case Study of a Korean Pine Plantation on Mt. Gari. J. Ecol. Environ. 2024, 48, 137–143. [Google Scholar] [CrossRef]
  47. R Core Team. R: A Language and Environment for Statistical Computing; R Foundation for Statistical Computing: Vienna, Austria, 2024; Available online: https://www.R-project.org/ (accessed on 1 October 2024).
  48. Kwon, S.D.; Chung, J.S. Development of Individual-Tree Distance-Independent Simulation Model for Growth Prediction of Pinus koraiensis Stands. J. Korean For. Soc. 2004, 93, 43–49. [Google Scholar]
  49. Kim, S.; Seol, A.; Chung, J. Development of Diameter Growth and Mortality Prediction Models of Pinus koraiensis Based on Periodic Annual Increment. J. Korean Soc. For. Sci. 2011, 100, 1–7. [Google Scholar] [CrossRef]
  50. Kwon, K.; Han, H.; Seol, A.; Chung, H.; Chung, J. Analyzing Thinning Effects on Growth and Carbon Absorption for Cryptomeria japonica Stands Using Distance-Independent Growth Simulations. J. Korean Soc. For. Sci. 2016, 105, 132–138. [Google Scholar] [CrossRef]
  51. Craine, J.M.; Fargione, J.; Sugita, S. Supply Pre-Emption, Not Concentration Reduction, Is the Mechanism of Competition for Nutrients. New Phytol. 2005, 166, 933–940. [Google Scholar] [CrossRef] [PubMed]
  52. Hong, M.; Song, C.; Kim, M.; Kim, J.; Roh, M.; Ko, Y.; Cho, K.; Son, Y.; Jeon, S.; Kraxner, F.; et al. Modeling-Based Risks Assessment and Management of Climate Change in South Korean Forests. Forests 2023, 14, 745. [Google Scholar] [CrossRef]
  53. Lee, S.-J.; Lee, Y.-J.; Ryu, J.-Y.; Kwon, C.-G.; Seo, K.-W.; Kim, S.-Y. Prediction of Wildfire Fuel Load for Pinus densiflora Stands in South Korea Based on the Forest-Growth Model. Forests 2022, 13, 1372. [Google Scholar] [CrossRef]
  54. Ager, A.A.; Barros, A.M.G.; Houtman, R.; Seli, R.; Day, M.A. Modelling the Effect of Accelerated Forest Management on Long-Term Wildfire Activity. Ecol. Model. 2020, 421, 108962. [Google Scholar] [CrossRef]
  55. Dhakal, A.S.; Sidle, R.C. Long-Term Modelling of Landslides for Different Forest Management Practices. Earth Surf. Process. Landf. 2003, 28, 853–868. [Google Scholar] [CrossRef]
  56. McCullagh, A.; Black, K.; Nieuwenhuis, M. Evaluation of Tree and Stand-Level Growth Models Using National Forest Inventory Data. Eur. J. For. Res. 2017, 136, 251–258. [Google Scholar] [CrossRef]
  57. Mehtätalo, L.; Räty, M.; Mehtätalo, J. A New Growth Curve and Fit to the National Forest Inventory Data of Finland. Ecol. Model. 2025, 501, 111006. [Google Scholar] [CrossRef]
  58. Cho, Y.C.; Seol, J.; Lim, C.H. Climate-Induced Distribution Dynamics and Niche Adaptation of South Korean Endemic Plants across the Korean Peninsula. Sci. Rep. 2024, 14, 22253. [Google Scholar] [CrossRef]
  59. Jevšenak, J.; Skudnik, M. A Random Forest Model for Basal Area Increment Predictions from National Forest Inventory Data. For. Ecol. Manag. 2021, 479, 118601. [Google Scholar] [CrossRef]
  60. Leite e Lopes, I.; Sousa da Mata, A.; Oliveira Castro, R.V.; Viana da Páscoa, K.J.; Souza Jarochinski e Silva, C.; Rezende Gomide, L. Applying Complex Network Metrics to Individual-Tree Diameter Growth Modeling. iForest 2025, 18, 176–182. [Google Scholar] [CrossRef]
  61. Kwon, S. Development of a simulation model for stand-level forest management. Ph.D. Thesis, Seoul National University Graduate School, Seoul, Republic of Korea, 2003. [Google Scholar]
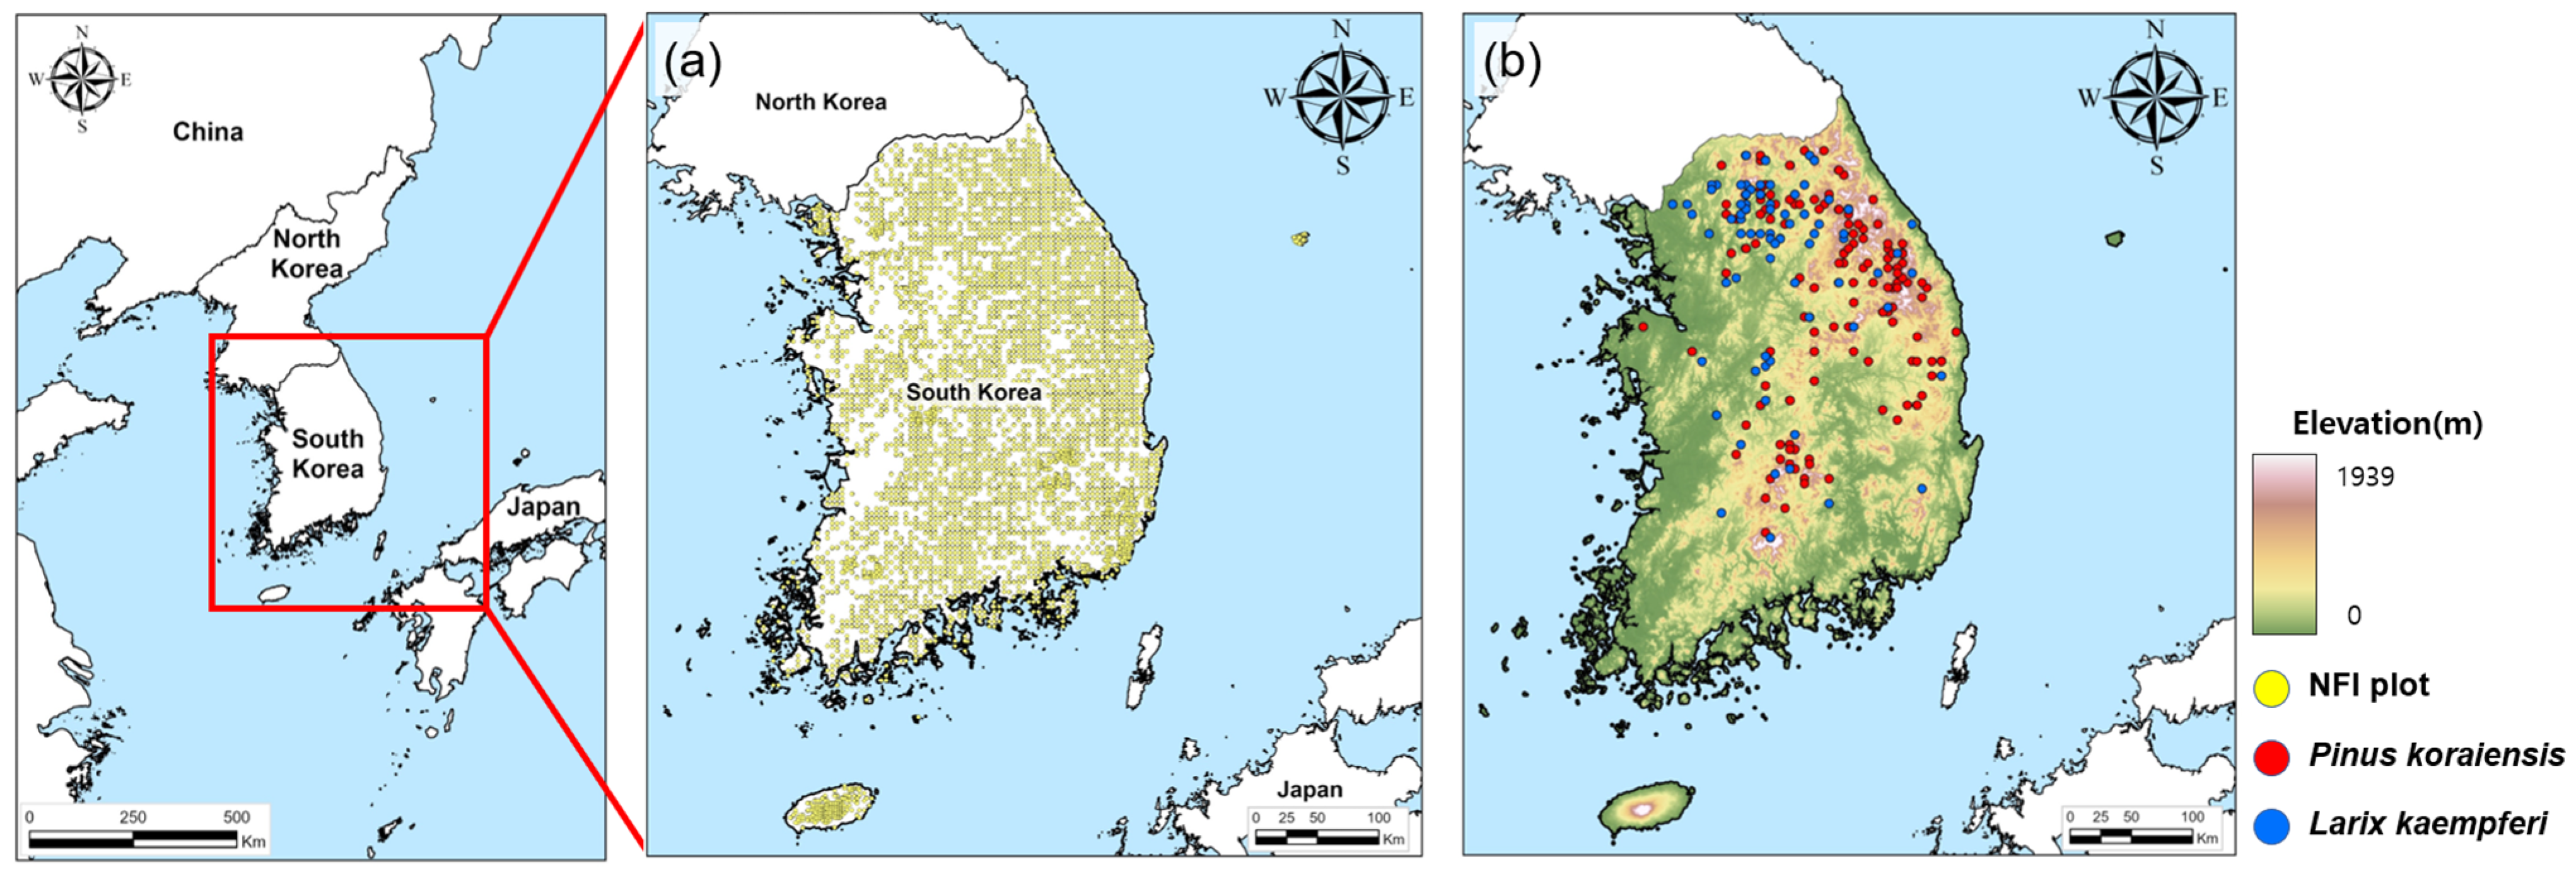
Figure 1. Location of study area and distribution of National Forest Inventory (NFI) plots. (a) NFI permanent plots across South Korea; (b) Distribution of sample plots for Pinus koraiensis (red) and Larix kaempferi (blue) superimposed on the elevation map.
Forests 16 01567 g001
Figure 2. Estimation of the maximum allowable growth rate (red line) for (a) Pinus koraiensis and (b) Larix kaempferi based on five years of growth and diameter at breast height (DBH) data. Light blue dots represent DBH growth derived from the 5th NFI tree-ring data, while dark blue dots indicate the second-largest value within each 1 cm DBH class. The red line represents the fitted Gaussian function used to approximate the maximum allowable DBH growth following [35].
Forests 16 01567 g002
Figure 3. Estimation of five-year diameter at breast height (DBH) growth for (a) Pinus Koraiensis (crown ratio = 13, site index = 0.52, average diameter = 23) and (b) Larix Kaempferi (crown ratio = 19, site index = 0.34, average diameter = 24) stands. Crown ratio, site index, and average diameter were calculated using the average values for each species extracted by the “knfi” R package.
Forests 16 01567 g003
Figure 4. (a) Potential diameter growth (cm·yr−1) for P. koraiensis as a function of DBH (cm) under different site index (SI) and crown ratio (CR) conditions, and (b) growth modifier in relation to basal area (m2·ha−1) across varying relative diameter (R = DBH/AD) and average diameter (AD) values.
Forests 16 01567 g004
Figure 5. (a) Potential diameter growth (cm·yr−1) for L. kaempferi as a function of DBH (cm) under different site index (SI) and crown ratio (CR) conditions, and (b) growth modifier in relation to basal area (m2·ha−1) across varying relative diameter (R) and average diameter (AD) values.
Forests 16 01567 g005
Figure 6. Comparison between predicted (orange) and observed (blue) diameter at breast height (DBH) values from 2006 to 2051 across three thinning treatments in the Mt. Garisan experimental forest. Each boxplot illustrates five-year intervals of DBH simulation across different thinning intensities: (a) light thinning, (b) intensive thinning, and (c) no thinning.
Forests 16 01567 g006
Table 1. Summary statistics of vegetation data for Pinus koraiensis and Larix kaempferi plots in the 5th, 6th, and 7th NFI survey cycles. Variables include the number of plots, age, tree height, diameter at breast height (DBH), tree density, and tree growing stocks (mean ± standard deviation).
CategoryPinus koraiensisLarix kaempferi
5th6th7th5th6th7th
Number of plots171165158249230207
Age29.40 ± 9.6833.40 ± 10.5037.60 ± 10.8030.80 ± 10.5035.60 ± 10.4039.60 ± 11.60
Height (m)12.15 ± 3.5814.23 ± 3.2315.74 ± 3.3717.47 ± 4.3520.12 ± 4.2421.96 ± 4.19
Diameter at breast height (cm)20.77 ± 7.4423.72 ± 7.4725.95 ± 7.6922.16 ± 6.7724.56 ± 6.8126.34 ± 7.08
Tree density
(trees/ha)
713.96 ± 473.55606.00 ± 434.55566.47 ± 396.40602.41 ± 355.03534.59 ± 334.59468.35 ± 283.40
Tree growing stocks (m3/ha)130.89 ± 78.85166.21 ± 91.04204.68 ± 96.53181.34 ± 91.79220.16 ± 104.79241.73 ± 117.88
Table 2. Summary statistics for Pinus koraiensis stands at the Mt. Garisan site used for external model validation across different thinning intensities. Variables include tree density (trees/ha), diameter at breast height (DBH, cm), and basal area (m2/ha). Values for “Before thinning” and “After thinning” are based on 2006 and 2011 survey data, respectively.
Management TypeArea
(ha)
Age in 2006
(year)
Tree Density
(trees/ha)
Average DBH
(cm)
Basal Area
(m2/ha)
Before
Thinning
After
Thinning
Before
Thinning
After
Thinning
Before
Thinning
After
Thinning
Light thinning13.946937.5525.024.5 ± 0.728.7 ± 0.946.935.5
Intensive thinning14.946737.5275.025.7 ± 0.831.4 ± 1.640.222.4
No thinning3.946975.0975.020.3 ± 0.721.5 ± 0.833.437.6
Table 3. Coefficients and model performance metrics (R2, RMSE) for the potential growth and modifier function using the distance-independent model for Pinus koraiensis and Larix kaempferi in South Korea.
SpeciesFunctionParameter EstimatesR2RMSE
b1b2b3b4b5b6BAmax
Pinus koraiensisCrown
Ratio
0.17330.03120.44140.1864----0.981.15
Potential Growth2.57400.00000113.98100.053780.4870--0.16
Modifier0.3723−9.377037,6000.47030.79390.189657.910.98
Larix kaempferiCrown
Ratio
0.06300.00910.75400.0198----0.981.14
Potential Growth3.73890.00098312.22580.03760.5526--0.13
Modifier0.5497−4.4901406.710.35970.67270.294965.010.98
Table 4. Model validation statistics (R2, RMSE, and Bias) comparing predicted and observed DBH under different thinning intensities (light thinning, intensive thinning, and no thinning) in Mt. Garisan for 2011, 2016, and 2021.
ManagementR2RMSEBias
201120162021201120162021201120162021
Light thinning0.970.940.900.871.381.86−0.35−0.68−0.80
Intensive thinning0.980.930.900.821.481.80−0.420.250.24
No thinning0.980.890.860.922.292.81−0.77−1.81−2.40
Disclaimer/Publisher’s Note: The statements, opinions and data contained in all publications are solely those of the individual author(s) and contributor(s) and not of MDPI and/or the editor(s). MDPI and/or the editor(s) disclaim responsibility for any injury to people or property resulting from any ideas, methods, instructions or products referred to in the content.