Article

Precision Carbon Stock Estimation in Urban Campuses Using Fused Backpack and UAV LiDAR Data

1
School of Resources and Environmental Engineering, Anhui University, Hefei 230601, China
2
School of Geographic Information and Tourism, Chuzhou University, Chuzhou 239000, China
3
Anhui Province Key Laboratory of Physical Geographic Environment, Chuzhou 239000, China
4
School of Civil and Architectural Engineering, Chuzhou University, Chuzhou 239000, China
*
Author to whom correspondence should be addressed.
These authors contributed equally to this work.
Forests 2025, 16(10), 1550; https://doi.org/10.3390/f16101550
Submission received: 17 September 2025 / Revised: 3 October 2025 / Accepted: 7 October 2025 / Published: 8 October 2025
(This article belongs to the Special Issue Urban Forests and Greening for Sustainable Cities)

Abstract

Accurate quantification of campus vegetation carbon stocks is essential for advancing carbon neutrality goals and refining urban carbon management strategies. This study pioneers the integration of drone and backpack LiDAR data to overcome limitations in conventional carbon estimation approaches. The Comparative Shortest-Path (CSP) algorithm was originally developed to segment tree crowns from point cloud data, with its design informed by metabolic ecology theory—specifically, that vascular plants tend to minimize the transport distance to their roots. In this study, we deployed the Comparative Shortest-Path (CSP) algorithm for individual tree recognition across 897 campus trees, achieving 88.52% recall, 72.45% precision, and 79.68% F-score—with 100% accuracy for eight dominant species. Diameter at breast height (DBH) was extracted via least-squares circle fitting, attaining >95% accuracy for key species such as Magnolia grandiflora and Triadica sebifera. Carbon storage was calculated through species-specific allometric models integrated with field inventory data, revealing a total stock of 163,601 kg (mean 182.4 kg/tree). Four dominant species—Cinnamomum camphora, Liriodendron chinense, Salix babylonica, and Metasequoia glyptostroboides—collectively contributed 84.3% of total storage. As the first integrated application of multi-platform LiDAR for campus-scale carbon mapping, this work establishes a replicable framework for precision urban carbon sink assessment, supporting data-driven campus greening strategies and climate action planning.

1. Introduction

Against the backdrop of escalating global climate change, carbon peak and carbon neutrality have emerged as common strategic goals for the international community. Accurate estimation of terrestrial ecosystem carbon storage is pivotal to achieving these targets [1]. The IPCC Sixth Assessment Report emphasizes that vegetation carbon pool—critical carbon sinks in terrestrial ecosystems—directly influences global carbon cycle dynamics. Their precise quantification is indispensable for formulating evidence-based emission reduction strategies and evaluating ecosystem services [2]. Urban campus green spaces, integrating natural attributes with anthropogenic functions, present unique challenges for carbon stock assessment. Compared to natural ecosystems, they exhibit diverse vegetation types, complex spatial patterns, and frequent human disturbances [3]. Nevertheless, as micro-observatories of urban carbon cycles, campus carbon sink data provide essential support for refining urban carbon inventories and guiding low-carbon campus planning [4]. This aligns with growing recognition of educational institutions’ role in sustainable urbanization, as demonstrated by studies on campus sustainability transitions [5].
Conventional approaches face limitations in complex campus environments. The quadrat method—a ground-survey technique—estimates carbon storage by measuring plot-level biomass and converting it to carbon equivalents. However, it is labor-intensive, destructive, and spatially restricted in built-up campuses with high pedestrian flow, leading to inadequate spatial representativeness [6]. Optical remote sensing (e.g., satellite/UAV RGB imagery) enables large-scale monitoring but fails to accurately capture three-dimensional vegetation structural parameters (e.g., tree height, diameter at breast height) due to canopy occlusion and illumination constraints [7,8,9]. These parameters are critical for robust carbon stock estimation [10].
Light Detection and Ranging (LiDAR) technology offers a revolutionary solution. By emitting laser pulses and analyzing returned signals, LiDAR directly acquires 3D point clouds of Earth’s surface [11,12,13], enabling precise extraction of vertical vegetation structures (e.g., height, canopy architecture). This capability overcomes key limitations of optical remote sensing and has been widely validated for individual tree parameter retrieval [14,15,16,17]. Zhang et al. (2023) estimated the Diameter at breast height (DBH) of Cunninghamia lanceolata and Eucalyptus robusta based on airborne LiDAR data, with the highest R2 reaching 0.90 [18]. Li et al. (2025) conducted DBH estimation for Cinnamomum camphora, Koelreuteria integrifolia, Carya cathayensis, and Quercus acutissima using backpack LiDAR data, and the maximum R2 achieved was 0.975 [13]. Liu et al. (2018) carried out DBH estimation for Larix gmelinii, Betula platyphylla and Quercus mongolica based on terrestrial LiDAR data, with the highest R2 being 0.976 [19]. Ali et al. (2025) estimated the tree height of Picea crassifolia using UAV-LiDAR data, yielding an R2 of 0.91 [20]. Fan et al. (2020) performed tree height estimation for Sophora japonica based on terrestrial LiDAR data, with an R2 of 0.92 [21]. Zheng et al. (2016) estimated the leaf area index (LAI) using airborne LiDAR data, achieving an accuracy of 71.35% [22]. Wang et al. (2023) conducted LAI estimation based on spaceborne, airborne, and terrestrial LiDAR data, with the highest R2 reaching 0.97 [23]. Brede et al. (2019) estimated the tree volume of Fagus sylvatica, Quercus robur, Picea abies, Abies grandis and Pseudotsuga menziesiu using UAV LiDAR data, and the concordance correlation coefficient could reach 0.85 [24]. Ali et al. (2024) estimated tree volume based on terrestrial LiDAR data, with the highest R2 reaching 0.98 [25].
Synergistic integration of UAV and backpack LiDAR can overcome site-specific limitations: UAV-LiDAR captures upper canopy structures, while backpack systems map understory vegetation. Fusing these datasets enables holistic 3D characterization of complex campuses. Therefore, this study targets Chuzhou University campus to: (1) fuse backpack- and UAV-LiDAR data for complete vegetation structural mapping, (2) apply the Comparative Shortest-Path (CSP) algorithm for individual tree detection and species identification, and (3) quantify campus arbor carbon stocks using ground-validated models. This approach provides a scalable framework for carbon stock assessment in urban micro-ecosystems, supporting SDG 11 (Sustainable Cities).

2. Materials and Methods

2.1. Study Area

The research was conducted in the East Area of Huifeng Campus, Chuzhou University, situated in Langya District, Chuzhou City, Anhui Province, China (Figure 1). It spans the longitude range of 118°17′00″ E to 118°18′00″ E and the latitude range of 32°17′00″ N to 32°18′00″ N, covering an area of approximately 31.6 hm2 with an average elevation of 30 m. The study area is situated in a humid monsoon climate zone with a transitional climate property from the northern subtropical to the warm temperate zone. The multi-year average precipitation in this region reaches 1000 mm, and the annual mean temperature is 15.2 °C. The campus green space within the study area exhibits notable vegetation diversity, encompassing a rich assemblage of arbor species with varying ecological traits, including both evergreen and deciduous broad-leaved trees, as well as coniferous species. This complex vegetation composition, shaped by long-term campus greening initiatives, makes it a representative urban micro-ecosystem for investigating carbon storage dynamics. This campus was selected primarily for its 23 arbor species (high diversity)—a feature that allows the adaptability of the proposed method to mixed urban vegetation to be tested—and its accessibility, which simplifies field surveys and repeated data acquisition.

2.2. Datasets

2.2.1. Lidar Data Acquisition

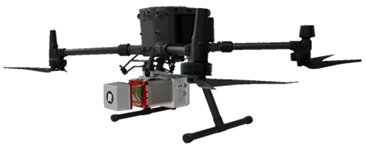
The LiDAR data utilized in this study encompasses both UAV and terrestrial-sourced data, which were acquired in January 2023. The UAV point cloud data were captured using a M300 UAV (Shenzhen DJI Technology Co., Ltd., Shenzhen, China) equipped with a LiAir 250 sensor (Beijing Digital Green Soil Technology Co., Ltd., Beijing, China). The flight altitude was set at 100 m, with a flight line spacing of 30 m and an airspeed of 7 m/s. The forward overlap and side overlap were configured to be 90% and 70%, respectively, resulting in an average point cloud density of 220–300 points/m2. The terrestrial point cloud data were obtained through a Li-Backpack DGC50 laser scanner (Beijing Digital Green Soil Technology Co., Ltd., Beijing, China), with an average point cloud density ranging from 2000 to 100,000 points/m2. The parameters of the LiDAR equipment are detailed in Table 1.

2.2.2. Field Survey

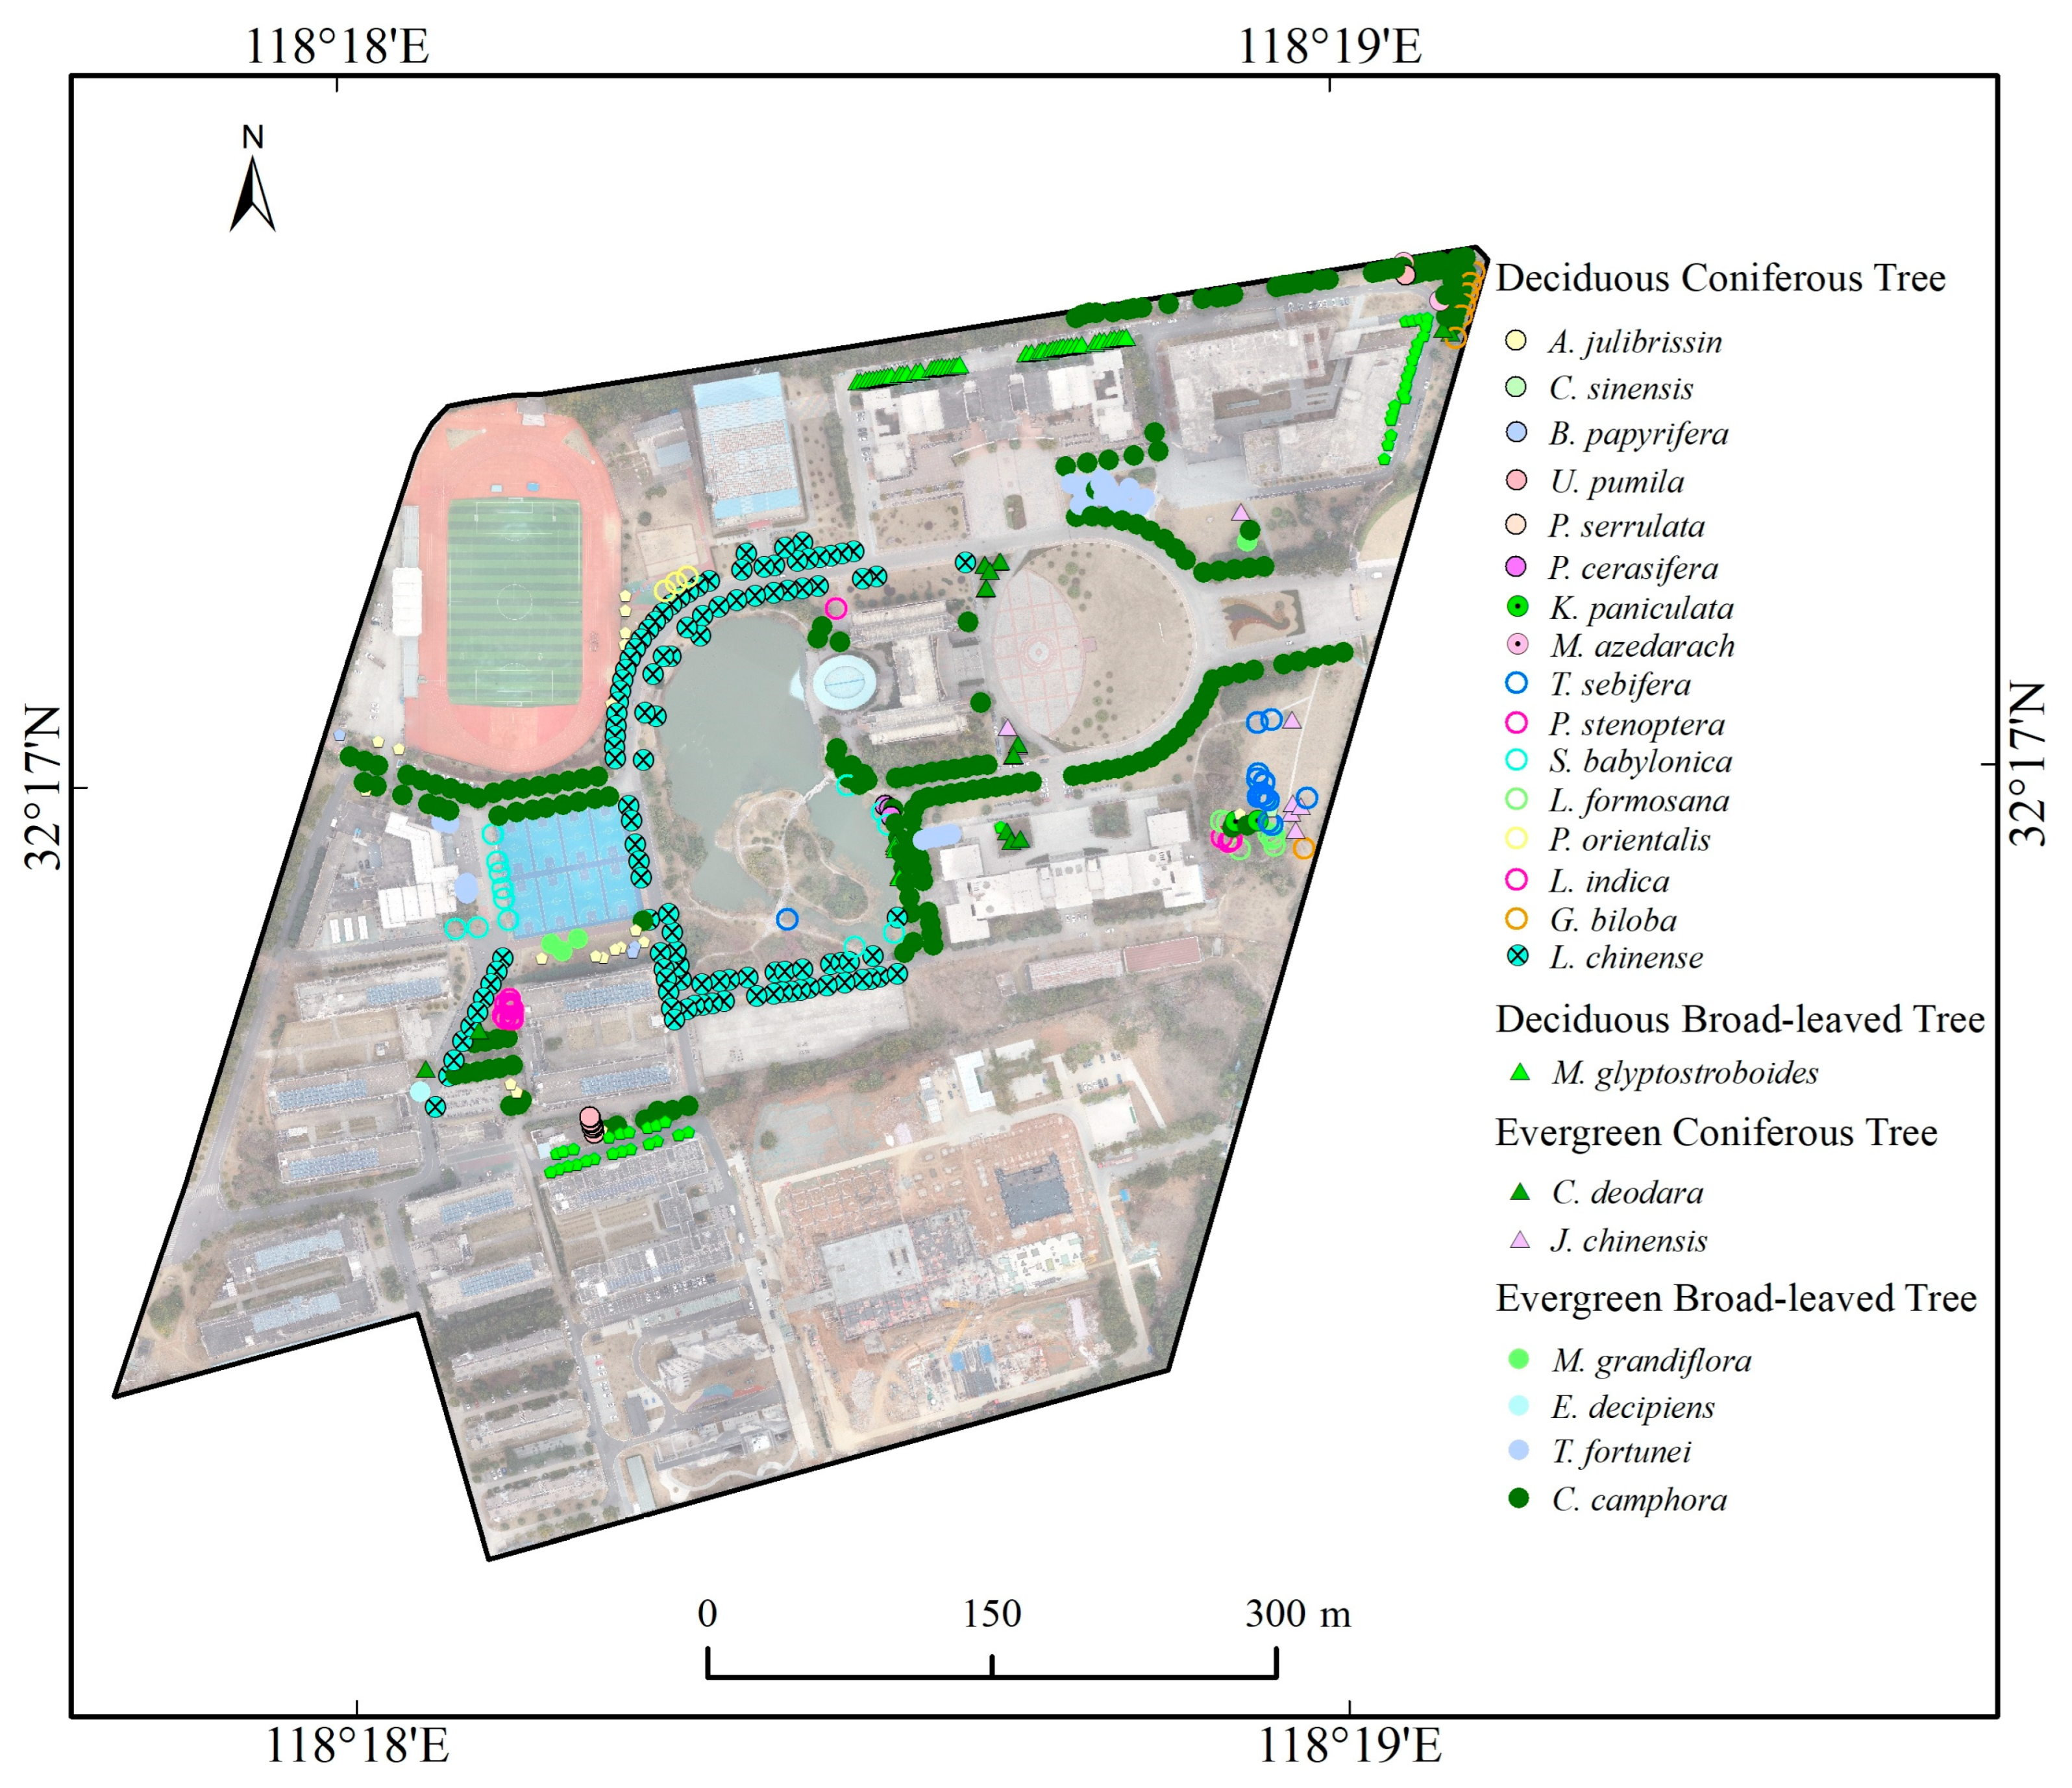
In January 2023, a campus tree inventory was conducted, and information such as tree species, DBH, and the positions of individual trees was collected. The DBH was measured with a DBH tape at 1.3 m above the ground. This survey involved a total of 573 trees belonging to 23 species, and the specific details of each species are presented in Table 2. The coordinate data were recorded by vertically placing a Polar Mini Mobile RTK (Guangzhou South Surveying & Mapping Technology Co., Ltd., Guangzhou, China) adjacent to the tree trunk, and the specific positions of the vegetation are illustrated in Figure 2. The DBH tape has a measurement precision of ±0.1 cm, ensuring accurate recording of trunk diameter variations. The RTK device provides horizontal positioning accuracy of ±2 cm and vertical accuracy of ±3 cm, guaranteeing a reliable geospatial reference for subsequent LiDAR data validation. For tree height, since the study area is characterized by complex vegetation-building mixing, tree heights were derived from the UAV-based Canopy Height Model (CHM) established in Section 2.3.1. This approach ensures accurate height acquisition for trees with dense crowns or those adjacent to buildings, avoiding measurement errors caused by manual tools (e.g., clinometers) in limited spaces.

2.3. Methods

2.3.1. Preprocessing

Preprocessing, such as registration and denoising, was performed on the point cloud data. For the UAV and terrestrial point cloud data, coarse registration was conducted first, followed by fine registration and fusion [26]. Fixed ground objects such as buildings and steps were selected as control points (with a minimum of 3 points) for coarse registration. For fine registration, the Iterative Closest Point (ICP) algorithm was employed. This algorithm gradually optimizes the spatial transformation (rotation and translation) between the two point clouds through iteration, minimizing the distance between corresponding points of the two point clouds, and ultimately achieving high-precision registration [27]. In this study, the maximum number of iterations was set to 500, the maximum point search range was set to 1 m, and the convergence tolerance was set to 1 × 10⁻⁵.
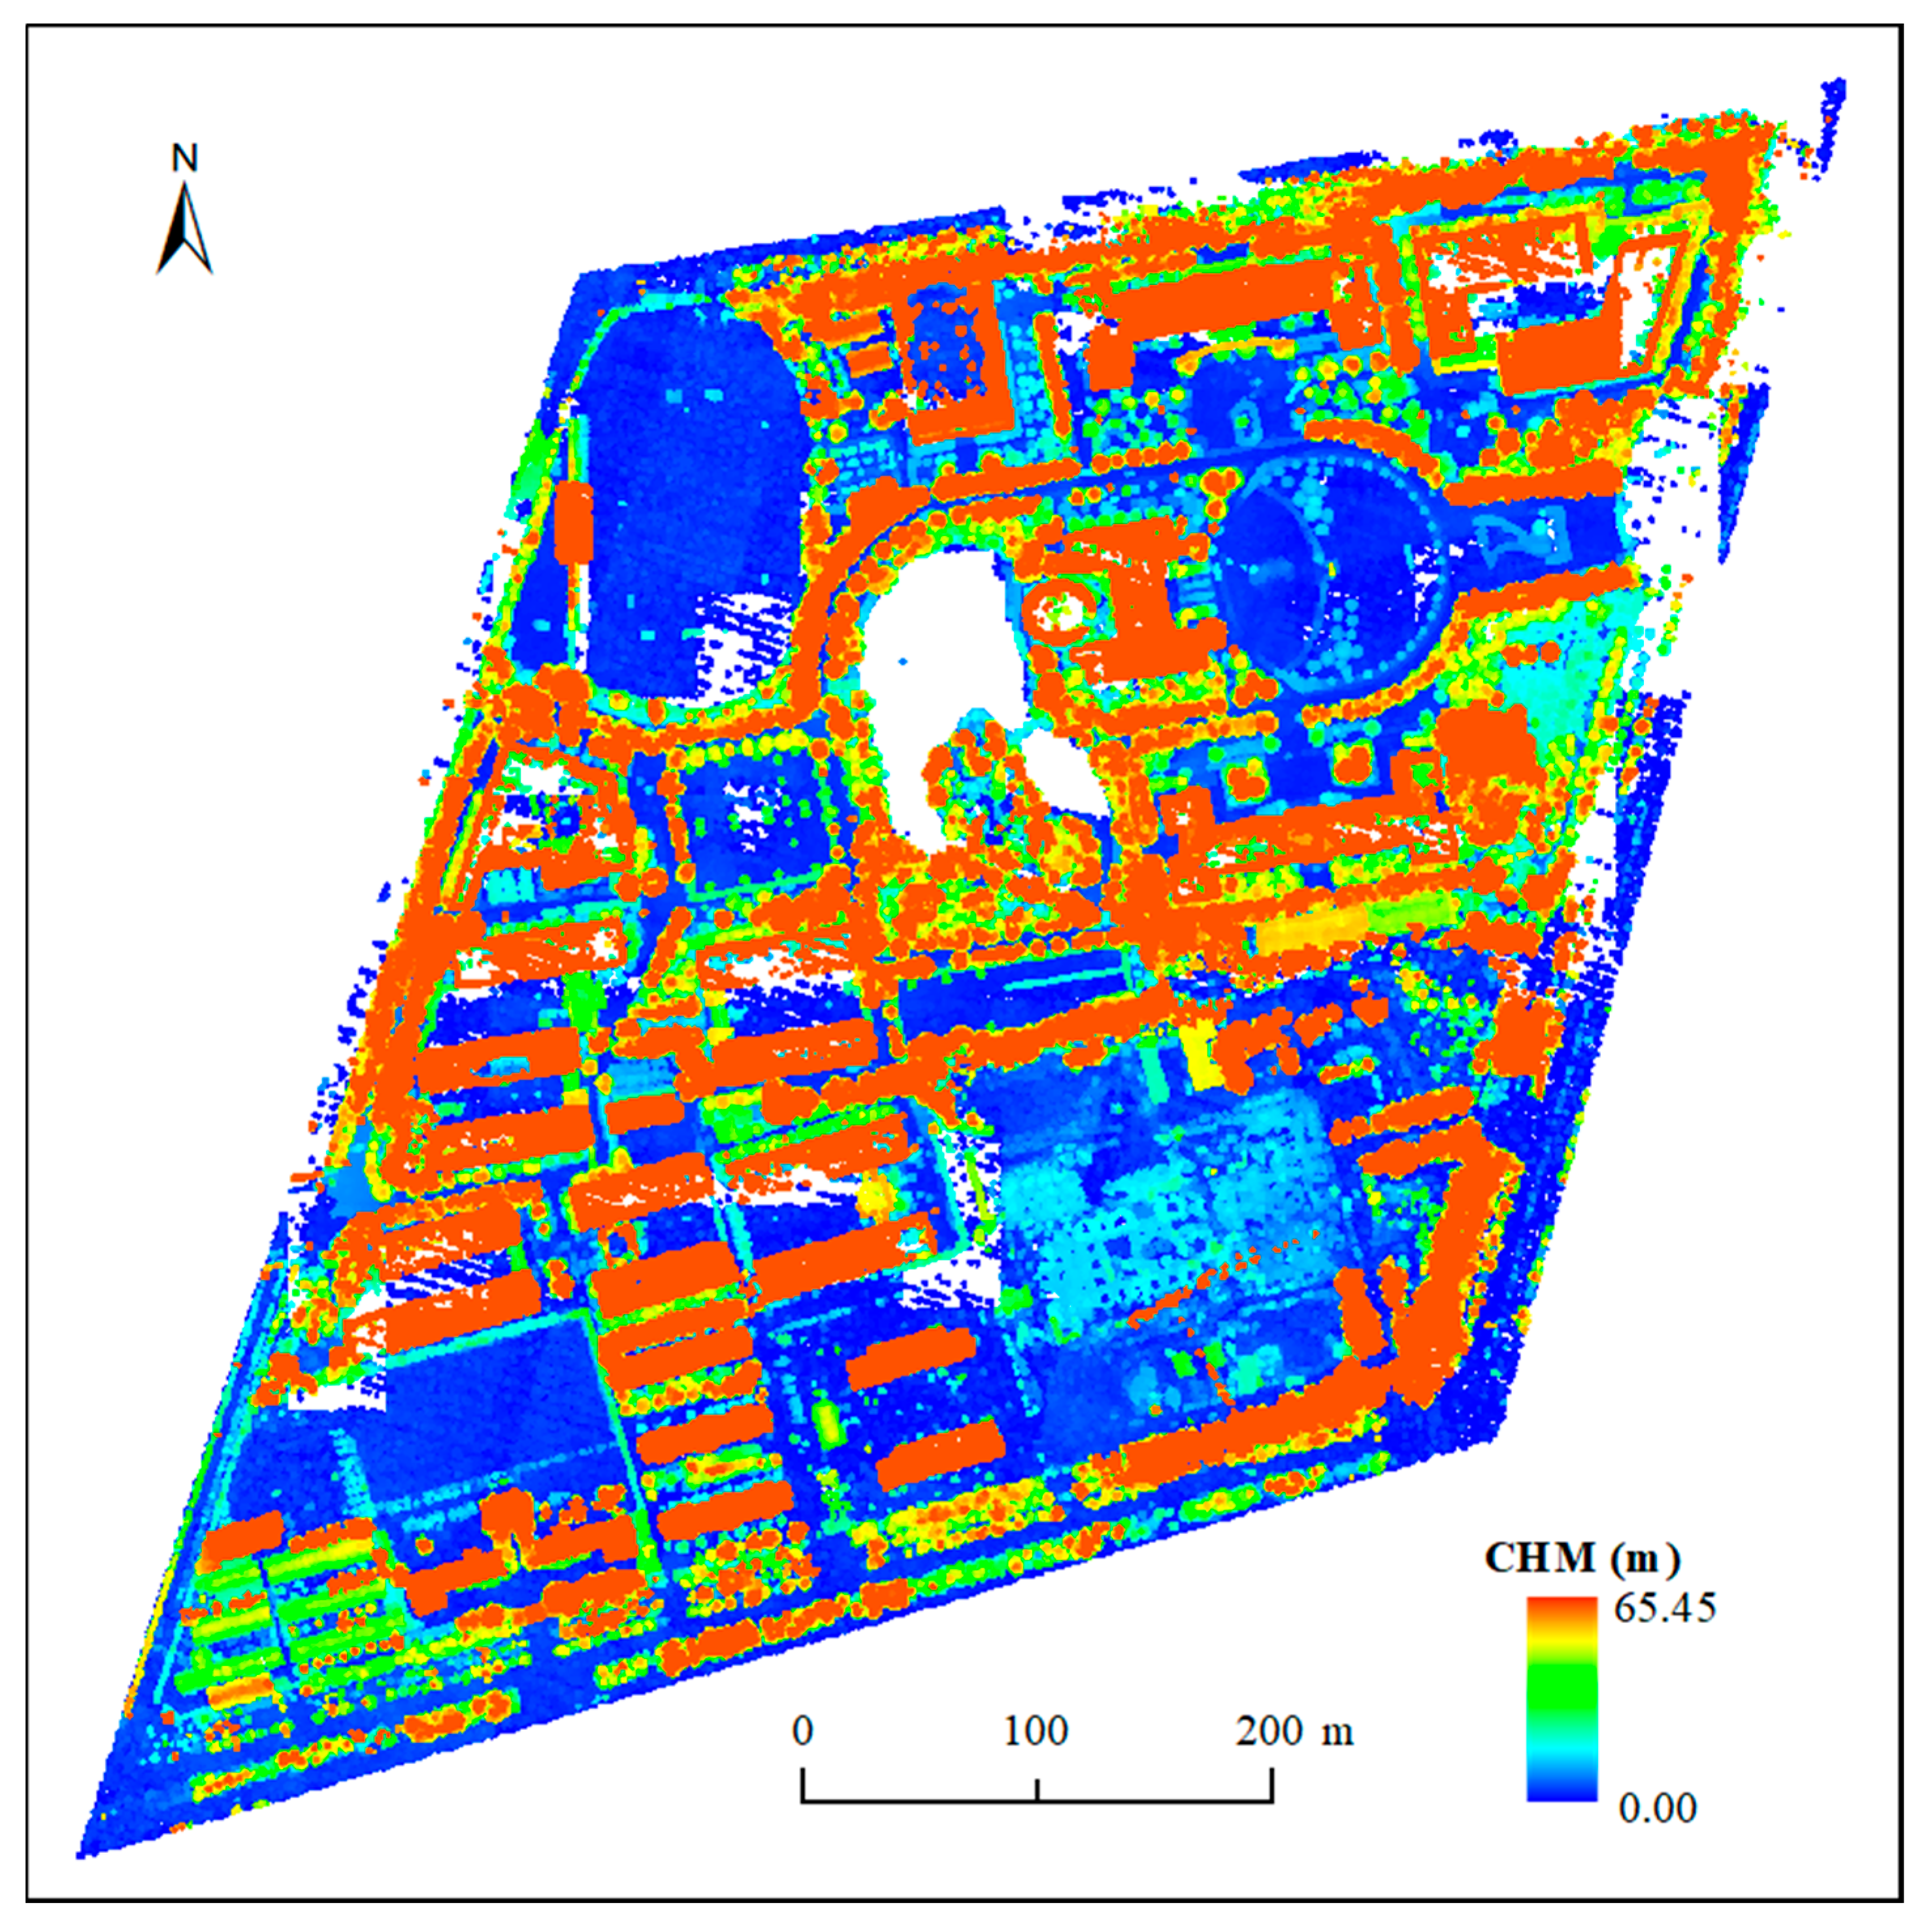
For denoising, statistical filtering was applied, where the number of neighboring points was configured as 10 and the standard deviation multiplier was set to 2 [28]. To generate the Digital Terrain Model (DTM, a model representing the bare-earth surface elevation, excluding vegetation and man-made structures) and Digital Surface Model (DSM, a model depicting the maximum elevation of all surface features, including vegetation, buildings, and terrain), the Improved Progressive TIN Densification (IPTD) algorithm was employed. This procedure produced terrain attributes including ground elevation, slope, and aspect, enabling the classification of ground points. The CHM was computed by subtracting the DTM from the DSM, which normalized tree heights to a uniform ground datum [29], as depicted in Figure 3. This strategy alleviated the interference of topographic variables (e.g., slope) on subsequent single-tree segmentation, improving the accuracy of individual tree delineation.
C H M = D S M D T M

2.3.2. Individual Tree Segmentation

For the segmentation of individual trees, the CSP algorithm was utilized. By integrating the metabolic ecological scaling law, this algorithm effectively resolves the ambiguity in crown intersection regions of trees with varying diameters [30]. The preprocessed LiDAR point cloud data were processed using LiDAR360 8.1 software to implement the CSP segmentation method. The clustering threshold was set to 0.1–0.3 m, and the minimum number of points per cluster was defined as 200–500.
The least-squares circle fitting algorithm was adopted to extract the DBH [19]. This algorithm determines the optimal solutions for the center coordinates and radius of the trunk cross-section by minimizing the squared distances from given LiDAR point cloud coordinates. Specifically, DBH was calculated at a standard height of 1.3 m above the ground surface. Tree height was derived using a direct point cloud statistical method. After segmenting individual tree point clouds, the algorithm computes the height difference between the highest point (canopy top) and the corresponding ground elevation. The calculation formula is as follows:
F a , b , R = d i 2
d i = r i R
r i = x i a 2 + y i b 2
H = ZmaxZgroud
where (a, b) is the coordinates of the fitted circle center, (xi, yi) represents the planar coordinates of LiDAR points, R is the radius of the least-squares fitted circle, ri is the distance from point (xi, yi) to the circle center; di the signed distance from point (xi, yi) to the circle perimeter, H is the tree height, Zmax is the elevation of the highest point in the tree point cloud, Zgroud is the interpolated ground elevation at the tree base.

2.3.3. Estimation of Carbon Storage

The carbon storage of individual trees in the study area is estimated based on biomass, and the quantification of biomass relies on allometric equations—a key tool in forest ecology that describes the statistical relationship between easily measurable plant traits (e.g., DBH, tree height) and hard-to-measure biomass components across different tree species. Allometric biomass models were selected from peer-reviewed literature based on tree species and regional applicability (Table 3). P. serrulate, T. fortunei, A. julibrissin, T. sebifera, U. pumila, P. cerasifera, M. azedarach, C. sinensis, P. stenoptera and E. decipiens were subjected to the general allometric model for broad-leaved tree biomass.
The LiDAR-derived parameters (DBH and tree height) were then incorporated into these species-specific models to estimate individual tree biomass. Carbon stock was calculated by applying the internationally recognized carbon conversion factor of 0.5 [31], assuming that carbon accounts for approximately 50% of dry biomass. The computational workflow is as follows:
B = f ( D ,   H )
C = B 0.5
where B is the aboveground biomass (kg), f represents species-specific allometric equations sourced from peer-reviewed literature, D stands for DBH (cm), H stands for tree height (m), C denotes carbon stock (kg).
Table 3. Models of aboveground biomass of tree species.
SpeciesAllometric Biomass ModelsSource
Cinnamomum camphora (L.) J.Presl.B = 0.937 + 0.037D2H[32]
Liriodendron chinense (Hemsl.) Sarg.B = 0.06393D2.61147[33]
Metasequoia glyptostroboides Hu & W. C. ChengB = Exp(−0.8168 + 2.1549lnD)[32]
Lagerstroemia indica L.B = 0.895 + 0.035D2H[32]
Cedrus deodara (Roxb. ex D. Don) G. DonB = 1.26(0.3721D1.2928 + 0.2805D1.3313)[33]
Juniperus chinensis L.B = 0.0707(D2H)0.8374 + 0.0054(D2H)1.0078 +
0.0048(D2H)1.0045 + 0.0058(D2H)0.6646
[34]
Salix babylonica L.B = 0.178D2.581[32]
Liquidambar formosana HanceB = 0.1511D7/3[35]
Ginkgo biloba L.B = 0.044 + 0.042D2H[32]
Magnolia grandiflora L.B = 0.33079D1.90957[33]
Platanus orientalis L.B = 0.0690(D2H)0.9133[33]
Broussonetia papyrifera (L.) L’Hér. ex Vent.B = 0.0017579(D2H)1.5784[32]
Koelreuteria paniculate Franch.B = 0.915 + 0.1D2H[32]
broad-leaved treeB = Exp(−3.5618 + 2.6645lnD)[33]

2.3.4. Accuracy Evaluation

The accuracy of individual tree segmentation was evaluated using detection precision (Pd), detection recall (Pr) and F-score (F). Based on the field-measured DBH, the accuracy of DBH fitting was verified using fitting accuracy (P), the coefficient of determination (R2), the root mean square error (RMSE), and relative root mean square error (rRMSE). A higher R2 indicates a stronger correlation between the measured values and the fitted values, while a lower RMSE indicates larger predicted values [36]. The formulas are as follows:
P d = N c N d × 100 %
P r = N c N r × 100 %
F = 2 P r × P d P r + P d × 100 %
P = 1 1 n i = 1 n | W i w i | W i
R 2 = i = 1 n ( w i w ı ¯ ) ( W i W ı ¯ ) i = 1 n ( w i w ı ¯ ) 2 i = 1 n ( W i W ı ¯ ) 2
R M S E = 1 n i = 1 n ( W i W ı ¯ ) 2
r R M S E = R M S E 1 n i = 1 n w i
where Nc is the number of correctly segmented individual trees, Nd is the number of trees extracted through segmentation, and Nr is the number of measured reference trees. n refers to the number of correctly segmented individual trees. Wi is the parameter of the segmented individual tree, and wi represents the measured individual tree parameter corresponding to the segmented individual tree.  w ı ¯  is the mean value of wi, and  W ı ¯  is the mean value of Wi.

3. Results

3.1. Results and Analysis of Individual Tree Recognition

The individual tree segmentation accuracy of the CSP algorithm in the study area was evaluated by comparing the number of measured trees with the algorithm recognition results (Table 4). A total of 1096 trees were identified, among which 794 were correctly recognized, with an average accuracy of 72.45% and an F-score of 79.68. The segmentation of L. formosana, G. biloba, P. cerasifera, P. orientalis, K. paniculata, C. sinensis, P. stenoptera, and E. decipiens was the best, with accuracy, recall, and F-score all reaching 100%. This can be visually supported by its point cloud cross-sectional profile in Figure 4, which shows distinct and clear boundaries of the tree. The segmentation of M. glyptostroboides, T. fortunei, L. indica, and L. chinense was excellent, with both precision and F-score exceeding 90%. The segmentation of P. serrulata, J. chinensis, C. camphora, A. julibrissin, and U. pumila was good, with precision values all higher than 80%. The segmentation performance of B. papyrifera, M. grandiflora, and M. azedarach was relatively poor, with accuracy ranging from 50% to 75%. The segmentation accuracy of T. sebifera was lower than 50%, while C. deodara and S. babylonica showed the worst segmentation performance, with accuracies of 14.41% and 14.29%, respectively.

3.2. Results and Analysis of DBH Fitting

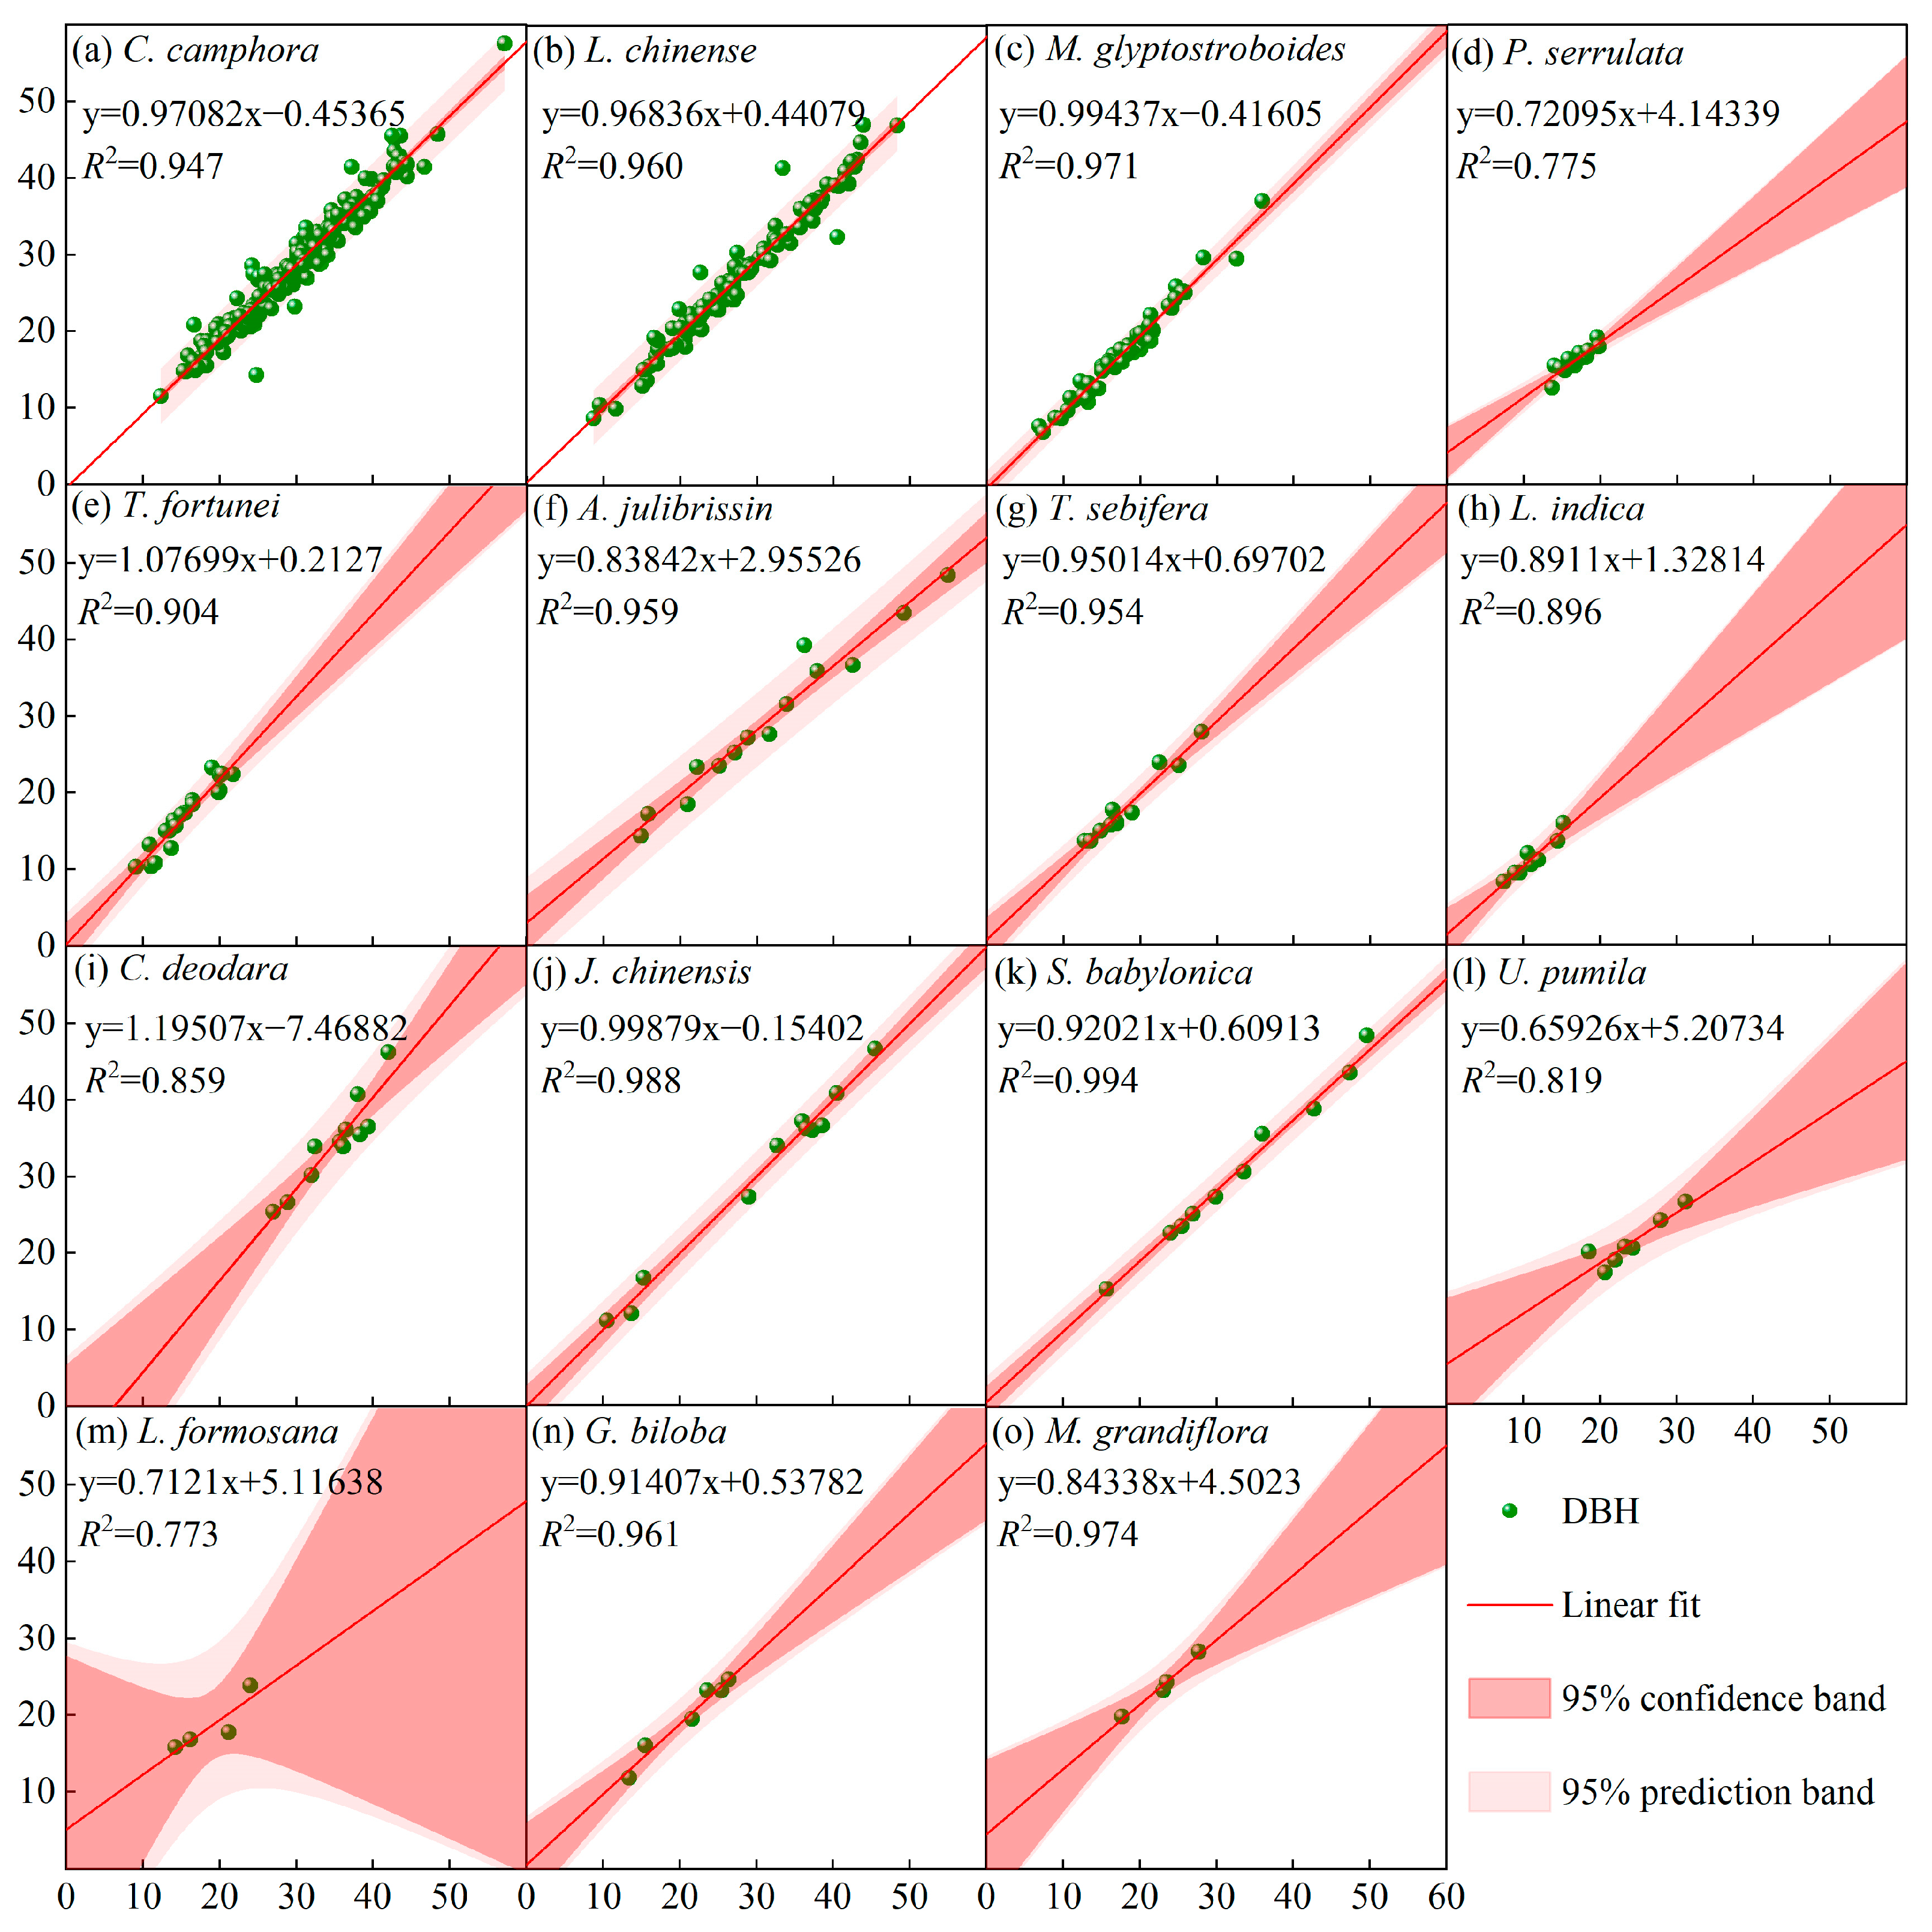
The DBH fitting results of different tree species are shown in Table 5 and Figure 5. The fitting accuracy of M. grandiflora, T. sebifera, J. chinensis, and L. chinense was the highest, all exceeding 95%, with R2 above 0.95 and rRMSE below 6.5%. The fitting accuracy of P. serrulata, M. glyptostroboides, C. deodara, S. babylonica, L. indica, C. camphora, G. biloba, L. formosana, A. julibrissin, and T. fortunei was good, ranging from 90% to 95%, with R2 above 0.773. The estimation accuracy of U. pumila was the lowest, standing at 84.13%, with R2 of 0.819 and a relatively high rRMSE at 14.56%.

3.3. Estimation Results of Carbon Storage

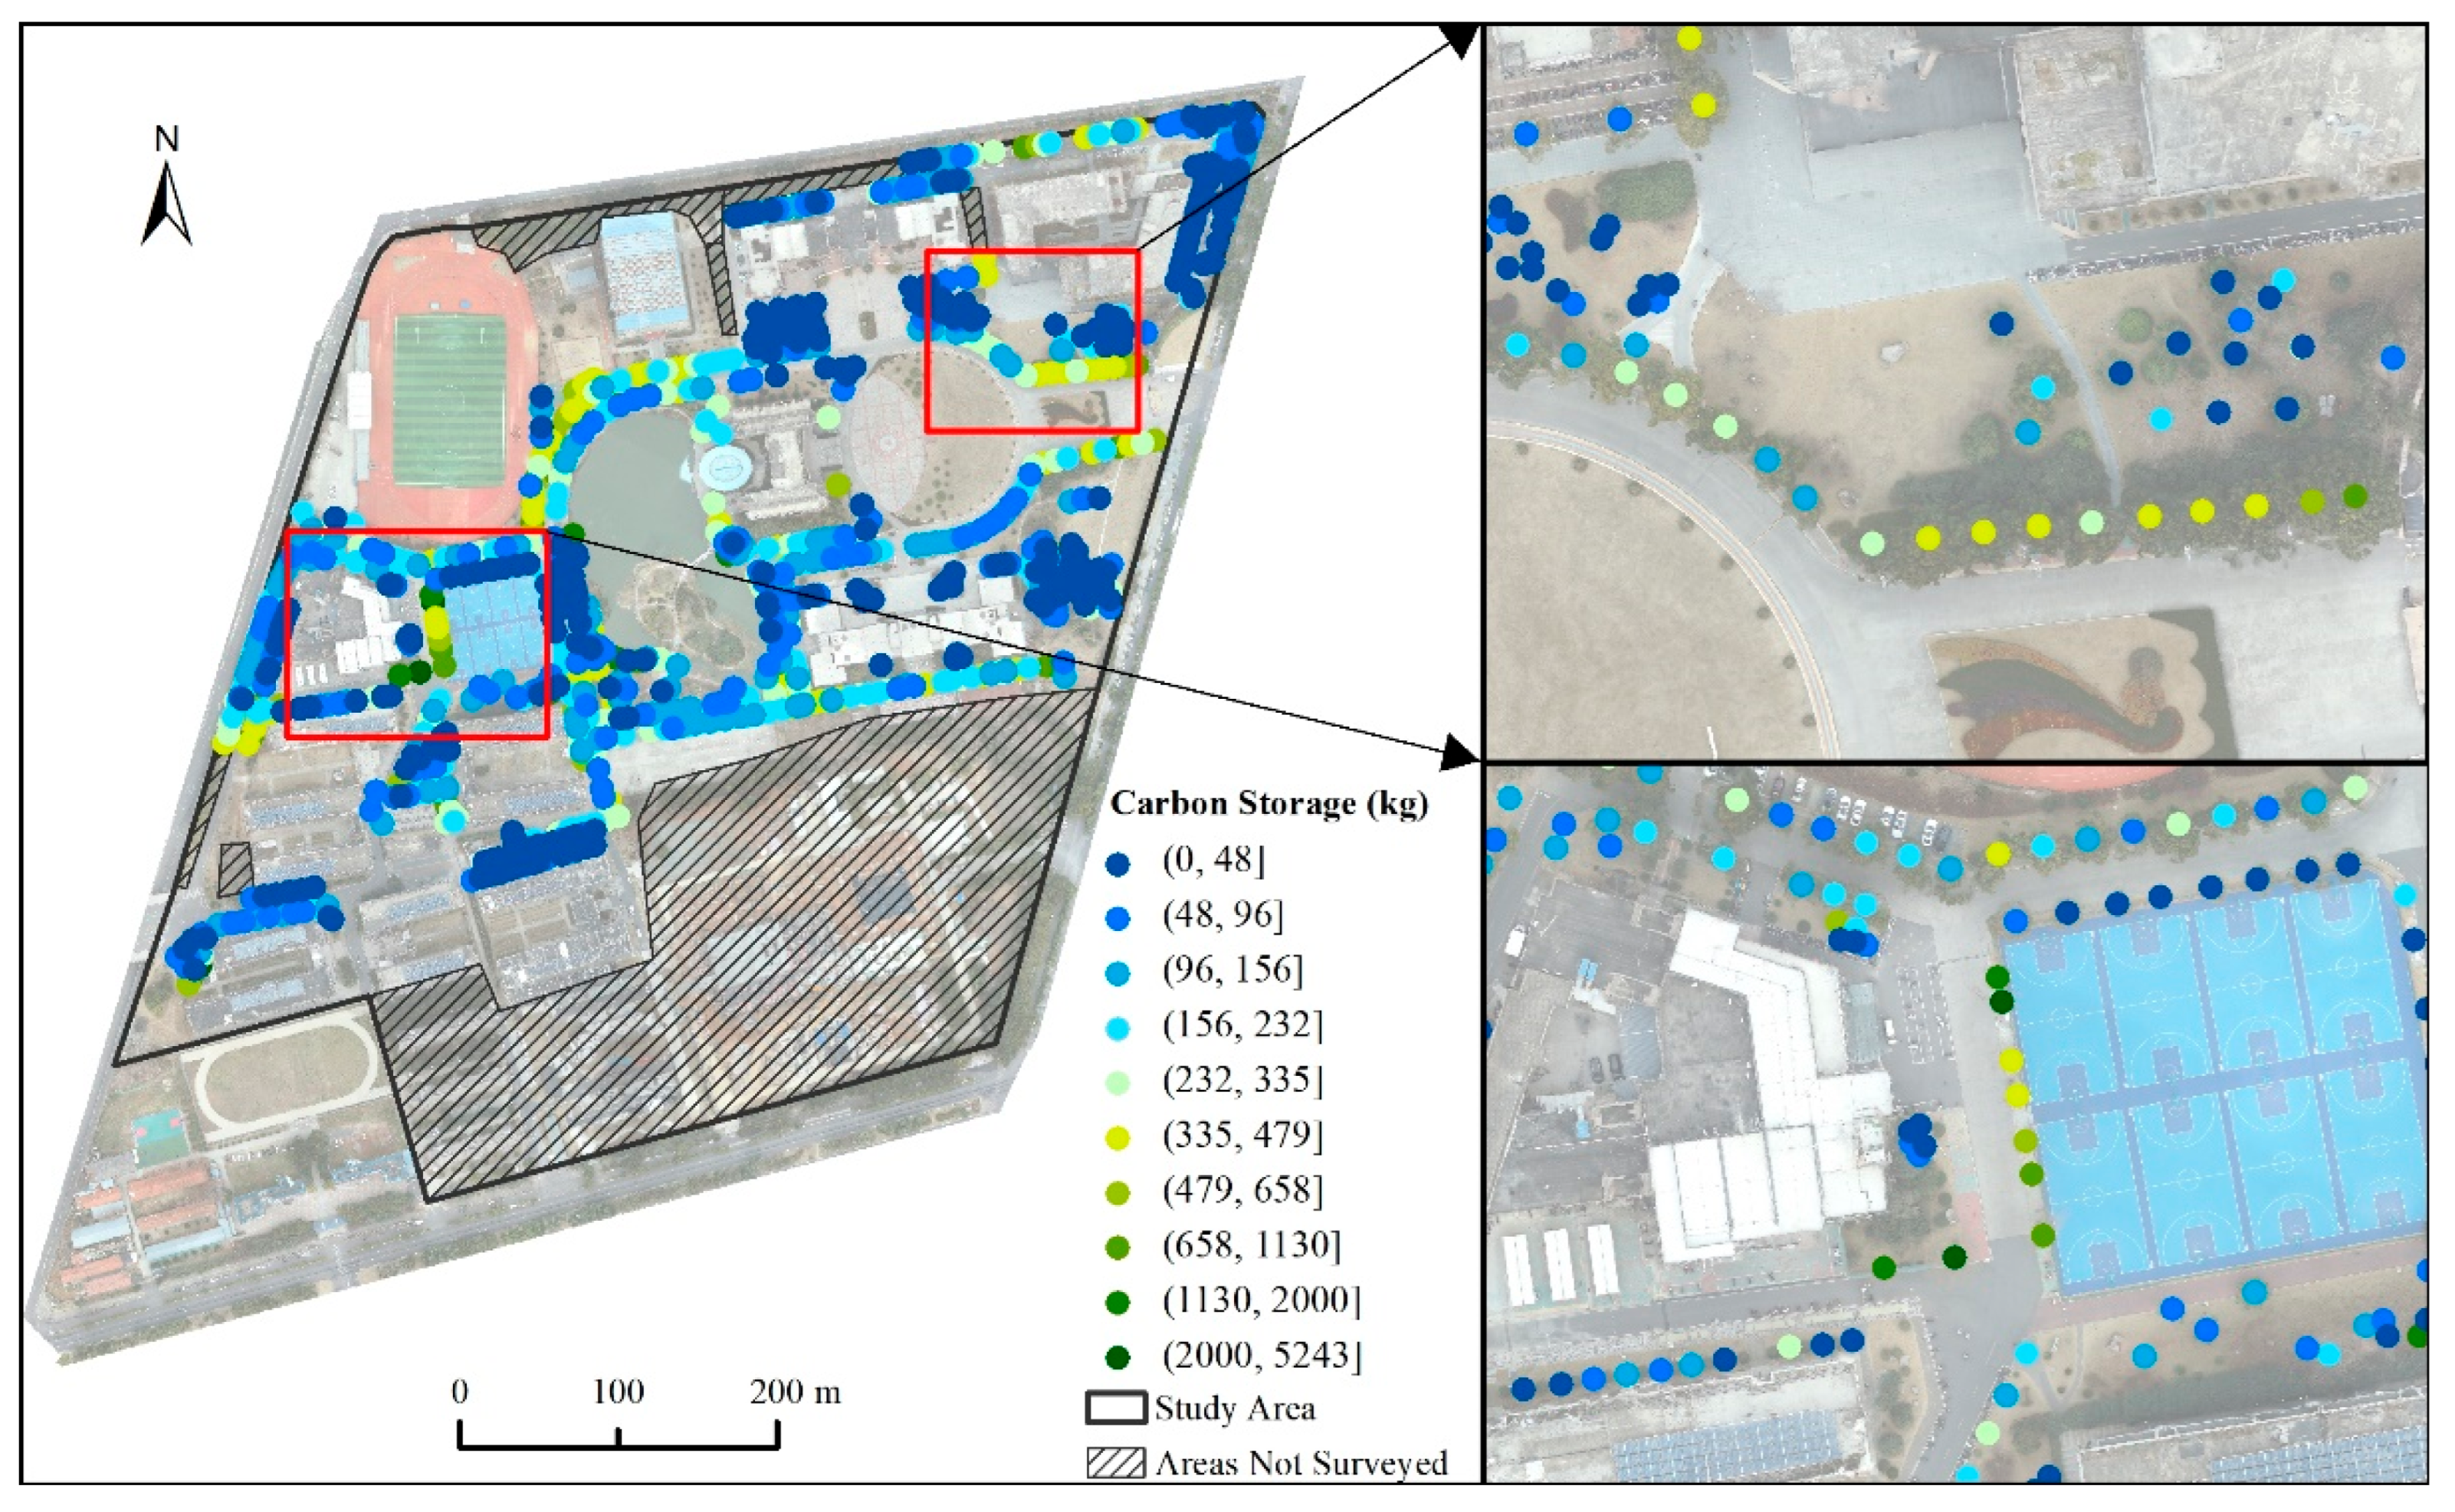
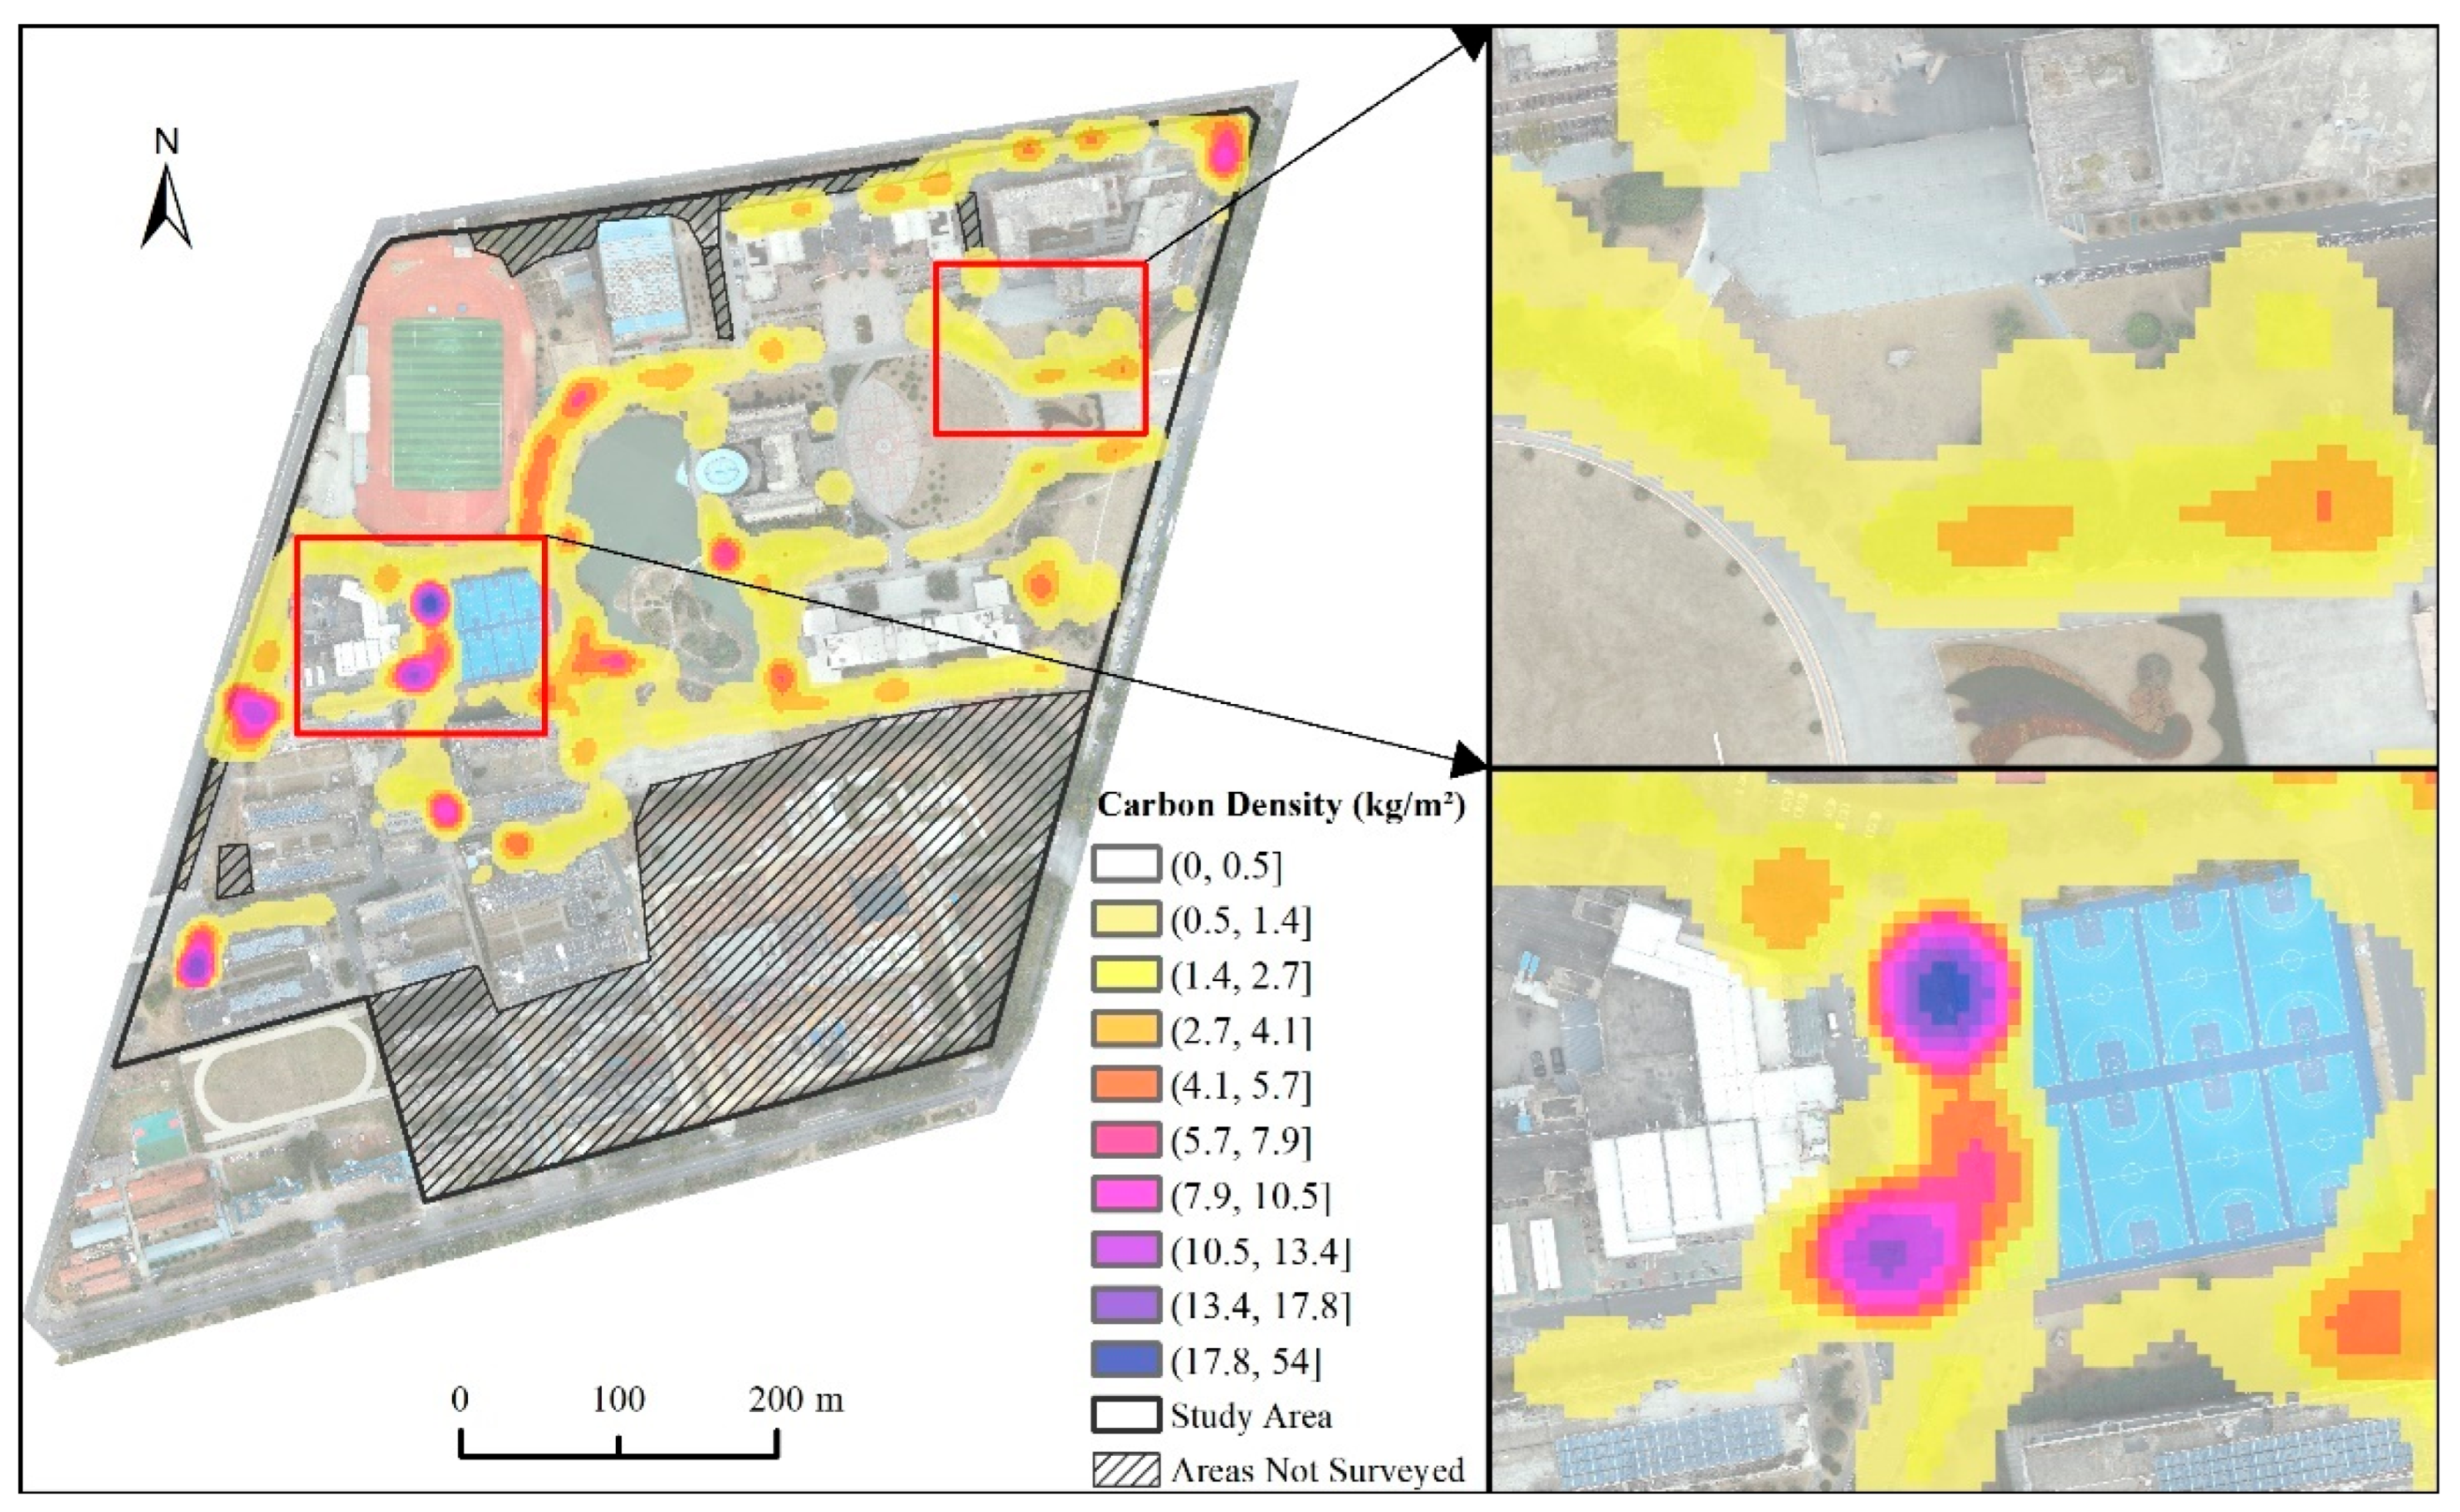
The carbon storage results of campus tree species are shown in Table 6. There are a total of 897 trees on the campus, with an average carbon storage of 182.4 kg per tree and a total carbon storage of 163,601 kg. The spatial distribution of this total carbon storage across the study area is presented in Figure 6. The average carbon storage per plant of S. babylonica is the highest, at 1256.6 kg, with a total carbon storage of 33,928 kg. Followed by P. orientalis, the average carbon storage per plant is 466.0 kg, and the total carbon storage is 1398 kg. K. paniculata, B. papyrifera, L. chinense, M. glyptostroboides, C. camphora, and A. julibrissin have relatively high average carbon storage per plant, which are 345.1 kg, 330.3 kg, 222.7 kg, 201.0 kg, 174.8 kg, and 100.2 kg, respectively. The spatial aggregation characteristics of these high-carbon-storage tree species and overall carbon storage hotspots can be further observed in Figure 7. The average carbon storage per plant of M. grandiflora, J. chinensis, E. decipiens, L. formosana, G. biloba, U. pumila, P. stenoptera, T. fortunei, and M. azedarach exhibit a moderate level of carbon storage capacity, with their average carbon storage per plant ranging from 50 kg to 100 kg. P. cerasifera, L. indica, T. sebifera, C. deodara, P. serrulata, and C. sinensis have relatively low-carbon storage, all below 50 kg, among which C. sinensis is the lowest, at 4.0 kg.

4. Discussion

4.1. Factors Affecting Individual Tree Recognition

The CSP algorithm used in this study exhibits significant differences in individual tree segmentation across different tree species. Tree species such as L. formosana, G. biloba, P. orientalis and K. paniculata typically have regular, independent crowns with clear outlines, distinct branches, and relatively discrete spatial distribution in planting. These morphological features enable the space-clustering-based CSP segmentation algorithm to effectively distinguish individual tree boundaries, minimizing the occurrence of under-segmentation and over-segmentation, thus achieving high-precision individual tree segmentation.
However, the algorithm still exhibits obvious limitations in segmenting certain tree species. Taking C. deodara as an example, its dense lateral branches with strong horizontal extension ability easily result in interwoven crowns between adjacent individuals, making it difficult to precisely define the boundaries of individual trees and leading to significantly low segmentation accuracy (Figure 8(a1,a2)). In the case of S. babylonica (willows), their slender and flexible branches, often growing in a pendulous or spreading manner, result in loose and irregular overall crown shapes with indistinct boundary contours. This makes it challenging for the algorithm to accurately demarcate the spatial scope of individual trees, thereby causing severe over-segmentation (Figure 8(b1,b2)). Additionally, the widespread adoption of dense planting strategies and mixed arrangement patterns in campus greening leads to frequent interlacing of crowns among adjacent trees, where the spatial boundaries between individual trees tend to disappear, further exacerbating the difficulty of segmentation (Figure 8(c1,c2)).
The essence of the aforementioned phenomena lies in the fact that the effective operation of the CSP algorithm highly relies on the ideal prerequisites of “regular crown morphology, discrete spatial distribution, and independent individual characteristics”, which are often not met by trees in campus scenarios. Specifically, on one hand, campus trees encompass a rich diversity of species, with significant differences in their morphological characteristics, lacking unified recognition patterns; on the other hand, the spatial distribution of trees is dominated by artificial planning, mostly presenting dense and structured layouts, which are distinctly different from the discrete distribution characteristics in natural states; furthermore, some trees are artificially pruned to meet landscape design requirements, forming unnatural morphological features. This further deviates from the ideal assumptions relied upon by the algorithm, ultimately resulting in fluctuations and declines in segmentation accuracy.
Given the particularities of campus tree segmentation, future optimization of individual tree segmentation algorithms should focus on enhancing robustness for tree species with such challenging morphologies. For instance, more refined descriptions of morphological features can be introduced, such as incorporating micro-characteristics like branch growth angles, density distribution, and canopy texture, to strengthen the ability to recognize complex crown structures. Meanwhile, improving point cloud clustering strategies by considering the spatial correlation of densely planted campus trees and designing adaptive clustering threshold adjustment mechanisms will better handle crown interweaving scenarios, thereby improving the overall accuracy and stability of individual tree segmentation in campus environments.

4.2. Sources of DBH Fitting Error

Significant differences in the DBH fitting accuracy were found among different tree species through research. The trunk morphology has an important influence on the DBH fitting accuracy. Tree species with straight trunks, good cylindricity, and relatively smooth surfaces, such as C. camphora, L. chinense, T. sebifera and J. chinensis, enable LiDAR to acquire clear and complete DBH cross-sectional point cloud data more smoothly (Figure 9a,b,g,j), thereby achieving higher fitting accuracy.
However, some tree species have lower fitting accuracy due to their trunk characteristics. For example, the trunk surface of T. fortunei is often wrapped with fibrous leaf-sheath bases, and this special structure makes the cross-sectional shape of the trunk irregular (Figure 9e), resulting in a DBH fitting accuracy of only 90%. The fitting accuracy of A. julibrissin is affected by its growth structure. The clear-bole height of A. julibrissin is relatively low, and its early-stage branches are near 1.3 m. At this time, the trunk often has not yet formed a regular cylindrical shape (Figure 9f). This irregular morphology interferes with the positioning of the standard cross-section and the acquisition of point cloud data by LiDAR, ultimately resulting in rRMSE of over 10%. The DBH fitting situation of P. serrulata is rather special. Its DBH fitting accuracy and relative error are 94.84% and 5.67%, respectively, indicating good performance based on these two data points. However, the R2 is only 0.775. This is due to the inclination of P. serrulata during growth, making the shape at the DBH fitting not a standard circle (Figure 9d), which limits the LiDAR’s ability to fit the DBH to some extent. P. cerasifera has the worst performance in terms of DBH fitting, with a fitting accuracy of 64.52%. This can be attributed to the presence of multiple branches at the 1.3 m height (Figure 9p), which caused significant interference to the DBH fitting process.
Our findings on precision carbon stock estimation using fused backpack and UAV LiDAR data in urban campuses hold practical implications for broader urban forest carbon management. First, the method’s ability to accurately quantify carbon storage in small-scale, vegetation-building mixed areas (a typical feature of urban campuses) can be extended to other urban green spaces, such as community parks and street greenbelts. This provides urban planners with a reliable tool to assess the carbon sequestration potential of fragmented green patches, supporting targeted green infrastructure optimization—for example, prioritizing the planting of high-carbon-sequestration tree species in areas with verified low current carbon stocks.
Future research will explore the integration of more abundant 3D structural parameters derived from LiDAR (such as canopy volume, canopy closure, etc.) into allometric models to develop more accurate biomass estimation algorithms that rely less on traditional species-specific parameters, which is particularly important for carbon storage estimation in complex urban environments. To verify the universality of the method in this study, future work will apply this framework to other campus areas; through comparative research, it will systematically reveal the differential impacts of different campus green space configurations on carbon sequestration functions. In addition, future studies will integrate multi-temporal LiDAR data to establish a long-term dynamic monitoring system for carbon storage. This system will not only enable the quantification of interannual and seasonal fluctuations in carbon storage but also link phenology, climate events, and human management measures, thereby dynamically assessing the net carbon sequestration capacity of cities and their driving mechanisms.

5. Conclusions

This study estimated campus carbon storage using drone and backpack LiDAR data. Individual tree segmentation was performed on 897 trees across the campus, resulting in the identification of 1096 trees, among which 794 were correctly recognized. The detection rate, precision, and F-score were 72.45%, 88.52%, and 79.68%, respectively. An accuracy analysis of DBH fitting revealed that 14 tree species achieved a fitting accuracy exceeding 90%. Among them, M. grandiflora exhibited the highest fitting accuracy, reaching 95.89%. The total carbon storage of 897 campus trees reached 163,601 kg. C. camphora, L. chinense, S. babylonica, and M. glyptostroboides collectively contributed 84.3% of the total. Our research provides a novel approach for campus carbon storage estimation, demonstrating the feasibility of LiDAR-based methods. Tree morphology and data processing techniques jointly influence individual tree recognition and DBH fitting accuracy. Given the significant interspecies variation in carbon sequestration capacity, our results offer actionable insights for optimizing species selection in campus greening initiatives.

Author Contributions

Conceptualization, N.L. and L.L.; methodology, S.Z.; software, S.Z.; validation, Y.L. and T.X.; investigation, J.M., H.W. and M.H.; data curation, T.X.; writing—original draft preparation, S.Z.; writing—review and editing, N.L.; visualization, S.Z.; supervision, L.L.; funding acquisition, L.L. All authors have read and agreed to the published version of the manuscript.

Funding

This research was funded by the National Natural Science Foundation of China (grant no. 42101387), the Anhui Province Universities Outstanding Talented Person Support Project (grant no. YQZD2024045), the Natural Science Research Project for Anhui Universities (grant no. 2023AH030094, 2022AH051111, 2023AH040217), the Foundation of Anhui Province Key Laboratory of Physical Geographic Environment (2024PGE005).

Data Availability Statement

Data will be made available on request to the corresponding author.

Acknowledgments

The authors would like to thank Linjia Wei, Yuhao Li, Xin Cheng, Jun Wang, Jingyi Xie, Mengjia Yang, Jianing Zhou, Yanan Pei, Xinyan Niu, Yuxin Lu and Xujun Cheng for their support in the field investigation.

Conflicts of Interest

The authors declare that they have no known competing financial interests or personal relationships that could have appeared to influence the work reported in this paper.

References

  1. Xie, D.; Feng, L.; Yan, X.; Sharma, R.P.; Wang, Z.; Duan, G.; Tang, S.; Liu, S.; Fu, L. forestat: An R package for computing forest carbon sequestration and potential productivity. Ecol. Indic. 2024, 166, 112477. [Google Scholar] [CrossRef]
  2. Feng, T.; Qi, Y.; Zhang, Y.; Fan, D.; Wei, T.; Wang, P.; Keesstra, S.D.; Cerdà, A. Long-term effects of vegetation restoration and forest management on carbon pools and nutrient storages in northeastern Loess Plateau, China. J. Environ. Manag. 2024, 354, 120296. [Google Scholar] [CrossRef] [PubMed]
  3. Gülçin, D.; van Den Bosch, C.C.K. Assessment of above-ground carbon storage by urban trees using LiDAR data: The case of a university campus. Forests 2021, 12, 62. [Google Scholar] [CrossRef]
  4. Schick, M.; Griffin, R.; Cherrington, E.; Sever, T. Utilizing LiDAR to quantify aboveground tree biomass within an urban university. Urban For. Urban Green. 2023, 89, 128098. [Google Scholar] [CrossRef]
  5. Wang, C.; Parvez, A.; Mou, J.; Quan, C.; Wang, J.; Zheng, Y.; Luo, X.; Wu, T. The status and improvement opportunities towards carbon neutrality of a university campus in China: A case study on energy transition and innovation perspectives. J. Clean. Prod. 2023, 414, 137521. [Google Scholar] [CrossRef]
  6. Zhang, L.; Shao, Z.; Liu, J.; Cheng, Q. Deep learning based retrieval of forest aboveground biomass from combined LiDAR and Landsat 8 data. Remote Sens. 2019, 11, 1459. [Google Scholar] [CrossRef]
  7. Jiang, X.; Li, G.; Lu, D.; Chen, E.; Wei, X. Stratification-based forest aboveground biomass estimation in a subtropical region using airborne lidar data. Remote Sens. 2020, 12, 1101. [Google Scholar] [CrossRef]
  8. Wang, L.; Ju, Y.; Ji, Y.; Marino, A.; Zhang, W.; Jing, Q. Estimation of forest above-ground biomass in the study area of Greater Khingan ecological station with integration of airborne LiDAR, Landsat 8 OLI, and hyperspectral remote sensing data. Forests 2024, 15, 1861. [Google Scholar] [CrossRef]
  9. Kabiri, K. Mapping coastal ecosystems and features using a low-cost standard drone: Case study, Nayband Bay, Persian gulf, Iran. J. Coast. Conserv. 2020, 24, 62. [Google Scholar] [CrossRef]
  10. Karimi, A.; Abtahi, B.; Kabiri, K. Mapping and Estimating Blue Carbon in Mangrove Forests Using Drone and Field-Based Tree Height Data: A Cost-Effective Tool for Conservation and Management. Forests 2025, 16, 1196. [Google Scholar] [CrossRef]
  11. Zhao, K.; Suarez, J.C.; Garcia, M.; Hu, T.; Wang, C.; Londo, A. Utility of multitemporal lidar for forest and carbon monitoring: Tree growth, biomass dynamics, and carbon flux. Remote Sens. Environ. 2018, 204, 883–897. [Google Scholar] [CrossRef]
  12. Liu, Y.; Chen, D.; Na, J.; Peethambaran, J.; Pfeifer, N.; Zhang, L. Segmentation of Individual Trees in TLS Point Clouds via Graph Optimization. IEEE Trans. Geosci. Remote Sens. 2025, 63, 5702821. [Google Scholar] [CrossRef]
  13. Li, L.; Wei, L.; Li, N.; Zhang, S.; Hu, M.; Ma, J. Impact of backpack LiDAR scan routes on diameter at breast height estimation in forests. Forests 2025, 16, 527. [Google Scholar] [CrossRef]
  14. Ma, S.; Chen, Y.; Li, Z.; Chen, J.; Zhong, X. Improved cylinder-based tree trunk detection in LiDAR point clouds for forestry applications. Sensors 2025, 25, 714. [Google Scholar] [CrossRef]
  15. Wang, C.; Luo, S.; Xi, X.; Nie, S.; Ma, D.; Huang, Y. Influence of voxel size on forest canopy height estimates using full-waveform airborne LiDAR data. For. Ecosyst. 2020, 7, 31. [Google Scholar] [CrossRef]
  16. Wang, A.; Wang, J.; Li, H.; Hu, J.; Zhou, H.; Zhang, X.; Liu, X.; Wang, W.; Zhang, W.; Wu, S.; et al. Tree parameter extraction method based on new remote sensing technology and terrestrial laser scanning technology. Big Data Res. 2024, 36, 100460. [Google Scholar] [CrossRef]
  17. Zhang, Z.; Cao, L.; She, G. Estimating forest structural parameters using canopy metrics derived from airborne LiDAR data in subtropical forests. Remote Sens. 2017, 9, 940. [Google Scholar] [CrossRef]
  18. Zhang, Z.; Wang, T.; Skidmore, A.K.; Cao, F.; She, G.; Cao, L. An improved area-based approach for estimating plot-level tree DBH from airborne LiDAR data. For. Ecosyst. 2023, 10, 100089. [Google Scholar] [CrossRef]
  19. Liu, C.; Xing, Y.; Duanmu, J.; Tian, X. Evaluating different methods for estimating diameter at breast height from terrestrial laser scanning. Remote Sens. 2018, 10, 513. [Google Scholar] [CrossRef]
  20. Ali, J.S.; Chen, L.; Liao, B.; Wang, C.; Zhang, F.; Bhutto, Y.A.; Junejo, S.A.; Nian, Y. Integration of UAS and Backpack-LiDAR to Estimate Aboveground Biomass of Picea crassifolia Forest in Eastern Qinghai, China. Remote Sens. 2025, 17, 681. [Google Scholar] [CrossRef]
  21. Fan, G.; Nan, L.; Chen, F.; Dong, Y.; Wang, Z.; Li, H.; Chen, D. A new quantitative approach to tree attributes estimation based on LiDAR point clouds. Remote Sens. 2020, 12, 1779. [Google Scholar] [CrossRef]
  22. Zheng, G.; Ma, L.; Eitel, J.U.; He, W.; Magney, T.S.; Moskal, L.M.; Li, M. Retrieving directional gap fraction, extinction coefficient, and effective leaf area index by incorporating scan angle information from discrete aerial lidar data. IEEE Trans. Geosci. Remote Sens. 2016, 55, 577–590. [Google Scholar] [CrossRef]
  23. Wang, Y.; Fang, H.; Zhang, Y.; Li, S.; Pang, Y.; Ma, T.; Li, Y. Retrieval and validation of vertical LAI profile derived from airborne and spaceborne LiDAR data at a deciduous needleleaf forest site. GISci. Remote Sens. 2023, 60, 2214987. [Google Scholar] [CrossRef]
  24. Brede, B.; Calders, K.; Lau, A.; Raumonen, P.; Bartholomeus, H.M.; Herold, M.; Kooistra, L. Non-destructive tree volume estimation through quantitative structure modelling: Comparing UAV laser scanning with terrestrial LiDAR. Remote Sens. Environ. 2019, 233, 111355. [Google Scholar] [CrossRef]
  25. Ali, M.; Lohani, B.; Hollaus, M.; Pfeifer, N. Benchmarking geometry-based leaf-filtering algorithms for tree volume estimation using terrestrial LiDAR scanners. Remote Sens. 2024, 16, 1021. [Google Scholar] [CrossRef]
  26. Zhao, Y.; Im, J.; Zhen, Z.; Zhao, Y. Towards accurate individual tree parameters estimation in dense forest: Optimized coarse-to-fine algorithms for registering UAV and terrestrial LiDAR data. GISci. Remote Sens. 2023, 60, 2197281. [Google Scholar] [CrossRef]
  27. Kapoutsis, C.A.; Vavoulidis, C.P.; Pitas, I. Morphological iterative closest point algorithm. IEEE Trans. Image Process. 1999, 8, 1644–1646. [Google Scholar] [CrossRef]
  28. Li, L.; Wei, L.; Li, N.; Zhang, S.; Wu, Z.; Dong, M.; Chen, Y. Extracting the DBH of moso bamboo forests using LiDAR: Parameter optimization and accuracy evaluation. Forests 2024, 15, 804. [Google Scholar] [CrossRef]
  29. Zhang, W.; Qi, J.; Wan, P.; Wang, H.; Xie, D.; Wang, X.; Yan, G. An easy-to-use airborne LiDAR data filtering method based on cloth simulation. Remote Sens. 2016, 8, 501. [Google Scholar] [CrossRef]
  30. Tao, S.; Wu, F.; Guo, Q.; Wang, Y.; Li, W.; Xue, B.; Hu, X.; Li, P.; Tian, D.; Li, C.; et al. Segmenting tree crowns from terrestrial and mobile LiDAR data by exploring ecological theories. ISPRS J. Photogramm. Remote Sens. 2015, 110, 66–76. [Google Scholar] [CrossRef]
  31. IPCC. Guidelines for National Greenhouse Gas Inventories; Intergovernmental Panel on Climate Change: Geneva, Switzerland, 2006. [Google Scholar]
  32. Han, S. Study on the Comprehensive Effects of Water Saving and Carbon Fixation in Main Urban Road Greenbelts in Hangzhou. Master’s Thesis, Zhejiang A&F University, Hangzhou, China, 2023. [Google Scholar]
  33. Ma, L. Research on the Allocation Mode and Design Optimization of Carbon Sequestration Plants in Green Space in Residential Areas: A Case Study of Changqingfang, Xi’an. Master’s Thesis, Xi’an University of Architecture and Technology, Xi’an, China, 2023. [Google Scholar]
  34. Zhu, Y. Characteristics of Structure and Carbon Storage of Greening on the Campus of Anhui Agricultural University. Master’s Thesis, Anhui Agricultural University, Hefei, China, 2016. [Google Scholar]
  35. Zeng, W. Developing one-variable individual tree biomass models based on wood density for 34 Tree Species in China. For. Resour. Manag. 2017, 6, 41–46. [Google Scholar]
  36. Wang, D.; Liang, X.; Mofack, G.I.; Martin-Ducup, O. Individual tree extraction from terrestrial laser scanning data via graph pathing. For. Ecosyst. 2021, 8, 67. [Google Scholar] [CrossRef]
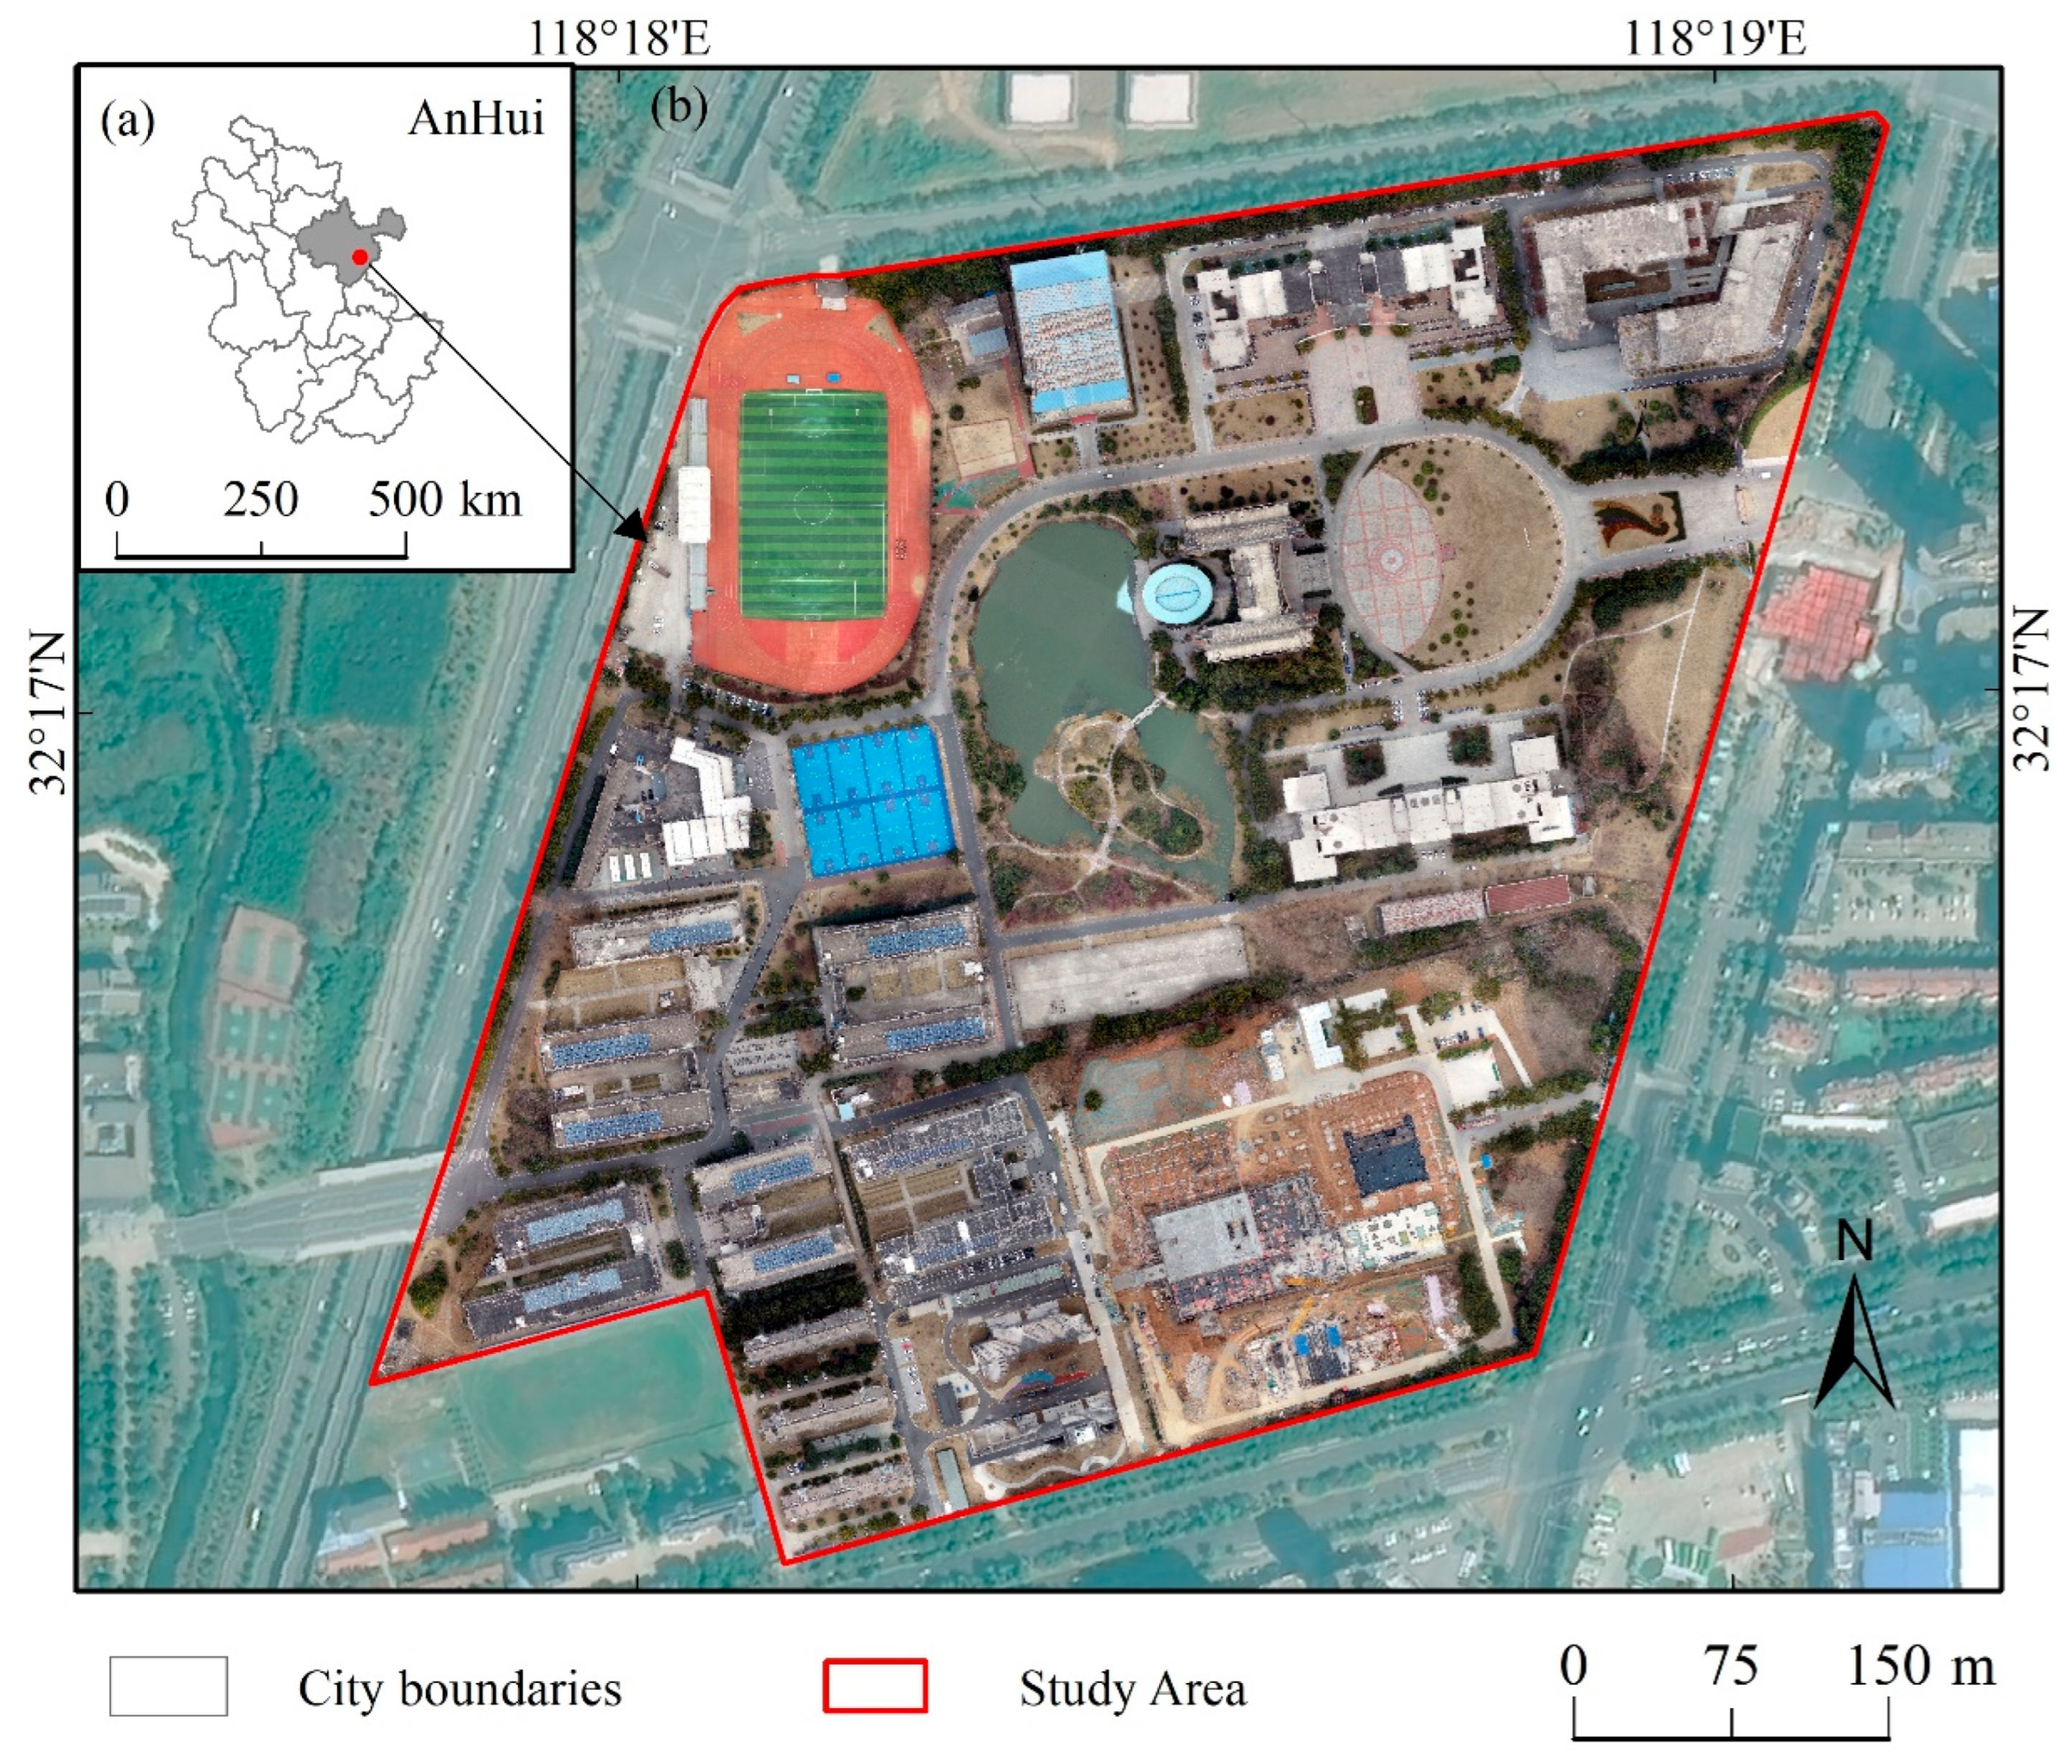
Figure 1. Overview map of the study area. (a) Anhui Province; (b) study area.
Forests 16 01550 g001
Figure 2. Tree location map of the study area.
Forests 16 01550 g002
Figure 3. CHM of the study area.
Forests 16 01550 g003
Figure 4. Cross-sectional profiles of point clouds for different tree species. (at) are C. camphora, L. chinense, M. glyptostroboides, P. serrulata, T. fortunei, A. julibrissin, T. sebifera, L. indica, C. deodara, J. chinensis, S. babylonica, U. pumila, M. grandiflora, P. cerasifera, P. orientalis, B. papyrifera, K. paniculata, M. azedarach, P. stenoptera and E. decipiens, respectively. The colors represent the height of the point cloud, with red indicating higher areas and blue indicating lower areas.
Forests 16 01550 g004
Figure 5. Regression plots of DBH fitting for different tree species. (ao) are C. camphora, L. chinense, M. glyptostroboides, P. serrulata, T. fortunei, A. julibrissin, T. sebifera, L. indica, C. deodara, J. chinensis, S. babylonica, U. pumila, L. formosana, G. biloba and M. grandiflora, respectively.
Forests 16 01550 g005
Figure 6. Distribution of carbon storage in the study area.
Forests 16 01550 g006
Figure 7. Kernel density map of carbon storage in the study area.
Forests 16 01550 g007
Figure 8. On-site images of campus trees and segmentation results from point clouds. (a1c1) represent the point cloud data of typical areas, and (a2c2) represent the on-site photos. Different colors represent different individual trees after segmentation.
Forests 16 01550 g008
Figure 9. Cross-sectional point clouds of DBH for different tree species. (ap) are C. camphora, L. chinense, M. glyptostroboides, P. serrulata, T. fortunei, A. julibrissin, T. sebifera, L. indica, C. deodara, J. chinensis, S. babylonica, U. pumila, L. formosana, G. biloba, M. grandiflora and P. cerasifera, respectively. The green points represent the cross-section of the point cloud, and the red circles are the schematics of the fitted circles.
Forests 16 01550 g009
Table 1. Parameters of LiDAR device.
Performance IndicatorsLiAir 250Li-Backpack DGC50
Laser SensorRiegl mini VUX-1UAVVLP16
Relative Precision±3 cm±3 cm
Absolute Precision±5 cm±5 cm
Measurement Rate1,000,000 pts/s640,000 pts/s
Field of View360°Horizontal 280–360° Vertical ± 90°
Scanning Distance3–250 m120 m
PhotoForests 16 01550 i001Forests 16 01550 i002
Table 2. Information on tree species in the study area.
SpeciesNumber of TreesDBH/cm
MinimumMaximumAverage
Cinnamomum camphora (L.) J.Presl.2087.857.229.9
Liriodendron chinense (Hemsl.) Sarg.1078.748.328.1
Metasequoia glyptostroboides Hu & W. C. Cheng516.835.918.1
Prunus serrulata Lindl.439.021.615.6
Trachycarpus fortunei (Hook.) H. Wendl.309.126.715.7
Albizia julibrissin Durazz.2114.954.930.4
Triadica sebifera (L.) Small1512.840.419.7
Lagerstroemia indica L.147.515.211.7
Cedrus deodara (Roxb. ex D. Don) G. Don132750.336.1
Juniperus chinensis L. 139.645.530.0
Salix babylonica L.1315.771.039.6
Ulmus pumila L.911.831.221.8
Liquidambar formosana Hance812.324.017.6
Ginkgo biloba L.711.026.419.6
Magnolia grandiflora L.417.727.723.0
Prunus cerasifera Ehrh.314.327.620.6
Platanus orientalis L.345.759.751.6
Broussonetia papyrifera (L.) L’Hér. ex Vent.321.027.123.5
Koelreuteria paniculate Franch.214.227.120.7
Melia azedarach L.218.227.022.6
Celtis sinensis Pers.15.45.45.4
Pterocarya stenoptera C. DC.134.334.334.3
Elaeocarpus decipiens Hemsl.131.231.231.2
Table 4. Individual tree recognition results of different tree species.
SpeciesNrNdNcPd (%)Pr (%)F (%)
Cinnamomum camphora (L.) J.Presl.30132127485.3691.0388.10
Liriodendron chinense (Hemsl.) Sarg.16617115490.0692.7791.39
Metasequoia glyptostroboides Hu & W. C. Cheng72726894.4494.4494.44
Prunus serrulata Lindl.56595389.8394.6492.17
Trachycarpus fortunei (Hook.) H. Wendl.80817592.5993.7593.17
Albizia julibrissin Durazz.29312683.8789.6686.67
Triadica sebifera (L.) Small23381744.7473.9155.74
Lagerstroemia indica L.24252392.0095.8393.88
Cedrus deodara (Roxb. ex D. Don) G. Don411181714.4141.4621.38
Juniperus chinensis L. 13141285.7192.3188.89
Salix babylonica L.27981414.2951.8522.40
Ulmus pumila L.910880.0088.8984.21
Liquidambar formosana Hance999100.00100.00100.00
Ginkgo biloba L.777100.00100.00100.00
Magnolia grandiflora L.45360.0075.0066.67
Prunus cerasifera Ehrh.333100.00100.00100.00
Platanus orientalis L.333100.00100.00100.00
Broussonetia papyrifera (L.) L’Hér. ex Vent.67571.4383.3376.92
Koelreuteria paniculate Franch.161616100.00100.00100.00
Melia azedarach L.22150.0050.0050.00
Celtis sinensis Pers.111100.00100.00100.00
Pterocarya stenoptera C. DC.444100.00100.00100.00
Elaeocarpus decipiens Hemsl.111100.00100.00100.00
All Tree897109679472.45%88.5279.68
Table 5. DBH fitting accuracy of tree species.
SpeciesP (%)R2RMSE (cm)rRMSE (%)
Cinnamomum camphora (L.) J.Presl.93.190.9472.247.45
Liriodendron chinense (Hemsl.) Sarg.95.110.9601.816.44
Metasequoia glyptostroboides Hu & W. C. Cheng94.380.9711.156.38
Prunus serrulata Lindl.94.840.7750.955.67
Trachycarpus fortunei (Hook.) H. Wendl.90.100.9041.9212.36
Albizia julibrissin Durazz.90.680.9593.4510.95
Triadica sebifera (L.) Small95.260.9541.015.50
Lagerstroemia indica L.93.420.8960.817.26
Cedrus deodara (Roxb. ex D. Don) G. Don93.820.8592.356.70
Juniperus chinensis L.95.180.9881.294.23
Salix babylonica L.93.490.9942.797.63
Ulmus pumila L.84.130.8193.4914.56
Liquidambar formosana Hance91.700.7731.9010.07
Ginkgo biloba L.92.340.9611.617.67
Magnolia grandiflora L.95.890.9741.165.06
Table 6. Carbon storage of different tree species.
SpeciesNrAverage Carbon Storage per Plant (kg)Carbon
Storage (kg)
Cinnamomum camphora (L.) J.Presl.301174.852,621
Liriodendron chinense (Hemsl.) Sarg.166222.736,971
Metasequoia glyptostroboides Hu & W. C. Cheng72201.014,474
Prunus serrulata Lindl.5633.51878
Trachycarpus fortunei (Hook.) H. Wendl.8057.94633
Albizia julibrissin Durazz.29100.22907
Triadica sebifera (L.) Small2339.6911
Lagerstroemia indica L.2440.9981
Cedrus deodara (Roxb. ex D. Don) G. Don4136.01476
Juniperus chinensis L. 1382.41071
Salix babylonica L.271256.633,928
Ulmus pumila L.972.6653
Liquidambar formosana Hance978.7708
Ginkgo biloba L.777.9545
Magnolia grandiflora L.482.5330
Prunus cerasifera Ehrh.348.0144
Platanus orientalis L.3466.01398
Broussonetia papyrifera (L.) L’Hér. ex Vent.6330.31982
Koelreuteria paniculate Franch.16345.15521
Melia azedarach L.256.0112
Celtis sinensis Pers.14.04
Pterocarya stenoptera C. DC.467.5270
Elaeocarpus decipiens Hemsl.182.082
All tree897182.4163,601
Disclaimer/Publisher’s Note: The statements, opinions and data contained in all publications are solely those of the individual author(s) and contributor(s) and not of MDPI and/or the editor(s). MDPI and/or the editor(s) disclaim responsibility for any injury to people or property resulting from any ideas, methods, instructions or products referred to in the content.