Article

Long-Term Changes in the Structural and Functional Composition of Spruce Forests in the Center of the East European Plain

1
Institute of Geography, Russian Academy of Sciences, Staromonetniy Pereulok 29, Moscow 119017, Russia
2
Institute of Forest Science, Russian Academy of Sciences, Uspenskoe 143030, Russia
3
A.N. Severtsov Institute of Ecology and Evolution, Russian Academy of Sciences, Leninsky Ave. 33, Moscow 119071, Russia
4
Sergeev Institute of Environmental Geoscience of the Russian Academy of Sciences, Ulansky Pereulok 13, Building 2, Moscow 101000, Russia
*
Author to whom correspondence should be addressed.
Forests 2025, 16(10), 1526; https://doi.org/10.3390/f16101526
Submission received: 26 August 2025 / Revised: 23 September 2025 / Accepted: 26 September 2025 / Published: 29 September 2025
(This article belongs to the Special Issue Features of Forest Stand Structure Under Changing Conditions)

Abstract

Norway spruce (Picea abies (L.) H. Karst.) is a primary forest-forming species in the European part of Russia, both in terms of its distribution and economic importance. A number of studies indicate that one of the reasons for the disturbance of spruce forests is linked to rising temperatures, particularly the detrimental effects of extreme droughts. The aim of our research is to identify changes in the structural and functional organization of mature spruce forests at the center of the East European Plain. The study was conducted in intact spruce forests using resurveyed vegetation relevés within the Smolensk–Moscow Upland, with relevés repeated after 40 years (in 1985 and 2025). Changes in structural and functional parameters of spruce communities were analyzed. The results showed that significant disturbances of the tree layer led to changes in the vegetation of subordinate layers, as well as the successional dynamics of spruce forests. It was found that following the collapse of old-growth spruce stands, two types of secondary succession developed: (1) with the renewal of spruce and (2) with active development of shrubs (hazel and rowan) and undergrowth of broadleaved species. It was also demonstrated that the typological diversity of the studied communities changed over 40 years not only due to the loss of the tree layer and the formation of new “non-forest” types but also because several mixed spruce-broadleaved communities transitioned into broadleaved ones, and pine–spruce communities of boreal origin shifted to nemoral types. An analysis of the complete species composition of spruce forests based on Ellenberg’s scales scoring revealed changes in habitat conditions over the 40-year period. A noticeable trend was an increase in the proportion of thermophilic and alkaliphilic species, indicating a shift toward a nemoral vegetation spectrum. It is expected that under the current forest management regime, the next 40 to 60 years will see a decline in the proportion of spruce within mixed stands, potentially culminating in the complete collapse of monospecific spruce forests in the center of the East European Plain.

1. Introduction

The majority of studies on the plant communities transformation have indicated progressive rates of species diversity reduction [1,2,3]. A “toxic” increase in species richness in certain regions has been documented, led by the invasion of alien species and loss of native species [4,5]. Changes in species composition are typically the result of structural and functional disturbances of forest communities due to natural and/or anthropogenic causes [6,7]. The data increasingly indicate cascading effects of climate change on forest communities [8]. Natural forest disturbances, such as wildfires, windfalls, and pest outbreaks, are becoming more frequent and severe due to climate change or land-use change [9].
The functional properties of species assemblages in forest communities are an additional aspect of biodiversity [9]. They provide a better understanding of the ecological consequences of disturbances or successional dynamics of communities [10]. Functional properties are a set of ecological properties of species that determine the nature of plant growth and development, as well as its responses to environmental conditions [11]. The grouping of species communities by functional traits is a long-standing idea recently applied to various ecological tasks [12,13].
Norway spruce (Picea abies (L.) H. Karst.) is one of the main forest-forming species in the European part of Russia, both in terms of its distribution and economic importance. In the hemiboreal zone (mixed forests), stands dominated by spruce are formed under the centuries-old human activity (logging, land plowing, fires, and silviculture in the modern era of forestry).
Repetitive vegetation monitoring in permanent relevés is a widely used method for assessing changes in plant communities [6,14,15,16]. The importance of long-term research in old-growth forests is consistently emphasized in relevant reviews [17,18,19]. Most of these studies place great importance on the issues of successional dynamics in mature communities. However, identification of such forest areas is complicated even within specially protected territories.
The forest cover of the Moscow region stands out against the background of neighboring territories with a greater representation of intact forests of natural origin due to the prohibition of large-scale industrial logging and the protective status of forests. This fact is a unique opportunity to study the peculiarities of autogenous successional dynamics of zonal forests. Therefore, the history and dynamics of rare old-growth spruce forests of the 19th and 20th centuries are of great interest to understand the potential of their preservation.
In the current study, we suggest a hypothesis of the critical state of old-growth spruce forests in the center of the East European Plain, the decline of which is escalating each year due to global climate change. The aim of our study is to identify the patterns of the structural and functional composition changes in mature spruce forests by repeating relevés after 40 years. The study area is the Moscow region, which is representative of the center of the East European Plain. The results allow us to identify dynamic trends of spruce forests and to forecast their further development in the territory of the East European Plain.

2. Materials and Methods

2.1. Study Area

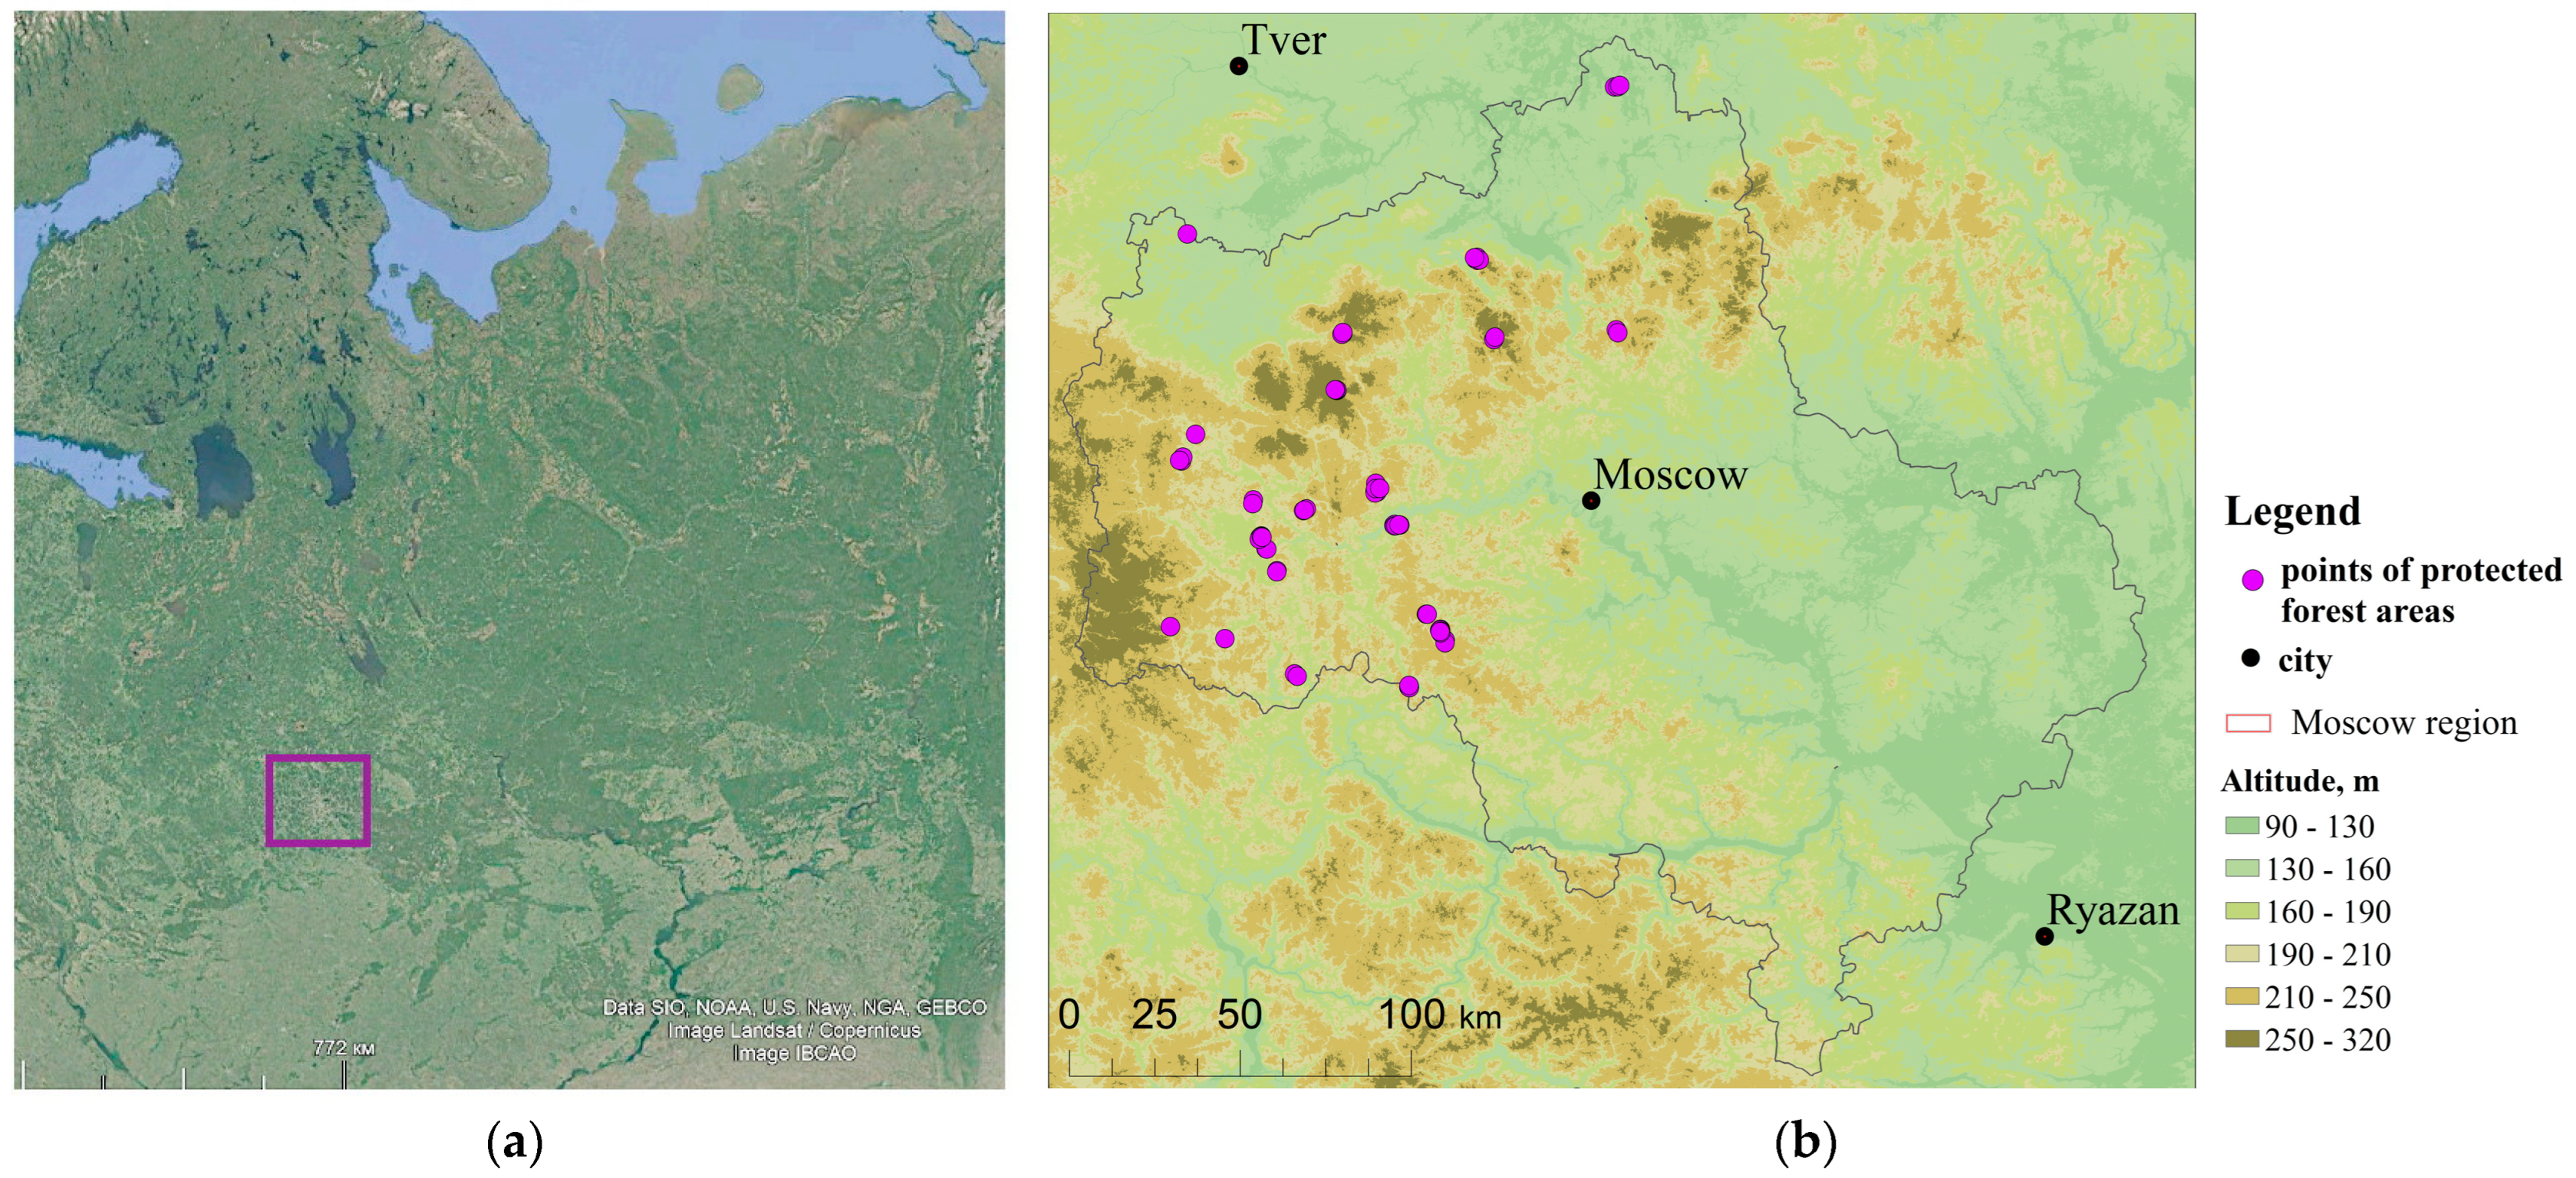
The study area is located in the central part of the East European Plain (54°12′–56°55′ N, 35°10′–40°15′ E) and covers about 4.7 million ha (Figure 1). The average annual air temperature is 2.7–3.8 °C, and precipitation is 560–640 mm [20]. The terrain of the area is gently hilly, with elevations ranging from 90 to 320, averaging 174 m a.s.l., and an average slope of 2.06° (0–30.9°). According to the geobotanical zoning delimitation, the study area is located in the boreal–nemoral forest zone, passing into nemoral forest and further into the forest–steppe zone in the southeast, where agricultural lands occupy most of the territory [21]. Detailed characteristics of Norway spruce forests in this area are given in comprehensive publications [21,22].
Geobotanical relevés are located within the Smolensk–Moscow Upland (Figure 1). Here the proportion of spruce forests is maximum (38%). The territory is located on upland with underlying moraine, moraine-water-glacial and lake-water-glacial loamy, sandy loam, and sandy sediments. Soils are mainly podzols and gleyic podzols. Relevés are located in mesophitic habitats of automorphic terrain positions in the watershed.
The central part of the East European Plain and the study area has a long history of land use. Forests are cut down and plowed, and in certain periods the forest area amounted to about a quarter of the territory. The forest cover in the MR has nearly doubled due to silvicultural efforts since the beginning of the 20th century. Additionally, as former agricultural lands are converted into fallow lands, natural reforestation is actively underway. Currently the forest cover in the MR exceeds 50%, with no primary forests remaining [23,24]. Most of the forests are old-growth and second-growth. They are similar to primary forests in terms of tree and undergrowth composition but significantly younger. As a result, the forest cover in the MR is represented by a successional mosaic of forests with varying composition, age, and origin. Coniferous and mixed forests include a significant proportion of silviculture [25].

2.2. Data Acquisition

The research was conducted in strict scientific forest reserves with official conservation status in two periods: the 1980s (I dataset (d.s.)) and 2024–2025 (II d.s.). Primary 70 vegetation relevés were carried out in I d.s. All relevés were resurveyed in II d.s. (Figure 1). Main attention was given to closed natural old-growth stands with no signs of human activity at that time. These were intact, closed old-growth forests with spruce dominance (Picea abies) and admixture of lime (Tilia cordata), oak (Quercus robur), maple (Acer platanoides), and other species, with a predominant stand age of 80–100 years. The studied communities belonged predominantly to the Querco-Fagetea class, although many vegetation types were on the border between the Querco-Fagetea and the Vaccinio-Piceetea [26].
In order to confirm the natural origin of these forest areas, we analyzed historical maps of the XIX century [27,28,29] and aerial photographs of the 1960–80s–CORONA images (April 1962, January 1965, November 1968, January 1972, February 1972, February 1976). Most of the images have a spatial resolution of 2–5 m. Winter images provide clear differentiation of coniferous and leaved forests.
The TerraClimate database [30] was used to assess changes in climate conditions. The data was prepared in the Google Earth Engine. The mean values for each pixel for the growing season (April–August) in the area where the relevés are compiled were calculated. Changes in maximum temperatures, precipitation, and water deficit were assessed for two decades: 1875–1985 and 2014–2024.
The relevés were carried out within plant communities, homogeneous in terms of general floristic composition, composition of dominants of each layer, community structure, and habitat conditions, on an area of 400 square meters using standard data entry forms [31], according to standards of the “European vegetation survey” [32] and the European Vegetation Archive database. The composition and structure of the canopy, including projected crown cover, average height of adult trees, and understory, were assessed. The complete species composition of the shrub, herb-dwarf shrub, and moss layers was determined, and the percent projective cover (PC) was estimated.
Elevation data for relevés were obtained from topographic maps and GPS data. Plant names of vascular species are given according to [33], mosses according to [34].
Figure 1. Study area (a) and layout of protected forest areas, according to [35] (b).
Forests 16 01526 g001

2.3. Data Analysis

Changes in all vegetation layers were analyzed by comparing data obtained after 40 years. The following abbreviations were used for different layers: A—tree layer, B—understory (B1) and shrubs (B2) (1–10 m high), C—herb-dwarf shrubs layer (below 1 m), and D—moss layer.
Patterns of projective cover (PC) and abundance change were assessed by comparing mean PC values between datasets I and II, including null values. The significance of changes in community species composition and abundance was compared using the Mann–Whitney U test, which is appropriate when the sample size is small and does not fit normal distribution (Table A1). The linear relationship between PCs of considered forest-forming species was evaluated by gamma correlation. Correlation between PCs and morphometric variables was evaluated by Spearman’s rank correlation coefficient. These calculations were carried out in Statistica 12 software. The sample size (n) for all species was 70, including the sites where species were absent.
The consequences of structural disturbances in communities were manifested in the change in functional groups of plants united by similarity of response to changes in environmental conditions. Such indicators as the composition of ecological and cenotic groups (ECG) and species activity (A) are used for generalized relevés of plant communities, their classification, and successional status. The assignment of species to ECGs was performed according to the method [36], including diagnostic species for the compared community types in the Braun-Blanquet approach [37]. The following groups were applied: Br (boreal, including boreal shrubs, boreal small herbs, and species of boreal green mosses), Nm (nemoral broadleaved herbs, including species of mosses of nemoral communities), NW (nitrophilic-wet), Md (meadow), Eg (edge-herb), and Ad (adventive). Meadow, edge, and adventive groups are rare and are usually considered together as meadow–edge groups.
The functional significance of species was assessed in terms of the composition of all community layers using the species activity index (A) [38]:
A   =   F · D
where F is the relative occurrence of the species at all sites in the set of relevés, D is the average value of species abundance (%) for the sites where the species was recorded. Sites where the species was present were considered. Prospects for spruce regeneration were assessed by the dynamics of abundance of tree and shrub species present at different stages of the study.
Typology of relevés was carried out using the ecological–phytocoenotic approach [24]. Community types were distinguished based on the representation of ecological–phytocenotic groups (ECGs) of species of subordinate layers and the dominant tree species. Linear stepwise discriminant analysis (LDA) was used in IBM SPSS Statistics 12 to test the typology.
Nonmetric multidimensional scaling (NMDS ordination) was used to interpret species composition of community types in two time periods (I and II d.s.), using the square root transformation, the Wisconsin double standardization, and the Bray–Curtis distance. The differentiation of the community types was studied based on the composition and abundance of species of the main layers in different combinations. The indirect ordination method allowed us to visualize the differences between community types in terms of environmental gradients. Ellenberg scale values were evaluated for each relevé during ordination and interpretation of the axes. The indicator values for light (L), soil mineral nitrogen richness (N), soil reaction (R), and soil moisture (M) using the full list of species and weighted by species cover were calculated in the Juice 7 software [39,40,41]. Correlation of ordination axes with ecological characteristics of relevés was displayed by means of the length and direction of vectors of ecological factors, as well as the degree of their correlation with the axes. In this way, the values of factors for each relevé were obtained when assessing the distribution of forest communities in the ecological space in different years of research.

3. Results

Historical cartographic materials indicated that 69% of the studied forest reserves had been forested for at least 300 years, on 28% of relevés the forests emerged about 250 years ago, and only 3% of relevés the forests were less than 200 years old. Remote sensing data from the 1960s and 1980s confirmed the absence of significant disturbance after 1945.

3.1. Changes in Structural and Functional Properties in Spruce Forests

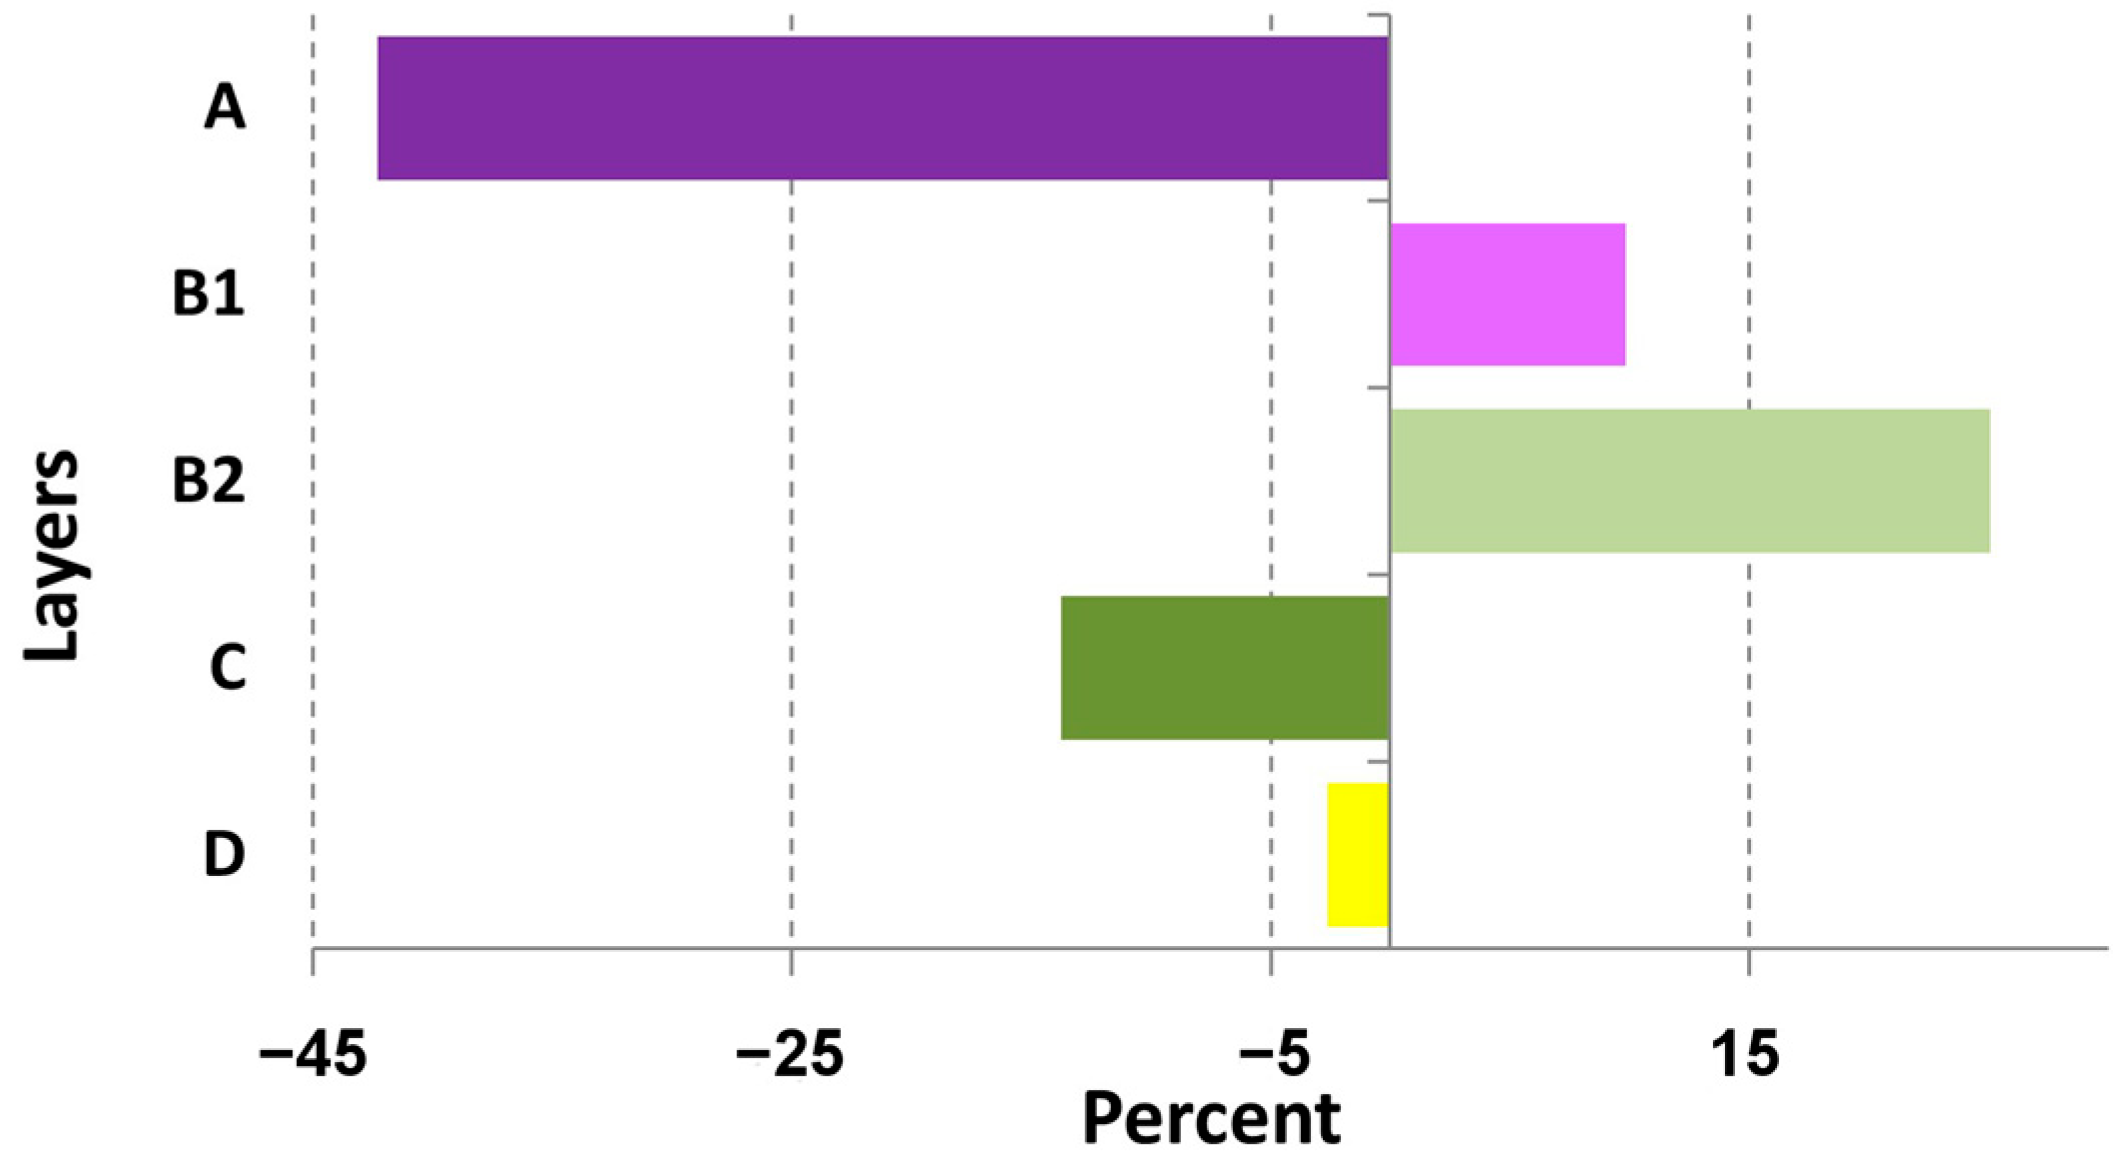
Changes in the general patterns of spruce communities’ structure over the 40-year period are the disruption of stand layer structure of the stand and changes in the species composition of forest-forming species of the tree and shrub layer (Appendix B, Figure A1a–f). Redistribution of the abundance of plants forming the main structural layers of spruce communities is evident (Figure 2). It is noticeable that the tree layer (A) cover decreased by 2.5 times, and the understory (B1) and shrub (B2) layers cover increased twofold. Less significant change is lower layers (C and D) cover decrease. All differences were significant (at p < 0.05) (Table 1).
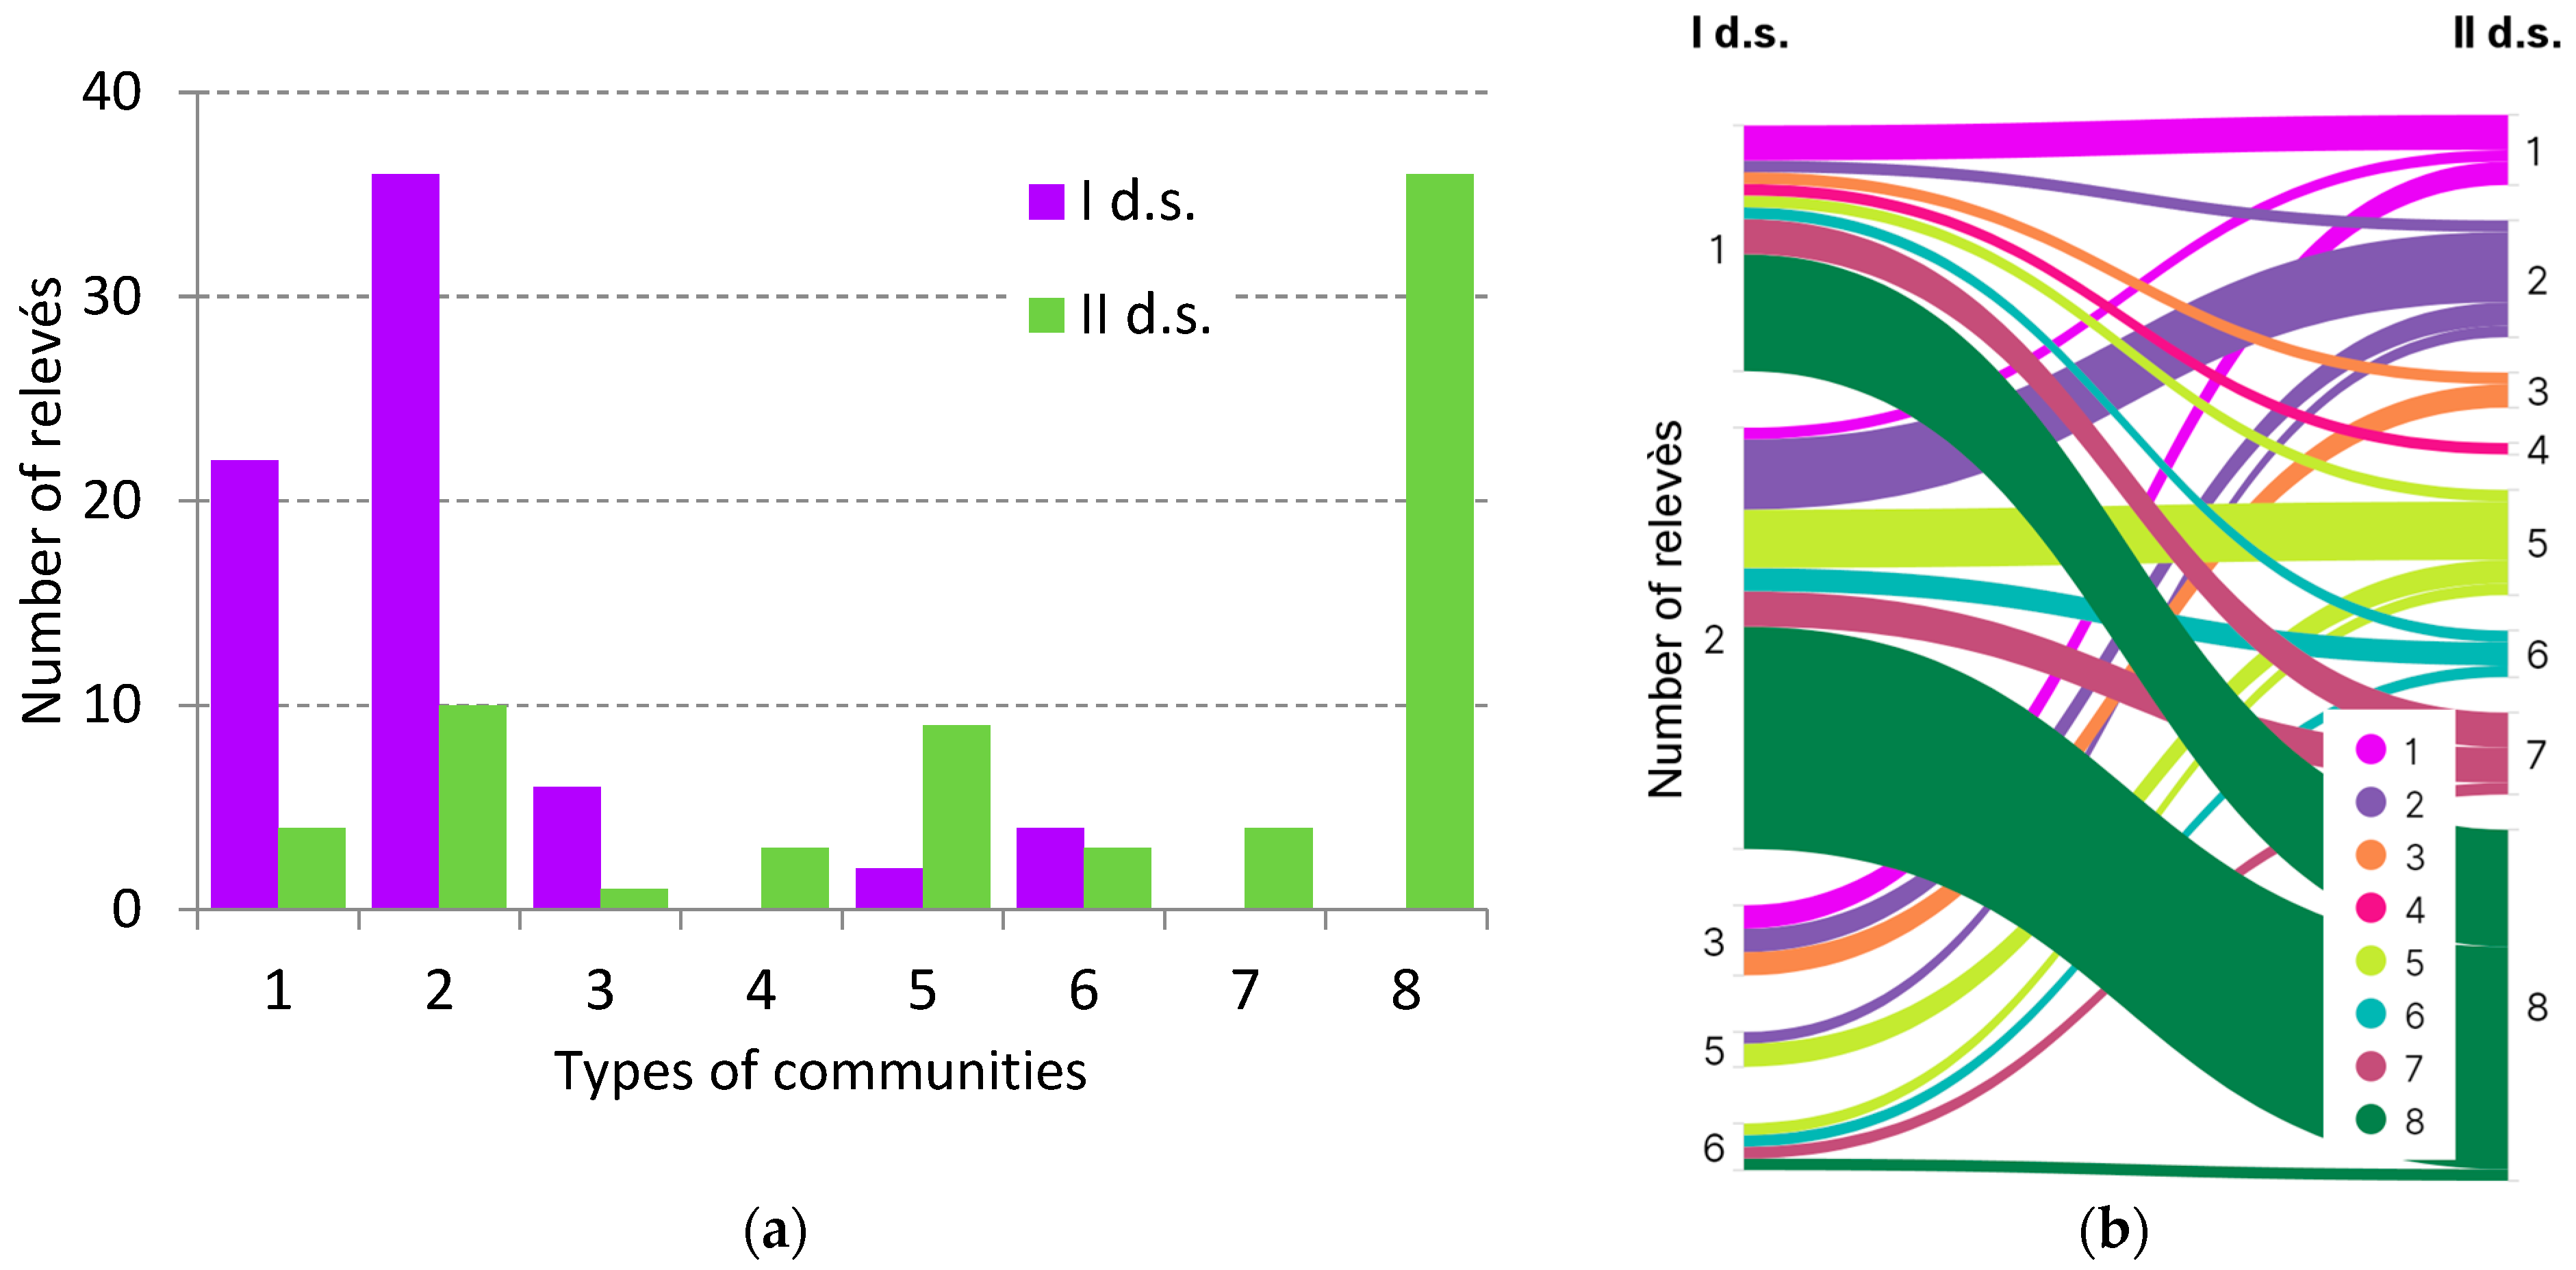
The typological composition of spruce forests has also changed (Figure 3a). The disintegration of the tree layer in spruce forests caused a change in the set of community types. Five community types were identified in I d.s., and eight in II d.s. There was an increase in typological diversity through the appearance mainly of two new types—with disintegrated tree layers (7 and 8) in place of boreal and nemoral spruce forests (1, 2). In the first case, active regeneration of spruce was observed mainly in point of relevés of boreal (type 1) and nemoral spruce forests (type 2) (Figure 3b). The composition of communities in destroyed spruce forests (type 8) with regeneration of hazel (Corylus avellana) and rowan (Sorbus aucuparia) under the canopy of linden (Tilia cordata) and maple (Acer platanoides) was formed mainly from nemoral (type 2) and, to a lesser extent, boreal spruce forests (type 1). Several relevés of nemoral pine–spruce forests (4) were recorded at the point of the spruce boreal type (1).
Detailed structures of tree layers and diagnostic species of herb-dwarf shrubs and moss layers for the identified forest types are given below (Table 2). The results of LDA showed different accuracy for the selected types. The overall accuracy of the field relevés typology was 90.0% (Table A3).

3.2. Changes in Common Patterns of Tree and Shrub Layers

Let us consider in more detail the main changes in the tree and shrub layers that determine the redistribution of habitat-forming conditions (light, moisture, and nutrients) for plants of lower levels. Drastic changes are noticeable between the composition and structure of vegetation of the upper layers. The main changes are the decrease in the tree layer cover, dominated by Picea abies, and the increase in the shrub layer cover, dominated by Corylus avellana and Sorbus aucuparia (Figure 2).
The decrease in the total cover of the tree layer was not only due to the loss of Picea abies (2.5-fold), but also due to the loss of Betula sp. (5-fold), Populus tremula, Pinus sylvestris, and disappearance of Alnus incana. The loss of these species is a natural process associated with overmaturity (100 years and more). In contrast, the participation of Quercus robur has slightly increased (Table 3).
The cover of understory tends to increase (Table 4). During the study period, Picea abies understory increased more than 3-fold, indicating a recovery process as a form of secondary succession and potentially successful regeneration in place of decayed stands. Acer platanoides and Quercus robur increased yet more, indicating potential for spruce-broadleaved stands in the future.
The shrub layer was poorly represented in old-growth spruce forests (Table 5). The predominant species (in descending order) were Corylus avellana, Sambucus racemosa, Sorbus aucuparia, and Frangula alnus; the participation of other species was almost negligible. The most significant structural change is the fivefold coverage increase in C.avellana (from 5.7 to 26.36% to 80%–90% in some communities). In many cases hazel shrub communities with woody undergrowth were formed in place of old-growth spruce forests. There is also a tendency of cover increase in rowan (Sorbus aucuparia) and elderberry (Sambucus racemosa) to a lesser extent. Other species under the overgrown hazel canopy have decreased their participation.
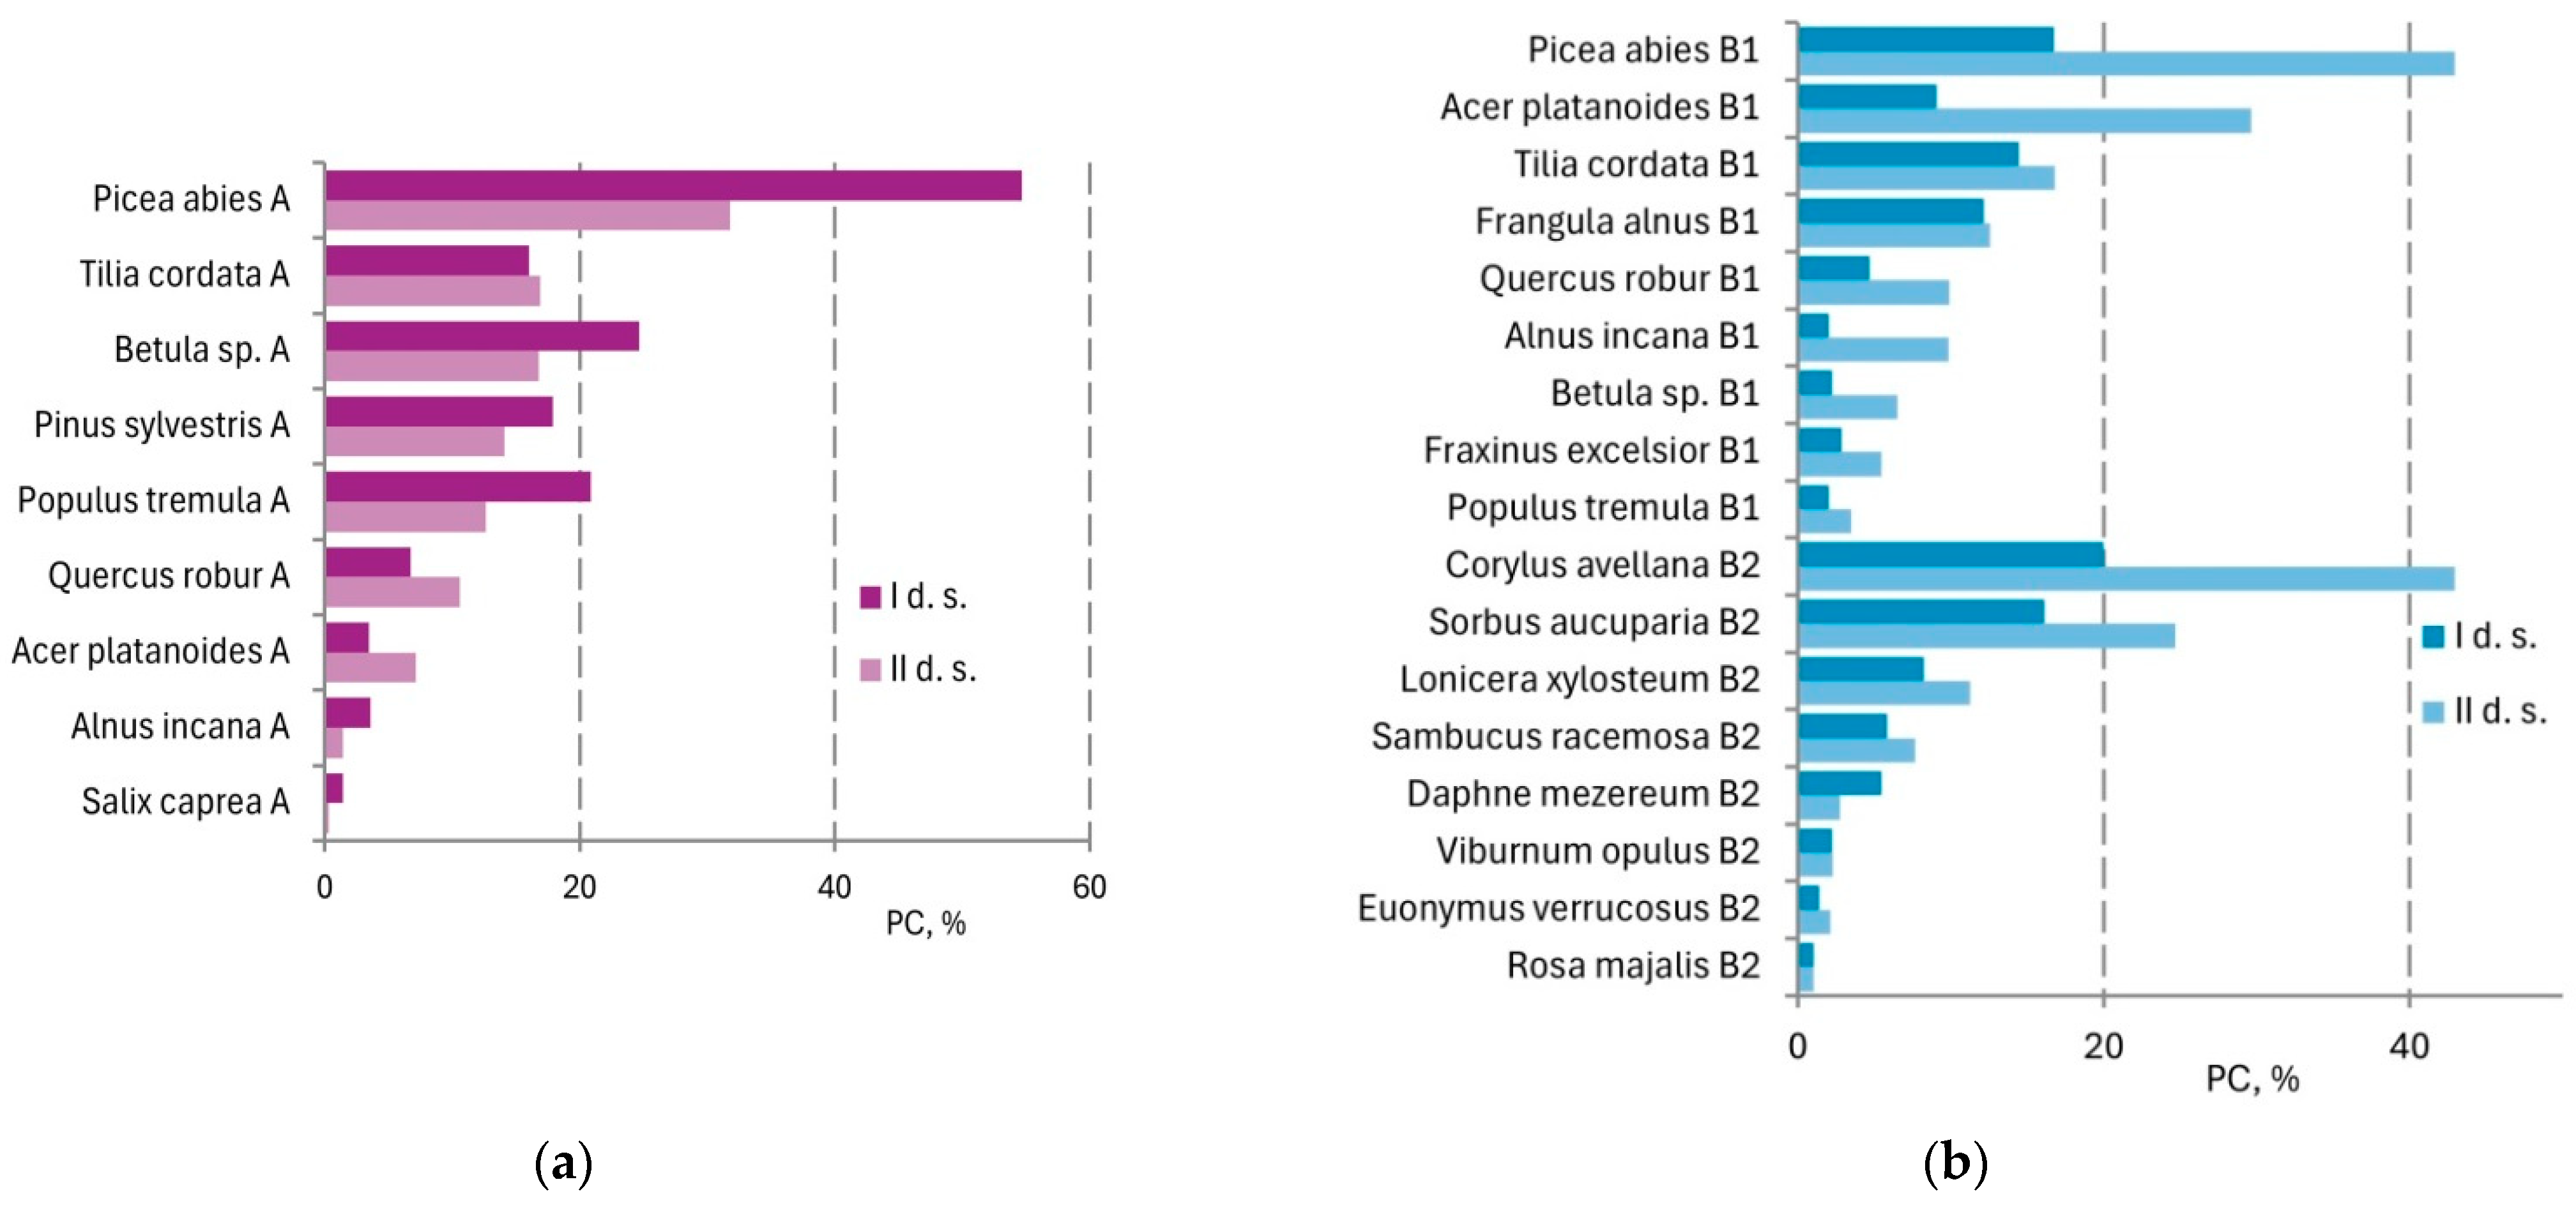
Structural reorganization of the tree and understory layers was reflected in the species activity index (A) shift during the study period. A of Picea abies in the tree layer was reduced by almost half; Betula sp., Pinus sylvestris, and Populus tremula decreased to a lesser extent. At the same time, A of Tilia cordata and Acer platanoides has increased (Figure 4a). Significant changes were observed in the understory—Picea abies increased more than 2 times, and Acer platanoides 3 times. In the shrub layer, A of Corylus avellana increased more than 2 times, and Sorbus aucuparia and Lonicera xylosteum increased to a lesser extent (Figure 4b).
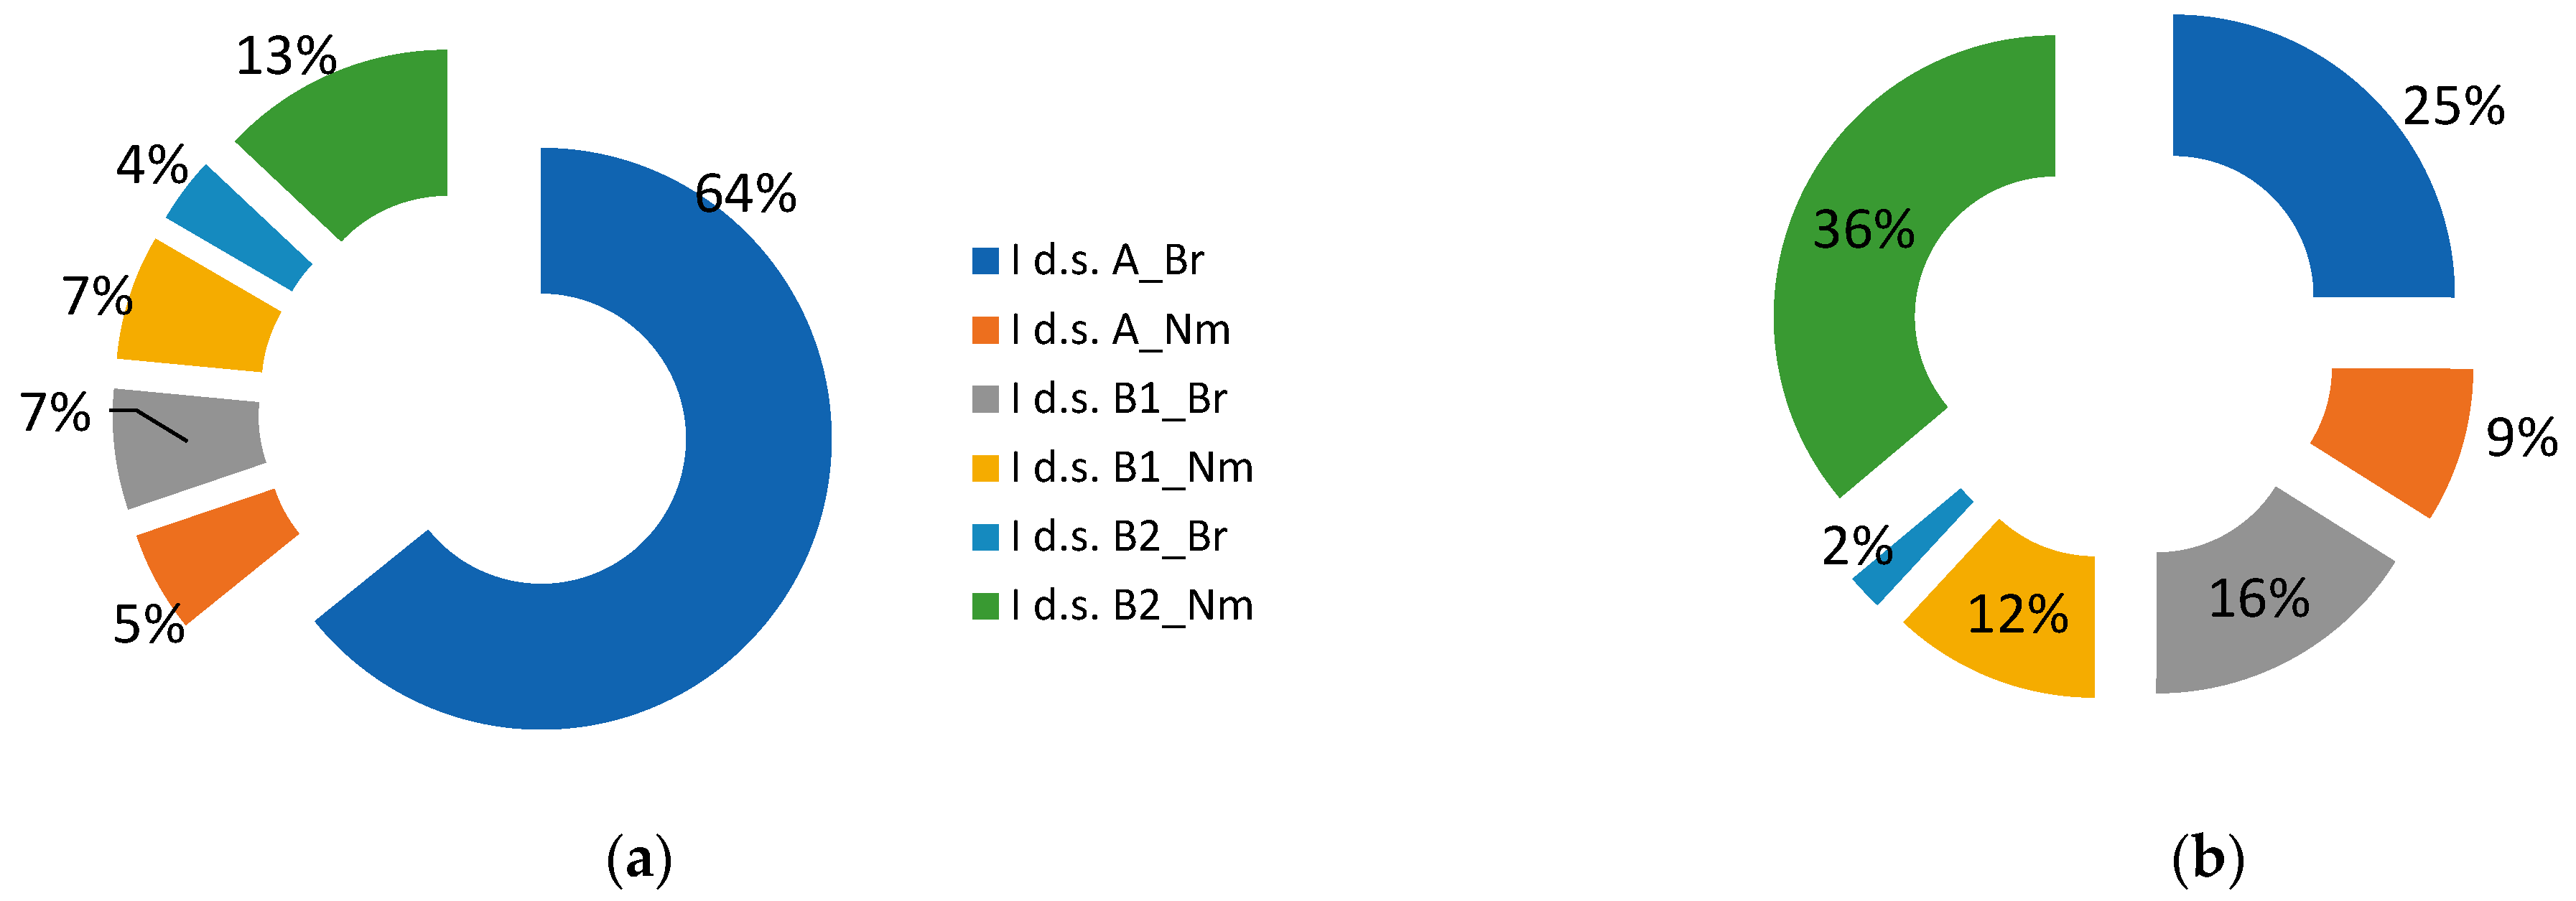
ECGs grouping allows us to assess functional shifts in tree (A), undergrowth (B1), and shrub (B2) layers. The main changes here were observed in the redistribution of species in the boreal and nemoral groups. The coverage of boreal species in the tree layer (A) decreased by 2.5 times, and coverage of the nemoral species increased by 1.5 times. The coverage of boreal species in the undergrowth layer (B1) increased by more than 2 times; coverage of nemoral species changed slightly. Significant reduction in boreal species coverage in the shrub layer (B2), nemoral species coverage increases more than 3 times (Figure 5a,b). All mentioned changes are significant at p < 0.05.
There are different trends of phytocenotic links, calculated based on gamma-correlation of abundance of the main forest-forming species in communities for two time periods (Table A2). The highest positive relationship is for Tilia cordata and Pinus sylvestris (r = 0.85, r = 0.81), and the negative correlation is for Picea abies (r = −0.44) between the study period I d.s. and II d.s. in the tree layer.
The PC of Picea abies in the main layer in II d.s. has a negative correlation with I d.s. values, indicating a reliable change in the distribution of the main forest-forming species at the relevés, while the PC of associated species remained positively correlated over the study period. This indicates that the PC of Corylus avellana and especially Acer platanoides in II d.s. were determined by the values for the previous measurement period. On the contrary, the results of comparison of Picea abies in the main layer cover between the indicators of I d.s. and II d.s. showed their relative independence, and the strong disturbance of the spruce mother layer confirms again cardinal transformations in the structure of communities.

3.3. Changes in Common Patterns in Herb-Dwarf Shrub and Moss Layers

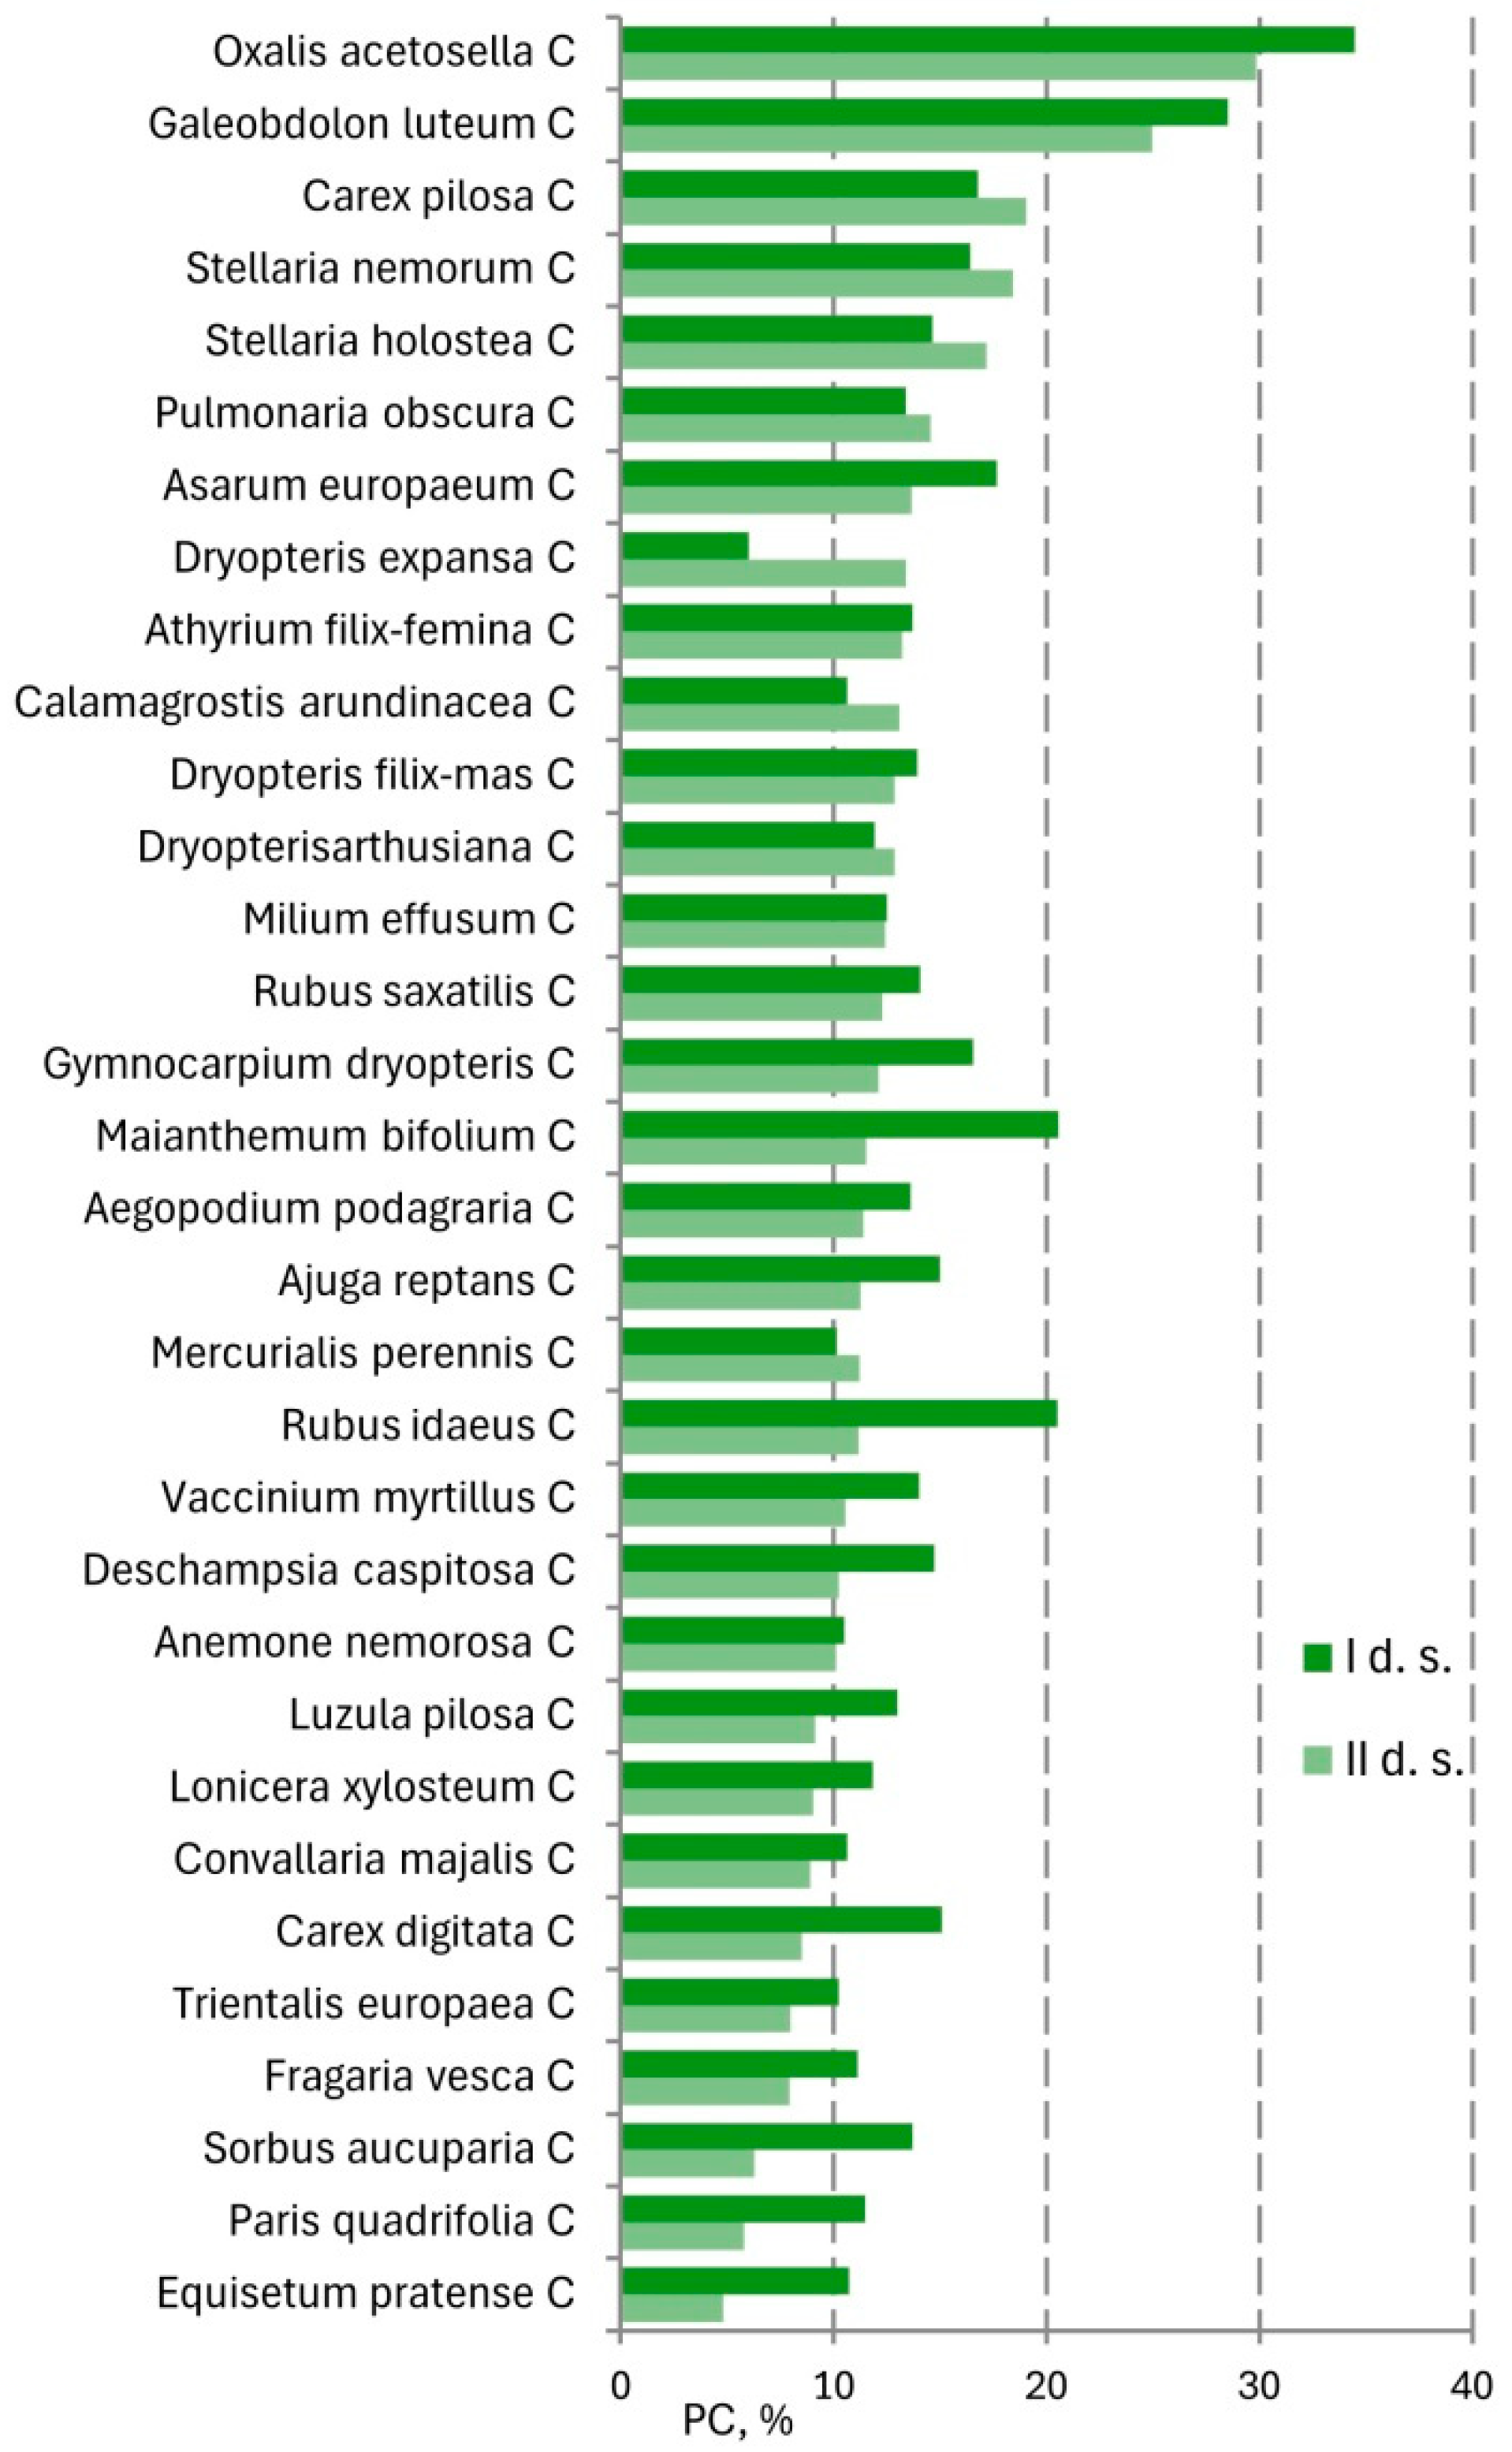
There are no drastic changes in the species composition of the herb-dwarf shrub (C) layers according to the species activity index (A). The changes were mostly related to the redistribution of species abundance while maintaining the general composition of species (Figure 6).
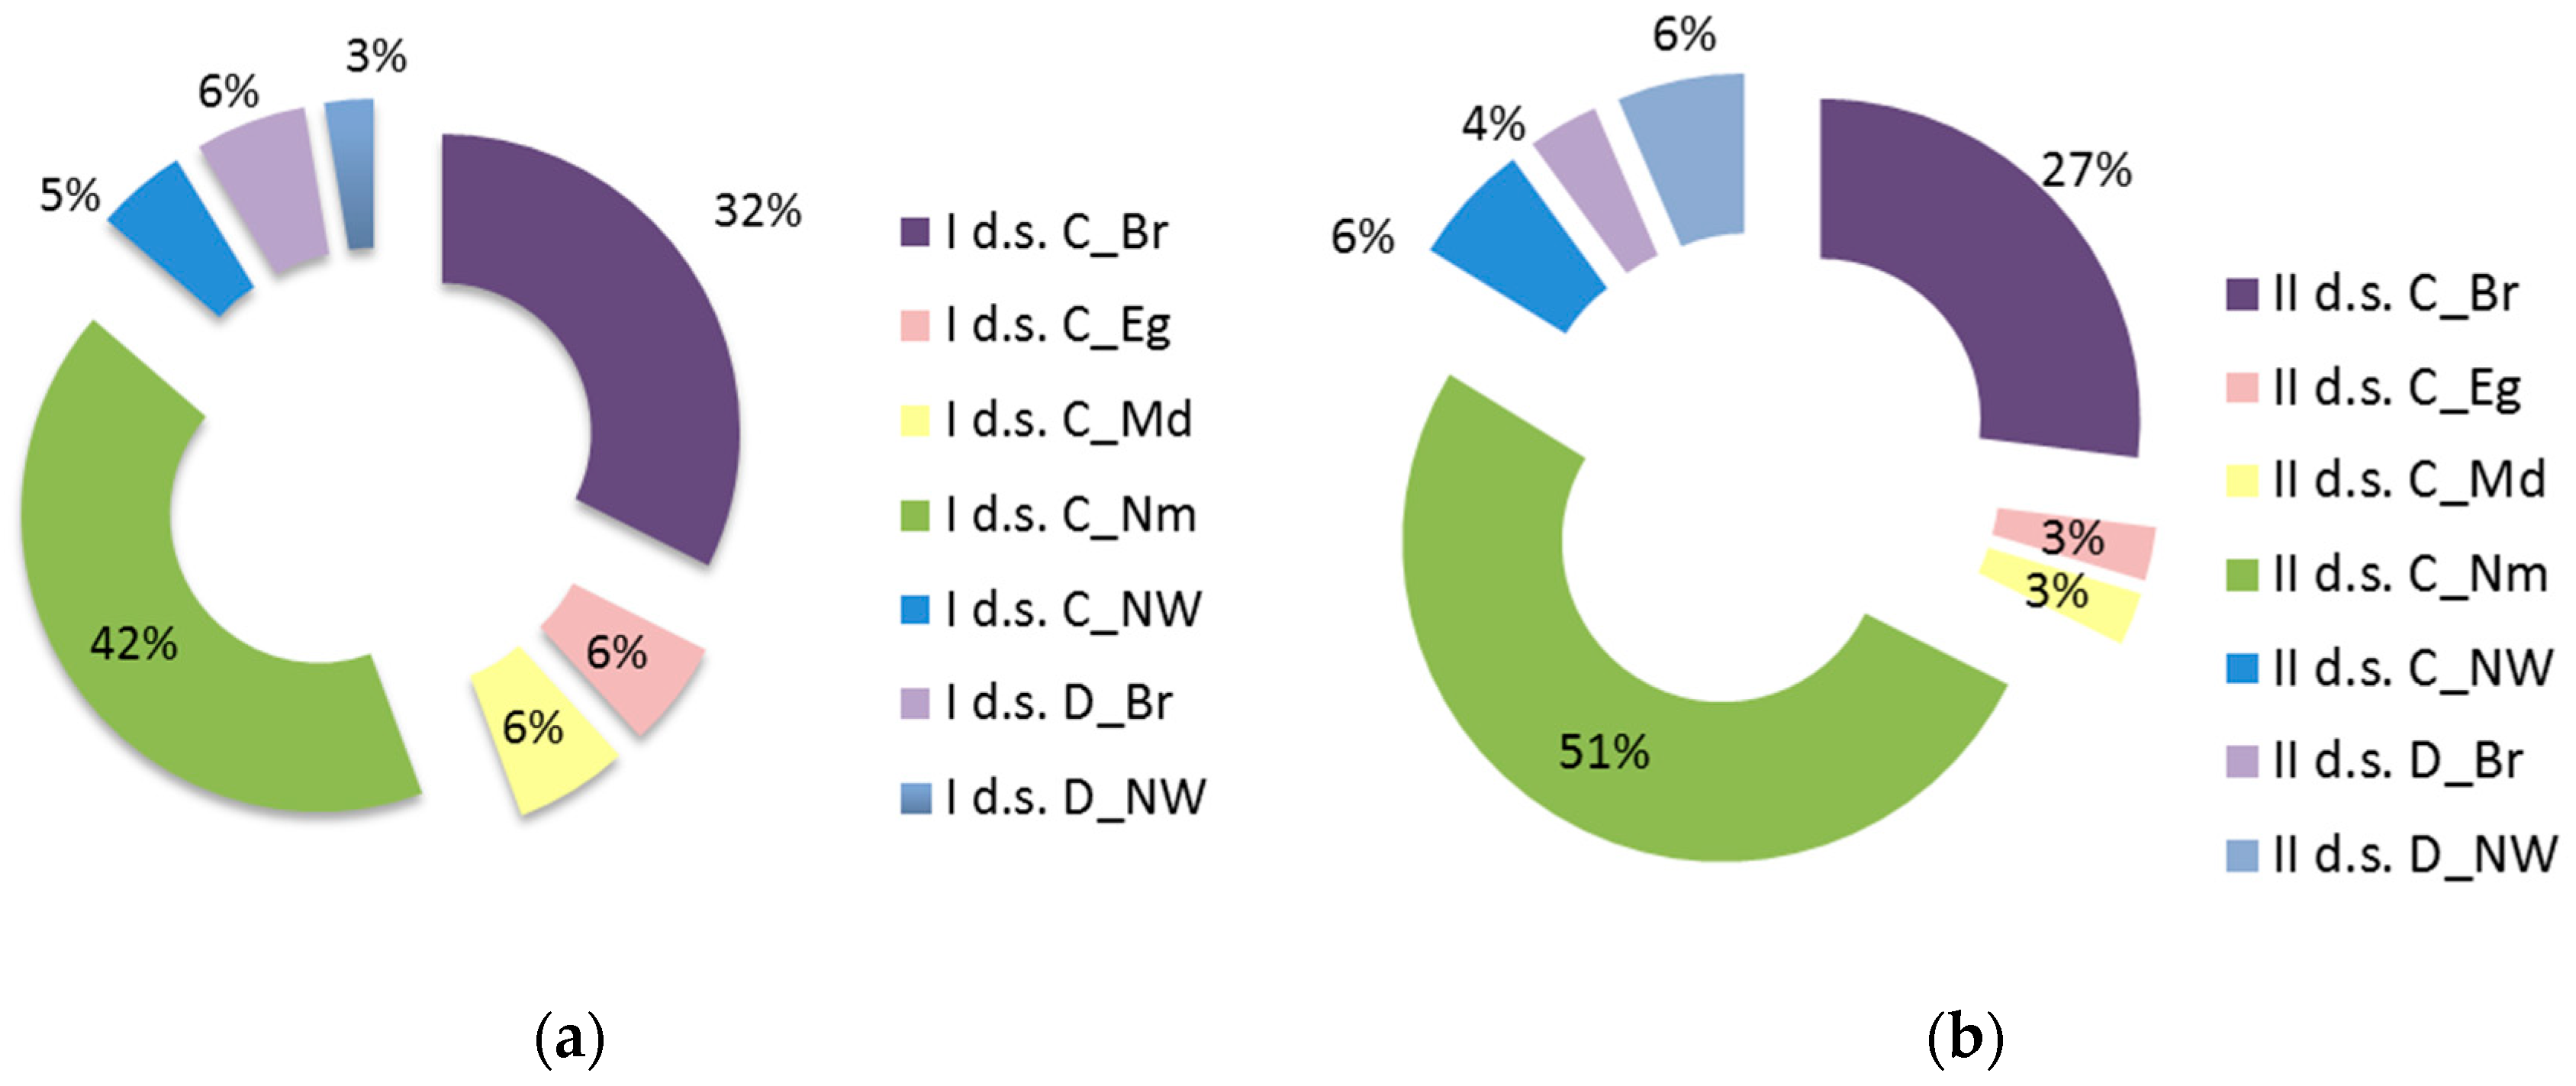
There was also a restructuring pattern in the ecological-phytocoenotic structure of herb-dwarf shrub (C) and moss (D) layers (Figure 7). A minor significant (p < 0.05) decrease in the proportion of boreal vascular species and a minor increase in nemoral species. A decrease in edge-herb (Eg) and meadow (Md) species, significant changes in boreal (Br) and edge-herb (Eg) species of the moss layer (D).

3.4. Relationship with Environmental Factors

The relationship of spruce community type’s organization with external environmental factors, in particular, climate and terrain conditions, allows us to reveal specific patterns.
The mean value of maximum temperatures of I d.s. is 17.9 ± 0.7 °C, and II d.s.—19.5 ± 0.7 °C. Precipitation accumulation of I d.s. is 69.9 ± 4.7 mm, II d.s.—65.4 ± 4.2 mm. Climate water deficit of I d.s. is 12.1 ± 2.5, II d.s.—20.6 ± 3.3. According to Mann–Whitney U tests, the differences are significant for maximum temperatures and climate water deficit, which are higher for the II d.s.
Spearman rank correlations between the indicators of forest-forming species abundance and terrain elevation, slope, and curvature were calculated. There was a significant correlation between elevation and undergrowth (B1) PC, positive: Corylus avellana (r = 0.49 in I d.s., r = 0.35 in II d.s.), Acer platanoides (r = 0.31 in I d.s., r = 0.35 in II d.s.), negative: Pinus sylvestris (r = −0.33 in I d.s., r = −0.29 in II d.s.), and Picea abies (r = −0.32 in I d.s., r = −0.36 in II d.s.). No significant relationships with slope and curvature.
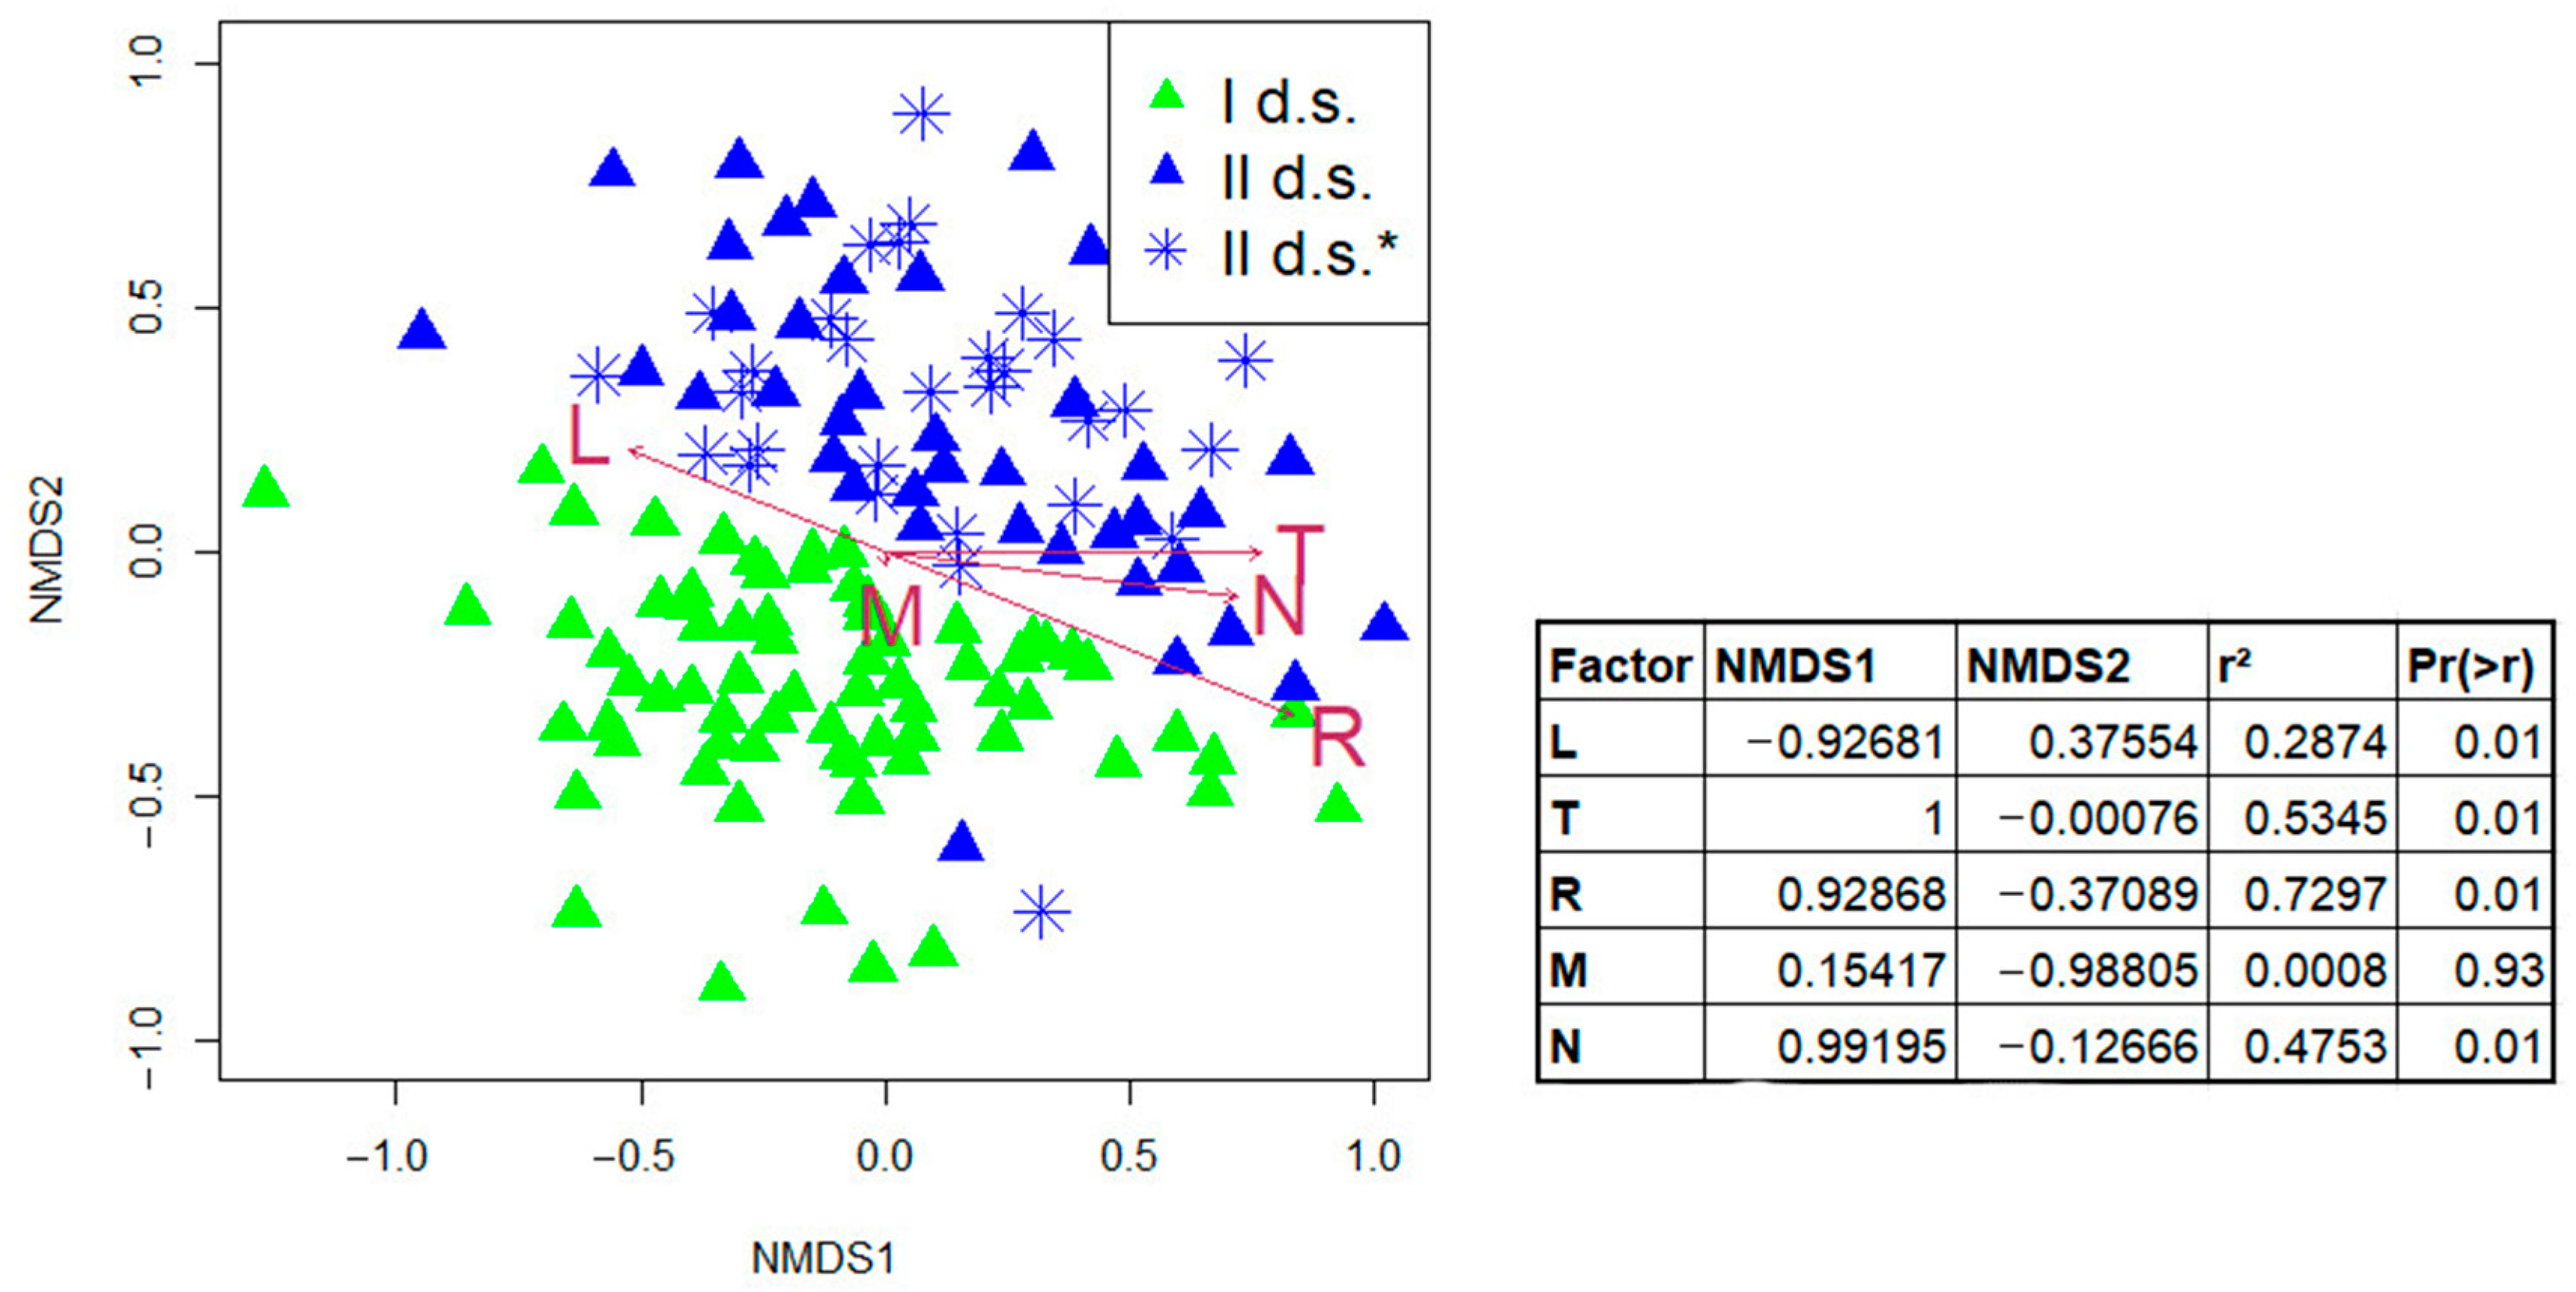
Changes in ecological conditions of habitats were assessed by linking community types to biotopic factors expressed through Ellenberg ecological scales using non-metric multidimensional scaling (NMDS ordination). Changes in light (L), temperature (T), soil reaction (R), and soil nitrogen (N) factors were associated with the first axis of variation (NMDS1). Changes in moisture content (M) and, to a lesser extent, soil reaction (R)—associated with the second axis (NMDS2). The correlations between environmental factors and ordination axes and regression coefficient (r2) are high enough, which indicates significant change in environmental factors for the studied time interval. The stress value was 0.24 when reducing the multidimensional space to a two-dimensional one.
In general, the gradient of displacement of the set of relevés in II d.s. indicated a tendency of maximum increase in the values of temperature and decrease in soil reaction, contributing to the formation of a nemoral spectrum of species. Soil reaction and moisture content were relatively “weak” factors (Figure 8).

4. Discussion

There are many cases of transformations of community composition and structure in the course of community dynamics in the literature, in which typical mosaic-cyclic processes have been described [42,43,44]. Strong winds tend to act as the main disturbance type in European temperate forests. This leads to small-scale episodic disturbances [45,46], where disturbed areas are usually reforested by highly competitive, shade-tolerant climax tree species. Outbreaks of the bark beetle Ips typographus often occurred after large windthrow events in Western Europe [47]. Mass spruce dieback in the forests of Central Russia was preceded by unfavorable climatic conditions (droughts) during the vegetation period [48,49], which weakened trees and reduced their ability to resist pests and diseases [50,51]. Observations of spontaneous dynamics of spruce forest communities in the Central Forest Reserve confirmed a similar tendency of dieback within 1–2 years as a result of recurrent meteorological anomalies, further weakening of trees, and insect pest outbreaks [52].
Our study recorded drastic changes in spruce communities within the center of the East European Plain that occurred over a period of 40 years and confirmed our assumptions. The restructuring in mature communities of natural origin is associated with the peculiarities of the formation of cenopopulations of tree species. The tree layer in mature communities is characterized by a gradual decrease in PC from the upper to the lower layers and mutual oppression of trees of younger generations. Phytocenotic significance of interaction as a differentiation factor and high competition for environmental factors (light, moisture, soil nutrients) was investigated in other studies [53,54,55]. In trees of older generations, the significance of phytocenotic factors is inferior to environmental factors, in particular, hurricane winds or sharp fluctuations in the water table. Therefore, the impact of extreme factors turns out to be the most dangerous for the largest trees of older generations [56]. In our case, such dramatic changes reflect the fact of complete or partial mortality of the mother spruce stand, including as a result of mass outbreaks of bark beetle in 1999–2003 and 2010–2013.
Two directions of secondary succession were recorded after the collapse of the mother spruce stand: (1) with restoration of Picea abies undergrowth and (2) with active development of shrubs (Corylus avellana and Sorbus aucuparia) and broadleaved undergrowth. Analysis of the sensitivity of forest-forming species to environmental conditions was used in the study of successional direction. In our study we observed a significant relationship of Picea abies, Acer platanoides, and Corylus avellana undergrowth with morphometric indicators of terrain. This is consistent with other data—boreal spruce forests are typical for flat terrain. While nemoral (complex) spruce forests with participation of broadleaved tree species are typical for convex moraine watershed plateaus [57].
It has been established that the mean annual temperature has increased over 40 years by 2 °C [58]. For spruce forests at their southern limit of distribution, such warming corresponds to a shift in the vegetation period isotherms by about 150 km to the south [59]. This leads to a transformation of the formational composition of forests. Indeed, in our study, typological diversity of the studied communities increased after 40 years not only due to the loss of the tree layer and the formation of new “non-forest” community types, but also due to the transition of a part of mixed spruce–broadleaf communities to broadleaf communities and of pine–spruce communities of the boreal type to the nemoral type. Analysis of the complete species composition of spruce forests and the ratio of species of different ECGs confirmed the general nemoralization of the composition—while the species composition as a whole remained the same, the abundance of boreal-type species in all structural layers decreased, while the abundance of nemoral species increased. The gradient of the shift in the set of modern relevés in the ecological space indicated a tendency of increasing values of temperature and decreasing soil acidity, which contributed to the formation of a nemoral spectrum of species. The increase in the proportion of nemoral species in the forests of the Moscow region has been noted already since the 1990s in other studies [60].
In this case, it is difficult to separate the interrelated effects of natural succession and climate warming, as soil enrichment and increased availability of nutrients favoring the development of the nemoral plant spectrum occur in both cases. There is evidence that complex patterns of change in species biodiversity are also observed when combining factors of abandonment of traditional management in Czech plant communities and in association with increased litter accumulation [61,62]. Both processes support stronger competitors and likely contribute to the co-evolution of vegetation [63]. In addition, climate warming may extend the growing season, contribute to biomass increases, and alter successional processes [64,65]. The results of the study of oak stands in Poland revealed different effects of an increase in air temperature of 1 °C on the two oak species (slowing down the growth of Quercus robur but improving the growth of Q. petraea) [66]. This indicates different responses of species to changing environmental conditions.
It should also be considered that the mechanisms of intra- and interspecific competition are important driving forces in the feedback loop of the structure and functioning of the stand [67,68]. Analysis of interspecific relationships in the composition of tree species in the upper and subordinate layers (undergrowth and shrubs) demonstrated significant relationships that predetermine the likely course of development of spruce communities. Thus, on the one hand, a significant positive relationship was observed between different generations of tree (Acer platanoides, Quercus robur, and Pinus sylvestris) and shrub (Corylus avellana) species at different study times; on the other hand, a negative correlation was noted between the abundance of Picea abies in the upper layer in I d.s. and II d.s. At the same time, the active development of young trees of Acer platanoides in the undercanopy space of the main layer is currently negatively associated with the formation of Picea abies undergrowth but positively with Populus tremula in the upper layer. Ecological features of the species, primarily the illumination factor, explain this picture. As a whole, the dynamics of correlation links indicate changes in the structure and interactions between species of the ecosystem between two study periods. Strengthening of positive links may indicate closer cooperation or joint response of species to environmental conditions in the process of successional dynamics. Whereas the emergence of negative links indicates competition or division of resources.
Considering the life cycles of vegetation (10–20 years for the shrub layer with understory and 40 years for the tree layer) [69], we can assume that if the protected status is maintained, over the next 40–60 years the composition of spruce forests will approach coniferous–broadleaved forests, and the latter will transition to broadleaved forests. This rate of transition of successional stages is close to the pattern of forest succession in a number of spruce and mixed (with undergrowth of Quercus robur, Tilia cordata, and Picea abies) communities in the south of the Moscow region [70]. An assessment of coniferous forest dynamics in the Moscow region based on historical Landsat images in the period from 1990 to 2020 showed that the area of spruce forests of natural and artificial origin decreased from 19.6 to 7% [23]. Thus, the total area and composition of spruce forests in the region will decrease in the future due to direct loss of spruce in mature stands of both artificial and natural origin and subsequent transition to mixed forests.

5. Conclusions

The presence of mature forests of natural origin in the Smolensk–Moscow Upland is a unique opportunity to study the peculiarities of autogenous successional dynamics of zonal forests. In this study we considered disturbances in the structural and functional organization of old-growth spruce forests over the last four decades, caused by the dieback of upper canopy trees. The initiation of this type of disturbance was a general increase in temperatures and especially extreme droughts provoking weakening of spruce stands and invasions of insect pests. Restoration of mixed and broadleaved communities through active development of Corylus avellana and Acer platanoides undergrowth in higher elevation positions with better drainage was more common. The development of a young generation of Picea abies in canopy windows with subsequent restoration of boreal-type spruce forests was observed in flat terrain forms. In general, there was an undoubted trend of nemoralization of plant species composition, confirmed by quantitative assessment of the shift in biotopic characteristics towards an increase in average temperature, decrease in soil acidity, and increase in soil fertility.
In the next 40–60 years, under the current forest management regime in the Moscow region, as well as in the center of the East European Plain, Picea abies is expected to be present as a companion species in mixed stands with a complete loss of “pure” spruce forests.
The main avenues for future research are (1) a more detailed assessment of the dynamics of species diversity of spruce communities and their derivatives; (2) identifying differences in the dynamics of natural forests in reserves and plantation forests; and (3) comparison of dynamic processes not only in spruce, but also in pine forests.
Author Contributions

Conceptualization, T.C.; methodology, T.C. and A.M.; validation, T.C., N.B., and I.K.; formal analysis, T.C., I.K., and N.B.; conducted the fieldwork, T.C., A.N., A.M., A.T., M.A., M.P., and N.B.; resources, T.C. and I.K.; data curation, T.C., N.B., and A.M.; writing—original draft preparation, T.C. and I.K.; visualization, T.C., N.B. and I.K.; supervision, T.C.; project administration, T.C. All authors have read and agreed to the published version of the manuscript.

Funding

The core of this research was conducted as part of the RSF project (№ 24-17-00120) (field research, analytical work, statistical data analysis). The research was conducted as part of the State Assignment of the IG RAS (FMWS-2024-0007) (synthesis of materials from previous and modern research).

Data Availability Statement

Research data can be obtained from the corresponding author upon request.

Acknowledgments

The authors thank the colleagues—Yuri Peterson and Lyudmila Savelyeva, who participated in geobotanical relevés in the 1980s.

Conflicts of Interest

The authors declare no conflicts of interest. The funders had no role in the design of the study; in the collection, analyses, or interpretation of data; in the writing of the manuscript; or in the decision to publish the results.

Abbreviations

The following abbreviations are used in this manuscript:
PCProjective cover
ECGEcological and cenotic group
BrBoreal
NmNemoral
NWNitrophilic-wet
MdMeadow
EgEdge-herb
AdAdventive
NMDSNon-metric multidimensional scaling
LLight
NNitrogen richness
RSoil reaction
MSoil moisture
d.s.dataset
LDALinear discriminant analysis

Appendix A

Table A1. Tests of normality.
VariableMax DK-SLillieforsWp
Layers
I d.s. A0.210137p < 0.01p < 0.010.9122740.000123
I d.s. B10.257900p < 0.01p < 0.010.7784250.000000
I d.s. B20.232442p < 0.01p < 0.010.7414670.000000
I d.s. C0.246644p < 0.01p < 0.010.7930780.000000
I d.s. D0.331663p < 0.01p < 0.010.6413380.000000
II d.s. A0.136081p < 0.20p < 0.010.9308350.000816
II d.s. B10.154364p < 0.10p < 0.010.8852720.000011
II d.s. B20.118907p > 0.20p < 0.050.9547400.012941
II d.s. C0.122560p > 0.20p < 0.050.9633790.038579
II d.s. D0.303029p < 0.01p < 0.010.6901040.000000
Species A
I d.s. Acer platanoides0.495326p < 0.01p < 0.010.2516540.000000
I d.s. Betula sp.0.336394p < 0.01p < 0.010.6612190.000000
I d.s. Picea abies0.191070p < 0.05p < 0.010.9144310.000151
I d.s. Pinus sylvestris0.420630p < 0.01p < 0.010.4584800.000000
I d.s. Populus tremula0.315705p < 0.01p < 0.010.6187950.000000
I d.s. Quercus robur0.443994p < 0.01p < 0.010.4420040.000000
I d.s. Tilia cordata0.455612p < 0.01p < 0.010.3696430.000000
II d.s. Acer platanoides0.533284p < 0.01p < 0.010.0981570.000000
II d.s. Betula sp.0.328819p < 0.01p < 0.010.5005810.000000
II d.s. Picea abies0.237515p < 0.01p < 0.010.7934910.000000
II d.s. Pinus sylvestris0.415343p < 0.01p < 0.010.4739950.000000
II d.s. Populus tremula0.417133p < 0.01p < 0.010.3504950.000000
II d.s. Quercus robur0.483124p < 0.01p < 0.010.1200220.000000
II d.s. Tilia cordata0.474169p < 0.01p < 0.010.3420330.000000
Species B1
I d.s. Acer platanoides 0.402206p < 0.01p < 0.010.3080070.000000
I d.s. Betula sp. 0.533892p < 0.01p < 0.010.2442680.000000
I d.s. Picea abies 0.349031p < 0.01p < 0.010.6433100.000000
I d.s. Populus tremula 0.539404p < 0.01p < 0.010.2457770.000000
I d.s. Quercus robur 0.509077p < 0.01p < 0.010.1612880.000000
I d.s. Tilia cordata 0.435930p < 0.01p < 0.010.3398340.000000
II d.s. Acer platanoides 0.292722p < 0.01p < 0.010.6189290.000000
II d.s. Betula sp. 0.495213p < 0.01p < 0.010.3142850.000000
II d.s. Picea abies 0.267399p < 0.01p < 0.010.7697450.000000
II d.s. Populus tremula 0.516757p < 0.01p < 0.010.2383140.000000
II d.s. Quercus robur 0.365823p < 0.01p < 0.010.3648070.000000
II d.s. Tilia cordata 0.385446p < 0.01p < 0.010.3206000.000000
Species B2
I d.s. Corylus avellana0.338204p < 0.01p < 0.010.5493120.000000
I d.s. Daphne mezereum0.389830p < 0.01p < 0.010.4887890.000000
I d.s. Euonymus verrucosus0.539029p < 0.01p < 0.010.1576740.000000
I d.s. Frangula alnus0.422857p < 0.01p < 0.010.4426600.000000
I d.s. Lonicera xylosteum0.475978p < 0.01p < 0.010.3348820.000000
I d.s. Sambucus racemosa 0.458260p < 0.01p < 0.010.4079640.000000
I d.s. Sorbus aucuparia 0.322545p < 0.01p < 0.010.5663770.000000
I d.s. Viburnum opulus 0.537052p < 0.01p < 0.010.2817010.000000
II d.s. Corylus avellana 0.178712p < 0.05p < 0.010.9005340.000041
II d.s. Daphne mezereum0.461763p < 0.01p < 0.010.1674740.000000
II d.s. Euonymus verrucosus 0.486087p < 0.01p < 0.010.2289030.000000
II d.s. Frangula alnus0.374328p < 0.01p < 0.010.5998140.000000
II d.s. Lonicera xylosteum 0.271190p < 0.01p < 0.010.6640790.000000
II d.s. Sambucus racemosa 0.412753p < 0.01p < 0.010.3730140.000000
II d.s. Sorbus aucuparia 0.243579p < 0.01p < 0.010.7107420.000000
II d.s. Viburnum opulus 0.496493p < 0.01p < 0.010.2646670.000000
ECG
I d.s. A_Br0.175383p < 0.05p < 0.010.9014380.000039
I d.s. A_Nm0.365155p < 0.01p < 0.010.4154540.000000
I d.s. B1_Br0.279627p < 0.01p < 0.010.7201840.000000
I d.s. B1_Nm0.328309p < 0.01p < 0.010.5326440.000000
I d.s. B2_Br0.340848p < 0.01p < 0.010.5472770.000000
I d.s. B2_Nm0.254346p < 0.01p < 0.010.7074800.000000
I d.s. B2_NW0.407686p < 0.01p < 0.010.4526090.000000
II d.s. A_Br0.207947p < 0.01p < 0.010.8403570.000000
II d.s. A_Nm0.347353p < 0.01p < 0.010.5360280.000000
II d.s. B1_Br0.270345p < 0.01p < 0.010.7646170.000000
II d.s. B1_Nm0.248392p < 0.01p < 0.010.7479100.000000
II d.s. B2_Br0.354435p < 0.01p < 0.010.6107180.000000
II d.s. B2_Nm0.174144p < 0.05p < 0.010.9046930.000053
II d.s. B2_NW0.481930p < 0.01p < 0.010.3192540.000000
I d.s. C_Br0.080048p > 0.20p > 0.200.9557340.013672
I d.s. C_Eg0.243480p < 0.01p < 0.010.7449290.000000
I d.s. C_Md0.238700p < 0.01p < 0.010.6201890.000000
I d.s. C_Nm0.063660p > 0.20p > 0.200.9639460.039209
I d.s. C_NW0.276650p < 0.01p < 0.010.6279930.000000
I d.s. D_Br0.290690p < 0.01p < 0.010.6152880.000000
I d.s. D_NW0.295347p < 0.01p < 0.010.5582040.000000
II d.s. C_Br0.132951p < 0.20p < 0.010.9249980.000440
II d.s. C_Eg0.337641p < 0.01p < 0.010.4757940.000000
II d.s. C_Md0.277249p < 0.01p < 0.010.6410090.000000
II d.s. C_Nm0.141687p < 0.15p < 0.010.9119380.000106
II d.s. C_NW0.280360p < 0.01p < 0.010.5960580.000000
II d.s. D_Br0.403718p < 0.01p < 0.010.4008180.000000
II d.s. D_NW0.350384p < 0.01p < 0.010.5872360.000000
Note. K-S—Kolmogorov–Smirnov test; Lilliefors—Lilliefors test; W—Shapiro–Wilk’s W test.
Table A2. Pairwise correlation coefficients between PC of the main forest-forming species of tree and shrub layers in communities in different years of research.
II d.s.
Acer platanoides AAcer platanoides B1Betula sp. ABetula sp. B1Corylus avellana B2Daphne mezereum CEuonymus verrucosus B2Frangula alnus B1Lonicera xylosteum B2Picea abies APicea abies B1Pinus sylvestris A1Populus tremula A1Populus tremula B1Quercus robur AQuercus robur B1Sorbus aucuparia B2Sambucus racemosa B2Tilia cordata ATilia cordata B1
1234567891011121314151617181920
I d.s.10.2060.5010.200−0.129−0.055−0.1290.179−0.289−0.068−0.031−0.269−0.0860.058−0.0990.0710.074−0.299−0.2010.2620.055
20.4940.6920.166−0.1860.115−0.0940.247−0.346−0.0430.028−0.182−0.2900.072−0.0210.0800.223−0.214−0.2250.2260.116
30.1320.1210.151−0.0050.0300.186−0.1120.029−0.2340.0580.266−0.2690.1590.003−0.0970.2000.1410.044−0.085−0.100
4−0.075−0.0960.0830.094−0.140−0.0880.1370.022−0.1570.131−0.1630.356−0.127−0.0680.0140.067−0.1430.1180.0040.002
50.3230.3900.139−0.2390.4970.043−0.124−0.414−0.016−0.080−0.269−0.3110.041−0.0020.0570.270−0.017−0.021−0.1320.023
60.0190.2640.005−0.1310.2770.2770.202−0.1340.146−0.142−0.201−0.1500.228−0.0560.098−0.061−0.207−0.1970.2260.114
7−0.0520.2380.000−0.061−0.264−0.0610.216−0.1380.1490.049−0.156−0.0960.160−0.048−0.085−0.142−0.225−0.0960.3700.045
8−0.178−0.3340.1470.201−0.255−0.127−0.0600.1240.0480.0910.2590.363−0.002−0.057−0.0240.0810.2500.105−0.192−0.123
90.1740.1920.116−0.1460.0870.111−0.006−0.2330.2280.082−0.011−0.1390.2940.058−0.2020.120−0.071−0.0360.002−0.072
10−0.065−0.258−0.007−0.0940.2480.162−0.0450.1120.269−0.444−0.128−0.079−0.1340.0010.0180.2550.2300.111−0.244−0.017
11−0.044−0.014−0.0910.299−0.202−0.1850.0120.026−0.3380.1690.2870.150−0.179−0.052−0.052−0.067−0.1670.0820.0950.025
12−0.209−0.356−0.1360.350−0.058−0.245−0.0140.301−0.0720.135−0.0170.811−0.249−0.0770.102−0.2050.1550.088−0.275−0.239
13−0.1120.184−0.2160.0010.2430.077−0.034−0.0870.2010.0340.018−0.2830.4250.194−0.031−0.2250.0110.016−0.053−0.053
14−0.075−0.046−0.244−0.0880.020−0.088−0.0820.2080.112−0.1070.0640.006−0.127−0.0680.0260.1220.0320.259−0.1270.065
150.1630.354−0.018−0.0230.2340.066−0.067−0.098−0.0020.012−0.1830.001−0.050−0.1550.2610.081−0.091−0.0830.0830.074
160.1510.107−0.2440.0800.1630.099−0.082−0.0390.054−0.0200.0140.002−0.127−0.0680.0220.046−0.1570.146−0.127−0.039
17−0.024−0.214−0.1670.298−0.0520.153−0.1580.261−0.107−0.1040.2660.155−0.1780.255−0.046−0.0960.2220.439−0.246−0.223
180.030−0.114−0.0090.168−0.184−0.087−0.0140.092−0.054−0.0710.1820.273−0.1420.0000.0350.1160.2200.144−0.155−0.147
190.0920.2850.154−0.170−0.264−0.1700.349−0.3090.1170.1070.086−0.2650.1400.004−0.047−0.111−0.312−0.2650.8450.555
20−0.0170.2130.232−0.185−0.311−0.1860.260−0.2160.0710.1010.219−0.289−0.005−0.1430.028−0.129−0.262−0.2900.9180.713
Table A3. Results of LDA.
ClassPredicted Community Class MembershipTotal
12345678
OriginalQuantity123300000026
224200000246
3007000007
4000300003
500001010011
6000005027
7000010304
811000103336
%188.511.50.00.00.00.00.00.0100.0
24.391.30.00.00.00.00.04.3100.0
30.00.0100.00.00.00.00.00.0100.0
40.00.00.0100.00.00.00.00.0100.0
50.00.00.00.090.99.10.00.0100.0
60.00.00.00.00.071.40.028.6100.0
70.00.00.00.025.00.075.00.0100.0
82.82.80.00.00.02.80.091.7100.0
A total of 90.0% of the original grouped observations were classified correctly.

Appendix B

Figure A1. The appearance of spruce forests at different stages of successional dynamics: (a)—nemoral spruce forests before the start of stand decay; (b)—boreal spruce forests before the start of stand decay; (c)—drying of spruce trees as a result of defeat by the bark beetle Ips typographus; (d)—initial stage of spruce tree fall; (e)—the stage of regeneration of spruce undergrowth in a section of decayed spruce forest; (f)—the stage of active overgrowth of hazel (Corylus avellana) in a section of decayed spruce forest.
Forests 16 01526 g0a1

References

  1. Jandt, U.; Bruelheide, H.; Jansen, F.; Bonn, A.; Grescho, V.; Klenke, R.A.; Sabatini, F.M.; Bernhardt-Römermann, M.; Blüml, V.; Dengler, J.; et al. More Losses than Gains during One Century of Plant Biodiversity Change in Germany. Nature 2022, 611, 512–518. [Google Scholar] [CrossRef]
  2. Bolam, F. Over Half of Threatened Species Require Targeted Recovery Actions to Avert Human-induced Extinction. Front. Ecol. Environ. 2023, 22, 64–70. [Google Scholar] [CrossRef]
  3. Zhang, L.; Ameca, E.I.; Otero-Jimenez, B.; Montaño, S.K.; Shea, A.; Kelly, T.; Andrianoely, D.; Wright, P.C. Human-Induced Deforestation Increases Extinction Risk Faster than Climate Pressures: Evidence from Long-Term Monitoring of the Globally Endangered Milne-Edward’s Sifaka. Biol. Conserv. 2022, 274, 109716. [Google Scholar] [CrossRef]
  4. Dimitrova, A.; Csilléry, K.; Klisz, M.; Lévesque, M.; Heinrichs, S.; Cailleret, M.; Andivia, E.; Madsen, P.; Böhenius, H.; Cvjetkovic, B.; et al. Risks, Benefits, and Knowledge Gaps of Non-Native Tree Species in Europe. Front. Ecol. Evol. 2022, 10, 908464. [Google Scholar] [CrossRef]
  5. Ellis, E.C.; Antill, E.C.; Kreft, H. All Is Not Loss: Plant Biodiversity in the Anthropocene. PLoS ONE 2012, 7, e30535. [Google Scholar] [CrossRef]
  6. Klinkovská, K.; Sperandii, M.G.; Knollová, I.; Danihelka, J.; Hájek, M.; Hájková, P.; Hroudová, Z.; Jiroušek, M.; Lepš, J.; Navrátilová, J.; et al. Half a Century of Temperate Non-Forest Vegetation Changes: No Net Loss in Species Richness, but Considerable Shifts in Taxonomic and Functional Composition. Glob. Change Biol. 2025, 31, e70030. [Google Scholar] [CrossRef]
  7. Pakeman, R.J.; Lepš, J.; Kleyer, M.; Lavorel, S.; Garnier, E. The VISTA consortium Relative Climatic, Edaphic and Management Controls of Plant Functional Trait Signatures. J. Veg. Sci. 2009, 20, 148–159. [Google Scholar] [CrossRef]
  8. Martinez del Castillo, E.; Zang, C.; Buras, A.; Hacket-Pain, A.; Esper, J.; Serrano-Notivoli, R.; Hartl, C.; Weigel, R.; Klesse, S.; Resco de Dios, V.; et al. Climate-Change-Driven Growth Decline of European Beech Forests. Commun. Biol. 2022, 5, 1–9. [Google Scholar] [CrossRef] [PubMed]
  9. Viljur, M.-L.; Abella, S.; Adámek, M.; Alencar, J.; Barber, N.; Beudert, B.; Burkle, L.; Cagnolo, L.; Campos, B.; Chao, A.; et al. The Effect of Natural Disturbances on Forest Biodiversity: An Ecological Synthesis. Biol. Rev. Camb. Philos. Soc. 2022, 97, 1930–1947. [Google Scholar] [CrossRef]
  10. Rosenfeld, J. Functional Redundancy in Ecology and Conservation. Oikos 2002, 98, 156–162. [Google Scholar] [CrossRef]
  11. Pugnaire, F.; Valladares, F. (Eds.) Functional Plant Ecology, 2nd ed.; Taylor & Francis Group: Oxfordshire, UK, 2007. [Google Scholar]
  12. Nock, C.; Vogt, R.; Beisner, B. Functional Traits. In eLs; John Wiley & Sons, Ltd.: Hoboken, NJ, USA, 2016; ISBN 978-0-470-01617-6. [Google Scholar]
  13. Vasilevich, V. Functional diversity in plant communities. Bot. J. 2016, 101, 776–795. [Google Scholar] [CrossRef]
  14. Bakker, J.P.; Olff, H.; Willems, J.H.; Zobel, M. Why Do We Need Permanent Plots in the Study of Long-Term Vegetation Dynamics? J. Veg. Sci. 1996, 7, 147–155. [Google Scholar] [CrossRef]
  15. Chytry, M.; Tichý, L.; Hennekens, S.; Schaminée, J. Assessing Vegetation Change Using Vegetation-Plot Databases: A Risky Business. Appl. Veg. Sci. 2014, 17, 32–41. [Google Scholar] [CrossRef]
  16. Kapfer, J.; Hédl, R.; Jurasinski, G.; Kopecký, M.; Schei, F.H.; Grytnes, J.-A. Resurveying Historical Vegetation Data—Opportunities and Challenges. Appl. Veg. Sci. 2016, 20, 164–171. [Google Scholar] [CrossRef]
  17. Kneeshaw, D.; Gauthier, S. Old Growth in the Boreal Forest: A Dynamic Perspective at the Stand and Landscape Level. Environ. Rev. 2003, 11, 99–114. [Google Scholar] [CrossRef]
  18. Mosseler, A.; Thompson, I.; Pendrel, B. Overview of Old-Growth Forests in Canada from a Science Perspective. Environ. Rev. 2011, 11, S1–S7. [Google Scholar] [CrossRef]
  19. Rees, M.; Condit, R.; Crawley, M.; Pacala, S.; Tilman, D. Long-Term Studies of Vegetation Dynamics. Science 2001, 293, 650–655. [Google Scholar] [CrossRef] [PubMed]
  20. Litvinenko, L.; Kalinina, A. Territorial Distribution of Precipitation in the Moscow Region in the Presence and Absence of the Large Anthropogenic Formation. Ecol. Urban. Areas 2018, 2, 66–71. [Google Scholar]
  21. Hytteborn, H.; Maslov, A.A.; Nazimova, D.I.; Rysin, L.P. Boreal Forests of Eurasia. In Coniferous Forests; Elsevier: Amsterdam, The Netherlands, 2005; pp. 23–99. [Google Scholar]
  22. Rysin, L.P.; Savelyeva, L.I. Spruce Forests of Russia; Nauka: Moscow, Russia, 2002; 335p. [Google Scholar]
  23. Kotlov, I.; Chernenkova, T. Modeling of Forest Communities’ Spatial Structure at the Regional Level through Remote Sensing and Field Sampling: Constraints and Solutions. Forests 2020, 11, 1088. [Google Scholar] [CrossRef]
  24. Chernenkova, T.V.; Kotlov, I.P.; Belyaeva, N.G.; Suslova, Y.G.; Morozova, O.Â.V. Mapping and Assessment of the Cenotic Diversity of the Forests of the Moscow Region. Russ. J. Ecol. 2024, 54, 682–692. [Google Scholar] [CrossRef]
  25. Chernenkova, T.; Kotlov, I.; Belyaeva, N.; Suslova, E.; Morozova, O.; Pesterova, O.; Arkhipova, M. Role of Silviculture in the Formation of Norway Spruce Forests along the Southern Edge of Their Range in the Central Russian Plain. Forests 2020, 11, 778. [Google Scholar] [CrossRef]
  26. Maslov, A. Monitoring biodiversity and natural dynamics processes in protected forest areas: Program and results of work over 25 years. In Structure and Functions of Forests in European Russia; Scientific Publications Association KMK: Moscow, Russia, 2009; pp. 172–190. ISBN 978-5-87317-585-7. [Google Scholar]
  27. Plans of the Russian Empire Land Survey 1777. The Russian State Archive of Ancient Acts (RGADA), archive fund 1354, inventory 246–248.
  28. Three-Verst Military Topographic Map of the Russian Empire. Lithography of the Cartographic Department of the Corps of Military Topographers. Moscow. 1850.
  29. Topographic Military Maps of Red Army (RKKA). General Staff of the Red Army, sheets N-36, N-37, 1937–1941. Moscow. 1936.
  30. Abatzoglou, J.T.; Dobrowski, S.Z.; Parks, S.A.; Hegewisch, K.C. TerraClimate, a High-Resolution Global Dataset of Monthly Climate and Climatic Water Balance from 1958–2015. Sci. Data 2018, 5, 170191. [Google Scholar] [CrossRef] [PubMed]
  31. Mirkin, B. Theoretical Basis of Modern Phytocenology; Nauka, USSR Academy of Sciences, Bashkir Branch, Institute of Biology: Moscow, Russia, 1985. [Google Scholar]
  32. Rodwell, J.S.; Mucina, L.; Pignatti, S.; Schaminée, J.H.J.; Chytry, M. European Vegetation Survey; the Context of the Case Studies. Folia Geobot. Phytotaxon. 1997, 32, 113–115. [Google Scholar] [CrossRef]
  33. Moore, D.M. Flora Europaea Check-List and Chromosome Index; Cambridge University Press: Cambridge, UK, 1982. [Google Scholar]
  34. Ignatov, M.; Ignatova, E. Moss Flora of the Middle Eropean Russia; KMK: Moscow, Russia, 2003; Volume 1, ISBN 5-87317-149-1. [Google Scholar]
  35. Maslov, A. Biodiversity of the Native Forest Types in Strict Scientific Forest Reserves of the Moscow Region. Russ. J. For. Sci. 2022, 54, 611–620. [Google Scholar] [CrossRef]
  36. Smirnov, V.; Khanina, L.; Bobrovsky, M. Validation of the ecological-coenotical groups of vascular plant species for European Russian forests on the basis of ecological indicator values, vegetation releves and statistical analysis. Bull. Mosc. Soc. Nat. 2006, 111, 36–47. [Google Scholar]
  37. Mucina, L.; Grabherr, G.; Wallnöfer, S. Die Pflanzengesellschaften Österrreichs. Teil III; Wälder und Gebüsche: Jena, Germany, 1993. [Google Scholar]
  38. Malyshev, L. Floristic Zoning Based on Quantitative Characteristics. Bot. J. 1973, 58, 1581–1588. [Google Scholar]
  39. Tichý, L. JUICE, Software for Vegetation Classification. J. Veg. Sci. 2002, 13, 451–453. [Google Scholar] [CrossRef]
  40. R Core Team. R: A Language and Environment for Statistica Computing; R Foundation for Statistical Computing: Vienna, Austria, 2019; Available online: https://www.R-project.org/ (accessed on 25 September 2025).
  41. Oksanen, J.; Blanchet, F.G.; Kindt, R.; Legendre, P.; Minchin, P.R.; O’hara, R.B.; Simpson, G.L.; Solymos, P.; Stevens, M.H.H.; Wagner, H. Package ‘Vegan.’, version 2013; Community Ecology Package. Available online: https://mirror.ibcp.fr/pub/CRAN/web/packages/vegan/vegan.pdf (accessed on 25 September 2025).
  42. Remmert, H. The Mosaic-Cycle Concept of Ecosystems—An Overview. In The Mosaic-Cycle Concept of Ecosystems; Springer: Berlin/Heidelberg, Germany, 1991; pp. 1–21. ISBN 978-3-642-75650-4. [Google Scholar]
  43. Král, K.; Vrška, T.; Hort, L.; Adam, D.; Šamonil, P. Developmental Phases in a Temperate Natural Spruce-Fir-Beech Forest: Determination by a Supervised Classification Method. Eur. J. For. Res. 2010, 129, 339–351. [Google Scholar] [CrossRef]
  44. Bayer, D.; Pretzsch, H. Reactions to Gap Emergence: Norway Spruce Increases Growth While European Beech Features Horizontal Space Occupation–Evidence by Repeated 3D TLS Measurements. Silva Fenn. 2017, 51, 7748. [Google Scholar] [CrossRef]
  45. Neal, J.; Hawker, L. FABDEM V1-2; University of Bristol: Bristol, UK, 2023. [Google Scholar]
  46. Šamonil, P.; Schaetzl, R.J.; Valtera, M.; Goliáš, V.; Baldrian, P.; Vašíčková, I.; Adam, D.; Janík, D.; Hort, L. Crossdating of Disturbances by Tree Uprooting: Can Treethrow Microtopography Persist for 6000 Years? For. Ecol. Manag. 2013, 307, 123–135. [Google Scholar] [CrossRef]
  47. Schelhaas, M.; Nabuurs, G.; Schuck, A. Natural Disturbances in the European Forests in the 19th and 20th Centuries. Glob. Change Biol. 2003, 9, 1620–1633. [Google Scholar] [CrossRef]
  48. Maslov, A. Bark Beetle and Drying out of Spruce Forests; FBU VNIILM: Moscow, Russia, 2010; ISBN 978-5-94219-170-2. [Google Scholar]
  49. Korotkov, S.A. Change in the Composition of Tree Stands and the Stability of Protective Forests in the Central Part of the Russian Plain; ANO “DOBLEST EPOH”: Moscow, Russia, 2023. (In Russian) [Google Scholar]
  50. Malakhova, E.; Lyamtsev, N. Extent and Structure of Moscow Region Spruce Forest Dieback in 2010–2012. Izv. St.-Peterbg. Lesoteh. Akad. 2014, 207, 193–201. [Google Scholar]
  51. Maslov, A.D.; Komarova, I.; Kotov, A. The Dynamics of Reproduction of Bark Beetles in Central Russia in 2010–2013. And the Forecast for 2014. For. Inf. 2014, 1, 38–46. [Google Scholar]
  52. Pugachevsky, A. Spruce Coenopopulations. Structure, Dynamics, Regulatory Factors; Nauka i Tekhika: Minsk, Belarus, 1992; ISBN 5-343-00783-X. [Google Scholar]
  53. Purves, D.W.; Lichstein, J.W.; Pacala, S.W. Crown Plasticity and Competition for Canopy Space: A New Spatially Implicit Model Parameterized for 250 North American Tree Species. PLoS ONE 2007, 2, e870. [Google Scholar] [CrossRef]
  54. Karpov, V. Experimental Phytocenology of Taiga; Nauka, Leningrad Department: Leningrad, Russia, 1969. [Google Scholar]
  55. Alekseev, V. Light Regime of the Forest; Nauka: Leningrad, Russia, 1975. [Google Scholar]
  56. Dyrenkov, S. Structure and Dynamics of Taiga Spruce Forests; Nauka: Leningrad, Russia, 1984. [Google Scholar]
  57. Rysin, L.; Savelyeva, L. Cadastres of Forest Types and Forest Biogeocenoses; Scientific Publications Partnership KMK: Moscow, Russia, 2007; ISBN 978-5-87317-397-6. [Google Scholar]
  58. Third Assessment Report on Climate Change and Its Consequences in the Russian Federation; Наукoемкие технoлoгии: Saint Petersburg, Russia, 2022.
  59. Kobyakov, K.; Titova, S.; Shmatkov, N.; Korotkov, V.; Kazakov, P. Assessment of Possibilities for Increasing Greenhouse Gas Absorption by Forests in the Central European Russia. Sustain. For. Manag. 2019, 4–20. [Google Scholar]
  60. Maslov, A.A. Dynamics of Ecological Species Groups and Forest Types during Natural Successions in Central Russia Preserved Forests. Bull. Mosc. Soc. Naturalists. Biol. Ser. 1998, 103, 34–43. [Google Scholar]
  61. Enyedi, Z.M.; Ruprecht, E.; Deák, M. Long-term Effects of the Abandonment of Grazing on Steppe-like Grasslands. Appl. Veg. Sci. 2008, 11, 55–62. [Google Scholar] [CrossRef]
  62. Ruprecht, E.; Enyedi, M.Z.; Eckstein, R.L.; Donath, T.W. Restorative Removal of Plant Litter and Vegetation 40 Years after Abandonment Enhances Re-Emergence of Steppe Grassland Vegetation. Biol. Conserv. 2010, 143, 449–456. [Google Scholar] [CrossRef]
  63. Klinkovská, K.; Sperandii, M.G.; Trávníček, B.; Chytrý, M. Significant decline in habitat specialists in semi-dry grasslands over four decades. Biodivers. Conserv. 2024, 33, 161–178. [Google Scholar] [CrossRef]
  64. Chételat, J.; Kalbermatten, M.; Lannas, K.S.M.; Spiegelberger, T.; Wettstein, J.-B.; Gillet, F.; Peringer, A.; Buttler, A. A Contextual Analysis of Land-Use and Vegetation Changes in Two Wooded Pastures in the Swiss Jura Mountains. Ecol. Soc. 2013, 18, art39. [Google Scholar] [CrossRef]
  65. Peringer, A.; Siehoff, S.; Chételat, J.; Spiegelberger, T.; Buttler, A.; Gillet, F. Past and Future Landscape Dynamics in Pasture-Woodlands of the Swiss Jura Mountains under Climate Change. Ecol. Soc. 2013, 18, 11. [Google Scholar] [CrossRef]
  66. Konatowska, M.; Młynarczyk, A.; Rutkowski, P.; Kujawa, K. Impact of Site Conditions on Quercus Robur and Quercus Petraea Growth and Distribution under Global Climate Change. Remote Sens. 2024, 16, 4094. [Google Scholar] [CrossRef]
  67. Pretzsch, H. Forest Dynamics, Growth and Yield: From Measurement to Model; Springer: Berlin/Heidelberg, Germany, 2009; ISBN 978-3-540-88306-7. [Google Scholar]
  68. Hari, P. Theoretical Aspects of Eco-Physiological Research. In Crop Physiology of Forest Trees; Helsinki University Press: Helsinki, Finland, 1985; pp. 21–30. [Google Scholar]
  69. Rabotnov, T. Phytocenology: Textbook for Universities in the Field of “Biology” and Specialty “Botany”; Moscow State University Publishing House: Moscow, Russia, 1992; ISBN 5-211-02401-X. [Google Scholar]
  70. Korotkov, V. Basic Concepts and Methods of Restoration of Natural Forests in Eastern Europe. Russ. J. Ecosyst. Ecol. 2017, 2, 1–18. [Google Scholar] [CrossRef]
Figure 2. Change in PC species over the observed period, percent. Layers: A—tree, B1—understory, B2—shrubs, C—herb-dwarf shrubs, D—moss.
Forests 16 01526 g002
Figure 3. Transformation of the typological composition of spruce forests (a) and communities’ successional tracks (b) during the study period. Types of communities: 1—Spruce forests of boreal type, 2—Spruce forests of nemoral type, 3—Spruce-pine forests of boreal type, 4—Spruce-pine forests of nemoral type, 5—Oak-lime with spruce forests, 6—Birch-aspen with spruce forests, 7—Disintegrated spruce forests of boreal type, 8—Disintegrated spruce forests of nemoral type.
Forests 16 01526 g003
Figure 4. Change in the activity species index of tree (a) and subcanopy layers (b) over the study period.
Forests 16 01526 g004
Figure 5. Changes in the ecological-cenotic structure of tree and understory layers over the study period—I d.s. (a), II d.s. (b).
Forests 16 01526 g005
Figure 6. Change in the activity index (A) of the most important herb-dwarf shrub layer (C) species over the study period.
Forests 16 01526 g006
Figure 7. Changes in the ecological-phytocoenotic structure of herb-dwarf shrub and moss layer species over the study period—I d.s., (a), II d.s. (b).
Forests 16 01526 g007
Figure 8. NMDS ordination and correlation of relevés distribution with ordination axes and squares of correlation coefficients. Factor designation: L—light, T—temperature, R—soil reaction, M—soil moisture, N—soil nitrogen. II d.s.*—disturbed spruce forests.
Forests 16 01526 g008
Table 1. Change in projective cover of main layer in spruce forests over the study period, percent.
LayersI d.s.II d.s.p
M, %S.D.M, %S.D.
A71.49.229.122.40.000
B111.013.720.816.80.000
B212.216.637.224.20.000
C76.717.662.918.20.012
D16.625.114.021.70.000
Note: M—mean value; S.D.—standard error of mean value; p—significance level by Mann–Whitney criterion at p < 0.05.
Table 2. Typology of relevés and the relative quality of LDA, %.
NoCommunity Types and Diagnostic SpeciesLDA, %
1Spruce with birch, aspen forests, dwarf shrubs—small herbs—green moss, and small herbs (Vaccinium myrtillus, V. vitis idaea, Oxalis acetosella, Dryopteris carthusiana, Calamagrostis arundinacea, Luzula pilosa, Carex digitata, Orthilia secunda, Pleurozium schreberi, Hylocomium splendens, Rhytidiadelphus triquetrus)88.5
2Spruce with birch, aspen, oak, and linden forests; small herb–broad herb and broad herb (Stellaria_holostea, Aegopodium podagraria, Carex pilosa, Anemonoides nemorosa, Oxalis acetosella, Veronica chamaedrys, Carex pilosa, Ajuga reptans, Lamiastrum galeobdolon, Atrichum undulatum)91.3
3Spruce-pine with birch forests, dwarf shrubs—small herbs—green moss, and small herbs (Vaccinium myrtillus, Vaccinium vitis-idaea, Oxalis acetosella, Dryopteris carthusiana, Calamagrostis arundinacea, Convallaria majalis, Pleurozium schreberi, Hylocomium splendens)100
4Spruce-pine with birch forests, small herb–broad herb and broad herb (Corylus avellana, Oxalis acetosella, Carex pilosa, Lamiastrum galeobdolon, Athyrium filix-femina, Dryopteris carthusiana).100
5Oak-linden with spruce forests and broad herbs (Aegopodium podagraria, Carex pilosa, Anemonoides ranunculoides, Mercurialis perennis, Lamiastrum galeobdolon, Dryopteris filix-mas, Pulmonaria obscura, Asarum europaeum, Ranunculus cassubicus, Stellaria nemorum, Aconitum septentrionale)90.9
6Birch-aspen with spruce forests with broad herbs (Aegopodium podagraria, Ranunculus_cassubicus, Carex pilosa, Glechoma_hirsuta, Equisetum_pratense, Lamiastrum galeobdolon, Pulmonaria obscura, Stellaria nemorum, Calamagrostis arundinacea)72.4
7Disintegrated spruce forests with spruce undergrowth and dwarf shrubs—small herbs—green moss, and small herbs (Equisetum sylvaticum, E. pratense, Lysimachia vulgaris, Circaea alpina, Dryopteris expansa, Filipendula ulmaria, Trientalis europaea, Luzula pilosa, Orthilia secunda, Climacium dendroides)75.0
8Disintegrated spruce forests with hazel and small herb–broad herb and broad herb (Corylus avellana, Sorbus aucuparia, Stellaria nemorum, Carex sylvatica, Athyrium filix-femina, Rubus idaeus, Dryopteris carthusiana)91.7
Table 3. Change in projective cover of tree layer species (A) over the study period, percent.
SpeciesI d.s.II d.s.F II/Ip
MS.D.MS.D.
Acer platanoides0.170.660.733.20.560.000
Betula sp.8.7019.84.037.9−4.670.006
Picea abies42.7611.616.1616.8−26.600.000
Pinus sylvestris4.5611.02.846.9−1.710.415
Populus tremula6.231.51.607.6−4.630.001
Quercus robur0.640.172.297.31.640.753
Tilia cordata3.670.664.1111.40.440.780
Note: M—mean value; S.D.—standard error of mean value; F II/I—change in PC of species over the observed period; p—significance level by Mann–Whitney criterion at p < 0.05.
Table 4. Change in projective cover of understory (B1) over the study period, percent.
SpeciesI d.s.II d.s.F II/Ip
MS.D.MS.D.
Acer platanoides1.174.154.037.42.860.010
Betula sp.0.070.310.431.60.360.532
Picea abies4.006.513.714.89.70.000
Populus tremula0.10.230.10.4600.879
Quercus robur0.311.91.64.01.290.000
Tilia cordata2.979.93.07.80.030.553
Note: see Table 3.
Table 5. Change in percent of shrub species (B2) over the study period, percent.
SpeciesI d.s.II d.s.F II/Ip
MS.D.MS.D.
Corylus avellana5.7011.726.3623.720.660.000
Daphne mezereum0.430.910.110.62−0.320.000
Euonymus verrucosa0.030.170.060.290.030.475
Frangula alnus2.105.51.402.6−0.700.218
Lonicera xylosteum0.973.21.822.90.850.000
Sambucus racemosa0.491.30.832.60.350.572
Sorbus aucuparia3.707.38.6812.54.980.000
Viburnum opulus0.070.260.080.310.000.788
Note: see Table 3.
Disclaimer/Publisher’s Note: The statements, opinions and data contained in all publications are solely those of the individual author(s) and contributor(s) and not of MDPI and/or the editor(s). MDPI and/or the editor(s) disclaim responsibility for any injury to people or property resulting from any ideas, methods, instructions or products referred to in the content.