Article

Linking Morphological Traits of Fine Root to Soil CO2 Efflux in Middle-Aged Plantations of Four Tree Species

1
Department of Forestry and Environmental Systems, Kangwon National University, Chuncheon 24341, Republic of Korea
2
Forest Ecology Division, National Institute of Forest Science, Seoul 02455, Republic of Korea
3
Department of Forest Resources, Kangwon National University, Chuncheon 24341, Republic of Korea
*
Authors to whom correspondence should be addressed.
Forests 2025, 16(10), 1513; https://doi.org/10.3390/f16101513
Submission received: 4 September 2025 / Revised: 19 September 2025 / Accepted: 23 September 2025 / Published: 25 September 2025

Abstract

Understanding belowground carbon dynamics is essential for predicting the carbon balance of forest ecosystems. This study aimed to investigate links between soil CO2 efflux (RS), soil physicochemical properties, and fine-root morphology across four middle-aged plantations of different species (Robinia pseudoacacia, Quercus mongolica, Pinus koraiensis, and Metasequoia glyptostroboides) in Mt. Ansan, Seoul, Republic of Korea. Seasonal measurements of RS, soil temperature (TS), and soil water content (SWC) were conducted, and soils and fine roots (≤2.0 mm) were analyzed for physicochemical properties and morphological traits, with a focus on very-fine roots (≤0.5 mm). The results showed that RS was positively correlated with TS (r = 0.77) and negatively with SWC (r = −0.33). RS normalized at 25 °C (R25), differed significantly among plantations, and exhibited strong positive correlations with electrical conductivity (r = 0.81), as well as with total nitrogen and carbon concentrations and clay content. Among fine root traits, the length, surface area, and volume of very-fine roots exhibited the strongest associations with R25, underscoring their pivotal role in regulating belowground respiration. These findings suggest that species-specific fine root strategies and soil conditions jointly control RS dynamics, particularly under warmer conditions, and highlight very-fine root traits as key indicators of soil carbon flux in forest ecosystems.

1. Introduction

Climate change, driven by increasing greenhouse gas emissions, has become one of the most pressing global challenges [1,2], contributing to rising global temperatures, extreme weather events, and shifts in ecosystem dynamics. Among the greenhouse gases, carbon dioxide (CO2) is a major contributor, and its rapid accumulation in the atmosphere is closely linked to both anthropogenic activities, such as fossil fuel combustion and deforestation, and natural processes like decomposition and wildfires [3]. Forest ecosystems play a pivotal role in global carbon cycling by acting as both carbon sinks and sources, regulating atmospheric CO2 levels through photosynthesis and respiration [4,5]. Within these ecosystems, soils store the largest proportion of carbon, estimated to hold more than twice the amount of carbon found in the atmosphere [6]. As a result, forest soils are critical in determining the net carbon balance of terrestrial ecosystems and play a central role in climate regulation.
Soil respiration (RS, soil CO2 efflux), a key process in soil carbon dynamics, refers to the release of CO2 from the soil surface to the atmosphere. It primarily consists of autotrophic (root) and heterotrophic (microbial) respiration. RS constitutes the second largest terrestrial carbon flux [7], contributing approximately 70% of the total ecosystem respiration. So, fluctuations in RS can significantly influence atmospheric CO2 levels, potentially creating feedback loops that accelerate climate change [1]. Therefore, understanding the RS and its influencing factors is essential for predicting ecosystem carbon balance. Numerous studies have highlighted soil temperature (TS) and water content (SWC) as the major drivers of RS [8,9]. However, many studies have also attempted to link RS to complex interactions of biotic and abiotic factors, including climate, soil environment, vegetation characteristics, and anthropogenic activities [10,11,12,13].
Soil physicochemical properties are fundamental determinants of soil fertility and serve as key factors influencing the productivity of terrestrial ecosystems [14]. Soil physicochemical properties also have a strong influence on both root respiration and microbial respiration. For instance, soil texture and bulk density affect root growth by determining soil porosity, water retention, and oxygen availability, thus directly influencing root respiration rates. Additionally, nutrient availability—particularly nitrogen, phosphorus, and other essential minerals—influences root metabolic activities, thereby affecting root respiration. Furthermore, soil organic carbon and nitrogen content strongly affect microbial biomass and metabolism, directly controlling the magnitude of microbial respiration. Overall, the interplay of these physicochemical properties creates a soil environment that fundamentally regulates both root and microbial respiratory processes.
Roots perform essential functions such as water and nutrient absorption, reserve storage, and structural support [15]. Among these, fine roots (≤2 mm) play critical roles in resource uptake and ecosystem processes [16,17] and contribute substantially to root respiration [18]. Notably, very-fine roots (≤0.5 mm) exhibit higher respiration rates per unit biomass and faster decomposition than thicker fine roots, suggesting greater microbial stimulation [19,20]. Several studies have identified fine root morphological traits as major factors influencing both root and microbial respiration [18,21,22,23]. However, most previous studies considered fine roots as a single category (≤2 mm) without distinguishing very-fine roots [24,25]. Research explicitly addressing the functional role of very-fine roots in regulating RS remains limited, despite their potentially greater significance.
Vegetation is widely recognized as a key factor influencing soil physicochemical properties and morphological traits of fine roots [26]. Leaves of different tree species have generated species-specific effects on litter layer decomposition and the release of nutrients into the soil [27,28]. Meanwhile, roots of different tree species also generate species-specific effects on the soil. A study by [29] demonstrated that tree species affect soil physicochemical properties primarily through variations in fine root development, which play a central role in determining the amount and quality of organic inputs to the soil. Notably, they found that belowground inputs from fine roots exert a greater influence on soil carbon accumulation than aboveground sources such as leaf litter. So, our study was designed to determine the following: (1) differences in RS, soil physicochemical properties, morphological traits of very-fine roots in four plantations of different species; (2) relationships between soil physicochemical properties and morphological traits of very-fine roots; (3) relationships of RS with soil physicochemical properties and morphological traits of very-fine roots by examining the RS seasonally, and analyzing the effects of soil properties and morphological traits of very-fine roots on RS.

2. Materials and Methods

2.1. Site Description

This study was conducted in Ansan Urban Nature Park (37° 34′ 45″ N, 126° 56′ 34″ E, 115–200 m a. s. l.) located in Seodaemun-gu, Seoul, Republic of Korea (Figure 1). The study site is characterized by a typical temperate climate with hot, humid summers and cold, dry winters. The mean annual temperature is 12.4 °C and the mean annual precipitation is 1234 mm (1991–2020), 60% to 70% of which occurs from June to August (Korea Meteorological Administration). Four middle-aged plantations with different species were selected, including Robinia pseudoacacia L. (R), Quercus mongolica Fisch. Ex Ledeb. (Q), Pinus koraiensis Siebold & Zucc. (P), and Metasequoia glyptostroboides Hu & W. C. Cheng (M). The four plantations were selected to represent similar microtopographic conditions, with their topographic and stand characteristics summarized in Table 1. All four plantations showed thinning traces of similar intensity. The shrub layers are mainly dominated by Cornus kousa Buerger ex Miq., Pteridium aquilinum (L.) Kuhn, Corylus heterophylla Fisch. ex Trautv., Robinia pseudoacacia, Lespedeza bicolor Turcz., Rhododendron mucronulatum Turcz., and Stephanandra incisa (Thunb.) Zabel across all plantations. The soil depth of all plantations was observed to range from 43 to 70 cm.

2.2. Measurements of RS, TS, and SWC

To investigate RS (µmol CO2 m−2 s−1) in four plantations with different species, 12 soil collars (11.5 cm in diameter, 10 cm in height) made of PVC were installed at a depth of 5 cm in each plantation. The collars were spaced at least 1.5 m apart and placed away from tree trunks and coarse roots. A closed chamber (12 cm in diameter, 11 cm in height) with a diffusion-type non-dispersive infrared gas analyzer (GMP-343, Vaisala, Helsinki, Finland) was repeatedly used to investigate the seasonal variation of RS. The CO2 concentration in the chamber was recorded every 5 s for 300 s by a data logger (MI-70, Vaisala). RS was calculated from a linear regression of the increase in the CO2 concentration by the following equation:
RS = dCO2/dt × PV/ART
where dCO2/dt is the rate of change in CO2 concentration over time, P is the atmospheric pressure (atm), V is the chamber volume plus the collar volumes for each sampling location, T is the air temperature in the chamber (K), A is the soil surface area (83.7 cm2), and R is the ideal gas constant (0.08206 L atm mol−1 k−1). The measurements, TS and SWC at depths of 5 and 10 cm were repeatedly measured near all soil collars by a portable thermometer (CT-500WP, Custom, Tokyo, Japan) and a time-domain reflectometry (TDR) sensor (HydroSense II, Campbell Scientific, Logan, UT, USA), respectively.

2.3. Measurements of Soil Physicochemical Properties and Fine Root Traits

To investigate the soil properties and fine root traits in four plantations with different species, we randomly selected four sampling points in each plantation. The distance between each sampling point was set to be at least 5 m, and the organic layer at all points was removed before soil sampling. At each sampling point, soil samples were collected at depths of 0–10 cm using 200 cc soil cans. Additionally, 400 cc of soil was collected twice at each sampling point from a depth of 0–10 cm using an auger. Both types of soil samples were carefully transported to the laboratory.
The soil cans were oven-dried at 105 °C after measuring their fresh weight, and the bulk density (BD) of soil was determined. The 400 cc soil samples were immediately air-dried and sieved into soil (particle size < 2 mm), gravel (≥2 mm), and roots. The sieved soil was then divided into two equal parts, with one half subsequently oven-dried at 105 °C for soil texture (sand, silt, and clay), total carbon (TC), total nitrogen concentration (TN), and available phosphorus (AP) analysis. The contents of sand (%), silt (%), and clay (%) were determined using an automated soil particle size analyzer (PARIO Plus, METER, Pullman, WA, USA). TC (%) and TN (%) were determined using a CN elemental analyzer (vario MACRO cube, Elementar Analysensysteme GmbH, Langenselbold, Germany). AP (mg kg−1) was determined through the Lancaster method (1:1 0.05 M HCl). The remaining air-dried soils were used for pH and electrical conductivity (EC) analysis. To determine soil pH and EC (dS m−1), pH (Lab 855; SI Analytics, Mainz, Germany) and EC (Orion Star A215; Thermo Scientific, Waltham, MA, USA) meters were used, respectively.
The separated roots were sorted using a digital caliper to isolate fine roots with a diameter of 2 mm or less (total). The fine roots were scanned for morphological traits, including length (L), surface area (SA), and volume (V) by diameter class, using a root scanner and root analysis software (WinRHIZO Reg2022b; Regent Co., QC, Canada). After scanning, we conducted detailed analyses of L, SA, V for fine roots (Ltotal, SAtotal, and Vtotal, respectively), as well as separately for very-fine (0–0.5 mm) roots (Lvf, SAvf, and Vvf, respectively). Samples of fine roots were oven-dried at 65 °C to examine the biomass of fine roots. Subsequently, we calculated the specific root length (SRL, m g−1) and root tissue density (RTD, g cm−3).

2.4. Statistical Analysis

Data are presented as means ± standard error. One-way analysis of variance (ANOVA) was performed to explore significant differences of average RS, TS, SWC, soil physicochemical properties, and fine root traits among the plantations of different species. A difference with p-value < 0.05 was considered significant. When ANOVA indicated significant differences, Tukey’s honest significant difference (HSD) test was conducted as a post hoc analysis to determine pairwise differences among the plantations. Pearson’s correlation coefficient was used to examine the relationships between soil physicochemical properties and fine root traits, as well as their correlations with RS. To describe the temperature dependency of the RS, we used the following exponential function:
R = R0∙expbT
where R is the CO2 flux (µmol CO2 m−2 s−1), R0 is the respiration rate at a reference temperature of 0 °C, b is a regression coefficient related to temperature sensitivity (Q10 = e10b), and T is the soil temperature (°C) at 5 cm depth. Subsequently, we calculated RS normalized at 25 °C (R25) to examine RS in high TS conditions. Principal component analysis (PCA) was performed to identify patterns and groupings among soil physicochemical properties, morphological traits of fine roots, and RS parameters (R0, R25, and Q10). The analysis was conducted using standardized variables to ensure comparability among different measurement units. All statistical analyses were conducted using the 3.13.1 version of Python.

3. Results

3.1. Soil Physicochemical Properties Among Different Plantations

All plantations had similar sand, silt, and clay proportions, and their soil texture was classified as loam (Table 2). The BD was significantly higher in P (1.05 ± 0.06 g cm−3) plantation than R (0.75 ± 0.04 g cm−3) plantation, while Q (0.90 ± 0.08 g cm−3) and M (0.97 ± 0.08 g cm−3) plantations showed intermediate values.
The soil pH across all plantations was found to be in the acidic (4.34–4.90) range, with no significant difference among plantations. Mean values of EC in all plantations ranged from 0.28 to 0.55 dS m−1, a level that does not induce salinization stress on plant growth. Although the average TC appeared relatively higher in plantations of deciduous broad-leaved species, no statistically significant difference was detected among plantations based on the post hoc analysis. The TN also showed no significant difference among the plantations. The AP values were significantly higher in the R (39.3 ± 2.3 mg kg−1) plantation than in the Q (20.7 ± 1.7 mg kg−1) and M (23.3 ± 1.8 mg kg−1) plantations, while the P (28.9 ± 4.0 mg kg−1) plantation showed intermediate values without significant differences from the other plantations.

3.2. Fine Root Biomass and Morphological Traits Among Different Plantations

There was no significant difference among plantations in root biomass, but significant differences were observed in morphological traits (Table 3). Ltotal in R (18.15 ± 4.45 m m−2) and Q (20.09 ± 5.13 m m−2) plantations was significantly higher than P (3.19 ± 1.63 m m−2) plantation while M (9.70 ± 1.99 m m−2) plantation showed intermediate values without significant differences from the other plantations. Lvf at Q (15.28 ± 4.56 m m−2) plantation was significantly higher than P (0.60 ± 0.28 m m−2) plantation, while R (13.46 ± 3.66 m m−2) and M (5.86 ± 1.70 m m−2) plantations showed intermediate values. No significant difference was observed in SAtotal. However, for SAvf, the R (1.03 ± 0.28 m2 m−2) and Q (1.09 ± 0.28 m2 m−2) plantations showed significantly higher values compared to the P (0.06 ± 0.03 m2 m−2) plantation, while M (0.54 ± 0.15 m2 m−2) plantation exhibited intermediate values. Similar to SAtotal, Vtotal exhibited no significant differences among plantations. Vvf showed significant difference between R (76.0 ± 20.3 cm3 m−2) and P (5.1 ± 2.7 cm3 m−2) plantations, as well as Q (77.7 ± 17.7 cm3 m−2) and P plantations, while M (46.1 ± 11.5 cm3 m−2) plantation showed intermediate values. RTD in Q (0.674 ± 0.038 g cm−3) plantation was the highest. SRL exhibited no significant differences among the plantations.

3.3. Soil CO2 Efflux

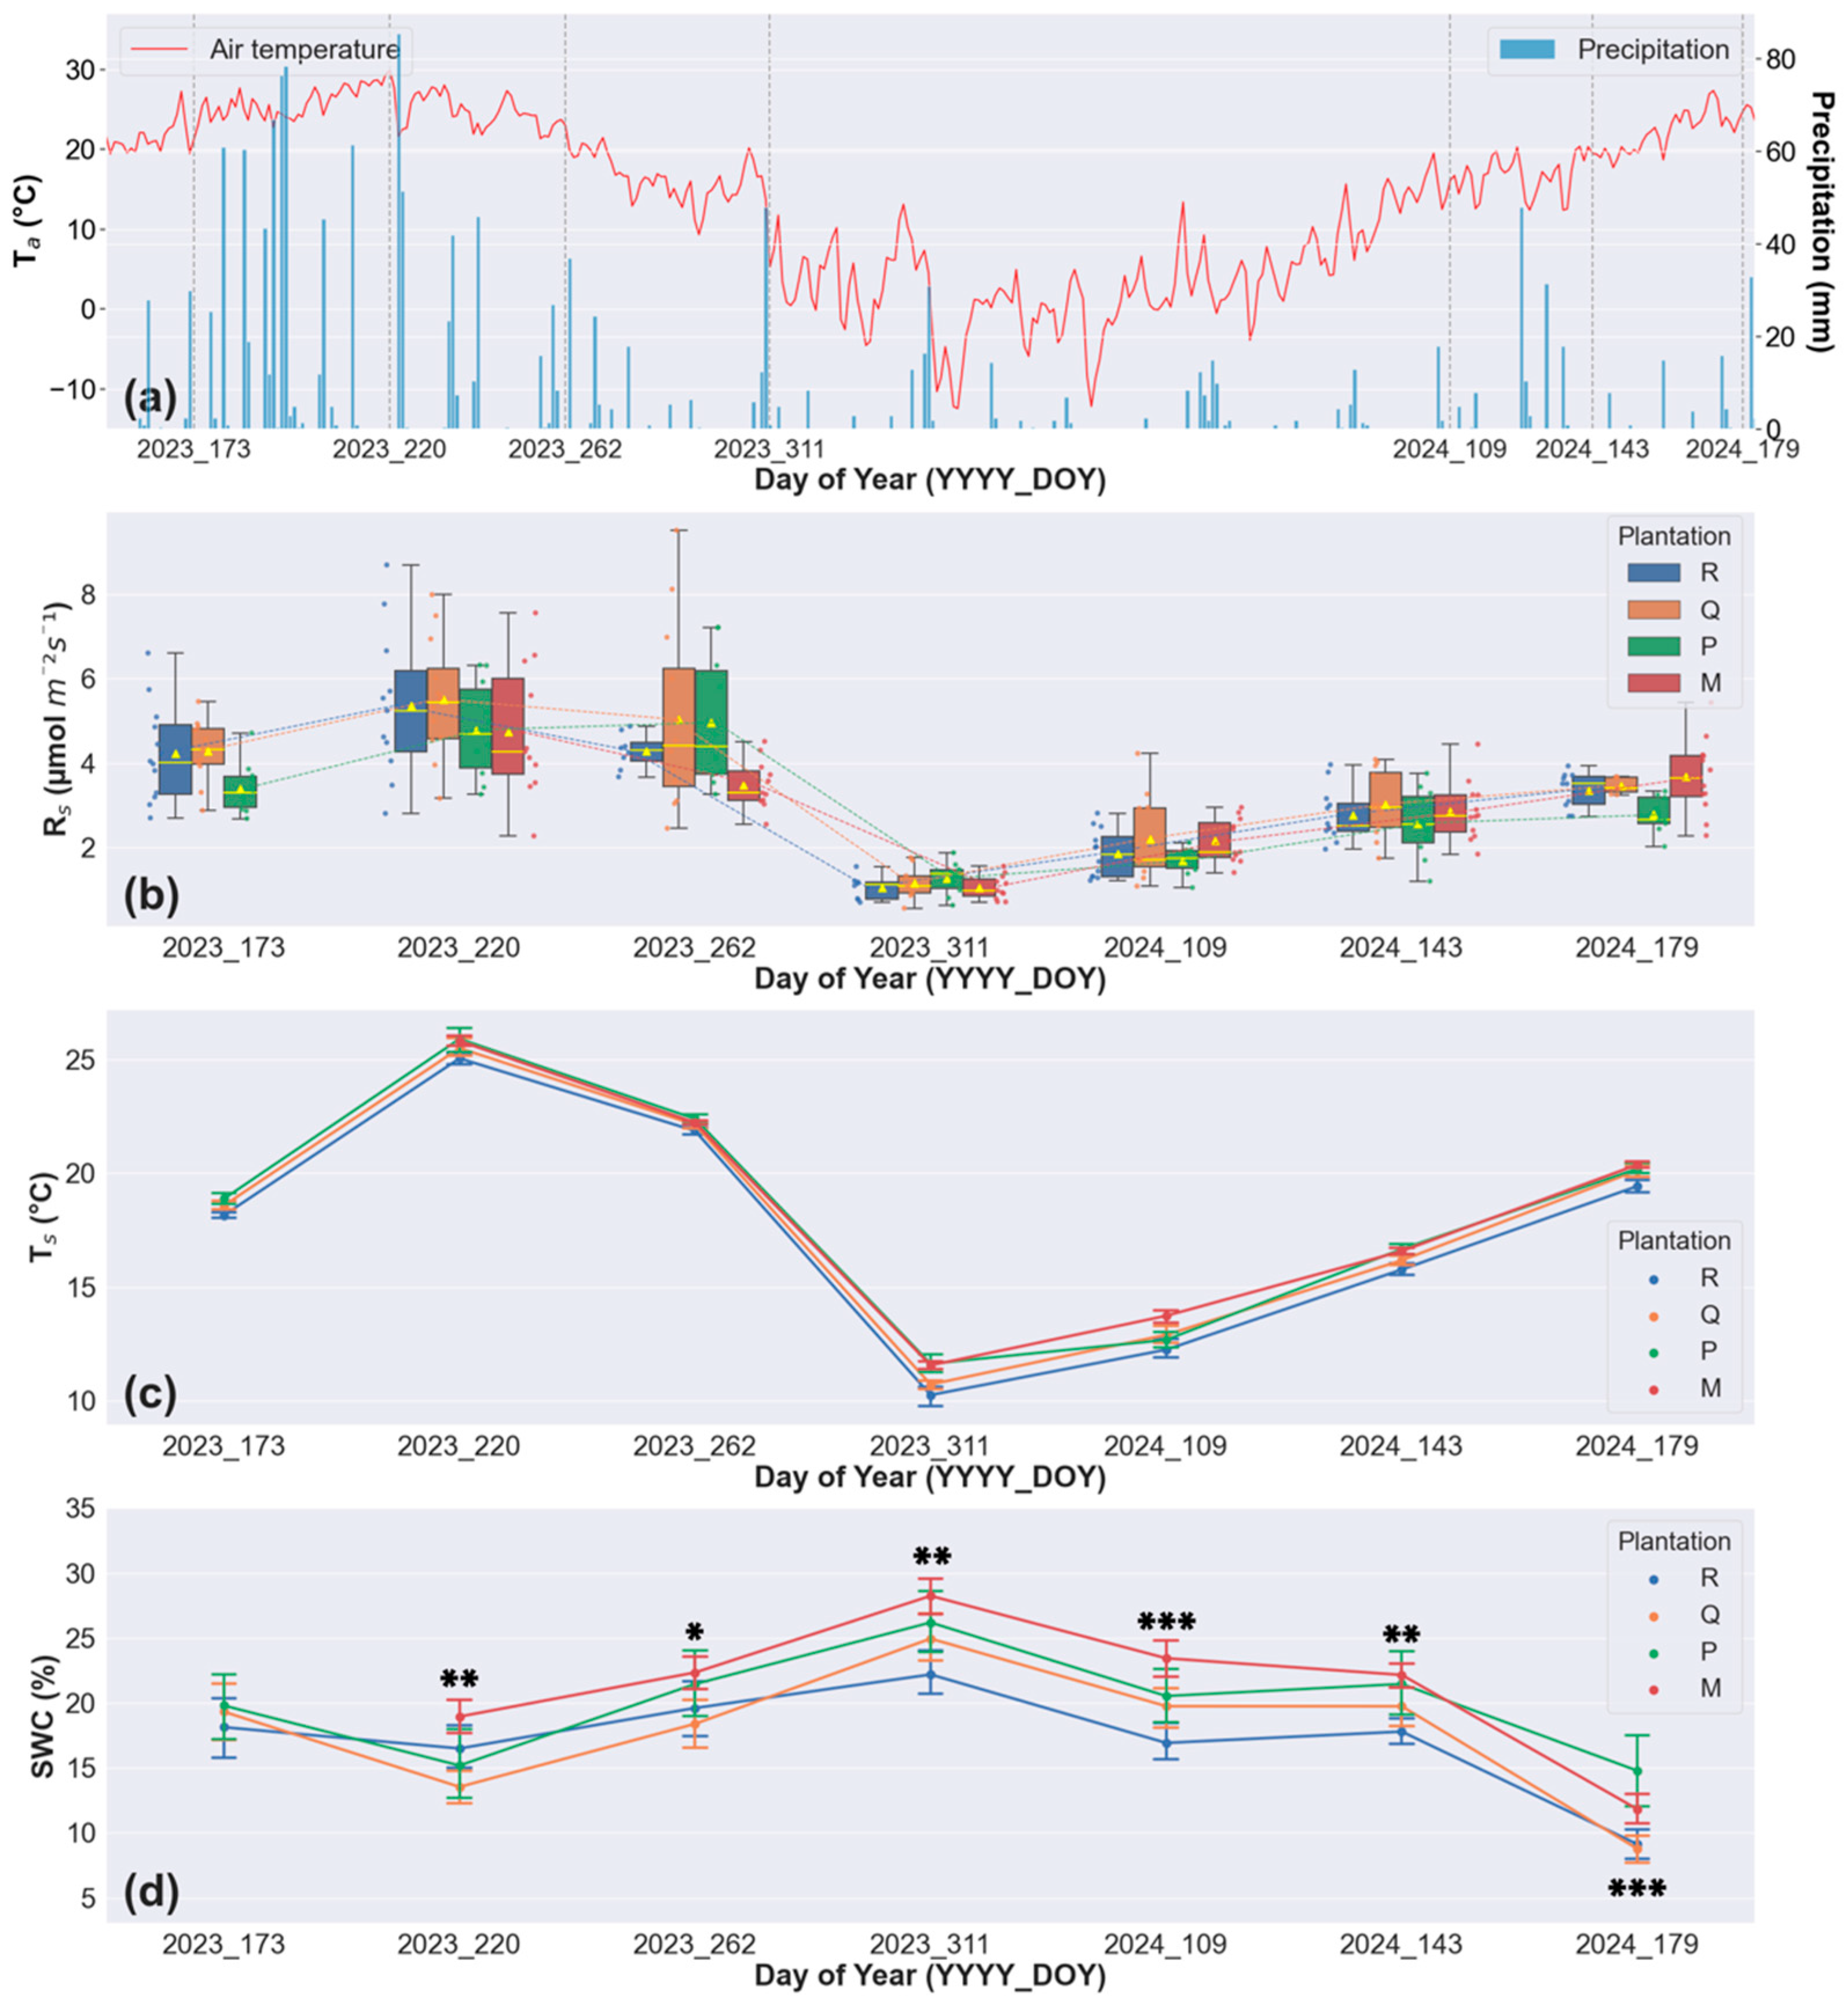
RS of all plantations seasonally varied significantly along with Ta and Ts during the study period (p < 0.01) (Figure 2a–c). For every measurement, significant differences in RS rate among plantations were not observed. But RS in plantations of broad-leaved species was relatively higher than plantations of coniferous species in the summer season, while RS in P plantation was relatively highest in the winter season.
Significant differences in SWC among plantations were observed across multiple days of the year (Figure 2d). Specifically, significant differences were found between M and P plantations as well as M and Q plantations in 2023_220 (p < 0.01); between M and R plantations as well as P and R plantations in 2023_262 (p < 0.05); and between M and R plantations as well as P and R plantations in 2023_311 (p < 0.01). Similar trends were observed in 2024_109 (p < 0.001), 2024_143 (p < 0.01) and 2024_179 (p < 0.001). These results indicate that SWC varies significantly among plantations, with particularly strong differences between the R and P plantations. This pattern suggests distinct water availability dynamics between plantations of coniferous and broad-leaved species.
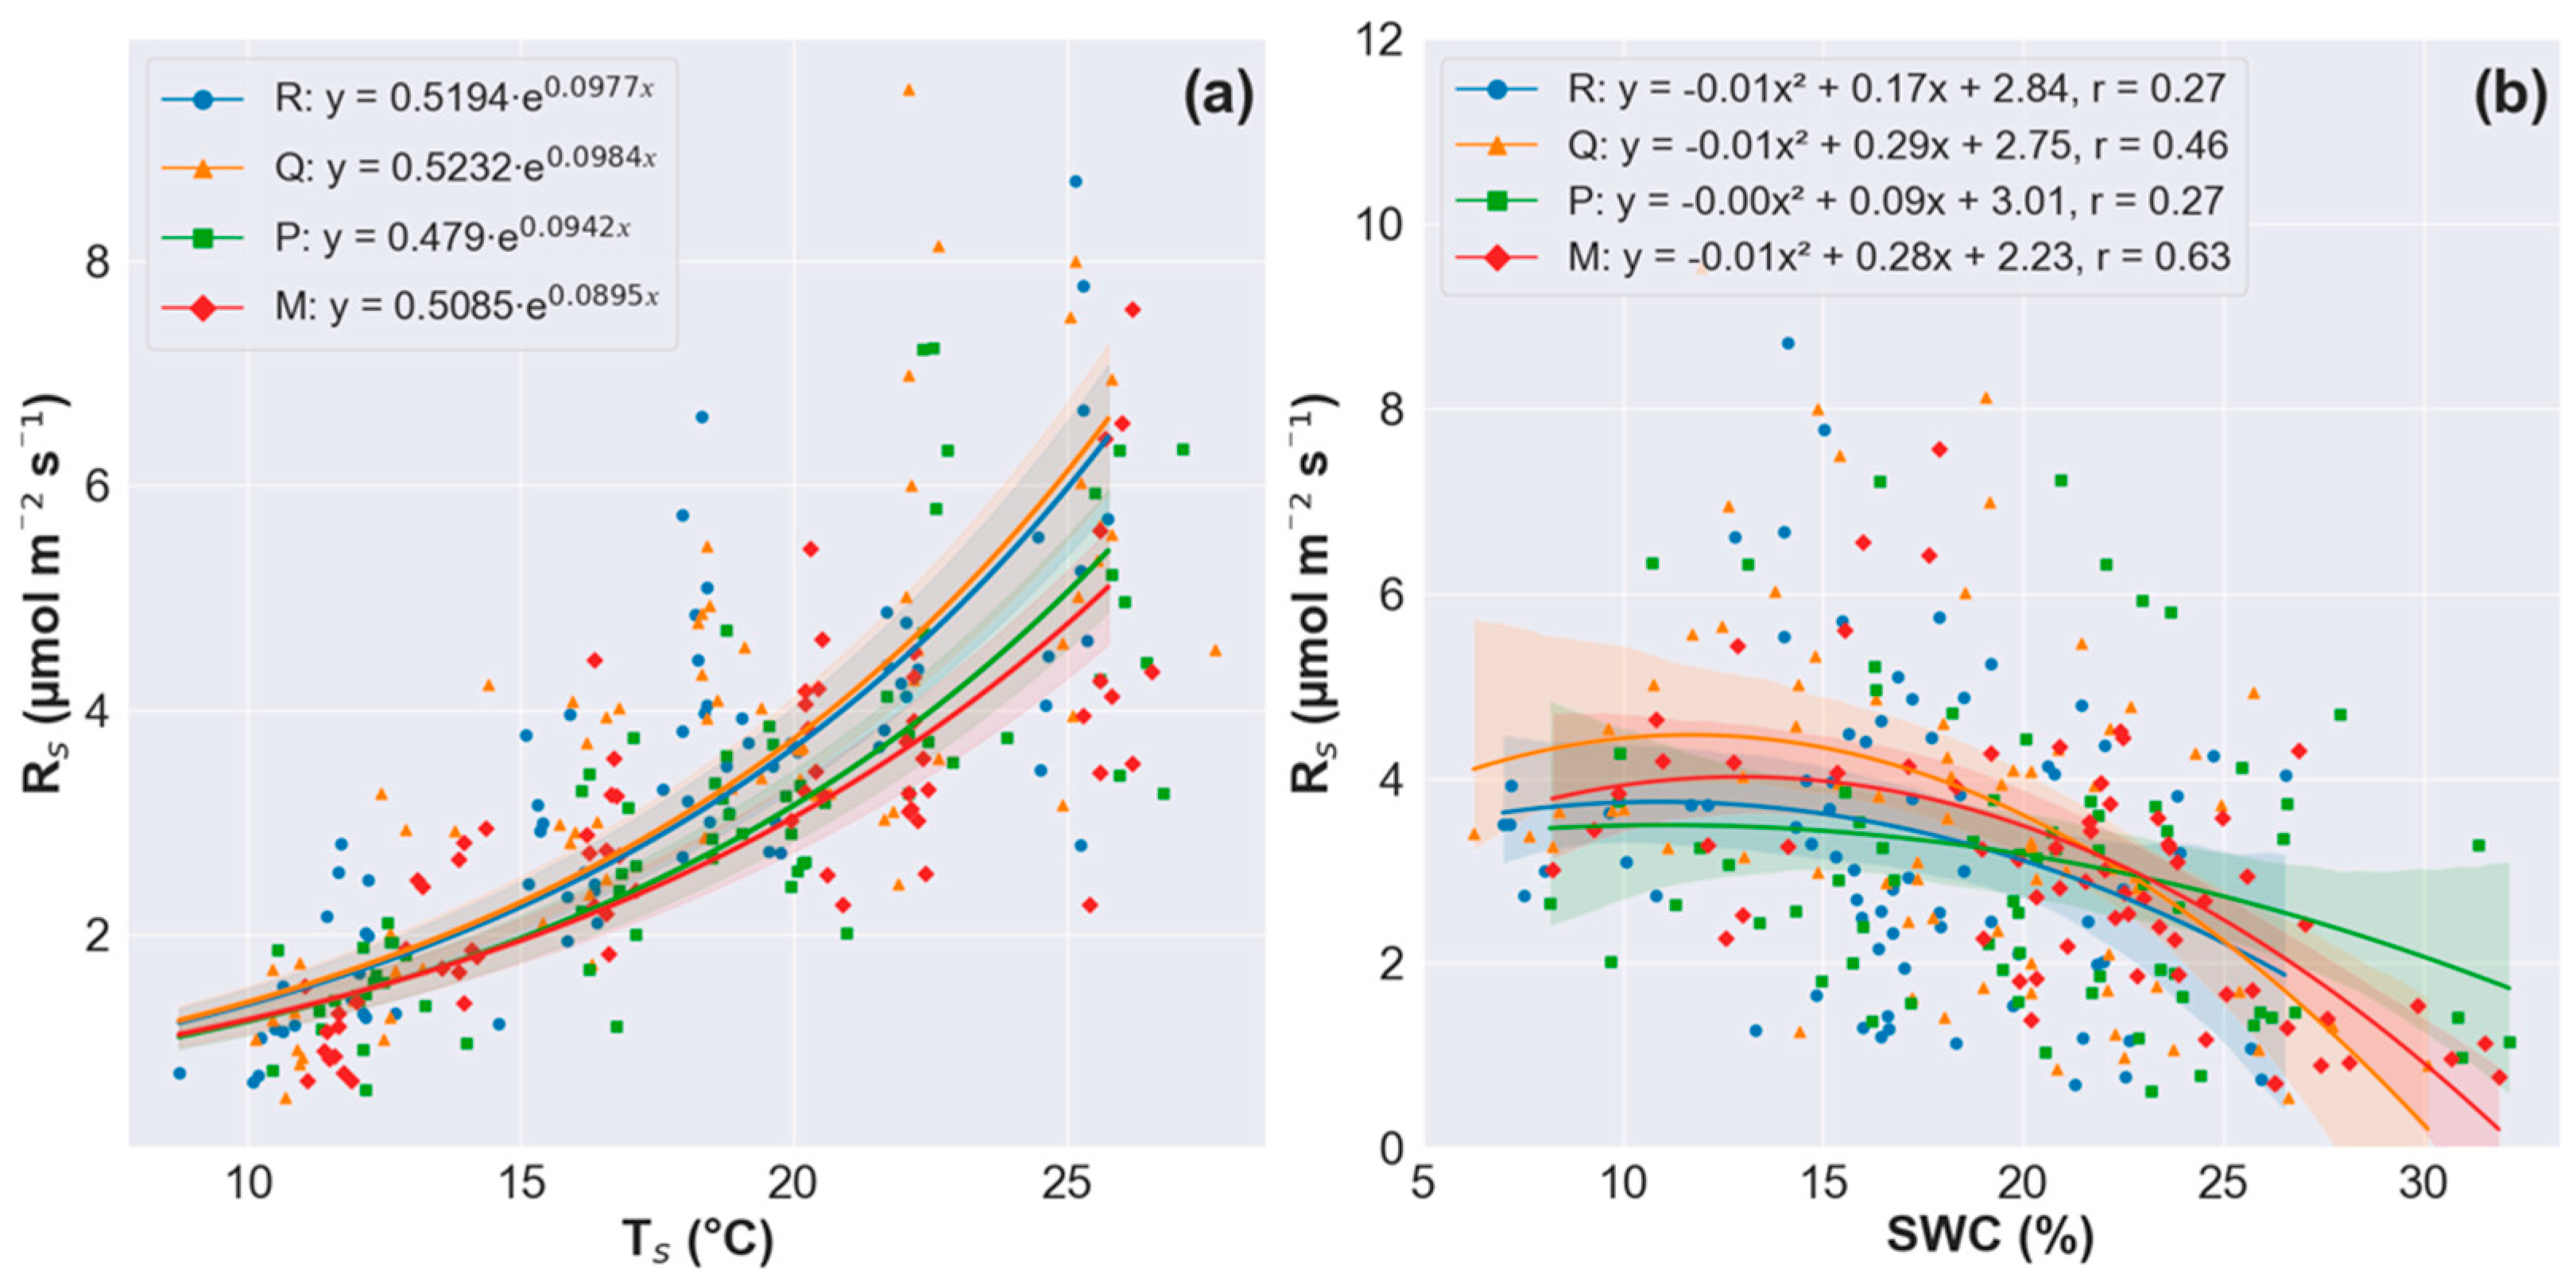
RS of all plantations was significantly influenced by TS (p < 0.05) (Figure 3a). The exponential relationships between TS and RS accounted for approximately 79%–82% of the RS variability in each plantation (Table 4). Although not statistically significant, RS in R and Q plantations tended to be more sensitive to TS, whereas RS in M plantation exhibited the lowest sensitivity to TS. R0 showed no significant difference among the plantations, but R25 was significantly higher in R (6.20 ± 0.38 µmol m−2 s−1) and Q (6.33 ± 0.18 µmol m−2 s−1) plantations than M (5.00 ± 0.45 µmol m−2 s−1) plantation, while P (5.37 ± 0.23 µmol m−2 s−1) plantation showed intermediate values (Table 4). Moreover, we found a significant correlation between SWC and RS using a second-order polynomial function in Q and M plantations, whereas R and P plantations exhibited a similar trend but without statistical significance (Figure 3b). The quadratic form of SWC characterized the two-phase effect of SWC on RS: RS in Q and M plantation increased with increasing SWC when SWC was within the range of 5%–15% but then decreased with further increase in SWC.

3.4. Relationships Between Soil Physicochemical Properties and Traits of Fine Roots

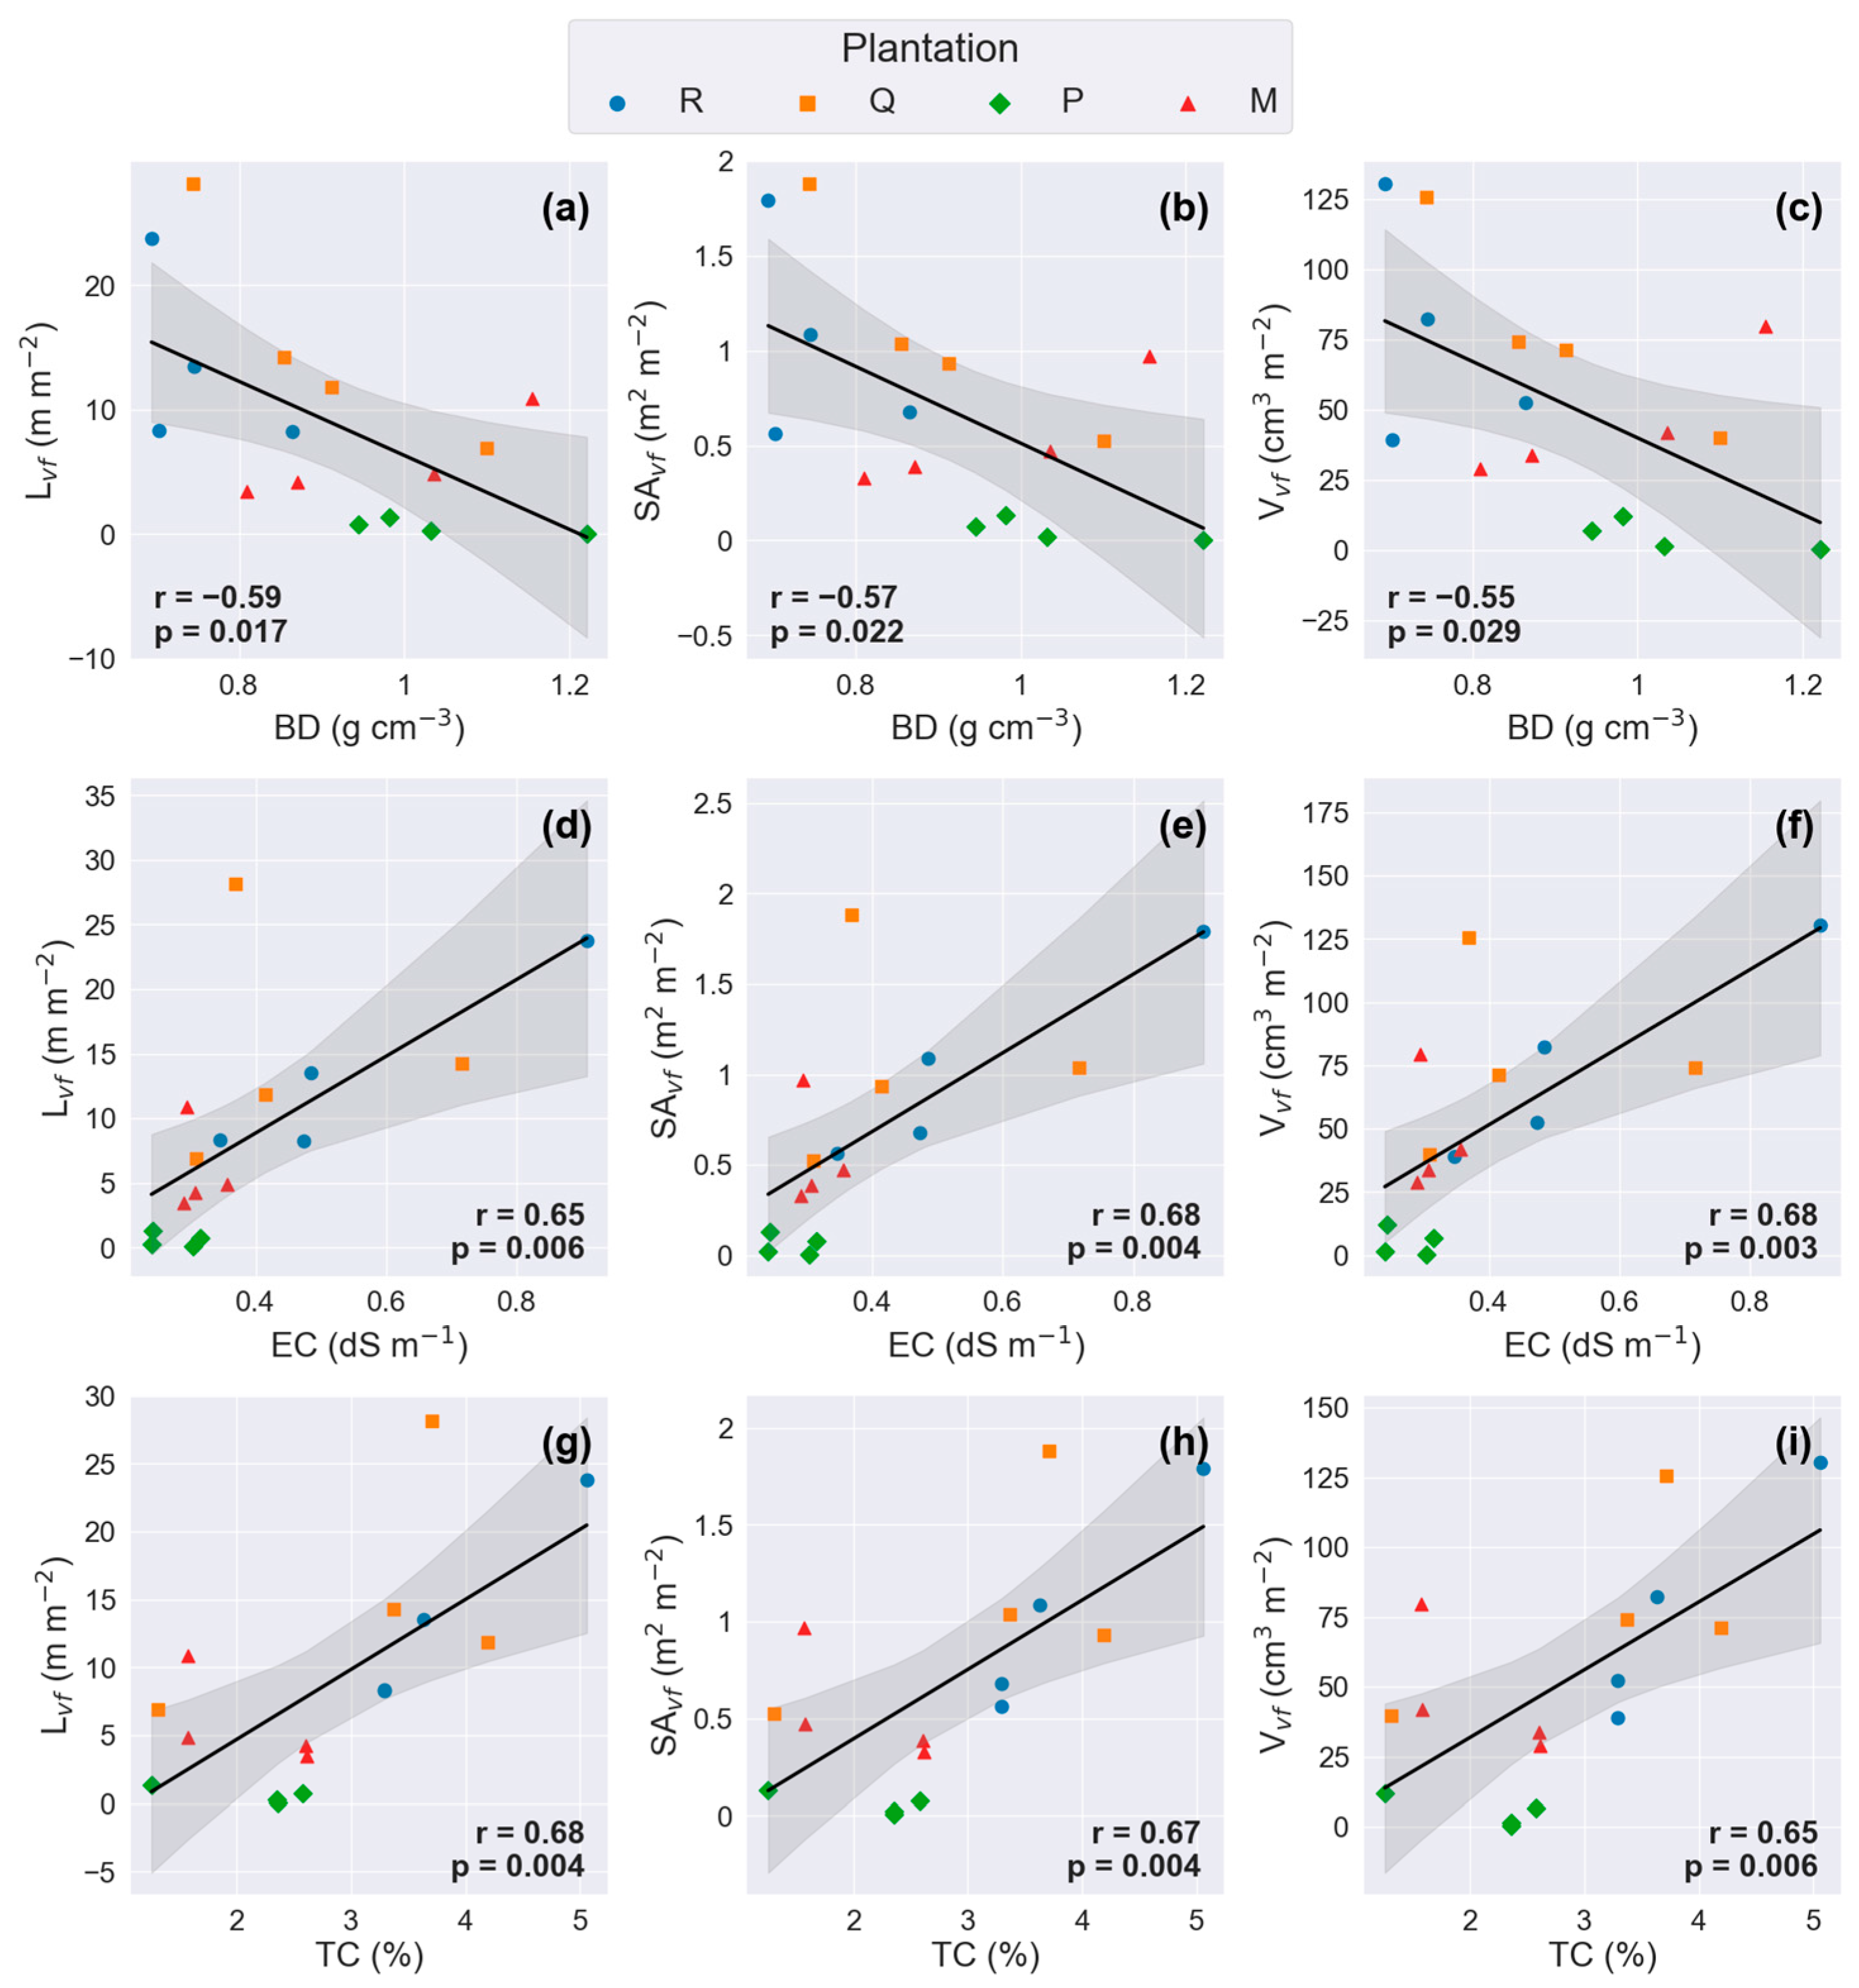
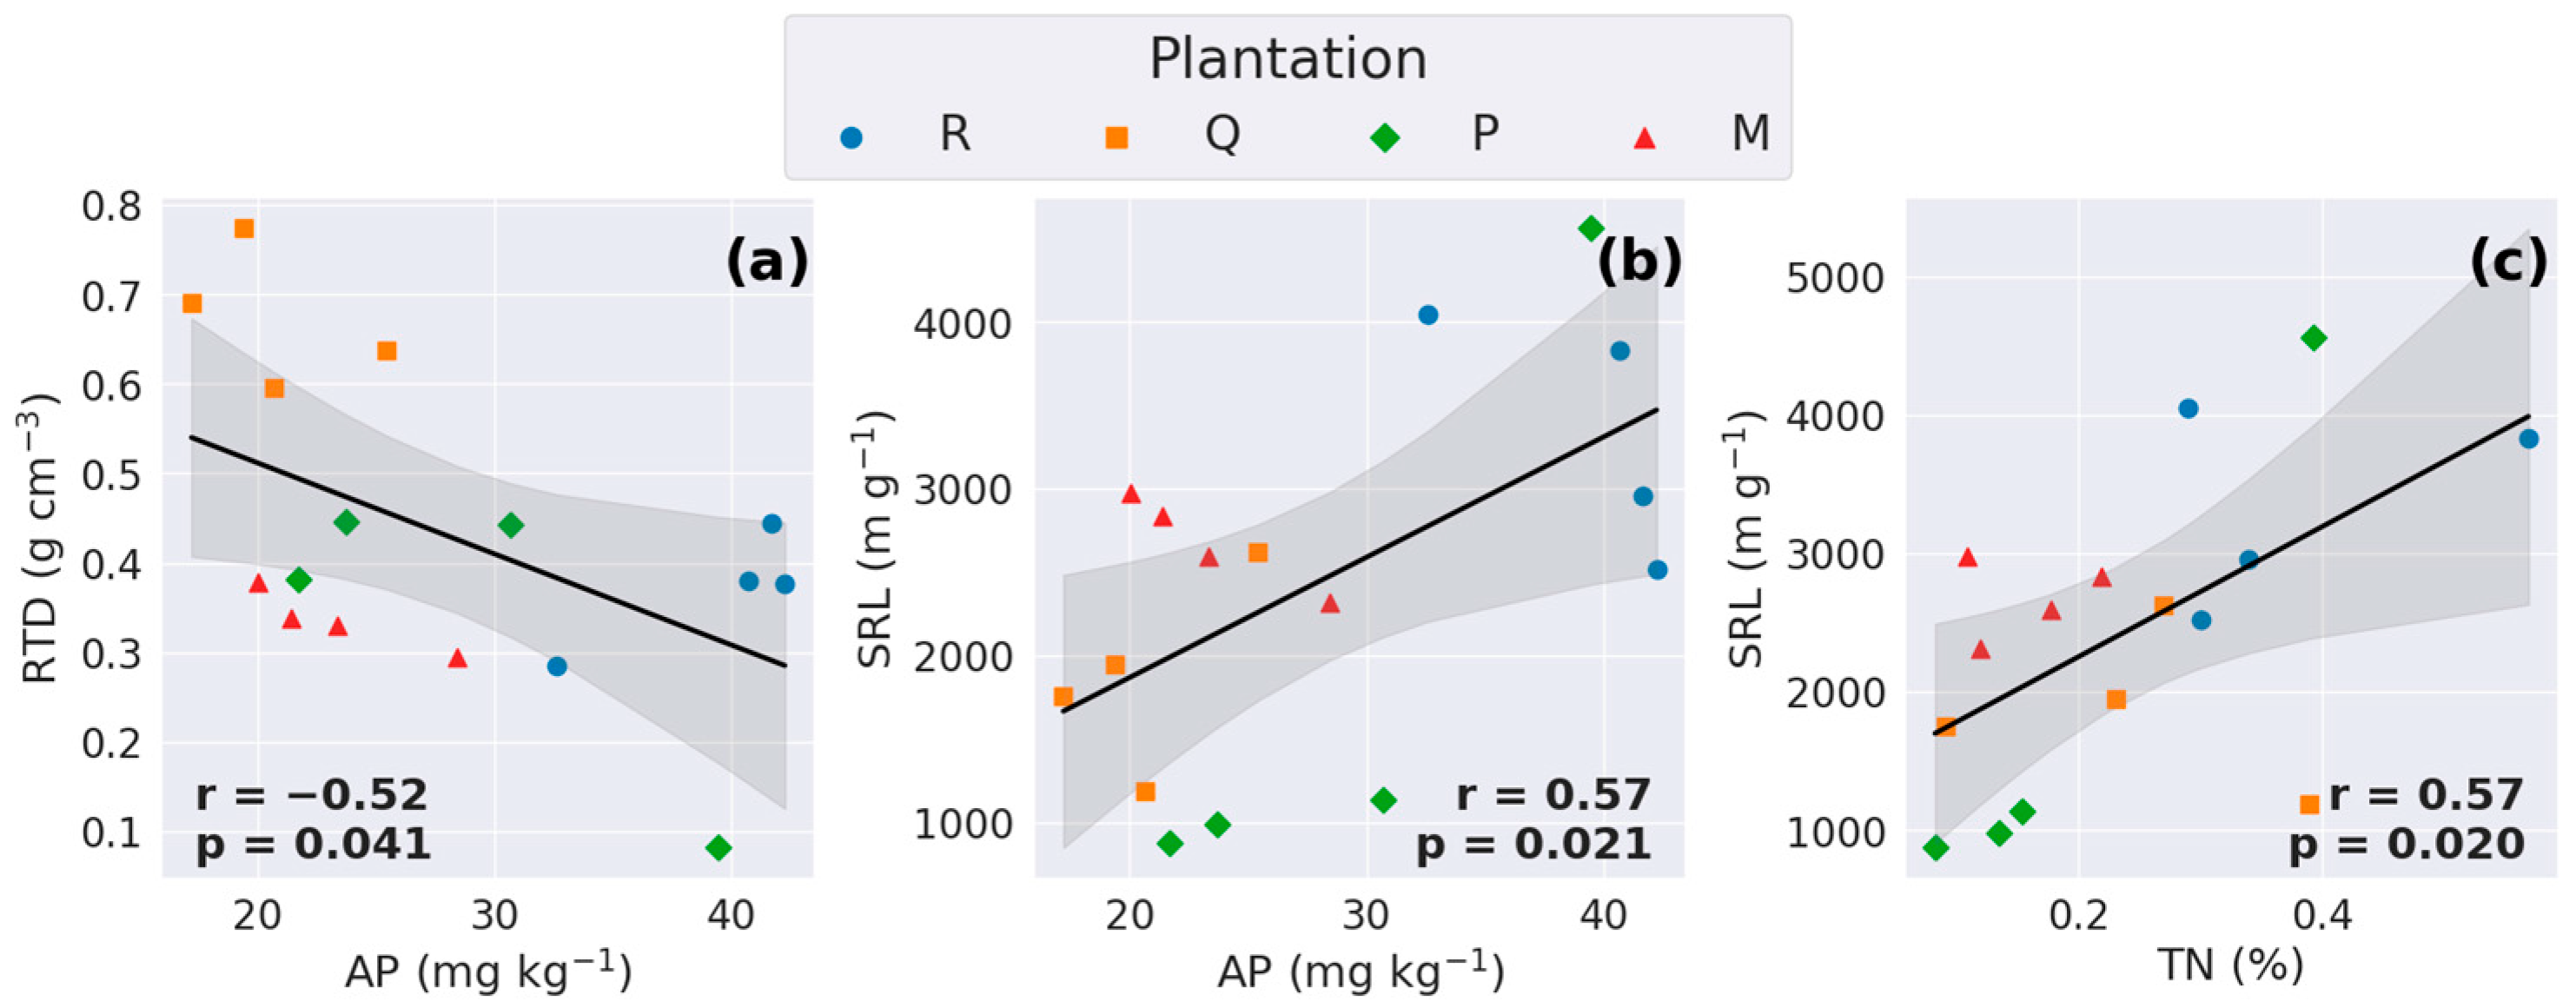
Morphological traits of very-fine roots showed significant correlation with some soil physicochemical properties. BD was negatively correlated with morphological traits of very-fine (≤0.5 mm in diameter) roots (Figure 4). Lvf significantly decreased when BD increased. SAvf and Vvf also showed significant negative correlation with BD. EC showed a positive correlation with the morphological traits of very-fine roots. Lvf, SAvf, and Vvf significantly increased when EC increased. TC also showed a positive correlation with fine root morphological traits. Lvf, SAvf, Vvf significantly increased when TC increased. Among the soil physicochemical properties, EC (r = 0.65, 0.68) was found to be the most important factor to predict the morphological traits of very-fine roots (Lvf, SAvf, and Vvf). The relationships between morphological traits of fine roots and soil properties showed patterns like those of very-fine roots. Ltotal exhibited significant correlation with BD, while Ltotal and SAtotal showed significant correlation with EC and TC (Figure S1). RTD showed a negative correlation with AP, while SRL significantly increased when TN and AP increased (Figure 5).

3.5. Relationships of RS with Soil Physicochemical Properties and Morphological Traits of Fine Roots

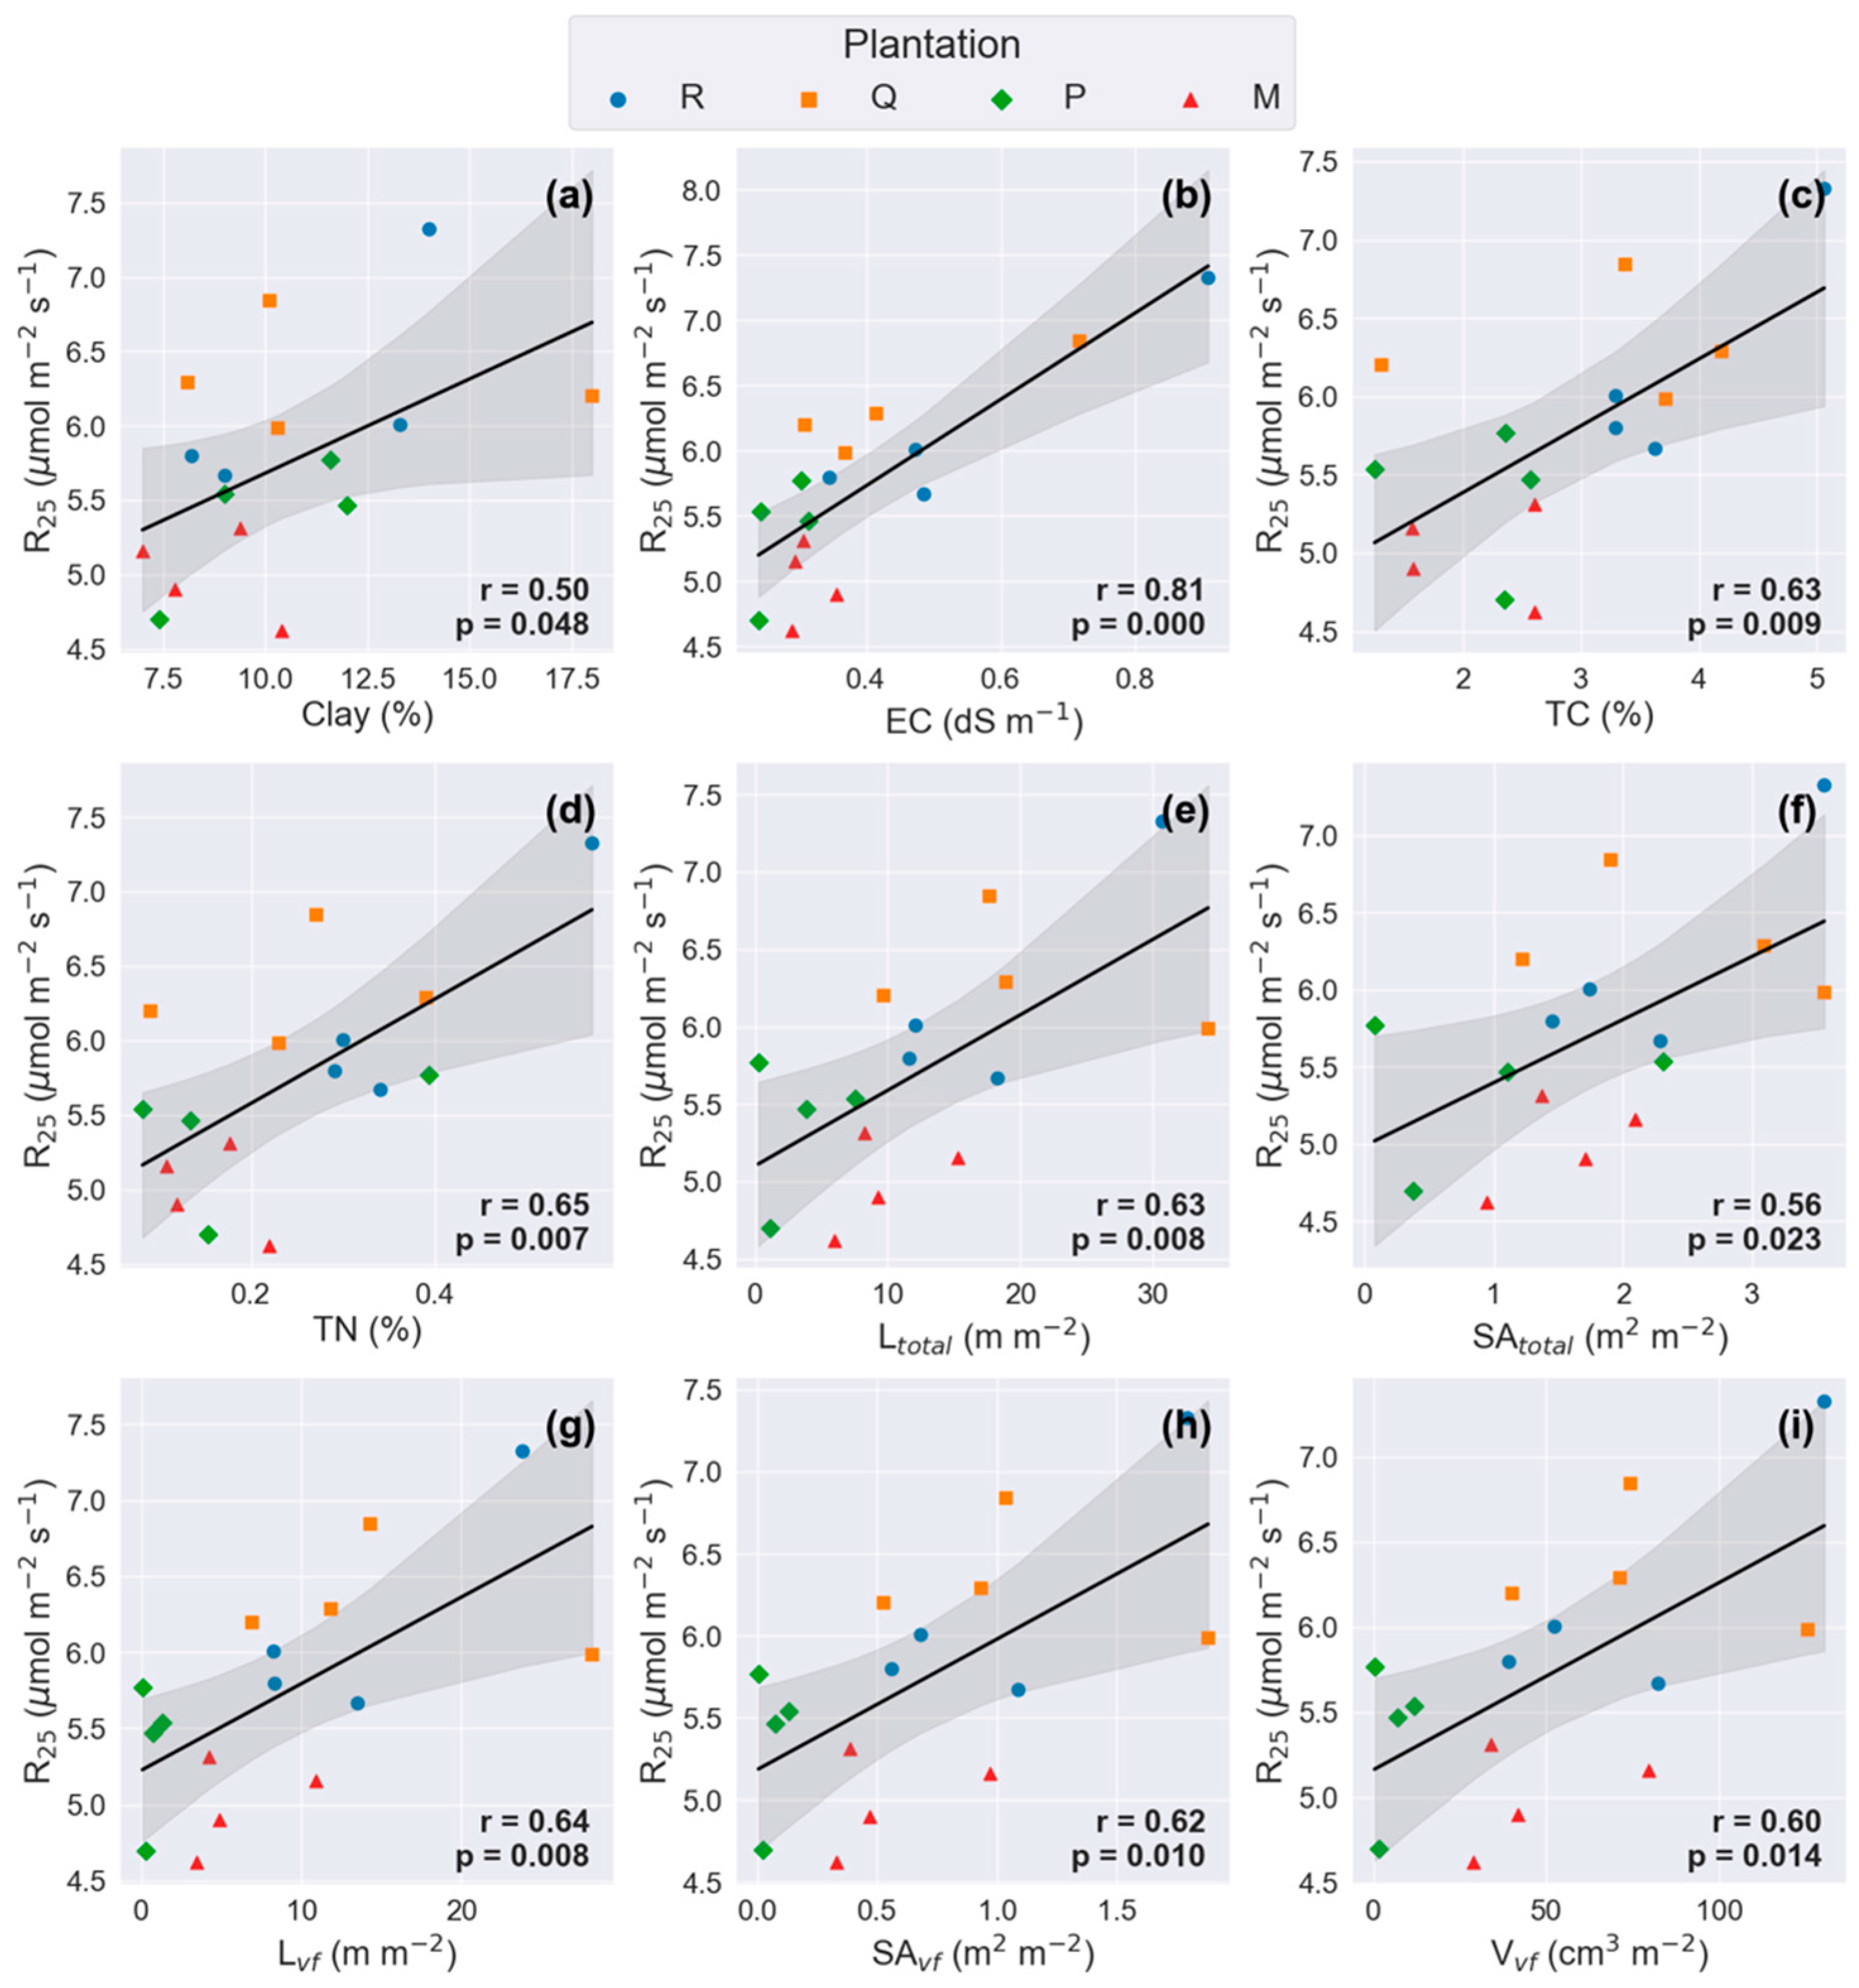
Soil physicochemical properties and morphological traits of fine roots were found to be correlated with R25 (Figure 6). Among the soil properties, EC (r = 0.81) was found to be the most major factor to understand R25, followed by TN (r = 0.65), TC (r = 0.63), and clay (r = 0.50). For morphological traits of fine roots, traits of very-fine roots, such as Lvf, SAvf, and Vvf, exhibited stronger and more significant correlations with R25 compared to other diameter classes.

3.6. Multivariate Integration of Soil Properties, Fine Root Traits, and RS

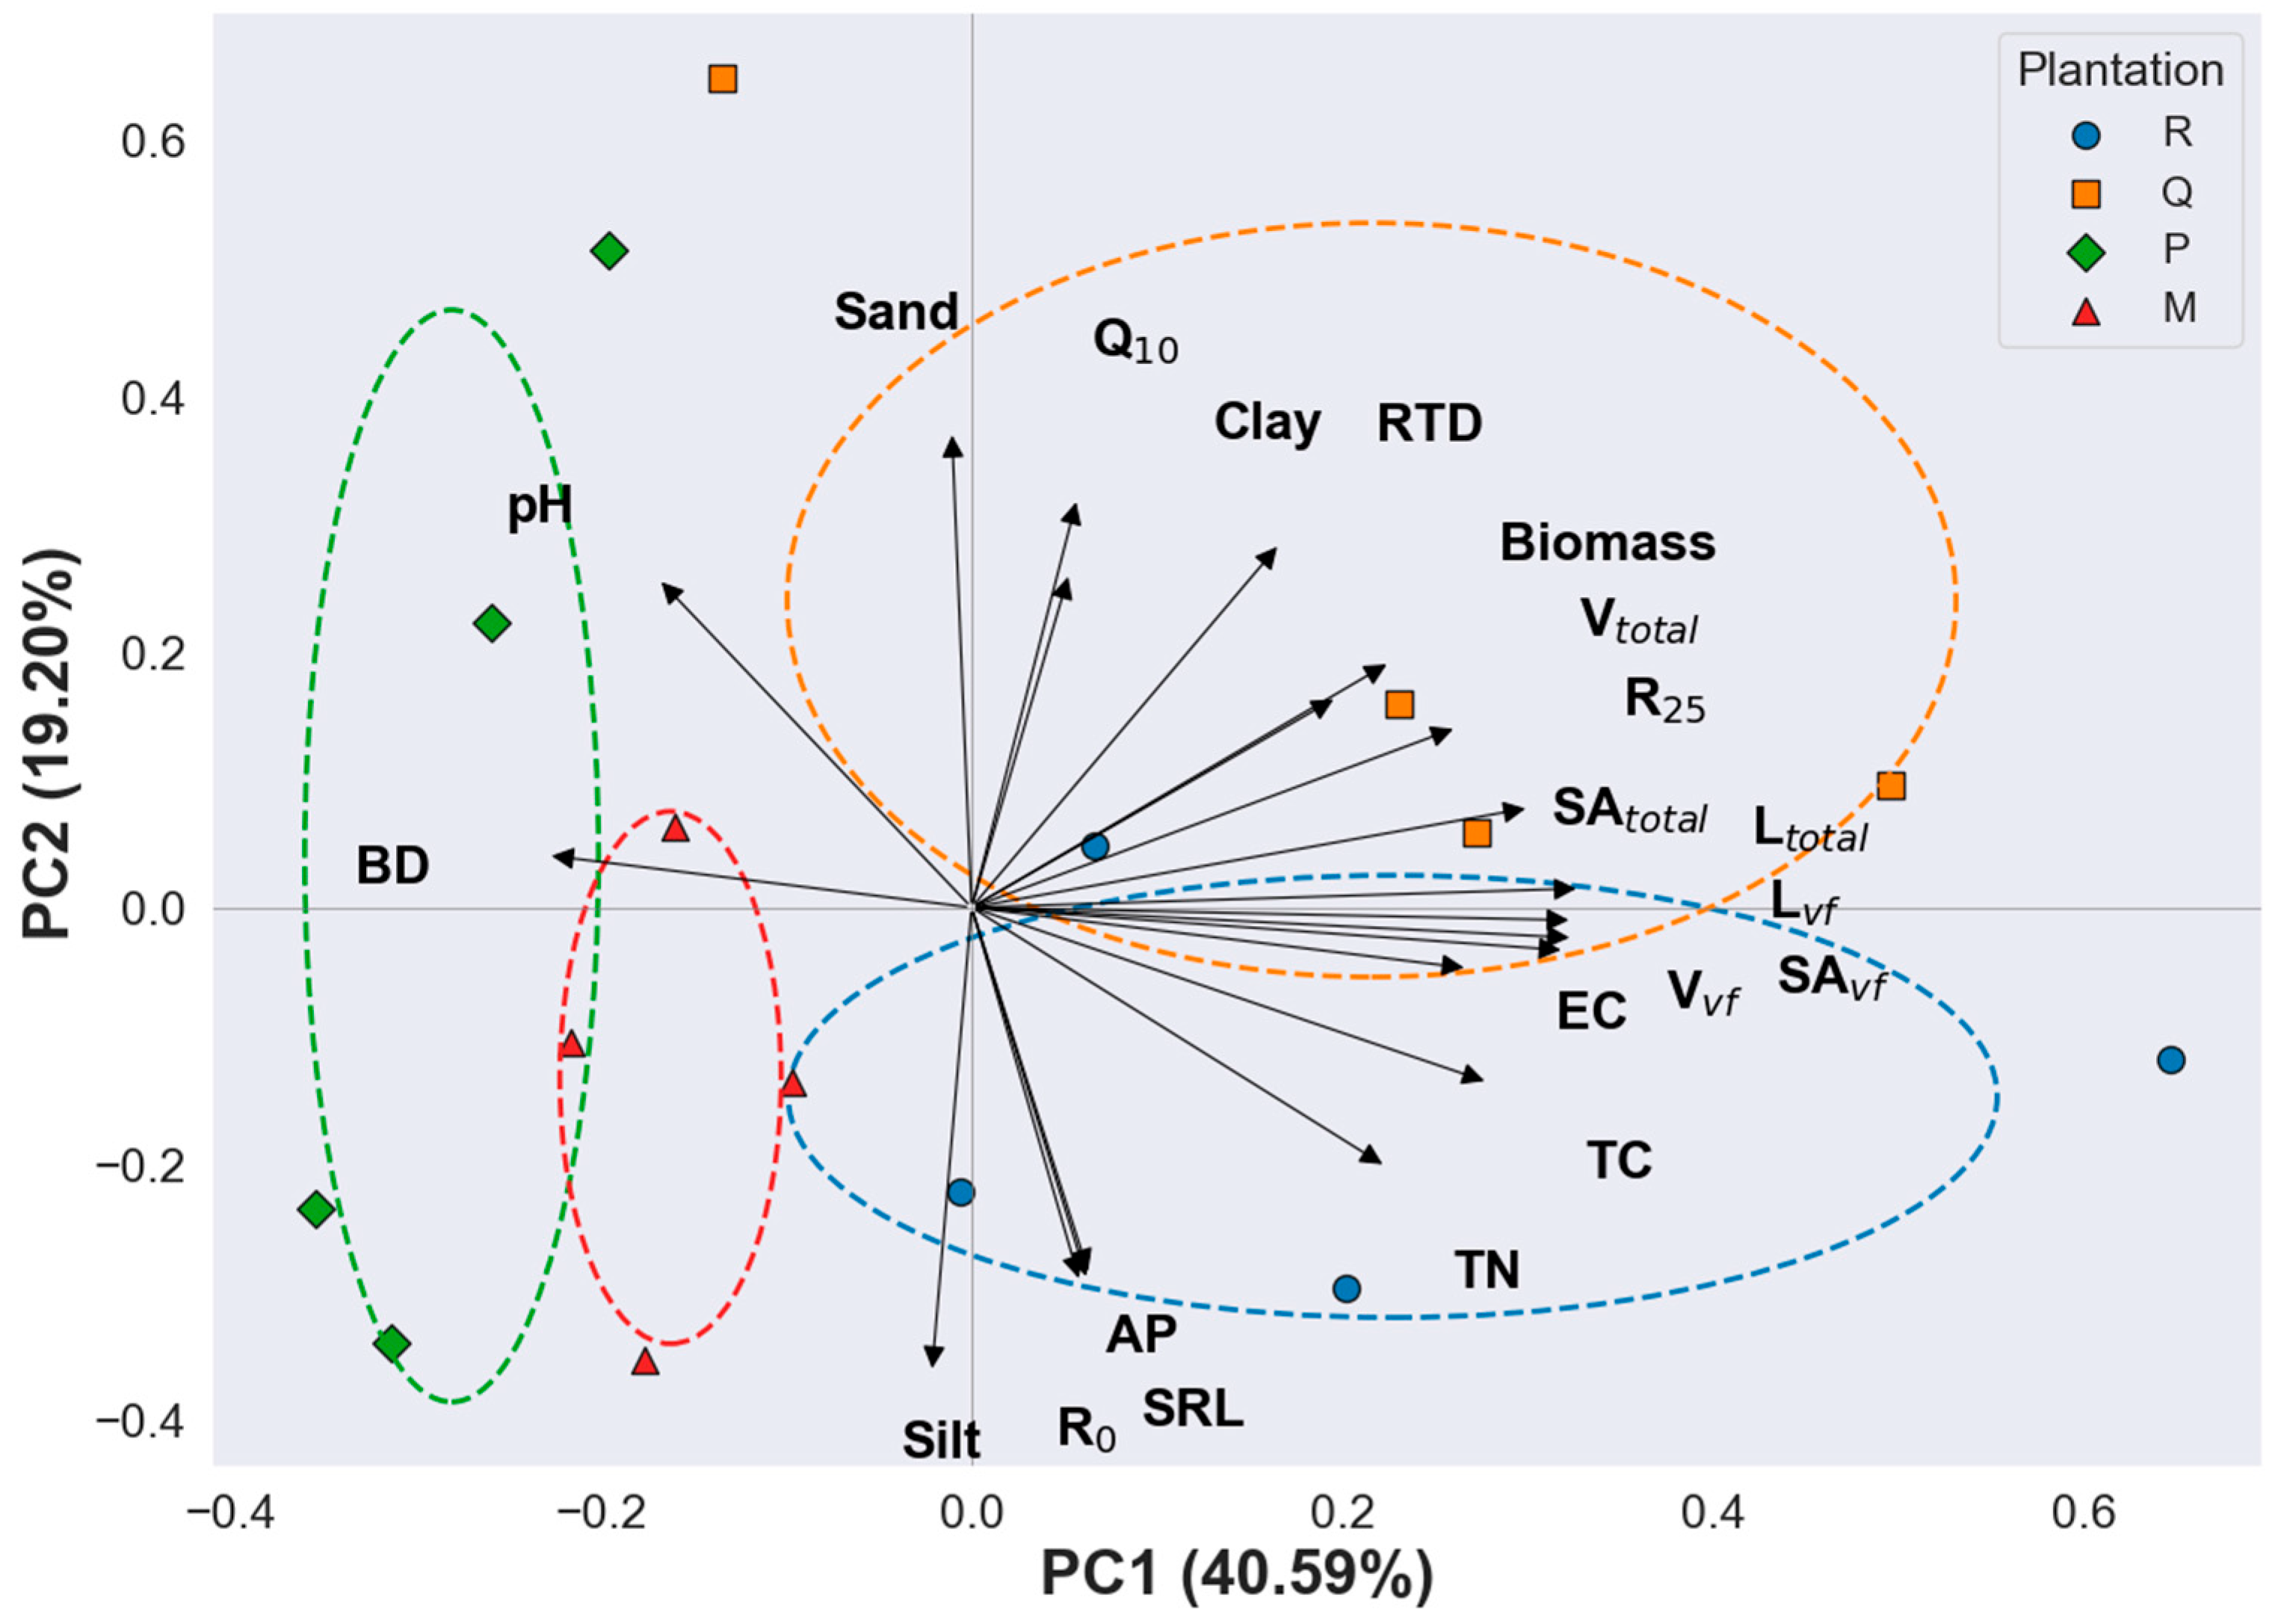
The first two axes of the PCA accounted for 59.79% of the total variance in soil physicochemical properties, fine root morphological traits, and RS parameters (R0, R25, and Q10) (Figure 7). PC1 (40.59%) was predominantly associated with fine root traits, particularly RTD, SAtotal, Vtotal, and biomass, whereas PC2 (19.20%) primarily reflected the soil physical properties, including the sand, clay, and silt fractions. Along PC1, R and Q plantations were clearly separated from P and M plantations, indicating distinct fine root traits and their interaction with soil properties.

4. Discussion

4.1. Species Effects on Soil Physicochemical Properties Across the Four Plantations

Soil physical properties related to soil texture showed no significant differences among plantations. These results indicate that soil physical properties are less sensitive to vegetation type. Pérez-Bejarano et al. [30] reported that while tree species significantly influenced soil chemical properties, especially organic carbon and nutrient concentrations, differences in soil physical properties among species were generally small or not significant. In our study, significant differences in soil physical properties among plantations were observed in BD. The observed differences likely reflect species-specific differences in litter input, which appear to affect surface BD most directly. Moreover, BD showed negative correlations with morphological traits of very-fine roots (Lvf, SAvf, and Vvf) (Figure 4a–c), indicating that a species with greater fine root production contributes to lower BD, and the reduced BD in turn provides more favorable conditions for fine root elongation.
TC and TN tend to be higher in plantations of deciduous broad-leaved species than in other plantations without statistical significance. Soil pH and EC also did not differ significantly among the plantations. However, soil AP concentration was significantly higher in the R plantation, despite R. pseudoacacia being a nitrogen-fixing species with relatively high phosphorus demand [31]. One possible explanation is that high AP concentrations in plant tissues, particularly leaves and roots, can result in greater AP return to the forest floor through litter. Because the decomposition of such litter strongly influences surface soils (0–10 cm), this pathway could contribute to the elevated AP levels observed in the topsoil of the R plantation [32]. Further studies analyzing leaf stoichiometry, such C:N:P ratios, are needed to better understand nutrient dynamics and their role in regulating soil phosphorus availability.

4.2. Species Effects on Morphological Traits of Fine Roots Across the Four Plantations

Plants promote the development of fine roots to improve the overall efficiency of nutrient uptake. Therefore, the amount and morphological traits of fine roots may vary depending on the nutrient requirements of each species. Our results showed no significant variation in biomass among the plantations; however, some morphological traits of fine roots exhibited significant differences (Table 3). Ltotal, SAvf, and Vvf in plantations of deciduous broad-leaved species showed significantly higher values than P plantation, and Lvf in Q plantation exhibited significantly higher values than P plantation. These results indicate species-specific acquisition strategies of nutrients and water through fine roots, which are significantly influenced by phenological characteristics (Figure 7) [33,34].
However, even within deciduous broadleaved species, the two plantations (R and Q plantations) exhibited different strategies for increasing fine roots. The lower RTD observed in R plantation indicates that this species produces lighter roots with reduced carbon investment per unit volume. Such a strategy facilitates rapid root elongation and efficient soil exploration, which is typical of pioneer species aiming for fast nutrient acquisition [35]. In contrast, Q plantation exhibited a significantly higher RTD, reflecting a conservative strategy in which roots are constructed with greater carbon allocation, resulting in denser, mechanically robust tissues that can persist longer in the soil. This difference implies that Q. mongolica favors stable and long-term nutrient foraging, whereas R. pseudoacacia prioritizes fast nutrient uptake and turnover [36]. These contrasting strategies are consistent with the multidimensional root economic spectrum described by [37], where high RTD is associated with increased root longevity and lower turnover.
Furthermore, our study revealed that the morphological differences in fine roots among plantations were primarily attributed to variations in the very-fine roots. Compared to Ltotal (p = 0.022), Lvf (p = 0.018) showed more pronounced differences among the plantations. Similarly, although SAtotal and Vtotal showed no statistically significant differences among plantations, they exhibited a trend of interspecific variation that became significant when considering the very-fine root fractions, as reflected in SAvf and Vvf.

4.3. RS,TS, and SWC

Seasonal variation of RS was observed in all plantations; however, the RS rate did not differ significantly among plantations (Figure 2b). This can be attributed to the lack of substantial differences in most of the soil physicochemical properties across plantations, which may have masked species-specific effects on basal respiration (R0) [38]. RS was strongly correlated with TS, with exponential models explaining over 79% of its variation, consistent with previous studies in temperate forests [39,40,41]. Plantations of deciduous broad-leaved species tended to exhibit higher Q10 values than coniferous species, suggesting greater seasonal fluctuations in belowground activity [42]. This likely reflects enhanced root growth and microbial respiration during warmer periods in deciduous stands. After normalizing RS to 25 °C, R25 differed significantly among plantations, despite similar R0 values. This finding indicates that species-specific differences in RS become more pronounced under high-temperature conditions, likely due to the elevated metabolic activity of fine roots and associated rhizosphere microbes [43]. SWC also showed a nonlinear effect on RS, significantly in Q and M plantations, where moderate SWC enhanced respiration, but excessive moisture suppressed it. In the R plantation, the RS–SWC relationship was not statistically significant, possibly due to the relatively steep slope (Table 1), which may have facilitated drainage and limited the occurrence of high SWC conditions. As a result, SWC values in R rarely exceeded 25% (Figure 3), potentially constraining the detection of the Rs–SWC response pattern [44,45]. The non-significant relationship between RS and SWC in P plantation may reflect the lower responsiveness of evergreen coniferous species to changes in SWC [46]. Further studies should aim to minimize variation in microclimate and RS caused by topographic differences, while ensuring similar stand age across plantations, to better clarify the RS–SWC relationship.

4.4. The Correlation Between RS and Soil Physicochemical Properties

R25 showed a significant correlation with soil physicochemical properties (Figure 6a–d). Among soil physical properties, clay only showed a positive correlation with R25. Since soil texture of all plantations is classified as loam, all plantations are predicted to have moderate soil drainage. So, higher clay content should be helpful to enhance both the water and nutrient availability in the soil. EC was found to be the most significant factor to predict R25 among the soil physicochemical properties and morphological traits of fine roots. This was not a common result in previous studies of RS. Many previous studies reported EC as a negative indicator of RS in terms of salinization stress [47,48,49]. Yang et al. [50] reported that in an incubation experiment, increasing soil EC (ranging from 0.2 to 21.6 dS m−1) led to a decrease in basal respiration, even though it showed a positive correlation with microbial diversity. However, a study conducted by Drake et al. [51] reported a positive trend between RS and field-measured EC (0.1–4.0 dS m−1). Additionally, EC within an appropriate range tends to indicate adequate soil moisture and nutrient availability, reflecting a healthy soil environment [52]. A study conducted by Kim and Park [53] revealed that under loam and sandy loam soils with an appropriate range (10%–25%) of water supply, soil EC was strongly associated with plant-available nutrients. They further demonstrated that the addition of organic matter enhanced this relationship by increasing exchangeable ions, thereby confirming that EC can serve as a reliable indicator of nutrient availability under non-saline conditions. So, within our study range (0.28–0.55 dS m−1), EC could be a positive factor to predict belowground carbon dynamics by indicating adequate nutrient availability that facilitates root metabolism and stimulates microbial activity. Even if they are not as much as EC, TC and TN also showed significant correlation with R25. These results indicate that higher decomposition and root activity can be possible with high storage of carbon and nutrients in the soil.

4.5. The Correlation Between RS and Morphological Traits of Very-Fine Roots

Interestingly, the soil properties that were most strongly correlated with RS—such as EC and TC—also exhibited significant correlations with the morphological traits of very-fine roots (Figure 4 and Figure 5). This pattern implies a potential mediating role of root morphology, wherein favorable soil conditions promote the development of longer and more voluminous very-fine roots, which in turn enhance soil CO2 efflux. Building upon this linkage, R25 exhibited particularly strong correlations with the morphological traits of very-fine roots, further emphasizing their central role in belowground CO2 efflux regulation (Figure 6). In terms of proportional contribution within the fine root pool, Lvf accounted for approximately 74% of Ltotal, while SAvf and Vvf comprised 46% and 21% of SAtotal and Vtotal, respectively. Notably, Ltotal, which had the highest proportion of very-fine roots among the three traits, also showed the strongest correlation with R25 (r = 0.63). This suggests that the influence of fine roots on RS is largely driven by the very-fine root fraction. Among the morphological traits of very-fine roots, Lvf showed the highest correlation with R25 (r = 0.64), followed by SAvf (r = 0.62) and Vvf (r = 0.60). These correlations may be attributed to the fact that very-fine roots typically exhibit higher respiration rates per unit biomass [18] and faster decomposition rates, which in turn stimulate microbial respiration [19,54]. As such interactions may be influenced by stand age [55,56], the findings from middle-aged plantations suggest the need for further research on age-dependent relationships between fine root traits and RS.

5. Conclusions

This study highlights the pivotal role of morphological traits of fine roots—particularly the very-fine root fraction (≤0.5 mm)—in regulating RS across the plantations of different tree species. Compared to fine root biomass, morphological traits such as length, surface area, and volume of very-fine roots exhibited stronger interspecific differences and closer correlations with RS. These findings suggest that root morphology, rather than root biomass alone, may better explain the variation in RS among plantations. Furthermore, our results underscore the importance of distinguishing very-fine roots from the broader fine root pool to enhance our understanding of belowground carbon cycling in forest ecosystems. These results can be integrated into process-based models to improve predictions of belowground CO2 dynamics. However, this study was conducted in only four species from a single urban forest park. So, results of the study may not be generalizable to other ecosystems. Moreover, this study did not include measurements of root nutrient concentrations (e.g., C and N) or microbial community characteristics—factors that play essential roles in mediating rhizosphere processes. Future research should integrate analyses of root nutrient stoichiometry, microbial functional diversity, and respiration of very-fine roots to better capture the mechanisms underlying soil carbon dynamics.

Supplementary Materials

The following supporting information can be downloaded at: https://www.mdpi.com/article/10.3390/f16101513/s1: Figure S1—Correlation between soil physicochemical properties and morphological traits of fine root (≤2.0 mm in diameter). (a) Correlation between bulk density (BD) and fine root length (Ltotal), (b,c) Correlations of electrical conductivity (EC) with Ltotal and fine root surface (SAtotal), respectively, (d,e) Correlations of total carbon (TC) with Ltotal and SAtotal, respectivelytitle

Author Contributions

Conceptualization, N.J.N.; methodology, N.J.N.; software, S.W.L.; validation, N.J.N.; formal analysis, S.W.L.; investigation, S.W.L., K.H.S., J.W.J., and S.H.L.; resources, N.J.N.; data curation, S.W.L.; writing–original draft preparation, S.W.L.; writing–review and editing, N.J.N., N.K., and S.K.; visualization, S.W.L.; supervision; N.J.N.; project administration, N.J.N.; funding acquisition, S.K. and N.J.N. All authors have read and agreed to the published version of the manuscript.

Funding

This research was funded by the National Institute of Forest Science (No. FE0100-2022-2025) and the National Research Foundation of Korea (NRF), grants (No. RS-2023-00213945).

Data Availability Statement

The data presented in this study are available on request from the corresponding author. The authors have reviewed and edited the output and take full responsibility for the content of this publication.

Conflicts of Interest

The authors declare no conflicts of interest.

References

  1. IPCC. Climate Change 2021: The Physical Science Basis. Contribution of Working Group I to the Sixth Assessment Report of the Intergovernmental Panel on Climate Change; Cambridge University Press: Cambridge, UK; New York, NY, USA, 2021; Available online: https://www.ipcc.ch/report/ar6/wg1/ (accessed on 15 June 2025).
  2. Abbass, K.; Qasim, M.Z.; Song, H.; Murshed, M.; Mahmood, H.; Younis, I. A review of the global climate change impacts, adaptation, and sustainable mitigation measures. Environ. Sci. Pollut. Res. 2022, 29, 42539–42559. [Google Scholar] [CrossRef] [PubMed]
  3. Friedlingstein, P.; O’Sullivan, M.; Jones, M.W.; Andrew, R.M.; Hauck, J.; Landschützer, P.; Le Quéré, C.; Li, H.; Luijkx, I.T.; Olsen, A.; et al. Global Carbon Budget 2024. Earth Syst. Sci. Data Discuss. 2024, 17, 965–1039. [Google Scholar] [CrossRef]
  4. Bonan, G.B. Forests and climate change: Forcings, feedbacks, and the climate benefits of forests. Science 2008, 320, 1444–1449. [Google Scholar] [CrossRef]
  5. Baccini, A.; Walker, W.S.; Carvalho, L.; Farina, M.; Sulla-Menashe, D.; Houghton, R.A. Tropical forests are a net carbon source based on aboveground measurements of gain and loss. Science 2017, 358, 230–234. [Google Scholar] [CrossRef]
  6. Jobbágy, E.G.; Jackson, R.B. The vertical distribution of soil organic carbon and its relation to climate and vegetation. Ecol. Appl. 2000, 10, 423–436. [Google Scholar] [CrossRef]
  7. Bond-Lamberty, B.; Thomson, A. Temperature-associated increases in the global soil respiration record. Nature 2010, 464, 579–582. [Google Scholar] [CrossRef]
  8. Phillips, R.P.; Finzi, A.C.; Bernhardt, E.S. Enhanced root exudation induces microbial feedbacks to N cycling in a pine forest under long-term CO2 fumigation. Ecol. Lett. 2011, 14, 187–194. [Google Scholar] [CrossRef]
  9. Watts, J.D.; Natali, S.; Minions, C. Soil Respiration Maps for the Above Domain, 2016–2017; ORNL DAAC Data Set; Oak Ridge National Laboratory Distributed Active Archive Center: Oak Ridge, TN, USA, 2022. [CrossRef]
  10. Lee, M.S.; Lee, J.S.; Koizumi, H. Temporal variation in CO2 efflux from soil and snow surfaces in a Japanese cedar (Cryptomeria japonica) forest. Ecol. Res. 2007, 22, 215–222. [Google Scholar]
  11. Noh, N.J.; Son, Y.; Lee, S.K.; Yoon, T.K.; Seo, K.W.; Kim, C.; Lee, W.K.; Bae, S.W.; Hwang, J. Influence of stand density on soil CO2 efflux for a Pinus densiflora forest in Korea. J. Plant Res. 2010, 123, 411–419. [Google Scholar] [CrossRef]
  12. Fekete, I.; Varga, C.; Biró, B.; Tóth, J.A.; Várbíró, G.; Szabó, G.; Kotroczó, Z. The effects of litter production and litter depth on soil microclimate in a Central European deciduous forest. Plant Soil 2016, 398, 291–300. [Google Scholar] [CrossRef]
  13. Staněk, L.; Neruda, J.; Ulrich, R. Changes in the concentration of CO2 in forest soils resulting from the traffic of logging machines. J. For. Sci. 2025, 71, 250–267. [Google Scholar] [CrossRef]
  14. Lal, R. Managing soils for negative feedback to climate change and positive impact on food and nutritional security. Soil Sci. Plant Nutr. 2020, 66, 1–9. [Google Scholar] [CrossRef]
  15. Lee, S.H.; Park, M.W.; Chang, H.; Je, S.M.; Kim, G.J.; Noh, N.J. Effects of soil physical ameliorants on the growth and root morphology of Prunus yedoensis and Ginkgo biloba seedlings in compacted soils. J. For. Res. 2025, 30, 1–10. [Google Scholar] [CrossRef]
  16. Hobbie, S.E.; Oleksyn, J.; Eissenstat, D.M.; Reich, P.B. Plant species effects on nutrient cycling: Revisiting litter feedbacks. Trends Ecol. Evol. 2015, 30, 357–363. [Google Scholar] [CrossRef]
  17. Freschet, G.T.; Valverde-Barrantes, O.J.; Tucker, C.M.; Craine, J.M.; McCormack, M.L.; Violle, C.; Fort, F.; Blackwood, C.B.; Urban-Mead, K.R.; Iversen, C.M.; et al. Climate, soil and plant functional types as drivers of global fine-root trait variation. J. Ecol. 2017, 105, 1182–1196. [Google Scholar] [CrossRef]
  18. Makita, N.; Kosugi, Y.; Dannoura, M.; Takanashi, S.; Niiyama, K.; Kassim, A.R.; Nik, A.R. Patterns of root respiration rates and morphological traits in 13 tree species in a tropical forest. Tree Physiol. 2012, 32, 303–312. [Google Scholar] [CrossRef]
  19. Miyatani, K.; Tanikawa, T.; Makita, N.; Hirano, Y. Relationships between specific root length and respiration rate of fine roots across stands and seasons in Chamaecyparis obtusa. Plant Soil 2018, 423, 215–227. [Google Scholar] [CrossRef]
  20. Makita, N.; Kawamura, A.; Osawa, A. Size-dependent morphological and chemical properties of fine-root litter decomposition. Plant Soil 2015, 393, 283–295. [Google Scholar] [CrossRef]
  21. Karst, J.; Gaster, J.; Wiley, E.; Landhäusser, S.M. Relationships between root respiration rate and root morphology, chemistry, and anatomy in Larix gmelinii and Fraxinus mandshurica. Tree Physiol. 2013, 33, 579–589. [Google Scholar] [CrossRef] [PubMed]
  22. Noh, N.J.; Crous, K.Y.; Li, J.; Choury, Z.; Barton, C.V.M.; Arndt, S.K.; Reich, P.B.; Tjoelker, M.G.; Pendall, E. Does root respiration in Australian rainforest tree seedlings acclimate to experimental warming? Tree Physiol. 2020, 40, 1192–1204. [Google Scholar] [CrossRef] [PubMed]
  23. Han, M.; Zhu, B. Linking Root Respiration to Chemistry and Morphology across Species. Glob. Change Biol. 2021, 27, 1367–1381. [Google Scholar] [CrossRef] [PubMed]
  24. McCormack, M.L.; Guo, D.; Iversen, C.M.; Chen, W.; Eissenstat, D.M.; Fernandez, C.W.; Li, L.; Ma, C.; Ma, Z.; Poorter, H.; et al. Building a better foundation: Improving root-trait measurements to understand and model plant and ecosystem processes. New Phytol. 2017, 215, 27–37. [Google Scholar] [CrossRef]
  25. Freschet, G.T.; Pagès, L.; Iversen, C.M.; Comas, L.H.; Rewald, B.; Roumet, C.; Klimešová, J.; Zadworny, M.; Poorter, H.; Postma, J.A.; et al. A starting guide to root ecology: Strengthening ecological concepts and standardising root classification, sampling, processing and trait measurements. New Phytol. 2021, 232, 973–1122. [Google Scholar] [CrossRef]
  26. Valverde-Barrantes, O.J.; Smemo, K.A.; Blackwood, C.B. Fine Root Morphology Is Phylogenetically Structured, but Nitrogen Is Related to the Plant Economics Spectrum in Temperate Trees. Funct. Ecol. 2015, 29, 796–807. [Google Scholar] [CrossRef]
  27. Norris, M.D.; Blair, J.M.; Johnson, L.C. Effects of fire frequency on litter decomposition and nutrient release in a tallgrass prairie. Oecologia 2012, 170, 587–598. [Google Scholar]
  28. Aponte, C.; García, L.V.; Marañón, T.; Gardes, M. Tree species effects on nutrient cycling and soil biota: A feedback mechanism favouring species coexistence. For. Ecol. Manag. 2013, 309, 36–46. [Google Scholar] [CrossRef]
  29. Russell, A.E.; Raich, J.W.; Valverde-Barrantes, O.J.; Fisher, R.F. Tree species effects on soil properties in experimental plantations in tropical moist forest. Soil Sci. Soc. Am. J. 2007, 71, 1389–1397. [Google Scholar] [CrossRef]
  30. Pérez-Bejarano, A.; Mataix-Solera, J.; Zornoza, R.; Guerrero Maestre, C.; Arcenegui, V.; Mataix-Beneyto, J.J.; Cano-Amat, S. Influence of plant species on physical, chemical and biological soil properties in a Mediterranean forest soil. Eur. J. For. Res. 2010, 129, 15–24. [Google Scholar] [CrossRef]
  31. Zhang, W.; Liu, W.; Xu, M.; Deng, J.; Han, X.; Yang, G.; Feng, Y.; Ren, G. Response of forest growth to C:N:P stoichiometry in plants and soils during Robinia pseudoacacia afforestation on the Loess Plateau, China. Geoderma 2019, 337, 280–289. [Google Scholar] [CrossRef]
  32. Lambers, H.; Plaxton, W.C. Phosphorus: Back to the Roots. In Annual Plant Reviews, Volume 48: Phosphorus Metabolism in Plants; Plaxton, W.C., Lambers, H., Eds.; John Wiley & Sons: Chichester, UK, 2015; pp. 3–22. [Google Scholar] [CrossRef]
  33. McCormack, M.L.; Adams, T.S.; Smithwick, E.A.H.; Eissenstat, D.M. Variability in root production, phenology, and turnover rate among 12 temperate tree species. Ecology 2014, 95, 2224–2235. [Google Scholar] [CrossRef]
  34. Zhao, Y.; Liu, Q.; Liu, L.; Liu, S.; Zhang, C. Fine root phenology differs among subtropical evergreen broadleaved forests with increasing tree diversities. For. Ecol. Manag. 2017, 404, 326–334. [Google Scholar] [CrossRef]
  35. Comas, L.H.; Eissenstat, D.M. Patterns in root trait variation among 25 co-existing North American forest species. New Phytol. 2009, 182, 919–928. [Google Scholar] [CrossRef] [PubMed]
  36. Reich, P.B. The world-wide ‘fast–slow’ plant economics spectrum: A traits manifesto. J. Ecol. 2014, 102, 275–301. [Google Scholar] [CrossRef]
  37. Kramer-Walter, K.R.; Bellingham, P.J.; Millar, T.R.; Smissen, R.D.; Richardson, S.J.; Laughlin, D.C. Root traits are multidimensional: Specific root length is independent from root tissue density and the plant economic spectrum. J. Ecol. 2016, 104, 1299–1310. [Google Scholar] [CrossRef]
  38. Kuzyakov, Y. Sources of CO2 efflux from soil and review of partitioning methods. Soil Biol. Biochem. 2006, 38, 425–448. [Google Scholar] [CrossRef]
  39. Lee, J.S. Monitoring soil respiration using an automatic operating chamber in a Gwangneung temperate deciduous forest. J. Ecol. Environ. 2011, 34, 411–423. [Google Scholar] [CrossRef]
  40. Klimek, B.; Chodak, M.; Niklińska, M. Soil respiration in seven types of temperate forests exhibits similar temperature sensitivity. J. Soils Sediments 2021, 21, 338–345. [Google Scholar] [CrossRef]
  41. Possinger, A.R.; Driscoll, C.T.; Green, M.B.; Fahey, T.J.; Johnson, C.E.; Koppers, M.M.K.; Martel, L.D.; Morse, J.L.; Templer, P.H.; Uribe, A.M.; et al. Increasing soil respiration in a northern hardwood forest indicates symptoms of a changing carbon cycle. Commun. Earth Environ. 2025, 6, 418. [Google Scholar] [CrossRef]
  42. Curiel-Yuste, J.; Janssens, I.A.; Carrara, A.; Ceulemans, R. Annual Q10 of soil respiration reflects plant phenological patterns as well as temperature sensitivity. Glob. Change Biol. 2004, 10, 161–169. [Google Scholar] [CrossRef]
  43. Phillips, C.L.; Nickerson, N.; Risk, D.; Bond, B.J. Interpreting diel hysteresis between soil respiration and temperature. Glob. Change Biol. 2011, 17, 515–527. [Google Scholar] [CrossRef]
  44. Seyfried, M.S.; Flerchinger, G.N.; Bryden, S.; Link, T.; Marks, D.G.; McNamara, J.P. Slope and aspect controls on soil climate: Field documentation and implications for large-scale simulation of critical zone processes. Vadose Zone J. 2021, 20, e20158. [Google Scholar] [CrossRef]
  45. Lenk, A.; Richter, R.; Kretz, L.; Wirth, C. Effects of canopy gaps on microclimate, soil biological activity and their relationship in a European mixed floodplain forest. Sci. Total Environ. 2024, 941, 173572. [Google Scholar] [CrossRef] [PubMed]
  46. Robakowski, P.; Wyka, T.P.; Kowalkowski, W.; Barzdajn, W.; Pers-Kamczyc, E.; Jankowski, A.; Politycka, B. Practical Implications of Different Phenotypic and Molecular Responses of Evergreen Conifer and Broadleaf Deciduous Forest Tree Species to Regulated Water Deficit in a Container Nursery. Forests 2020, 11, 1011. [Google Scholar] [CrossRef]
  47. Yuan, B.C.; Li, Z.Z.; Liu, H.; Gao, M.; Zhang, Y.Y. Microbial biomass and activity in salt-affected soils under arid conditions. Appl. Soil Ecol. 2007, 35, 319–328. [Google Scholar] [CrossRef]
  48. Ebrahimi, M.; Sarikhani, M.R.; Sinegani, A.A.; Ahmadi, A.; Keesstra, S. Estimating soil respiration under different land uses using artificial neural network and linear regression models. Catena 2019, 174, 371–382. [Google Scholar] [CrossRef]
  49. Cui, H.; Bai, J.; Du, S.; Wang, J.; Keculah, G.N.; Wang, W.; Zhang, G.; Jia, J. Interactive effects of groundwater level and salinity on soil respiration in coastal wetlands of a Chinese delta. Environ. Pollut. 2021, 286, 117400. [Google Scholar] [CrossRef]
  50. Yang, C.; Wang, X.; Miao, F.; Li, Z.; Tang, W.; Sun, J.; Wang, Q.; Liu, J. Assessing the effect of soil salinization on soil microbial respiration and diversities under incubation conditions. Appl. Soil Ecol. 2020, 155, 103671. [Google Scholar] [CrossRef]
  51. Drake, P.; McCormick, C.A.; Smith, M.J.A. Controls of soil respiration in a salinity-affected ephemeral wetland. Geoderma 2014, 221–222, 96–102. [Google Scholar] [CrossRef]
  52. Ahmad, M.N.; Anuar, M.I.; Abd Aziz, N.; Murdi, A.A. Function and application of soil electrical conductivity (EC) sensor in agriculture: A review. Adv. Agric. Food Res. J. 2025, 6, a0000552. [Google Scholar]
  53. Kim, H.N.; Park, J.H. Monitoring of soil EC for the prediction of soil nutrient regime under different soil water and organic matter contents. Appl. Biol. Chem. 2024, 67, 1. [Google Scholar] [CrossRef]
  54. Makita, N.; Fujii, S. Tree species effects on microbial respiration from decomposing leaf and fine root litter. Soil Biol. Biochem. 2015, 88, 39–47. [Google Scholar] [CrossRef]
  55. Saiz, G.; Byrne, K.A.; Butterbach-Bahl, K.; Kiese, R.; Blujdea, V.; Farrell, E.P. Stand age-related effects on soil respiration in a first rotation Sitka spruce chronosequence in central Ireland. Glob. Change Biol. 2006, 12, 1007–1020. [Google Scholar] [CrossRef]
  56. Jagodziński, A.M.; Ziółkowski, J.; Warnkowska, A.; Prais, H. Tree Age Effects on fine root biomass and morphology over chronosequences of Fagus sylvatica, Quercus robur and Alnus glutinosa stands. PLoS ONE 2016, 11, e0148668. [Google Scholar] [CrossRef] [PubMed]
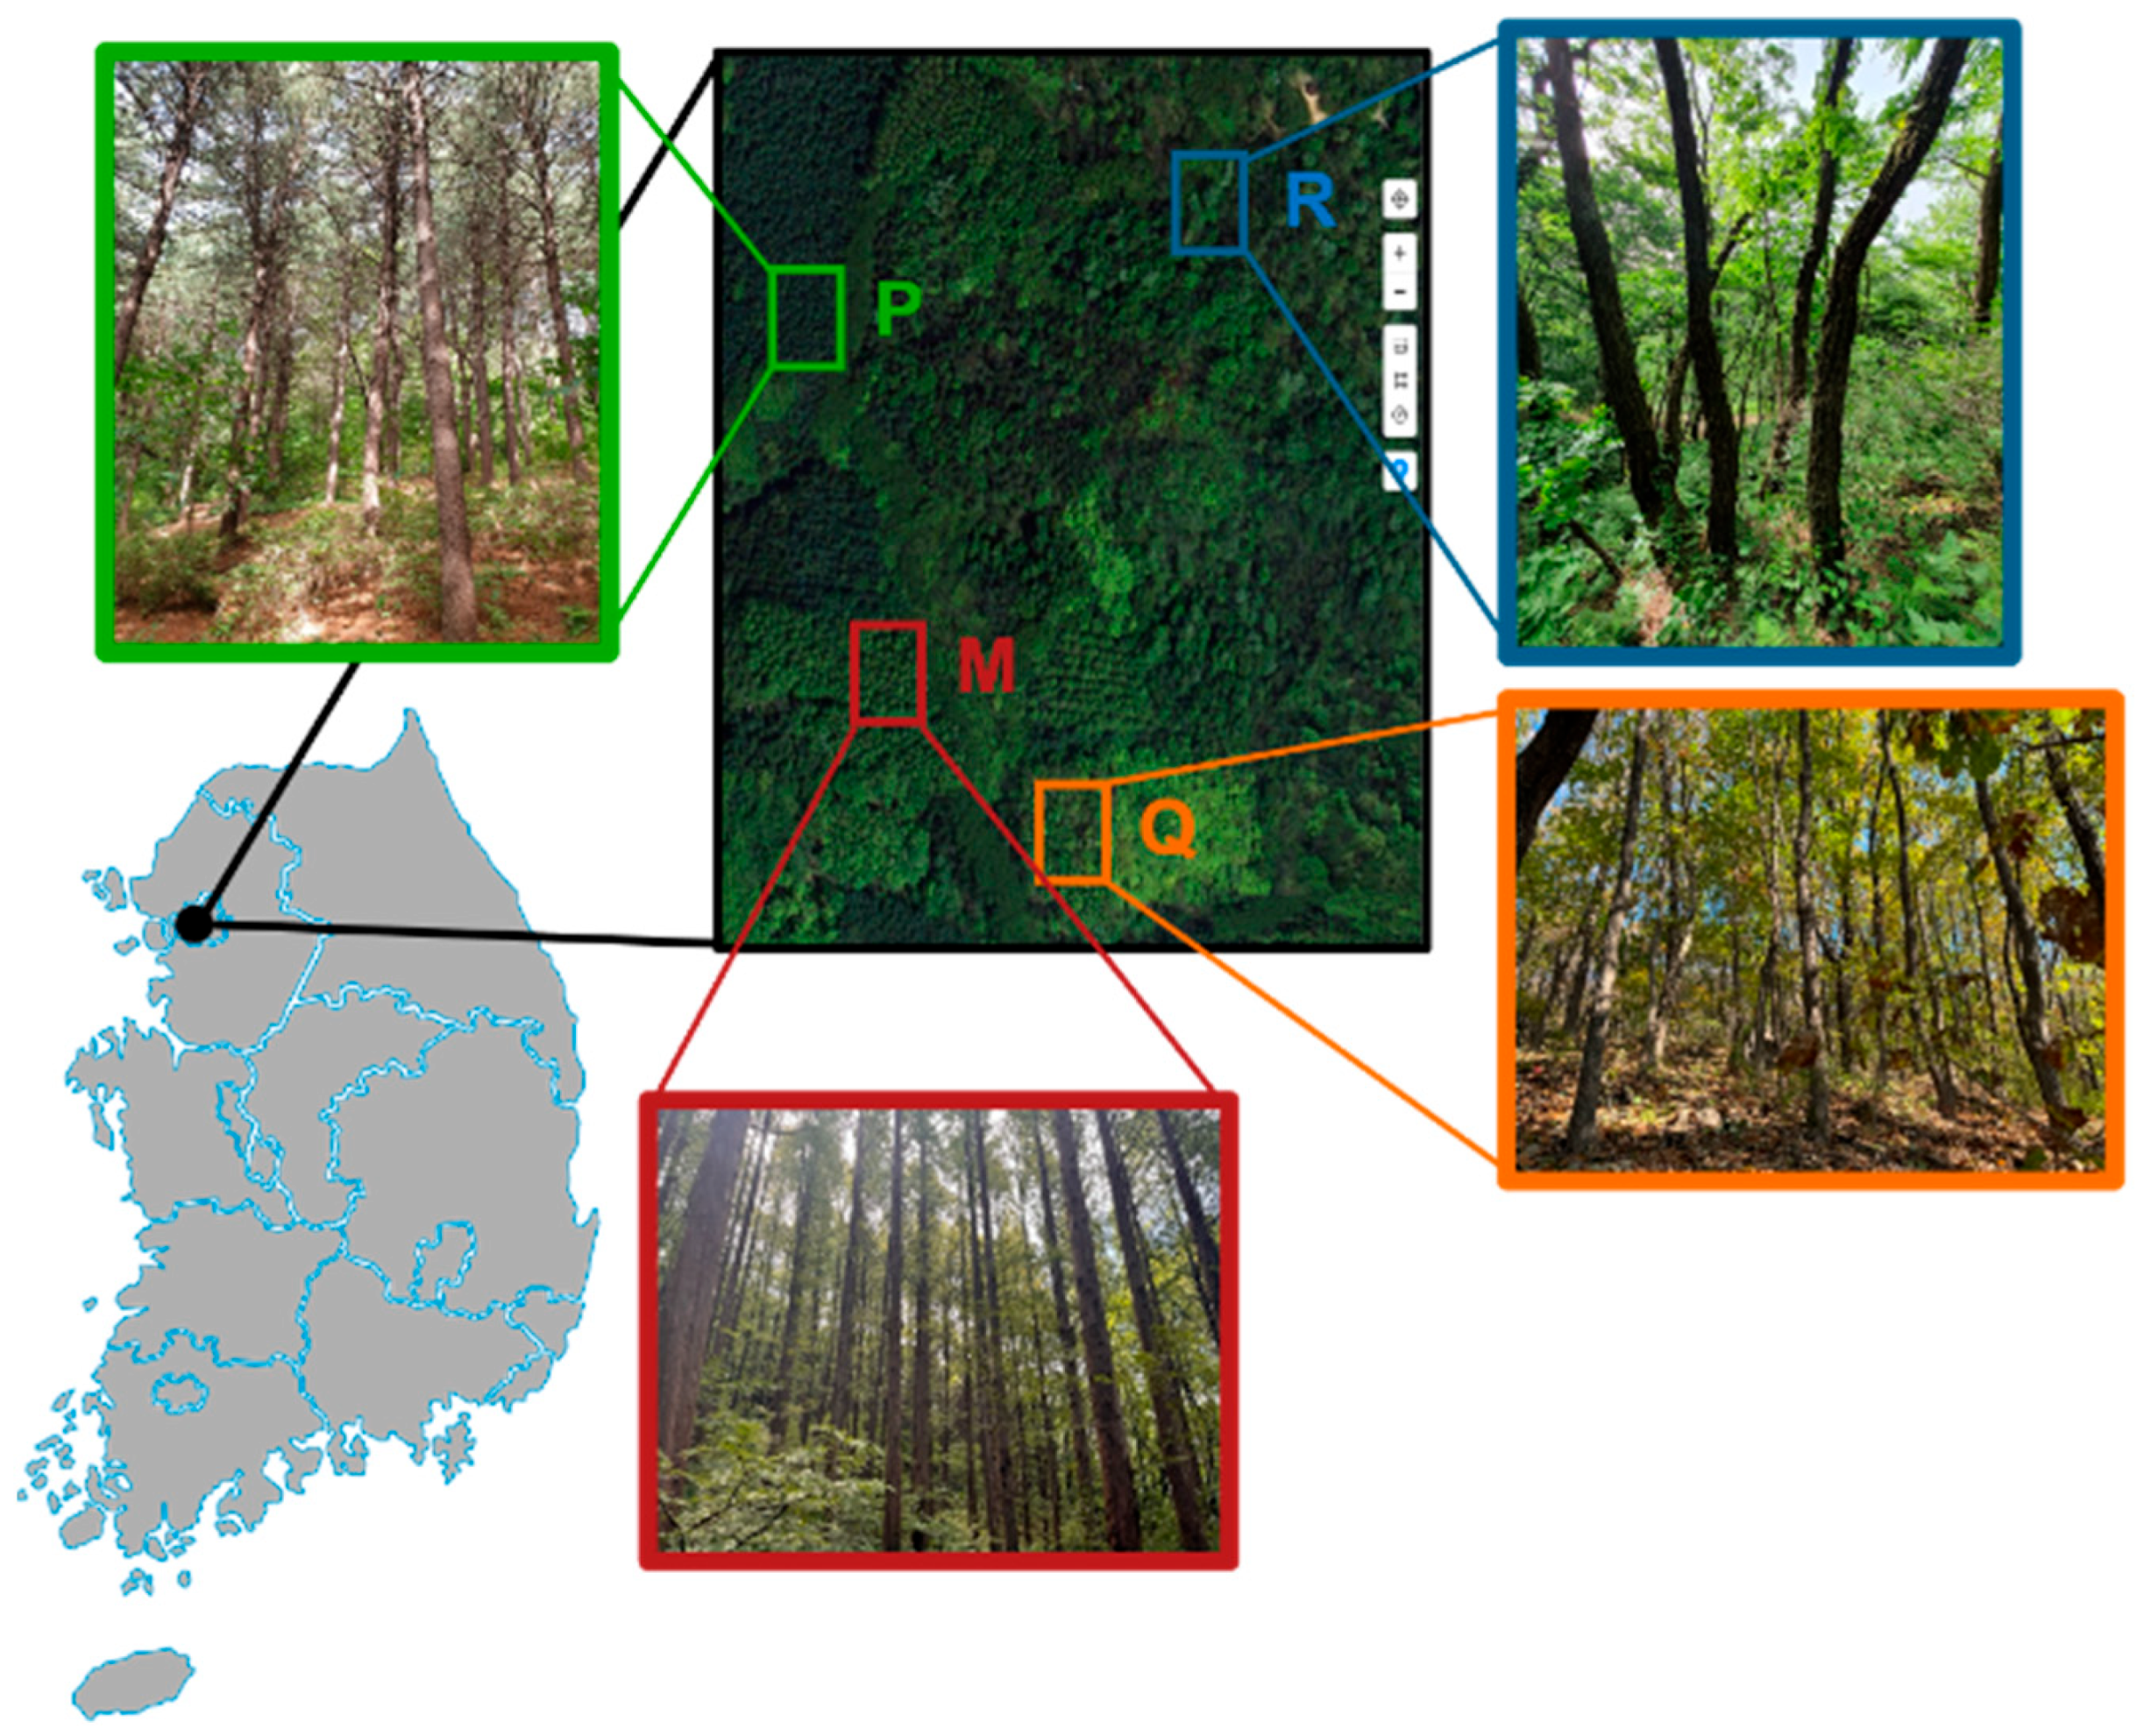
Figure 1. Location of the study sites for Robinia pseudoacacia (R), Quercus mongolica (Q), Pinus koraiensis (P), and Metasequoia glyptostroboides (M) plantations located at Mt. Ansan in Seoul, Republic of Korea.
Forests 16 01513 g001
Figure 2. Seasonal variation of (a) air temperature and precipitation, (b) soil CO2 efflux (RS), (c) soil temperature (TS), and (d) soil water content (SWC) in R. pseudoacacia (R), Q. mongolica (Q), P. koraiensis (P), and M. glyptostroboides (M) plantations during the study period. In (b), yellow triangles indicate mean values, and the yellow dashed line indicates median values. “*”, “**”, and “***” indicate statistical significance at p < 0.05, p < 0.01, and p < 0.001, respectively.
Forests 16 01513 g002
Figure 3. Correlations of soil CO2 efflux (RS) with (a) soil temperature (TS) and (b) water content (SWC) in R. pseudoacacia (R), Q. mongolica (Q), P. koraiensis (P), and M. glyptostroboides (M) plantations.
Forests 16 01513 g003
Figure 4. Correlation between soil physicochemical properties and morphological traits of very-fine (≤0.5 mm in diameter) roots. (ac) Correlations of bulk density (BD) with length (Lvf), surface area (SAvf), and volume (Vvf) of very-fine roots, respectively. (df) Correlations of electrical conductivity (EC) with Lvf, SAvf, and Vvf, respectively. (gi) Correlations of total carbon (TC) with Lvf, SAvf, and Vvf, respectively.
Forests 16 01513 g004
Figure 5. Correlation between soil physicochemical properties and morphological traits of fine (≤2.0 mm in diameter) roots. (a) Correlation between available phosphorus (AP) and root tissue density (RTD), (b,c) Correlations of specific root length (SRL) with AP and total nitrogen (TN), respectively.
Forests 16 01513 g005
Figure 6. Correlations of soil respiration normalized at 25 °C (R25) with (ad) soil physicochemical properties—clay, electrical conductivity (EC), total carbon (TC), and total nitrogen (TN). (ei) Morphological traits of fine roots (≤2 mm: length, Ltotal; surface area, SAtotal) and very-fine roots (≤0.5 mm: length, Lvf; surface area, SAvf; volume, Vvf).
Forests 16 01513 g006
Figure 7. Principal component analysis (PCA) of soil physicochemical properties, morphological traits of fine roots, temperature sensitivity of RS (Q10), and RS normalized at 0 °C (R0) and 25 °C (R25) for the R. pseudoacacia (R), Q. mongolica (Q), P. koraiensis (P), and M. glyptostroboides (M) plantations.
Forests 16 01513 g007
Table 1. Characteristics of the study sites. Values denote the mean ± S.E. (n = 3).
CharacteristicsPlantation
RQPM
Stand age classIVIVIVIV
Altitude (m a. s. l.)195–200190–200135–140145–155
Slope (°)31–3326–3020–2222–24
Aspect (°)NW19NW3NW40NW10
Stand density (tree ha−1)550 ± 87767 ± 68650 ± 76959 ± 31
Mean D.B.H. (cm)23.85 ± 0.5620.98 ± 1.4722.50 ± 1.1623.87 ± 1.48
Basal area (m2 ha−1)26.2 ± 2.9725.7 ± 3.9228.0 ± 0.8946.7 ± 5.5
Table 2. Soil physicochemical properties at a depth of 0–10 cm in four plantations of different species. Values denote the mean ± S.E. (n = 4), evaluated by the one-way ANOVA (* = p < 0.05, ** = p < 0.01). Different letters in superscripts (a, b) indicate significant (p < 0.05) differences among plantations assayed by Tukey’s HSD test.
PropertiesPlantation
RQPMp-Value
Sand (%)45.1 ± 1.747.6 ± 1.846.4 ± 1.843.3 ± 0.9>0.1
Silt (%)43.8 ± 2.840.8 ± 3.743.6 ± 2.048.1 ± 1.6>0.1
Clay (%)11.1 ± 1.511.6 ± 2.210.0 ± 1.18.7 ± 0.8>0.1
BD (g cm−3)0.75 ± 0.040.90 ± 0.08 ab1.05 ± 0.06 a0.97 ± 0.08 ab0.045 *
pH4.34 ± 0.034.51 ± 0.094.90 ± 0.234.69 ± 0.080.056
EC (dS m−1)0.55 ± 0.120.45 ± 0.090.28 ± 0.020.31 ± 0.020.088
TC (%)3.82 ± 0.42 a3.15 ± 0.63 a2.14 ± 0.30 a2.09 ± 0.30 a0.043
TN (%)0.38 ± 0.070.25 ± 0.060.19 ± 0.070.16 ± 0.0 30.090
AP (mg kg−1)39.3 ± 2.3 a20.7 ± 1.7 b28.9 ± 4.0 ab23.3 ± 1.8 b0.002 **
Table 3. Fine root traits in four plantations of different species. Values denote the mean ± S.E. (n = 4), evaluated by the one-way ANOVA (* = p < 0.05, ** = p < 0.01). Different letters in superscripts (a, b) indicate significant (p < 0.05) differences among plantations assayed by Tukey’s HSD test.
TraitsDiameter
(mm)
Plantation
RQPMp-Value
Biomass (kg m−2)Total1.39 ± 0.282.89 ± 0.781.19 ± 0.590.95 ± 0.160.080
L (m m−2)Total18.15 ± 4.45 a20.09 ± 5.13 a3.19 ± 1.63 b9.70 ± 1.99 ab0.022 *
Very-fine13.46 ± 3.66 ab15.28 ± 4.56 a0.60 ± 0.28 b5.86 ± 1.70 ab0.018 *
0.5–2.04.69 ± 0.805.68 ± 1.032.58 ± 1.353.84 ± 0.45>0.1
SA (m2 m−2)Total2.26 ± 0.472.44 ± 0.540.96 ± 0.501.53 ± 0.24>0.1
Very-fine1.03 ± 0.28 a1.09 ± 0.28 a0.06 ± 0.03 b0.54 ± 0.15 ab0.016 *
0.5–2.01.23 ± 0.191.57 ± 0.350.91 ± 0.470.99 ± 0.14>0.1
V (cm3 m−2)Total368.3 ± 61.5429.6 ± 116.1297.3 ± 152.0281.7 ± 46.1>0.1
Very-fine76.0 ± 20.3 a77.7 ± 17.7 a5.1 ± 2.7 b46.1 ± 11.5 ab0.014 *
0.5–2.0292.5 ± 42.0406.5 ± 106.7292.2 ± 149.3235.6 ± 39.2>0.1
RTD (g cm−3)Total0.37 ± 0.03 b0.67 ± 0.04 a0.34 ± 0.09 b0.34 ± 0.02 b0.001 **
SRL (m g−1)Total3339 ± 3601879 ± 2951890 ± 8922682 ± 145>0.1
Table 4. Temperate sensitivity (Q10) of RS, and RS normalized at specific soil temperature (0 °C, 25 °C) in four plantations of different species (R0, R25). Values denote the mean ± S.E. (n = 4), evaluated by the one-way ANOVA (** = p < 0.01). Different letters in superscripts (a, b) indicate significant (p < 0.05) differences among plantations assayed by Tukey’s HSD test.
ParameterPlantation
RQPMp-Value
Q102.80 ± 0.112.76 ± 0.152.62 ± 0.152.54 ± 0.170.583
R0 (µmol m−2 s−1)0.48 ± 0.040.52 ± 0.060.50 ± 0.060.52 ± 0.080.970
R25 (µmol m−2 s−1)6.20 ± 0.38 a6.33 ± 0.18 a5.37 ± 0.23 ab5.00 ± 0.45 b0.007 **
r20.80 ± 0.050.79 ± 0.030.80 ± 0.050.82 ± 0.06-
Disclaimer/Publisher’s Note: The statements, opinions and data contained in all publications are solely those of the individual author(s) and contributor(s) and not of MDPI and/or the editor(s). MDPI and/or the editor(s) disclaim responsibility for any injury to people or property resulting from any ideas, methods, instructions or products referred to in the content.