Article

Comparison of Plantation Arrangements and Naturally Regenerating Mixed-Conifer Stands After a High-Severity Fire in the Sierra Nevada

1
School of Natural Resources and the Environment, West Virginia University, 322 Percival Hall, PO Box 6125, Morgantown, WV 26506, USA
2
Pacific Southwest Research Station, USDA Forest Service, 3644 Avtech Parkway, Redding, CA 96002, USA
3
School of Forest Resources, University of Maine, 5755 Nutting Hall, Orono, ME 04469, USA
*
Author to whom correspondence should be addressed.
The author is currently retired.
Forests 2025, 16(10), 1506; https://doi.org/10.3390/f16101506
Submission received: 11 August 2025 / Revised: 16 September 2025 / Accepted: 17 September 2025 / Published: 23 September 2025
(This article belongs to the Special Issue Post-Fire Recovery and Monitoring of Forest Ecosystems)

Abstract

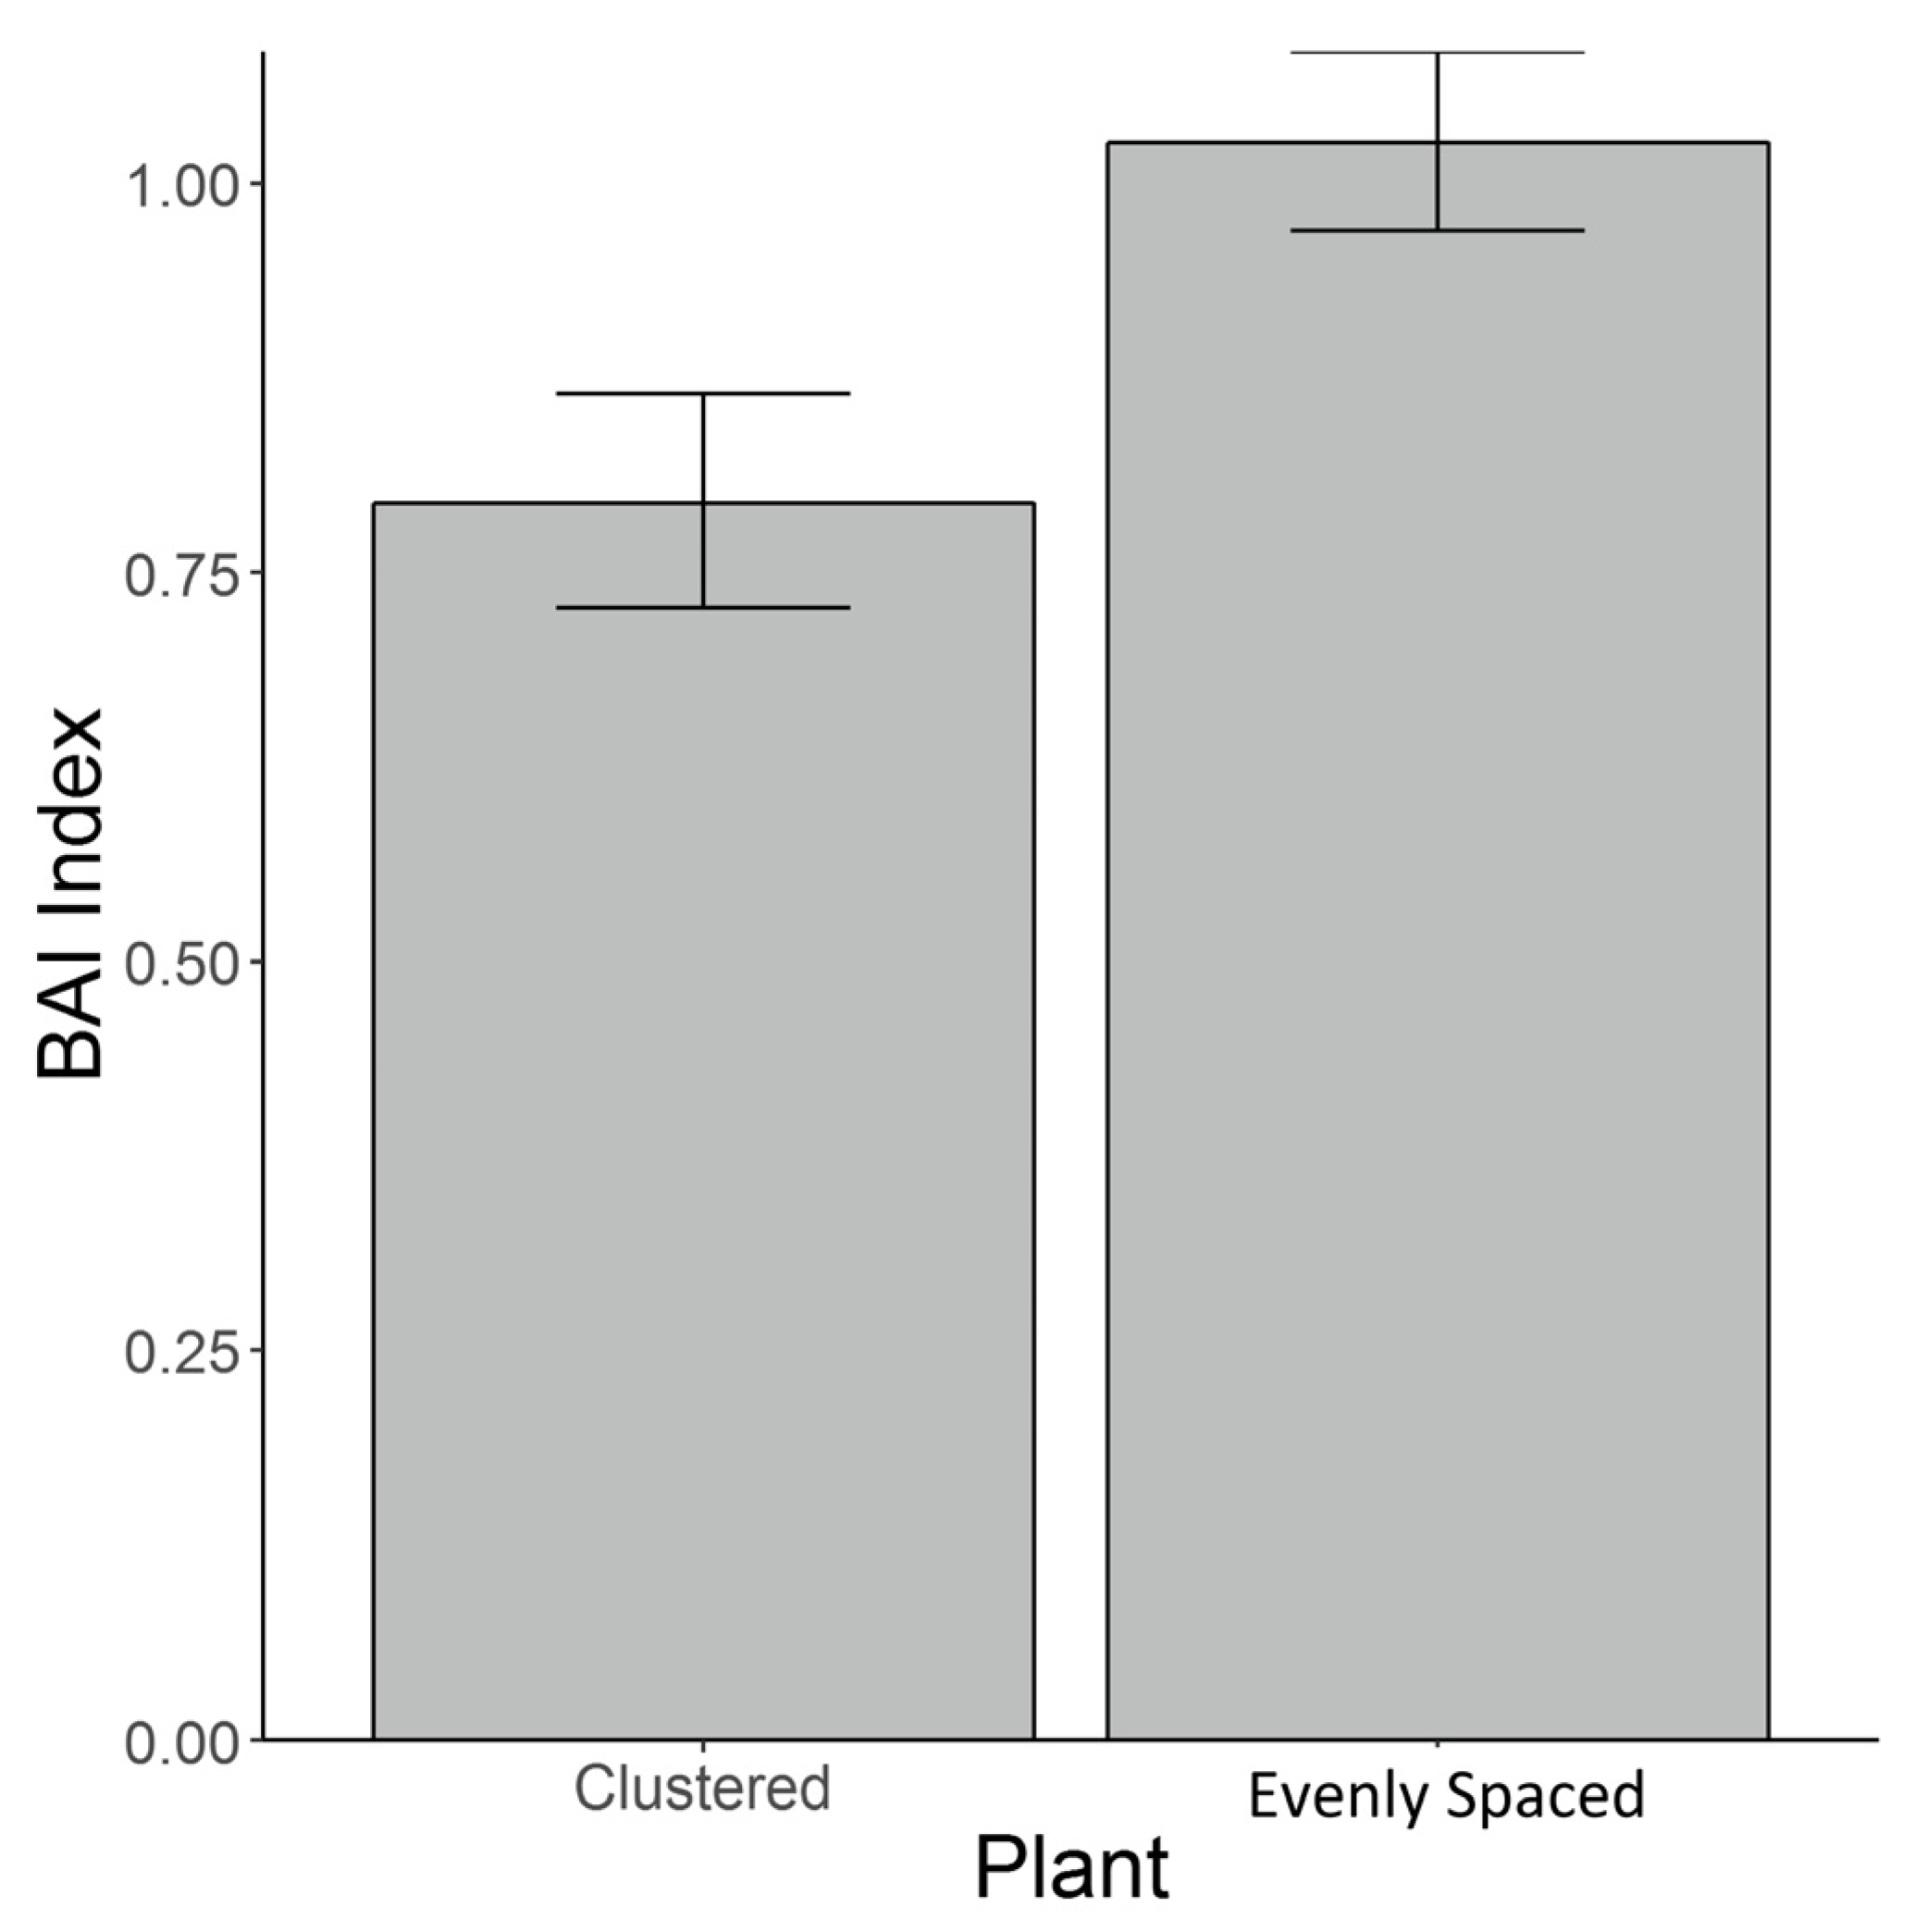
A sharp escalation in wildfire frequency, severity, and scale in the western United States calls for the creation of forests that are resilient in the future. One reforestation method involves clustering trees into groups of two to four, instead of creating evenly spaced plantations, in an effort to increase structural heterogeneity and emulate natural regeneration patterns. There have been a limited number of studies on clustered plantations, and this study addresses this important research gap. In Eldorado National Forest in the Sierra Nevada, we compared growth and structure in several post-fire plantations, treated with and without pre-commercial thinning (PCT), and naturally regenerating stands. Using mixed-effects models, we tested for growth and structural differences between evenly spaced and clustered plantations, as well as comparing them to stands of naturally regenerating trees. Our results indicated that diameter and height growth were generally better maintained in the plantations compared to under natural stand conditions. When considering plantation arrangement, the annual basal area increment (BAI) thinning index ([BAI after thinning − BAI before thinning]/BAI before thinning) was generally higher in evenly spaced plantations (1.03) compared to clustered plantations (0.79). While high plant diversity would be important eventually from an ecological perspective, our study suggests that during the initial phases of plantation development, lower shrub diversity could assist with plantation establishment and growth. The frequency of yellow pines was an important, positively associated factor affecting BAI and height growth, but primarily in the high-elevation region, which demonstrates a facilitative legacy effect of prior stand composition. Our study highlighted the important legacy effect of prior stand density on the growth of yellow pines, but primarily in the low-elevation region, and only when the two plantation groups were examined. The negative association suggests that a lower initial density of plantations promotes better BAI growth and height growth after PCT. These findings thus have broad implications for effective post-fire restoration of young plantations to help ensure their future resilience to both post-fire restoration and climate change adaptation and biotic (i.e., plant competition) stress factors.

1. Introduction

Climate change and over a century of fire suppression have caused a change in the fire regime of mixed-conifer forests in the Sierra Nevada, CA, USA [1,2,3]. Contemporary fires leave the landscape heavily altered, disrupting the post-fire successional process by limiting conifer regeneration. To aid with reforestation after stand-replacing fires, plantations are often established, and these plantations are usually more successful than naturally regenerating stands [4,5]. Although most plantations are established in an evenly spaced manner, some restoration projects plant them in small aggregates, usually of two to four trees [5,6], in an attempt to mimic the natural clustered pattern of historically fire-resilient Sierra Nevada forests [7,8,9]. A potential drawback of this method is that it could increase competition between trees, impacting growth and survival [10]. Light is one of the most important factors for tree regeneration in mixed conifer forests [11]; therefore, increasing light and soil moisture competition within clumped plantings could be detrimental to seedling survival [12,13]. However, a mutual benefit (facilitation) of young trees within a clump has been observed before [14,15,16]. Facilitation could result from neighboring trees shading each other and improving soil moisture, benefitting growth in dry conditions [17]. Also, ectomycorrhizal connections between trees are stronger at closer distances [18]. The literature on clustered plantations in the United States is scarce, with there being no published studies on these plantations in the Sierra Nevada to our knowledge. It is important to quantify the advantages and disadvantages of clustered plantations if they are to be used as a regeneration method in post-fire restoration.
Due to their persistent soil seed bank, shrubs will often dominate this post-fire landscape [19]. Shrubs can outcompete conifer seedlings for water and light, which delays conifer regeneration for decades [20]. In addition to increased competition, stand-replacing fires kill seed-source trees, preventing the establishment of the next generation of trees [21]. Post-fire restoration plantations often require intensive shrub management [22,23]. Increased densities and close spacing can exacerbate the risk of fire due to the high amount of ladder fuels [5,24]. Fire behavior modeling has shown that fire risks in the Sierra Nevada can be reduced if fuels are reduced through pre-commercial thinning, as well as through fuel mastication and prescribed burning [25].
This study focuses on early forest dynamics in two types of mixed conifer plantations after a high-severity fire: one planted using the traditional, evenly spaced method, and one with trees planted in clusters. Specifically, the objective of this study is to quantify growth and structural differences at the stand level using analysis of variance (ANOVA) and regression-based modeling between these two planting types, along with analysis of how they compare to naturally regenerated stands after a fire. We hypothesize that while clustered plantations can mimic post-fire spatial recruitment patterns, and potentially have a facilitative effect under high-resource-stress conditions (i.e., drought stress), the close inter-tree distances within a cluster will negatively impact tree growth due to higher competition compared to conditions in evenly spaced plantations. While natural stands may be expected to have higher structural diversity, we hypothesize that the advantage of plantation stands is reduced competition. The study will not only quantify structural and growth differences between plantation categories, but also evaluate their potential role in developing resilient post-fire forests under changing climate conditions.

2. Methods

2.1. Study Area

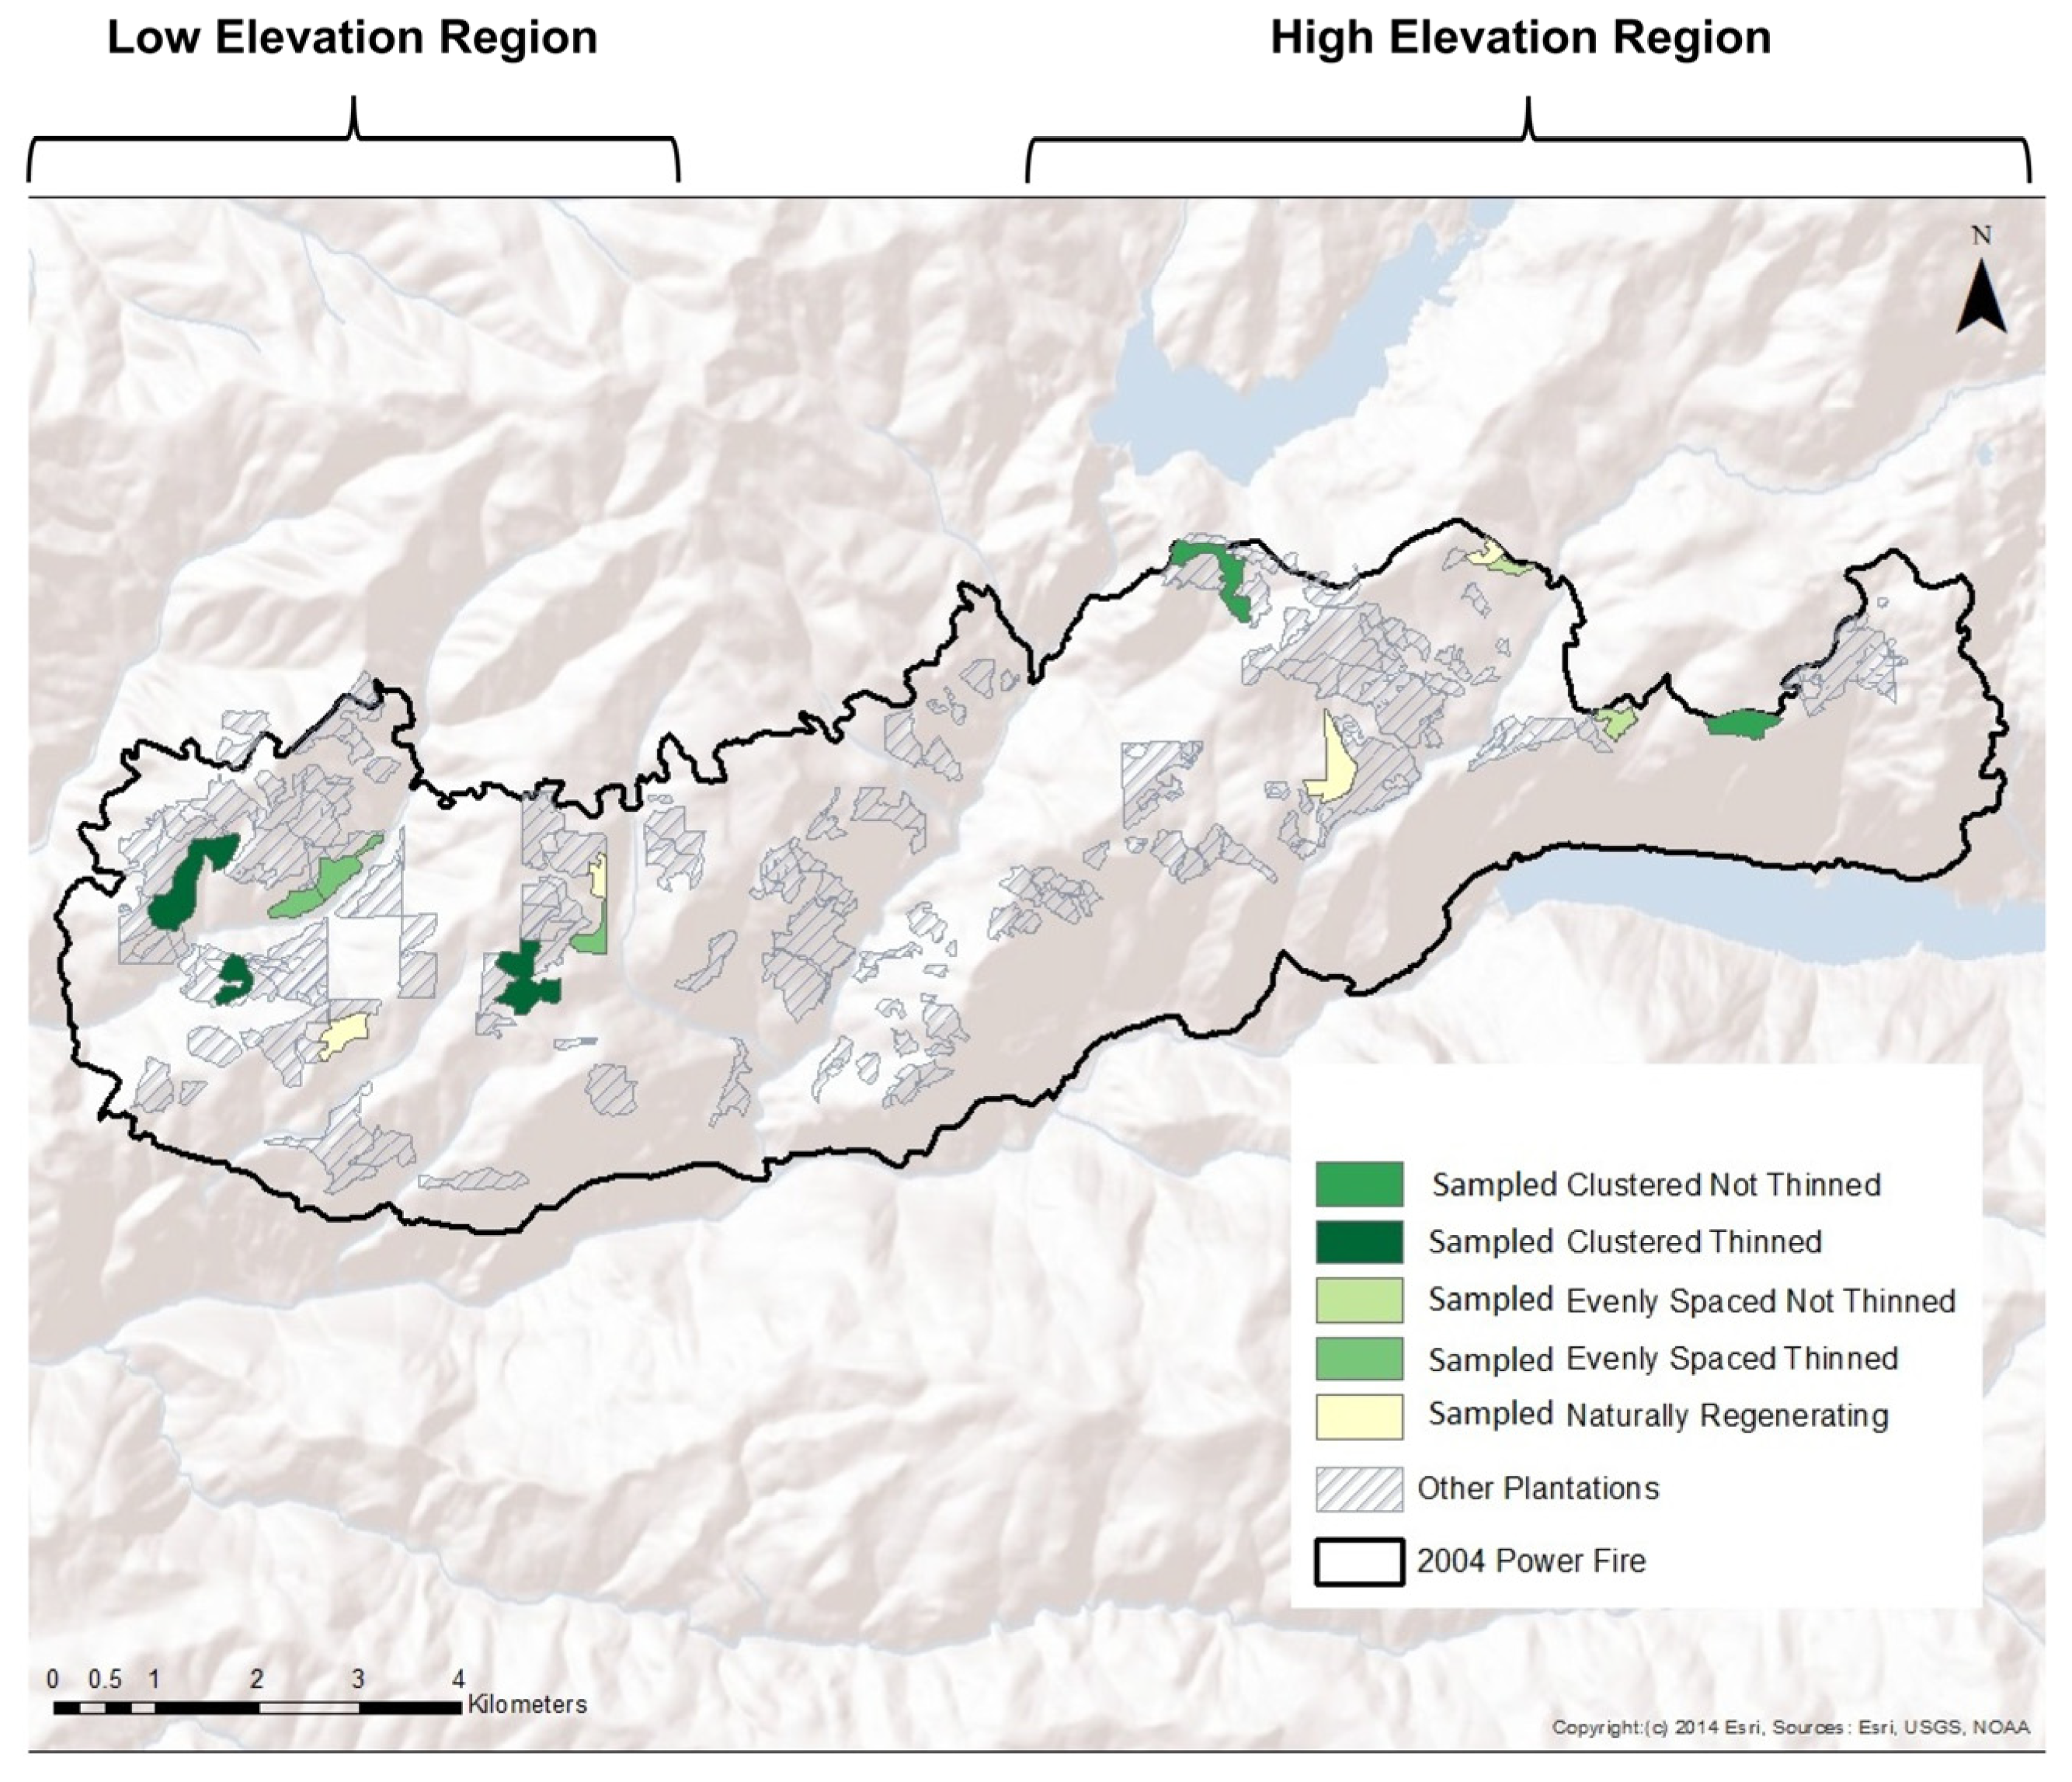
The study was conducted at the boundary of the 2004 Power Fire which burned at the southern extent of Eldorado National Forest, situated in the north–central Sierra Nevada Mountains in the state of California (Figure 1). Eldorado National Forest is situated in what is characterized as a Mediterranean climate, comprising dry and warm summers and winters which are cool and wet; furthermore, the study area is officially classified under the Sierra Nevada ecological subregion [26]. The Power Fire burned 6000 hectares, of which almost 50% was burned by the fire at a high degree of severity, resulting in more than 75% tree mortality [27]. To support efforts towards restoration of the burned area, the U.S. Forest Service established plantations from 2005 to 2009 (Figure 2) [27]. The species planted included ponderosa pine (Pinus ponderosa Lawson and C. Lawson), Jeffery pine (Pinus jefferyi Grev. and Balf.), sugar pine (Pinus lambertiana Douglas), Douglas-fir (Pseudotsuga menziesii (Mrib.) Franco), incense cedar (Calocedrus decurrens (Torr.) Florin), white fir (Abies concolor (Gord. and Glend.) Lindl. Ex Hildbr.), red fir (Abies magnifica A. Murr.)), and giant sequoia (Sequoiadendro giganteum (Lindl.) Buchholz), with ponderosa pine being the most frequently planted species. Two plantation arrangements were utilized, each attempting to attain different goals designated by the Sierra Nevada Forest Plan Amendment Record of Decision [28]. The clustered planting arrangement, or planting group A, mimics an old-growth forest group-gap evolved from a century of stand development through multiple natural disturbances. It was planted in aggregates of 2–4 trees, with incorporation of about 6.4 m between the clusters and 1 m between trees within the same cluster for a finalized planting density of 494 to 988 trees per hectare. On the other hand, the evenly spaced arrangement, or planting group B, follows a planting scheme that is more traditional, with even spacing, and is intended to allow the plantation to rapidly close its canopy by successfully competing with shrubs. Trees that were planted in an evenly spaced manner had about 4 m inter-tree spacing and a planting density of 741 to 865 trees per hectare. Approximately 75% of all plantations were pre-commercially thinned (PCT) from 2013 to 2015. This pre-commercial thinning was carried out on both trees and shrubs, and logging slash was left unmulched on the ground.

2.2. Site Selection

We selected study sites to represent conditions for both planting arrangements (i.e., clustered vs. evenly spaced) and in adjacent non-plantation forest land (Figure 2). In 2017, field sampling occurred in the summer months from May to August. We identified evenly spaced and clustered plantations without interplanting after initial establishment which had occurred in other areas with moderate-to-high-severity burns. Stands were selected to cover a range of aspects and slopes. During the verification process in the field, sites with lower survival rate of planted trees were eliminated, since the goal of this study was to evaluate how established plantations performed, not to identify the factors that cause a plantation to become established. The elevation at the thinned sites ranged from 1340 to 1570 m, while at the thinning sites, it ranged from 1940 to 2000 m. PCT was only performed at lower elevations, since the plantations at high elevation had not yet reached an adequate size for PCT. This resulted in a confounding factor between thinning and elevation, which was addressed in the data analysis by separately analyzing the plots that were thinned at low elevation (referred to hereafter as the low-elevation region) from the plots that were sampled at high elevation that were not thinned (referred to hereafter as the high-elevation region). We selected 6 plantations in the low-elevation region that were thinned and included three clustered and three evenly spaced plantations (low-elevation, n = 6). We selected 4 plantations in the high-elevation region that were unthinned and included two clustered and two evenly spaced plantations (Figure 2, Table 1 and Table 2) (high-elevation, n = 4). In each elevation region (low and high), naturally regenerating stands were located in areas close to seed sources without management that (1) were classified as having burned at moderate-to-high severity, and (2) were within 1-mile proximity of sampled plantations. Four naturally regenerating stands were selected, of which two were near the unthinned plantations in the high-elevation region and two were near the thinned plantations in the low-elevation region (Figure 2, Table 1 and Table 2). Note that plantation stands in the high-elevation region contained more fir species and Jeffrey pine compared to those in the low-elevation region (Table 2).
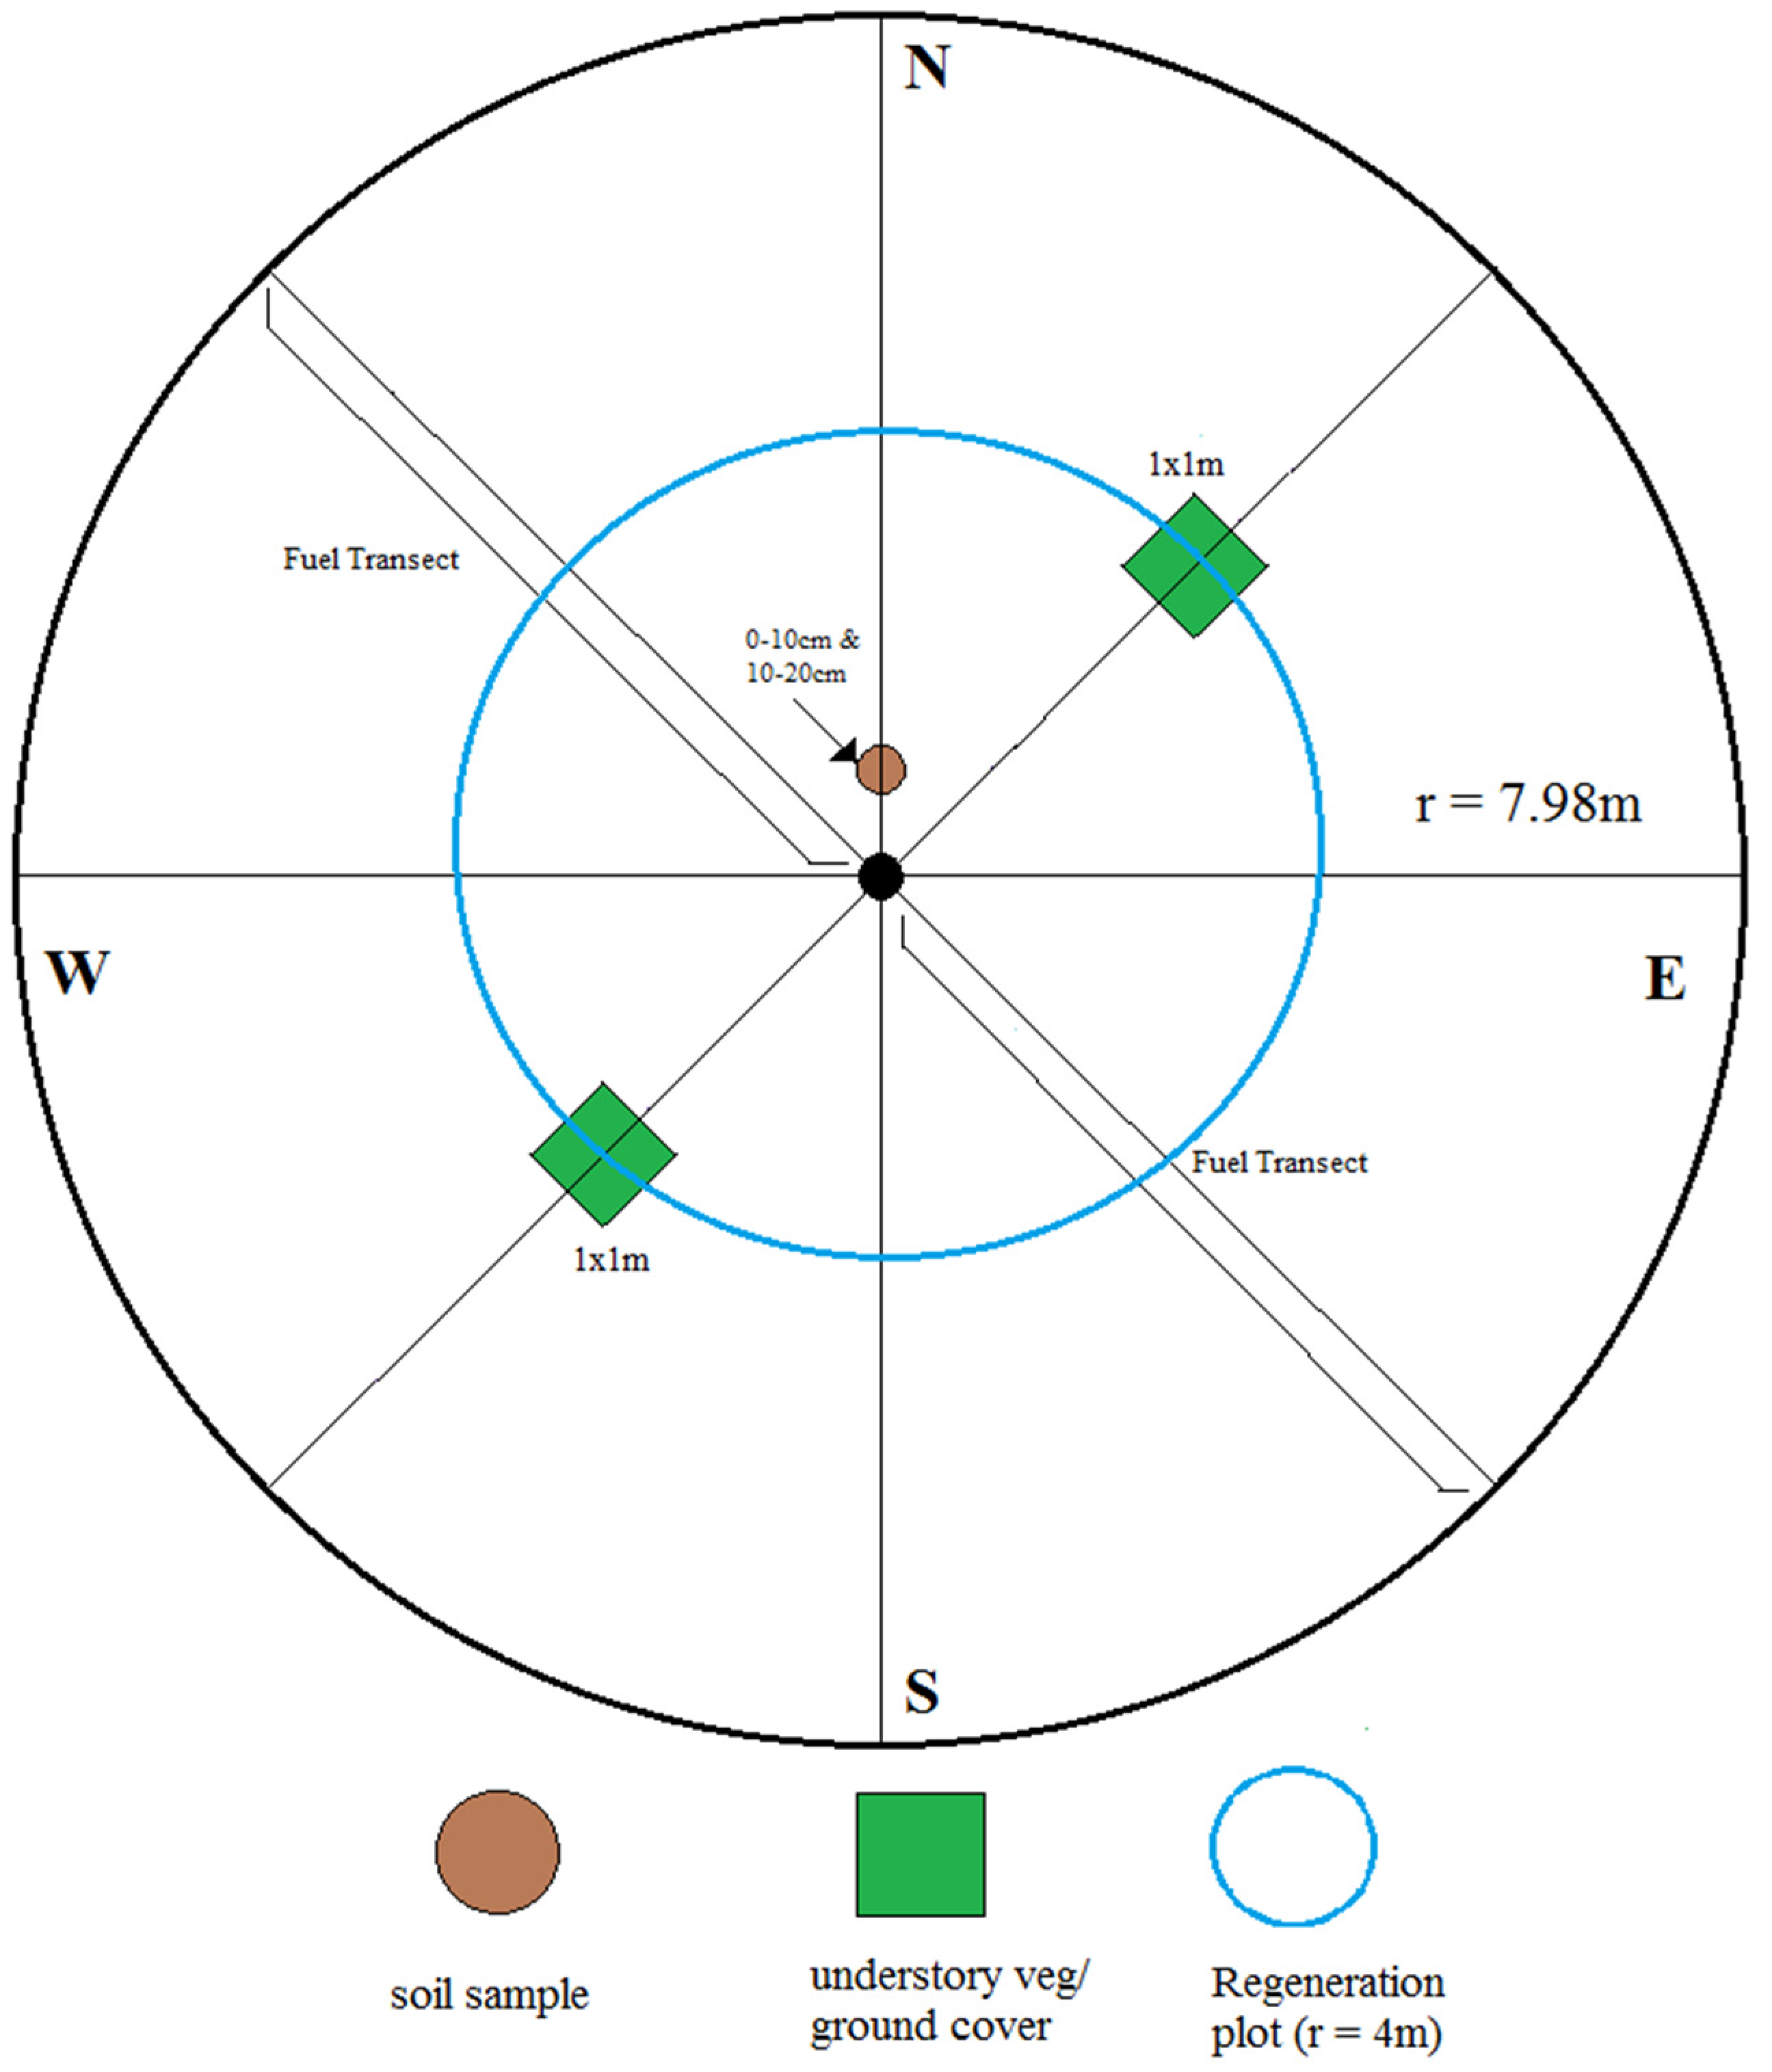
Plot locations were determined within a particular stand by digitally imposing a 50 by 50 m grid over each stand, and a 20 m buffer zone situated at the stand boundaries was also incorporated. Five intersections were randomly selected from each grid as plot locations. If an intersection landed in an area that could not be sampled (i.e., too steep or a road intersection), another random point was chosen until there was a total of five plots per stand. Each plot was circular and 200 m2 (1/50 hectare with a corresponding circular plot radius of 7.98 m radius) in area (Figure 3). All stands typically had five plots; the exception to this was connected to two naturally regenerating stands, of which one had seven plots and another stand had eight plots selected. This selection process was carried in this manner so that evenly spaced, clustered, and naturally regenerating stands would each be equitably be represented with 25 plots.

2.3. Field Methods

Forest structure was inventoried to quantify stand growth and attributes. At each plot, slope was measured using a clinometer (Suunto, Vanta, Finland) and aspect was measured with a compass (Suunto, Finland). For all trees taller than breast height (1.37 m) (assumed to be planted) within the plot, we collected species, DBH (measured with a diameter tape from Forestry Suppliers, Jackson, MS, USA), and status (live/dead). We randomly selected a subset of five yellow pines (ponderosa or Jeffery pine) to collect additional measurements, specifically height, crown width in two directions, height to live crown, and inter-whorl height, using an ultrasonic measurement system; furthermore, we cored these pines at breast height using an increment borer (Haglof, Långsele, Sweden) to determine basal area increment. Pines are the only species in this forest type that grow one distinct whorl each year, allowing the collection of annual inter-whorl measurements. Furthermore, the focus on measurements of yellow pines was primarily due to management interest in restoration targets, since yellow pines were principal species that dominated the landscape before the era of fire suppression altered the stand structure and composition in a way that allowed for the encroachment of shade-tolerant and fire-sensitive species, such as firs and incense cedar. Within the half-plot radius, we recorded the species and the heights (using a laser hypsometer from Haglof, Sweden) for all trees below breast height (referred to as regeneration) (Figure 3).
We surveyed understory vegetation using an 1 m × 1 m ground cover plot centered at halfway points (3.99 m) along the northeast and southwest radii of each plot (Figure 3). We estimated the percent cover of the different herbaceous species, along with a count of individual plants per species. Within each half-radius plot, we recorded shrub species, height, and two perpendicular crown diameters (Figure 3). If a shrub extended past the half-radius boundary, we only measured the diameter portion within the half-radius boundary. We recorded the distance to nearest seed source (mature, cone baring) with a laser range finder for the following tree species: ponderosa pine (Pinus ponderosa), Jeffrey pine (Pinus jeffreyi), white fir (Abies concolor), red fir (Abies magnifica), incense cedar (Calocedrus decurrens), and Douglas-fir (Pseudotusga menziesii).

2.4. Laboratory Methods

We used standard dendrochronological methods to determine past tree growth. Cores were processed using standard dendrochronological techniques [29]. Due to their very short chronologies (most cores ranged from seven to three rings) and robust growth rings, we only visually crossdated the cores. The cores were scanned at 2400 dpi and ring widths were measured with the software program CooRecorder 9.0 [30]. Ring widths were converted to annual basal area increment (BAI, mm2) using the dplR dendrochronology package in R [31,32].

2.5. Statistical Methods

Statistical analyses were conducted to determine differences between the two planting arrangements and naturally regenerating stands. We conducted two types of data analysis: analysis of variance (ANOVA) and multiple linear regression. Three mixed-effects ANOVAs were performed: (1) one-way ANOVA in the low-elevation region that was thinned in order to compare three different treatment categories (clustered plantation, evenly spaced, and natural regeneration); (2) one-way ANOVA in the high-elevation region that was not thinned in order to compare three different treatment categories (clustered plantation, evenly spaced, and natural regeneration); and (3) t-tests comparing thinned plantations in the low-elevation region by planting arrangement: clustered and evenly spaced.
For the one-way ANOVAs in either the low- or high-elevation region, we tested the following growth/density variables: diameter at breast height, total height, and density of trees below breast height (regeneration). We also tested the following ecological variables: shrub height, percent of plot covered in shrubs, species richness, and Shannon’s diversity index ( i = 1 s p i × l n p i ; s = total number of species, pi = proportion of individuals in species i). We tested the following variables among only the thinned plantations: trees per hectare before thinning, trees per hectare after thinning, BAI before thinning, BAI after thinning, annual height growth before thinning, annual height growth after thinning, and two growth indices (referred to as “thinning index”), one for BAI and one for height, calculated using the following equation: [Growth After Thining − Growth Before Thinning]/Growth Before Thinning. We calculated this to determine the percent of growth change from the thinnings. Thinning occurred in 2015, and sampling occurred in 2017; therefore, pre-thinning refers to growth in 2013 and 2014 and post-thinning refers to growth in 2016.
We used Plantation ID as a random effect and nested plantation ID inside planting treatment. We initially tried to use plot ID nested inside plantation ID as a random effect for variables measured at the individual level (e.g., DBH, shrub height), but the mixed-effects model would not converge to a final solution for the comparison between all three levels of treatment categories (clustered, evenly spaced, and natural regeneration). For the comparison between only the plantation arrangements (clustered vs. evenly spaced) in the low-elevation region, we were able to successfully use plot ID nested inside plantation ID as a random effect for variables measured at the individual level. We tested normality using the Shapiro–Wilk test. If any tests were not normal, we performed transformations (detailed in Supplementary Materials) until normality was achieved (Table 3). We used Tukey’s HSD for all post hoc tests. We ran all ANOVAs as mixed-effects models using the JMP V.15.0.0 statistical program [33].
We set up the multiple linear regression models similarly to the ANOVAs, except that all the models used data summarized at the plot level, and we ran them using the JMP V.15.0.0 statistical program [33]. There were two different model frameworks for each elevation region. One model framework included all 3 treatment categories (clustered plantation, evenly spaced plantation, and natural regeneration), and had treatment as a categorical, explanatory variable. The other model framework only used plantations and had plantation arrangements (clustered or evenly spaced) as categorical, explanatory variables. In addition to the categorical variables, we used the following continuous, explanatory variables: elevation, aspect, slope, percent shrub cover, average shrub height, Shannon’s diversity index, species richness, trees per hectare, density of tree regeneration, distance to the closest seed source, and the proportion of trees that were yellow pines in each plot. The dependent variables modeled in the low-elevation region that was thinned included BAI from 2013 to 2016, BAI before thinning, BAI after thinning, height growth from 2013 to 2016, annual height growth before thinning, and annual height growth after thinning. The dependent variables modeled in the low-elevation region that was not thinned included BAI from 2013 to 2016 and height growth from 2013 to 2016. We used an AIC stepwise model selection process to determine model variables [33].

3. Results

3.1. One-Way ANOVA in the Low- and High-Elevation Regions

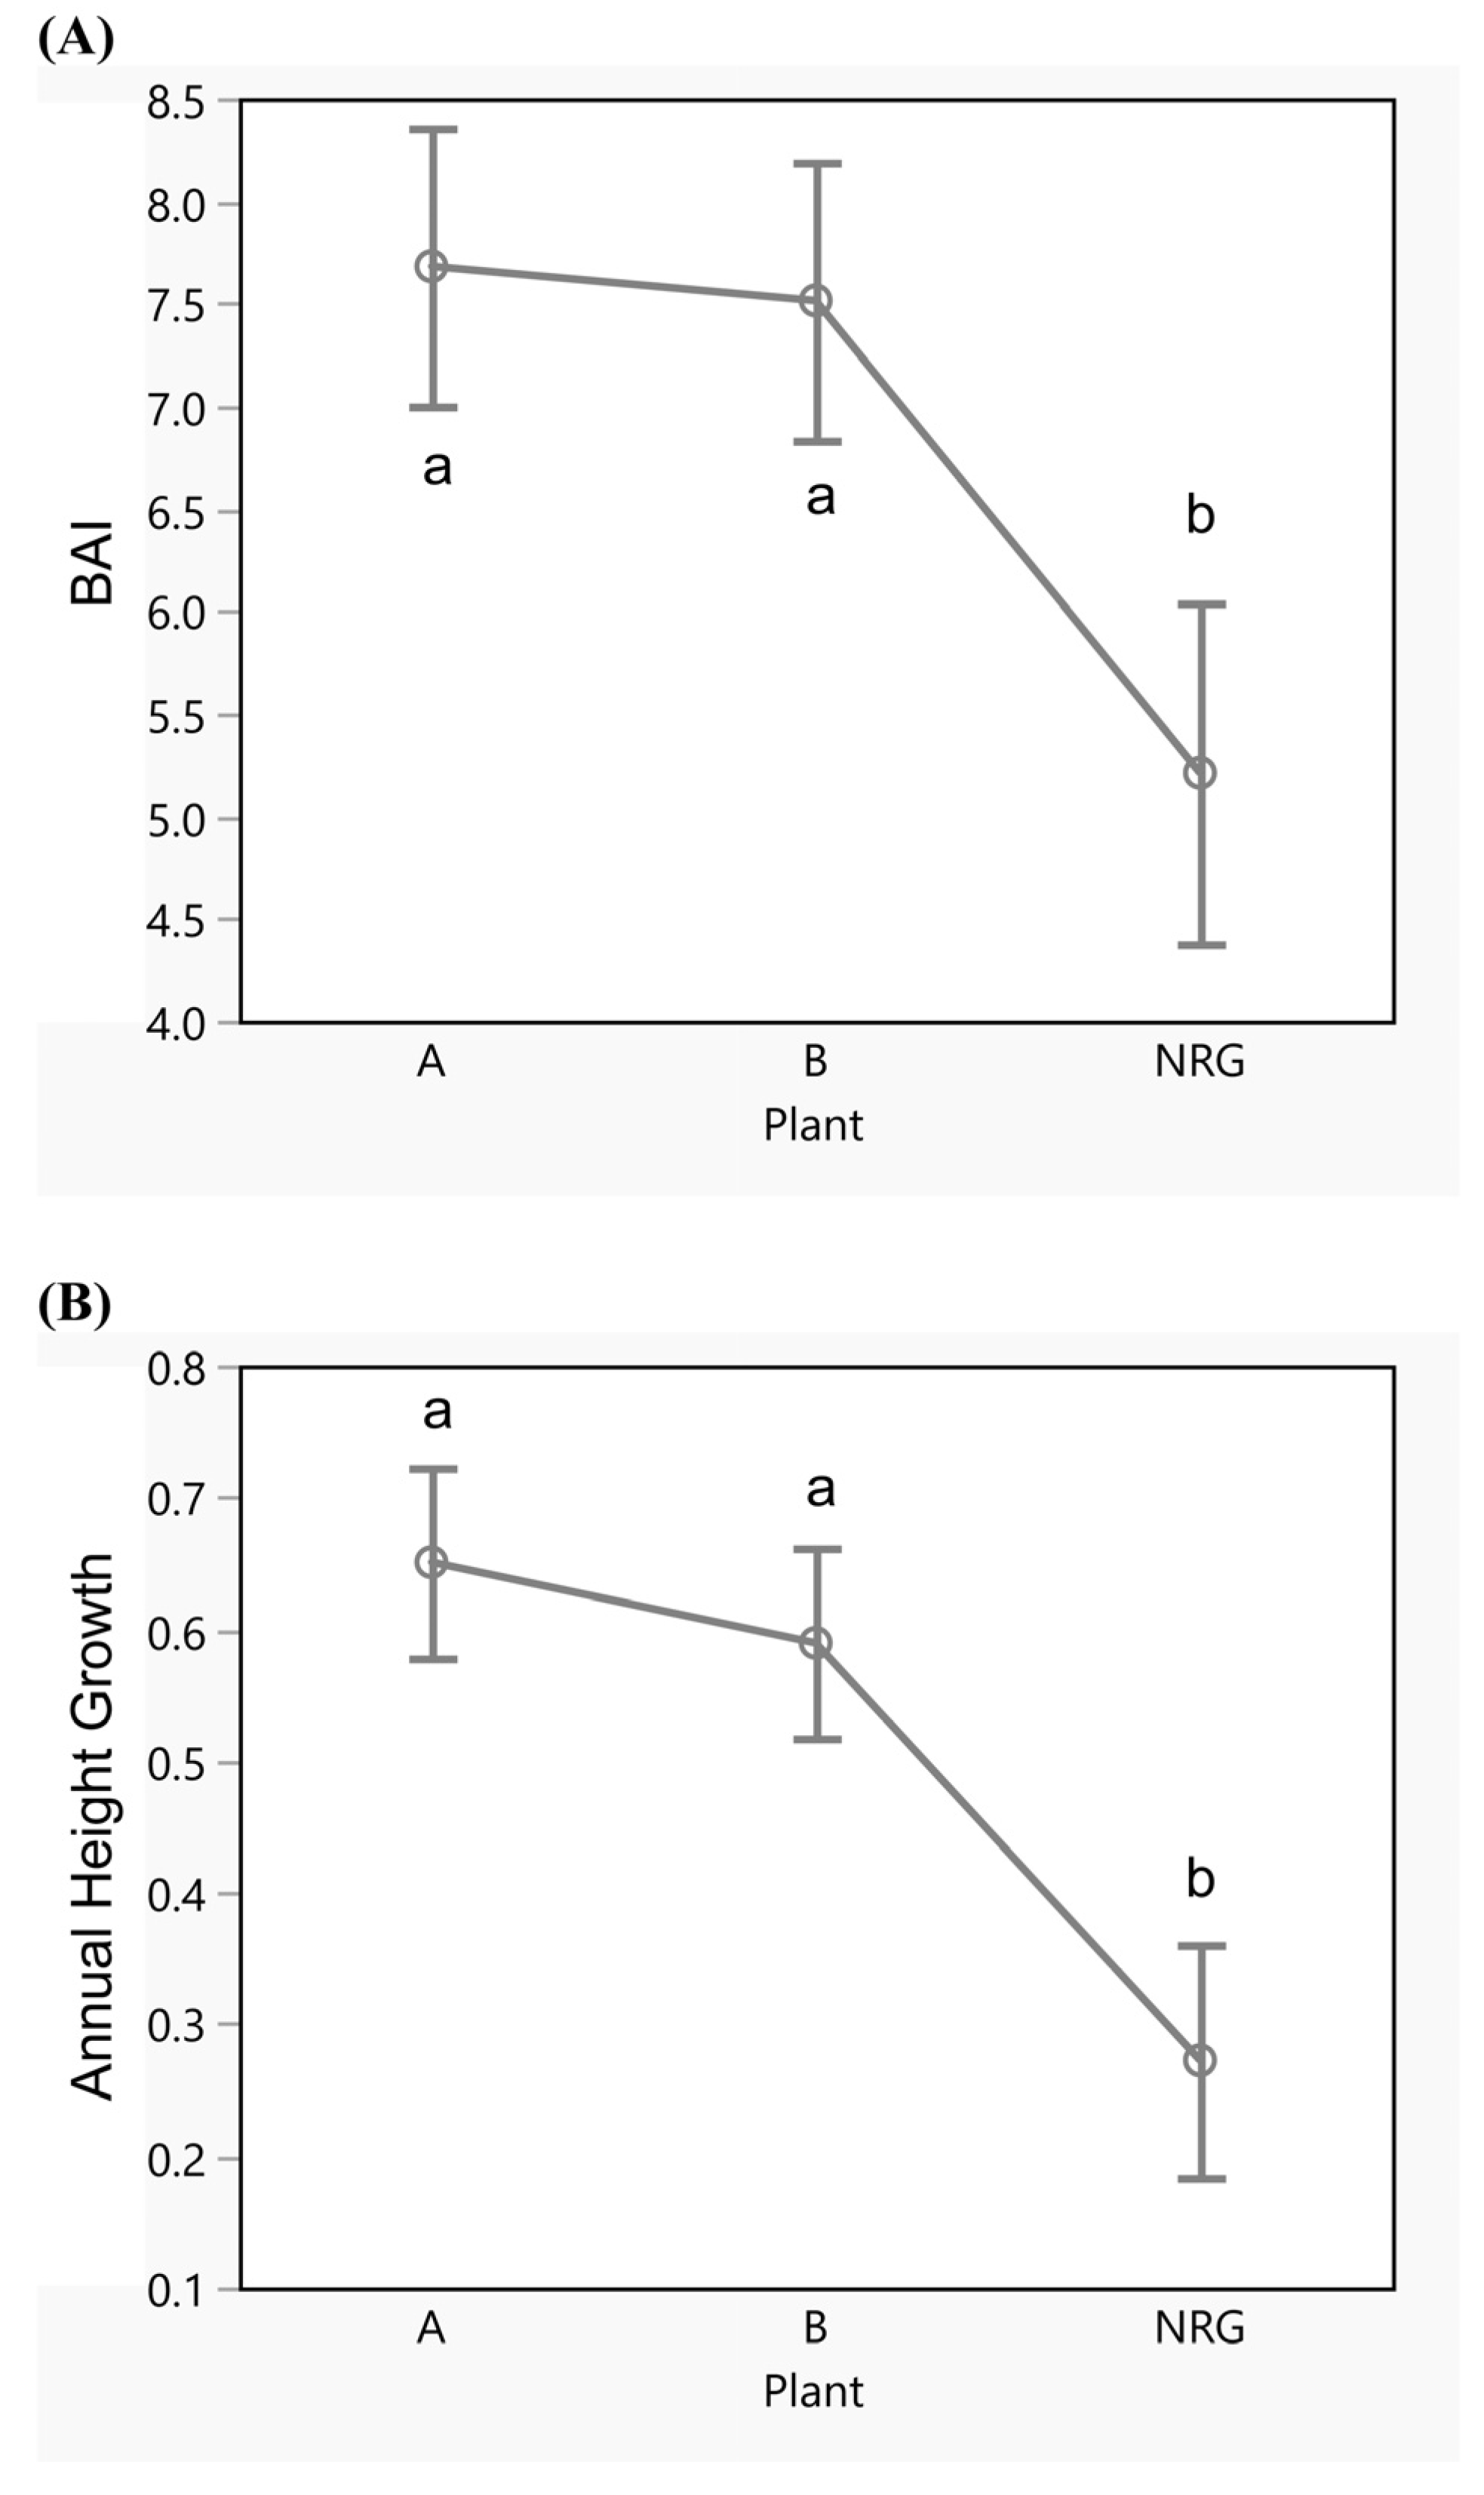
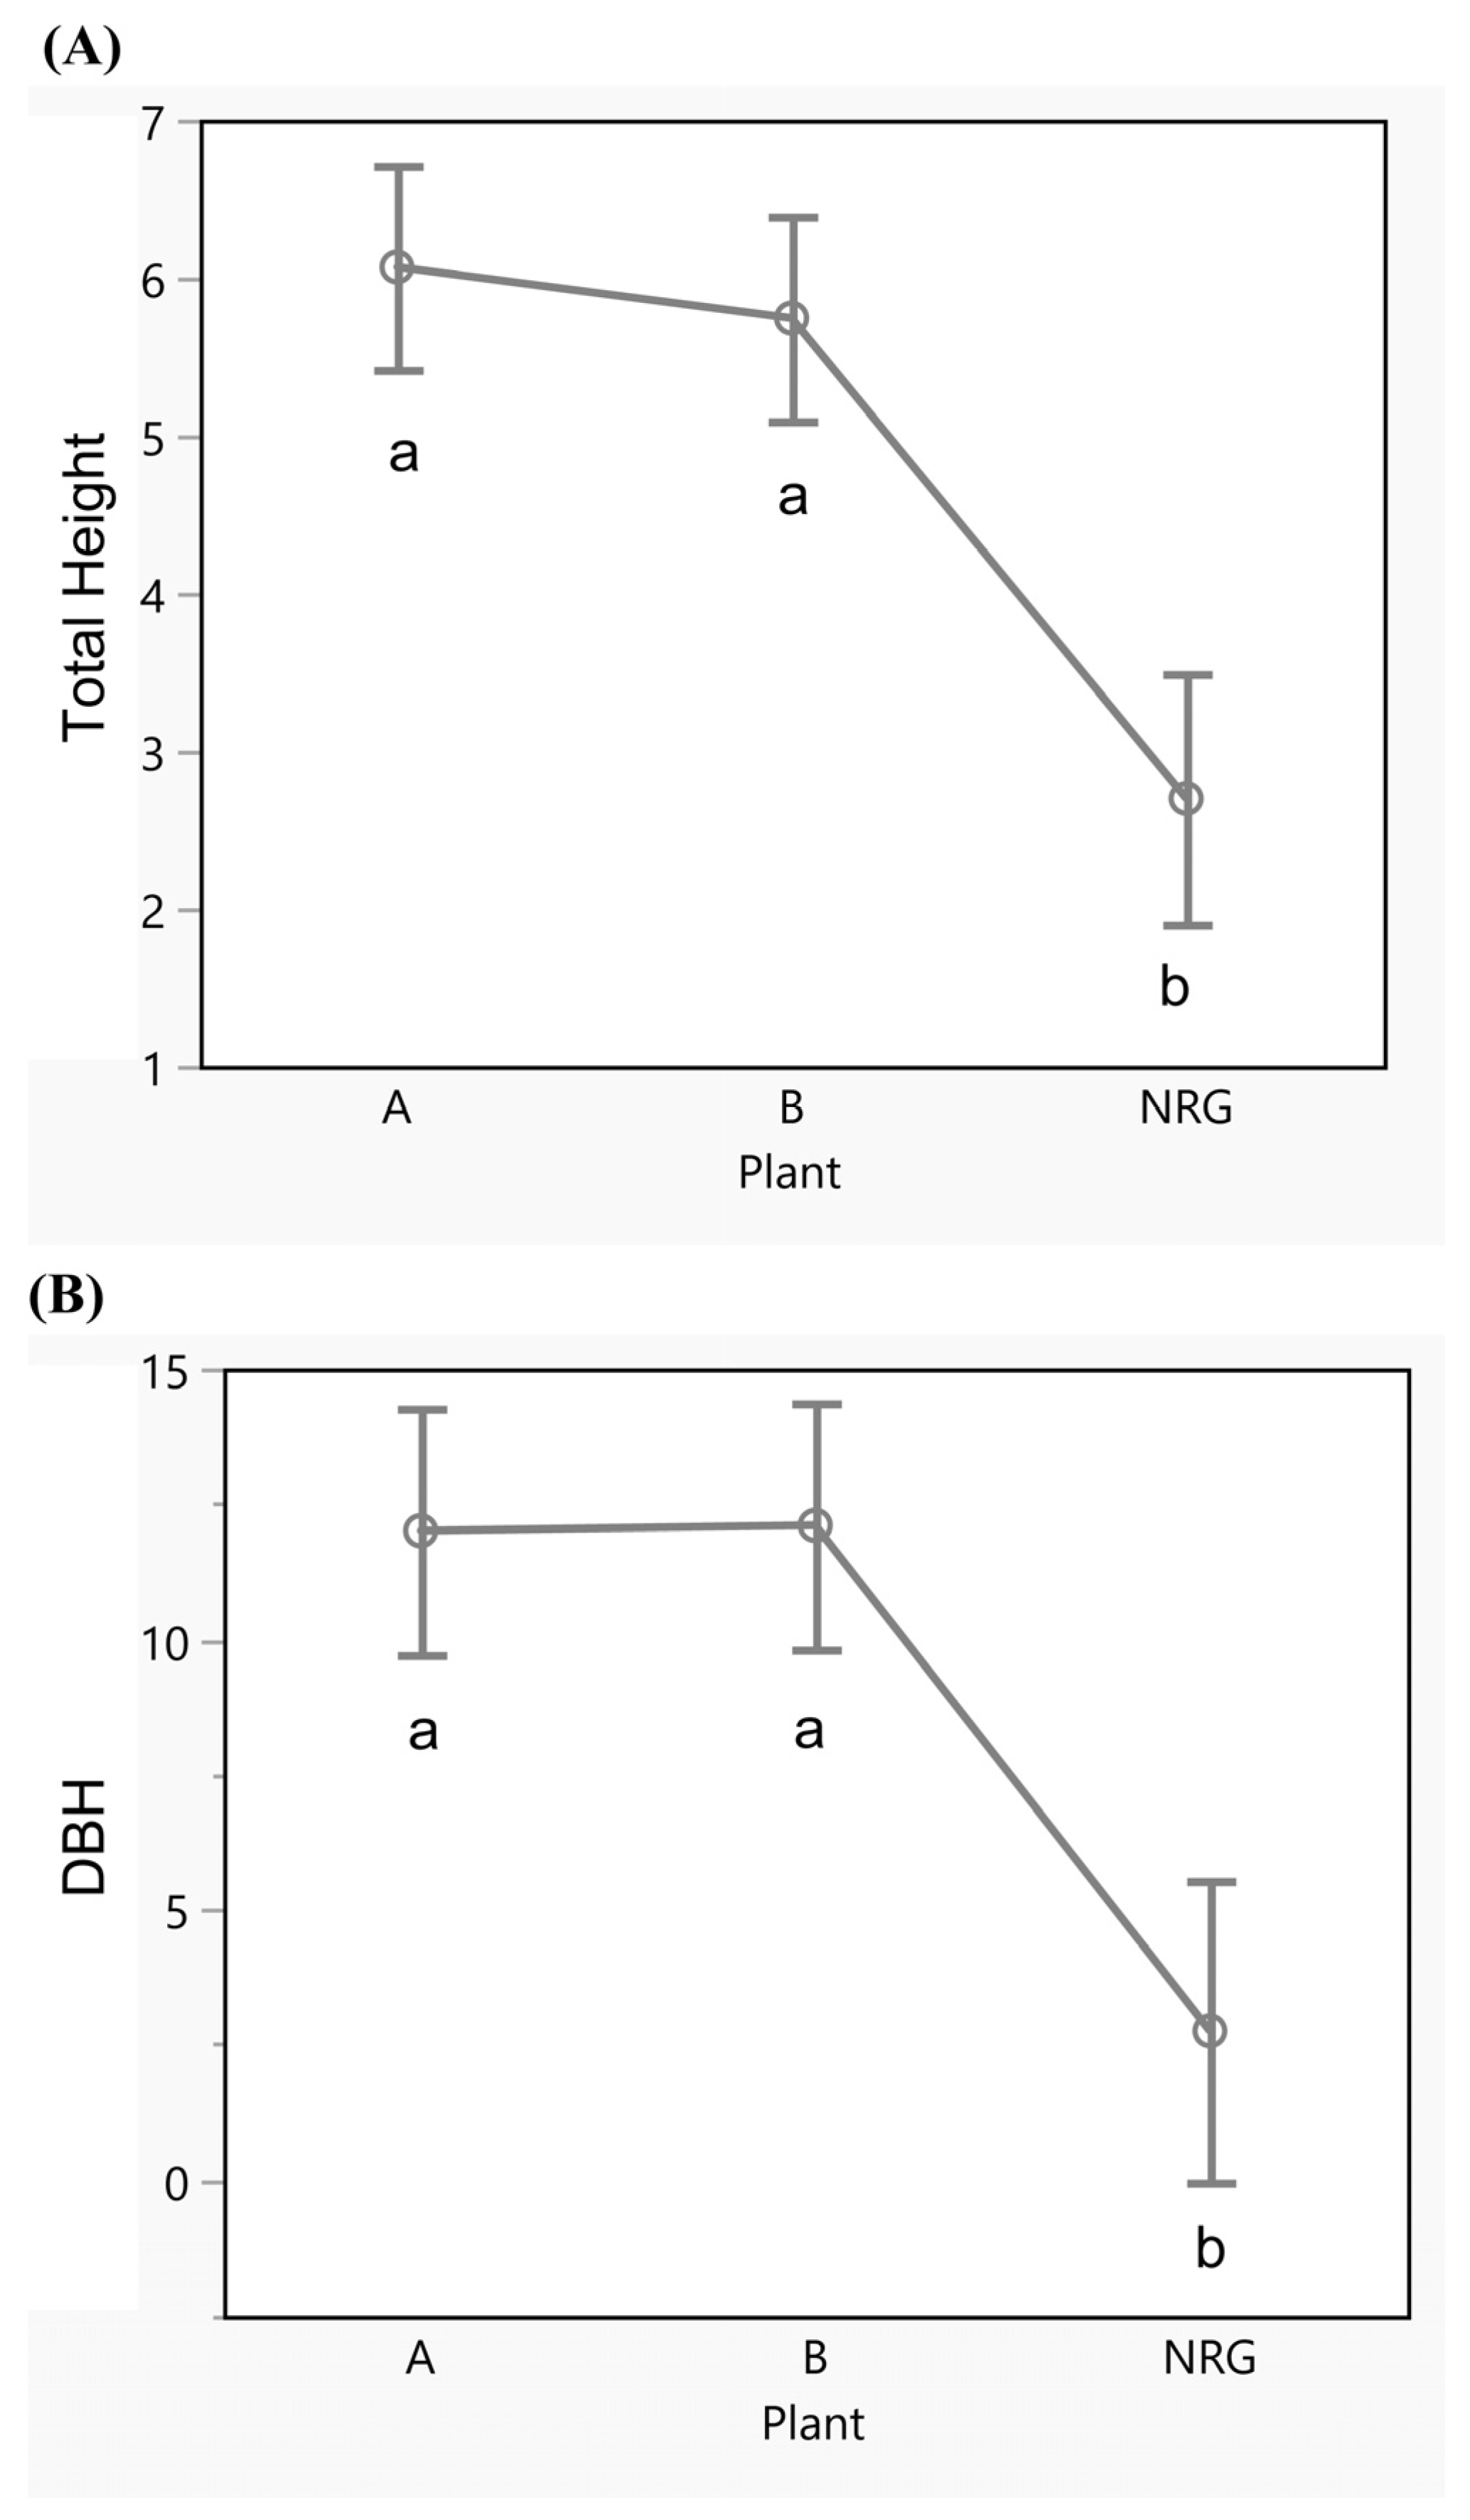
In the low-elevation region, the annual BAI (basal area increment) (Figure 4A) and annual height growth (Figure 4B) before thinning was greater in plantations compared to naturally regenerating stands (all p < 0.01) (Table 3). Furthermore, the total height (Figure 5A) and DBH (Figure 5B) were also greater in plantations than in naturally regenerating stands (all p < 0.01) (Table 3). Regeneration (Figure 6A) and trees per hectare (Figure 6B) were greater in naturally regenerating stands versus plantation stands (all p < 0.001) (Table 3).
There was a trend of shrub cover percentage (p = 0.0507) and shrub height (p = 0.0877) differing among the treatments (Table 3). Clustered plantations generally had the highest shrub percent and shrub height, while naturally regenerating stands generally had the lowest shrub percent and shrub height.
There were no significant differences among the treatment groups for any of the dependent variables for the one-way ANOVA in the high-elevation region (Table 3).

3.2. ANOVA of Only Thinned Plantations in the Low-Elevation Region

When looking at only thinned plantations in the low-elevation region, the thinning index for BAI had a trend of the evenly spaced plantations responding 15% more to thinning than the clustered plantations (p = 0.061; Figure 7, Table 4). We feel there is some ecological merit in still interpreting these patterns when the p value is close to 0.05, and this is also partly a reflection of the issue of a low sample size. None of the other variables tested among only the thinned plantations (BAI and annual height growth after thinning and height growth thinning index) differed among the planting arrangements (all p > 0.1; Table 4).

3.3. Regression Models

Based on the regression framework examining growth across all plantations and naturally regenerating stands, the dummy variable associated with naturally regenerating stands was a significant independent variable for all regression models in the low-elevation region (Table 5). Height growth from 2013 to 2016 was positively associated with shrub height. Height growth before thinning was also related to aspect. Dependent variables in the high-elevation region had more independent variables in the model and higher adjusted R2 values compared to their counterparts in the low-elevation region (Table 5). The frequency of yellow pine was positively associated with BAI and height growth from 2013 to 2016. The distance to the nearest seed sources was associated with BAI and height growth from 2013 to 2016 in different ways (either positive or negative) depending on the tree species. Furthermore, BAI (2013–2016) was also associated negatively with shrub percent and positively related to shrub height. Overall, across these models, shrub cover tended to reduce growth, while the frequency of yellow pines had a positive effect, especially at high elevation (Table 5).
Under the regression framework where only plantation stands were considered, and for the low-elevation region, the explanatory power of the regression models declined with lower adjusted R2 values compared to when all three treatment categories were considered (Table 6). The categorical, dummy variable related to plantation arrangement was not significant in any of the models in either the low- or high-elevation region (Table 6). BAI dependent variables in the low-elevation region were all negatively associated with shrub percent, species richness, and trees per hectare before thinning. In the low-elevation region, height growth from 2013 to 2016 and before thinning was positively related to density of regeneration, while height growth after thinning was associated instead with trees per hectare before thinning. The response of BAI and height in the high-elevation region, and for only the plantations, responded to similar types of independent variables and had a slightly higher explanatory power (i.e., adjusted R2) (Table 6) compared to when all three treatment categories (i.e., clustered vs. evenly spaced vs. natural regeneration) were considered (c.f. Table 5). Overall, across these models comparing only plantation arrangements, shrub cover tended to reduce growth, while the frequency of yellow pines had a positive effect, especially at high elevation (Table 6).

4. Discussion

Our findings reaffirm the benefits of plantation establishment for improving tree growth (i.e., annual BAI (basal area increment) and annual height growth) compared to natural stand growth [34]. Nevertheless, natural stands still showcased higher regeneration and tree density, primarily due to the fact that several large trees acting as seed sources remained in the natural stands selected and examined in this study, having escaped the effects of the Power Fire. Consequently, naturally regenerating stands can still contribute to ecological recovery after fires that have a heterogenous impact on the landscape, leading to variability in fire severity, tree mortality, and effects on the forest floor substrate. Despite the lower growth rates in natural stands, this could be offset by the typically higher density found in these stands in comparison to plantations. We recommend that careful monitoring of natural stands and application of pre-commercial and commercial thinning will help to ensure the future resilience of these natural-origin stands. From a forest economics standpoint, incorporation of natural stands in post-fire recovery is essential to minimize the per acre cost of post-fire recovery. Fuel treatments applied on a landscape scale can help to promote heterogeneity, which, in turn, can increase stand survival [25,35] and essentially serve as the equivalent of “advanced regeneration” for post-fire recovery efforts. Furthermore, our study supports investments in artificial regeneration in plantation establishment, which can help to set up a strong trajectory for tree growth and therefore general forest productivity [36].
When only considering planted stands, our study showed that the spatial arrangement of the plantation did have some influence depending on the level of statistical significance considered. For instance, the BAI thinning index was 15% higher in stands that were evenly spaced compared to clustered stands, but only at the 10% level of significance. In the water-limiting climate of the Sierra Nevada montane region [12], this trend is expected, since trees spaced further apart from each other, i.e., evenly spaced plantations in this study, have greater growing space and therefore lower competition for light and below-ground resources [34]. Height growth was not significantly different between the plantation arrangements, highlighting that in the early stand developmental stage, height growth is not as sensitive to the degree of spatially driven extent of competition. According to the stress-gradient hypothesis, plant interactions shift from competition to facilitation as environmental conditions become more stressful [37,38]. Consequently, the choice of spatial arrangement, to some extent, could be framed under the stress-gradient hypothesis: evenly spaced plantations perform better under more mesic conditions, but clustered arrangements are likely to become more beneficial under extreme climate conditions (i.e., drought stress).
Our study highlighted the importance of factoring in plant diversity in general and understory shrubs in particular, and their typically negative impact on the growth of ponderosa pine and Jeffrey pine. When considering all three stand treatment categories (i.e., clustered, evenly spaced, and naturally regenerating stands), shrub height appeared to have a height training effect on the pine species, prioritizing and allocating more height growth. Shrub height and shrub cover was typically associated with BAI-related metrics. In the low-elevation region, higher species richness appeared to have a negative competitive influence on all BAI-related metrics of the yellow pine species. While high plant diversity could be important from an ecological perspective, it appears that during the initial phases of plantation development, lower plant diversity could assist with plantation growth by limiting competing vegetation. Several studies have found increased native and non-native species richness with shrub removal in post-fire plantations in the Sierra Nevada [39,40]. Increases in plant richness after shrub removal and thinning are most likely due to an increase in the level of light in the environment after treatment, allowing more species to colonize [41].
The frequency of yellow pines was an important, positively associated factor that affected BAI and height growth, but primarily in the high-elevation region. There are two possible explanations for this trend. Yellow pines could have faster diameter and height growth when accompanied by other yellow pines. For instance, Owen et al. [16] found that in patches of ponderosa pine regeneration after a fire, sapling height was positively correlated with neighboring-sapling density, suggesting that young ponderosa pines experience intraspecific facilitation. Alternatively, the correlation of yellow pine density with positive diameter and height growth could also be a reflection of site quality. A higher-quality site can support a greater density of yellow pines, and trees would likely exhibit high survival following establishment, which ultimately translates to better growth. Our findings also indicated the importance of distance to seed sources, which not only affected naturally regenerated stands, but also plantations, regardless of planting patterns, at higher elevation. When all three stand categories were considered, BAI and height growth showed mixed results with distance to remnant overstory trees (potential seed sources). It should be noted that high levels of natural regeneration and ingrowth in the high-elevation plantations limits direct interpretation of causal mechanisms, yet similar patterns of inter/intra-species-specific competition have been noted in mature sugar and ponderosa pine elsewhere in the Sierra Nevada [42]. Multiple studies have found that mixed-conifer establishment after a high-severity fire is often patchy and variable [4,5,43].
Our study highlighted the important legacy effect of prior stand density on the growth of yellow pines, but primarily in the low-elevation region, and only when the two plantation groups were examined. Namely, the trees per hectare before thinning negatively affected all metrics of BAI, but only influenced height growth after thinning. This negative association suggests that a lower initial density of the plantations promotes better BAI growth and height growth after pre-commercial thinning. These findings are expected in the context of ensuring adequate growing space for trees, and reinforce the importance of density control as part of plantation management regimens [34].
Unfortunately, our field sampling design had elevation and pre-commercial thinning as confounding factors, since PCTs were only conducted in the low-elevation regions. Consequently, we were not in a position to directly interpret the impacts of elevation or pre-commercial thinning. While elevation was not a significant variable in the regression models, we are not in a position to make a definitive statement due to these confounding issues. It is not entirely possible to exclude the impact of elevation on the growth of the plantations, considering that shorter growing conditions and cooler temperatures at higher elevation likely slowed growth and thereby limited the necessity of performing PCT [44,45]. Multiple studies in the Sierra Nevada have shown that species richness decreases as elevation increases [44,46,47]. This decrease in richness is often attributed to a decrease in invasive plants at higher elevations [44,46].
Nonetheless, our study did explore the before and after-effects of pre-commercial thinning on BAI and height growth in the low-elevation region, and while not perfect, still has the potential to be generalized beyond just our study sites. When only the planted stands were considered, it appeared that the regeneration count was positively associated with height growth before the PCT, but after the PCT, it switched to a negative association with trees per hectare that was present before the thinning. PCT did not appear to influence the types of significant independent variables found when it came to the before-and-after-thinning comparison for BAI. We therefore recommend that future studies apply PCT across all elevational regions in order to discern more directly whether elevation plays a role. Furthermore, some of the patterns observed, especially related to the thinning index and plantation arrangement, were only significant at the 10% level. Consequently, we recommend that future studies consider deploying higher sample replication. Pre-commercial thinning has been shown to increase resource availability, including soil moisture, which is important for ponderosa pine growth, as it is found in dry climates [48].
The effects of climate were not considered directly in this study, partly since the tree-ring record of juvenile trees was much too short to conduct a traditional dendroclimatic study. Nonetheless, the findings of this study have potential implications for promoting future resilience to climate change. Future climate projections for the state of California indicate a trend of increased warming by the end of the 21st century, whereas there is a lack of distinct changes in precipitation, since different climate models project both a decrease and increase in winter precipitation [49]. In terms of plantation arrangement, under relatively more mesic conditions and a moderate gradient of climate stress, we hypothesize that evenly spaced plantations will likely perform better under future climate change. Likewise, under the stress-gradient framework, the excessive warming anticipated by the end of the 21st century will likely catapult clustered plantations into providing a facilitative role. The potential mechanism behind this is that clustered stands will provide more protective cover against excessive solar radiation, and thereby ameliorate microclimatic conditions and promote conditions of cooler temperatures, higher relative humidity, and higher soil moisture [50].

5. Conclusions

In this study, we compared growth and development in several post-fire plantations and naturally regenerating stands in Eldorado National Forest in the north–central Sierra Nevada Mountains in California. Our results indicated that diameter and height growth was generally better maintained in the plantations compared to under natural stand conditions. When considering plantation arrangement, the annual basal area increment was generally higher in evenly spaced plantations compared to clustered plantations. While high plant diversity will be important eventually from an ecological perspective, our study suggests that during the initial phases of plantation development, lower shrub diversity could assist with plantation growth. The frequency of yellow pines was an important, positively associated factor that affected BAI or height growth, but primarily in the high-elevation region, which demonstrates a facilitative legacy effect of prior stand composition. Our study highlights the important legacy effect of prior stand density and indicates that a lower initial density of plantations promotes better BAI growth and height growth after pre-commercial thinning.
From a forest management perspective, there are several important management recommendations derived from this study which not only will inform the management of forests in the Sierra Nevada, but also have implications for other similar Mediterranean-type ecosystems. These recommendations include the following:
  • Evenly spaced plantations appear to maximize growth compared to the clustered arrangement, at least in the short term, which will need to be verified further with future forest monitoring.
  • Clustered plantations may enhance structural and spatial heterogeneity across the landscape and potentially provide facilitative effects and thus resilience to extreme climatic stress.
  • Shrub management and removal of competing understory vegetation not only promote better growth, but likely also limit fire risk by removing potential ladder fuels.
  • Thinning, even as pre-commercial thinning, still continues to promote tree-level productivity and the improved growing space promotes resilience to climatic stress and also limits fire risk [51].
Overall, forest managers should consider balancing evenly spaced plantations, which prioritize rapid growth, with clustered plantations to retain structural diversity, while maintaining shrub management and thinning as key management interventions to promote plantation productivity and resilience.
One of the limitations of this study was the confounding issue that pre-commercial thinning was only conducted in the low-elevation region. Future studies need to incorporate pre-commercial thinning across an elevational gradient to better isolate the potential effects of elevation. Furthermore, given the short post-fire time frame, future research should focus on revisiting the site in the future to examine the temporal stability of the patterns we have seen so far, especially under projected increases in fire frequency and climate stressors. The study represents baseline data that can used for comparison purposes if additional, repeated fires break out in the area, which unfortunately could negatively influence restoration success and affect future fire severity [52]. Future studies could also examine interactions between regional climatic conditions and their impact on the microclimate, as well as the ecophysiological performance of tree seedlings in different plantation arrangements and under natural stand conditions.

Supplementary Materials

The following supporting information can be downloaded at: https://www.mdpi.com/article/10.3390/f16101506/s1, Table S1: Full set of results from one way ANOVA among the 3 overall treatment categories (TRT) for: (a) low elevational region and (b) high elevation region. This table includes the type of transformation and F-statistic which are missing from Table 3 in the main manuscript; Table S2: Results from one way ANOVA on just thinned plantations comparing planting arrangements. * indicates significance at 0.1 level, for fixed effects. This table includes the type of transformation and F-statistics which are missing from Table 4 in the main manuscript.

Author Contributions

Formal analysis, I.A.; funding acquisition, S.C.; methodology, I.A., S.C., J.Z. and M.P.; supervision, S.C. and J.Z.; writing—original draft, I.A.; writing—review and editing, S.C., J.Z. and M.P. All authors have read and agreed to the published version of the manuscript.

Funding

This project was funded by the United States Forest Service, Pacific Southwest Station, Participating Agreement 17-PA-11272139-010. This work was also supported by the United States Department of Agriculture (USDA), National Institute of Food and Agriculture (NIFA), McIntire Stennis Project WVA00831.

Data Availability Statement

The original contributions presented in this study are included in the article and Supplementary Materials. Further inquiries can be directed to the corresponding author.

Acknowledgments

Assistance in the field was provided by S. Dickinson, K. Finley, M. Subedi, S. Spottswood, and C. Albright. We also thank the journal editors and three anonymous reviewers for their constructive feedback on a prior version of the manuscript.

Conflicts of Interest

The authors declare no conflicts of interest.

References

  1. Agee, J.K. Fire Ecology of Pacific Northwest Forests; Island Publisher: Washington, DC, USA, 1993. [Google Scholar]
  2. Miller, J.D.; Safford, H.D. Trends in wildfire severity: 1984 to 2010 in the Sierra Nevada, Modoc Plateau, and southern Cascades, California, USA. Fire Ecol. 2012, 8, 41–57. [Google Scholar] [CrossRef]
  3. Westerling, A.L.; Bryant, B.P. Climate change and wildfire in California. Clim. Change 2007, 87 (Suppl. S1), 231–249. [Google Scholar] [CrossRef]
  4. Collins, B.M.; Roller, G.B. Early forest dynamics in stand-replacing fire patches in the northern Sierra Nevada, California, USA. Landsc. Ecol. 2013, 28, 1801–1813. [Google Scholar] [CrossRef]
  5. North, M.P.; Stevens, J.T.; Greene, D.F.; Coppoletta, M.; Knapp, E.E.; Latimer, A.M.; Restaino, C.M.; Restaino, C.M.; Tompkins, R.E.; Welch, K.R.; et al. Tamm Review: Reforestation for resilience in dry western U.S. forests. For. Ecol. Manag. 2019, 432, 209–224. [Google Scholar] [CrossRef]
  6. USDA Forest Service. Power Fire Reforestation Project; USDA Forest Service, Eldorado National Forest: Placerville, CA, USA, 2014.
  7. Churchill, D.J.; Larson, A.J.; Dahlgreen, M.C.; Franklin, J.F.; Hessburg, P.F.; Lutz, J.A. Restoring forest resilience: From reference spatial patterns to silvicultural prescriptions and monitoring. For. Ecol. Manag. 2013, 291, 442–457. [Google Scholar] [CrossRef]
  8. North, M.P.; Stine, P.A.; O’Hara, K.; Zielinski, W.J.; Stephens, S.L.; Service, F.; Hara, K.O. An Ecosystem Management Strategy for Sierran Mixed-Conifer Forests; General Technical Reports, PSW-GTR-220; USDA Forest Service: Albany, CA, USA, 2009.
  9. Chamberlain, C.P.; Bartl-Geller, B.N.; Cansler, C.A.; North, M.P.; Meyer, M.D.; van Wagtendonk, L.; Redford, H.E.; Kane, V.R. When do contemporary wildfires restore forest structures in the Sierra Nevada. Fire Ecol. 2024, 20, 91. [Google Scholar] [CrossRef]
  10. Duchesneau, R.; Lesage, I.; Messier, C.; Morin, H. Effects of light and intraspecific competition on growth and crown morphology of two size classes of understory balsam fir saplings. For. Ecol. Manag. 2001, 140, 215–225. [Google Scholar] [CrossRef]
  11. McDonald, P.M. Forest Regeneration and Seedling Growth from Five Major Cutting Methods in North-Central California; Research Paper PSW-115; Department of Agriculture, Forest Service, Pacific Southwest Forest and Range Experiment Station: Riverside, CA, USA, 1976; p. 10. [Google Scholar]
  12. Royce, E.B.; Barbour, M.G. Mediterranean climate effects. I. Conifer water use across a Sierra Nevada ecotone. Am. J. Bot. 2001, 88, 911–918. [Google Scholar] [CrossRef]
  13. Tappeiner, J.C.; McDonald, P.M. Regeneration of Sierra Nevada forests. In Sierra Nevada Ecosystem Project Final Report to Congress: Status of the Sierra Nevada; USGS Publications Warehouse: Reston, VA, USA, 1996; Volume 3, pp. 501–513. [Google Scholar]
  14. Scott, W.; Meade, R.; Leon, R.; Hyink, D.; Miller, R. Planting density and tree-size relations in coast Douglas-fir. Can. J. For. Res. 1998, 28, 74–78. [Google Scholar] [CrossRef]
  15. Fajardo, A.; McIntire, E.J.B. Under strong niche overlap conspecifics do not compete but help each other to survive: Facilitation at the intraspecific level. J. Ecol. 2011, 99, 642–650. [Google Scholar] [CrossRef]
  16. Owen, S.M.; Sieg, C.H.; Sánchez Meador, A.J.; Fulé, P.Z.; Iniguez, J.M.; Baggett, L.S.; Fornwalt, P.J.; Battaglia, M.A. Spatial patterns of ponderosa pine regeneration in high-severity burn patches. For. Ecol. Manag. 2017, 405, 134–149. [Google Scholar] [CrossRef]
  17. Holmgren, M. Combined effects of shade and drought on tulip poplar seedlings: Trade-off in tolerance or facilitation? Nord. Soc. Oikos 2000, 90, 67–78. [Google Scholar] [CrossRef]
  18. Simard, S.W. The foundational role of mycorrhizal networks in self-organization of interior Douglas-fir forests. For. Ecol. Manag. 2009, 258, 95–107. [Google Scholar] [CrossRef]
  19. Nagel, T.A.; Taylor, A.H. Fire and persistence of montane chaparral in mixed conifer forest landscapes in the northern Sierra Nevada, Lake Tahoe Basin, California, USA. J. Torrey Bot. Soc. 2005, 132, 442–457. [Google Scholar] [CrossRef]
  20. Russell, W.H.; Mcbride, J.R.; Rowntree, R. Revegetation after four stand replacing fires in the Lake Tahoe Basin. Madrono 1998, 45, 40–46. [Google Scholar]
  21. Bonnet, V.H.; Schoettle, A.W.; Shepperd, W.D. Postfire environmental conditions influence the spatial pattern of regeneration for Pinus ponderosa. Can. J. For. Res. 2005, 35, 37–47. [Google Scholar] [CrossRef]
  22. McDonald, P.M.; Fiddler, G.O. Twenty-Five Years of Managing Vegetation in Conifer Plantations in Northern and Central California: Results, Application, Prin-Ciples, and Challenges; General Technical Reports PSW-GTR_231; USDA Forest Service: Albany, CA, USA, 2010. Available online: http://www.srs.fs.usda.gov/pubs/37965 (accessed on 10 August 2025).
  23. Zhang, J.; Oliver, W.W.; Busse, M.D. Growth and development of ponderosa pine on sites of contrasting productivities: Relative importance of stand density and shrub competition effects. Can. J. For. Res. 2006, 2438, 2426–2438. [Google Scholar] [CrossRef]
  24. Kobziar, L.N.; Mcbride, J.R.; Stephens, S.L. The efficacy of fire and fuels reduction treatments in a Sierra Nevada pine plantation. Int. J. Wildland Fire 2009, 18, 791–801. [Google Scholar] [CrossRef]
  25. Allen, I.; Pawlikowski, N.; Chhin, S.; Premer, M.; Zhang, J. Modeling juvenile stand development and fire risk of post fire planted-forests under variations in thinning and fuel treatments using FVS-FFE. Forests 2023, 14, 1223. [Google Scholar] [CrossRef]
  26. Bailey, R. Bailey’s Ecoregions and Subregions of the United States, Puerto Rico, and the U.S. Virgin Islands; Forest Service Research Data Archive: Ft. Collins, CO, USA, 2016. [Google Scholar] [CrossRef]
  27. U.S. Department of Agriculture (USDA) Forest Service. Final Environmental Impact Statement Power Fire Reforestation Project; U.S. Department of Agriculture (USDA) Forest Service: Missoula, MT, USA, 2017.
  28. U.S. Department of Agriculture (USDA) Forest Service. Record of Decision. In Sierra Nevada Forest Plan Amendment—Final Supplemental Environmental Impact Statement; U.S. Department of Agriculture (USDA) Forest Service: Missoula, MT, USA, 2004; p. 72. Available online: http://www.fs.usda.gov/detail/r5/landmanagement/planning/?cid=STELPRDB5349922 (accessed on 10 August 2025).
  29. Speer, J.H. Fundamentals of Tree Ring Research; University of Arizona Press: Tucson, AZ, USA, 2012. [Google Scholar]
  30. Cybis Electronic. CDendro and CooRecorder. 2018. Available online: https://www.cybis.se/forfun/dendro/index.htm (accessed on 10 August 2025).
  31. Bunn, A.G. A dendrochronology program library in R (dplR). Dendrochronologia 2008, 26, 115–124. [Google Scholar] [CrossRef]
  32. RStudio Team. RStudio: Integrated Development for R; RStudio Team: Boston, MA, USA, 2018; Available online: http://www.rstudio.com/ (accessed on 10 August 2025).
  33. SAS Institute Inc. JMP; SAS Institute Inc.: Cary, SC, USA, 2018. [Google Scholar]
  34. Nyland, R.D. Silviculture: Concepts and Applications, 2nd ed.; Waveland Press, Inc.: Long Grove, IL, USA, 2002; 682p. [Google Scholar]
  35. Allen, I.; Chhin, S.; Zhang, J. Fire and forest management in montane forests of the northwestern States and California, USA. Fire 2019, 2, 17. [Google Scholar] [CrossRef]
  36. Sterner, S.; Aslan, C.; Best, R.; Chaudhry, T. Forest management effects on vegetation regeneration after a high severity wildfire: A case study in the southern Cascade range. For. Ecol. Manag. 2022, 520, 120394. [Google Scholar] [CrossRef]
  37. Bertness, M.D.; Callaway, R.M. Positive interactions in communities. Trends Ecol. Evol. 1994, 9, 191–193. [Google Scholar] [CrossRef]
  38. Schmied, S.; Kappen, J.; del Rio, M.; Moser, W.K.; Gundale, M.J.; Hilmers, T.; Ambs, D.; Uhl, E.; Pretzsch, H. Positive mixture effects in pine-oak forests during drought are context-dependent. Plant Biol. 2025. [Google Scholar] [CrossRef]
  39. Bohlman, G.N.; North, M.P.; Safford, H.D. Shrub removal in reforested post-fire areas increases native plant species richness. For. Ecol. Manag. 2016, 374, 195–210. [Google Scholar] [CrossRef]
  40. McGinnis, T.W.; Keeley, J.E.; Stephens, S.L.; Roller, G.B. Fuel buildup and potential fire behavior after stand-replacing fires, logging fire-killed trees and herbicide shrub removal in Sierra Nevada forests. For. Ecol. Manag. 2010, 260, 22–35. [Google Scholar] [CrossRef]
  41. Wayman, R.B.; North, M.P. Initial response of a mixed-conifer understory plant community to burning and thinning restoration treatments. For. Ecol. Manag. 2007, 239, 32–44. [Google Scholar] [CrossRef]
  42. Premer, M.; Chhin, S.; Zhang, J. Local testing and calibration of species-specific competition indices in Sierran mixed-conifer forests: Application transfer to evolving objectives. Can. J. For. Res. 2021, 51, 524–532. [Google Scholar] [CrossRef]
  43. Welch, K.R.; Safford, H.D.; Young, T.P. Predicting conifer establishment 5–7 years after wildfire in middle elevation yellow pine and mixed conifer forests of the North American Mediterranean-climate zone. Ecosphere 2016, 7, e01609. [Google Scholar] [CrossRef]
  44. Rundel, P.W.; Keeley, J.E. Dispersal Limitation Does Not Control High Elevational Distribution of Alien Plant Species in the Southern Sierra Nevada, California. Nat. Areas J. 2016, 36, 277–287. [Google Scholar] [CrossRef]
  45. Western Regional Climate Center. Climate of California. Western Regional Climate Center, 2018. Available online: https://wrcc.dri.edu (accessed on 10 August 2025).
  46. Klinger, R.; Underwood, E.C.; Moore, P.E. The role of environmental gradients in non-native plant invasion into burnt areas of Yosemite National Park, California. Divers. Distrib. 2006, 12, 139–156. [Google Scholar] [CrossRef]
  47. Wathen, S.; Thorne, J.H.; Holguin, A.; Schwartz, M.W. Estimating the spatial and temporal distribution of species richness within Sequoia and Kings Canyon National Parks. PLoS ONE 2014, 9, e112465. [Google Scholar] [CrossRef]
  48. Chase, C.W.; Kimsey, M.J.; Shaw, T.M.; Coleman, M.D. The response of light, water, and nutrient availability to pre-commercial thinning in dry inland Douglas-fir forests. For. Ecol. Manag. 2016, 363, 98–109. [Google Scholar] [CrossRef]
  49. Cayan, D.R.; Luers, A.L.; Franco, G.; Hanemann, M.; Croes, B.; Vine, E. Overview of the California climate change scenarios project. Clim. Change 2008, 2008, S1–S6. [Google Scholar] [CrossRef]
  50. Chhin, S.; Wang, G.G. Growth of white spruce, Picea glauca, seedlings in relation to microenvironmental conditions in a forest-prairie ecotone of southwestern Manitoba. Can. Field Nat. 2007, 121, 191–200. [Google Scholar] [CrossRef]
  51. Zhang, J.; Ritchie, M.W.; Maguire, D.A.; Oliver, W.W. Thinning ponderosa pine (Pinus ponderosa) stands reduces mortality while maintaining stand productivity. Can. J. For. Res. 2013, 43, 311–320. [Google Scholar] [CrossRef]
  52. Jasperse, L.; Collins, B.M.; Coppoletta, M.; Merriam, K.; Stephens, S.L. Drivers of fire severity in repeat fires: Implications for mixed-conifer forests in the Sierra Nevada, California. Fire Ecol. 2025, 21, 46. [Google Scholar]
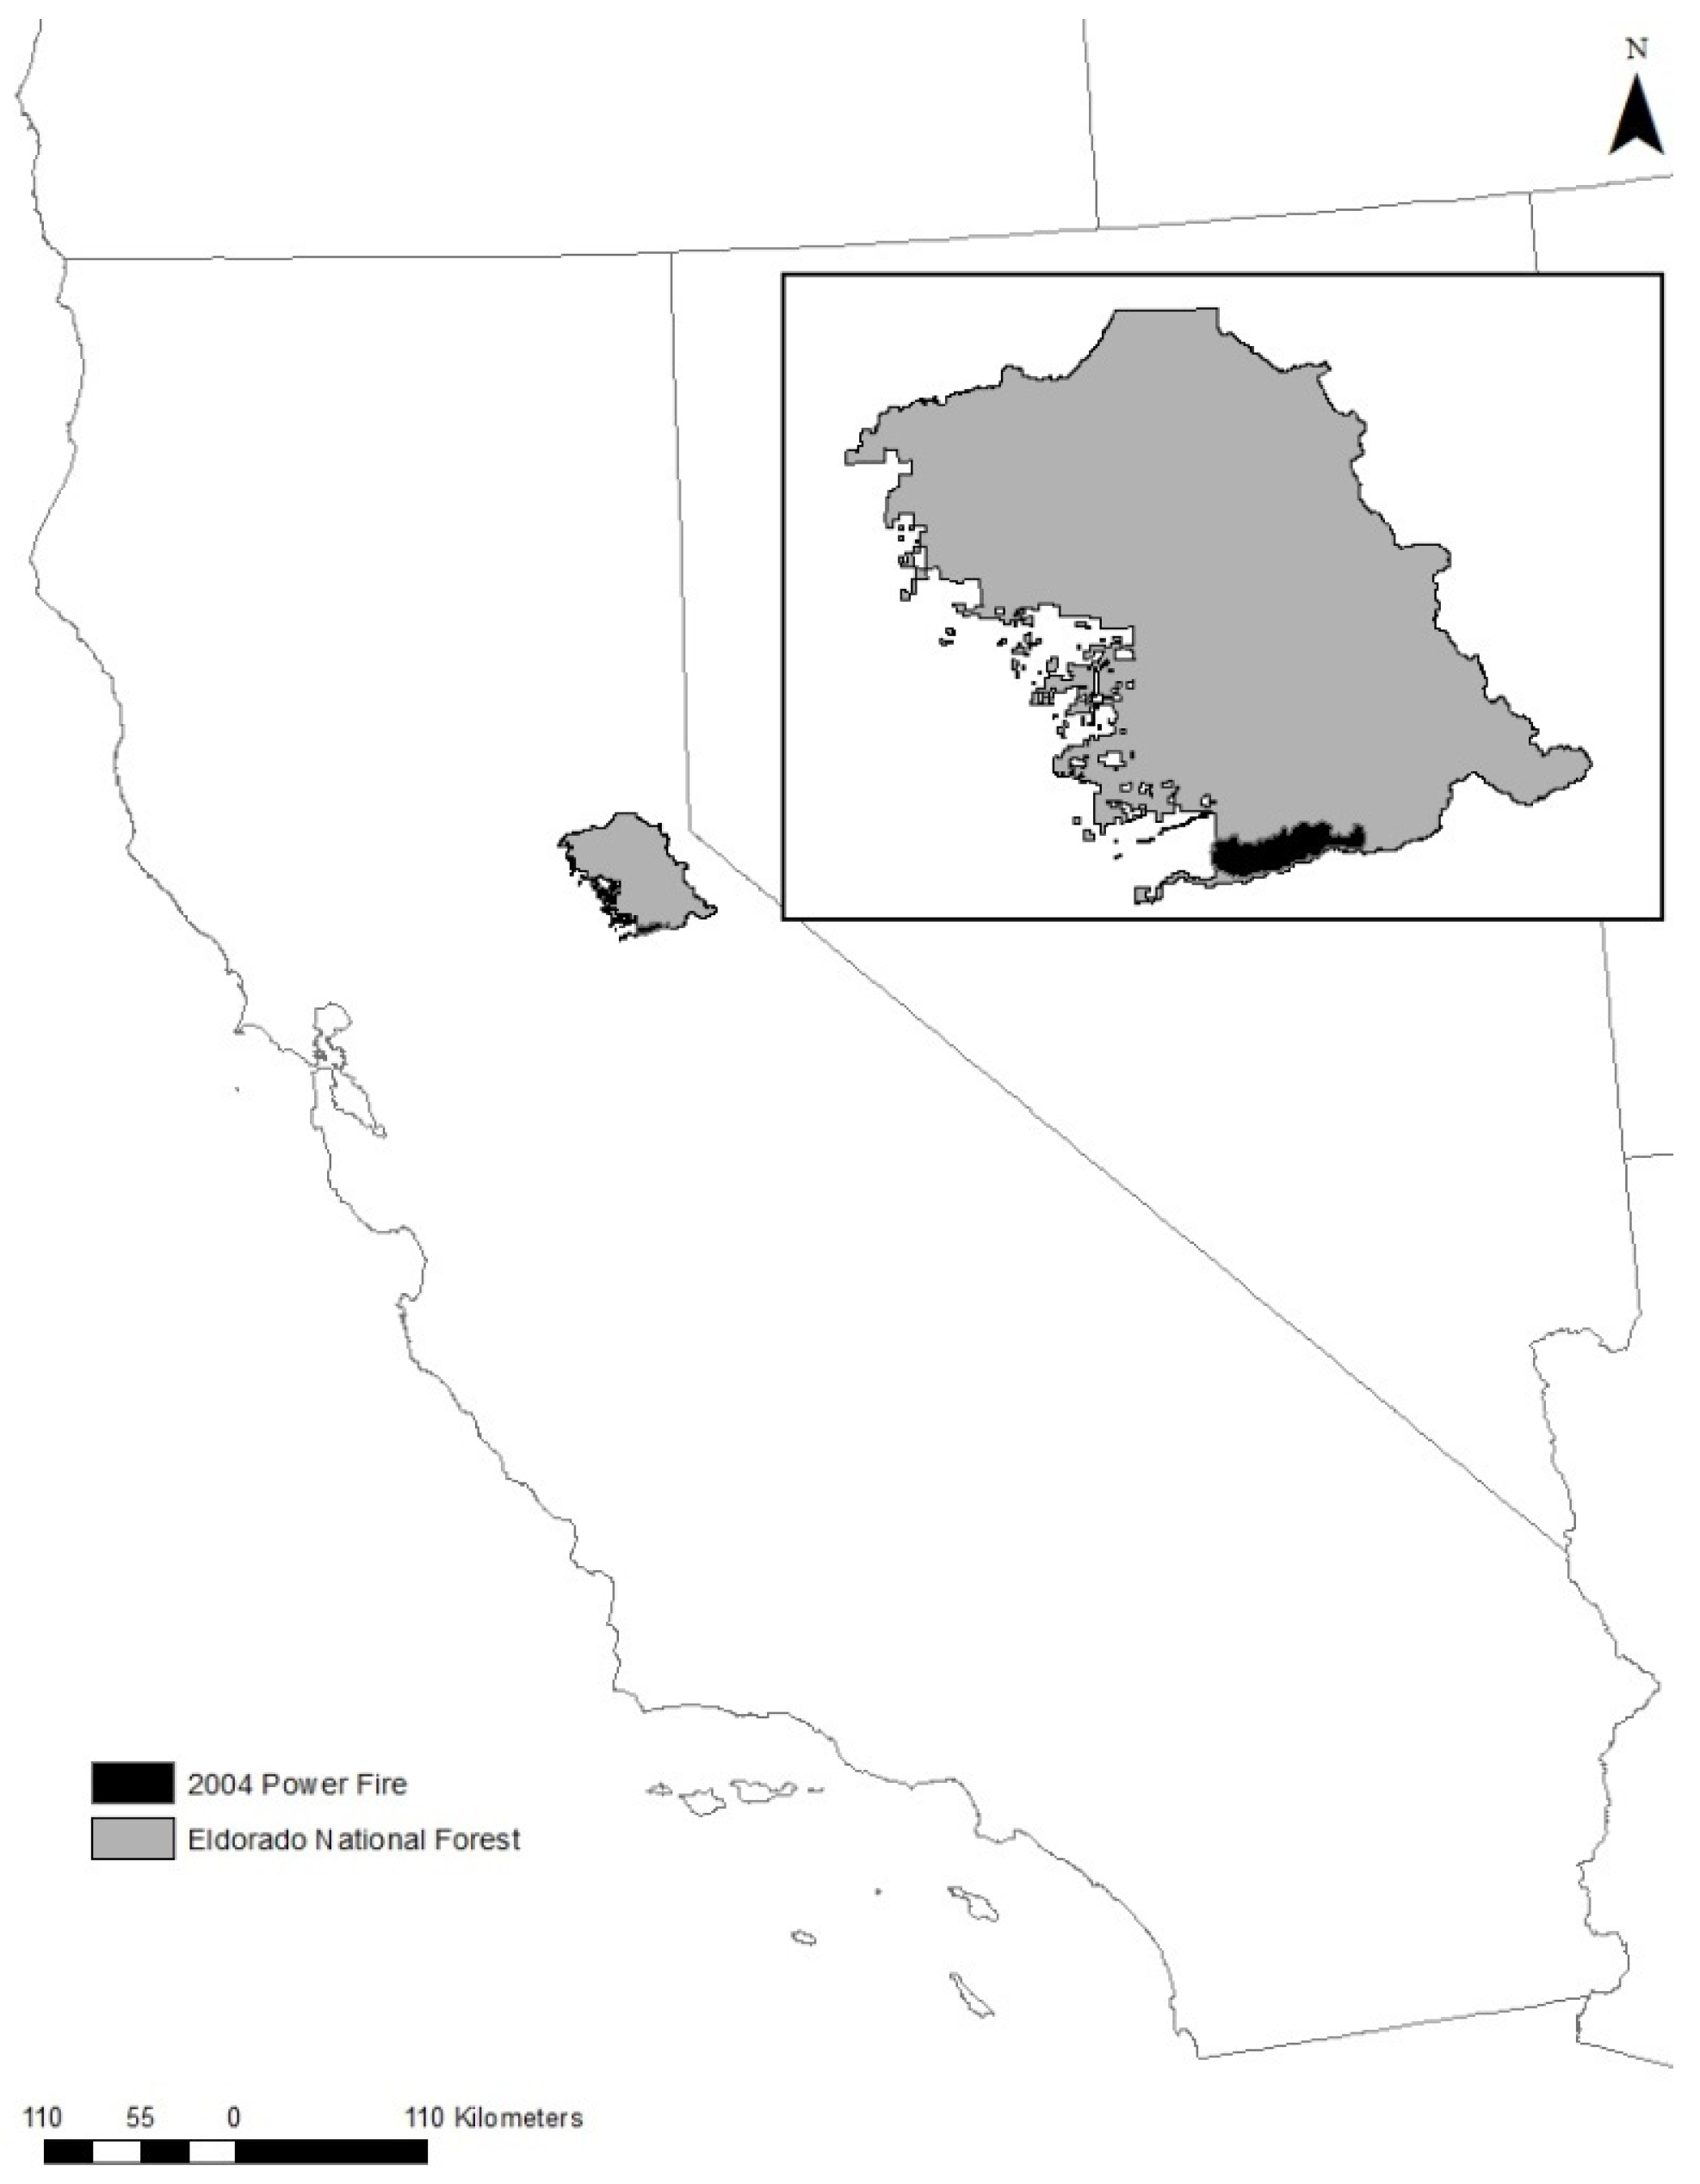
Figure 1. A representation of the study area, including Eldorado National Forest (gray) and the perimeter of the 2004 Power Fire (black) situated in Northern California (surrounded by the state of Oregon to the north and the state of Nevada to the east).
Forests 16 01506 g001
Figure 2. Field sampling locations within the 2004 Power Fire perimeter.
Forests 16 01506 g002
Figure 3. Sampling diagram for 200 m2 plots. r = radius; N= North, E = East, S = South, W = West.
Forests 16 01506 g003
Figure 4. Annual incremental growth compared among all 3 treatment groups (i.e., A = clustered plantation, B = evenly spaced plantation, NRG = natural regeneration) in the low-elevation region: (A) basal area increment (BAI) before thinning and (B) annual height growth before thinning. Different lowercase letters represent a statistical difference to the 0.05 significance level between treatments. Error bars represent ±1 standard error. Plantation stands had higher BAI and annual height growth compared to stands of natural origin.
Forests 16 01506 g004
Figure 5. Mean total height (A) and DBH (diameter at breast height) (B) across all 3 treatments groups (i.e., A = clustered plantation, B = evenly spaced plantation, NRG = natural regeneration) in the low elevation region. Different lowercase letters represent a statistical difference to the 0.05 significance level between treatments. Error bars represent ±1 standard error. Plantation stands had higher total height and DBH compared to stands of natural origin.
Forests 16 01506 g005
Figure 6. Regeneration per hectare (A) and trees per hectare (TPH) after thinning (B) compared between all 3 treatments groups (i.e., A = clustered plantation, B = evenly spaced plantation, NRG = natural regeneration) in the low elevation region. Same lowercase letters represent no statistical difference to the 0.05 significance level between treatments. Error bars represent ±1 standard error. Natural-origin stands had higher density metrics compared to their plantation counterparts.
Forests 16 01506 g006
Figure 7. BAI thinning index ([BAI after thinning − BAI before thinning]/BAI before thinning) compared between planting arrangements among plantations that were thinned. Error bars represent ±1 back-transformed standard error. There was a slight trend of the BAI index differing between planting arrangements (p = 0.061).
Forests 16 01506 g007
Table 1. Characteristics of sampled stands for (a) low-elevation region and (b) high-elevation region. Slope, elevation, and aspect are averaged across plots per stand.
StandIDPlantation ArrangementThinned# of PlotsSlope (Degrees)Elevation (m)Aspect
(a) Low-Elevation Region
A102Clustered (A)Yes519.41416.6255.6
A137Clustered (A)Yes526.61427.4121.0
A78Clustered (A)Yes512.41555.090.2
B139Evenly Spaced (B)Yes529.21358.4106.0
B140Evenly Spaced (B)Yes528.61355.9157.0
B82Evenly Spaced (B)Yes5151434.8134.6
NRG147Natural Regeneration (NRG)NA714.71460.6114.6
NRG164Natural Regeneration (NRG)NA86.91525.371.9
(b) High-Elevation Region
A217Clustered (A)No513.21961.4122.2
A25Clustered (A)No59.41984.8200.2
B13Evenly Spaced (B)No510.41970.9126.4
B24Evenly Spaced (B)No510.01939.6182.4
NRG17Natural Regeneration (NRG)NA515.62011.4121.6
NRG302Natural Regeneration (NRG)NA515.01794.9200.4
Table 2. Species composition of sampled stands in trees per hectare for (a) low-elevation region and (b) high-elevation region.
StandIDPlantation ArrangementThinnedABCOABMACADEPIJEPIPOPILAPSMEHardwoodsTotal
(a) Low Elevational Region
A102Clustered (A)Yes006002200070350
A137Clustered (A)Yes00100290100390700
A78Clustered (A)Yes00200260000280
B139Evenly Spaced (B)Yes00600360070190680
B140Evenly Spaced (B)Yes003003700040440
B82Evenly Spaced (B)Yes004002900050380
NRG147Natural Regeneration (NRG)No708210155014072399
NRG164Natural Regeneration (NRG)No560519013445613132001
(b) High Elevation Region
A217Clustered (A)No101200112005001701470
A25Clustered (A)No200504800000550
B13Evenly Spaced (B)No03060145000001540
B24Evenly Spaced (B)No0700110101000200
NRG17Natural Regeneration (NRG)No1010103060000120
NRG302Natural Regeneration (NRG)No003020250100240550
Note: ABCO = Abies concolor, ABMA = Abies magnifica, CADE = Calocedrus decurrens, PIJE = Pinus jeffreyi, PIPO = Pinus ponderosa, PILA = Pinus lambertiana, PSME = Pseudotusga menziesii.
Table 3. Results from one-way ANOVA among the 3 overall treatment categories (TRT) for (a) low-elevation region and (b) high-elevation region.
VariablepTRTpstand
(a) Low-Elevation Region
Regen/ha0.0033 **<0.0001
Shrub %0.0507 *<0.0001
Shannon’s diversity index0.4873<0.0001
Species richness0.2443<0.0001
Shrub height0.0877 *<0.0001
DBH0.0020 **<0.0001
Total height0.0008 **<0.0001
TPH before thinning0.8268<0.0001
TPH after thinning0.0054 **<0.0001
BAI before thinning (2013–2014)0.0039 **<0.0001
Annual height growth before thinning0.0009 **<0.0001
(b) High-Elevation Region
Regen/ha0.5735<0.0001
Shrub %0.9286<0.0001
Shannon’s diversity index0.8787<0.0001
Species richness0.8770<0.0001
Shrub height0.5111<0.0001
DBH0.2926<0.0001
Total height0.5332<0.0001
Note: * indicates significance at 0.1 level, ** indicates significance at 0.05 level for TRT. Regen/Hec = trees below 1.37 m per hectare; TPH = trees per hectare; BAI = basal area increment. The full version of this table, containing data transformations and F-statistics, is available in Table S1 (Supplementary Materials).
Table 4. Results from one-way ANOVA of just-thinned plantations, comparing planting arrangements. * indicates significance at 0.1 level, for fixed effects. Note: The full version of this table, containing data transformations and F-statistics, is available in Table S2 (Supplementary Materials).
VariableTypepplantpstandpplot
BAI 2016Increment0.88920.42510.0020
BAI thinning indexIndex0.0610 *0.80630.00001
Annual height growth after 2016Increment0.48330.29120.0473
Annual height indexIndex0.77590.3866<0.0001
Table 5. Final selection for linear regression models predicting growth in mixed conifer plantations and naturally regenerating stands.
Dependent Variable Explanatory Variable with CoefficientsAdj R2
(a) Low-Elevation Region
BAI 2013–20161119.421 + (−902.9819 * TrtNRG)0.6616
BAI before thinning1126.333 + (−889.7403 * TrtNRG)0.5446
BAI after thinning1980.265 + (−1680.2667 * TrtNRG)0.7024
Height growth 2013–20160.3482 + (0.1482 * ShrubHeight) + (−0.1410 * TrtNRG)0.6423
Height growth before thinning0.3270 + (0.0008 * Aspect) + (−0.1745 * TrtNRG)0.6390
Height growth after thinning0.4719 + (−0.1692 * TrtNRG)0.5258
(b) High-Elevation Region
BAI 2013–2016−494.487 + (−6.359 * ShrubPercent) + (661.0129 * ShrubHeight) + (−13.5391 * SS.ABCO) + (−5.309 * SS.CADE) + (7.2601 * SS.YP) + (28.9281 * SS.FIR) + (381.0244 * FreqYP)0.7982
Height growth 2013–20160.044 + (−0.0057 * SS.ABCO) + (−0.0017 * SS.CADE) + (0.0093 * SS.FIR) + (0.2591 * FreqYP)0.7367
Note: FreqYP = frequency of yellow pines, TrtNRG = dummy variable for naturally regenerating stands, SS.ABCO = distance to nearest white fir seed source, SS.CADE = distance to nearest incense cedar seed source, SS.FIR = distance to nearest seed source average of both white fir and red fir, SS.YP = distance to nearest seed source average of both ponderosa pine and Jeffrey pine.
Table 6. Final selection for linear regression models predicting growth only for plantations.
Dependent Variable Explanatory Variable with CoefficientsAdj R2
(a) Low-Elevation Region
BAI 2013–2016−3926.578 + (−9.7259 * ShrubPercent) + (−221.2146 * Rich) + (−0.3151 * PreTPH)0.3974
BAI before thinning3494.755 + (−12.4837 * ShrubPercent) + (−255.1546 * Rich) + (−0.3607 * PreTPH) + (1054.5197 * FreqYP)0.4227
BAI after thinning6881.3828 + (−18.3104 * ShrubPercent) + (−346.6670 * Rich) + (−0.5414 * PreTPH)0.3560
Height growth 2013–20160.607 + (0.000013 * RegenCount)0.0100
Height growth before thinning0.602 + (0.000015 * RegenCount)0.1102
Height growth after thinning0.727 + (−0.000047 * PreTPH)0.1711
(b) High-Elevation Region
BAI 2013–2016−616.677 + (−4.9004 * ShrubPercent) + (554.8441 * ShrubHeight) + (9.9389 * SS.PIJE) + (−4.3142 * SS.PILA) + (−17.0197 * SS.ABCO) + (8.8627 * SS.ABMA) + (17.7243 * SS.FIR) + (836.492 * FreqYP)0.9497
Height growth 2013–2016−0.046 + (0.0014 * SS.PIJE) + (−0.0022 * SS.ABCO) + (0.0050 * SS.ABMA) + (0.4129 * FreqYP)0.8473
Note: FreqYP = frequency of yellow pines, PreTPH = trees per hectare before thinning, RegenCount = density of regeneration (trees under 1.37 m), Rich = species richness, SS.ABCO = distance to nearest white fir seed source, SS.ABMA = distance to nearest red fir seed source, SS.PIJE = distance to nearest Jeffrey pine seed source, SS.PILA = distance to nearest sugar pine seed source, SS.FIR = distance to nearest seed source—average of both white fir and red fir.
Disclaimer/Publisher’s Note: The statements, opinions and data contained in all publications are solely those of the individual author(s) and contributor(s) and not of MDPI and/or the editor(s). MDPI and/or the editor(s) disclaim responsibility for any injury to people or property resulting from any ideas, methods, instructions or products referred to in the content.