Article

The Effects of Nitrogen Deposition and Rainfall Enhancement on Intraspecific and Interspecific Competitive Patterns in Deciduous Broad-Leaved Forests

1
College of Mathematics and Statistics, Xinyang Normal University, Xinyang 464000, China
2
Henan Dabieshan National Field Observation & Research Station of Forest Ecosystem, Zhengzhou 450046, China
3
Xinyang Academy of Ecological Research, Xinyang 464000, China
4
College of Information Engineering, Xinyang University of Agriculture and Forestry, Xinyang 464000, China
5
Research Institute of Forest Resource Information Techniques, Chinese Academy of Forestry, Beijing 100091, China
6
Jigongshan National Nature Reserve, Xinyang 464039, China
*
Authors to whom correspondence should be addressed.
Forests 2025, 16(10), 1505; https://doi.org/10.3390/f16101505
Submission received: 21 August 2025 / Revised: 21 September 2025 / Accepted: 22 September 2025 / Published: 23 September 2025
(This article belongs to the Section Forest Ecology and Management)

Abstract

Amid accelerating global nitrogen deposition, China has emerged as the world’s third-largest hotspot after Western Europe and North America. Disentangling how elevated N inputs interact with intensifying precipitation and silvicultural practices is therefore essential for forecasting forest responses to ongoing climate change. Taking advantage of the “canopy-simulated nitrogen deposition” platform in Jigongshan National Nature Reserve, we compared tree-level census data from 2012 and 2022 to quantify decadal shifts in neighborhood competition under seven nitrogen addition and rainfall enhancement regimes. After using ordered-sample clustering to identify eight competitors as the optimal neighborhood size, we applied the Hegyi family of competitive indices (CI, CI1, CI2, mCI, mCI1 and mCI2) to analyze competitive responses at three hierarchical levels: the entire stand, all surviving trees and three dominant species (Quercus acutissima, Quercus variabilis, and Liquidambar formosana). The results indicate: (1) Nitrogen addition and rainfall enhancement did not alter the dominant tree species of the stand, which remained primarily Q. acutissima, Q. variabilis, and L. formosana. (2) The competition indices based on all trees showed an upward trend, whereas those calculated for surviving trees and for dominant species declined markedly (surviving trees p < 0.1, L. formosana CI1 p < 0.05). (3) Although nitrogen addition treatments did not alter overall stand competition intensity, it relieved competitive pressure on surviving trees by suppressing interspecific interactions (CI2 and mCI2); intraspecific competition also weakened, but at a slower rate. (4) Interspecific competition intensity for surviving L. formosana decreased significantly, whereas competition indices for Q. acutissima and Q. variabilis remained statistically unchanged. (5) Nitrogen addition methods (canopy vs. understory) had no significant effect on competition indices, while nitrogen addition intensity exhibited a dose-dependent effect: high nitrogen addition significantly reduced interspecific competition intensity more than low nitrogen addition (p < 0.05). In summary, nitrogen deposition primarily regulates interspecific competition through concentration rather than pathway, providing scientific basis for adaptive management of broad-leaved mixed forests in transitional zones under sustained nitrogen deposition scenarios.

1. Introduction

Rapid socio-economic development in China has driven a steep increase in both nitrogen-fertilizer production and fossil-fuel consumption. Consequently, China now ranks as the third global hotspot of atmospheric nitrogen deposition, after Western Europe and North America [1,2]. Increased nitrogen deposition can have profound impacts on forest ecosystems, including soil acidification, nutrient imbalance, and loss of biodiversity [3,4]. In addition to environmental drivers, stand characteristics also play a crucial role in forest growth, including tree species composition, stand density, age, and competition. For example, due to tree competition, when the density of a particular tree species exceeds a certain threshold on a specific site, forest growth often stabilizes [5]. Therefore, it is important to accurately assess the complex interactions between environmental drivers such as nitrogen deposition and enhanced precipitation and the complex interactions between these drivers and forest management is crucial for understanding their impact on forest growth [6,7].
In nitrogen-limited environments, nitrogen addition can effectively alleviate intense nutrient competition, enabling smaller trees to grow more effectively than larger ones [8,9]. This change helps to make individual trees in the stand more uniform in size. However, in environmentally nitrogen-enriched areas, nitrogen addition may instead lead to shortages of other elements such as phosphorus, which more significantly limits the growth of smaller trees [9,10], thereby increasing size differences among trees within the stand.
Climatic conditions are key drivers of forest ecosystems, with temperature and precipitation regimes directly influencing water availability and suitability [9]. Alterations in water supply can affect the prevalence and distribution of certain tree species, leading to shifts in forest composition over time [3,11]. Moreover, increased rainfall can influence the carbon sequestration capacity of forests. However, tree survival in forest ecosystems is governed by the complex interplay of multiple factors. A comprehensive understanding of how climate and atmospheric changes interactively alter ecosystem processes remains lacking, particularly regarding the effects of increased precipitation and nitrogen deposition. Notably, most experiments have been conducted in the understory, neglecting the forest canopy pathway [11].
The impact of nitrogen deposition on forest stand structure and competition is a complex and multifaceted process. As an external nitrogen fertilizer input, nitrogen deposition directly alters the nutrient limitations and chemical characteristics of forest plant organs [11,12,13,14,15], which in turn triggers changes in the growth status of trees of different sizes [8,16,17]. These changes further influence species composition and diversity within the stand, thereby regulating the competitive patterns among trees in the stand.
In forest communities, competition is one of the core ecological processes driving individual growth, population dynamics, and community succession [18,19]. Based on the objects involved, competition can be divided into intraspecific and interspecific competition: the former regulates the redistribution of limited resources among individuals of the same species, while the latter determines the ecological niche differentiation and coexistence patterns among different species [20,21]. Whether it is light, water, or mineral nutrients, trees inevitably face competitive pressure from neighboring individuals during resource acquisition, and the magnitude of this pressure is typically quantified using a competition index. Competition indices not only describe the quantitative relationship between the growth space of individual trees and their environmental resource requirements but also reveal the relative disadvantages or advantages of trees under specific resource gradients [22,23]. As forest grows old, environmental changes occur, and human management measures are implemented, competitive patterns undergo dynamic adjustments [24].
Currently, research has primarily focused on the impact of nitrogen deposition on tree growth [25,26,27,28], neglecting resource competition among different tree species or individuals, particularly the spatio-temporal changes in intra- and inter-specific competition. Nitrogen inputs are rising across the globe. Foresters must decide how to manipulate stand competition in this new chemical climate. Regulating neighborhood interactions is now viewed as a prerequisite for sustaining community composition and delivering multiple ecosystem services. Resolving this issue has become a central task for both forest management and restoration ecology [29,30]. Based on this, this study takes transitional deciduous broadleaf mixed forests as the research object and utilizes 10 years of interval survey data from the “Canopy-Simulated Nitrogen Deposition” large-scale experimental platform in the Jigongshan National Nature Reserve, Xinyang City, Henan Province. Our aim is to quantify how competition indices shift with nitrogen addition concentrations and application methods. The results offer theoretical insight and practical guidance for adaptive forest management under persistent nitrogen deposition. Our hypotheses are: (1) Whether nitrogen addition and increased rainfall alter the competition intensity within the stand and among surviving trees; (2) Whether the effects of nitrogen addition methods (canopy vs. understory) on stand competition intensity are consistent; (3) Whether the effects of nitrogen addition intensity on stand competition intensity are consistent.

2. Materials and Methods

2.1. Study Site

The study area is located within the Jigongshan National Nature Reserve in Henan Province (31°46′–31°52′ N, 114°01′–114°06′ E), situated in a transitional climate zone between subtropical and warm temperate zones. The annual average precipitation is 1120 mm, and the annual average temperature is 15.2 °C. The study plots are situated at elevations ranging from 300 to 800 m, with slopes typically between 15° and 25°. The soil is yellowish-brown sandy loam, with a pH value of approximately 5 to 6. The dominant forest type is broad-leaved deciduous mixed forest, with primary tree species including Quercus acutissima Carruth., Quercus variabilis Bl., Quercus aliena Blume, Liquidambar formosana Hance, Acer buergerianum Miq., and Celtis sinensis Pers. [1,30].

2.2. Experiment Design

The experimental plots for the “Canopy Simulation of Nitrogen Deposition” experimental platform were completed in 2012, using a randomized block design. A total of 4 blocks (i.e., 4 replicates) were established, with 7 nitrogen addition treatments randomly assigned within each block (Table 1). According to local meteorological records at Jigongshan, bulk N deposition is 19.7 kg N ha−1 yr−1; adding unmeasured dry deposition raises the total to an estimated 20–25 kg N ha−1 yr−1. The 25 kg N ha−1 yr−1 treatment therefore represents an approximate doubling of ambient inputs. Figure 1 shows the plot layout diagram, illustrating the distribution of blocks and plots. There are 28 fixed plots, each of which is circular with an area of approximately 907 m2. Nitrogen addition occurs during the growing season (April to October) each year. CAN25, CAN50, UAN25, UAN50, and CNW receive nitrogen addition once per month, while CW and CNW receive artificial rainfall 16 times per month [30,31].
Following the establishment of the platform, a baseline survey of trees with a diameter at breast height (DBH) of 1 cm or more within the plots was immediately conducted, with plot information remeasured in 2022. Measurement parameters included tree DBH, height, crown spread, relative position, and species.

2.3. Research Methods

2.3.1. Determination of Dominant Tree Species

The number of dominant tree species is determined using the dominance analysis method, which involves calculating the proportion of basal area (dominance) of each tree species in the sample plot and ranking them in descending order. The n value is then calculated for each species using the Formula (1) [32]. The number of tree species with the highest dominance corresponding to the smallest n value is defined as the number of dominant tree species [32,33]. Finally, the dominance values are sorted from highest to lowest, and the top n tree species are selected as the dominant tree species for the sample plot.
n = 1 N i S u x i x 2 + j S l x j 2
where N is the total number of tree species in the plot, Su is the set of dominant species, Sl is the set of tree species with lower dominance (remaining species), xi is the dominance of the dominant species, x is the recommended dominance of the dominant tree species, and xj is the dominance of the remaining species. The rule for determining the recommended dominance is as follows: if the number of dominant tree species in the plot is considered to be n, then the recommended dominance is set to 1 / n , n = 1 , 2 , , N .

2.3.2. Competition Index

Trees with DBH ≥ 3 cm were selected for the calculation of the competition index. Additionally, competing trees at the edge of the plot may be located outside the boundary, so this study treated the area within 2 m of the plot boundary as a buffer zone, where trees were only considered as competing trees for the calculation, while trees in the remaining area were considered both as competing trees and as target trees for the calculation.
This study adopts the most widely used Hegyi competition index [34], calculated as follows:
CI i = j = 1 k D j D i 1 d ij
CI = i = 1 n CI i
mCI = 1 n CI
where CIi denotes the competition index of the ith target tree, CI denotes the total competition index of the plot or tree species, mCI denotes the average competition index of the plot or tree species, Dj denotes the DBH of the jth competing tree, Di denotes the DBH of the ith target tree, dij denotes the distance between the ith target tree and the jth competing tree, k denotes the number of competing trees, and n denotes the number of trees in the plot or tree species.
The competition index (CI) is divided into intraspecific competition index (CI1) and interspecific competition index (CI2), defined as the competition index calculated by considering competition trees of the same and different species as the target tree, respectively. The average intraspecific competition index (mCI1) and average interspecific competition index (mCI2) are the averages of CI1 and CI2, respectively. Higher competition index values indicate more intense competition.

2.3.3. Selection of Competitor Trees

To calculate the competition index, it is necessary to determine the number of competitor trees or the competition range of the target tree. Some scholars suggest that the number of competing trees should be set to 4 [35], while other studies have differing opinions [36,37,38]. This study employs the ordered sample clustering analysis method to determine the number of competing trees, i.e., sequentially selecting the k nearest adjacent trees to the target tree as competing trees, and calculating the CI, CI1, CI2, mCI, mCI1, and mCI2 values for the study plot. Using these competitive indices as classification samples, the ordered sample clustering analysis method was used to divide them into two categories, and the optimal number of competitive neighbors was determined based on the consistency of the classification results. The ordered sample clustering algorithm uses the optimal partitioning method (or Fisher method) for classification, with the recursive formula being [33,39]:
L π 2 , k = min 2 j k L π 1 , j 1 + S j , k
where L denotes the classification loss function, π denotes a specific classification scheme, k denotes the number of competitive trees, and here k = 3 , 4 , , 12 , S denotes the sum of squared deviations for a certain class of samples.

2.3.4. One-Way Analysis of Variance

This study employed one-way analysis of variance to investigate the significance of forest stand competition indices in response to nitrogen deposition. Six competition indices were selected for data analysis: three total competition indices (CI, CI1, CI2) and three average competition indices (mCI, mCI1, mCI2). The study focused on competition indices from 2012 and 2022, as well as the magnitude of changes in competition indices between the two periods. Nitrogen deposition factors were considered in three types: (1) seven nitrogen addition treatments, namely CK, CAN25, CAN50, CNW, CW, UAN25, and UAN50; (2) three nitrogen addition methods, namely CK, CAN (combining CAN25 and CAN50), and UAN (combining UAN25 and UAN50); (3) Three nitrogen addition intensity: CK, AN25 (combining CAN25 and UAN25), and AN50 (combining CAN50 and UAN50).

3. Results and Analysis

3.1. Dynamic Changes in Dominant Tree Species

Using Formula (1), it was calculated that the dominant tree species in the study plots in 2012 and 2022 were all Q. acutissima, Q. variabilis, and L. formosana. The cumulative basal area of these three species accounted for 83.97% and 84.32% of the total basal area, respectively, while their cumulative number of individuals accounted for only 31.88% and 26.50%, respectively (Table 2). It can be seen that the proportion of dominant tree species in terms of number of trees is low, while their proportion in terms of basal area is high. This is because the individual trunk diameters of dominant tree species are generally large, especially for Q. acutissima and Q. variabilis. The proportion of basal area for Q. acutissima, Q. variabilis, and Q. aliena has slightly decreased, primarily due to a decline in the number of trees caused by mortality, with no replacement from regeneration. In contrast, the proportion of basal area for L. formosana, A. buergerianum, and C. sinensis has increased, directly attributed to the increase in the number of trees due to regeneration.

3.2. Determination of Competitive Trees

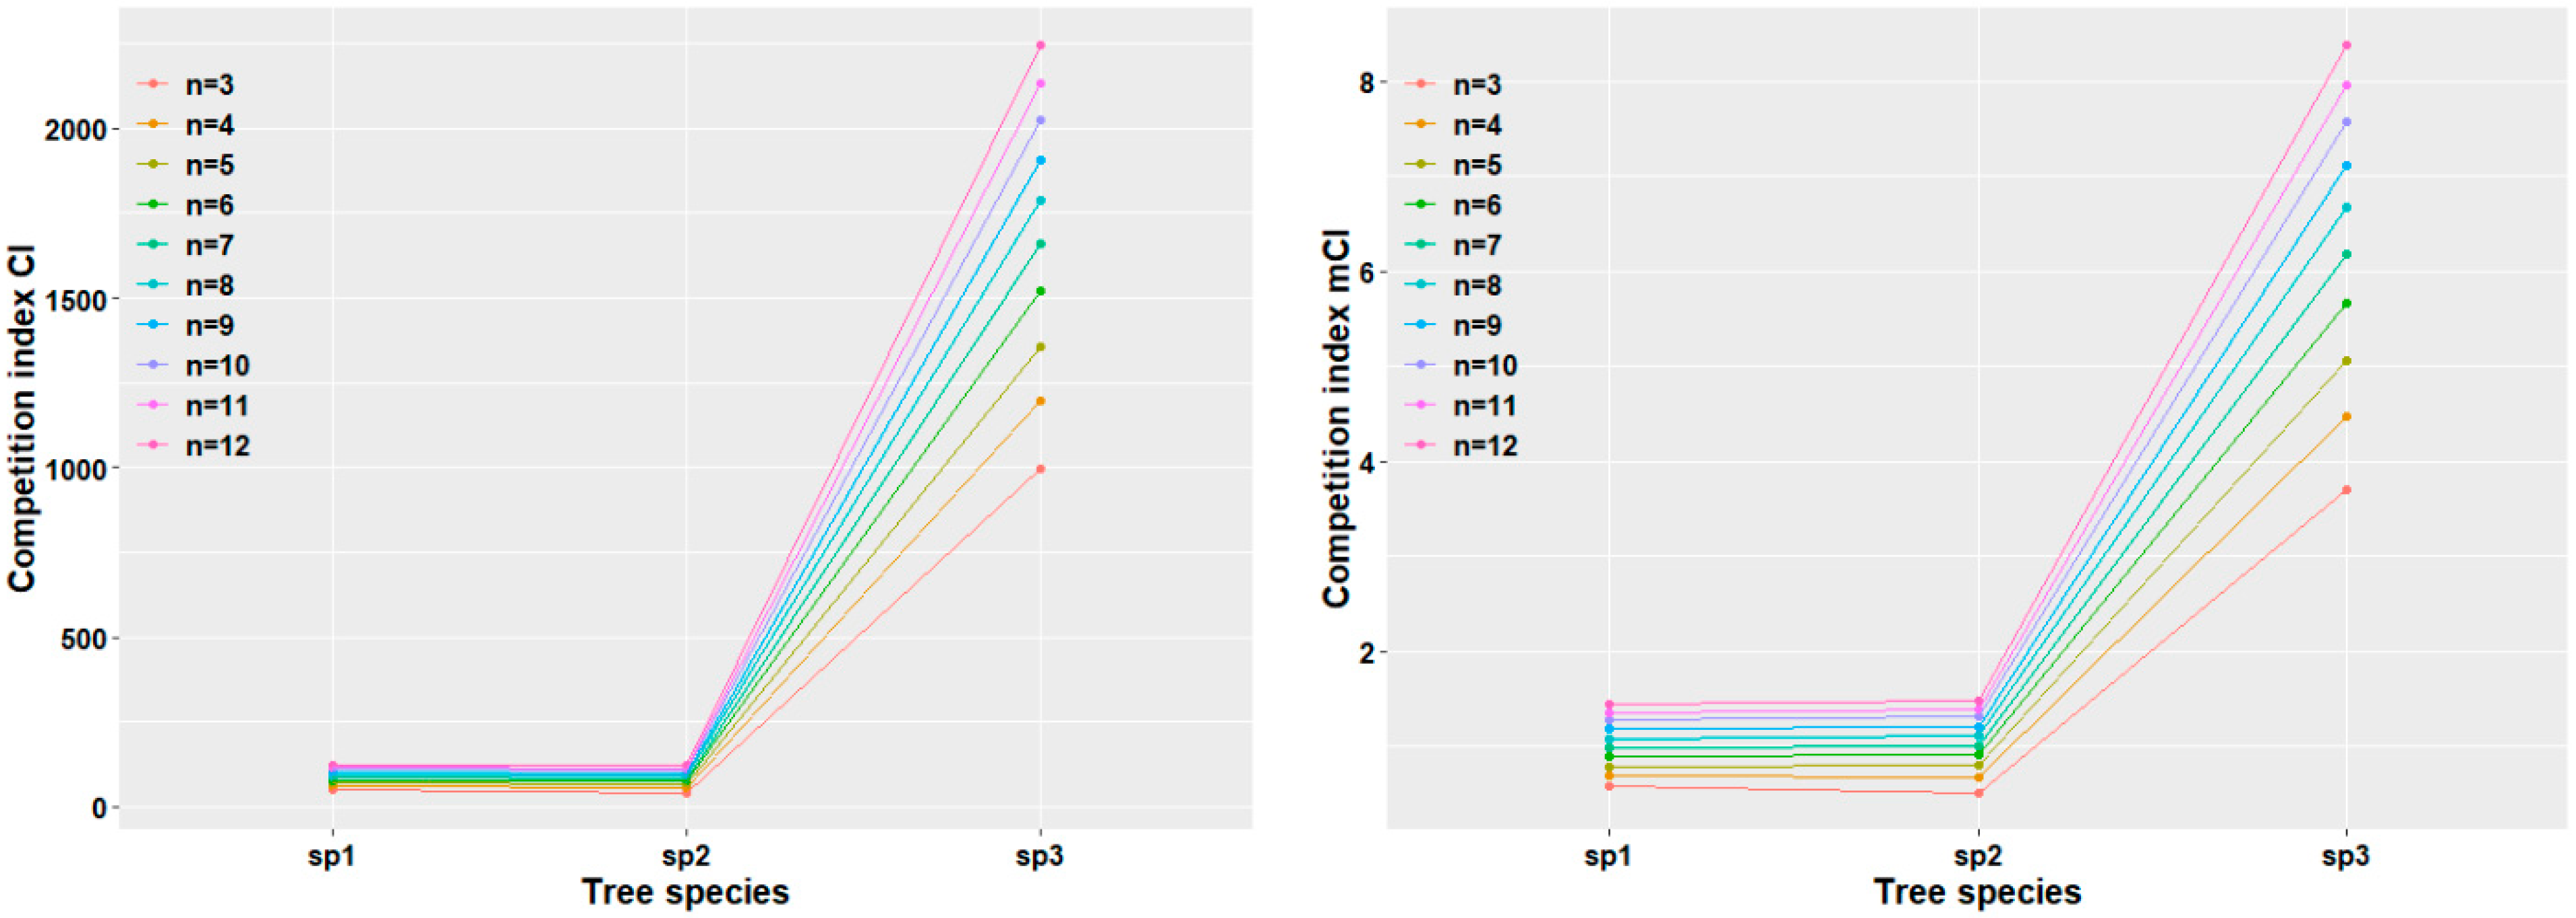
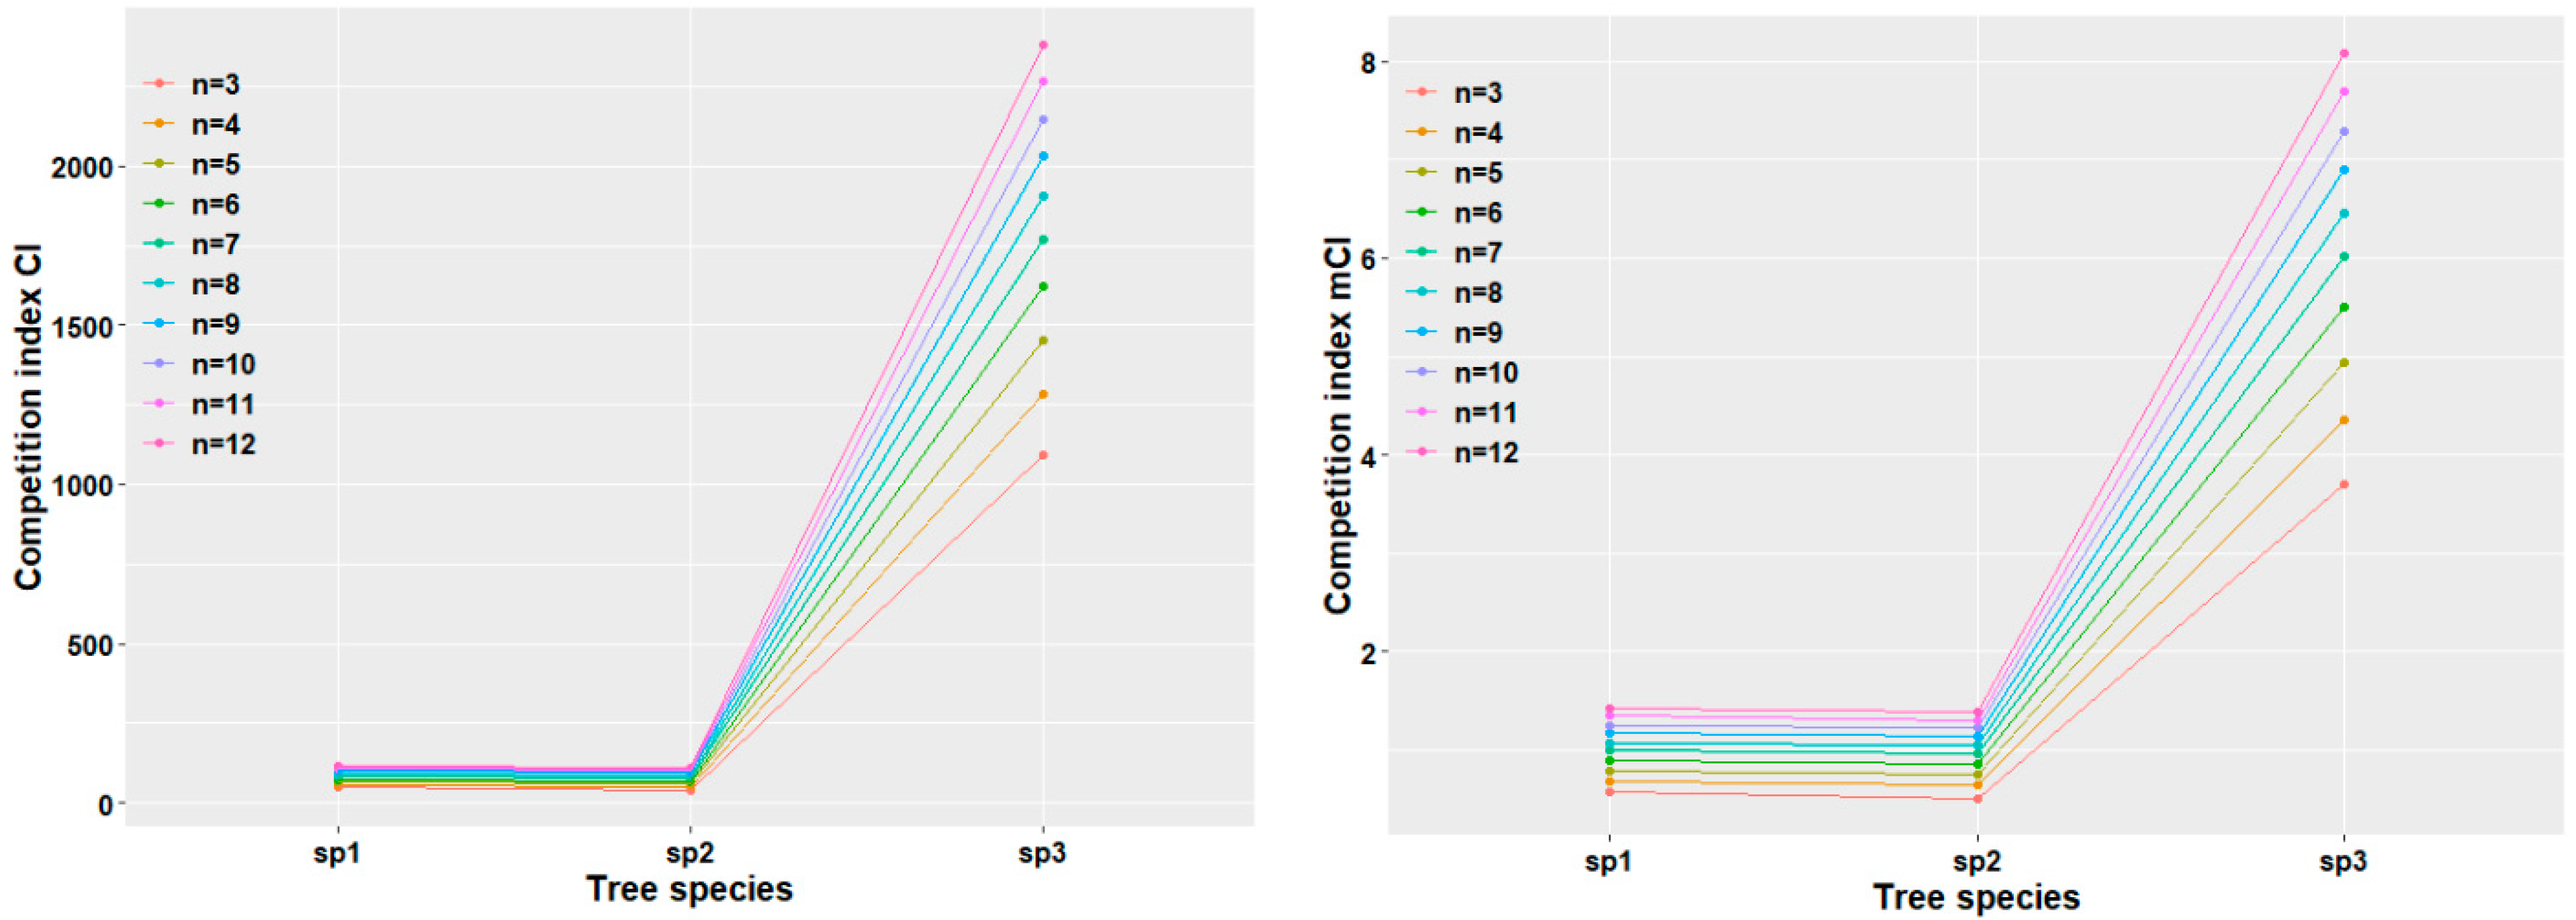
Figure 2 shows the competitive indices CI and mCI of the dominant tree species in the study plots in 2012 and 2022: Q. acutissima (sp1), Q. variabilis (sp2), and L. formosana (sp3). Using ordered sample clustering analysis to classify the competitive indices, the classification results for 2012 were consistent: [3,4,5,6,7] and [8,9,10,11,12], with the optimal cutoff points being 7 and 8. The classification results for 2022 were consistent: [3,4,5,6] and [7,8,9,10,11,12], indicating that the optimal cutoff points were 6 and 7. Since the competition index values become more stable as the number of competing trees increases, this study determined that the optimal number of competing neighbors for the target tree is 8.
Additionally, the three dominant tree species in the plot all showed a trend of increasing CI and mCI indices as the number of competing trees increased, with the rate of increase gradually slowing down (Figure 2). In terms of the magnitude of changes in the competition index caused by the number of competing trees, the competition index for L. formosana was significantly greater than that for Q. acutissima and Q. variabilis, i.e., CI and mCI values: L. formosana > Q. acutissimaQ. variabilis. Compared to 2012, the competition indices CI and mCI of dominant tree species in the study area in 2022 showed the following changes: the competition indices CI and mCI of Q. acutissima and Q. variabilis both decreased, but the decrease was not significant, possibly due to their natural mortality and lack of regeneration, which alleviated the external competitive environment. The CI of L. formosana is increasing, but the mCI is decreasing, possibly due to their own regeneration in forest gaps.

3.3. Effects of Nitrogen Deposition and Rain Enhancement on Stand Competition

3.3.1. Response of Stand Competition Intensity

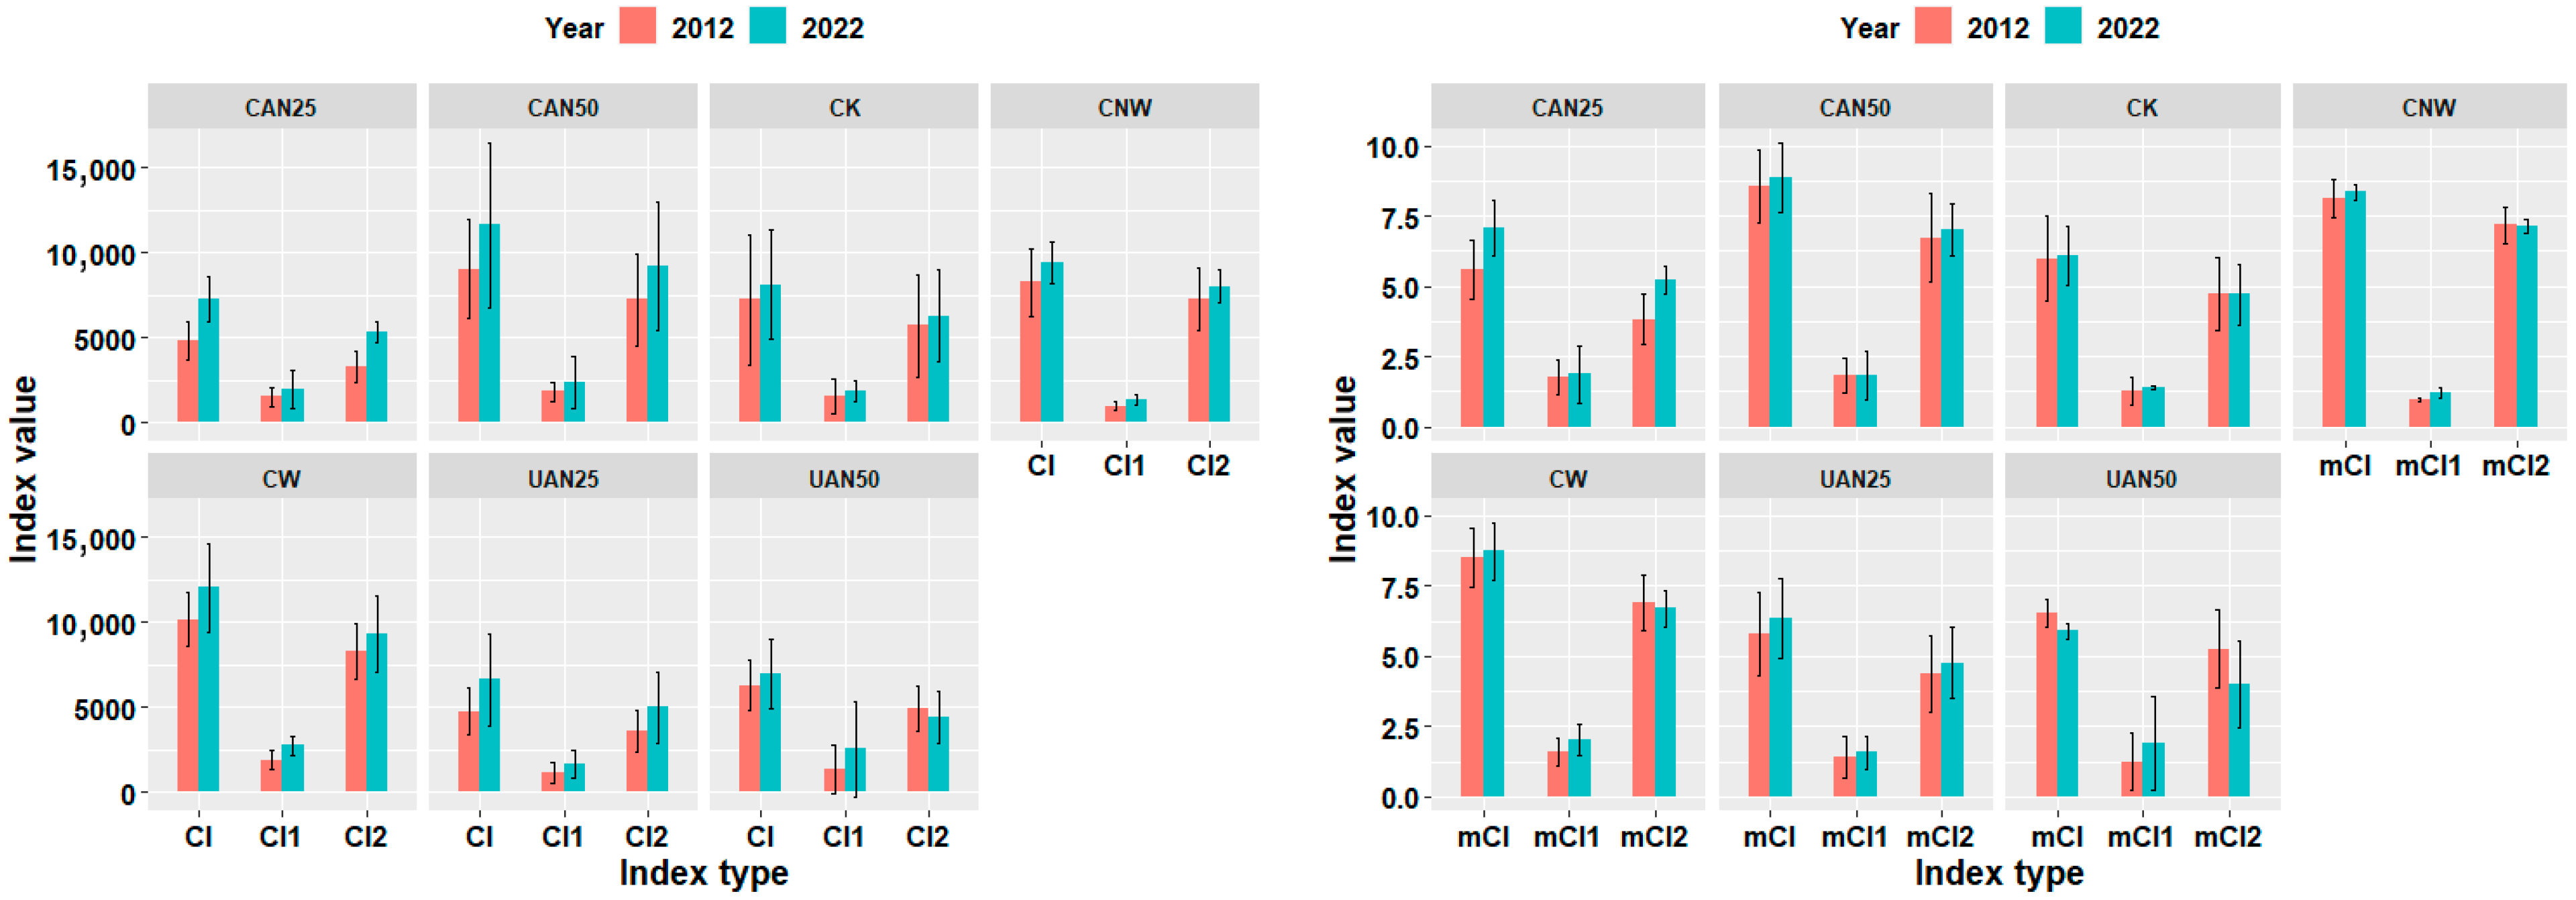
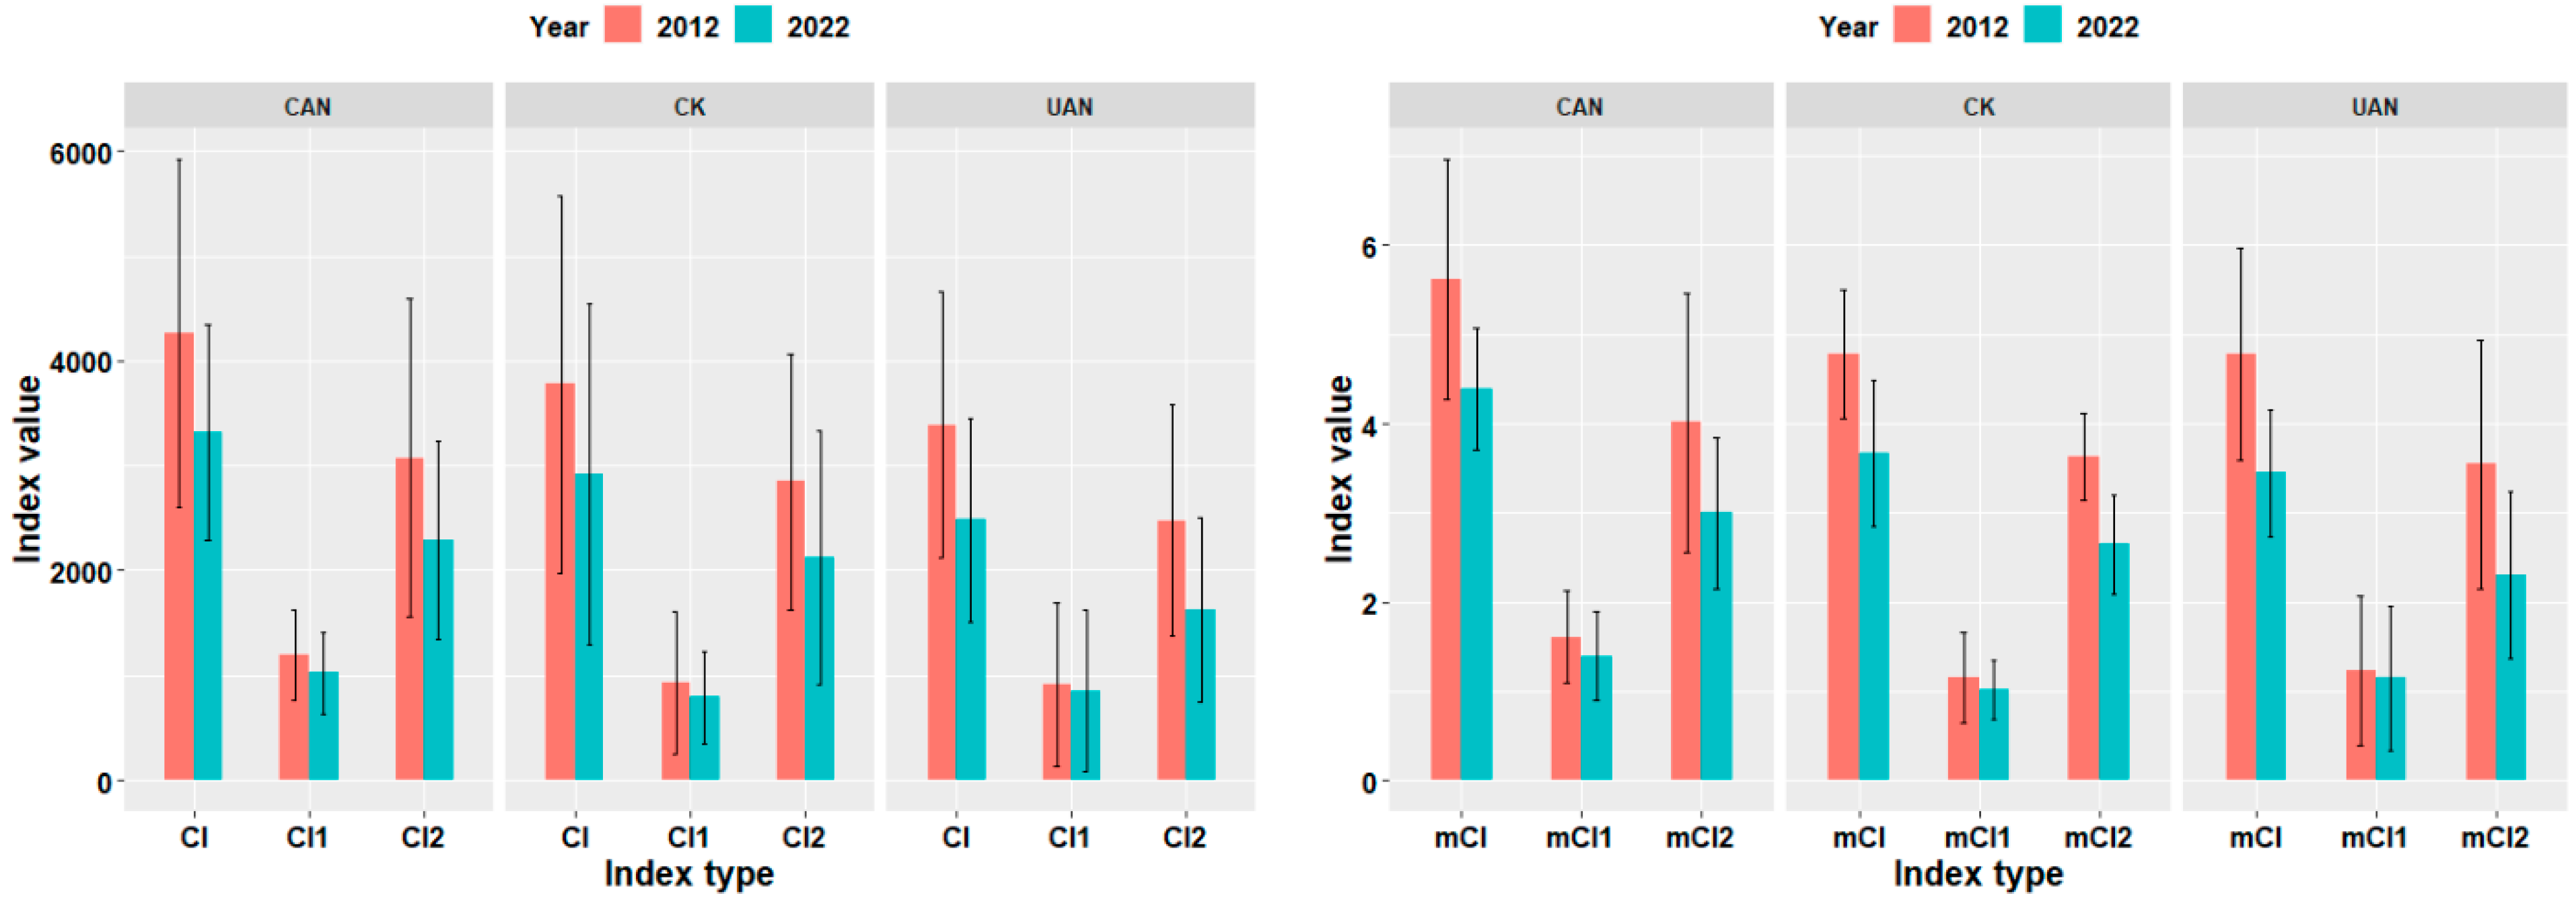
Stand-level means ± SD (error bars) are displayed for 2012 and 2022 (Figure 3). The three total competition indices (CI, CI1, and CI2) and the three average competition indices (mCI, mCI1, and mCI2) at the stand level are shown across all seven nitrogen addition treatments on the canopy simulation nitrogen deposition platform (CAN25, CAN50, CK, CNW, CW, UAN25, and UAN50).The competition indices CI, CI1, and CI2 increased across all seven nitrogen addition treatments at the stand level in both 2012 and 2022, especially in the CAN25 and UAN25 plots (Figure 3). CI increased by 50.83%, 28.59%, 11.88%, 13.98%, 18.37%, 39.57%, and 10.58%; CI1 by 28.49%, 30.93%, 19.87%, 39.90%, 43.68%, 43.02%, and 89.16%; and CI2 by 61.00%, 28.00%, 9.74%, 10.52%, 12.52%, 38.45%, and −10.73%. Changes in the competition indices (CI, CI1, and CI2) were generally consistent across the seven nitrogen addition treatments except for the UAN50 plots. In these plots, the intraspecific competition intensity increased while the interspecific competition intensity decreased. Changes in the average competition indices, mCI, mCI1, and mCI2, followed a pattern consistent with that of the total competition indices.
The response results for the three total competition indices (CI, CI1, and CI2) and the three average competition indices (mCI, mCI1, and mCI2) at the stand level are shown in Table 3. In 2022, CI and CI2, as well as mCI and mCI2, showed significant responses at the 0.05 level, while the interannual variations in all competition indices were not significant. Nitrogen addition treatments did not significantly affect the interannual changes in total and average competition intensity at the plot level.

3.3.2. Response of Surviving Trees in Plot Level to Competition Intensity

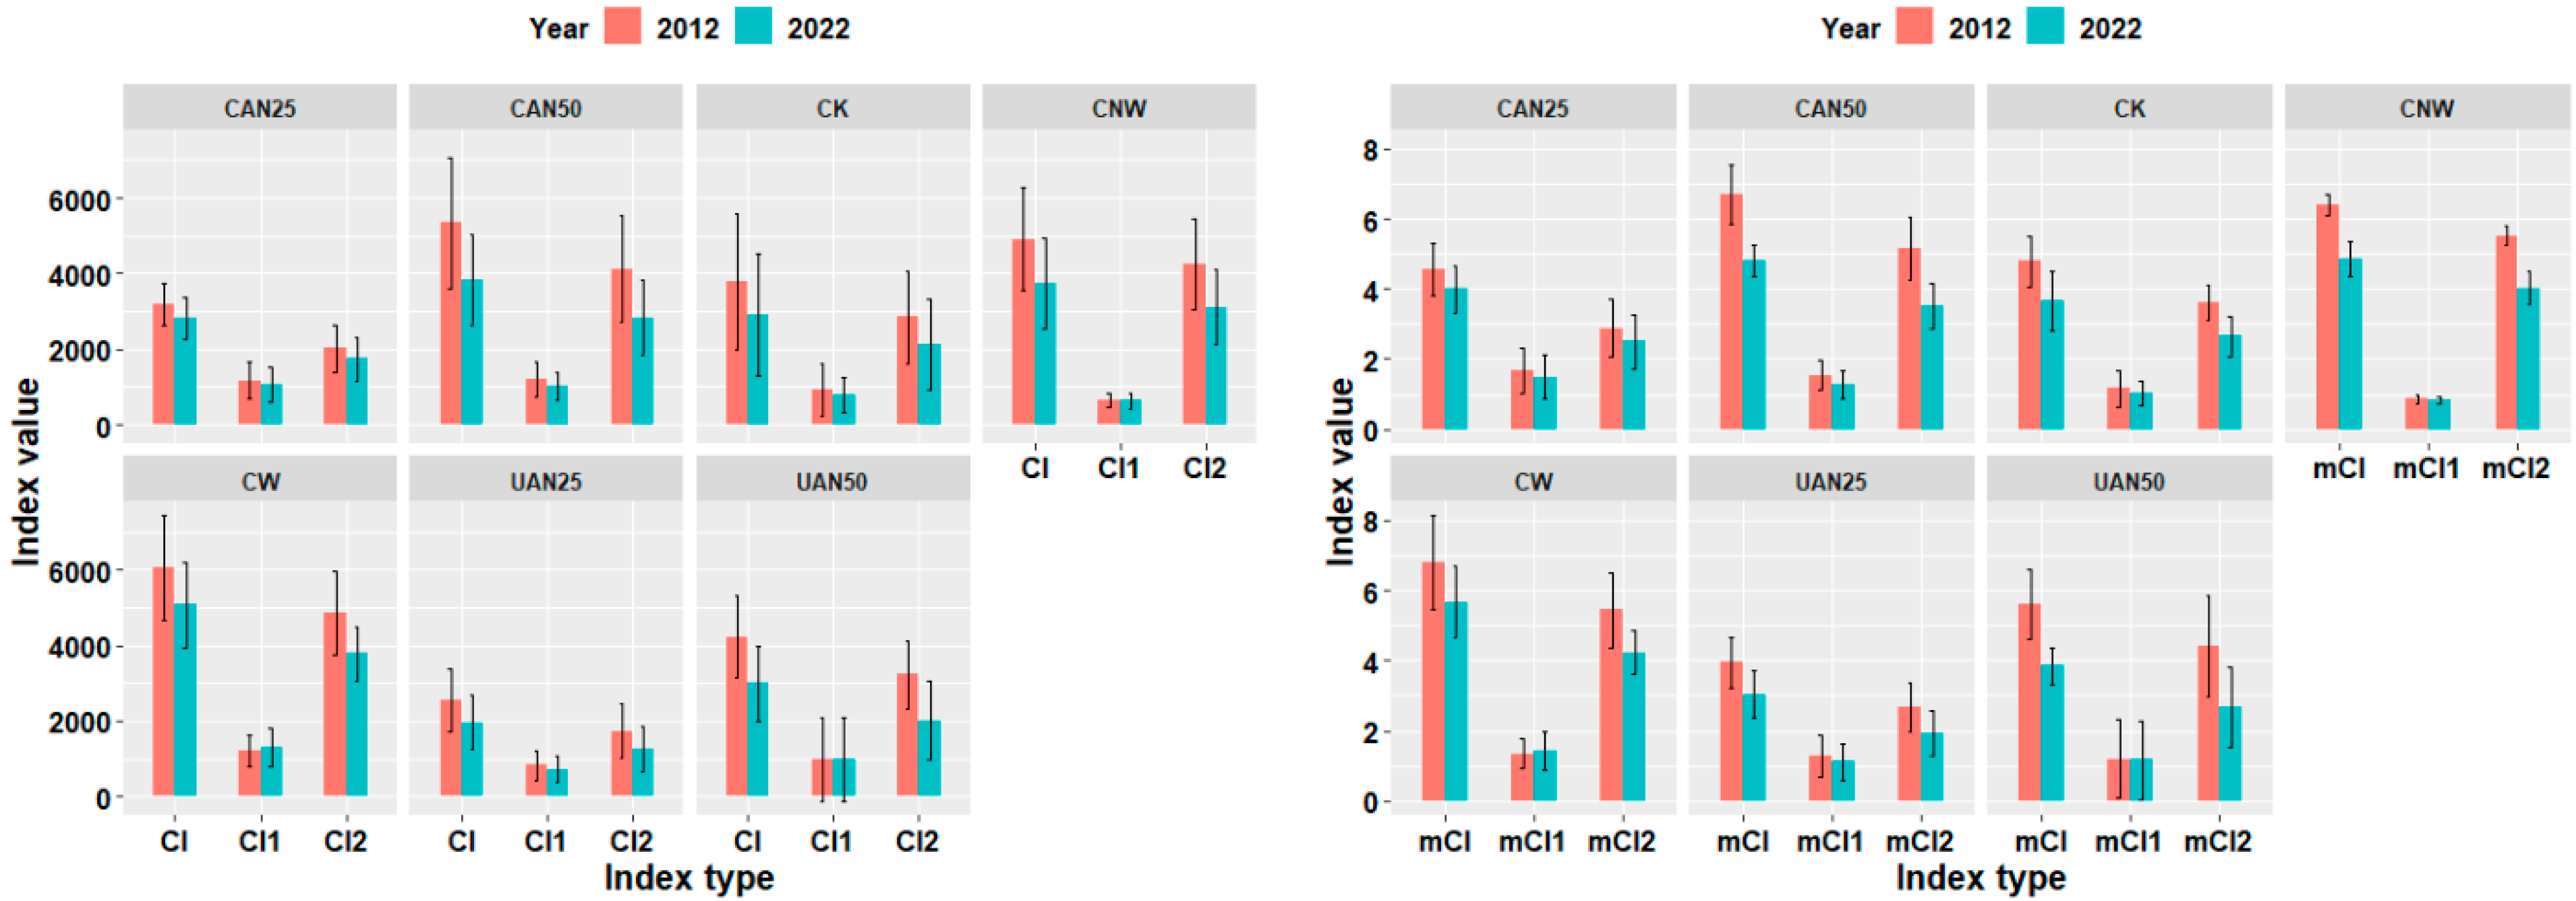
Surviving trees are those that survived from 2012 to 2022 in the study plot. Using trees that survived in both the 2012–2022 periods as the study subjects (Table 2), the three total competition indices (CI, CI1, CI2) at the stand level for the seven nitrogen addition treatments all showed a decreasing trend (Figure 4), with the exception of CI1 in the CW plot, which increased. The decrease in intraspecies competition intensity was less pronounced than that in interspecies competition intensity. The percentage decrease in CI was 12.18%, 28.26%, 22.70%, 23.75%, 16.27%, 22.71%, and 28.95%, respectively. The decrease in CI1 was 10.76%, 16.79%, 14.57%, 5.12%, −7.40%, 11.66%, and 0.99%, respectively. The decrease in CI2 was 13.01%, 31.60%, 25.36%, 26.67%, 22.19%, 27.96%, and 37.56%, respectively. The changes in the competition indices CI, CI1, and CI2 were generally consistent across the seven nitrogen addition treatments, except that the intraspecies competition intensity in the CNW, CW, and UN50 plots showed little relief, while the interspecies competition intensity pressure decreased significantly. The average competition indices (mCI, mCI1, mCI2) exhibited trends and magnitudes consistent with the corresponding total competition indices, further validating the regulatory effect of nitrogen addition on the competition pattern.
The response results of the six competition indices for surviving trees at the stand level for the years 2012 and 2022 are presented (Table 4), along with their interannual changes. The response results for the total competition indices (CI, CI1, CI2) and average competition indices (mCI, mCI1, mCI2) are consistent. Here, we further present the results of multiple tests for the mean differences between the two periods for the average competition indices: mCI: CAN50 and UAN50 were significantly lower than CAN25 (difference −1.336 and −1.191; p = 0.0307 and 0.0676); mCI1: CW was significantly higher than CAN25 and CAN50 (differences 0.274 and 0.338; p = 0.0954 and 0.0230); mCI2: CAN50, CNW, and UAN50 were all significantly lower than CAN25 (difference −1.272, −1.126, −1.364; p = 0.0416, 0.0904, 0.0248), while differences between other treatment levels did not reach significance (p > 0.1). In summary, nitrogen addition treatments significantly affected the average competitive intensity of surviving trees. High nitrogen and rain enhancement (CAN50, CNW, UAN50) were more effective than low nitrogen (CAN25) in reducing the average competitive intensity between species, thereby significantly reducing the overall competitive pressure on surviving trees.

3.3.3. Response of Competitive Intensity of Dominant Tree Species Among Surviving Trees in Plot Level

Stand-level means ± SD (error bars) of six competitive indices (CI, CI1, CI2, mCI, mCI1, mCI2) for dominant tree species (Q. acutissima, Q. variabilis, L. formosana) in surviving trees are displayed for 2012 and 2022 (Figure 5). At the plot level, competition indices (CI, CI1 and CI2) consistently show that L. formosana experiences the strongest competitive pressure among the seven nitrogen addition treatments. Q. acutissima and Q. variabilis, in contrast, exhibit comparable and significantly lower competition intensities. Looking at the interannual changes in competitive intensity between 2012 and 2022, the competitive index CI shows that the competitive intensity of L. formosana has been decreasing, while that of Q. acutissima and Q. variabilis has fluctuated slightly, with overall competitive intensity remaining largely unchanged. Regarding the intraspecific competition index CI1, the competitive strength of L. formosana remained largely unchanged, while that of Q. acutissima and Q. variabilis showed an overall downward trend. In terms of the interspecific competition index CI2, the competition intensity of L. formosana decreased, while that of Q. acutissima and Q. variabilis showed an overall upward trend. Additionally, the intraspecific competition intensity in the CNW, CW, and UN50 plots remained largely unchanged, while the interspecific competition intensity pressure decreased significantly. The trends and magnitudes of changes in the average competition indices mCI, mCI1, and mCI2 were consistent with those of the overall competition indices.
The results of the interannual changes in six competition indices at the stand level for dominant tree species in surviving trees are presented in Table 5. The interannual changes in competition indices for the dominant tree species Q. acutissima and Q. variabilis were not significant, while the number of significant interannual differences in average competition indices for L. formosana was greater. Among the total competition indices, only the intraspecific competition index CI1 of L. formosana showed significant interannual differences. Multiple comparisons indicated that CW was significantly higher than CAN25 and CAN50 (differences of 226 and 185, p = 0.0080 and 0.0407, respectively). The annual changes in the average competition index were significant for all three indices of L. formosana, with mCI showing significant differences in 6 treatment groups (p < 0.05). Among these, CAN50, CNW, and UAN50 were significantly lower than CAN25 (differences of −2.123, −1.537, −1.785), and UAN25 was significantly higher than CAN25, CNW, and UAN50 (differences of 1.970, 1.385, and 1.632, respectively). mCI1: 4 treatment groups showed significant differences (p < 0.05), with CW significantly higher than CK, CAN25, CAN50, and UAN50 (differences of 0.646, 0.658, 0.657, and 0.586). mCI2: 7 treatment differences were significant (p < 0.05), with CAN50, CNW, CW, and UAN50 all significantly lower than CAN25 (differences of −2.124, −1.645, −1.462, −2.095), and UAN25 was significantly higher than CAN50, CNW, and UAN50 (differences of 1.899, 1.419, 1.870). In summary, nitrogen addition treatments significantly altered the competitive strength of L. formosana, with high nitrogen and rain enhancement (CAN50, CNW, UAN50) significantly reducing interspecific competitive pressure on L. formosana compared to the control and low nitrogen treatments, while CW exacerbated intraspecific competitive pressure on L. formosana by increasing the intraspecific competitive index.

3.4. Effects of Nitrogen Addition Methods on Competition Among Surviving Trees in Plot Level

Stand-level means ± SD (error bars) of six competitive indices at the stand level for surviving trees under three nitrogen addition methods (CAN, CK, and UAN) are displayed for 2012 and 2022 (Figure 6). The competition indices (CI, CI1, and CI2) for all three nitrogen addition methods showed a consistent downward trend, with the degree of decline in intraspecific competition intensity being lower than that of interspecific competition intensity. The percentage decrease in CI was 22.24%, 22.70%, and 26.60%, respectively; the percentage decrease in CI1 was 13.81%, 14.57%, and 5.82%, respectively; and the decrease in CI2 was 25.51%, 25.36%, and 34.21%, respectively. Intraspecific competition intensity in the UAN plots showed little relief, while interspecific competition intensity pressure decreased significantly. The changes in the average competition indices mCI, mCI1, and mCI2 were consistent with the overall competition indices.
The results of the response to nitrogen addition methods for the six competition indices of surviving trees at the stand level in 2012 and 2022 are presented (Table 6), along with their interannual changes. Only the mCI in 2022 was significant at the 0.05 level, while the others were not significant. In the multiple comparison of mean differences for mCI in 2022, the difference between UAN and CAN was −0.9453, with a corresponding p-value of 0.0448. The p-values for the mean differences at other levels were all greater than 0.1. This indicates that both canopy and understory of nitrogen addition had no significant effect on changes in the average competitive strength of surviving trees in the study plots.

3.5. Effects of Nitrogen Addition Intensity on Competition Among Surviving Trees in Plot Level

Stand-level means ± SD (error bars) of six competitive indices at the stand level for surviving trees under three nitrogen addition intensity (AN25, AN50, CK) are displayed for 2012 and 2022 (Figure 7). The competition indices (CI, CI1, and CI2) for all three-nitrogen addition intensity showed a decreasing trend, with the decrease in intraspecific competition intensity being smaller than that in interspecific competition intensity. The decrease in CI was 16.85%, 28.56%, and 22.70%, respectively; the decrease in CI1 was 11.13%, 9.64%, and 14.57%, respectively; and the decrease in CI2 was 19.91%, 34.21%, and 25.36%, respectively. The decrease in intraspecific competition intensity in the AN50 plot was much smaller than that in interspecific competition intensity. The changes in the average competition indices mCI, mCI1, and mCI2 were consistent with those of the total competition indices.
The results of the response of six competition indices at the stand level for surviving trees in plot level in 2012 and 2022 are presented (Table 7), as well as their interannual changes, to nitrogen addition intensity. The response results for the total competition indices (CI, CI1, CI2) and the average competition indices (mCI, mCI1, mCI2) are consistent. Multiple comparisons indicate that significant differences exist only between high nitrogen (AN50) and low nitrogen (AN25): AN50 is significantly lower than AN25 (the differences in CI, CI2, mCI, and mCI2 are −882, −888, −1.092, and −1.132, respectively). In summary, the decrease in competitive intensity of surviving trees is primarily reflected in interspecific competitive pressure, and the high-nitrogen treatment (AN50) significantly alleviated total interspecific competition and average competitive intensity compared to the low-nitrogen treatment (AN25).

4. Discussion

4.1. Competitive Changes in Dominant Tree Species

Nitrogen addition treatments did not alter the dominant tree species in the study plots, and while these species did not hold an absolute advantage in terms of number of individuals, they dominated in terms of basal area due to their larger individual trunk diameters (Q. acutissima and Q. variabilis), indicating that the forest stands in the study area have entered a stage characterized by a larger diameter class structure. In fact, the DBH of Q. acutissima ranged from 10.4 cm to 63.7 cm, with an average DBH of 37.3 cm, while the DBH of Q. variabilis ranged from 8.5 cm to 55.0 cm, with an average DBH of 34.7 cm. The significant individual advantages of Q. acutissima and Q. variabilis stem from their early artificial planting advantages, enabling them to occupy the upper canopy space first in competition, thereby obtaining higher light and resources, and further promoting diameter growth [31]. The increase in the proportion of basal area of L. formosana is directly related to the increase in the number of regenerating trees. This tree species typically has light-loving characteristics or rapid early growth, achieving high regeneration success rates in forest gaps or forest edges, and can utilize the resource space released after the death of dominant tree species [40,41].
The number of competing trees and spatial distance jointly determine the increase in CI. As the number of competing trees increases, the average distance between new individuals and target trees also increases, leading to a decline in individual competition effects. Consequently, the growth curves of CI and mCI exhibit gradual saturation, consistent with conclusions related to forest tree competition [33]. It was also found that density effects and stem diameter differences primarily influence the competitive intensity of dominant tree species, i.e., CI values and mCI values: L. formosana > Q. variabilisQ. acutissima. This may be because the density of L. formosana (410 trees ha−1) is greater than that of Q. variabilis (85 trees ha−1) and Q. acutissima (81 trees ha−1), with density of L. formosana being approximately five times that of oak species. Within the same radius, L. formosana can include more competing trees, resulting in greater cumulative competitive intensity. This positive correlation between stand density and competitive indices has been observed in many studies [42,43]. Furthermore, the average DBH of Q. acutissima (37.3 cm) and Q. variabilis (34.7 cm) is significantly larger than that of L. formosana (9.9 cm). Larger DBH of the target tree results in lower competition [44]. Even with the same number of competing trees, oak species exhibit lower CI and mCI due to their competitive advantage.

4.2. Analysis of Changes in Competitive Intensity Under Nitrogen Addition Treatments

Nitrogen deposition has been shown to reshape the competitive structure within communities by altering soil nitrogen availability, promoting seedling renewal, and accelerating tree growth [45]. The results of this study indicate that all seven nitrogen addition treatments increased the total competition indices (CI, CI1, and CI2) and average competition indices (mCI, mCI1, and mCI2) of the study plots. However, there were no significant interannual differences, suggesting that nitrogen addition treatments have a consistent and sustained effect on enhancing overall competition intensity. This trend is closely related to the continuous increase in stand density [31]. However, unlike the competition indices calculated using all trees in the plot, the competition indices of surviving trees in the plot showed a decreasing trend under the seven nitrogen addition treatments, and the differences in interannual changes were significant at the 0.1 level. This contrast between overall increase and decrease in surviving trees indicates that nitrogen-driven competitive pressure does not act uniformly on all individuals. Multiple comparisons further indicate that high nitrogen treatments significantly reduce the competitive intensity of surviving trees compared to low nitrogen treatments, particularly the interspecific competitive intensity. Nitrogen-promoted regeneration surges lead to a rapid increase in the number of small-diameter individuals [9,28]. Under resource-limited conditions, weaker individuals are eliminated first, resulting in a decrease in the average neighboring tree density of surviving trees [46].

4.3. Asymmetric Regulation of the Competitive Landscape of L. formosana by Nitrogen Addition Treatments

After nitrogen addition, the total competitive intensity and average competitive intensity of L. formosana surviving trees at the plot level were significantly higher than those of Q. acutissima and Q. variabilis, which was directly related to the smaller average DBH and high density of L. formosana. Notably, nitrogen addition did not cause the competitive intensity of L. formosana surviving trees to continue to rise; instead, it showed a decreasing trend, meaning that while intraspecific competitive intensity remained unchanged, interspecific competitive intensity decreased. This suggests that nitrogen addition treatments did not significantly alter the relative status of individual L. formosana within the species. However, due to its own growth and increased DBH, it narrowed the gap with larger-diameter Q. acutissima and Q. variabilis in light resource competition, thereby reducing asymmetric suppression from oak species [47]. Conversely, the intraspecies competition intensity of Q. acutissima and Q. variabilis decreased, while the interspecies competition intensity increased. This was due to the death of Q. acutissima and Q. variabilis, the filling of canopy gaps by regenerating other tree species, leading to an increase in interspecies competition sources, and thus an increase in CI2; while the decrease in the number of large-diameter individuals of the surviving oak species led to a decrease in the number of intraspecies neighbors, and thus a decrease in CI1.
Regarding the interannual variation in competition intensity, nitrogen addition treatments significantly affected the average competition intensity of L. formosana surviving trees in the study plots but had no significant effect on surviving Q. acutissima and Q. variabilis. This may be because Q. acutissima and Q. variabilis have larger trunk diameters and are less susceptible to external pressures, thereby maintaining a dominant position. Multiple comparisons showed that compared to low nitrogen, high nitrogen treatment significantly alleviated the average interspecific competition intensity of L. formosana, while rainfall enhancement increased soil moisture availability, enhancing the photosynthetic efficiency of Q. acutissima and Q. variabilis, thereby intensifying resource competition with L. formosana and causing its average competition intensity to significantly increase. These results further confirm the importance of the interactive effects of resources and competition, where nitrogen and moisture jointly determine the intensity and direction of competitive asymmetry [48,49].

4.4. Analysis of Differences in Changes in Competition Intensity Among Surviving Trees in Plot Level Based on Nitrogen Addition Methods and Intensity

This study categorized nitrogen deposition scenarios into two methods—canopy and understory—and two intensity—low nitrogen and high nitrogen. The results showed that both nitrogen addition methods and intensity exhibited consistent trends in changes in competition intensity among surviving trees in the study plots, with both showing a decreasing trend. Additionally, the decrease in intraspecific competition intensity was less pronounced than that in interspecific competition intensity. However, there were no significant interannual differences in nitrogen addition methods, while nitrogen addition intensity exhibited significant dose-dependent regulation of competition intensity: (i) the decrease in competition intensity under high nitrogen treatment was significantly greater than under low nitrogen treatment (p < 0.05); (ii) interspecies competition intensity showed significant interannual variation, while intraspecies competition intensity did not, indicating that the mitigating effect of nitrogen addition intensity primarily manifested at the external competition level rather than the intraspecies neighbor level. Therefore, under the current nitrogen addition gradient (annual average of 25 kg N ha−1), the spatial input points of nitrogen did not alter the community competition structure, suggesting that tree nitrogen uptake is primarily driven by concentration rather than input pathways.

4.5. Limitations

First, the single-site design inherently limits how far our findings can be extrapolated. The studied deciduous broad-leaved forest is embedded in a unique combination of species pool, soil chemistry and topographic microclimate; consequently, the observed responses to nitrogen addition and rainfall enhancement may differ—both in magnitude and direction—from those in forests situated on contrasting soils, steeper terrain, or under more continental or maritime climates. Multi-site networks that span gradients in these drivers are therefore needed before the results can be generalized to the biome scale. Second, with only two full censuses (2012 and 2022) we can quantify net decadal change, but the snapshot approach inevitably smooths over the rich palette of inter-annual variation. Short-term pulses of drought, late frost, or mast years can transiently intensify or relax competition. Without intermediate measurements we cannot pinpoint when during the decade the competitive trajectories diverged, nor can we separate monotonic trends from abrupt, event-driven shifts. Long-term and high-frequency monitoring would reveal interannual variability or the temporal dynamics of competitive interactions. Additionally, tree competition may substantially modulate foliar nutrient partitioning and seed production [50]. Systematic acquisition of relevant data and hypothesis-driven investigations into these mechanisms are therefore advocated for future studies.

5. Conclusions

Under the seven nitrogen addition treatments, the interannual variability and trends in the total competition index (CI, CI1, CI2) and average competition index (mCI, mCI1, mCI2) were generally similar. Nitrogen addition treatments had no significant effect on the interannual variability of competition intensity among all trees in the plot, but they had a significant effect on the variability of competition intensity among surviving trees. Nitrogen addition treatments significantly regulated the competitive structure of surviving trees, primarily affecting interspecific competition intensity. The decrease in interspecific competition was significantly greater than that in intraspecific competition, leading to a significant overall reduction in competitive intensity among surviving trees. This effect was primarily driven by the dominant species, L. formosana, while the competitive intensity of Q. acutissima and Q. variabilis showed no significant interannual variation. The nitrogen addition methods (canopy vs. understory) did not significantly alter the competitive intensity of surviving trees, while nitrogen addition intensity exhibited a dose-dependent effect: high-nitrogen treatment significantly alleviated interspecific competition compared to low-nitrogen treatment, providing evidence for understory regeneration and community structure optimization.

Author Contributions

Conceptualization, L.H., G.D., Y.Y. and L.F.; methodology, L.H., G.D. and L.F.; software, L.H. and G.D.; validation, L.H., L.M. and Y.Y.; formal analysis, L.H., X.L. and S.F.; investigation, L.H., G.D., L.M., X.L. and J.F.; resources, S.F. and J.F.; data curation, G.D., L.M. and X.L.; writing—original draft preparation, L.H., G.D. and Y.Y.; writing—review and editing, L.H., G.D. and S.F.; visualization, L.H., X.L. and G.D.; supervision, S.F., L.F. and J.F.; project administration, G.D. and L.M.; funding acquisition, G.D. All authors have read and agreed to the published version of the manuscript.

Funding

This research was funded by Xinyang Academy of Ecological Research Open Foundation (2023XYMS10, 2023XYZD02), the Key scientific research projects in universities of Henan (23A220003), General Project of Natural Science Foundation of Henan Province (232300420162) and National Natural Science Foundations of China (31971653).

Data Availability Statement

The data that support the funding of this study are available from the corresponding author.

Conflicts of Interest

The authors declare no conflicts of interest.

References

  1. Zhang, W.; Shen, W.J.; Zhu, S.D.; Wan, S.Q.; Luo, Y.Q.; Yan, J.H.; Wang, K.Y.; Liu, L.; Dai, H.T.; Li, P.X.; et al. Can canopy addition of nitrogen better illustrate the effect of atmospheric nitrogen deposition on forest ecosystem? Sci. Rep. 2015, 5, 11245. [Google Scholar] [CrossRef]
  2. Tian, D.; Du, E.Z.; Jiang, L.; Ma, S.H.; Zeng, W.J.; Zou, A.L.; Feng, C.Y.; Xu, L.C.; Xing, A.J.; Wang, W.F.; et al. Responses of forest ecosystems to increasing N deposition in China: A critical review. Environ. Pollut. 2018, 243 Pt A, 75–86. [Google Scholar] [CrossRef]
  3. Chen, X.N.; Zhao, N.Q.; Duan, N.; Gegen, B.; Zhang, J.B.; Shi, S.Y.; Duan, R.B.; Gao, S.C. Research progress on plant responses to water and nitrogen addition. Temper. For. Res. 2022, 5, 7–11. [Google Scholar]
  4. Liu, X.J.; Duan, L.; Mo, J.M.; Du, E.Z.; Shen, J.L.; Lu, X.K.; Zhang, Y.; Zhou, X.B.; He, C.Y.; Zhang, F.S. Nitrogen deposition and its ecological impact in China: An overview. Environ. Pollut. 2011, 159, 2251–2264. [Google Scholar] [CrossRef]
  5. Long, J.N.; Dean, T.J.; Roberts, S.D. Linkages between silviculture and ecology: Examination of several important conceptual models. For. Ecol. Manag. 2004, 200, 249–261. [Google Scholar] [CrossRef]
  6. Gessler, A.; Schaub, M.; McDowell, N.G. The role of nutrients in drought-induced tree mortality and recovery. New Phytol. 2017, 214, 513–520. [Google Scholar] [CrossRef]
  7. Simpson, D.; Arneth, A.; Mills, G.; Solberg, S.; Uddling, J. Ozone—The persistent menace: Interactions with the N cycle and climate change. Curr. Opin. Environ. Sustain. 2014, 9–10, 9–19. [Google Scholar] [CrossRef]
  8. Jiang, L.; Tian, D.; Ma, S.H.; Zhou, X.L.; Xu, L.C.; Zhu, J.X.; Jing, X.; Zheng, C.Y.; Shen, H.H.; Zhu, B.; et al. The response of tree growth to nitrogen and phosphorus additions in a tropical montane rainforest. Sci. Total Environ. 2018, 618, 1064–1070. [Google Scholar] [CrossRef] [PubMed]
  9. Li, Y.; Tian, D.S.; Yang, H.; Niu, S.L. Size-dependent nutrient limitation of tree growth from subtropical to cold temperate forests. Funct. Ecol. 2018, 32, 95–105. [Google Scholar] [CrossRef]
  10. Tian, D.; Li, P.; Fang, W.J.; Xu, J.; Luo, Y.K.; Yan, Z.B.; Zhu, B.; Wang, J.J.; Xu, X.N.; Fang, J.Y. Growth responses of trees and understory plants to nitrogen fertilization in a subtropical forest in China. Biogeosciences 2017, 14, 3461–3469. [Google Scholar] [CrossRef]
  11. Hong, L.; Tang, S.Z.; Li, T.; Fu, L.Y.; Song, X.Y.; Duan, G.S.; Fu, J.M.; Ma, L. Determinants of Deadwood Biomass under the Background of Nitrogen and Water Addition in Warm Temperate Forests. Forests 2024, 15, 1464. [Google Scholar] [CrossRef]
  12. Hou, L.; Dong, Z.J.; Yang, Y.Y.; Zhang, D.H.; Zhang, S.L.; Zhang, S.X. Applying foliar stoichiometric traits of plants to determine fertilization for a mixed pine-oak stand in the Qinling Mountains, China. PeerJ 2018, 6, e4628. [Google Scholar] [CrossRef]
  13. Yang, H. Effects of nitrogen and phosphorus addition on leaf nutrient characteristics in a subtropical forest. Trees 2018, 32, 383–391. [Google Scholar] [CrossRef]
  14. You, C.M.; Wu, F.Z.; Yang, W.Q.; Xu, Z.F.; Tan, B.; Yue, K.; Ni, X.Y. Nutrient-limited conditions determine the responses of foliar nitrogen and phosphorus stoichiometry to nitrogen addition: A global meta-analysis. Environ. Pollut. 2018, 241, 740–749. [Google Scholar] [CrossRef]
  15. Reich, P.B.; Oleksyn, J. Global patterns of plant leaf N and P in relation to temperature and latitude. Proc. Natl. Acad. Sci. USA 2004, 101, 11001–11006. [Google Scholar] [CrossRef] [PubMed]
  16. Razaq, M.; Zhang, P.; Shen, H.L.; Salahuddin. Influence of nitrogen and phosphorous on the growth and root morphology of Acer mono. PLoS ONE 2017, 12, e0171321. [Google Scholar] [CrossRef] [PubMed]
  17. Thomas, R.Q.; Canham, C.D.; Weathers, K.C.; Goodale, C.L. Increased tree carbon storage in response to nitrogen deposition in the US. Nat. Geosci. 2010, 3, 13–17. [Google Scholar] [CrossRef]
  18. Zhang, H.C.; Li, Y.Q.; Xu, K.Q.; Yu, L.H.; He, P.; Zeng, S.P.; Song, Y.X.; Liu, R.; Sun, Y. Effects of Anthropogenic Disturbance on the Structure, Competition, and Succession of Abies ziyuanensis Communities. Forests 2024, 15, 1001. [Google Scholar] [CrossRef]
  19. Daniels, R.F. Simple Competition Indices and Their Correlation with Annual Loblolly Pine Tree Growth. For. Sci. 1976, 22, 454–456. [Google Scholar]
  20. Adler, P.B.; Smull, D.; Beard, K.H.; Choi, R.T.; Furniss, T.; Kulmatiski, A.; Meiners, J.M.; Tredennick, A.T.; Veblen, K.E. Competition and coexistence in plant communities: Intraspecific competition is stronger than interspecific competition. Ecol. Lett. 2018, 21, 1319–1329. [Google Scholar] [CrossRef]
  21. Chesson, P. Mechanisms of Maintenance of Species Diversity. Annu. Rev. Ecol. Syst. 2000, 31, 343–366. [Google Scholar] [CrossRef]
  22. Filipescu, C.N.; Comeau, P.G. Competitive interactions between aspen and white spruce vary with stand age in boreal mixedwoods. For. Ecol. Manag. 2007, 247, 175–184. [Google Scholar] [CrossRef]
  23. Weiner, J.; Thomas, S.C. Size Variability and Competition in Plant Monocultures. Oikos 1986, 47, 211–222. [Google Scholar] [CrossRef]
  24. Pretzsch, H.; Biber, P. Size-symmetric versus size-asymmetric competition and growth partitioning among trees in forest stands along an ecological gradient in central Europe. Can. J. For. Res. 2010, 40, 370–384. [Google Scholar] [CrossRef]
  25. Braun, S.; Schindler, C.; Rihm, B. Growth trends of beech and Norway spruce in Switzerland: The role of nitrogen deposition, ozone, mineral nutrition and climate. Sci. Total Environ. 2017, 599–600, 637–646. [Google Scholar] [CrossRef]
  26. DeForest, J.L.; Snell, R.S. Tree growth response to shifting soil nutrient economy depends on mycorrhizal associations. N. Phytol. 2020, 225, 2557–2566. [Google Scholar] [CrossRef]
  27. Bu, W.S.; Wang, F.C.; Zhang, C.C.; Bruelheide, H.; Fang, X.M.; Wang, H.M.; Chen, F.S. The contrasting effects of nitrogen and phosphorus fertilizations on the growth of Cunninghamia lanceolata depend on the season in subtropical China. For. Ecol. Manag. 2021, 482, 118874. [Google Scholar] [CrossRef]
  28. Liu, B.; Zhang, C.C.; Deng, J.; Zhang, B.W.; Chen, F.S.; Chen, W.; Fang, X.M.; Li, J.J.; Zu, K.L.; Bu, W.S. Response of tree growth to nutrient addition is size dependent in a subtropical forest. Sci. Total Environ. 2024, 923, 171501. [Google Scholar] [CrossRef]
  29. Tian, Y.; Zhou, P.; Zhou, L.; Zhang, L.; Lin, Y.B.; Wang, Y.J.; Wang, J.; Hui, D.F.; Ren, H.; Lu, H.F. Multi-ecosystem services differently affected by over-canopy and understory nitrogen additions in a typical subtropical forest. Glob. Change Biol. 2024, 30, e17192. [Google Scholar] [CrossRef]
  30. Li, X.W.; Zhang, C.L.; Zhang, B.B.; Wu, D.; Zhu, D.D.; Zhang, W.; Ye, Q.; Yan, J.H.; Fu, J.M.; Fang, C.L.; et al. Nitrogen deposition and increased precipitation interact to affect fine root production and biomass in a temperate forest: Implications for carbon cycling. Sci. Total Environ. 2021, 765, 144497. [Google Scholar] [CrossRef]
  31. Hong, L.; Duan, G.S.; Fu, S.L.; Fu, L.Y.; Ma, L.; Li, X.W.; Fu, J.M. Response of Stand Spatial Structure to Nitrogen Addition in Deciduous Broad-Leaved Forest in Jigong Mountain. Sustainability 2024, 16, 5137. [Google Scholar] [CrossRef]
  32. Ohsawa, M. Differentiation of vegetation zones and species strategies in the subalpine region of Mt. Fuji. Vegetatio 2004, 57, 15–52. [Google Scholar] [CrossRef]
  33. Hu, X.F.; Duan, G.S.; Zhang, H.R.; Lu, J.; Zhang, X.H. Response of tree competition in natural secondary Quercus mongolica forest to thinning treatment. Forest Res. 2021, 34, 1–9. [Google Scholar] [CrossRef]
  34. Hegyi, F. A simulation model for managing jack-pine stands simulation. Royal Coll. For. Res. Notes 1974, 30, 74–90. [Google Scholar]
  35. Hui, G.Y.; Hu, Y.B.; Zhao, Z.H.; Yuan, S.Y. A tree competition index based on intersection angle. Scient. Silvae Sin. 2013, 49, 68–73. [Google Scholar] [CrossRef]
  36. Staupendahl, K.; Zucchini, W. Estimating the spatial distribution in forest stands by counting small angles between nearest neighbours. Allg. Forst Jagdztg. 2006, 177, 160–168. [Google Scholar]
  37. Assuncao, R. Testing spatial randomness by means of angles. Biometrics. 1994, 50, 531–537. [Google Scholar] [CrossRef]
  38. Davies, O.; Pommerening, A. The contribution of structural indices to the modelling of Sitka spruce (Picea sitchensis) and birch (Betula spp.) crowns. For. Ecol. Manag. 2008, 256, 68–77. [Google Scholar] [CrossRef]
  39. Tang, S.Z. Multivariate Statistical Analysis Methods; China Forestry Publish House: Beijing, China, 1986. [Google Scholar]
  40. Liu, F.; Tan, C.; Yang, Z.G.; Li, J.J.; Xiao, H.S.; Tong, Y. Regeneration and growth of tree seedlings and saplings in created gaps of different sizes in a subtropical secondary forest in southern China. For. Ecol. Manag. 2022, 511, 120143. [Google Scholar] [CrossRef]
  41. Guan, Y.Y.; Fei, F.; Guan, Q.W.; Chen, B. Research progress on forest gap ecology. Sci. Silvae Sin. 2016, 52, 91–99. [Google Scholar]
  42. Liu, Y.X.; Zeng, Y.; Wang, P.; He, J.; Li, P.P.; Liang, Y.J. The spatial pattern of Populus euphratica competition based on competitive exclusion theory. Front. Plant Sci. 2024, 15, 1276489. [Google Scholar] [CrossRef] [PubMed]
  43. Castagneri, D.; Vacchiano, G.; Lingua, E.; Motta, R. Analysis of intraspecific competition in two subalpine Norway spruce (Picea abies (L.) Karst.) stands in Paneveggio (Trento, Italy). For. Ecol. Manag. 2007, 255, 651–659. [Google Scholar] [CrossRef]
  44. Carr, S.; Larocque, G.R.; Luckai, N.J.; Bell, F.W. Effect of competition on individual white spruce production in young boreal mixedwood forests. Can. J. For. Res. 2020, 50, 726–735. [Google Scholar] [CrossRef]
  45. Du, E.; Terrer, C.; Pellegrini, A.F.A.; Ahlström, A.; van Lissa, C.J.; Zhao, X.; Xia, N.; Wu, X.H.; Jackson, R.B. Global patterns of terrestrial nitrogen and phosphorus limitation. Nat. Geosci. 2020, 13, 221–226. [Google Scholar] [CrossRef]
  46. Yuan, Z.Q.; Osei, R.; Mao, Z.K.; Ye, J.; Lin, F.; Fang, S.; Wang, X.G.; Hao, Z.Q.; Ali, A. Determinants of tree population temporal stability in a temperate mixed forest over a gradient of nitrogen addition. J. Environ. Manag. 2024, 368, 122198. [Google Scholar] [CrossRef]
  47. Zou, A.L.; Li, X.P.; Ni, X.F.; Ji, C.J. Responses of tree growth to nitrogen addition in Quercus wutaishanica forests in Mt. Dongling, Beijing, China. Chin. J. Plant Ecol. 2019, 43, 783–792. [Google Scholar]
  48. Li, W.; Su, Y.Z.; Qin, Y.W.; Li, F.W.; Zhou, T.L.; He, Y.Q.; Mao, J.N.; Li, M.K.; Liu, C.; Shi, Y.F.; et al. Canopy nitrogen and water addition affect fine-root survival strategies and carbon allocation in a warm-temperate forest in China. For. Ecol. Manag. 2025, 590, 122791. [Google Scholar] [CrossRef]
  49. Liu, T.; Mao, P.; Shi, L.L.; Wang, Z.Y.; Wang, X.L.; He, X.X.; Tao, L.B.; Liu, Z.F.; Zhou, L.X.; Shao, Y.H.; et al. Contrasting effects of nitrogen deposition and increased precipitation on soil nematode communities in a temperate forest. Soil Biol. Biochem. 2020, 148, 107869. [Google Scholar] [CrossRef]
  50. Qiu, T.; James, S.C.; Kyle, R.K.; Philip, A.T.; Jennifer, J.S. Remotely sensed crown nutrient concentrations modulate forest reproduction across the contiguous United States. Ecology 2024, 105, e4366. [Google Scholar] [CrossRef]
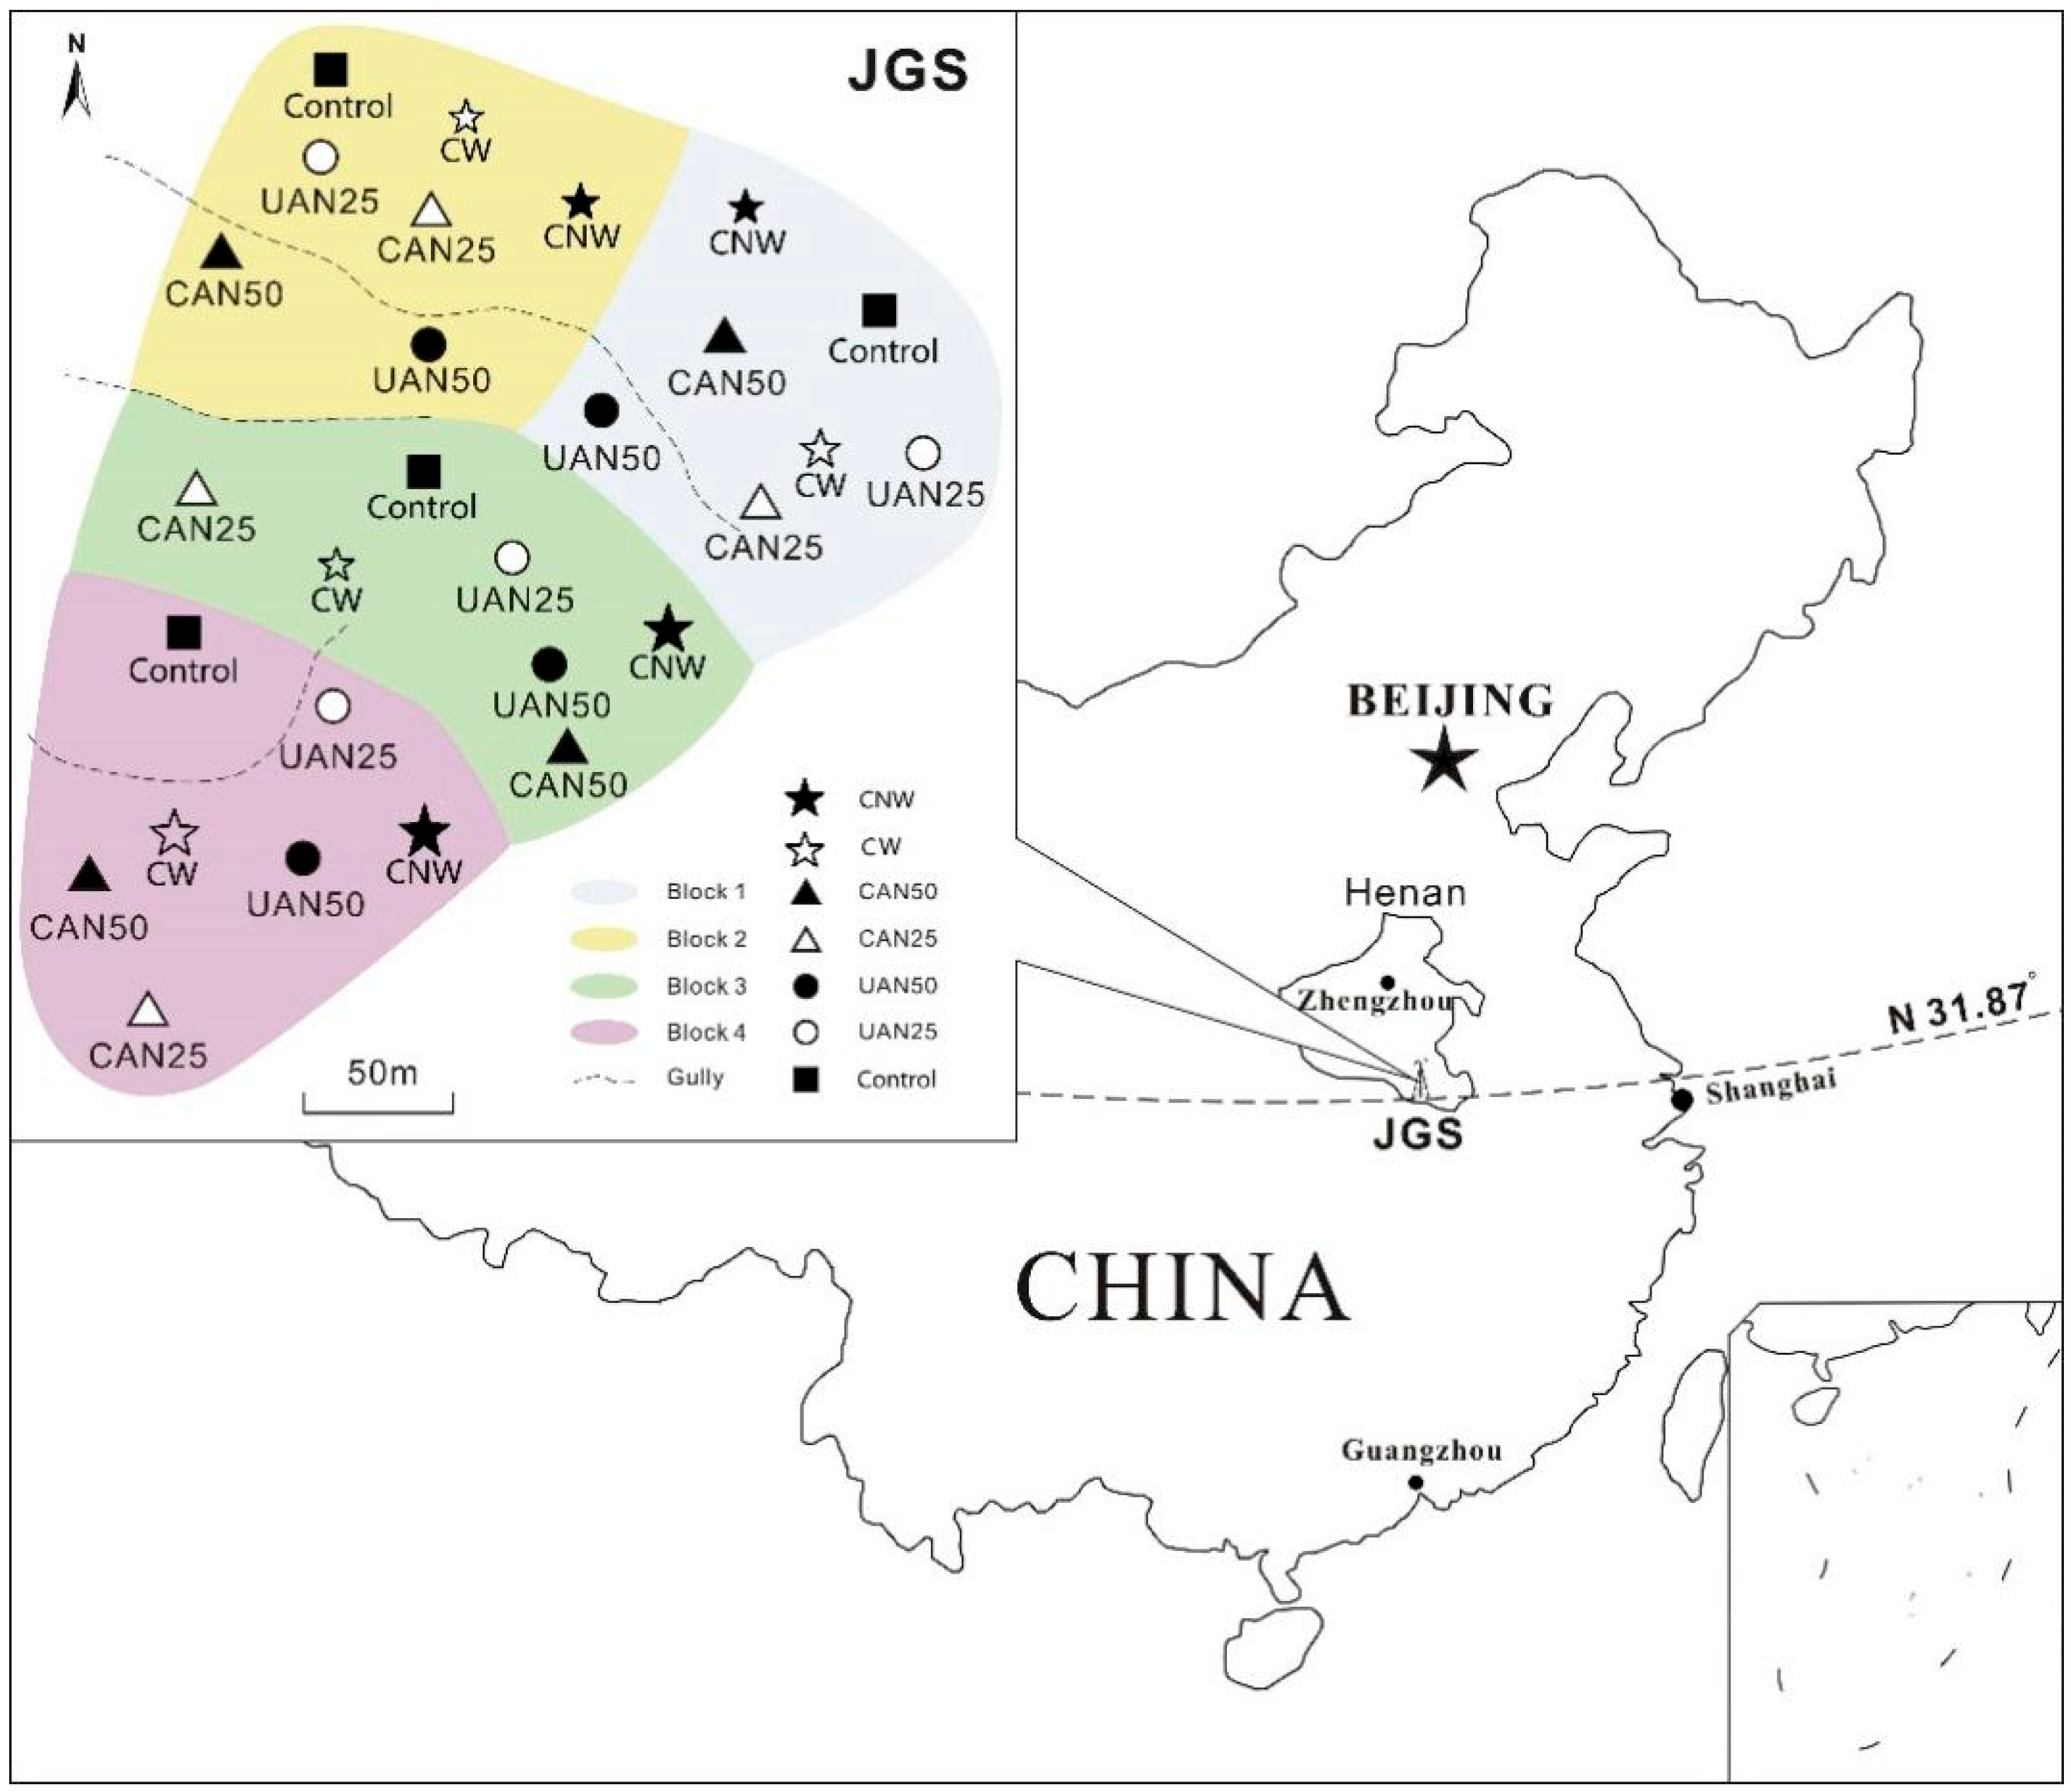
Figure 1. Location of permanent sample plots in “Canopy Simulated Nitrogen Deposition and Rainfall” experimental platform within the Jigongshan (JGS) study area.
Forests 16 01505 g001
Figure 2. Total competition index CI and average competition index mCI based on the different number of competing neighbors (up) 2012; (down) 2022).
Forests 16 01505 g002aForests 16 01505 g002b
Figure 3. Distribution of competition index of total, intraspecies and interspecies of nitrogen addition treatments among all trees in 2012 and 2022 ((left), CI, CI1, CI2; (right), mCI, mCI1, mCI2).
Forests 16 01505 g003
Figure 4. Distribution of competition index of total, intraspecies and interspecies of nitrogen addition treatments among surviving trees in plot level in 2012 and 2022 ((left), CI, CI1, CI2; (right), mCI, mCI1, mCI2).
Forests 16 01505 g004
Figure 5. Distribution of competition index of total, intraspecies and interspecies of nitrogen addition treatments for dominant tree species among surviving trees in plot level in 2012 and 2022 ((left), CI, CI1, CI2; (right), mCI, mCI1, mCI2).
Forests 16 01505 g005
Figure 6. Distribution of competition index of total, intraspecies and interspecies of nitrogen addition methods among surviving trees in plot level in 2012 and 2022 ((left), CI, CI1, CI2; (right), mCI, mCI1, mCI2).
Forests 16 01505 g006
Figure 7. Distribution of competition index of total, intraspecies and interspecies of nitrogen addition intensity among surviving trees in plot level in 2012 and 2022 ((left), CI, CI1, CI2; (right), mCI, mCI1, mCI2).
Forests 16 01505 g007
Table 1. Parameter settings for seven types of Nitrogen addition treatments.
Nitrogen Addition TreatmentsAbbreviationNitrogen Addition Intensities/kg N ha−1 yr−1Nitrogen Addition MethodsRainfall/mm ha−1
Canopy low nitrogen additionCAN 2525canopy21
Canopy high nitrogen additionCAN 5050canopy21
Understory low nitrogen additionUAN 2525understory21
Understory high nitrogen additionUAN 5050understory21
Canopy water additionCW0canopy330
Canopy low nitrogen and water additionCNW25canopy21 + 330
ControlCK0/0
Table 2. The distribution of tree number and basal area in the plots of deciduous broad-leaved forest in Jigong Mountain.
Tree SpeciesBasal Area/m2ha−1Percent/%Tree Number/Stems ha−1Percent/%Surviving Trees Number/Stems ha−1
20122022201220222012202220122022
Q. acutissima10.3711.6536.7235.1588855.343.9182
Q. variabilis8.449.7129.8929.3083815.043.7379
L. formosana4.906.5817.3619.8735441021.4918.86256
A. buergerianum0.851.323.023.9829647117.9721.67135
Q. aliena0.790.852.802.5721181.280.8314
Sophora japonica0.690.282.430.841680.970.377
C. sinensis0.530.851.882.5724637114.9417.07111
Pinus massoniana0.470.391.671.191060.610.286
Cerasus szechuanica0.170.290.590.8848482.912.2135
Lindera glauca0.140.260.510.7716630610.0814.0858
Vernicia fordii0.140.150.490.4666744.013.4027
Table 3. Variance analysis of stand competition index (CI, CI1, CI2, mCI, mCI1, mCI2) of nitrogen addition treatments among all trees.
Competitive Index2012 Year2022 YearAnnual Variation
p-ValueSignificancep-ValueSignificancep-ValueSignificance
CI0.4865 0.0262*0.1284
CI10.3243 0.6166 0.2213
CI20.1485 0.0136*0.1537
mCI0.0151*0.0007***0.3121
mCI10.2139 0.5918 0.3177
mCI20.0003***0.0014**0.3003
Note: significant level, *** p < 0.001, ** 0.001 ≤ p < 0.01, * 0.01 ≤ p < 0.05.
Table 4. Variance analysis of stand competition index (CI, CI1, CI2, mCI, mCI1, mCI2) of nitrogen addition treatments among surviving trees in plot level.
Competitive Index2012 Year2022 YearAnnual Variation
p-ValueSignificancep-ValueSignificancep-ValueSignificance
CI0.0146*0.0225*0.0176*
CI10.7975 0.6845 0.0680.
CI20.0026**0.0110*0.0097**
mCI0.0003***0.0006***0.0230*
mCI10.6285 0.6999 0.0272*
mCI20.0002***0.0012**0.0153*
Note: significant level, *** p < 0.001, ** 0.001 ≤ p < 0.01, * 0.01 ≤ p < 0.05, . 0.05 ≤ p < 0.1.
Table 5. Variance analysis of stand competition index (CI, CI1, CI2, mCI, mCI1, mCI2) of nitrogen addition treatments for dominant tree species among surviving trees in plot level.
Competitive IndexL. formosanaQ. variabilisQ. acutissima
p-ValueSignificancep-ValueSignificancep-ValueSignificance
CI0.3756 0.9659 0.4138
CI10.0179*0.1423 0.5153
CI20.2892 0.9775 0.7332
mCI0.0008***0.8312 0.0589.
mCI10.0313*0.3573 0.1707
mCI20.0008***0.5460 0.8045
Note: significant level, *** p < 0.001, * 0.01 ≤ p < 0.05, . 0.05 ≤ p < 0.1.
Table 6. Variance analysis of stand competition index (CI, CI1, CI2, mCI, mCI1, mCI2) of nitrogen addition methods among surviving trees in plot level.
Competitive Index2012 Year2022 YearAnnual Variation
p-ValueSignificancep-ValueSignificancep-ValueSignificance
CI0.5295 0.3642 0.9686
CI10.6441 0.7642 0.2330
CI20.6620 0.3987 0.9386
mCI0.3248 0.0488*0.9007
mCI10.4293 0.5893 0.1726
mCI20.7569 0.2752 0.7941
Note: significant level, * 0.01 ≤ p < 0.05.
Table 7. Variance analysis of stand competition index (CI, CI1, CI2, mCI, mCI1, mCI2) of nitrogen addition intensity among surviving trees in plot level.
Competitive Index2012 Year2022 YearAnnual Variation
p-ValueSignificancep-ValueSignificancep-ValueSignificance
CI0.0300*0.2032 0.0037**
CI10.9038 0.8503 0.9399
CI20.0084**0.1573 0.0017**
mCI0.0014**0.1250 0.0048**
mCI10.7482 0.7664 0.8489
mCI20.0014**0.1266 0.0034**
Note: significant level, ** 0.001 ≤ p < 0.01, * 0.01 ≤ p < 0.05.
Disclaimer/Publisher’s Note: The statements, opinions and data contained in all publications are solely those of the individual author(s) and contributor(s) and not of MDPI and/or the editor(s). MDPI and/or the editor(s) disclaim responsibility for any injury to people or property resulting from any ideas, methods, instructions or products referred to in the content.