Article

The Potential of Non-Native Pines for Timber Production—A Case Study from Afforested Post-Mining Sites

1
Faculty of Forestry and Wood Sciences, Czech University of Life Sciences Prague, Kamýcká 129, 165 00 Prague, Czech Republic
2
Łukasiewicz Research Network—Poznań Institute of Technology, Ewarysta Estkowskiego 6, 61-755 Poznan, Poland
3
Faculty of Forestry and Wood Technology, Poznań University of Life Sciences, Wojska Polskiego 71A, 60-625 Poznan, Poland
4
Forestry and Game Management Research Institute, Strnady 136, 252 02 Jíloviště, Czech Republic
*
Author to whom correspondence should be addressed.
Forests 2024, 15(8), 1388; https://doi.org/10.3390/f15081388
Submission received: 27 June 2024 / Revised: 31 July 2024 / Accepted: 3 August 2024 / Published: 8 August 2024
(This article belongs to the Section Wood Science and Forest Products)

Abstract

:
Scots pine (Pinus sylvestris L.) represents one of the most important commercial coniferous tree species, providing valuable timber. Due to climate change, it is experiencing serious problems in some areas, therefore, finding a suitable substitute for its wood is currently a challenge. In this study, we compared the wood quality of three different non-native pine species and Scots pine growing at the same site to ensure identical growing conditions. Black pine (Pinus nigra J. F. Arnold), a pine species native to Southern Europe, lodgepole pine (Pinus contorta Douglas ex Loudon), and ponderosa pine (Pinus ponderosa Douglas ex C. Lawson) native to North America were compared to Scots pine for selected quantitative (productivity) and qualitative (physical and mechanical) properties. Significant differences between pine species were found in all quantitative dendrometric parameters, except average diameter at breast height. The stand volume ranged from 157 m3 ha−1 for lodgepole pine to 356 m3 ha−1 for Scots pine. For qualitative characteristics, wood density, shrinkage, and compressive strength were used to find differences among species in choosing the best alternative. The highest wood density was obtained for Scots pine (458 kg m−3), followed by black pine with 441 kg m−3. The density of the remaining pine species was significantly lower. Scots pine also exceeded the tested species in compressive strength (44.2 MPa). Lodgepole pine achieved the second highest value (39.3 MPa) but was statistically similar to black pine (36.5 MPa). The tested pine species exhibited similar values in shrinkage, which were statistically insignificant, ranging from 14.3% for lodgepole pine to 15.1% for Scots pine. Based on applications and preferred characteristics, black pine or lodgepole pine could serve as the Scots pine substitute in some areas. And vice versa, ponderosa pine did not attain the Scots pine wood quality.

1. Introduction

Globally, the environment has been transformed by humans since antiquity [1,2,3]. Thus far, humans have changed approximately half of the Earth’s surface [4]. In the past few centuries, changes in forest cover were caused primarily by the growth of the human population [5,6]. Over the past 300 years, the forest area has been reduced significantly due to increased human activity [7]. However, currently, we see the opposite trend in expanding forest cover on the European continent due to land abandonment or targeted afforestation [8,9,10]. It is necessary to mention that afforestation provides a wide range of benefits, and one of the most urgent issues is climate change mitigation [11,12], which is responded to by increasing carbon sequestration in tree biomass and soils in afforested areas [8,13]. Photosynthesis in trees allows wood biomass to capture approximately 26% of global fossil fuel emissions [14], while carbon storage shows an increase in afforested areas.
The concept of afforesting abandoned agricultural land or postproduction lands, such as post-mining areas, to enhance forest coverage and wood production appears to be a sufficient opportunity to improve damaged areas with low value and also partly mitigate negative global change [8,15]. However, afforestation of abandoned lands may lead not only to increased forest cover, improved soil conditions, and a local water regime, but can ideally also provide an alternative source of high-quality wood material [8,16,17]. Afforestation of post-mining areas can significantly improve local conditions that were affected by previous mining activities that caused a devastating impact on the environment [18]. Usually, mining areas are located close to or even directly in the forest. Therefore, the potential for restoring lost ecosystem services through the re-afforestation of ex-mining areas is high. Moreover, the area of productive mining lands that no longer fulfill their role is still increasing. In the Sokolov area, approximately 9250 hectares are affected by mining [19], while in the whole of Czechia, over 400 km2 have been transformed by mining [20]. In comparison, in Poland, approximately 70 thousand hectares were covered by mines and power plants. So far, over 35% has been reclaimed, mainly by afforestation [21]. Due to the reasons given above, growth conditions in degraded post-mining areas are harsh. It is important to note that those conditions may not be tolerated by all tree species. Therefore, the principal challenge for forest management in degraded areas is the evaluation and selection of suitable tree species composition, which, in addition to a predisposition to survive in harsh conditions, will improve soil quality [22,23] and produce bioenergy [24] or quality wood in the future. Selecting an appropriate tree species requires a multi-criteria evaluation that takes into account parameters such as economic efficiency, carbon stock, and the reduction of afforestation costs [25]. It is also crucial to consider the topography of the former mining landscape, including slope faces, as these factors influence both soil moisture and sunlight availability, which are essential for determining the suitable tree species [26].
In this context, Scots pine (Pinus sylvestris L.) is one of the most common species to be planted in degraded areas [27]. However, in the context of ongoing climate change, introduced (non-native) tree species show high potential for afforestation. For example, the black pine (Pinus nigra J. F. Arnold) is one of the most effective introduced species at post-mining sites, which combines resistance to climate extremes and timber production in poor habitats, including post-mining sites [28]. Therefore, after successful evaluation of production potential in a wide gradient of different soil conditions, including poor habitats, the black pine currently spans over 9.5 million hectares and is extensively cultivated beyond its native distribution range [29], which points to the high importance of the evaluation of the growth conditions of introduced tree species. However, most studies of introduced tree species have concentrated mostly on the production, biodiversity, and soil conditions of tree species plantations on post-mining sites. In general, most scientific work on post-mining areas has focused primarily on soil reclamation, land transformation, and biodiversity, which is essential in the case of recreating natural habitats in these areas [30].
Moreover, the importance of introduced tree species is currently highlighted by the ongoing climate change, resulting in the dieback of the main native tree species observed during the last several years [31]. The dieback predominately affects monocultures of native coniferous species, initially planted for their high-quality wood production. Scots pine is one of these receding tree species, which covers over 28 million hectares in Europe and is crucial for the wood industry, with various wood applications [32,33]. From an ecological perspective, Scots pine is considered a pioneer species because of its exceptional resilience to drought and the ability to thrive in harsh habitats. Despite that, there has been a rise in documented cases of Scots pine stand mortality [32,34,35,36]. In the event of future increases in Scots pine dieback, the wood industry may face a lack of quality pine timber in the next few decades. Therefore, finding a suitable substitute source of quality timber for the wood industry is crucial.
The lack of high-quality timber material can be partially eased by afforested post-mining sites, provided the afforestation is based on thorough research. Consequently, the current principal aim of forest management is to select the optimal tree species composition and consider multiple perspectives. The primary choice for substitution appears to be the replacement of major forest-forming species with those with high potential for wood production. In the case of Scots pine timber, the introduced pines, such as black pine (Pinus nigra J. F. Arnold) and the less common lodgepole pine (Pinus contorta Douglas ex Loudon) or ponderosa pine (Pinus ponderosa Douglas ex C. Lawson), which are possibly more resistant to the impacts of climate change, can be considered suitable alternatives. Therefore, the focus of this study is a comprehensive assessment of selected pine species, which are not native to Central Europe, in terms of stand characteristics and especially wood properties, and are crucial for the timber industry. For these purposes, the production parameters (dbh, height, stand volume increment, canopy coverage, etc.) of native Scots pine were evaluated comparatively to those of black pine, lodgepole pine, and ponderosa pine grown in the same soil conditions at post-mining sites. The partial aims were the evaluation of wood properties, such as: (i) wood density, (ii) volumetric shrinkage, and (iii) compressive strength.

2. Materials and Methods
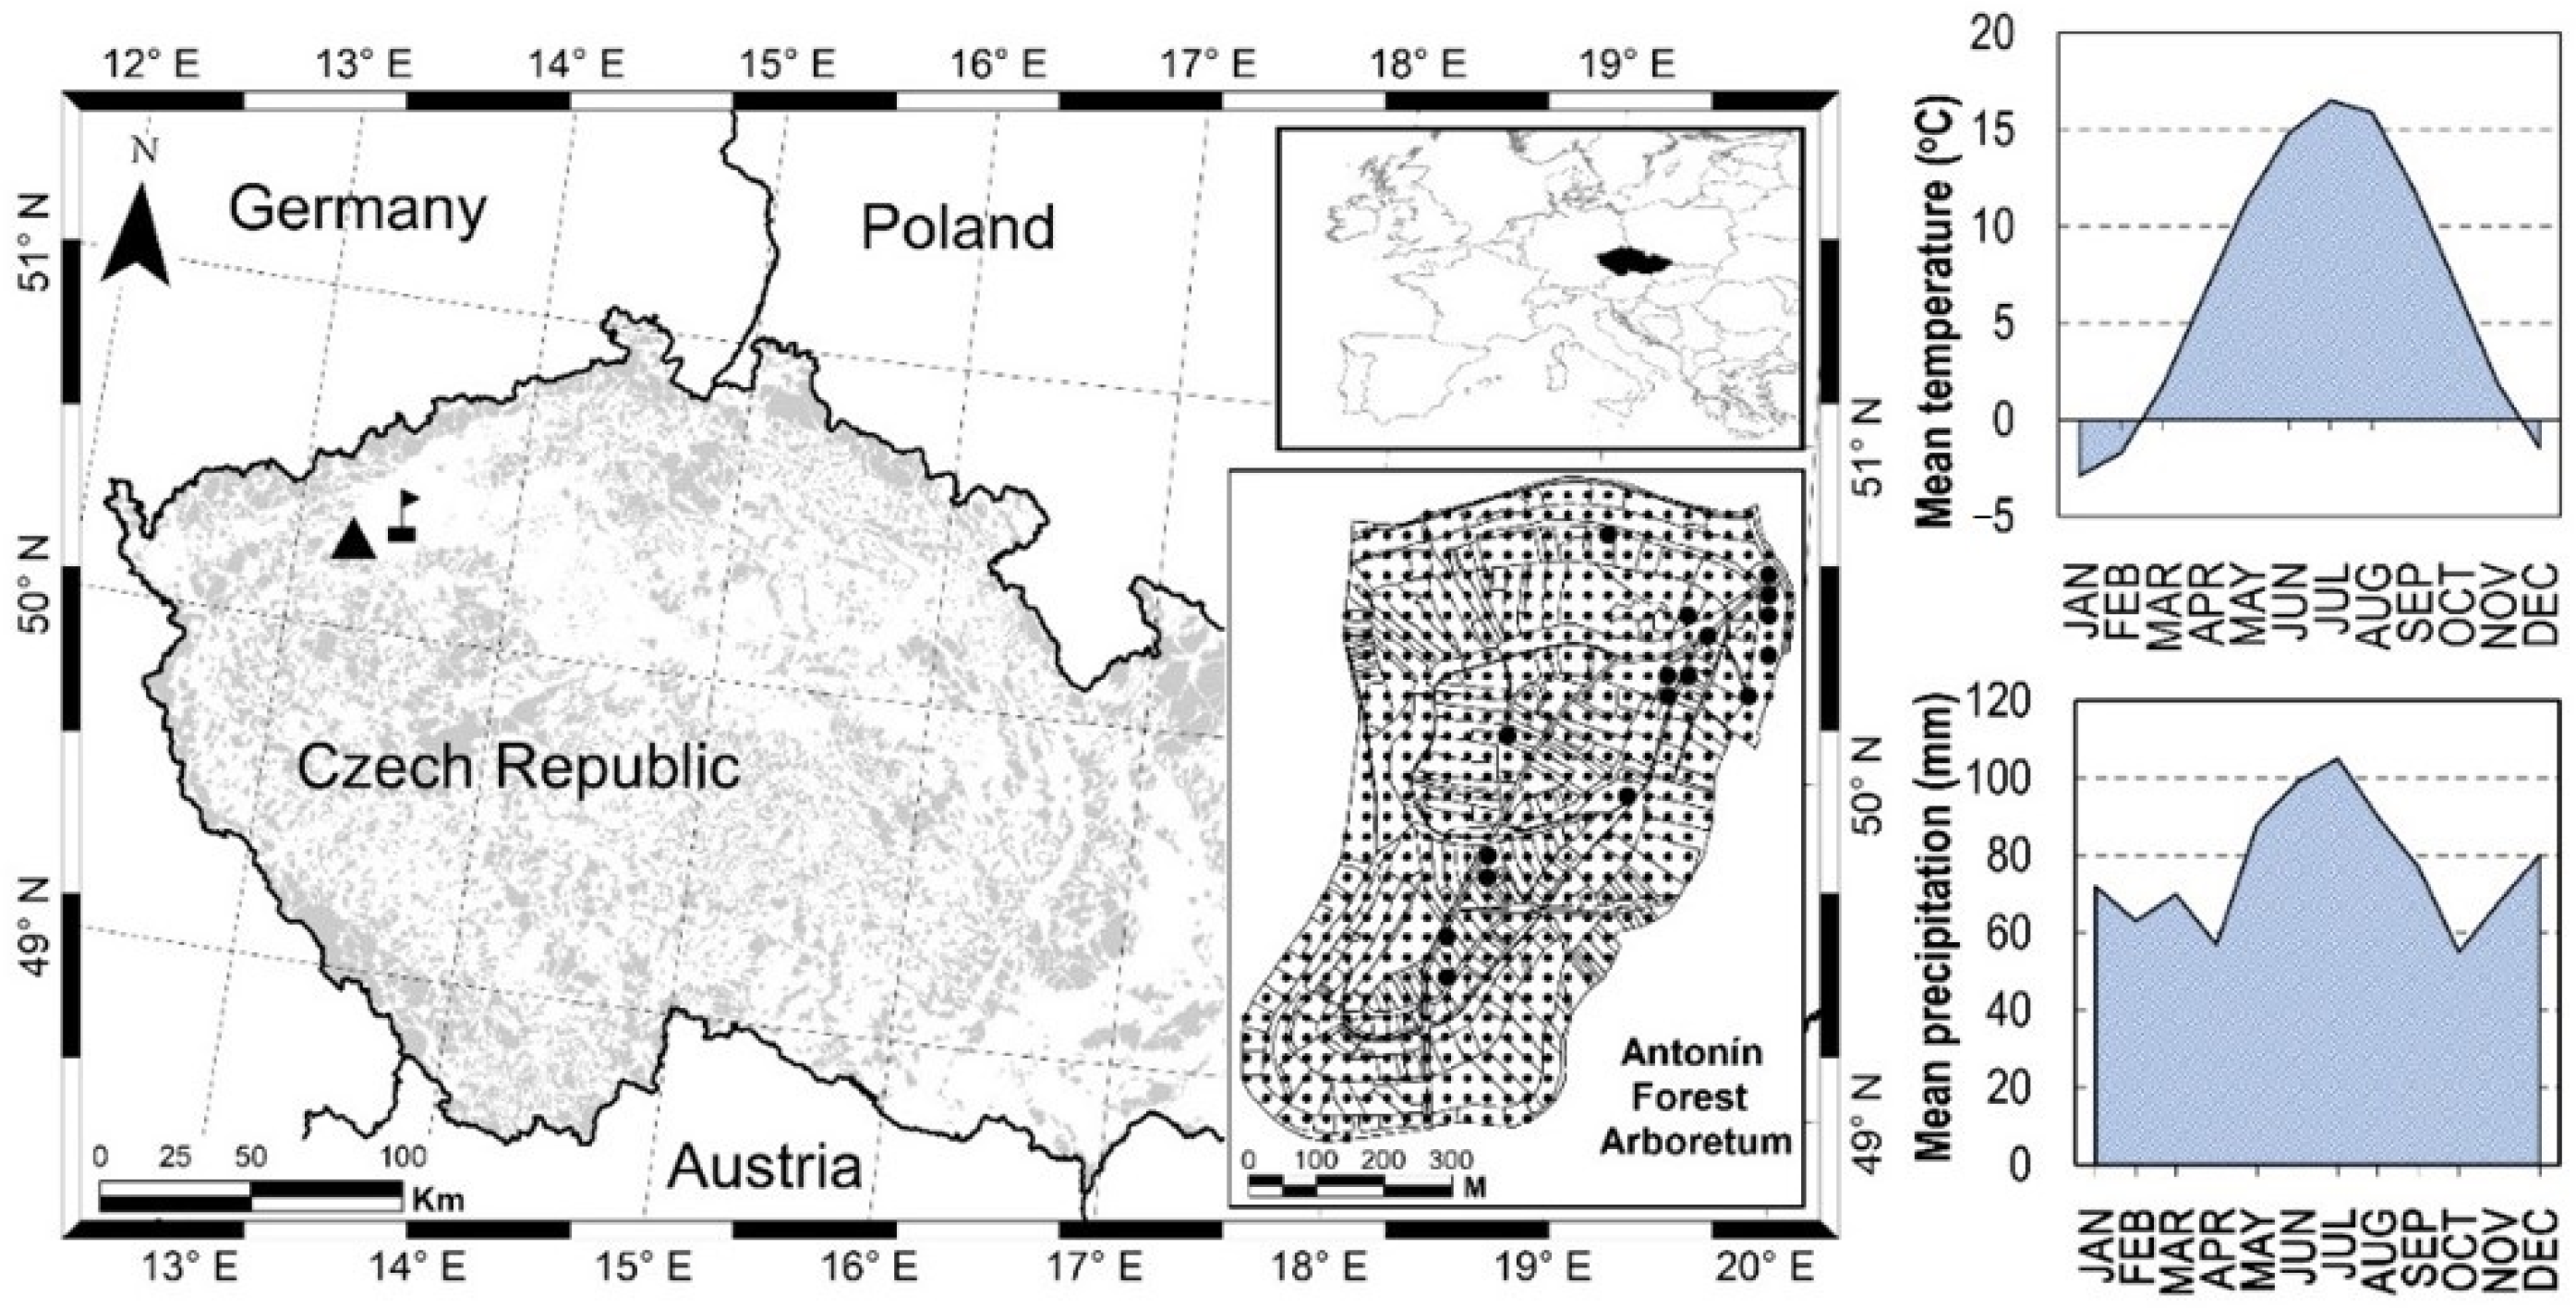
2.1. Study Area

The research area consisted of 22 permanent research plots (PRP) at the Antonín Forest Arboretum, located on the post-mining landscape of the Sokolov area in western Czechia (Figure 1). The afforested dump Antonín was created by backfilling the surface quarry. Coal mining in the Antonín mine occurred between 1881 and 1965, first underground and later through surface mining. In 1969–1974, large-scale forest reclamation and the planting of native and introduced shrubs and tree species occurred in an area of 165 ha. In the tree species composition, deciduous trees slightly predominate over conifers. Alder is the most represented, followed by pine, larch, linden, maple, and many other tree species. In terms of climate conditions, the long-term average annual temperature in the study area is 7.3 °C and the annual precipitation ranges from 327 to 658 mm, with an average sum of 611 mm per year (1975–2022) according to the Czech Hydrometeorological Institute’s Sokolov station (4 km southwest of Sokolov, 402 m above sea level). The vegetation period lasts between 220 and 227 days [37]. The region’s climate, classified as Cfb by Köppen [38], features warm, dry summers and cold, dry winters.

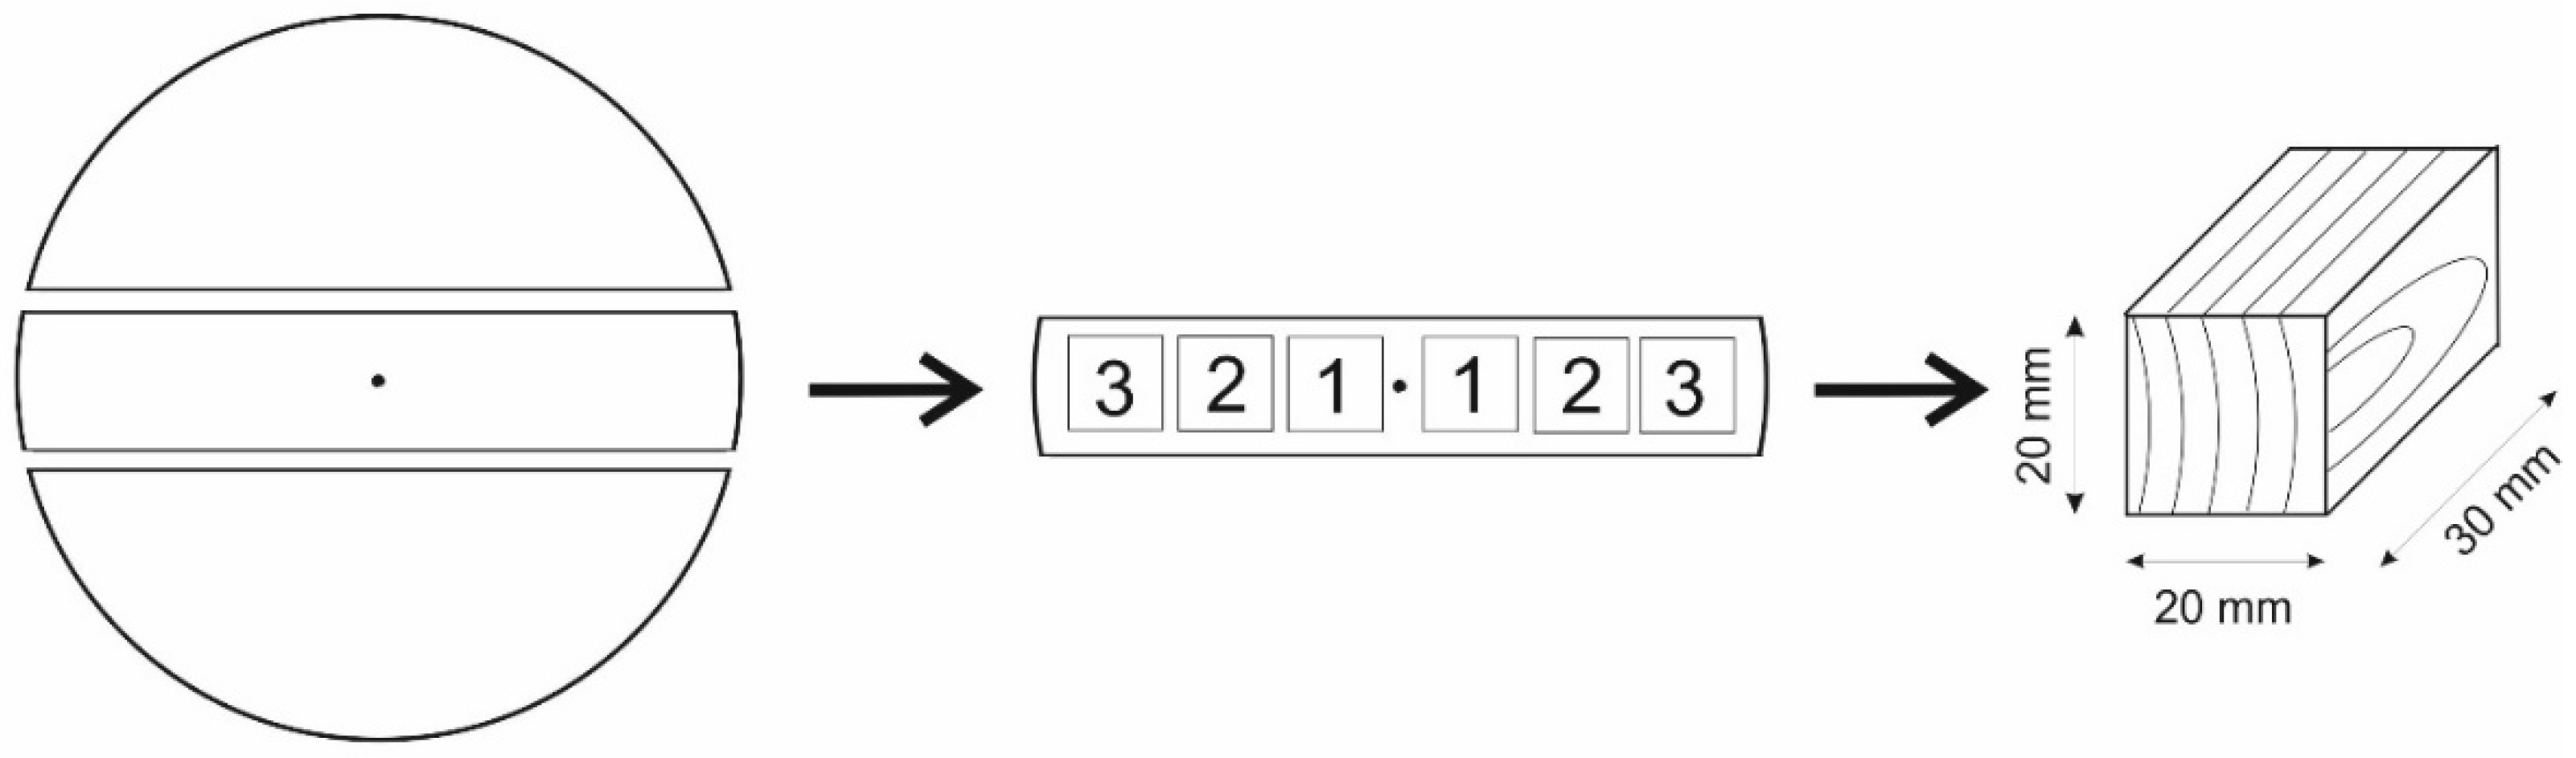
2.2. Data Collection and Determination of Properties

In terms of quantitative stand production parameters, the data collection took place across 22 PRPs, each measuring 10 × 15 m, during 2022–2023, with stands approximately 50 years old with monoculture forest stands of evaluated tree species. These plots were categorized into four variants based on monospecific pine tree species: one native species covering five PRPs and three introduced species covering twelve PRPs. The native species was Scots pine (P. sylvestris L.) and the introduced pines included black pine (P. nigra J. F. Arnold), lodgepole pine (P. contorta Douglas ex Loudon), and ponderosa pine (P. ponderosa Douglas ex C. Lawson). Five replicates were measured for most species. However, for P. ponderosa, only two plots per species were available due to their limited distribution and the historical fire outbreak in part of the area. FieldMap technology (IFER) was used to record the positions of individual trees with a diameter at breast height (dbh) of 4 cm or more, and their crown projection areas were measured in four directions. The dbh was determined with a Mantax Blue caliper (Haglöf, Sweden), and tree heights with a Vertex laser altimeter (Haglöf, Langsle, Sweden).
Regarding wood quality analyses, four model trees were selected and cut from each investigated pine species. The model trees were characterized by the representative height and diameter of all measured trees. Moreover, cut trees were free of visible defects, i.e., curves and decay. In the next step, a knotless log from the bottom part of the stem was cut. Then, the log was divided into boards using a band saw, and from those boards, the central section was processed to produce the test specimens for the evaluation of selected wood properties: wood density, shrinkage, and compressive strength. The specimens for wood properties evaluation were 20 × 20 × 30 mm and were collected from three sections along the cross-section of the stem from pith to bark direction, strictly following the radial and tangential orientation of the samples. The samples of the highest quality, characterized by a flawless shape, a tangential fiber direction aligned with the sample axis, and a tangential arrangement of annual rings towards one edge, devoid of any visible wood defects such as knots or rot, were identified and chosen for subsequent testing. Samples that did not meet the selection requirements were eliminated from the study. In total, 546 test samples were prepared for the tests (Figure 2).
The basic wood density (r) was set as the ratio of oven-dry mass weight (m) and volume (V) of the test specimen moisture content over fiber saturation point, using the standard ČSN 490108 [39] according to Equation (1):
ρ = m0/Vmax (kg m−3)
Volumetric shrinkage (β) was set as the changes in test specimens’ volume (V), related to altering moisture content from fiber saturation point to oven-dry state, using the standard ČSN 490128 [40] according to the following Equation (2):
β = (Vmax − Vmin)/Vmax × 100      (%)
From the mechanical properties, the compressive strength along fibers was tested. For that reason, the test specimens were air-conditioned in a standardized environment (air temperatures of 20 ± 2 °C and air humidity of 65 ± 5%) according to ČSN 49 0103 [41], until an equilibrium moisture content of 12% was reached. The maximal load (ultimate stress) was measured using a universal testing machine, TIRAtest 2850 (Tira GmbH, Schalkau, Germany). The procedure complies with the standard ČSN 490110 [42]. Compressive strength (σ) was set as a ratio of maximal load (Fmax) and the test specimen cross-section area and Equation (3) was used:
σ = Fmax/(a × b) (MPa)
where a and b represent test specimen transversal dimensions in cm.

2.3. Data Analysis

To evaluate stand production potential, several indicators were calculated: dbh (mean quadratic diameter at breast height), h (mean height), f (form factor), V (stand volume), HDR (height to diameter ratio), MAI (mean annual increment), CC (canopy closure), and relative SDI (stand density index). The CC was calculated based on the projection area of the tree crowns of the stand component, according to Crookston and Stage [43]. The relative SDI was calculated as the ratio of the actual value of the stand density index to its maximum value. The SDI represents the theoretical number of trees per hectare, if the mean quadratic diameter of the stand component is equal to 25 cm [44]. The maximum SDI value was derived from the model of yield tables [for pine 990 trees; [45]].
Statistical analyses were performed using STATISTICA software (version 13.4.0.14, TIBCO Software, Palo Alto, CA, USA). Stand production parameters, wood density, volumetric strength, and compressive strength were statistically compared between four pine species. Initially, the data were tested with the Shapiro-Wilk normality test and the Bartlett variance test. If both conditions were satisfied, the differences between parameters were analyzed using analysis of variance (ANOVA), followed by the Tukey HSD test. This test identified individual species differences and assessed property distribution around the radius, with significantly different variants marked by distinct characters (significance level α = 0.05). If normality and variance were not met, the investigated characteristics were tested by the nonparametric Kruskal-Wallis (KW) test. Additionally, relationships between tested properties were evaluated using a linear regression model. A situation map of the study area with highlighted permanent research plots was made in ArcGIS 10.6.1 (Esri, Redlands, CA, USA).

3. Results

3.1. Production Potential
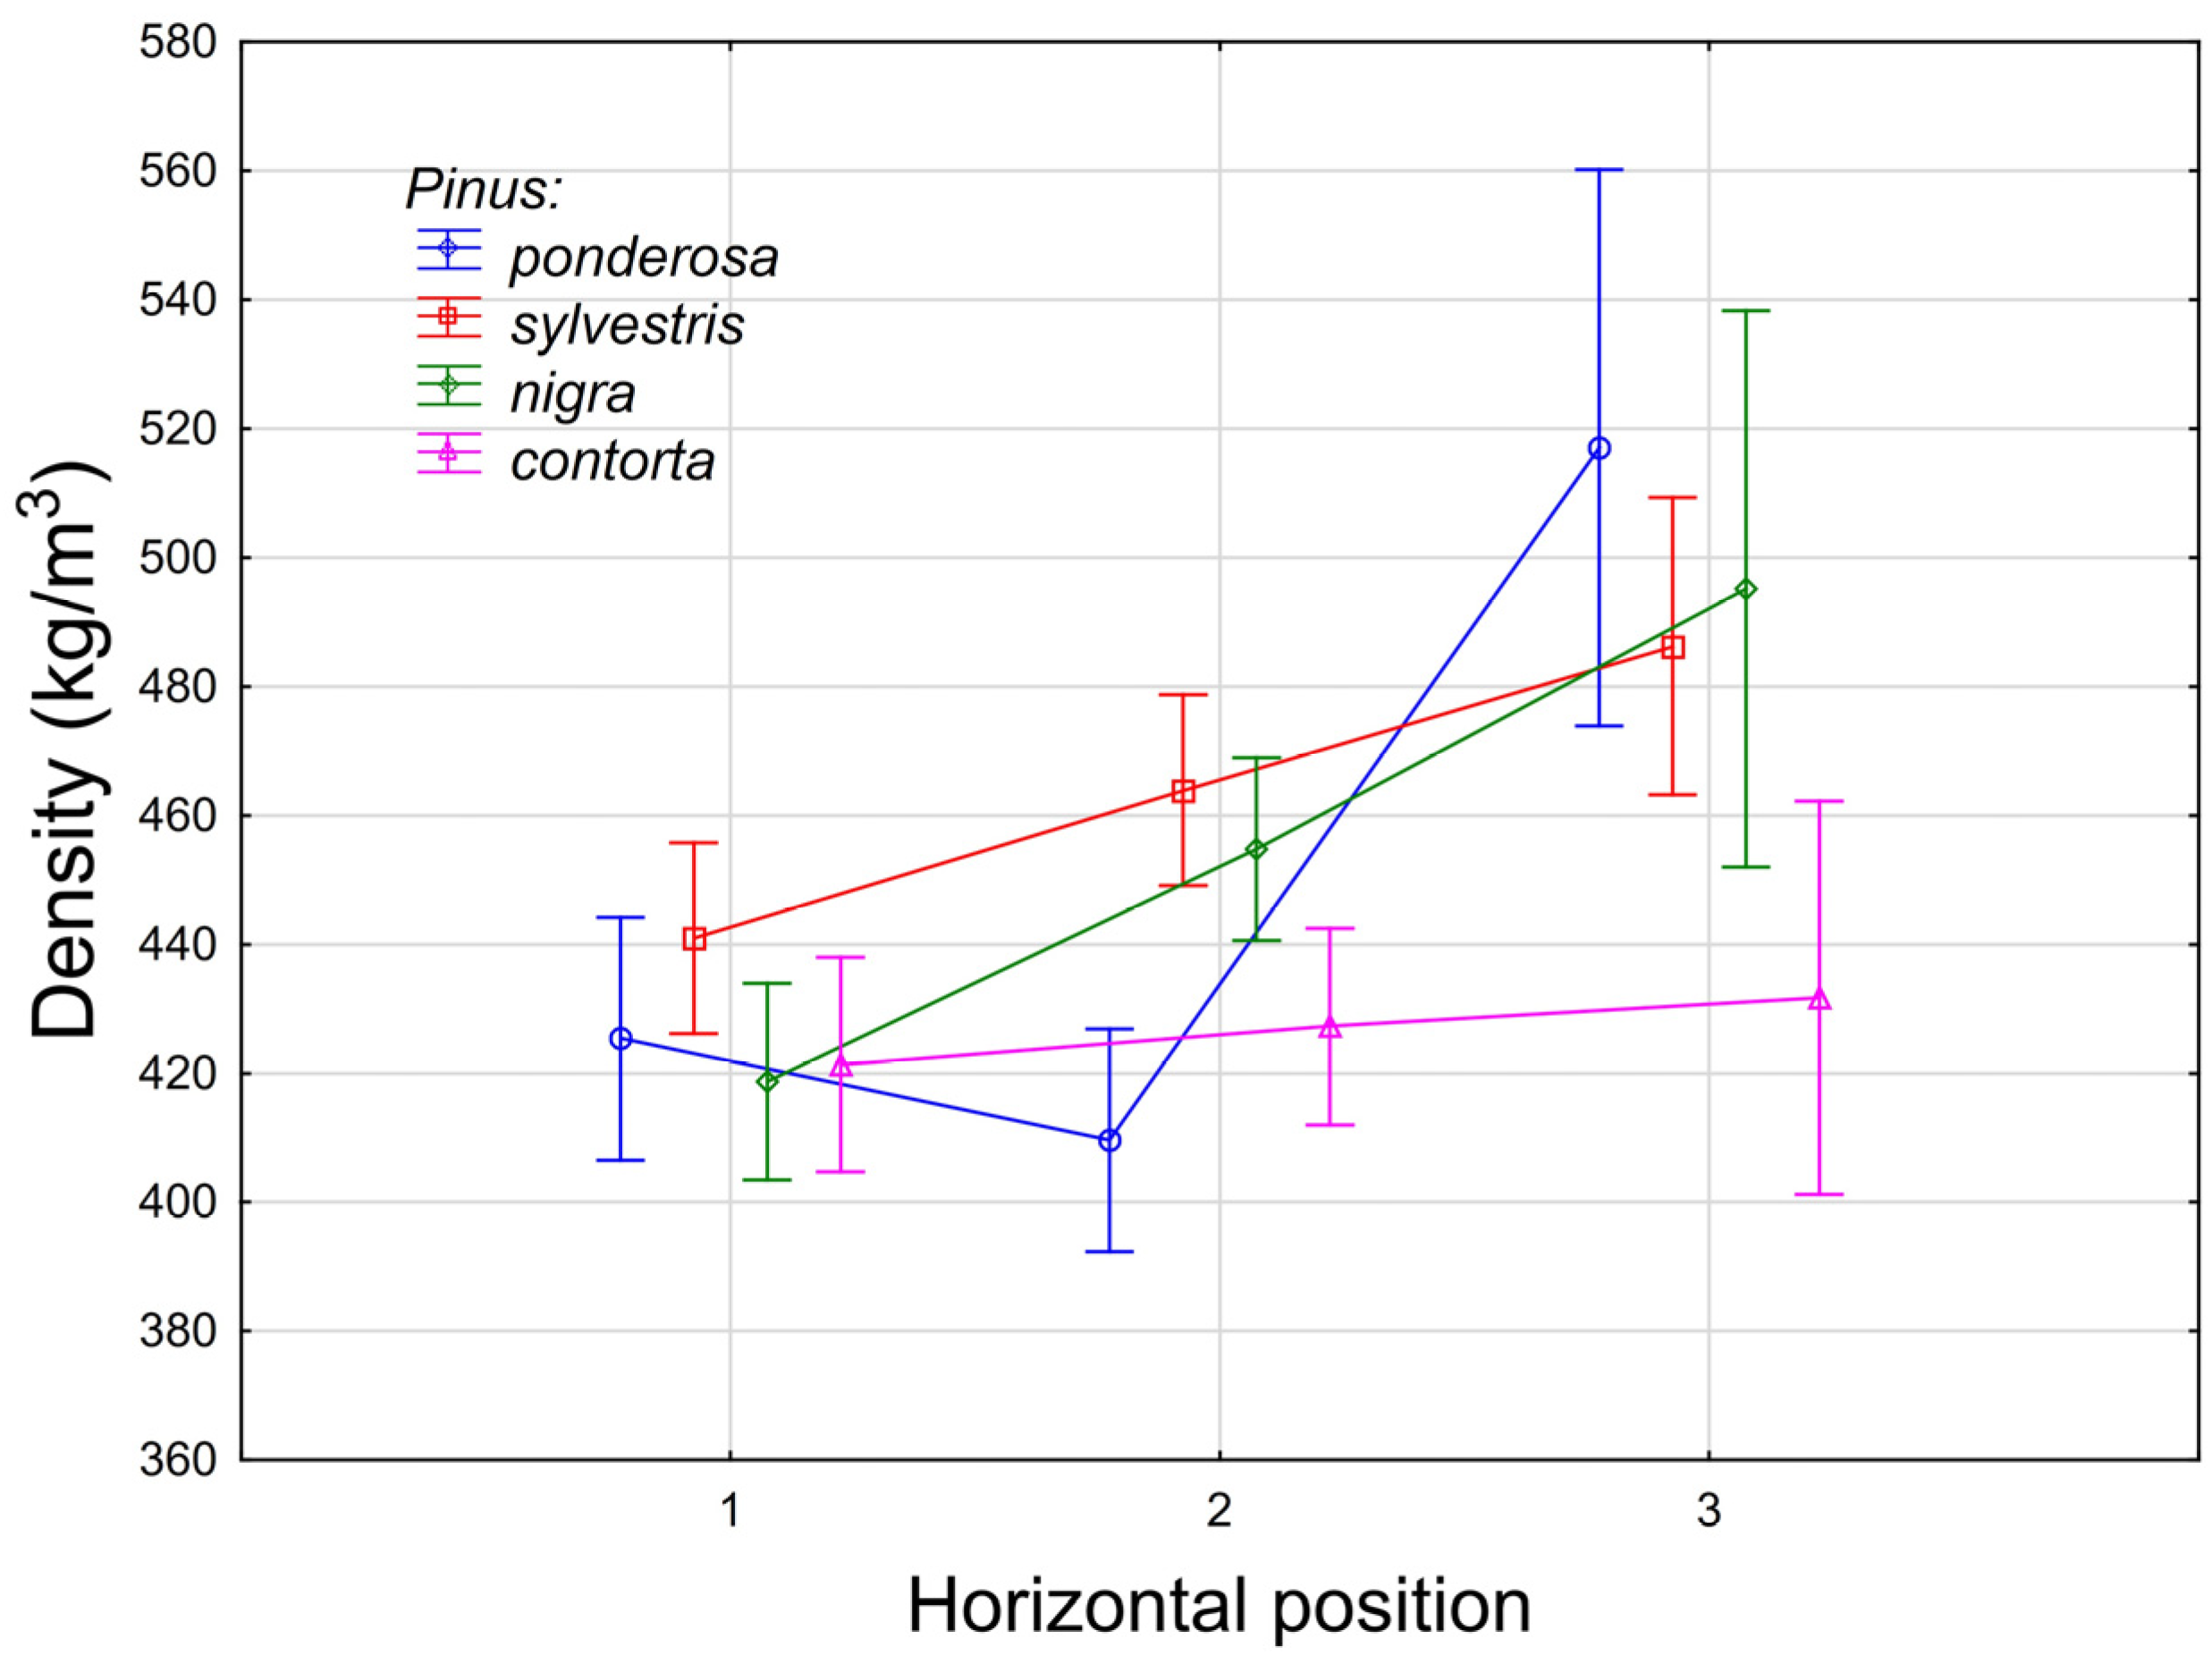
The individual pine species showed significant (p < 0.05–0.001) differences in production parameters, except for diameter at breast height (p = 0.086; Table 1). P. sylvestris had a significantly greater height (17.95 m) compared to the other pine species (13.73–14.76 m; p = 0.046). The form factor ranged from 0.439 for P. nigra to 0.486 for P. ponderosa. The slenderness coefficient, which is an indicator of forest stand stability, was significantly (p < 0.001) higher in P. sylvestris and P. nigra compared to P. contorta and P. ponderosa. In terms of production, the significantly (p = 0.038–0.043) highest stand volume (376 m3 ha−1), as well as the mean annual increment (8.18 m3 ha−1 yr−1), was found in the native P. sylvestris. No significant differences were found in these parameters among the other pine species (p > 0.05). Regarding stand density indicators, the significantly (p = 0.005–0.011) lowest stand density index (0.52) and crown closure (69.1%) were measured in stands with P. contorta.

3.2. Wood Density

The importance of native Scots pine for industry was clearly defined by its wood density. The native Scots pine obtained the highest wood density value, 458 kg m−3 (Table 2), of the tested pine species. Another European pine species—black pine, which is native to the Mediterranean (Southern Europe), lagged with 441 kg m−3. However, this difference is not statistically significant, and these two pine species can, therefore, be viewed as similar if wood density is used as a criterion. Ponderosa pine and lodgepole pine, the remaining two species native to North America, achieved a similar value for wood density (425 kg m−3), significantly lower than Scots pine wood density. Nevertheless, those two pine species cannot be distinguished from black pine wood density in statistical tests. Wood density showed low variability, ranging from 8.6% to 12.6%, with minimal differences among tested pine species.
We also attempted to compare the tested pine species from the point of view of wood properties changes in time, i.e., properties distribution in a radial direction from the pith up to the bark. Figure 3 shows the wood density distribution in the stem and its trend for the pine species in the pith-to-bark direction. An increasing trend, i.e., the highest value close to the stem periphery, is clear for all pine species, especially Scots pine and black pine. In the case of lodgepole pine, although the trend is growing, it is not statistically significant.

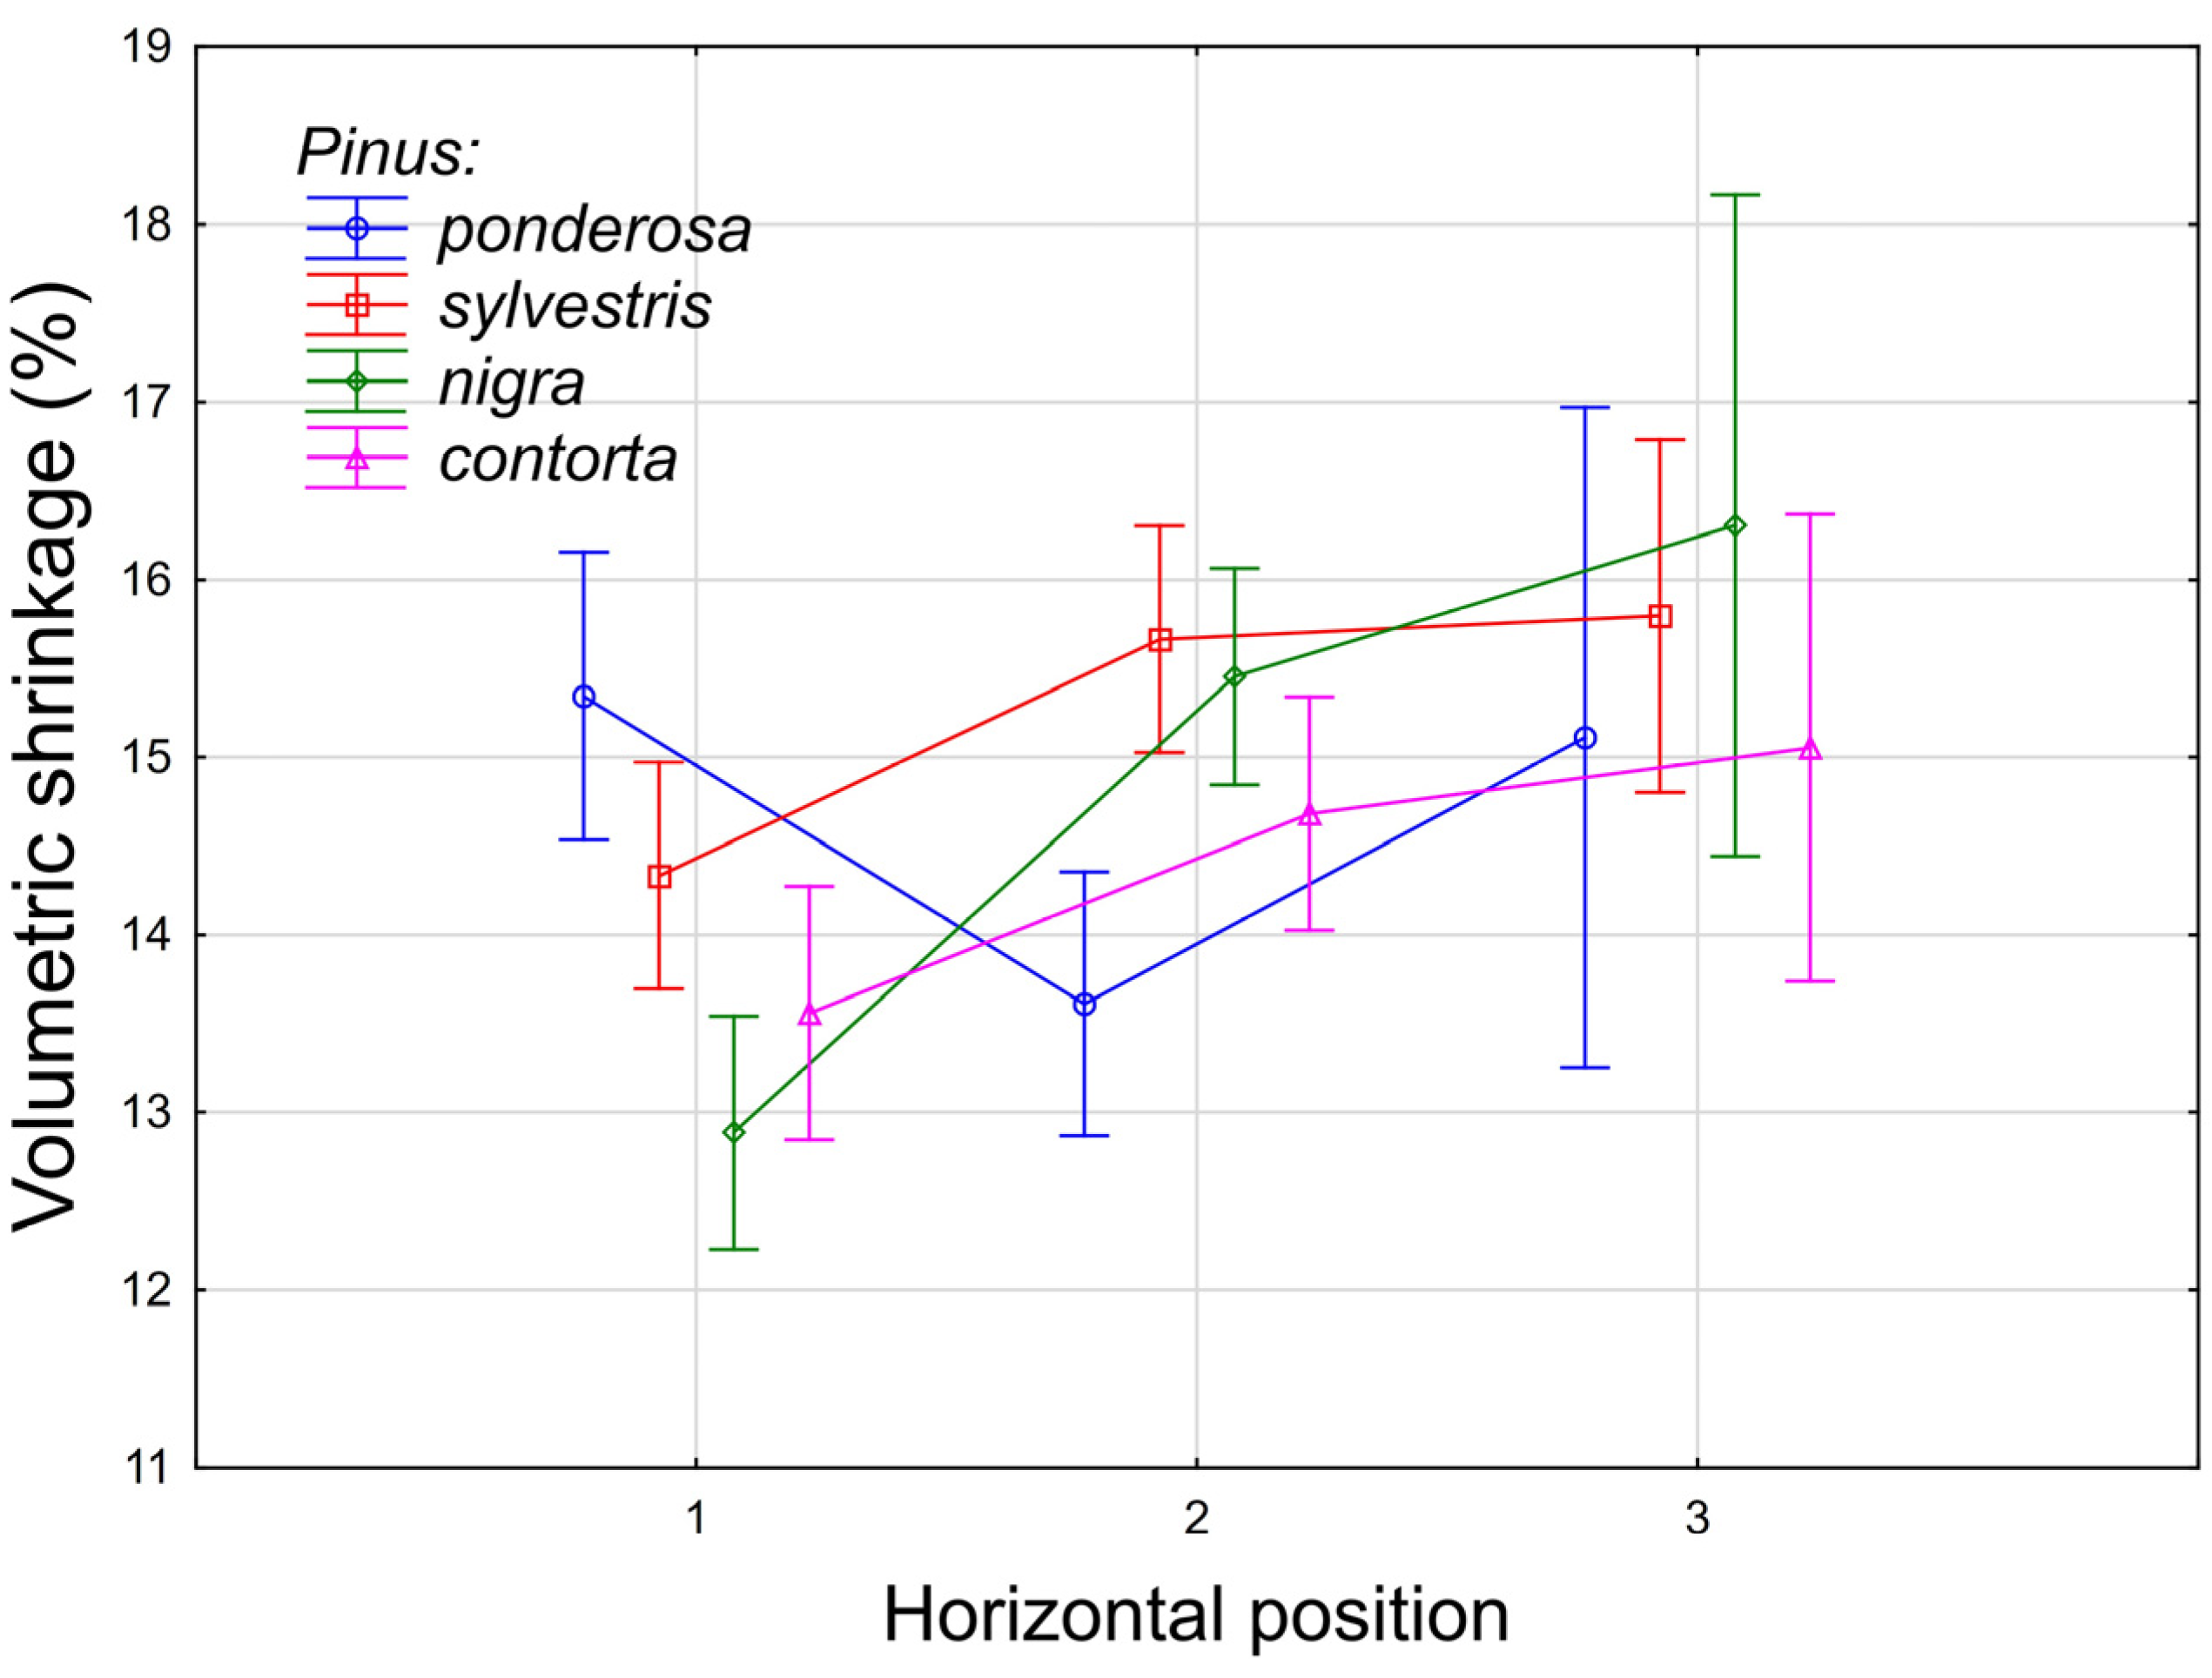
3.3. Volumetric Shrinkage

Volumetric shrinkage was another crucial physical property we employed to find differences in size changes among the pine species. There are no significant differences in volumetric shrinkage among the evaluated pine species (Table 3). The highest value was achieved for Scots pine (15.1%), while the remaining pine species achieved almost the same shrinkage values (14.4% or 14.3%). Statistical analyses showed no significant difference, and, concerning wood shrinkage, the evaluated species can be considered similar. The variability of the characteristic was within the range common for this property, with no relevant differences among species.
The radial distribution of volumetric shrinkage within the stem does not show a clear trend due to the high variability in individual positions (Figure 4). The only exception is black pine, with an increasing value of volumetric shrinkage towards the stem periphery.

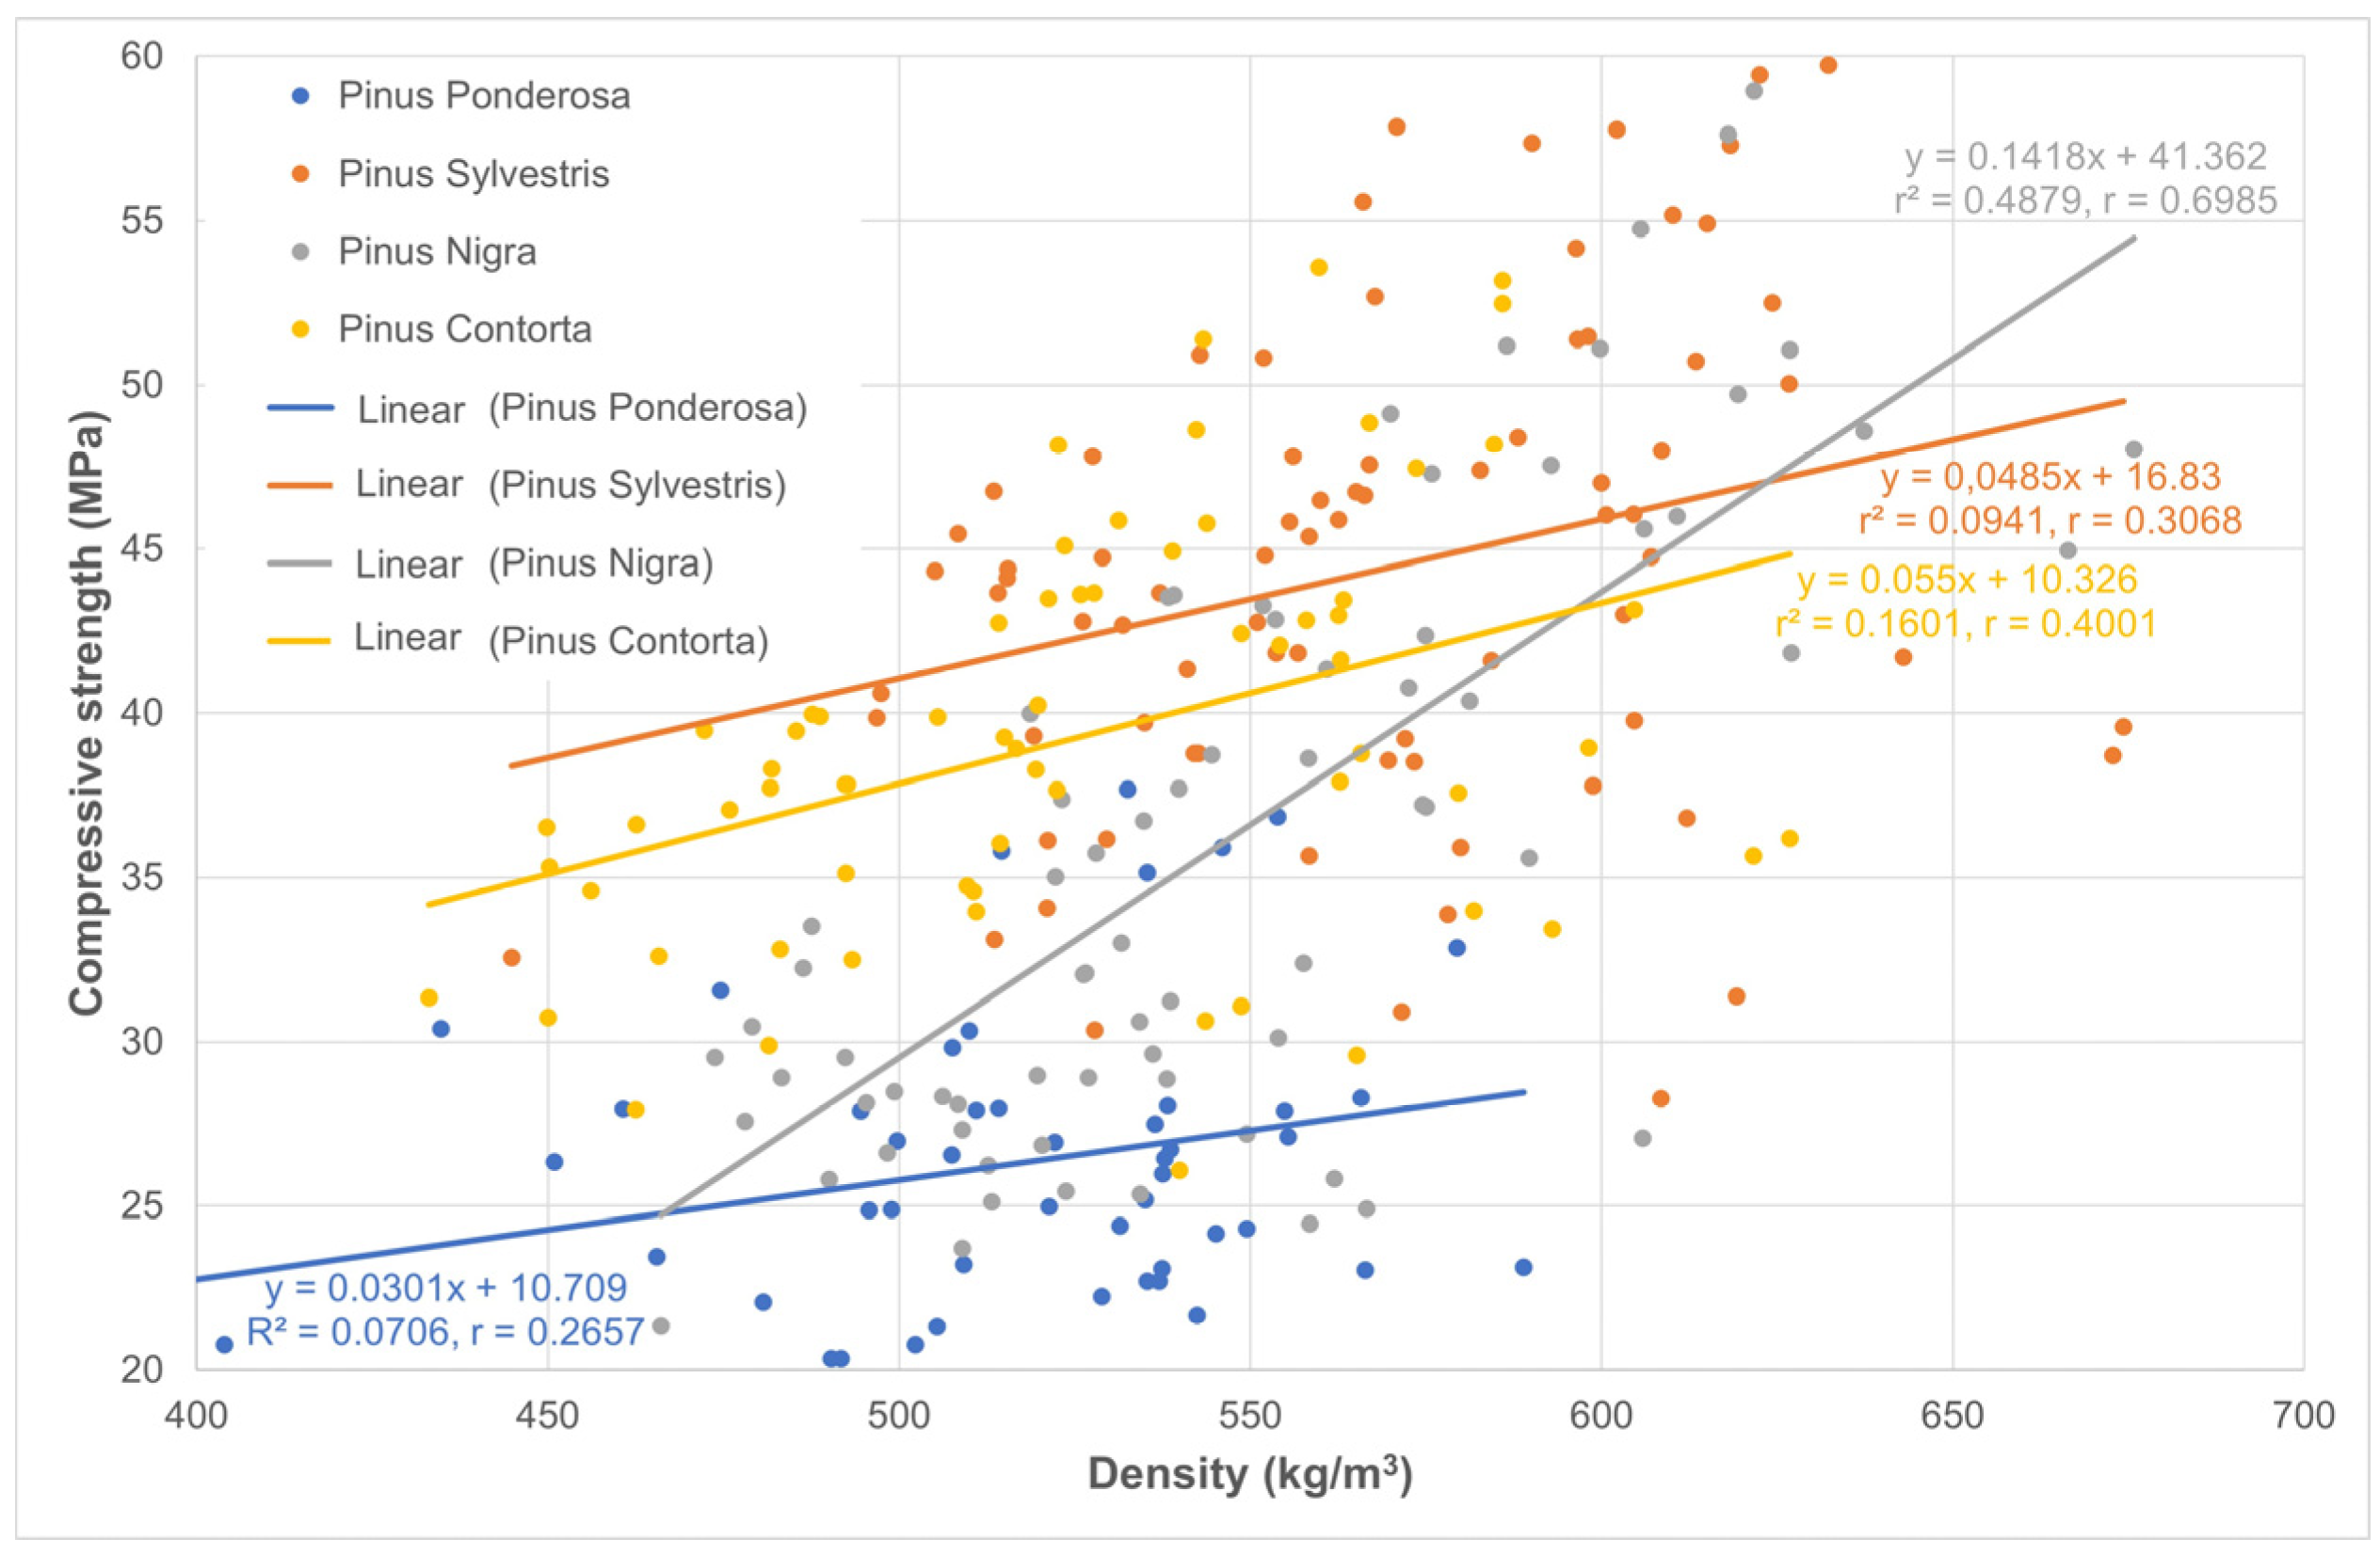
3.4. Compressive Strength

Scots pine achieved the highest compressive strength value along the grain (44.2 MPa). It was statistically significantly different from lodgepole pine, with a value of 39.3 MPa (Table 4). The relatively high density value of black pine did not have a positive effect on the compressive strength value (36.5 MPa), and it ranked third among the tested species. However, statistical tests have proven that the value is comparable to that of lodgepole pine. Ponderosa pine has the lowest compressive strength (26.2 MPa), corresponding to the low density value obtained for this species. It is statistically significantly different from the value achieved for black pine. The variability of the characteristic ranged within the values common for this characteristic, except for black pine, which achieved a 10% higher coefficient of variation than the other pine species.
The compressive strength distribution, related to the horizontal position in the stem, shows an increasing trend from the center of the stem to its outer part (Figure 5). The exception is black pine, where the strength increases steeply towards the bark and varies significantly from one part of the stem to another. Thus, the highest strength is near the bark, and conversely, the lowest strength is near the pith.

3.5. Relationships among the Properties

Figure 6 presents a correlation between selected physical properties and mechanical properties. Particularly, a strong relationship is assumed between wood density and compression strength. For volumetric shrinkage, the dependence on wood density is statistically significant but relatively low (Figure 6). The highest coefficient of correlation (r) was obtained for black pine (r = 0.54). For the remaining pine species, the coefficients were lower and similar to each other. Wood density cannot be regarded as a reliable indicator of shrinkage in this instance. Concerning compression, the strength of the correlation to wood density was low for most of the tested pines (Figure 7). The highest coefficient of correlation was found for black pine (r = 0.70). In relation to the remaining pine species, the coefficient was noticeably lower, and the wood density proved to be an insufficient factor for explaining the observed compressive strength.

4. Discussion

High productivity and outstanding wood quality make Scots pine an essential commercial tree species widely used in European forestry and the wood industry [32,33]. Yet, ongoing climate change effects frequently cause a dieback of forest-forming native tree species, which is especially visible in monocultural coniferous stands. In this study, the wood productivity and quality, based on the density and selected mechanical properties of Scots pine, were compared with three non-native pine species. The stand volume of the examined species ranged from 157 m3 ha−1 for lodgepole pine to 356 m3 ha−1 for Scots pine in 50-year-old stands growing in the same conditions in post-mining areas. Comparative production analysis can be conducted by referencing findings from afforested oil shale reclamations in northeast Estonia. There, the production of 40-year-old P. sylvestris stands ranged from 167 to 291 m3 ha−1 [46]. Vacek et al. [47] compared the stand volume of P. sylvestris on reclamation sites (318–371 m3 ha−1) to original forest sites (370–500 m3 ha−1) in several areas across Czechia, which showed reduced productivity in post-mining sites likely because of lower soil fertility. Regarding the productivity of other tested tree species, ponderosa pine appears to be the second-best pine tree in our study (335 m3 ha−1). Other studies from Czechia stands have also documented the high vigorous potential of P. ponderosa, when, at the age of 35 years, the stand production reached 430 m3 ha−1. We also found a low productivity potential of P. strobus—112 m3 ha−1 [48]. The high output of Scots and ponderosa pine is also related to the high production of biomass, which is crucial regarding carbon sequestration and climate change mitigation [31,49].
After the production parameters were determined, the physical characteristics of the wood were analyzed and found to be one of the chief determinants of its quality. Regardless of the tree species or type of wood, density is universally recognized as the most crucial factor in determining its mechanical and other physical properties [50,51]. The collected results for Scots pine wood density (458 kg m−3) were slightly higher compared to standard values previously reported for this region (440 kg m−3), which were found in standard forest conditions [52]. Moreover, compared to studies from different areas, our results were higher than the Scots pine wood density provided by other authors from standard forest stands [53,54,55,56]. The basic density of non-native pines was lower in the native one of every tested species. However, the second highest density values were found for black pine (441 kg m−3) with no significant differences compared to Scots pine in identical conditions. The highest similarity of basic density was found in the research of Guler et al. [57], with values of 464 kg m−3. Nevertheless, significantly higher results were noticed in Poland by Pazdrowski [58], at 664–829 kg m−3. This result comes from 91-year-old forest stands with unknown previous land use and stand history. The results from different regions—and provenances—were higher than in our research, but from older stands [59,60]. Therefore, it is necessary to mention that the difference between our results and the literature findings could be caused by the different ages and geographic locations of the tested stands. According to Sable et al. [61], lodgepole pine may have a higher wood density than Scots pine. However, this statement was not confirmed in our results, where we compared wood samples from the same stands. In this study, the basic density for ponderosa and lodgepole pines was similar, at 425 kg m−3. Our findings cannot be compared with other results because there are no findings for the wood properties of this introduced species. In its native range of distribution, the wood density of ponderosa pine varies from 380 to 464 kg m−3 [62,63,64]. The basic density obtained from samples collected from lodgepole pine was even higher than the value from native areas reported by Alden et al. [63] or FPL [65]; i.e., 380 kg m−3.
Resistance to shape change is of the utmost importance when using wood, particularly in timber construction. Therefore, the understanding of shrinkage or changes in wood size due to moisture content fluctuation below the fiber saturation point [66], will have a substantial effect on future wood applications. Typically, wood with lower shrinkage is considered to be of higher quality [67]. Our results did not reveal significant differences among the tested pine species, so their wood is interchangeable regarding shrinkage. In general, there are no ostensibly fundamental differences among commercial pine species [65]. The highest value for shrinkage was achieved for Scots pine (15.1%), and the results were higher than those reported by other authors, i.e., 10.7% [68], 11.2%–12.4% [69], or 13.1 [70]. In the case of non-native pine species, the volumetric shrinkage was similar and ranged from 14.3% to 14.4%. Although the values were higher than those found in the literature—10–12.2% for black pine [57,71,72], 9.7% for ponderosa pine, and 11.1% for lodgepole pine [63,65].
The only tested mechanical property of wood was compressive strength. The compressive strength range for Scots pine varies from 30 to 70 MPa [73,74]. Our results for Scots pine agree with the literature. The compressive strength of Scots pine reached the highest value among all examined species. It was statistically different from lodgepole pine. However, from a practical point of view, the difference was not significant. The acquired results for lodgepole pine were higher than values reported in native areas (37 MPa), according to FPL [65]. Despite the high-density value of black pine, the value of compressive strength (36 MPa) was not strongly correlated with it. These results are comparable to those of Zeidler [71]. Yet, in terms of statistical tests, the value was comparable to lodgepole pine and Pazdrowski’s [58] results, which ranged the compressive strength of black pine from 32 to 54 MPa. The lowest value was attained for ponderosa pine (26 MPa), which directly corresponded to the low density value obtained for this species. Moreover, the results were also lower than in its native areas [63,65].
The pattern of density and mechanical properties fluctuating in a radial direction, from the central part of the stem outwards, was described in detail for softwoods in Panshin and Zeeuw [75]. The lowest value can be found close to the pith, when it begins to grow, or the value drops first and then rises. The highest values are obtained in the part close to the bark. This radial density profile in wood density was verified in a comprehensive study by Schimleck et al. [76]. For mechanical properties, this distribution was proven by Hayatgheibi [77] in a study on lodgepole pine, by Pazdrowski [58] in a study of black pine, and by Vaughan et al. [62] in a study of ponderosa pine. The reasons for a pattern like this can be found in the way the conifers grow over time, juvenile zone occurrence, and other factors [78]. There is a noticeable difference between the wood density value in the central stem and the observable peripheral part, especially for black pine, ponderosa pine, and Scots pine. A comparable pattern of wood density was observed in the studies of black pine by Dias et al. [59] and ponderosa pine by Vaughan et al. [79]. For compressive strength, the growing trend is striking in the case of black pine. For other tested pine species, the trend was not as predictable.
It is expected that density has a positive effect on mechanical properties [67,80]. Such a positive correlation was proven in a study by Dias et al. [81] for black pine wood, in the research of Fernandes et al. [82] for Scots pine wood, and by Mackes et al. [83] for ponderosa pine wood. The highest r2 = 0.54 (coefficient of determination) for the dependence of compressive strength on wood density was reached in black pine wood, which was relatively low in contrast to black pine in the study of Guler et al. [57], at r2 = 0.6327. The impact of wood density on shrinkage turned out to be low. Shrinkage is also thought to depend on density, with higher density often leading to greater shrinkage [64]. However, this relationship is complex, and some researchers have suggested that factors other than density may play a role [84,85] as a direct correlation between density and shrinkage has not always been observed. This was the case in our study.
Presently, forestry is facing the legitimate problem of mitigating the ongoing climate change. On the one hand, expanding the forest cover and maintaining its sustainability are key factors for mitigating climate change effects [13]. On the other hand, foresters need to fulfill the productive function of the forestry sector, thus providing an appropriate amount of quality wood for trading. In the face of the mass dieback of forest-forming species [15,31,34], one of the primary objectives of forest management is to carefully choose the most suitable composition of tree species while considering various perspectives. In this study, we focused on evaluating only the potential of the quality wood production of non-native pine species planted in identical conditions, similar in age, and under the same management on poor forest reclamation sites, which could be a limiting factor for trees and wood tissue development. Based on the analyzed parameters, the best species to replace Scots pine seems to be black pine. However, the suitability of introduced pine species must be considered from the perspective of growth reactions to climatic extremes and their resistance against growth events, which must be evaluated in further studies. After considering these parameters, including wood quality, it is possible to responsibly introduce selected pine species to Central European conditions, considering changes in climate and forest management. For all tree prescriptions, tree species should be planted as a diverse mix across the landscape, not in single-species rows or blocks [26]. However, it could be expected that wood quality parameters may differ according to site and climate conditions and within the age of the stands. Therefore, these results should be confirmed in future studies in different parts of Europe with respect to local specifications.

5. Conclusions

For this study, the selected wood properties (physical and mechanical) of Scots pine and three non-native pines were evaluated to find a potential substitute species for native forest-forming pine in the specific conditions of post-mining sites. Among all tested species, the best results and properties were attained for native Scots pine. In the case of a potential substitute, a clear answer was not found for wood quality parameters. The highest wood density was obtained for black pine. Since wood density is the chief parameter for wood utilization, it may be a good proposition for the timber industry. However, when we considered mechanical properties, the highest resistance to compressive strength was noticed for lodgepole pine. The lowest potential for Scots pine substitute in Czechia was envisioned for ponderosa pine, which reached the lowest value in all tests.
In summary, if we consider the accomplishment of the non-native pine species in terms of the introduction, i.e., their ability to produce similar or possibly better wood quality compared to their native areas, it can be stated as successful since most of the tested properties were at least comparable to figures in native areas. Based on its high wood density, black pine could be particularly suited for heavy construction, outdoor applications, and products with a higher added value. Meanwhile, lodgepole pine, with its strong compressive strength, may be ideal for use in structural components or load-bearing applications. Ponderosa pine is recommended for silviculture in areas where the primary goal is to maximize biomass production, particularly for the generation of wood chips. With increasing age, properties were also growing in all tested pine species, but it worked only for wood density and compressive strength. The growing trend is apparent, especially for black pine. The relationship among tested properties was statistically significant, but the correlation was considerably low, primarily for volumetric shrinkage. Due to the limited range of the study, future tests in different areas and growth conditions should be performed to confirm these results.

Author Contributions

Conceptualization, Z.V., A.Z., J.C.; methodology, Z.V., A.Z., J.C.; validation, Z.V., A.Z., J.C., V.B., K.T., A.T.; formal analysis, Z.V., A.Z., V.B.; investigation, Z.V., A.Z., J.C.; resources, Z.V., A.Z.; data curation, Z.V., A.Z.; writing—original draft preparation, Z.V., A.Z., J.C., V.B., K.T., S.V., A.T.; writing—review and editing, Z.V., A.Z., J.C., V.B., K.T., S.V., A.T.; visualization, A.Z., Z.V.; funding acquisition, Z.V., J.C., A.Z. All authors have read and agreed to the published version of the manuscript.

Funding

The research was financially supported by the Ministry of Agriculture of the Czech Republic, institutional support MZE-RO0123.

Data Availability Statement

Data are contained within the article.

Acknowledgments

We would like to acknowledge Jitka Šišáková (an expert in the field) and Richard Lee Manore (a native speaker) for checking the English of this manuscript.

Conflicts of Interest

The authors declare no conflicts of interest.

References

  1. Grimm, N.B.; Grove, J.M.; Pickett, S.T.; Redman, C.L. Integrated Approaches to Long-Term Studies of Urban Ecological Systems. In Urban Ecology; Marzluff, J.M., Ed.; Springer: Boston, MA, USA, 2008. [Google Scholar] [CrossRef]
  2. Lanz, B.; Dietz, S.; Swanson, T. The Expansion of Modern Agriculture and Global Biodiversity Decline: An Integrated Assessment. Ecol. Econ. 2018, 144, 260–277. [Google Scholar] [CrossRef]
  3. Olofsson, P.; Kuemmerle, T.; Griffiths, P.; Knorn, J.; Baccini, A.; Gancz, V.; Blujdea, V.; Houghton, R.A.; Abrudan, I.V.; Woodcock, C.E. Carbon Implications of Forest Restitution in Post-Socialist Romania. Environ. Res. Lett. 2011, 6, 045202. [Google Scholar] [CrossRef]
  4. Riggio, J.; Baillie, J.E.M.; Brumby, S.; Ellis, E.; Kennedy, C.M.; Oakleaf, J.R.; Tait, A.; Tepe, T.; Theobald, D.M.; Venter, O.; et al. Global Human Influence Maps Reveal Clear Opportunities in Conserving Earth’s Remaining Intact Terrestrial Ecosystems. Glob. Chang. Biol. 2020, 26, 4344–4356. [Google Scholar] [CrossRef] [PubMed]
  5. Kaplan, J.O.; Krumhardt, K.M.; Zimmermann, N. The Prehistoric and Preindustrial Deforestation of Europe. Quat. Sci. Rev. 2009, 28, 3016–3034. [Google Scholar] [CrossRef]
  6. Williams, M. Dark Ages and Dark Areas: Global Deforestation in the Deep Past. J. Hist. Geogr. 2000, 26, 28–46. [Google Scholar] [CrossRef]
  7. Keenan, R.J.; Reams, G.A.; Achard, F.; de Freitas, J.V.; Grainger, A.; Lindquist, E. Dynamics of Global Forest Area: Results from the FAO Global Forest Resources Assessment 2015. For. Ecol. Manag. 2015, 352, 9–20. [Google Scholar] [CrossRef]
  8. Cukor, J.; Vacek, Z.; Vacek, S.; Linda, R.; Podrázský, V. Biomass Productivity, Forest Stability, Carbon Balance, and Soil Transformation of Agricultural Land Afforestation: A Case Study of Suitability of Native Tree Species in the Submontane Zone in Czechia. Catena 2022, 210, 105893. [Google Scholar] [CrossRef]
  9. Jepsen, M.R.; Kuemmerle, T.; Müller, D.; Erb, K.; Verburg, P.H.; Haberl, H.; Vesterager, J.P.; Andrič, M.; Antrop, M.; Austrheim, G.; et al. Transitions in European Land-Management Regimes between 1800 and 2010. Land Use Policy 2015, 49, 53–64. [Google Scholar] [CrossRef]
  10. Kolecka, N.; Kozak, J. Wall-to-Wall Parcel-Level Mapping of Agricultural Land Abandonment in the Polish Carpathians. Land 2019, 8, 129. [Google Scholar] [CrossRef]
  11. Yang, D.; Zhang, H.; Wang, Z.; Zhao, S.; Li, J. Changes in Anthropogenic Particulate Matters and Resulting Global Climate Effects since the Industrial Revolution. Int. J. Climatol. 2022, 42, 315–330. [Google Scholar] [CrossRef]
  12. Wadanambi, R.T.; Wandana, L.S.; Chathumini, K.K.G.L.; Dassanayake, N.P.; Preethika, D.D.P.; Arachchige, U.S. The effects of industrialization on climate change. J. Res. Technol. Eng. 2020, 1, 86–94. [Google Scholar]
  13. Kauppi, P.E.; Stål, G.; Arnesson-Ceder, L.; Hallberg Sramek, I.; Hoen, H.F.; Svensson, A.; Wernick, I.K.; Högberg, P.; Lundmark, T.; Nordin, A. Managing Existing Forests Can Mitigate Climate Change. For. Ecol. Manag. 2022, 513, 120186. [Google Scholar] [CrossRef]
  14. Coomes, D.A.; Flores, O.; Holdaway, R.; Jucker, T.; Lines, E.R.; Vanderwel, M.C. Wood Production Response to Climate Change Will Depend Critically on Forest Composition and Structure. Glob. Chang. Biol. 2014, 20, 3632–3645. [Google Scholar] [CrossRef] [PubMed]
  15. Zeidler, A.; Borůvka, V.; Brabec, P.; Tomczak, K.; Bedřich, J.; Vacek, Z.; Cukor, J.; Vacek, S. The Possibility of Using Non-Native Spruces for Norway Spruce Wood Replacement—A Case Study from the Czech Republic. Forests 2024, 15, 255. [Google Scholar] [CrossRef]
  16. Tomczak, K.; Kopacz, J.; Jelonek, T.; Tomczak, A. Wood Quality of Silver Birch (Betula Pendula Roth.) Stands Growing on Post-Agricultural Sites. Sylwan 2023, 167, 427–439. [Google Scholar]
  17. Tomczak, K.; Mania, P.; Tomczak, A. Quality of Beech, Birch and Oak Wood from Stands Growing on Post-Agricultural Lands. Wood Res. 2023, 68, 279–292. [Google Scholar] [CrossRef]
  18. Tost, M.; Murguia, D.; Hitch, M.; Lutter, S.; Luckeneder, S.; Feiel, S.; Moser, P. Ecosystem Services Costs of Metal Mining and Pressures on Biomes. Extr. Ind. Soc. 2020, 7, 79–86. [Google Scholar] [CrossRef]
  19. Kubát, J. History and Present Situation on Reclamation of Spoil Banks in the Sokolov Region. Sci. Agric. Bohem. 2008, 39, 342–347. [Google Scholar]
  20. Kupka, I.; Dimitrovský, K. Test Results of Selected Tree Species for Forestry Reclamations in the Sokolov Region. Zprávy Lesn. Výzkumu 2011, 56, 52–56. [Google Scholar]
  21. Pietrzykowski, M. Macronutrient Accumulation and Relationships in a Scots Pine (Pinus sylvestris L.) Ecosystem on Reclaimed Opencast Lignite Mine Spoil Heaps in Central Poland. In Proceedings of the 25th Annual Meeting of American Society of Mining and Reclamation (ASMR), “New Opportunities to Apply Our Science”, Richmond, VA, USA, 14–19 June 2008; pp. 856–877. [Google Scholar]
  22. Dutta, R.K.; Agrawal, M. Litterfall, Litter Decomposition and Nutrient Release in Five Exotic Plant Species Planted on Coal Mine Spoils. Pedobiologia 2001, 45, 298–312. [Google Scholar] [CrossRef]
  23. Horodecki, P.; Jagodziński, A.M. Tree Species Effects on Litter Decomposition in Pure Stands on Afforested Post-Mining Sites. For. Ecol. Manag. 2017, 406, 1–11. [Google Scholar] [CrossRef]
  24. Bungart, R.; Bens, O.; Hüttl, R.F. Production of Bioenergy in Post-Mining Landscapes in Lusatia: Perspectives and Challenges for Alternative Landuse Systems. Ecol. Eng. 2000, 16, 5–16. [Google Scholar] [CrossRef]
  25. Güngör, E.; Şen, G. Sustainable Afforestation Strategies: Hybrid Multi-Criteria Decision-Making Model in Post-Mining Rehabilitation. Forests 2024, 15, 783. [Google Scholar] [CrossRef]
  26. Davis, V.; Burger, J.A.; Rathfon, R.A.; Zipper, C.E.; Miller, C.R. Selecting Tree Species for Reforestation of Appalachian Mined Lands; Appalachian Regional Reforestation Initiative Location: Merrifield, VA, USA, 2012. [Google Scholar]
  27. Pietrzykowski, M.; Woś, B.; Pająk, M. Ecological Restoration of Degraded Soils through Protective Afforestation. In Agroecological Approaches for Sustainable Soil Management; Wiley: Hoboken, NJ, USA, 2023; pp. 145–163. [Google Scholar]
  28. Vacek, Z.; Cukor, J.; Vacek, S.; Gallo, J.; Bažant, V.; Zeidler, A. Role of Black Pine (Pinus Nigra J. F. Arnold) in European Forests Modified by Climate Change. Eur. J. For. Res. 2023, 142, 1239–1258. [Google Scholar] [CrossRef]
  29. UNECE; FAO. State of Europe’s Forests 2015; Ministerial Conference on the Protection of Forests in Europe FOREST EUROPE Liaison Unit Madrid: Madrid, Spain, 2015. [Google Scholar]
  30. Spasić, M.; Vacek, O.; Vejvodová, K.; Tejnecký, V.; Vokurková, P.; Križová, P.; Polák, F.; Vašát, R.; Borůvka, L.; Drábek, O. Which Trees Form the Best Soil? Reclaimed Mine Soil Properties under 22 Tree Species: 50 Years Later—Assessment of Physical and Chemical Properties. Eur. J. For. Res. 2024, 143, 561–579. [Google Scholar] [CrossRef]
  31. Vacek, Z.; Vacek, S.; Cukor, J. European Forests under Global Climate Change: Review of Tree Growth Processes, Crises and Management Strategies. J. Environ. Manag. 2023, 332, 117353. [Google Scholar] [CrossRef] [PubMed]
  32. Brichta, J.; Vacek, S.; Vacek, Z.; Cukor, J.; Mikeska, M.; Bílek, L.; Šimůnek, V.; Gallo, J.; Brabec, P. Importance and Potential of Scots Pine (Pinus sylvestris L.) in 21 St Century. Cent. Eur. For. J. 2023, 69, 3–20. [Google Scholar] [CrossRef]
  33. Durrant, T.H.; de Rigo, D.; Caudullo, G. Pinus Sylvestris in Europe: Distribution, Habitat, Usage and Threats. Eur. Atlas For. Tree Species 2016, 14, 845–846. [Google Scholar]
  34. Bose, A.K.; Gessler, A.; Büntgen, U.; Rigling, A. Tamm Review: Drought-Induced Scots Pine Mortality—Trends, Contributing Factors, and Mechanisms. For. Ecol. Manag. 2024, 561, 121873. [Google Scholar] [CrossRef]
  35. Lemaire, J.; Vennetier, M.; Prévosto, B.; Cailleret, M. Interactive Effects of Abiotic Factors and Biotic Agents on Scots Pine Dieback: A Multivariate Modeling Approach in Southeast France. For. Ecol. Manag. 2022, 526, 120543. [Google Scholar] [CrossRef]
  36. Cukor, J.; Vacek, Z.; Linda, R.; Vacek, S.; Šimůnek, V.; Macháček, Z.; Brichta, J.; Prokůpková, A. Scots Pine (Pinus sylvestris L.) Demonstrates a High Resistance against Bark Stripping Damage. For. Ecol. Manag. 2022, 513, 120182. [Google Scholar] [CrossRef]
  37. Vacek, Z.; Cukor, J.; Vacek, S.; Podrázský, V.; Linda, R.; Kovařík, J. Forest Biodiversity and Production Potential of Post-Mining Landscape: Opting for Afforestation or Leaving It to Spontaneous Development? Cent. Eur. For. J. 2018, 64, 116–126. [Google Scholar] [CrossRef]
  38. Koppen, W. Das Geographische System de Klimate. Handb. Der Klimatol. 1936. [Google Scholar]
  39. ČSN 49 0108; Drevo. Zisťovanie Hustoty (Wood. Determination of the Density). Český Normalizační Institut: Prague, Czech Republic, 1993. (In Czech)
  40. ČSN 490128; Metóda Zistovania Zosýchavosti. (Determination of Shrinkage). Úrad pro Normalizaci a Merení: Praha, Czech Republic, 1989. (In Czech)
  41. ČSN 49 0103; Drevo. Zisťovanie Vlhkosti Pri Fyzikálnych a Mechanických Skúškach (Wood. Determination of Moisture Content at Physical and Mechanical Testing). Vydavatelství Úřadu pro Normalizaci a Měření: Prague, Czech Republic, 1979. (In Czech)
  42. ČSN 49 0110; Drevo. Medza Pevnosti v Tlaku v Smere Vlákien (Wood. Compression Strength Limits Parallel to the Grain). Office for Standardization and Measurement: Prague, Czech Republic, 1980. (In Czech)
  43. Crookston, N.L. Percent Canopy Cover and Stand Structure Statistics from the Forest Vegetation Simulator; US Department of Agriculture, Forest Service, Rocky Mountain Research Station: Fort Collins, CO, USA, 1999.
  44. Reineke, L.H. Perfecting a Stand-Density Index for Even-Aged Forests. J. Agric. Res. 1933, 46, 627–638. [Google Scholar]
  45. Halaj, J. Rastove Tabulky Hlavnych Drevin CSSR; Priroda: Ogden, UT, USA, 1987. [Google Scholar]
  46. Metslaid, S.; Stanturf, J.A.; Hordo, M.; Korjus, H.; Laarmann, D.; Kiviste, A. Growth Responses of Scots Pine to Climatic Factors on Reclaimed Oil Shale Mined Land. Environ. Sci. Pollut. Res. 2016, 23, 13637–13652. [Google Scholar] [CrossRef]
  47. Vacek, Z.; Cukor, J.; Vacek, S.; Linda, R.; Prokůpková, A.; Podrázský, V. Production Potential, Biodiversity and Soil Properties of Forest Reclamations: Opportunities or Risk of Introduced Coniferous Tree Species under Climate Change? Eur. J. For. Res. 2021, 140, 1243–1266. [Google Scholar] [CrossRef]
  48. Podrázský, V.; Vacek, Z.; Vacek, S.; Vítámvás, J.; Gallo, J.; Prokůpková, A.; D’Andrea, G. Production Potential and Structural Variability of Pine Stands in the Czech Republic: Scots Pine (Pinus sylvestris L.) vs. Introduced Pines—Case Study and Problem Review. J. For. Sci. 2020, 66, 197–207. [Google Scholar] [CrossRef]
  49. Vashum, K.T.; Jayakumar, S. Methods to Estimate Above-Ground Biomass and Carbon Stock in Natural Forests—A Review. J. Ecosyst. Ecography 2012, 2, 116. [Google Scholar] [CrossRef]
  50. Tomczak, A.; Pazdrowski, W.; Jelonek, T. Quality of Scots Pine (Pinus sylvestris L.) Wood Part I. Characteristics of Selected Wood Traits and Properties Affecting Its Quality. Sylwan 2009, 153, 363–372. [Google Scholar]
  51. Jakubowski, M.; Dobroczyński, M. Allocation of Wood Density in European Oak (Quercus Robur l.) Trees Grown under a Canopy of Scots Pine. Forests 2021, 12, 712. [Google Scholar] [CrossRef]
  52. Novák, V. Dřevařská Technická Příručka (Wood Handbook); SNTL: Praha, Czech Republic, 1970. [Google Scholar]
  53. Jelonek, T.; Arasimowicz-Jelonek, M.; Gzyl, J.; Tomczak, A.; Łakomy, P.; Grzywiński, W.; Remlein, A.; Klimek, K.; Kopaczyk, J.; Jaszczak, R.; et al. Influence of Former Farmland on the Characteristics and Properties of Scots Pine (Pinus sylvestris L.) Tree Tissue. BioResources 2019, 14, 3247–3265. [Google Scholar] [CrossRef]
  54. Repola, J. Models for Vertical Wood Density of Scots Pine, Norway Spruce and Birch Stems, and Their Application to Determine Average Wood Density. Silva Fenn. 2006, 40, 673–685. [Google Scholar] [CrossRef]
  55. Auty, D.; Achim, A.; Macdonald, E.; Cameron, A.D.; Gardiner, B.A. Models for Predicting Wood Density Variation in Scots Pine. Forestry 2014, 87, 449–458. [Google Scholar] [CrossRef]
  56. Riesco Munoz, G.; Soilán Canas, M.; Rodríguez Soalleiro, R. Physical Properties of Wood in Thinned Scots Pines (Pinus sylvestris L.) from Plantations in Northern Spain. Ann. For. Sci. 2008, 65, 507. [Google Scholar] [CrossRef]
  57. Guler, C.; Copur, Y.; Akgul, M.; Buyuksari, U. Some Chemical, Physical and Mechanical Properties of Juvenile Wood from Black Pine (Pinus Nigra Arnold) Plantations. J. Appl. Sci. 2007, 7, 755–758. [Google Scholar] [CrossRef]
  58. Pazdrowski, W. The Proportion and Some Selected Physical and Mechanical Properties of Juvenile Maturing and Adult Wood of Black Pine and Scots Pine. Electron. J. Pol. Agric. Univ. Ser. For. 2004, 7. [Google Scholar]
  59. Dias, A.; Gaspar, M.J.; Carvalho, A.; Pires, J.; Lima-Brito, J.; Silva, M.E.; Louzada, J.L. Within- and between-Tree Variation of Wood Density Components in Pinus Nigra at Six Sites in Portugal. Ann. For. Sci. 2018, 75, 58. [Google Scholar] [CrossRef]
  60. Oliva, A.G.; Merino, V.B.; Seco, J.I.F.-G.; García, M.C.; Prieto, E.H. Effect of Growth Conditions on Wood Density of Spanish Pinus Nigra. Wood Sci. Technol. 2006, 40, 190–204. [Google Scholar] [CrossRef]
  61. Sable, I.; Grinfelds, U.; Vikele, L.; Rozenberga, L.; Zeps, M.; Neimane, U.; Jansons, A. Effect of Refining on the Properties of Fibres from Young Scots (Pinus sylvestris) and Lodgepole Pines (Pinus contorta). Balt. For. 2017, 23, 529–533. [Google Scholar]
  62. Vaughan, D.; Auty, D.; Dahlen, J.; Sánchez Meador, A.J.; Mackes, K.H. Modelling Variation in Wood Stiffness of Pinus Ponderosa Using Static Bending and Acoustic Measurements. For. Int. J. For. Res. 2021, 94, 232–243. [Google Scholar] [CrossRef]
  63. Alden, H.A. Softwoods of North America; United States Department of Agriculture: Madison, WI, USA, 1997.
  64. Tsoumis, G. Science and Technology of Wood: Structure, Properties, Utilization; Van Nostrand Reinhold: New York, NY, USA, 1991; Volume 115. [Google Scholar]
  65. Forest Products Laboratory. Wood Handbook—Wood as an Engineering Material. General Technical Report FPL-GTR-190; Department of Agriculture, Forest Service, Forest Products Laboratory: Madison, WI, USA, 2010.
  66. Skaar, C. Wood-Water Relations; Springer: Berlin/Heidelberg, Germany, 1988. [Google Scholar]
  67. Shmulsky, R.; Jones, P.D. Forest Products and Wood Science An Introduction; Wiley: Hoboken, NJ, USA, 2011; ISBN 9780813820743. [Google Scholar]
  68. Farsi, M.; Kiaei, M.; Miar, S.; Kiasari, S.M. Effect of Seed Source on Physical Properties of Scots Pine (a Case Study in Neka, Iran). Drv. Ind. 2013, 64, 183–191. [Google Scholar] [CrossRef]
  69. Wagenführ, R. Holzatlas, Wood Atlas; Fachbuchverlag: Leipzig, Germany, 2007. [Google Scholar]
  70. Schönfelder, O.; Zeidler, A.; Borůvka, V.; Bílek, L.; Lexa, M. Shrinkage of Scots Pine Wood as an Effect of Different Tree Growth Rates, a Comparison of Regeneration Methods. J. For. Sci. 2018, 64, 271–278. [Google Scholar] [CrossRef]
  71. Zeidler, A. Selected Wood Properties of Black Pine (Pinus Nigra Arnold.). Zprávy Lesn. Výzkumu 2007, 52, 14–20. [Google Scholar]
  72. Var, A.A.; Kardaş, I. Changes in Physical, Mechanical, Shrinking and Swelling Properties of Pine Wood Species Treated with Salt Natural Geothermal Waters as Environmentally Safe Resources. Appl. Ecol. Environ. Res. 2019, 17, 14053–14068. [Google Scholar] [CrossRef]
  73. Jelonek, T.; Pazdrowski, W.; Tomczak, A. Selected Properties of Wood in Scots Pine (Pinus sylvestris L.) Growing on Post-Agricultural Land in Northern Poland. For. Res. Pap. 2009, 70, 277–286. [Google Scholar] [CrossRef]
  74. Wąsik, R.; Michalec, K.; Barszcz, A.; Mudryk, K. Variability of selected macrostructure features, density and compression strength along the grain of the “Tabórz” Scots pine wood (Pinus sylvestris L.). Drewno. Pr. Nauk. Doniesienia Komun. = Wood. Res. Pap. Rep. Announc. 2020, 63, 171–182. [Google Scholar] [CrossRef]
  75. Panshin, A.J.; De Zeeuw, C. Textbook of Wood Technology: Structure, Identification, Properties, and Uses of the Commercial Woods of the United States and Canada; McGraw-Hill: New York, NY, USA, 1980. [Google Scholar]
  76. Schimleck, L.R.; Dahlen, J.; Auty, D. Radial Patterns of Specific Gravity Variation in North American Conifers. Can. J. For. Res. 2022, 52, 889–900. [Google Scholar] [CrossRef]
  77. Hayatgheibi, H. Quantitative Genetics of Lodgepole Pine (Pinus contorta) Wood Quality Traits in Sweden. Acta Univ. Agric. Sueciae 2018, 63, 171–182. [Google Scholar]
  78. Zobel, B.J.; Van Buijtenen, J.P. Wood Variation: Its Causes and Control; Springer Science & Business Media: Berlin/Heidelberg, Germany, 2012; ISBN 3642740693. [Google Scholar]
  79. Vaughan, D.; Auty, D.; Kolb, T.; Dahlen, J.; Sánchez Meador, A.J.; Mackes, K.H. Wood Density Variation in Naturally Regenerated Stands of Pinus Ponderosa in Northern Arizona, USA. Can. J. For. Res. 2021, 51, 583–594. [Google Scholar] [CrossRef]
  80. Dinwoodie, J.M.J. Timber: Its Nature and Behaviour, 2nd ed.; Routledge: New York, NY, USA, 2000; ISBN 1135808104. [Google Scholar]
  81. Dias, A.; Carvalho, A.; Silva, M.E.; Lima-Brito, J.; Gaspar, M.J.; Alves, A.; Rodrigues, J.C.; Pereira, F.; Morais, J.; Lousada, J.L. Physical, Chemical and Mechanical Wood Properties of Pinus Nigra Growing in Portugal. Ann. For. Sci. 2020, 77, 72. [Google Scholar] [CrossRef]
  82. Fernandes, C.; Gaspar, M.; Pires, J.; Alves, A.; Simões, R.; Rodrigues, J.; Silva, M.; Carvalho, A.; Brito, J.; Lousada, J. Physical, Chemical and Mechanical Properties of Pinus Sylvestris Wood at Five Sites in Portugal. iForest Biogeosci. For. 2017, 10, 669–679. [Google Scholar] [CrossRef]
  83. Mackes, K.; Shepperd, W.; Jennings, C. Evaluating the Bending Properties of Clear Wood Specimens Produced from Small-Diameter Ponderosa Pine Trees. For. Prod. J. 2005, 55, 72. [Google Scholar]
  84. Siau, J.F. Transport Processes in Wood; Springer: Berlin/Heidelberg, Germany, 1984; Volume 2, ISBN 978-3-642-69215-4. [Google Scholar]
  85. Leonardon, M.; Altaner, C.M.; Vihermaa, L.; Jarvis, M.C. Wood Shrinkage: Influence of Anatomy, Cell Wall Architecture, Chemical Composition and Cambial Age. Eur. J. Wood Wood Prod. 2010, 68, 87–94. [Google Scholar] [CrossRef]
Figure 1. Localization of the area of interest—Antonín Forest Arboretum in the Sokolov region (▲) with 22 highlighted permanent research plots (dot) and the mean monthly precipitation and air temperature (1975–2022); the meteorological station is marked by a flag symbol.
Forests 15 01388 g001
Figure 2. Stem sectioning, test specimen position in relation to the pith, and the test specimen parameters.
Forests 15 01388 g002
Figure 3. Density distribution along stem radius. (x-axis: Figures denote a position of the test specimen in relation to the pith. Section 1 shows a position close to the pith, while the highest figure is a position close to the bark. The intervals represent standard deviations).
Forests 15 01388 g003
Figure 4. Volumetric shrinkage distribution along stem radius. (x-axis: Figures denote a position of the test specimen in relation to the pith. Section 1 shows a position close to the pith, while the highest figure is a position close to the bark. The intervals represent standard deviations).
Forests 15 01388 g004
Figure 5. Compressive strength distribution along stem radius. (x-axis: Figures denote a position of the test specimen in relation to the pith. Section 1 shows a position close to the pith, while the highest figure is a position close to the bark. The intervals represent standard deviations).
Forests 15 01388 g005
Figure 6. Dependence of volumetric shrinkage on wood density for the tested pine species (r—coefficient of correlation, r2—coefficient of determination).
Forests 15 01388 g006
Figure 7. Dependence of compressive strength on wood density for the tested pine species (r—coefficient of correlation, r2—coefficient of determination).
Forests 15 01388 g007
Table 1. Production characteristics of forest stands on the permanent research plots differentiated by tree species; the highest values are in bold.
PRPdbhhfVHDRMAISDICC
(cm)(m) (m3 ha−1) (m3 ha−1 yr−1) (%)
Pinus sylvestris18.9 a ± 1.117.95 b ± 1.090.452 ab ± 0.003376 b ± 5594.8 b ± 1.08.18 b ± 1.201.04 b ± 0.0986.4 b ± 1.1
Pinus nigra15.5 a ± 0.614.76 a ± 0.510.439 a ± 0.006256 ab ± 3595.4 b ± 4.05.54 ab ± 0.780.98 b ± 0.1387.3 b ± 2.4
Pinus concorta20.8 a ± 0.813.92 a ± 0.790.473 bc ± 0.007157 a ± 3566.7 a ± 2.13.37 a ± 0.720.52 a ± 0.0869.1 a ± 5.6
Pinus ponderosa23.6 a ± 8.213.73 a ± 4.650.486 c ± 0.147335 ab ± 12261.2 a ± 20.17.05 ab ± 2.531.01 ab ± 0.2890.6 b ± 25.7
testKWANOVAKWANOVAANOVAANOVAANOVAKW
p-value0.0860.046<0.0010.043<0.0010.0380.0110.005
Notes: Significant differences between examined species were marked with different letters; dbh—mean quadratic diameter at breast height, h—mean height, f—form factor, V—stand volume, HDR—height to diameter ratio, MAI—mean annual increment, CC—canopy closure, SDI—stand density index; KW—Kruskal-Wallis test, ANOVA—analysis of variance, ±—standard errors.
Table 2. Wood density (kg m−3) comparison of the tested tree species.
Tree SpeciesMeanMin.Max.SDCV
Pinus ponderosa425 a ± 7.63717275412.6
Pinus sylvestris458 b ± 5.13566024610.0
Pinus nigra441 a,b ± 4.4385530388.6
Pinus contorta425 a ± 6.23487305112.0
Min.—minimal obtained value, Max.—maximal obtained value, SD—standard deviation, CV—coefficient of variation (%), ±—standard errors; the significantly (p < 0.05) highest values are in bold; Significant differences between examined species were marked with different letters.
Table 3. Volumetric shrinkage (%) comparison of the tested tree species.
Tree SpeciesMeanMin.Max.SDCV
Pinus ponderosa14.4 a ± 0.39.719.42.316.3
Pinus sylvestris15.1 a ± 0.39.018.92.315.1
Pinus nigra14.4 a ± 0.210.519.21.913.5
Pinus contorta14.3 a ± 0.28.618.01.711.7
Min.—minimal obtained value, Max.—maximal obtained value, SD—standard deviation, CV—coefficient of variation (%), ±—standard errors; the significantly (p < 0.05) highest values are in bold; Significant differences between examined species were marked with different letters.
Table 4. Compressive strength (MPa) along fibers comparison of the tested tree species.
Tree SpeciesMeanMinMaxSDCV
Pinus ponderosa26.2 a ± 0.717.737.74.617.6
Pinus sylvestris44.2 c ± 0.828.359.77.216.2
Pinus nigra36.5 b ± 1.121.361.79.726.6
Pinus contorta39.3 b ± 0.826.153.66.215.8
Min.—minimal obtained value, Max.—maximal obtained value, SD—standard deviation, CV—coefficient of variation (%), ±—standard errors; the significantly (p < 0.05) highest values are in bold; Significant differences between examined species were marked with different letters.
Disclaimer/Publisher’s Note: The statements, opinions and data contained in all publications are solely those of the individual author(s) and contributor(s) and not of MDPI and/or the editor(s). MDPI and/or the editor(s) disclaim responsibility for any injury to people or property resulting from any ideas, methods, instructions or products referred to in the content.

