Article

Response of Rhododendron simsii and Rhododendron delavayi Superoxide Dismutase Family Genes to High-Temperature Stress

1
School of Life Sciences, Guizhou Normal University, Guiyang 550025, China
2
College of Landscape Architecture, Nanjing Forestry University, Nanjing 210037, China
3
Key Laboratory of National Forestry and Grassland Administration on Biodiversity Conservation in Karst Mountainous Areas of Southwestern China, Guizhou Normal University, Guiyang 550025, China
4
Engineering Research Center of Carbon Neutrality in Karst Areas, Ministry of Education, Guizhou Normal University, Guiyang 550025, China
*
Author to whom correspondence should be addressed.
Forests 2024, 15(6), 931; https://doi.org/10.3390/f15060931
Submission received: 17 April 2024 / Revised: 12 May 2024 / Accepted: 25 May 2024 / Published: 27 May 2024

Abstract

:
Superoxide dismutases (SODs) are the first line of defense in the antioxidant defense system, and they play an essential role in various adversity stress adaptations in Rhododendron. In this study, 9 Rhododendron simsii SODs (RsSODs) and 11 Rhododendron delavayi SODs (RdSODs) genes were identified in the genomes of R. simsii and R. delavayi. Phylogenetic relationship analysis classified SOD proteins from two Rhododendron species and other related species into three subfamilies. The results of gene structure and conserved motif analysis show that SOD proteins are strongly evolutionarily conserved, and SODs of the same subfamily have similar motif distributions, positions, and lengths. Twenty-two light-responsive elements, eight phytohormone regulatory elements, five adversity stress-related elements, and three growth and development regulatory elements were detected in the RsSOD and RdSOD promoters. Quantitative real-time fluorescence polymerase chain reaction analysis showed that among the 20 candidate genes, except for RdCSD5, the other SODs were expressed in at least one of four tissues, and all of these gene family members had high expression levels in the leaves. We then investigated the response of the RsSOD and RdSOD gene families to high-temperature stress in combination with the following specific stressors: abscisic acid, ethephon, and hydrogen peroxide treatments, followed by high-temperature stress. Different degrees of upregulated expression of the detected SOD gene family members were found for exogenous reagent treatments and different times of high-temperature stress. Thus, we provide a basis for the further functional characterization of SOD genes in R. simsii and R. delavayi in the future.

1. Introduction

Plants accumulate excess reactive oxygen species (ROS) when faced with various stresses, leading to peroxidative damage. To counteract this damage, plants have evolved a sophisticated system for scavenging ROS over a long period of evolution, which includes both enzymatic and non-enzymatic mechanisms [1,2]. Superoxide dismutases (SODs) act as the first line of defense in this antioxidant system by catalyzing the breakdown of superoxide radicals, thus safeguarding plant cells from peroxidative harm [3], and they are crucial for enhancing plant stress tolerance [4,5,6]. Studies have shown that SOD promotes plant responses to various adversity stresses such as salinity, drought, cold, ethylene and auxin [7]. In addition, studies using overexpressing or knocked-out plant SOD genes have confirmed their functions in improving stress tolerance [7].
SOD enzymes are grouped into three main categories based on the metal ions that bind to their active centers: copper/zinc superoxide dismutase (Cu/ZnSOD), manganese superoxide dismutase (MnSOD), and iron superoxide dismutase (FeSOD) [3]. The intracellular localization of these different SOD types varies. Cu/ZnSOD is mainly found in the cytoplasm, chloroplasts, and peroxisomes. FeSOD is predominantly located in chloroplasts, and MnSOD is predominantly present in mitochondria [8,9]. The adversity stresses applied to plants under different types of adversity stresses vary at the subcellular level, inducing different types of antioxidant enzymes in response to the stresses [10,11]. For example, chloroplast SODase activity was found to be higher than mitochondrial SODase activity in winter wheat (Triticum aestivum) leaves under low-temperature stress. The distribution of SOD enzymes in the cytoplasm of maize (Zea mays) leaves under short-term water stress was found to be higher than that of other subcells.
The SOD gene family has been widely studied in many plants, for example, soybean (Glycine max) [12], tomato (Solanum lycopersicum) [13], maize [14], Salvia miltiorrhiza [15], and cucumber (Cucumis sativus) [16]. The SOD gene family has spatiotemporal and temporal expression specificity, and different types of SOD genes have different expression patterns under different stresses [16,17,18]. For example, SmCSD2 was upregulated in S. miltiorrhiza under low-temperature stress. The expression of almost all SmSODs, except SmFSD2, was upregulated under salt stress, and the expression patterns of SmCSD1/2/3 and SmMSD first increased and then decreased under drought stress [15]. Moreover, transgenic plants with different types of SOD gene family members exhibited differences in their response to stress. Yu et al. [19] reported that lines overexpressing the FeSOD gene and transgenic lines overexpressing the MnSOD gene in tobacco chloroplasts exhibited similar MnSOD enzyme activities. Still, lines overexpressing the MnSOD gene have been found to be more tolerant to Mn deficiency stress than lines overexpressing the FeSOD gene. Kwon et al. [20] found that after the overexpression of the Cu/ZnSOD gene and the overexpression of the MnSOD gene in tobacco chloroplasts, MnSOD transgenic lines were more tolerant to oxidative stress mediated by methyl viologen (MV) and photo-oxidative damage than Cu/ZnSOD transgenic tobacco lines. These studies have shown that members of different SOD gene families have different mechanisms of response and regulation to adversity stress.
China is rich in Rhododendron plants, but most resources are distributed in high-altitude areas [21]. Rhododendron prefers cool climates, and the high temperature in summer severely limits the popularization and application of Rhododendron plants. Heat-tolerant Rhododendron can maintain high antioxidant defenses under high-temperature stress, in which SOD enzymes play an important role [22,23]. Previous studies in our laboratory have found that the improved heat tolerance of Rhododendron treated with exogenous ethylene [24] and hydrogen peroxide (H2O2) [25] at appropriate concentrations is associated with enhanced SOD enzyme activity. Rhododendron simsii (R. simsii) is a deciduous shrub with bright red corolla, a famous flowering plant with high ornamental value, and the whole plant is used for medicinal purposes. Rhododendron delavayi (R. delavayi) is an evergreen shrub or small tree with terminal umbels of 10–20 flowers in each cluster and deep red corolla. Both belong to the genus Rhododendron in the family Ericaceae [21]. In this study, R. simsii and R. delavayi (both are wild type), which differ in heat tolerance, were selected for analysis to determine the mechanism of SOD regulation of heat tolerance in Rhododendron. Genome-wide identification and bioinformatics analyses of the SOD gene family were performed using available Rhododendron genomic data [26,27]. On this basis, the expression patterns of different gene family members were analyzed under high-temperature stress and treatment with exogenous reagents such as hydrogen peroxide, ethephon (ETH) and abscisic acid (ABA). These results laid an important foundation for further studies on the evolution of the plant SOD gene family, and provided useful information for the identification of key SOD under high-temperature stress.

2. Materials and Methods

2.1. Identification of R. simsii and R. delavayi SOD Gene Family Members

The complete genome sequences and predicted coding region sequences (CDSs) of R. simsii and R. delavayi were obtained from the NCBI database (http://www.ncbi.nlm.nih.gov, accessed on 15 September 2021) and the GigaDB database (http://gigadb.org/dataset/1003311, accessed on 15 September 2021) along with their protein sequences and annotation files. Hidden Markov model (HMM) files for the Cu/ZnSOD (PF00080) and Fe/MnSOD (PF00081, PF02777) families were retrieved from the Pfam database (http://pfam.xfam.org/, accessed on 15 September 2021). HMMERv3.3.2 software was employed to identify sequences containing the SOD structural domain within the protein sequences of R. simsii and R. delavayi [28]. The searched protein sequences were again analyzed by Pfam (http://pfam.xfam.org/search#tabview=tab1, accessed on 18 September 2021), SMART (http://smart.embl.de/, accessed on 18 September 2021), and NCBI CDD (https://www.ncbi.nlm.nih.gov/cdd/, accessed on 18 September 2021) [29] for comparison and confirmation of conserved structural domains of the SOD protein. Predicting the physicochemical properties of SOD proteins was undertaken using the Protparam online tool [30].

2.2. Bioinformatics Analysis

Phylogenetic trees were constructed to analyze the relationships among SOD proteins from R. simsii, R. delavayi, Arabidopsis thaliana [31], rice (Oryza sativa) [32], soybean [12], tomato [13], and Medicago truncatula [33]. Sequence alignment was carried out using MEGA 7 software, and a phylogenetic tree with 1000 bootstrap replicates was generated using the neighbor joining (NJ) method [34]. The tree was customized using the iTOL online tool (https://itol.embl.de/, accessed on 20 October 2021).
Within the R. simsii genome, gene duplication analysis of SOD genes was conducted using MCScanX software in TBtools1.09876 [35,36]. The results were visualized using Advanced Circos software in TBtools1.09876 [37]. Furthermore, gene duplication events between the R. simsii and Arabidopsis genomes were examined using the Dual Synteny Plot feature in TBtools. To investigate putative cis-elements in the promoters of SOD genes, 2 Kb sequences upstream of the start codon were extracted from the genome, and the cis-element prediction was carried out using the PlantCARE website (http://bioinformatics.psb.ugent.be/webtools/plantcare/html, accessed on 23 October 2021) [38]. The intron–exon structure of SOD genes was determined based on the genome annotation files of R. simsii and R. delavayi.
Additionally, conserved amino acid structural domains of the SOD proteins were predicted using NCBI CD-Search (https://www.ncbi.nlm.nih.gov/Structure/cdd/wrpsb.cgi, accessed on 28 October 2021), and conserved motifs of SOD proteins were identified using MEME (http://meme-suite.org/tools/meme, accessed on 28 October 2021) [39]. We predicted the protein interaction networks using the STRING (https://string-db.org/, accessed on 7 November 2021) website [40]. The interaction score between proteins in the interaction network was ≥0.70, with thicker lines between targets indicating stronger interactions. The results were saved as TSV files, and the PPI network was visualized using Cytoscape 3.8.2 software.

2.3. Experimental Materials and High-Temperature Stress Treatment

Two-year-old seedlings of R. simsii and R. delavayi were used as experimental materials and grown in a light culture room at 22 °C with a 16 h light/8 h dark cycle. Roots, stem epidermis, leaves, and flowers weighing between 1 and 5 g from R. simsii and R. delavayi were collected, rapidly frozen in liquid nitrogen, and stored at −80 °C for subsequent analysis of SOD gene expression across various tissues.
The experimental setup involved four treatment zones: direct exposure to high-temperature stress (40 °C) [25,41] and spraying of 100 μM ETH, 100 μM ABA, and 10 mM H2O2 on the leaves, followed by high-temperature stress. Leaf treatments were administered at 9:00 a.m., followed by high-temperature stress after 24 h. High-temperature stress was imposed in a light incubator at 40 °C with a light intensity of 12,000 Lx (GZX250E, Tianjin Taiste Instrument Co., Ltd., Tianjin, China). Trays with a water depth of 1 cm were placed at the bottom of the pots for water supplementation to alleviate heat-induced water stress. Leaves were harvested from two-year-old seedlings subjected to high-temperature stress at 0, 3, 6, 12, and 24 h, weighing between 1 and 5 g, and stored at −80 °C for subsequent quantitative real-time fluorescence polymerase chain reaction (qRT–PCR) analysis. Five two-year-old seedlings of similar growth were sampled from each treatment, with three biological replicates conducted.

2.4. Total RNA Extraction and cDNA First Strand Synthesis

Total RNA extraction and cDNA synthesis were performed by utilizing the manufacturer’s protocols for the TIANGEN Polysaccharide Polyphenol Plant Total RNA Extraction Kit (RNAprep Pure Plant Plus Kit) (Guizhou, China) and FastKing gDNA Dispelling RT SuperMix (Guizhou, China).

2.5. Quantitative Real-Time Fluorescence Polymerase Chain Reaction

Quantitative primers (Table S1) were designed according to the gene sequences in the genomic data and qRT-PCR analysis was performed. qRT–PCR analysis was performed using the ChamQ Universal SYBR qPCR Master Mix kit from Novizen (Beijing, China). PCR program: 95 °C for 30 s; 95 °C for 10 s, 60 °C for 30 s, cycling 40 times; 95 °C for 15 s, 60 °C for 60 s, and 95 °C for 15 s. The internal reference gene, β-actin, was chosen and validated, and the gene’s relative expression levels were calculated using the 2−△△Ct method. Three biological replicates and three technical replicates were carried out for each gene.

3. Results

3.1. Identification of SOD Proteins in R. simsii and R. delavayi

The SOD gene families in R. simsii and R. delavayi were characterized at the genome-wide level, revealing the presence of 9 and 11 SOD genes, respectively. These identified SOD genes were designated based on the chromosome distribution, scaffold size, and structural domains. In R. simsii, the SOD genes consisted of five Cu/ZnSODs (RsCSD1–RsCSD5), two FeSODs (RsFSD1 and RsFSD2), and two MnSODs (RsMSD1 and RsMSD2). Meanwhile, the SOD genes in R. delavayi included seven Cu/ZnSODs (RdCSD1–RdCSD7), two FeSODs (RdFSD1 and RdFSD2), and two MnSODs (RdMSD1 and RdMSD2).
As predicted by the Protparam tool, the physicochemical properties of the SOD proteins in R. simsii and R. delavayi exhibited specific characteristics. The lengths of the SOD proteins ranged from 89 to 277 amino acids (aa) in R. simsii and from 156 to 1668 aa in R. delavayi. Molecular weights varied from 9139.33 (RsCSD4) to 31,471 (RsFSD2) in R. simsii and from 16,068.72 (RdCSD6) to 184,229.34 (RdCSD1) in R. delavayi. The isoelectric point (pI) ranged from 6.04 to 8.84 in R. simsii and from 5.62 to 9.13 in R. delavayi. Moreover, the instability indices ranged from 5.20 to 44.13 in R. simsii and from 10.69 to 55.76 in R. delavayi, indicating protein stability under the experimental conditions (≤40 for stable; >40 for potentially unstable). Several SOD proteins exhibited hydrophobic characteristics, as indicated by positive GRAVY values (RsCSD1, RsCSD5, RdCSD4, and RdCSD7), while the rest showed hydrophilicity due to negative GRAVY values. The IDs and detailed physicochemical properties of RsSOD and RdSOD are presented in Table S2.

3.2. Phylogenetic Relationships

Phylogenetic analysis allows for the comprehension of the genetic relationships among various species, and enables the inference of potential gene functions based on protein homology within the evolutionary context. A phylogenetic tree was constructed using 65 SOD protein sequences from seven species (Figure 1). The protein IDs utilized for constructing the phylogenetic tree are listed in Table S3. The analysis revealed that the 65 sequences were grouped into two primary categories: Cu/ZnSODs and Mn/FeSODs, consistent with their respective metal cofactors. All CSDs were clustered in the Cu/ZnSOD subgroup and shared a common branch, further segmenting into three subgroups: Ia, Ib, and Ic. FSDs and MSDs were grouped in the FeSOD (II b) and MnSOD (II a) subgroups, respectively, forming a separate branch. Moreover, the numbers of genes in the Cu/ZnSOD subgroup exceeded those in the FeSOD or MnSOD subgroup. Within each subgroup, SOD proteins from different species were clustered on smaller branches. The SOD proteins from R. simsii and R. delavayi were found to be distributed across all five subfamilies.

3.3. Gene Structure and Motif Composition of the R. simsii and R. delavayi SOD Gene Families

For a deeper understanding of the SOD gene family evolution of R. simsii and R. delavayi, we examined the exon–intron structure of all identified SOD genes (Figure 2b). In brief, the number of exons in R. simsii SOD genes varied from six to nine, while in R. delavayi, it ranged from 6 to 16. Additionally, to further characterize the SOD proteins, the MEME 5.3.2 online software was employed to predict conserved motifs (Figure 2c). The analysis revealed 10 conserved motifs, with Motif7 and Motif2 being the most prevalent in both R. simsii and R. delavayi CSDs. For MSD and FSD, Motif3 and Motif4 were identified as the most conserved, respectively. Each subfamily exhibited similar types and numbers of conserved motifs, with some subfamilies possessing unique motifs. For instance, IIa featured Motif 10, while IIb contained Motif 8.

3.4. Chromosomal Distribution and Synthesis Analysis of RsSOD Genes

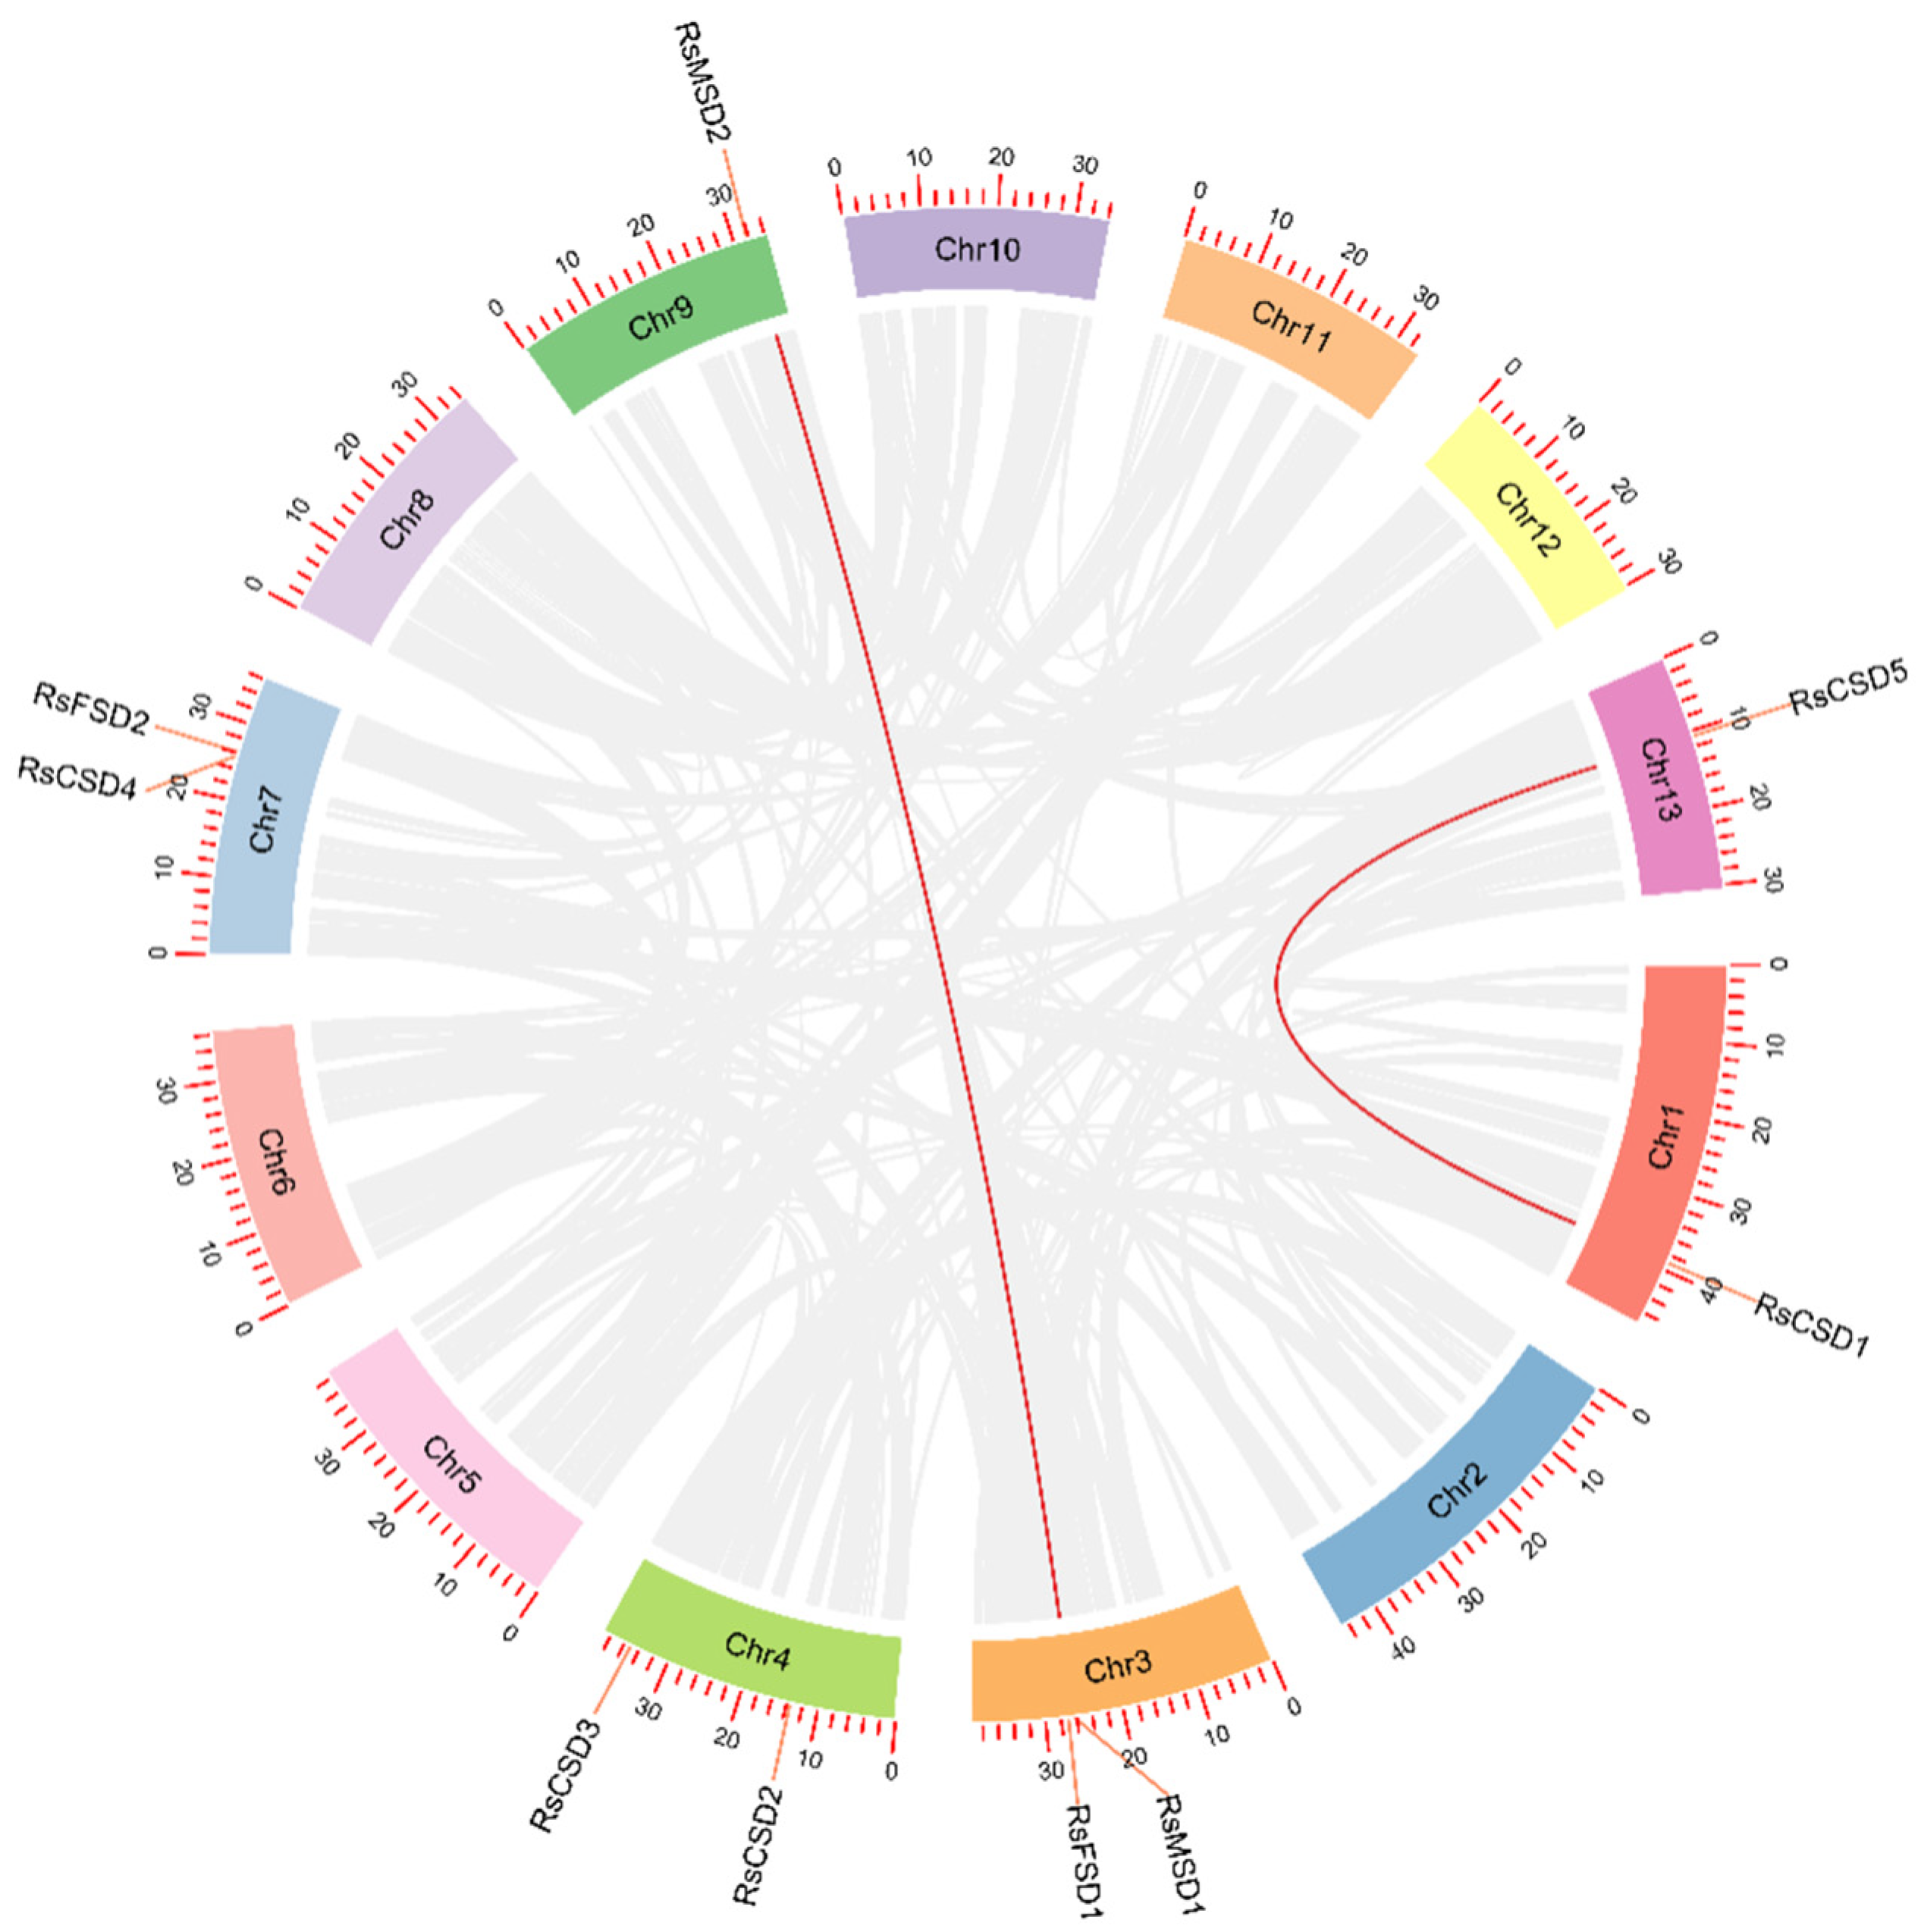
In our study, we observed an unequal distribution of the RsSOD genes among the 13 linkage groups in R. simsii (chromosomes, Chr) (Figure 3). Specifically, chromosomes Chr3, Chr4, and Chr7 harbored two RsSOD genes each, while chromosomes Chr1, Chr9, and Chr13 contained one RsSOD gene each (Figure 3). We also detected instances of gene duplication in the RsSODs via both tandem and segmental duplications to investigate potential gene amplification mechanisms within the RsSOD family. Upon comprehensive analysis, four genes (RsCSD1, RsCSD5, RsMSD1, and RsMSD2) were implicated in segmental duplications, with no tandem duplications detected in the RsSOD gene family.
The synthesis analysis unveiled 10 pairs of homologous SOD genes (AtCSD1/RsCSD4, AtCSD2/RsCSD1, AtCSD2/RsCSD5, AtMSD2/RsMSD1, AtMSD1/RsMSD1, AtMSD2/RsMSD2, AtMSD1/RsMSD2, AtFSD1/RsMSD2, AtFSD2/RsFSD1, and AtCSD3/RsCSD2) (Figure 4), indicating that segmental duplication likely plays a crucial role in the processes of the RsSOD gene family. The outcomes of the synthesis analysis between the genomes aligned with the findings of the phylogenetic relationships between R. simsii and A. thaliana (Figure 1).

3.5. Examination of Cis-Elements in the Promoters of RsSOD and RdSOD Genes

Analysis of cis-regulatory elements in the SOD promoter region is helpful to exploring the mechanism of gene response to various stresses. In the R. simsii and R. delavayi SOD genes, 42 and 39 cis-acting elements were identified, respectively, with 43 elements common to both (see details in Table S4). These 43 cis-regulatory elements are classified into four main groups: light-responsive, phytohormone-regulated, stress-related, and growth- and development-regulated elements. They encompass 22 types of light-responsive elements, eight types of plant hormone regulatory elements, five types of stress-related elements, and three types of growth and development regulatory elements. Notably, specific elements, such as the MYB-binding site (MBSI) linked to flavonoid biosynthesis genes, the circadian element associated with plant circadian rhythms, the MSA-like element linked to cell cycle regulation, and the MeJA response-related elements (TGACG-motif, CGTCA-motif), were identified. Interestingly, the light-responsive element 3-AF1 binding site was exclusive to the R. simsii RsFSD2 gene, and four cis-regulatory elements (GA-motif, GATA-motif, GTGGC-motif, and MBSI) were unique to the R. delavayi SOD gene. The positions, quantities, and types of these cis-regulatory elements within the SOD gene promoters are illustrated in Figure 5a,b. The results show that the cis-acting elements of most of the SOD genes were responsive to light. While the cis-acting elements of some of the genes were responsive to growth hormones, gibberellin, ABA, and low-temperature stress.
Overall, the expression levels of RsSODs and RdSODs may vary under phytohormonal and abiotic stress conditions.

3.6. RsSOD and RdSOD Family Protein Interaction Networks

Protein interaction analyses showed that the RsSOD and RdSOD protein families all have 12–19 interaction pathways (Figure S1). By examining the functional roles of these proteins in the STRING database, we postulated that RsSOD and RdSOD proteins might play a role in regulating various biological processes, such as ribosomal structural composition, translation, plastid gene expression, embryonic development, and seed dormancy termination. Interactions among the SOD proteins themselves and with copper chaperone for superoxide dismutase (CCS) and catalase (CAT) facilitate the neutralization of superoxide anion free radicals generated within the cell, thus mitigating their toxicity to the biological system and contributing to the regulation of growth and development in R. simsii and R. delavayi. Furthermore, CCS’s interaction with CAT aids in the elimination of ROS.

3.7. Tissue-Specific Expression Profiles of RsSODs and RdSODs

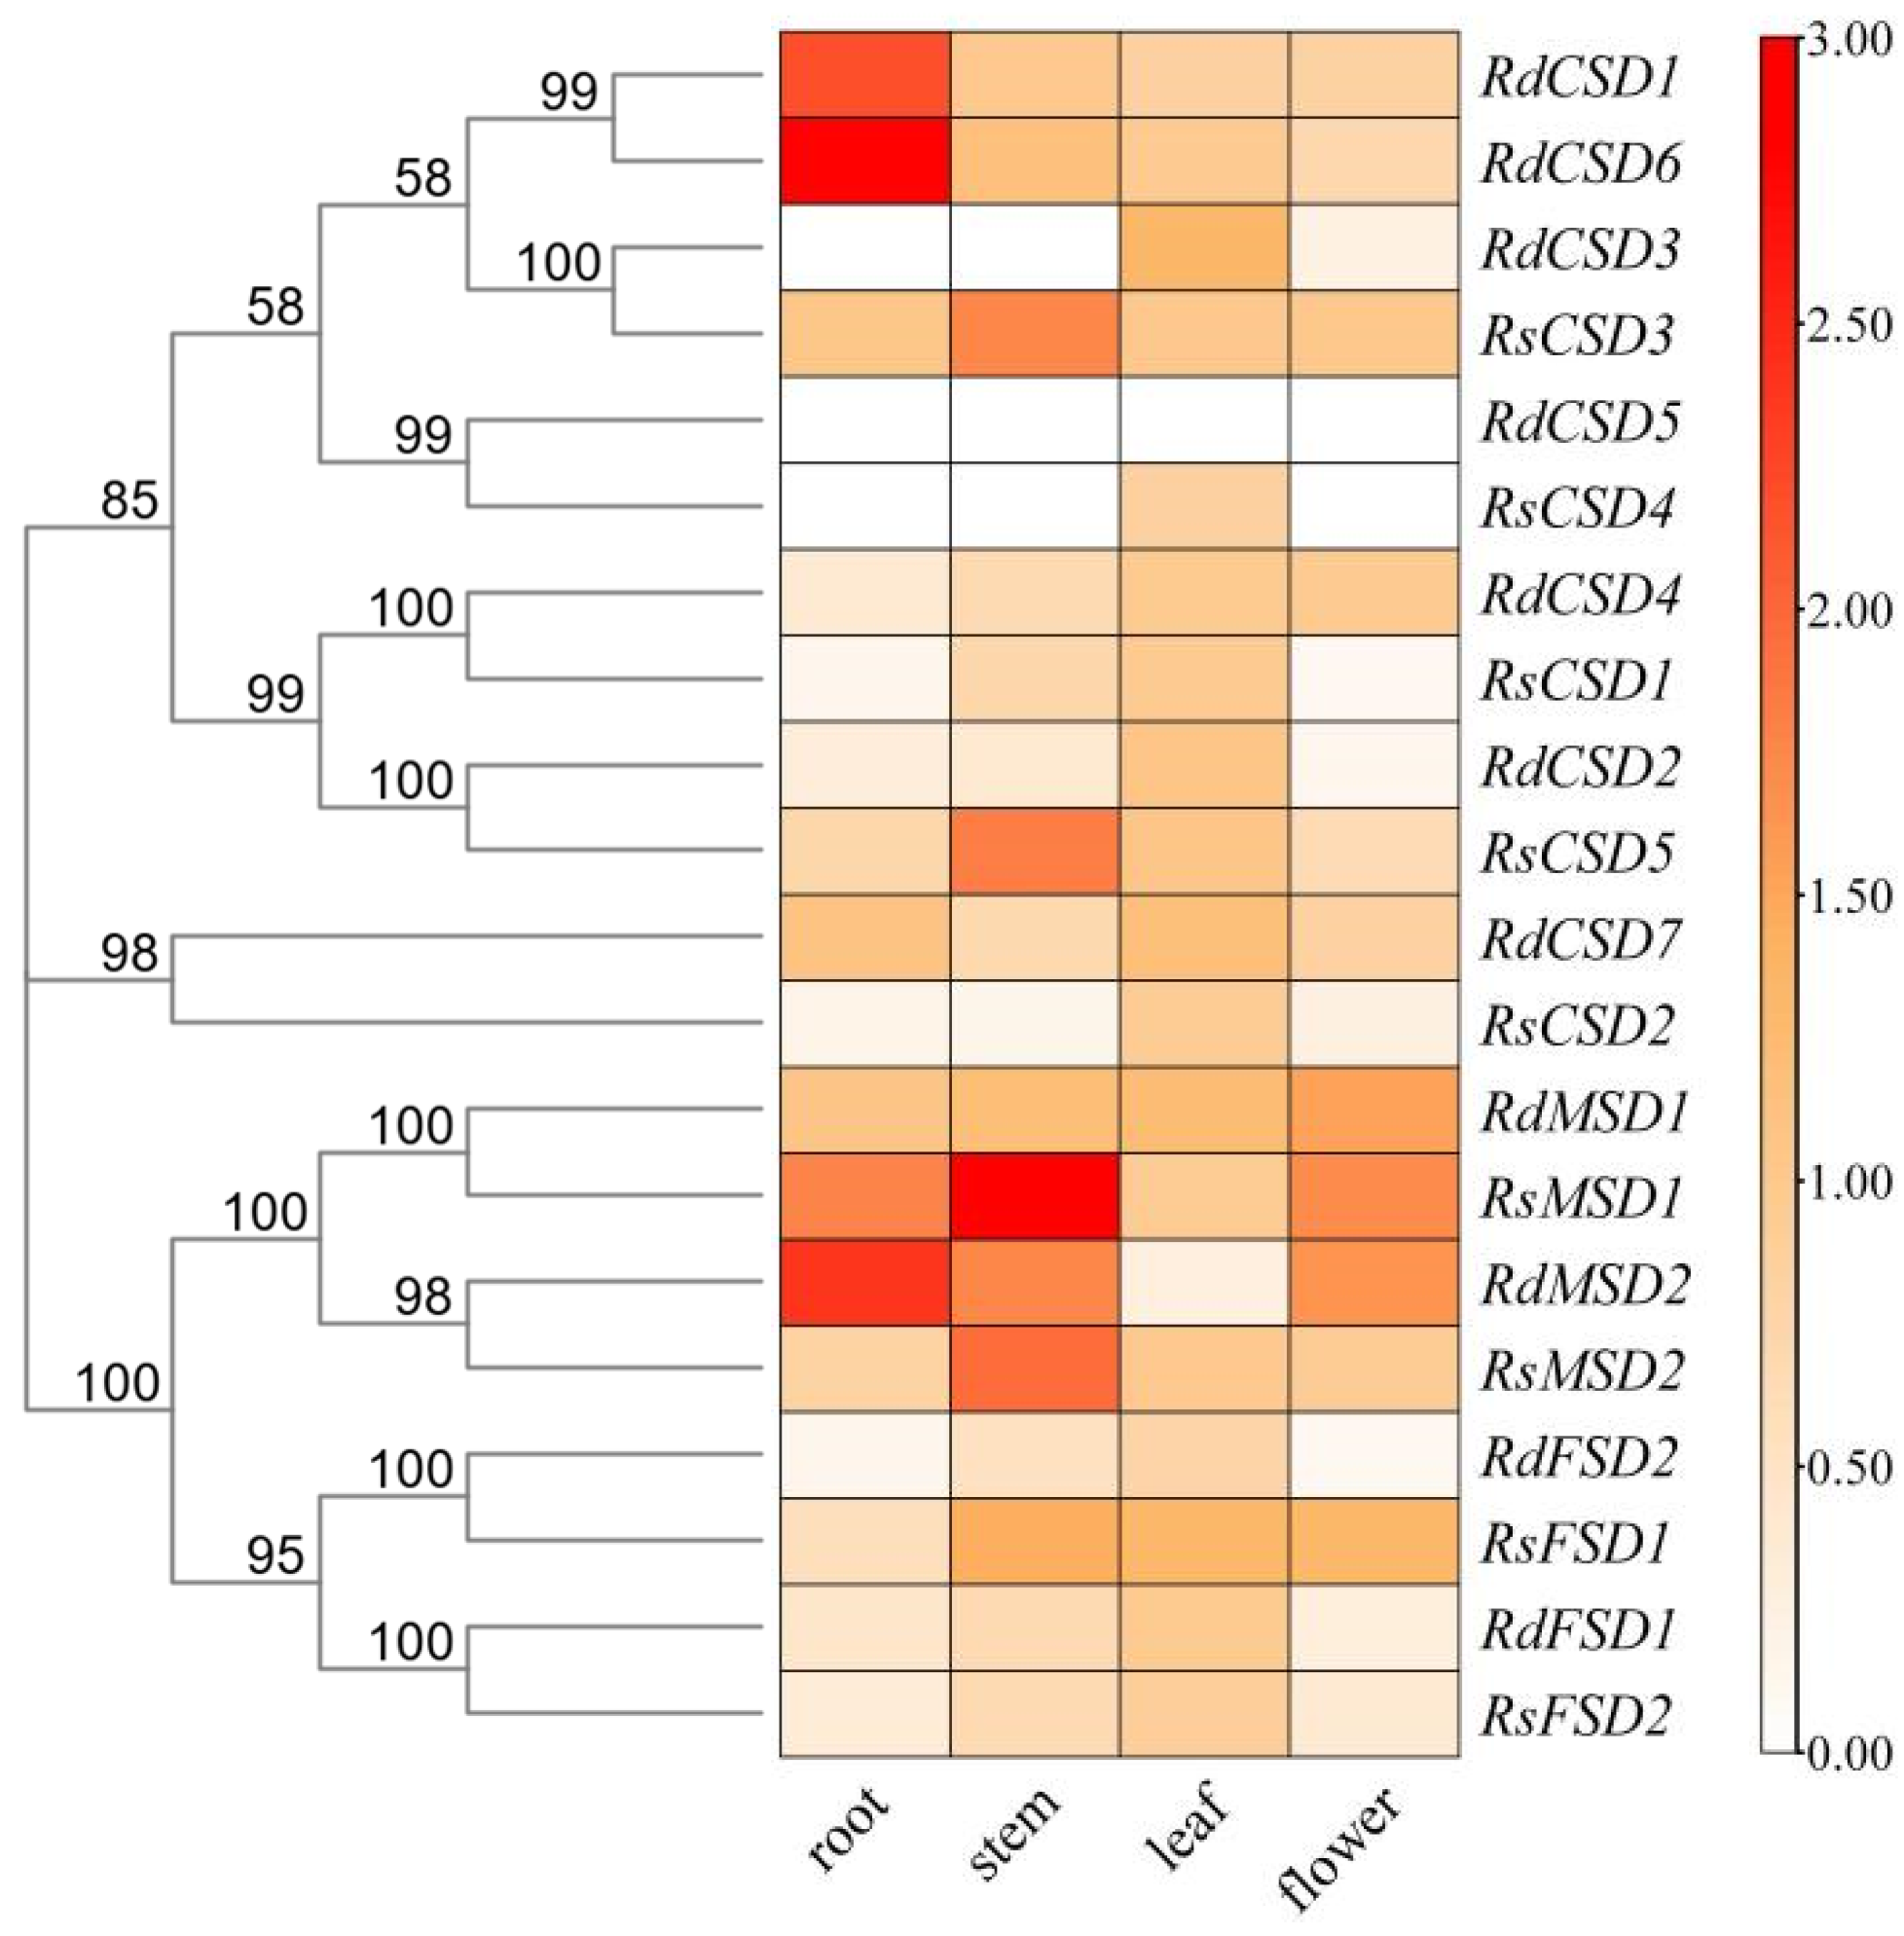
Among the 20 SOD gene family members, RdCSD5 gene expression was not detected, suggesting that RdCSD5 may be a pseudogene or that it is expressed at specific developmental stages, or under specific conditions (Figure 6). Other members of SODs were expressed in at least one of the tissues, with both RsSODs and members of the RdSOD gene family having high levels of expression in leaves. RsSOD3/5, RsMSD1/2, and RdMSD2 were expressed at higher levels in stems, and RdCSD1/6 and RdMSD2 were expressed at higher levels in roots. RsCSD4 and RdCSD3 were expressed only in the leaves. In other tissues, the expression levels were very low and almost undetected. RsCSD1/2, RsFSD2, RdCSD2, and RdFSD1/2 were expressed in flowers and roots at low levels.

3.8. Expression of RsSODs and RdSODs under Exogenous Reagents and High-Temperature Stress

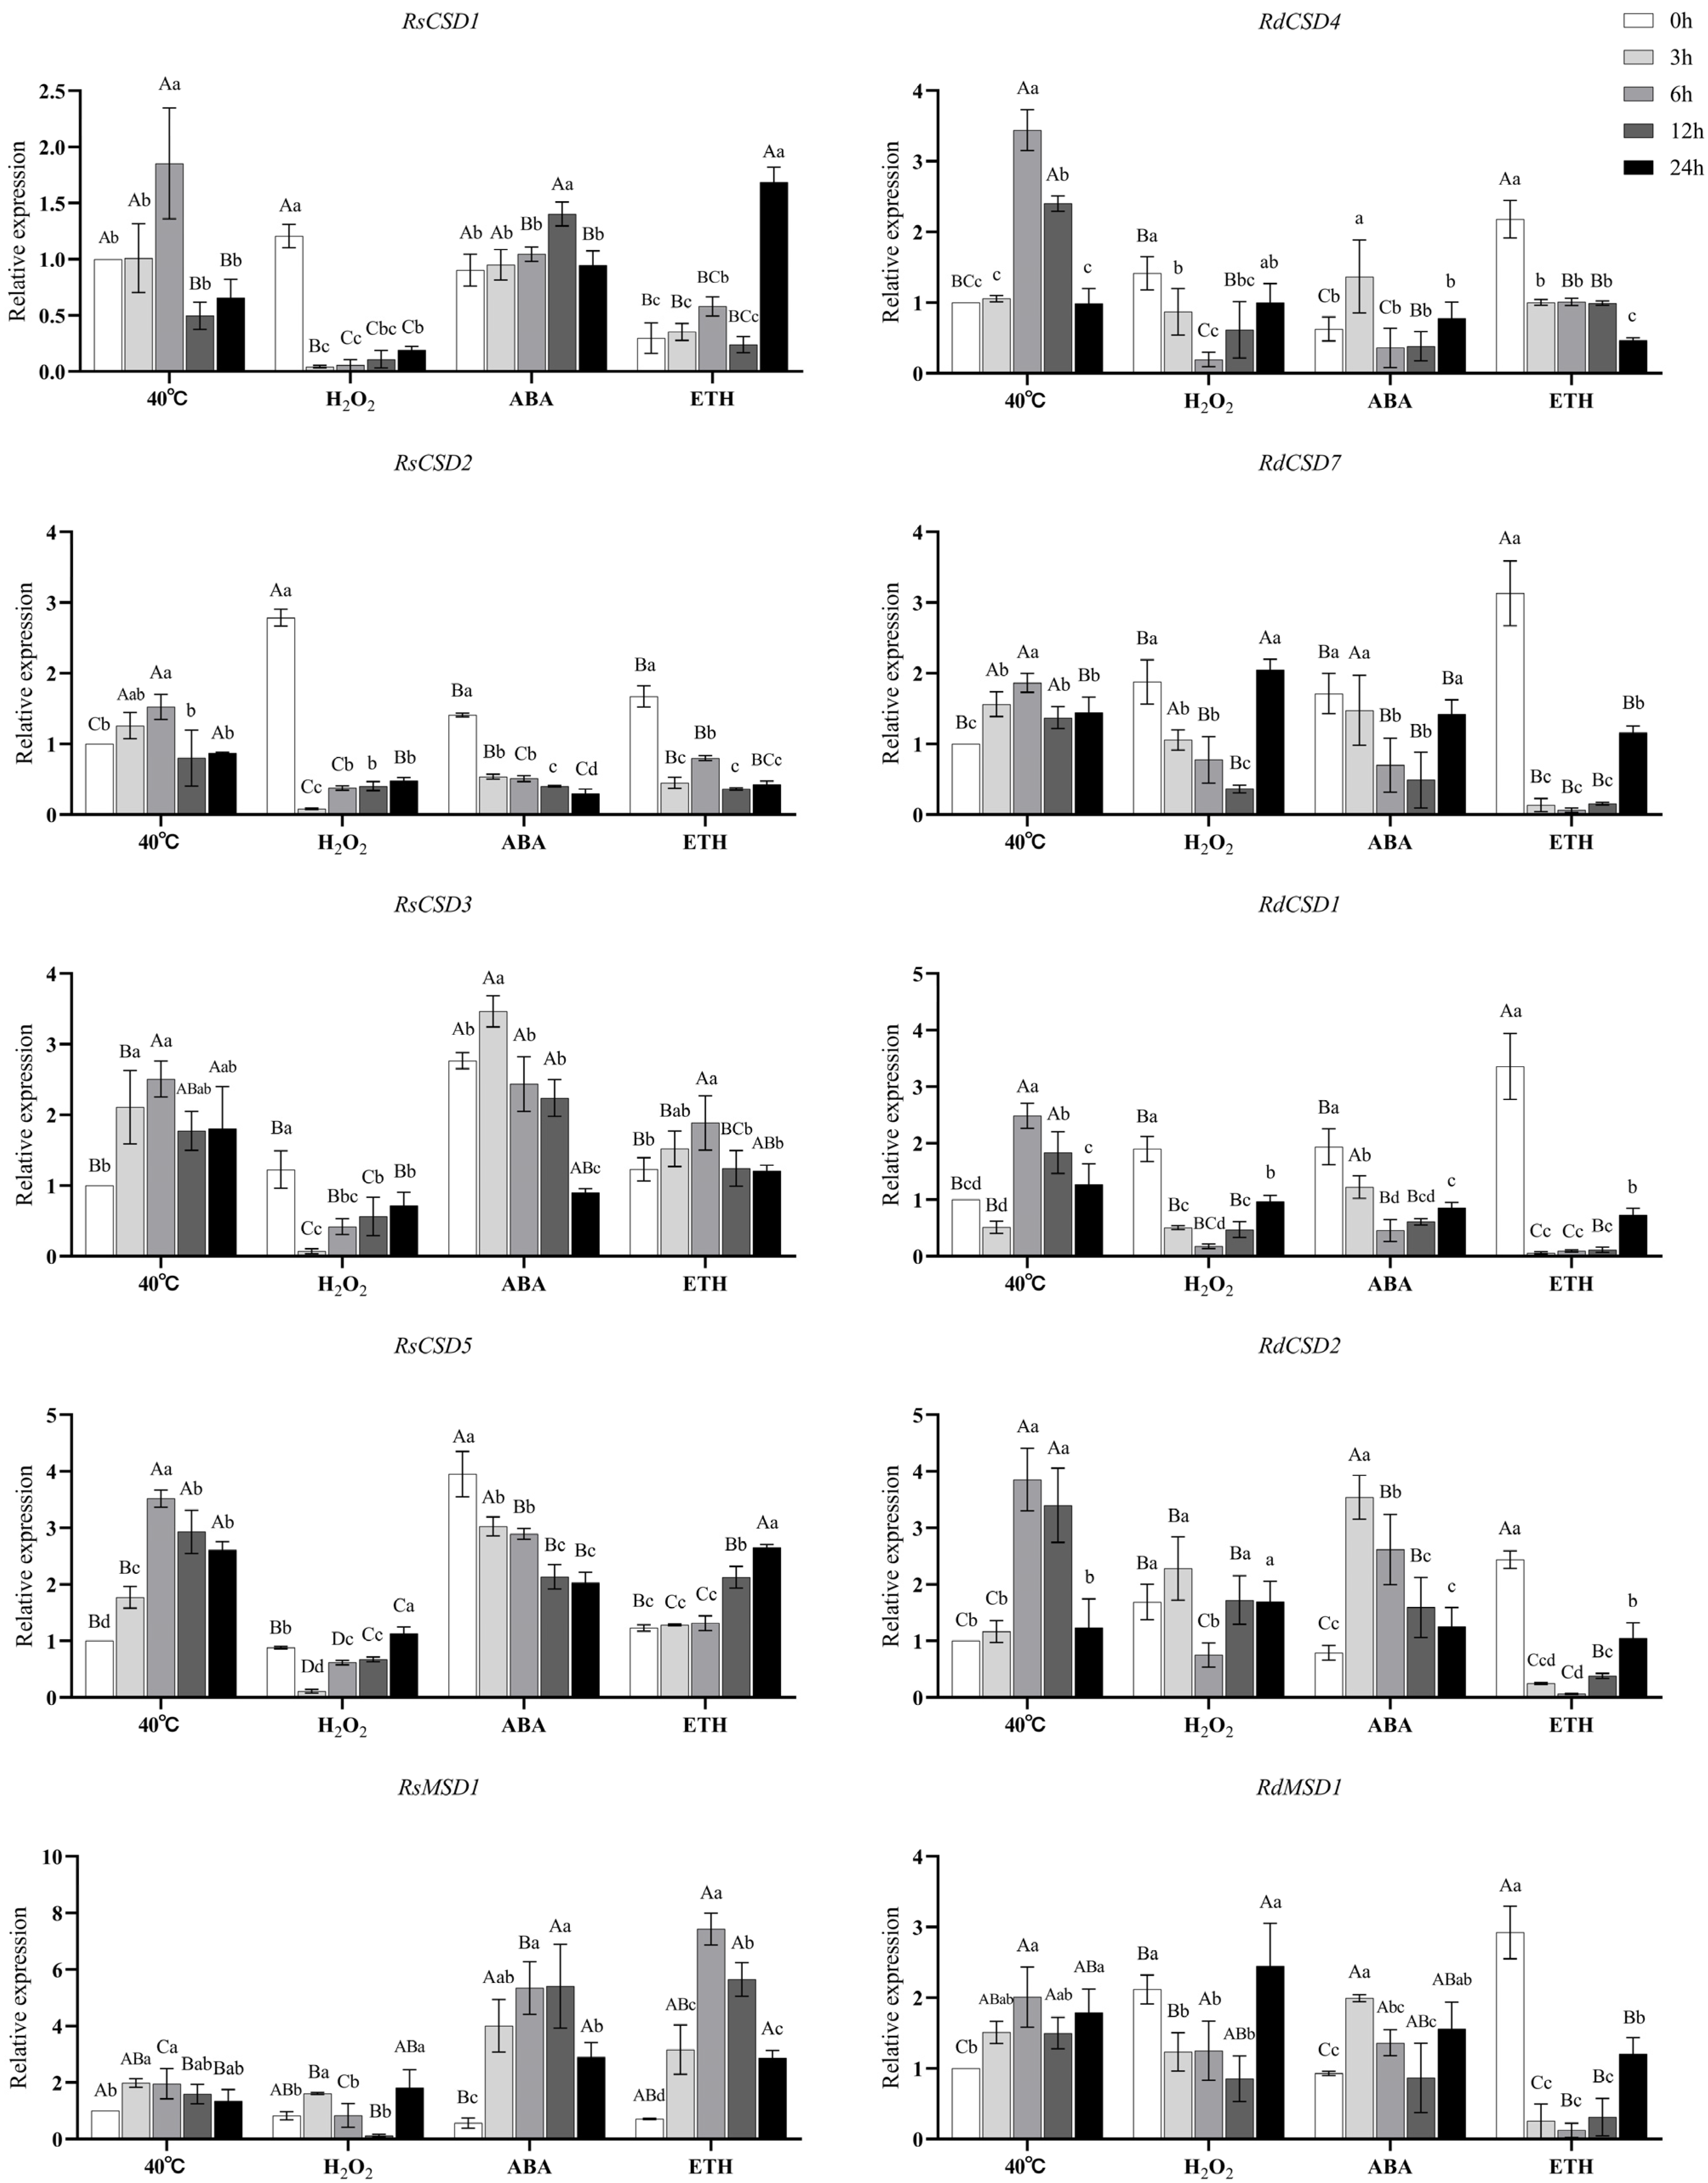
The expressions of 20 SOD genes were examined by qRT–PCR under heat stress and direct heat stress after ABA, H2O2, and ETH treatments (Figure 7, Table S5). Among them, RsCSD4, RdCSD3/5, and RdFSD2 expressions were nearly undetectable after heat stress (details not displayed in the figure).
All detected SOD gene members were differentially expressed under high-temperature stress and showed similar expression patterns, except for RsMSD1, which all peaked after 6, 12, or 24 h of high-temperature stress (Figure 7). Within 24 h, the expression levels of five genes in R. simsii (RsCSD3/5, RsFSD1/2, and RsMSD1) and five genes in R. delavayi (RdCSD2/7, RdFSD1, and RdMSD1/2) were notably higher than their initial levels. RsCSD3/5 and RsFSD2 exhibited the most upregulation at 6 h (or 12 h), showing fold increases of 2.51, 3.52, and 2.91, respectively. In R. delavayi, the genes significantly upregulated were RdCSD1/2/4/6 and RdFSD1, among which RdCSD2 and RdFSD1 correspond to homologous genes RsCSD5 and RsFSD2, respectively (refer to Figure 1). These findings suggest these two genes’ crucial roles in conferring Rhododendron’s heat tolerance.
Upon exposure to various exogenous reagents (before high-temperature stress treatment, 0 h), the response profiles of individual gene family members to H2O2, ABA, and ETH treatments differed, with inconsistent expression trends of homologous genes observed in the two Rhododendron species. The expression of only three genes, RsCSD1/2/3, was upregulated in R. simsii after H2O2 pretreatment. The expressions of all members of the RdSOD gene family were upregulated, with the most significant upregulation of RdMSD2 (by 3.3-fold compared to the control), and RsCSD1/2 were homologous to RdCSD4 and RdCSD7, respectively (Figure 1). After initiating high-temperature stress, the area treated with H2O2 showed an overall lower expression level of RsSOD genes compared to the directly heat-stressed area at the same time. However, all members of the RdSOD gene family exhibited lower expression levels at the onset of high-temperature stress compared to the directly heat-stressed area, with certain gene family members (RdCSD7, RdMSD1, and RdFSD1) demonstrating significant upregulation in expression at later stages.
Following pre-treatment with ABA, the expressions of RsCSD2/3/5, RdCSD1/6/7, and RdMSD2 were elevated, with RsCSD2 sharing homology with RdCSD7 (see Figure 1), while the expressions of other gene members were reduced. After the onset of high-temperature stress, the expressions of all RsSODs (except RsCSD2) were upregulated at different times in the ABA-treated area compared with the same stress time in the direct high-temperature stress-treated area. Among them, RsMSD1 and RsFSD1/2 were the most significantly upregulated, and their expression levels were all higher than those of the control group within 24 h and reached 5.41, 5.31, and 5.29-fold increases in their peaks at 6 h (or 12 h), respectively. Furthermore, the gene members of RdCSD1/2/4/6 and RdMSD1 exhibited augmented expression in the early phase of high-temperature stress (3 h). In contrast, during the later phase, all RdSOD gene members showed reduced expression levels compared to the direct high-temperature stress treatment zone.
After pretreatment with ETH, the expression of only three genes from the RsSOD family, namely, RsCSD2/3/5, increased. In contrast, all RdSOD genes exhibited a notable upregulation, of which RsCSD2/5 belonged to the homologous genes with RdCSD7/2, respectively (illustrated in Figure 1). Following the onset of high-temperature stress, the ETH-treated region showed a generally lower expression level of RsCSD1/2/3/5 genes compared to the area directly subjected to high-temperature stress at the same time. However, RsCSD1 showed a significant upregulation at 24 h of heat stress. RsMSD1/2 and RsFSD1/2 showed an overall higher expression level after heat stress, except for RsFSD2, which experienced a noticeable downregulation at 24 h of heat stress. All RdSOD gene members showed an overall low expression level.

4. Discussion

SOD plays a crucial role in various plant growth processes and their ability to resist environmental stress [42]. The SOD gene family is known to be present in diverse plant species, such as G. max [12], S. miltiorrhiza [15], and Setaria italica [43]. In this study, the comprehensive characterization of SOD gene families in R. simsii and R. delavayi enabled the identification of 9 and 11 SOD genes, respectively. Previous research has indicated that the number of SOD genes differs across plant species, with this variability not directly correlating with genome size changes. Discrepancies in the SOD gene count among plant species are likely due to gene duplications, which can involve segmental and tandem duplications and are vital for the divergence of SOD genes. Gene duplication events within SOD genes have been observed in many plant species, such as segmental and tandem duplications in tomato SOD genes [13] and tandem duplications in cucumber SOD genes [16]. In this study, an intraspecific collinearity analysis detected segmental duplications between a couple of pairs of RsSOD genes (RsMSD1/2, RsCSD1/5), indicating that fragment duplication may have significantly contributed to the expansion of RsSODs (Figure 3).
Phylogenetic analyses indicated a close relationship between Cu/ZnSODs and FeSODs/MnSODs. Phylogenetic analyses of SOD proteins of R. simsii and R. delavayi with several other plants showed that the two formed two separate groups based on bootstrap values (Figure 1), which is consistent with previous findings [44]. Orthologous SODs from different plant species clustered together, with a clear separation between monocotyledons and dicotyledons, reflecting the evolutionary connections between these plant groups. The unique evolutionary relationship between monocot SOD and dicot SOD can be used as a basis to explain the common ancestry of the two groups of plants [45]. The conserved motif analysis of SOD proteins supported the phylogenetic findings (Figure 2). Subgroups with similar motifs shared common features, including motif distribution, position, and length, among the SOD proteins within each group (Figure 2).
In this study, the gene structure analysis also revealed a high level of evolutionary conservation among SOD proteins. Previous research has indicated that the number of introns and the organization of intron–exon structures in plant SOD genes are highly conserved, with most cytosol and chloroplast genes containing seven introns [3]. However, our investigation identified a variation in the number of introns, ranging from 5 to 9 for RsSODs and from 8 to 16 for RdSODs (Figure 2). Previous reports have shown that this diversity in intron numbers can be attributed to three main mechanisms: insertion/deletion, exonization/pseudoexonization, and exon/intron gain/loss [46].
As in other plants, members of the RsSOD and RdSOD gene families exhibit tissue-specific expression patterns [12,13]. Among the 20 SOD gene family members, SODs were expressed in at least one of the tissues, except for RdCSD5, which was not detected in the roots, stems, leaves, or flowers (Figure 6). Notably, all the identified SODs exhibited high expression levels in leaves (Figure 6). This suggests that RdCSD5, similar to CsFSD3, may function as a pseudogene [16]. RdFSD1 and RdMSD1 showed constitutive expression without significant variations across the four tissues, as reported previously, reminiscent of the constitutive expression of SlSOD1/9 genes [13]. However, RdCSD1/6 and RdMSD2 exhibited high expression levels in the roots, aligning with the high expression of cereal SiCSD1/3 and SiMSD genes in roots and stems [43].
In this study, following exposure to high-temperature stress, all identified SOD genes exhibited increased expression, with some showing similar expression profiles (see Figure 7). RsCSD5 and RsFSD2, which share homology with RdCSD2 and RdFSD1, respectively, were notably upregulated in both Rhododendron species after the high-temperature stress treatments, indicating their potential significance in heat tolerance mechanisms in Rhododendron. SiFSD3 (as depicted in Figure 1), a member of the same subfamily as RsCSD5, demonstrated decreased expression levels following drought treatment, increased expression after exposure to cold, and slight variations in expression after salt treatment [43]. RsFSD2 is of the same subfamily as GmFSD4 in soybean (Figure 1), and GmFSD4 was significantly upregulated in the roots after alkaline treatment [12]. This observation implies that SOD genes may serve diverse roles in scavenging ROS induced by distinct abiotic stresses, and could be crucial for plant adaptation to challenging environments [16].
The upregulation of RsCSD3/5 and RdCSD1/6 occurred following ABA pretreatment and the initiation of high-temperature stress (Figure 7), indicating that ABA might play a role in regulating SOD expression during high-temperature stress. Upon analyzing the promoters, it was observed that six RsSOD genes (RsCSD2/3/4, RsMSD1/2, and RsFSD2) and eight RdSOD genes (RdCSD1/2/5/6/7, RdMSD2, and RdFSD1/2) contained one to eight ABA-responsive elements (ABREs) (Figure 5). Interestingly, despite the absence of ABRE cis-elements, the expression of the RsCSD5 gene was significantly induced by ABA, suggesting alternative regulatory mechanisms in response to ABA treatment. Further investigations revealed that miRNA-mediated regulation at the post-transcriptional level influences SOD gene expression under ABA treatment [47]. This implies a potential synergistic mediation of the SOD gene response to ABA treatment by both ABRE and miRNA [7].
Research has indicated that phytohormones can trigger signal transduction pathways in plant stress responses [48]. SOD genes serve as crucial regulators in the ethylene response [49,50]. In this investigation, the expression of RsCSD3/5 was elevated following ETH pretreatment and during high-temperature stress (Figure 7), indicating that ETH might facilitate plant heat tolerance via the regulation of SOD genes. A cross-regulation mechanism exists among various plant hormones during high-temperature stress. For example, the heat stress tolerance of the ethylene response factor (AtERF53) is stimulated by ABA [51]. Moreover, the heat tolerance of CaWRKY6 in chili peppers is positively modulated by ethylene (ET) and ABA [52]. Dong et al. [53] also proposed that the enhanced thermotolerance in the ET biosynthesis mutant (acs7) could be attributed to either signaling pathways or ABA synthesis in plants, indicating an antagonistic interplay between these two hormones. Furthermore, six other hormone-responsive elements (P-box, GARE-motif, TATC-box, TGA-box, AuxRR-core, and TGA-element) are present in the specific promoter regions of RsSODs and RdSODs. Their transcriptional regulation under auxin and gibberellin treatment warrants further exploration in subsequent experiments.

5. Conclusions

This study presented an extensive examination of the SOD gene family in R. simsii and R. delavayi. Here, 9 RsSOD genes and 11 RdSOD genes were identified and analyzed. We examined the phylogenetic relationships, sequence features, gene architecture, collinearity patterns, cis-acting elements, and protein interaction networks of RsSODs and RdSODs, along with their responses to ABA, H2O2, and ETH treatments and high-temperature stress. The findings indicate that various SOD genes may undertake distinct functions in combating different abiotic stresses. This investigation enhances our comprehension of the potential roles of RsSOD and RdSOD genes under environmental stress conditions. This provides a better understanding that will help in future to elucidate the function of the SOD gene family in Rhododendron.

Supplementary Materials

The following supporting information can be downloaded at: https://www.mdpi.com/article/10.3390/f15060931/s1, Supplementary Table S1: Primer information for qRT-PCR gene expression analysis. Supplementary Table S2: Physicochemical properties of proteins from the Rhododendron simsii and Rhododendron delavayi SOD gene families. Supplementary Table S3: Protein IDs for the SOD gene family used to construct phylogenetic relationships. Supplementary Table S4: Information on cis-elements detected in the RsSOD and RdSOD promoter regions. Supplementary Table S5: Expression profiles of RsSOD and RdSOD genes under various stress treatments. Supplementary Figure S1: Interaction network of RsSOD and RdSOD proteins.

Author Contributions

X.G. and L.H. designed the research. X.G., L.H. and F.C. performed the study. X.G., Y.Y., M.T. and L.H. analyzed the data. X.G., J.G. and L.H. wrote the manuscript. All authors have read and agreed to the published version of the manuscript.

Funding

This project was funded by Project supported by the Joint Fund of the National Natural Science Foundation of China and the Karst Science Research Center of Guizhou province (Grant No. U1812401), Guizhou forestry scientific research project, Qianlinkehe [2022] No. 28.

Data Availability Statement

All data are available upon reasonable request.

Conflicts of Interest

The authors declare that they have no known competing financial interests or personal relationships that affect the work covered in this article.

References

  1. Perez, I.B.; Brown, P.J. The Role of ROS Signaling in Cross-Tolerance: From Model to Crop. Front. Plant Sci. 2014, 5, 754. [Google Scholar] [CrossRef] [PubMed]
  2. Das, K.; Roychoudhury, A. Reactive Oxygen Species (ROS) and Response of Antioxidants as ROS-Scavengers during Environmental Stress in Plants. Front. Environ. Sci. 2014, 2, 53. [Google Scholar] [CrossRef]
  3. Fink, R.C.; Scandalios, J.G. Molecular Evolution and Structure--Function Relationships of the Superoxide Dismutase Gene Families in Angiosperms and Their Relationship to Other Eukaryotic and Prokaryotic Superoxide Dismutases. Arch. Biochem. Biophys. 2002, 399, 19–36. [Google Scholar] [CrossRef] [PubMed]
  4. Tang, Y.; Bao, X.; Zhi, Y.; Wu, Q.; Guo, Y.; Yin, X.; Zeng, L.; Li, J.; Zhang, J.; He, W.; et al. Overexpression of a MYB Family Gene, OsMYB6, Increases Drought and Salinity Stress Tolerance in Transgenic Rice. Front. Plant Sci. 2019, 10, 168. [Google Scholar] [CrossRef] [PubMed]
  5. Ji, H.S.; Bang, S.G.; Ahn, M.-A.; Kim, G.; Kim, E.; Eom, S.H.; Hyun, T.K. Molecular Cloning and Functional Characterization of Heat Stress-Responsive Superoxide Dismutases in Garlic (Allium sativum L.). Antioxidants 2021, 10, 815. [Google Scholar] [CrossRef] [PubMed]
  6. Wang, L.; Yao, L.; Hao, X.; Li, N.; Wang, Y.; Ding, C.; Lei, L.; Qian, W.; Zeng, J.; Yang, Y.; et al. Transcriptional and Physiological Analyses Reveal the Association of ROS Metabolism with Cold Tolerance in Tea Plant. Environ. Exp. Bot. 2019, 160, 45–58. [Google Scholar] [CrossRef]
  7. Feng, X.; Lai, Z.; Lin, Y.; Lai, G.; Lian, C. Genome-Wide Identification and Characterization of the Superoxide Dismutase Gene Family in Musa acuminata Cv. Tianbaojiao (AAA Group). BMC Genom. 2015, 16, 823. [Google Scholar] [CrossRef]
  8. Alscher, R.G. Role of Superoxide Dismutases (SODs) in Controlling Oxidative Stress in Plants. J. Exp. Bot. 2002, 53, 1331–1341. [Google Scholar] [CrossRef]
  9. Bowler, C.; Montagu, M.V.; Inze, D. Superoxide Dismutase and Stress Tolerance. Annu. Rev. Plant Biol. 1992, 43, 83–116. [Google Scholar] [CrossRef]
  10. Tan, M.; Lu, J.; Zhang, A.; Hu, B.; Zhu, X.; Li, W. The distribution and cooperation of antioxidant (iso) enzymes and antioxidants in different subcellular compartments in maize leaves during water stress. J. Plant Growth Regul. 2011, 30, 255–271. [Google Scholar] [CrossRef]
  11. Li, X.; Cai, J.; Liu, F.; Dai, T.; Cao, W.; Jiang, D. Cold Priming Drives the Sub-Cellular Antioxidant Systems to Protect Photosynthetic Electron Transport against Subsequent Low Temperature Stress in Winter Wheat. Plant Physiol. Biochem. 2014, 82, 34–43. [Google Scholar] [CrossRef] [PubMed]
  12. Lu, W.; Duanmu, H.; Qiao, Y.; Jin, X.; Yu, Y.; Yu, L.; Chen, C. Genome-Wide Identification and Characterization of the Soybean SOD Family during Alkaline Stress. PeerJ 2020, 8, e8457. [Google Scholar] [CrossRef]
  13. Feng, K.; Yu, J.; Cheng, Y.; Ruan, M.; Wang, R.; Ye, Q.; Zhou, G.; Li, Z.; Yao, Z.; Yang, Y.; et al. The SOD Gene Family in Tomato: Identification, Phylogenetic Relationships, and Expression Patterns. Front. Plant Sci. 2016, 7, 1279. [Google Scholar] [CrossRef] [PubMed]
  14. Liu, J.; Xu, L.; Shang, J.; Hu, X.; Yu, H.; Wu, H.; Lv, W.; Zhao, Y. Genome-Wide Analysis of the Maize Superoxide Dismutase (SOD) Gene Family Reveals Important Roles in Drought and Salt Responses. Genet. Mol. Biol. 2021, 44, e20210035. [Google Scholar] [CrossRef]
  15. Han, L.-M.; Hua, W.-P.; Cao, X.-Y.; Yan, J.-A.; Chen, C.; Wang, Z.-Z. Genome-Wide identification and Expression Analysis of the Superoxide dismutase (SOD) Gene Family in Salvia miltiorrhiza. Gene 2020, 742, 144603. [Google Scholar] [CrossRef]
  16. Zhou, Y.; Hu, L.; Wu, H.; Jiang, L.; Liu, S. Genome-Wide Identification and Transcriptional Expression Analysis of Cucumber Superoxide Dismutase (SOD) Family in Response to Various Abiotic Stresses. Int. J. Genom. 2017, 2017, 7243973. [Google Scholar] [CrossRef]
  17. Zhou, C.; Zhu, C.; Fu, H.; Li, X.; Chen, L.; Lin, Y.; Lai, Z.; Guo, Y. Genome-Wide Investigation of Superoxide Dismutase (SOD) Gene Family and Their Regulatory miRNAs Reveal the Involvement in Abiotic Stress and Hormone Response in Tea Plant (Camellia sinensis). PLoS ONE 2019, 14, e0223609. [Google Scholar] [CrossRef] [PubMed]
  18. Wang, W.; Xia, M.; Chen, J.; Deng, F.; Yuan, R.; Zhang, X.; Shen, F. Genome-Wide Analysis of Superoxide Dismutase Gene Family in Gossypium raimondii and G. arboreum. Plant Gene 2016, 6, 18–29. [Google Scholar] [CrossRef]
  19. Yu, Q.; Osborne, L.D.; Rengel, Z. Increased tolerance to Mn deficiency in transgenic tobacco overproducing superoxide dismutase. Ann. Bot. 1999, 84, 543–547. [Google Scholar] [CrossRef]
  20. Tang, L.; Kwon, S.-Y.; Kim, S.-H.; Kim, J.-S.; Choi, J.S.; Cho, K.Y.; Sung, C.K.; Kwak, S.-S.; Lee, H.-S. Enhanced Tolerance of Transgenic Potato Plants Expressing Both Superoxide Dismutase and Ascorbate Peroxidase in Chloroplasts against Oxidative Stress and High Temperature. Plant Cell Rep. 2006, 25, 1380–1386. [Google Scholar] [CrossRef]
  21. Wu, Z.Y.; Raven, P.H.; Hong, D.Y. Flora of China. Vol. 14 (Apiaceae through Ericaceae); Science Press: Beijing, China; Missouri Botanical Garden Press: St. Louis, MO, USA, 2005; pp. 242–440. [Google Scholar]
  22. Geng, X.M.; Liu, P.; Li, Z.F.; Xiao, L.Y. Improving heat tolerance of Rhododendron by H2O2 pretreatment. J. Anhui Agric. Univ. 2019, 46, 167–172, (In Chinese with English Abstract). [Google Scholar]
  23. Shen, H.F.; Zhao, B.; Xu, J.J.; Liang, W.; Huang, W.M.; Li, H.H. Effects of Heat Stress on Changes in Physiology and Anatomy in Two Cultivars of Rhododendron. S. Afr. J. Bot. 2017, 112, 338–345. [Google Scholar] [CrossRef]
  24. Zhao, H.; Geng, X.M.; Wang, L.L.; Xu, S.D. Research on the effect of ethylene in heat resistance mechanism of Rhododendron. Acta Hortic. Sin. 2022, 49, 561–570, (In Chinese with English Abstract). [Google Scholar]
  25. Geng, X.M.; Xiao, L.Y.; Zhao, H.; Liu, P. Sub-cellular Localization of ROS-scavenging System in Rhododendron Leaves under Heat Stress and H2O2 Pretreatment. Northwest Bot. 2019, 39, 791–800, (In Chinese with English Abstract). [Google Scholar]
  26. Zhang, L.; Xu, P.; Cai, Y.; Ma, L.; Li, S.; Li, S.; Xie, W.; Song, J.; Peng, L.; Yan, H.; et al. The Draft Genome Assembly of Rhododendron delavayi Franch. var. delavayi. Gigascience 2017, 6, 1–11. [Google Scholar] [CrossRef]
  27. Yang, F.-S.; Nie, S.; Liu, H.; Shi, T.-L.; Tian, X.-C.; Zhou, S.-S.; Bao, Y.-T.; Jia, K.-H.; Guo, J.-F.; Zhao, W.; et al. Chromosome-Level Genome Assembly of a Parent Species of Widely Cultivated Azaleas. Nat. Commun. 2020, 11, 5269. [Google Scholar] [CrossRef] [PubMed]
  28. Finn, R.D.; Clements, J.; Eddy, S.R. HMMER Web Server: Interactive Sequence Similarity Searching. Nucleic Acids Res. 2011, 39, W29–W37. [Google Scholar] [CrossRef] [PubMed]
  29. Marchler-Bauer, A.; Lu, S.; Anderson, J.B.; Chitsaz, F.; Derbyshire, M.K.; DeWeese-Scott, C.; Fong, J.H.; Geer, L.Y.; Geer, R.C.; Gonzales, N.R.; et al. CDD: A Conserved Domain Database for the Functional Annotation of Proteins. Nucleic Acids Res. 2011, 39, D225–D229. [Google Scholar] [CrossRef]
  30. Wilkins, M.R.; Gasteiger, E.; Bairoch, A.; Sanchez, J.C.; Williams, K.L.; Appel, R.D.; Hochstrasser, D.F. Protein Identification and Analysis Tools in the ExPASy Server. Methods Mol. Biol. 1999, 112, 531–552. [Google Scholar] [CrossRef]
  31. Kliebenstein, D.J.; Monde, R.A.; Last, R.L. Superoxide Dismutase in Arabidopsis: An Eclectic Enzyme Family with Disparate Regulation and Protein Localization. Plant Physiol. 1998, 118, 637–650. [Google Scholar] [CrossRef]
  32. Nath, K.; Kumar, S.; Poudyal, R.S.; Yang, Y.N.; Timilsina, R.; Park, Y.S.; Nath, J.; Chauhan, P.S.; Pant, B.; Lee, C.-H. Developmental Stage-Dependent Differential Gene Expression of Superoxide Dismutase Isoenzymes and Their Localization and Physical Interaction Network in Rice (Oryza sativa L.). Genes. Genom. 2014, 36, 45–55. [Google Scholar] [CrossRef]
  33. Song, J.; Zeng, L.; Chen, R.; Wang, Y.; Zhou, Y. In Silico Identification and Expression Analysis of Superoxide Dismutase (SOD) Gene Family in Medicago Truncatula. 3 Biotech 2018, 8, 348. [Google Scholar] [CrossRef] [PubMed]
  34. Yuan, J.; Amend, A.; Borkowski, J.; DeMarco, R.; Bailey, W.; Liu, Y.; Xie, G.; Blevins, R. MULTICLUSTAL: A Systematic Method for Surveying Clustal W Alignment Parameters. Bioinformatics 1999, 15, 862–863. [Google Scholar] [CrossRef] [PubMed]
  35. Qiao, X.; Yin, H.; Li, L.; Wang, R.; Wu, J.; Wu, J.; Zhang, S. Different Modes of Gene Duplication Show Divergent Evolutionary Patterns and Contribute Differently to the Expansion of Gene Families Involved in Important Fruit Traits in Pear (Pyrus bretschneideri). Front. Plant Sci. 2018, 9, 161. [Google Scholar] [CrossRef] [PubMed]
  36. Wang, Y.; Tang, H.; DeBarry, J.D.; Tan, X.; Li, J.; Wang, X.; Lee, T.; Jin, H.; Marler, B.; Guo, H.; et al. MCScanX: A Toolkit for Detection and Evolutionary Analysis of Gene Synteny and Collinearity. Nucleic Acids Res. 2012, 40, e49. [Google Scholar] [CrossRef] [PubMed]
  37. Chen, C.; Chen, H.; Zhang, Y.; Thomas, H.R.; Frank, M.H.; He, Y.; Xia, R. TBtools: An Integrative Toolkit Developed for Interactive Analyses of Big Biological Data. Mol. Plant 2020, 13, 1194–1202. [Google Scholar] [CrossRef] [PubMed]
  38. Rombauts, S.; Déhais, P.; Van Montagu, M.; Rouzé, P. PlantCARE, a Plant Cis-Acting Regulatory Element Database. Nucleic Acids Res. 1999, 27, 295–296. [Google Scholar] [CrossRef] [PubMed]
  39. Bailey, T.L.; Boden, M.; Buske, F.A.; Frith, M.; Grant, C.E.; Clementi, L.; Ren, J.; Li, W.W.; Noble, W.S. MEME Suite: Tools for Motif Discovery and Searching. Nucleic Acids Res. 2009, 37, W202–W208. [Google Scholar] [CrossRef]
  40. Szklarczyk, D.; Gable, A.L.; Lyon, D.; Junge, A.; Wyder, S.; Huerta-Cepas, J.; Simonovic, M.; Doncheva, N.T.; Morris, J.H.; Bork, P.; et al. STRING V11: Protein-Protein Association Networks with Increased Coverage, Supporting Functional Discovery in Genome-Wide Experimental Datasets. Nucleic Acids Res. 2019, 47, D607–D613. [Google Scholar] [CrossRef]
  41. Li, X.L.; Hua, Z.R.; Zhang, F.; Wang, X.J. Evaluation of Heat Tolerance of Different Rhododendron Varieties. Acta Agric. Jiangxi 2022, 34, 82–86, (In Chinese with English Abstract). [Google Scholar] [CrossRef]
  42. Fernández-Ocaña, A.; Chaki, M.; Luque, F.; Gómez-Rodríguez, M.V.; Carreras, A.; Valderrama, R.; Begara-Morales, J.C.; Hernández, L.E.; Corpas, F.J.; Barroso, J.B. Functional Analysis of Superoxide Dismutases (SODs) in Sunflower under Biotic and Abiotic Stress Conditions. Identification of Two New Genes of Mitochondrial Mn-SOD. J. Plant Physiol. 2011, 168, 1303–1308. [Google Scholar] [CrossRef] [PubMed]
  43. Wang, T.; Song, H.; Zhang, B.; Lu, Q.; Liu, Z.; Zhang, S.; Guo, R.; Wang, C.; Zhao, Z.; Liu, J.; et al. Genome-Wide Identification, Characterization, and Expression Analysis of Superoxide Dismutase (SOD) Genes in Foxtail Millet (Setaria italica L.). 3Biotech 2018, 8, 486. [Google Scholar] [CrossRef] [PubMed]
  44. Wang, W.; Xia, M.; Chen, J.; Deng, F.; Yuan, R.; Zhang, X.; Shen, F. Data Set for Phylogenetic Tree and RAMPAGE Ramachandran Plot Analysis of SODs in Gossypium raimondii and G. arboreum. Data Brief 2016, 9, 345–348. [Google Scholar] [CrossRef] [PubMed]
  45. McClung, C.R. A Modern Circadian Clock in the Common Angiosperm Ancestor of Monocots and Eudicots. BMC Biol. 2010, 8, 55. [Google Scholar] [CrossRef]
  46. Xu, G.; Guo, C.; Shan, H.; Kong, H. Divergence of Duplicate Genes in Exon-Intron Structure. Proc. Natl. Acad. Sci. USA 2012, 109, 1187–1192. [Google Scholar] [CrossRef] [PubMed]
  47. Lu, Y.; Feng, Z.; Bian, L.; Xie, H.; Liang, J. miR398 Regulation in Rice of the Responses to Abiotic and Biotic Stresses Depends on CSD1 and CSD2 Expression. Funct. Plant Biol. 2010, 38, 44–53. [Google Scholar] [CrossRef] [PubMed]
  48. Raja, V.; Majeed, U.; Kang, H.; Andrabi, K.I.; John, R. Abiotic Stress: Interplay between ROS, Hormones and MAPKs. Environ. Exp. Bot. 2017, 137, 142–157. [Google Scholar] [CrossRef]
  49. Prerostova, S.; Dobrev, P.I.; Kramna, B.; Gaudinova, A.; Knirsch, V.; Spichal, L.; Zatloukal, M.; Vankova, R. Heat Acclimation and Inhibition of Cytokinin Degradation Positively Affect Heat Stress Tolerance of Arabidopsis. Front. Plant Sci. 2020, 11, 87. [Google Scholar] [CrossRef] [PubMed]
  50. Larkindale, J.; Huang, B. Thermotolerance and Antioxidant Systems in Agrostis stolonifera: Involvement of Salicylic Acid, Abscisic Acid, Calcium, Hydrogen Peroxide, and Ethylene. J. Plant Physiol. 2004, 161, 405–413. [Google Scholar] [CrossRef]
  51. Hsieh, E.-J.; Cheng, M.-C.; Lin, T.-P. Functional Characterization of an Abiotic Stress-Inducible Transcription Factor AtERF53 in Arabidopsis Thaliana. Plant Mol. Biol. 2013, 82, 223–237. [Google Scholar] [CrossRef]
  52. Cai, H.; Yang, S.; Yan, Y.; Xiao, Z.; Cheng, J.; Wu, J.; Qiu, A.; Lai, Y.; Mou, S.; Guan, D.; et al. CaWRKY6 Transcriptionally Activates CaWRKY40, Regulates Ralstonia Solanacearum Resistance, and Confers High-Temperature and High-Humidity Tolerance in Pepper. J. Exp. Bot. 2015, 66, 3163–3174. [Google Scholar] [CrossRef] [PubMed]
  53. Dong, H.; Zhen, Z.; Peng, J.; Chang, L.; Gong, Q.; Wang, N.N. Loss of ACS7 Confers Abiotic Stress Tolerance by Modulating ABA Sensitivity and Accumulation in Arabidopsis. J. Exp. Bot. 2011, 62, 4875–4887. [Google Scholar] [CrossRef] [PubMed]
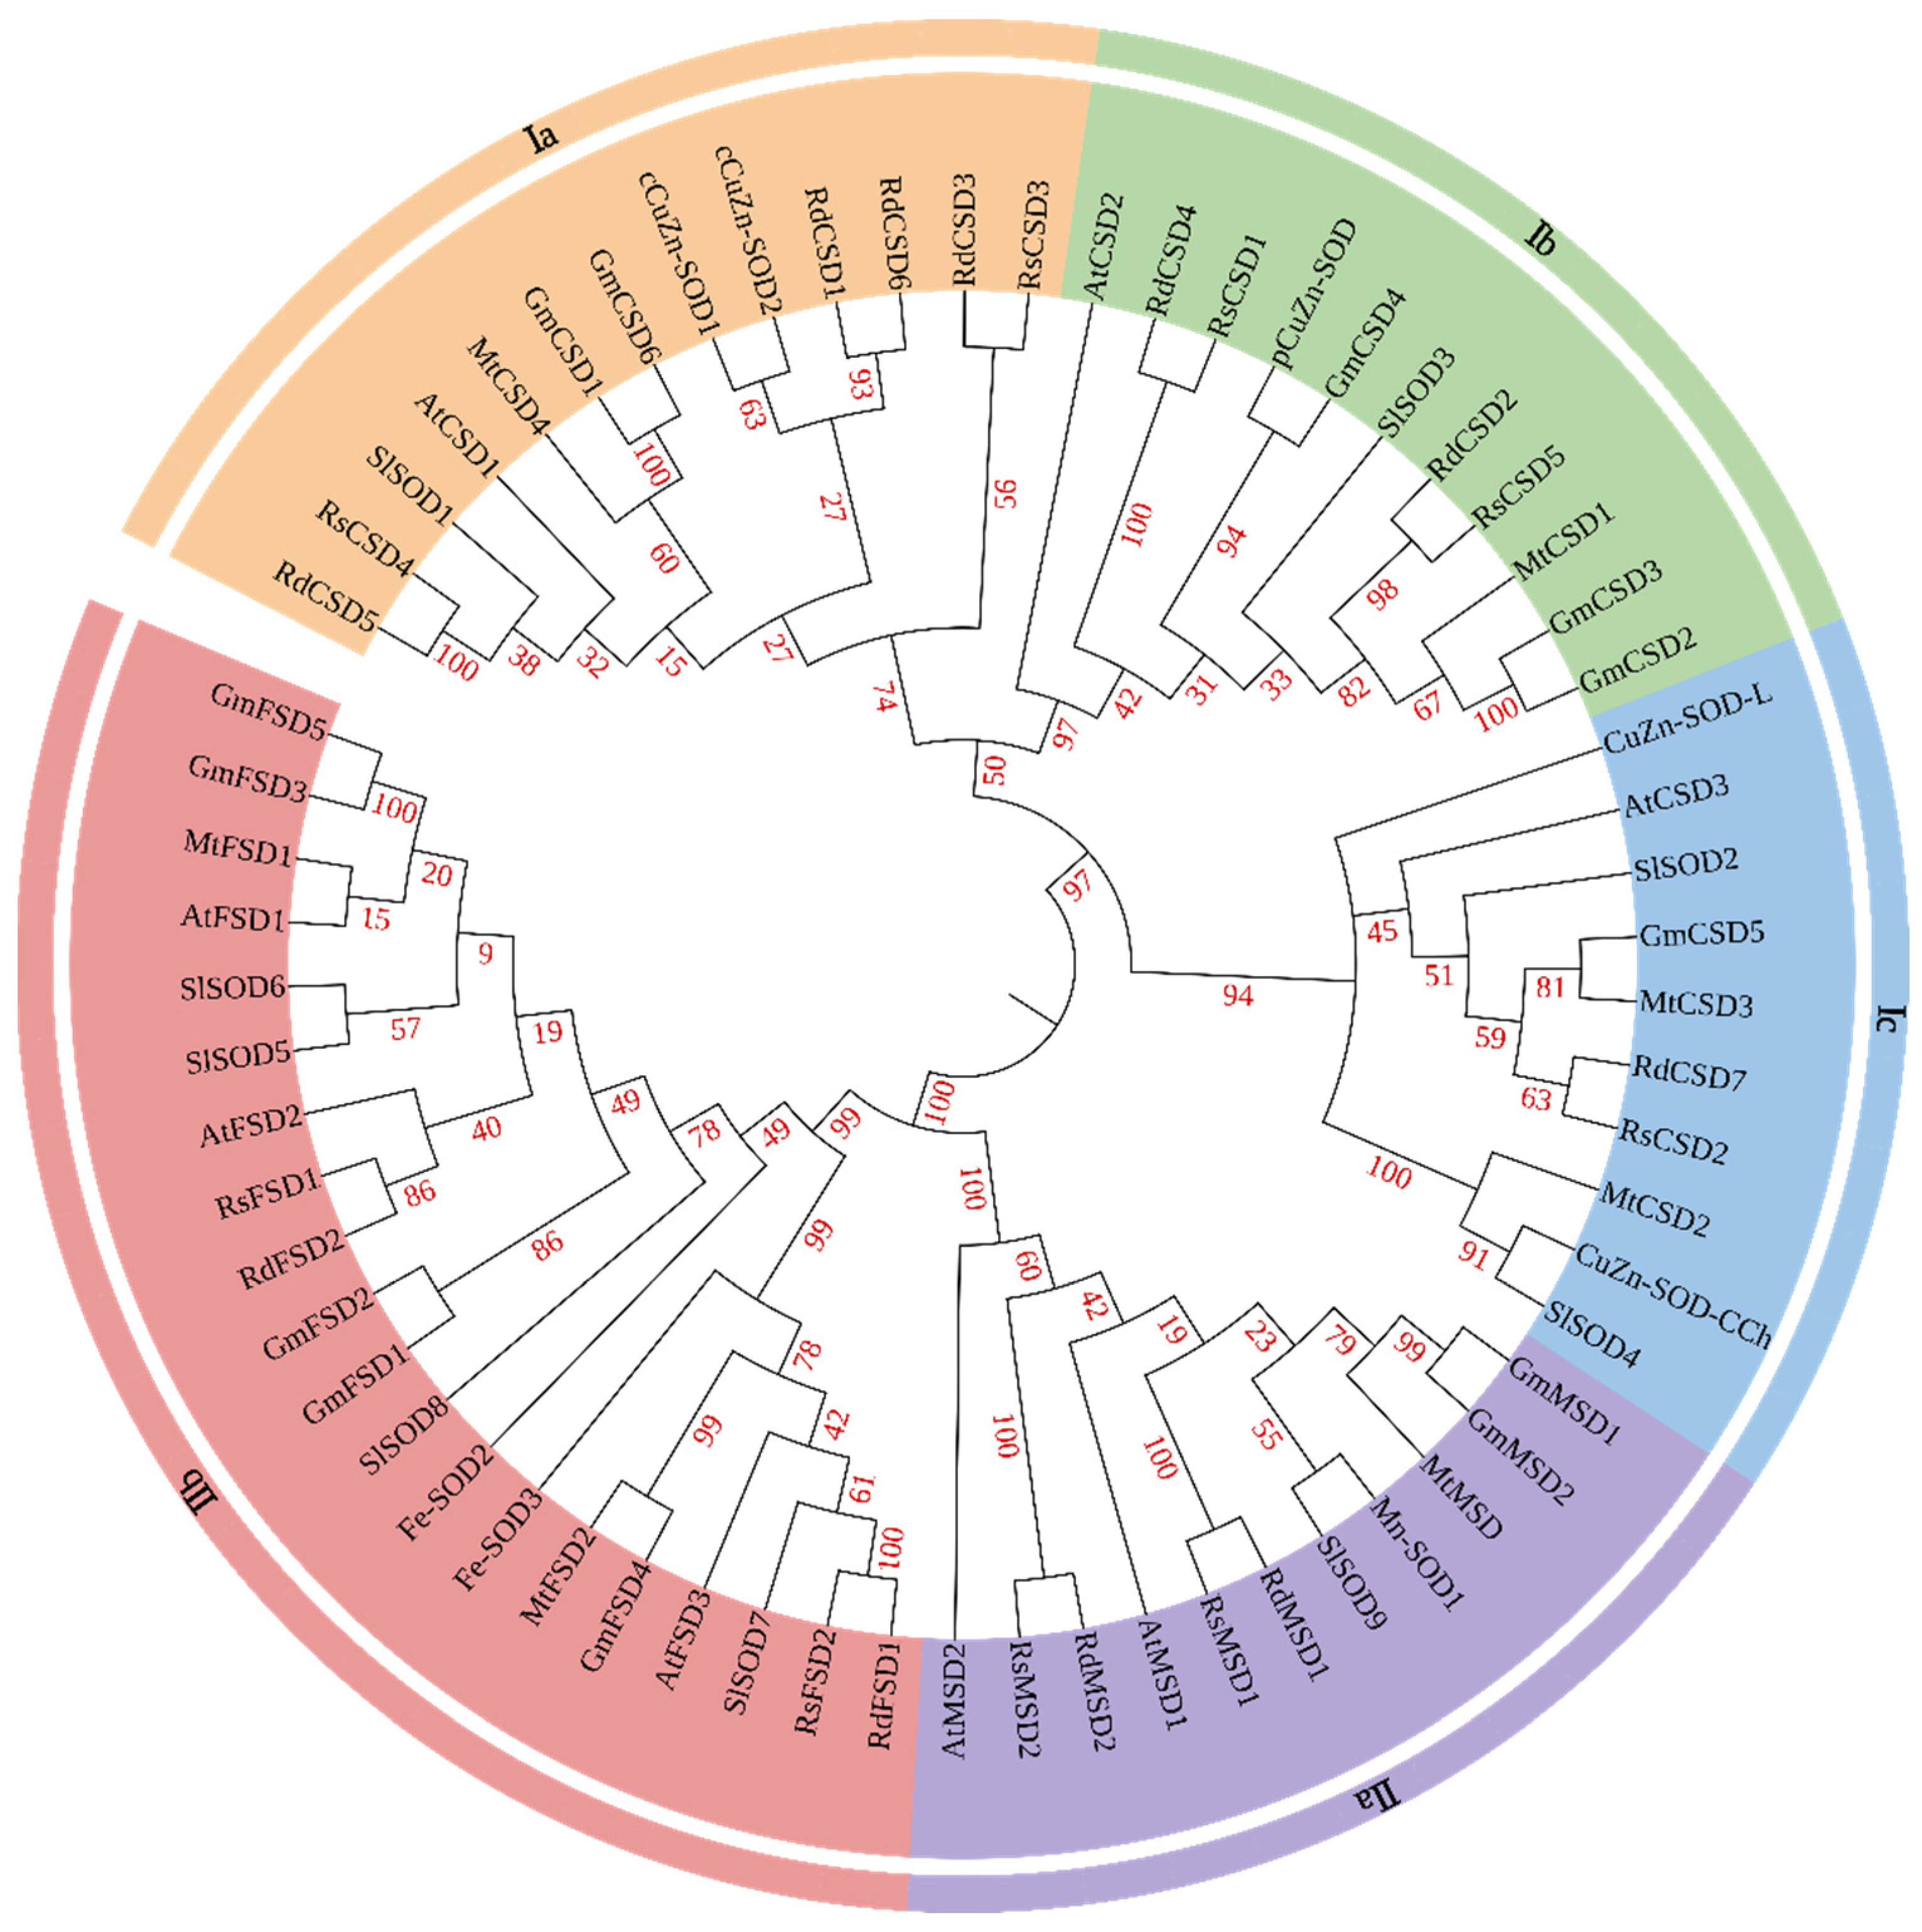
Figure 1. Neighbor joining phylogenetic tree of 65 superoxide dismutases from Rhododendron simsii, Rhododendron delavayi, Arabidopsis, rice, soybean, tomato, and Medicago truncatula. The different-colored graphs indicate different groups (or subgroups) of SOD domains. All annotations indicate the percentage of bootstrap values.
Forests 15 00931 g001
Figure 2. Gene structure and motif analysis of RsSODs and RdSODs. (a) Phylogenetic relationships of RsSODs and RdSODs. (b) Gene structure of RsSODs and RdSODs. Light green represents coding sequences or exon, and yellow represents untranslated regions. (c) Composition of conserved motifs identified in RsSODs and RdSODs. Different colored boxes indicate different motifs. Protein length can be estimated by addressing the scale at the bottom.
Forests 15 00931 g002
Figure 3. Locations of RsSOD genes on chromosomes and interchromosomal associations. The gray line in the figure indicates all homologous gene pairs in the R. simsii genome, and the red line indicates homologous RsSOD gene pairs.
Forests 15 00931 g003
Figure 4. Collinearity analysis of SOD genes in the chromosomes of R. simsii and A. thaliana. The gray lines in the figure indicate collinear blocks in the R. simsii and A. thaliana genomes, while the red lines indicate homologous SOD gene pairs.
Forests 15 00931 g004
Figure 5. Cis-acting elements in the promoter regions of RsSOD and RdSOD genes. (a) Distribution of cis-acting elements in the promoter regions of RsSOD and the RdSOD genes are shown in different colors. (b) Different numbers indicate the frequency of cis-elements appearing in the promoter region.
Forests 15 00931 g005
Figure 6. Tissue-specific expression profiles of RsSODs and RdSODs. The tissues tested were roots, stems, leaves, and flowers. In the expression bar, red represents high expression levels, and white represents low expression levels.
Forests 15 00931 g006
Figure 7. Expression levels of RsSOD and RdSOD genes at different time points (0 (CK), 3, 6, 12, and 24 h) after hydrogen peroxide, abscisic acid, and ethephon treatments followed by high-temperature stress conditions and direct heat stress conditions without exogenous reagent treatment. The data are the means ± standard deviation of three independent replicates. Error lines indicate the standard deviation of three independent biological replicates. In the same treatment area, lowercase letters indicate a significant difference (p < 0.05) between different high-temperature stress durations. Capital letters indicate the significant difference between different treatment areas with the same high-temperature stress time (p < 0.01). Those arranged in the same row are homologous genes, among which RsCSD3/RdCSD1 and RsFSD1/RdCSD6 are not homologous.
Forests 15 00931 g007
Disclaimer/Publisher’s Note: The statements, opinions and data contained in all publications are solely those of the individual author(s) and contributor(s) and not of MDPI and/or the editor(s). MDPI and/or the editor(s) disclaim responsibility for any injury to people or property resulting from any ideas, methods, instructions or products referred to in the content.