Article

Impacts of Deep-Rooted Apple Tree on Soil Water Balance in the Semi-Arid Loess Plateau, China

1
College of Urban and Environmental Sciences, Northwest University, Xi’an 710127, China
2
College of Resources and Environmental Engineering, Ludong University, Yantai 264025, China
3
Department of Soil Science, University of Saskatchewan, Saskatoon, SK S7N 5A8, Canada
4
College of Water Resources and Architectural Engineering, Northwest A&F University, Xianyang 712100, China
*
Author to whom correspondence should be addressed.
Forests 2024, 15(6), 930; https://doi.org/10.3390/f15060930
Submission received: 9 April 2024 / Revised: 20 May 2024 / Accepted: 24 May 2024 / Published: 27 May 2024
(This article belongs to the Section Forest Soil)

Abstract

:
Partitioning soil water balance (SWB) is an effective approach for deciphering the impacts of vegetation change on soil hydrological processes. Growing apple trees on the Loess Plateau, China, leads to a substantial deep soil water deficit, posing a serious threat to the sustainable development of apple production. However, the impact of deep-rooted apple trees on SWB remains poorly understood. In this study, we conducted a “Paired Plot” experiment to achieve this objective by decoupling SWB components using water stable isotopes, tritium, and soil water contents from deep soil cores (up to 25 m) under apple orchards with a stand age gradient of 8–23 years. The results showed that deep soil water storage under apple orchards was notably reduced compared to nearby farmland, showing a stand age-related pattern of deep soil water deficit (R2 = 0.91). By analyzing the changing patterns of SWB components, we found that the main factor driving this deficit is the water uptake process controlled by the deep root system. This process is triggered by the increased transpiration demand of apple trees and short-term water scarcity. These findings have implications for understanding soil water dynamics, sustainable agroforestry management, and soil water resources’ protection in this region and other similar water-limited areas.

1. Introduction

In recent decades, global vegetation has undergone significant changes due to human activities and climate change [1,2]. Vegetation plays a critical role in the critical zone by absorbing water from the soil through its roots and releasing it back into the atmosphere through transpiration. It also indirectly impacts processes such as rainfall infiltration, surface runoff, canopy interception, and groundwater recharge through its canopy and root systems [3]. Consequently, changes in vegetation can disrupt the overall balance of soil water, ultimately affecting regional water resources [4]. It is thus essential to understand the effects of vegetation change on soil water balance (SWB) to effectively manage soil water resources in a changing environment [5]. However, accurately separating SWB components presents challenges and uncertainties due to the complexity, high spatiotemporal heterogeneity, and limitations of monitoring methods in these processes [6,7]. While numerous studies have explored the impact of vegetation change on water yield at the watershed scale [5,8,9], we still lack a process-based understanding of how vegetation change affects SWB, particularly at the plot scale [10].
The Loess Plateau, China (CLP), hosts the world’s deepest and largest loess deposits, with a mean thickness of 100 m and a maximum thickness of up to ~350 m [11]. The CLP has long been plagued by significant issues including severe soil erosion, sparse vegetation, high population density, low productivity, and excessive sediment in the Yellow River [12]. To combat soil erosion, a variety of engineering and ecological strategies have been adopted, including the construction of terraces, check dams, and afforestation [13,14,15]. The afforestation initiatives, encompassing both ecological forests (e.g., Ro-binia pseudoacacia) and economic forests (e.g., Malus pumila Mill.), have significantly transformed farmland into forest land [16,17,18]. Particularly, due to the abundant sunlight, fertile soil, and soil water reservoirs, the CLP has become an optimal location for cultivating apple trees [19,20]. Because the cultivation of apple trees not only drives impressive economic growth but also brings significant ecological benefits (e.g., reduced soil erosion), vast stretches of farmland have been converted into apple orchards over the last three decades. As of 2016, the apple orchard area in the CLP had expanded to 1.3 × 10⁴ km2, accounting for 25% of the global apple orchard area [21]. However, compared to traditional crops, apple tree growth necessitates more soil water resources, resulting in increased evapotranspiration [17,22,23], reduced deep soil water content [24,25,26], and disruption of deep drainage processes [19,27,28,29]. While previous studies have acknowledged the notable impact of deep-rooted apple trees on soil water dynamics and hydrological processes, there is still a lack of comprehensive understanding of the long-term effects on soil hydrological characteristics. To the best of our knowledge, existing research has primarily concentrated on individual SWB components or stand ages [30], failing to thoroughly assess the overall influence of deep-rooted apple trees on SWB throughout their lifespan.
Various methods have been developed to decouple and close the SWB, including field monitoring, modeling, and isotope approaches [6,7]. While monitoring SWB components can provide valuable insights, it requires extended observation periods to gather sufficient data. On the other hand, numerical simulation is crucial for addressing SWB closure with limited monitoring data [6,30], but it requires prior information to effectively constrain and refine the model for improved accuracy and reliability. In contrast to these methods, water stable isotopes (2H/1H and 18O/16O) can capture all soil processes and distinguish between soil evaporation and transpiration [3,31]. Specifically, stable isotopes in multiple soil layers can offer a long-term record of soil evaporation, aiding in separating SWB components through stable isotope measurements in a snapshot field campaign [32]. Thus, combining soil water stable isotope measurements with other field monitoring data can be a valuable tool for unraveling and quantifying long-term SWB in regions with deep soils. Under such scenarios, this approach would present an opportunity to evaluate the influence of deep-rooted apple trees on SWB throughout their lifespan in the CLP, but it has not been systematically explored.
This study seeks to answer the overarching research question, How do deep-rooted apple trees affect the SWB in the CLP? We present a “Paired Plot” experiment to evaluate the effects of the deep-rooted apple tree on SWB by decoupling its components. Specifically, we achieve this objective by leveraging water stable isotopes, tritium, and soil water contents from deep soil cores (up to 25 m) under apple orchards with a stand age gradient of 8–23 years, which roughly covers the lifespan of the apple tree at our study site. The potential novelty of this study is that the SWB was partitioned to interpret the effects of agroforestry on soil water over its lifespan. Our findings would contribute to implications for understanding soil water dynamics, sustainable agroforestry management, and soil water resources in the CLP and similar dryland regions.

2. Materials and Methods
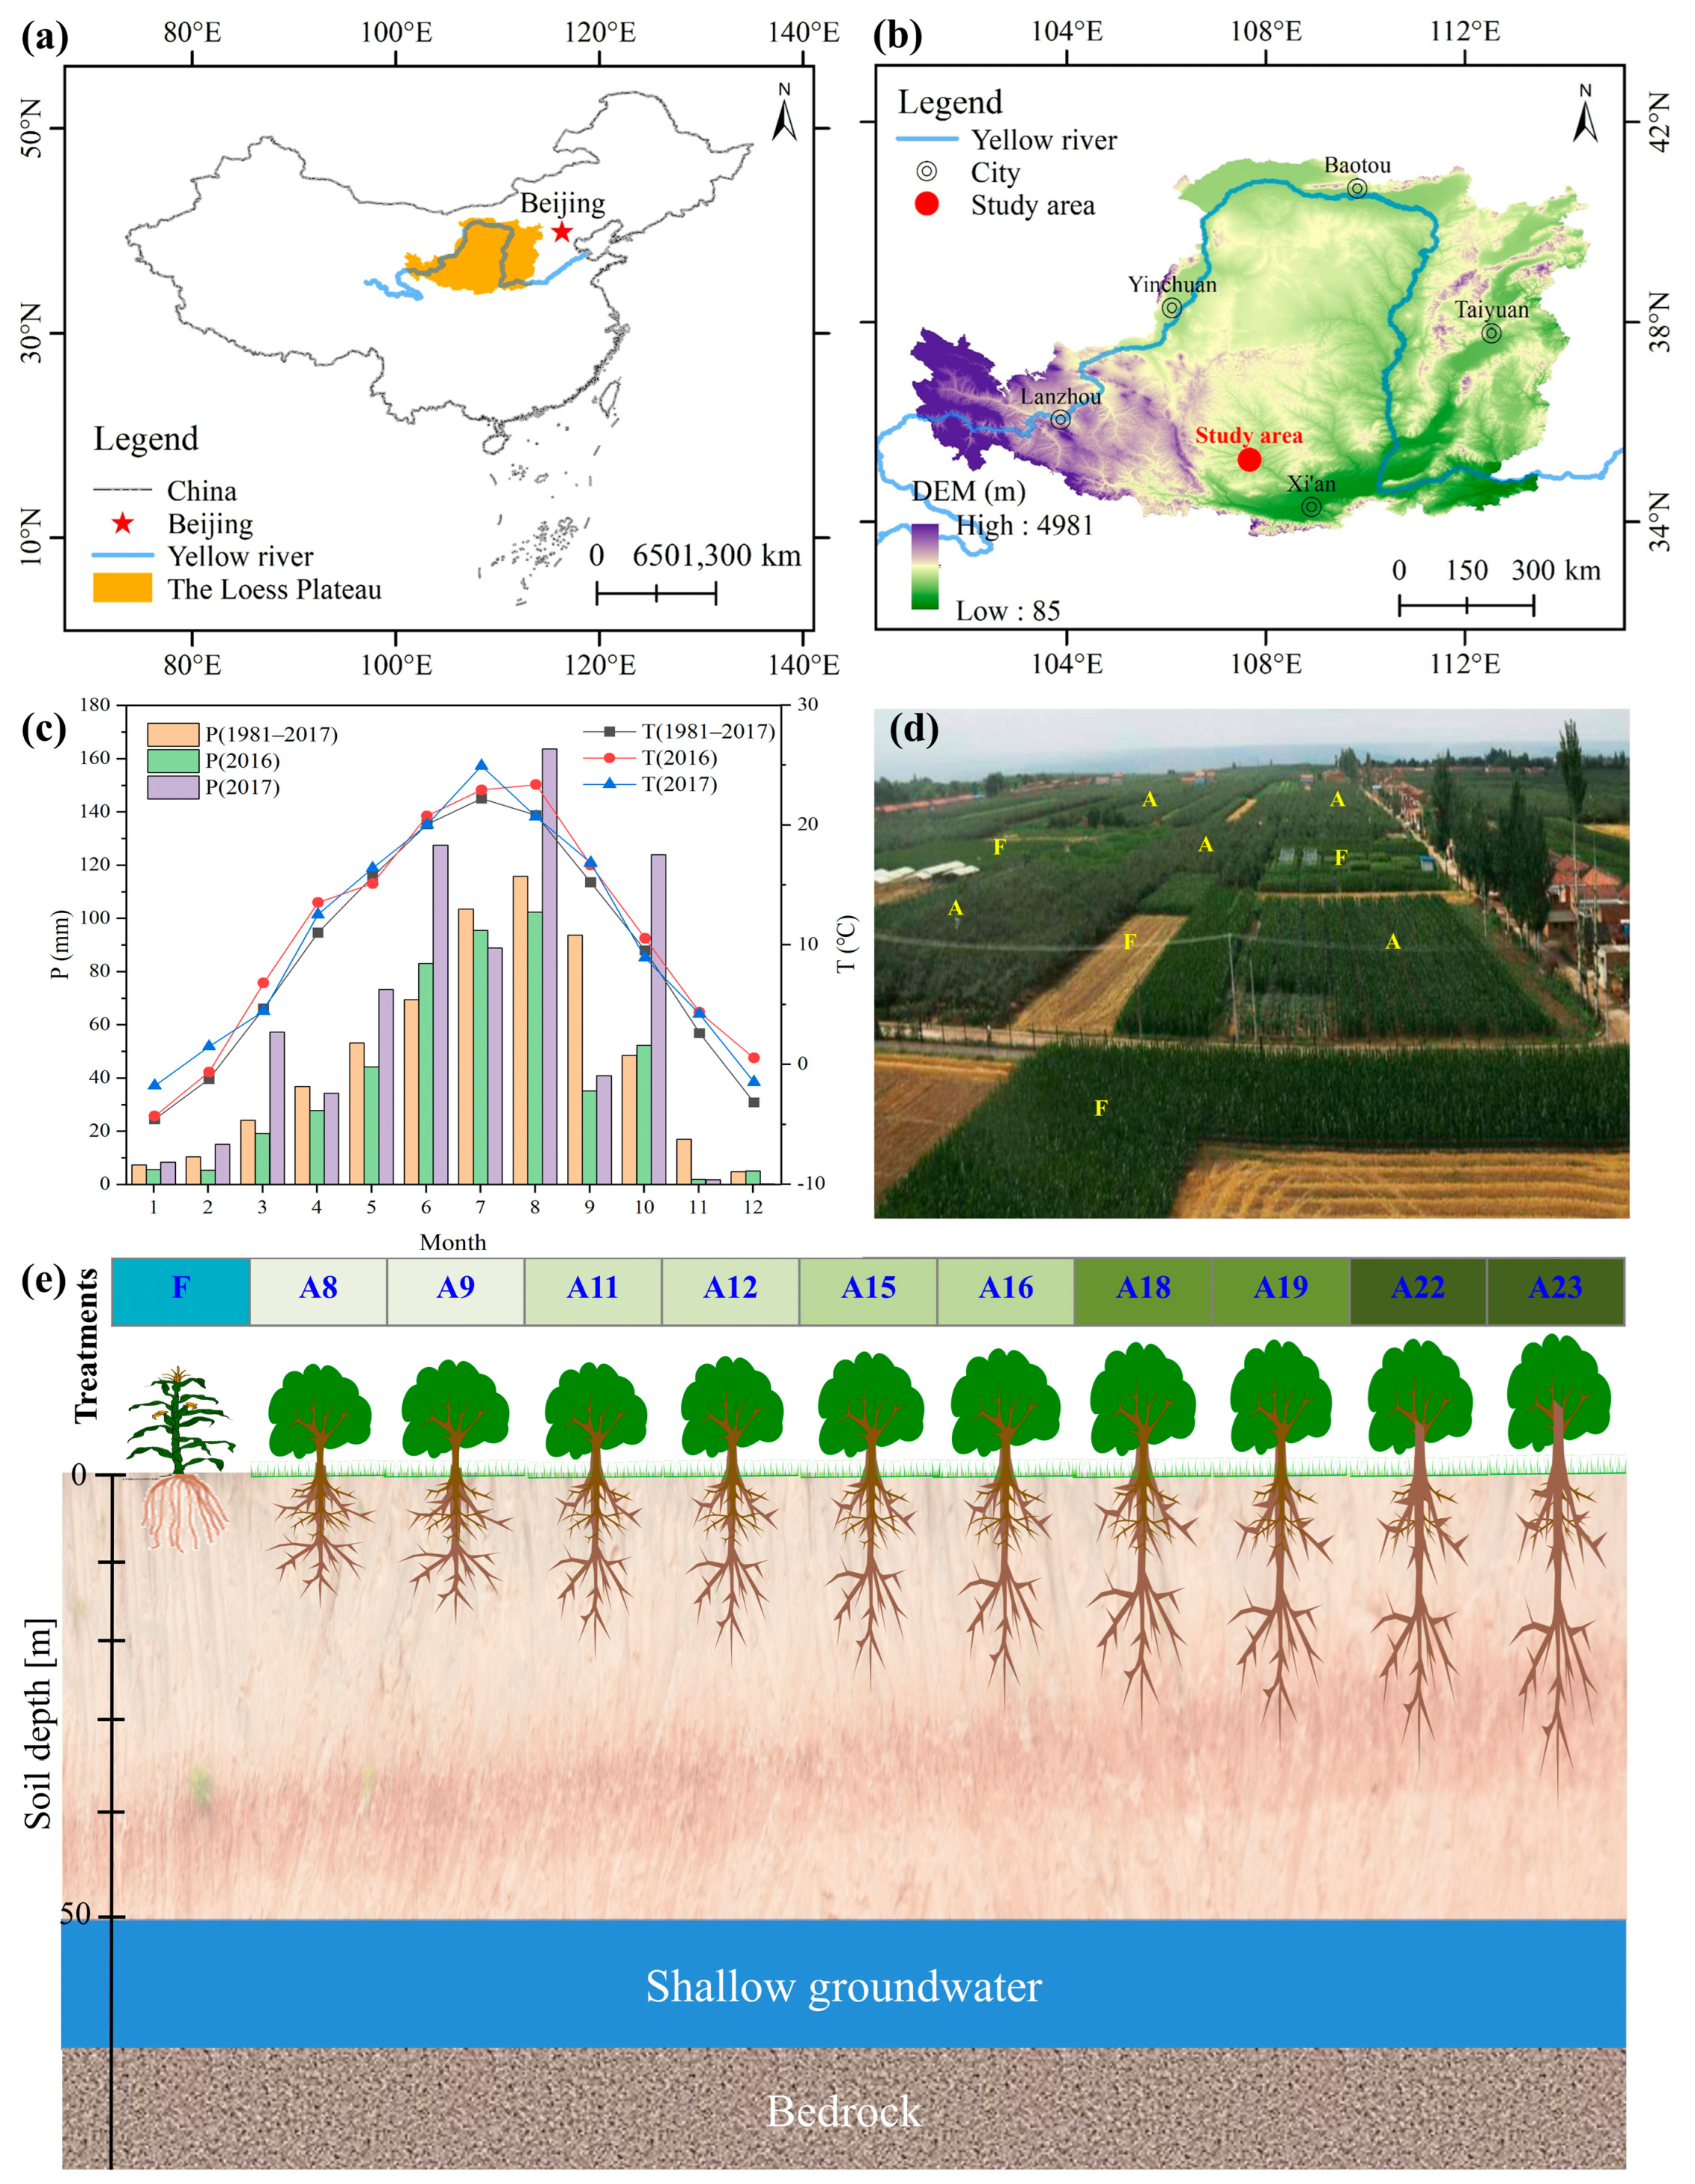
2.1. Study Area

This study was conducted at the Changwu Agroecological Experiment Station (35.2° N, 107.8° E) on the southern part of the CLP (Figure 1a,b). This site is classified as a semi-arid area and has a continental monsoon climate. The long-term (1981–2017) average annual temperature, precipitation, and potential evapotranspiration were 9.4 °C, 581 mm, and 903 mm, respectively (http://cwa.cern.ac.cn/meta/metaData, accessed on 1 April 2024) (Figure 1c). Over half of the annual precipitation occurs between July and September in the form of intense rainfall events. The monthly precipitation and temperature distributions within the year 2016 and 2017 closely resembled the multi-year average values. Notably, the total precipitation amounts in 2016 and 2017 were 477 mm and 735 mm, respectively, highlighting a dry year in 2016 and a wet year in 2017. The topography of the area is generally flat, with a slight slope of less than 0.05°. The soil is deep and mainly composed of loess, with a consistent texture that remains constant over both space and time. It is predominantly silt loam, with a silt content greater than 50%, classified as Heilu soil [33]. The field capacity is approximately 0.28 m3 m−3, while the permanent wilting point is 0.11 m3 m−3 [34]. The deep loess profile is uniform and porous, providing an ideal environment for plant root growth. The main land use types in the area include farmland, apple orchard, and grassland (Figure 1d) [35]. Groundwater is estimated to be 50–100 m below the surface, leading vegetation to rely solely on precipitation as there is no irrigation.

2.2. Sampling and Measurements

In total, eleven sites, in close proximity to one another (<1 km), were selected for this study, which were sampled in July 2016 and April 2017 (Figure 1e and Table 1): one under long-term (>100 years) farmland (F), and the remaining under representative apple orchards (Malus pumila Mill.) with stand ages (SA) of 8, 9, 11, 12, 15, 16, 18, 19, 22, and 23 years (A8, A9, A11, A12, A15, A16, A18, A19, A22, and A23). These apple orchards were previously converted from similar farmlands, and maintained a uniform tree density, with 3.5 m between rows and 3.0 m between plants within rows. In each apple orchard, six trees were randomly selected to measure the tree height (TH) and diameter at breast height (DBH). In addition, the leaf area index (LAI) was measured monthly in the growing season (April to September 2016 for A8, A11, A15, A18, and A22; April to September 2017 for A9, A12, A16, A19, and A23) using a LAI-2200C plant canopy analyzer (Li-Cor, Inc., Lincoln, NE, USA). The mean TH, DBH, and LAI were presented in Table 1, which have been reported in our previous work [23,36].
At each site, a hollow-stem auger (measuring 0.085 m in diameter and 0.25 m in length) with stem extension was used to obtain soil samples at a vertical interval of 0.2 m, with the maximum sampling depths ranging from 10 m to 25 m below the land surface (Table 1). Each soil sample was mixed well and then divided into three parts. One part (no root), of about 40 g, was used to determine gravimetric soil water content via the oven-dry method (105 °C for 12 h). The gravimetric soil water content was then converted to soil water storage using the bulk density data reported in the previous work [36]. Another part (no root) was stored in a 250 mL polyethylene plastic bottle sealed with parafilm, and stored in the refrigerator at −20 °C before soil water extraction. The remaining part (contained root) was washed carefully in a 1 mm sieve to obtain fresh root. Then, the sieved fresh roots were used to analyze the root length of different root diameters using a flatbed scanner (Epson model V700) with the WinRHIZO image analysis software (STD4800, Regent Instruments Inc., Quebec, Canada). Fine root length density (<2 mm) was calculated as the ratio of fine root length to soil volume. The maximum depth of fine root (fine roots were not found in the soil profiles) ranged from 9.6 m to 23.2 m, which has been reported in our previous work [23,36].
The cryogenic vacuum distillation system (LI-2000, LICA, Beijing, China) was used to extract water from soil samples. To fully extract water, we maintained a system pressure of less than 0.2 Pa, and heated soil samples at a temperature of 95 °C for more than 3 h. The stable isotopes (δ2H and δ18O) of soil water (N = 358) were determined with an isotopic liquid water analyzer (LGR LIWA 45EP, Enviro Tech Chemical Services, Modesto, CA, USA), and the results were given as per mil (‰) relative to the Vienna Standard Mean Ocean Water. The analysis precision of δ2H and δ18O were 1.0 ‰ and 0.2 ‰, respectively. The tritium of soil water under the farmland (N = 28) was determined using a liquid scintillation counter (Quantulus 1220, PerkinElmer, Singapore). Each sample consisted of 8 mL of extracted soil water mixed with 12 mL of scintillation solution in a 25 mL standard plastic bottle. After a 24 h dark adaptation period, the tritium activities were measured in counts per minute over a 500 min counting period and reported in tritium units (TU), with a detection limit of 10.5 TU. The tritium data have been previously reported in other studies [37].

2.3. Determination of SWB Components

Our study area is located on a very flat landscape (slope < 0.05), and the groundwater table is very deep (50 to 100 m below the surface). Thus, we ignored surface runoff and groundwater in SWB:
P = T + E + D + S
where P, T, E, D, and ∆S refer to long-term average precipitation, transpiration, soil evaporation, deep drainage, and change in soil water storage, respectively [mm year−1].

2.3.1. Soil Evaporation

The line-conditioned excess (lc-excess) [38] was used to indirectly reflect soil evaporation differences among treatments:
l c e x c e s s = δ 2 H a × δ 18 O b / a × S δ O 18 2 + S δ H 2 2 0.5
where a and b are the slope and intercept of the Local Meteoric Water Line (LMWL: δ2H = 7.67 δ18O + 8.76, N = 228, R2 = 0.96) [37]. Sδ2H and Sδ18O are analysis precision of δ2H and δ18O, respectively.
To estimate soil evaporation, the soil evaporation loss fraction (fE, E/P) was calculated using the dual-isotope method (Equation (3)) [32,39]. This method operates under the assumption that in a steady-state isotope mass balance model, precipitation is counterbalanced by evaporation, transpiration, and deep drainage, with surface runoff being disregarded [31]. The soil evaporation loss fraction is determined by the following equation:
f E = E P = δ 2 H S W a × δ 18 O S W b a × δ 18 O E δ 18 O S W δ 2 H E δ 2 H S W
where SW, E, and P refer to soil water, soil evaporation, and precipitation, respectively. The a and b are the same as in Equation (2). The value of δE was estimated based on the Craig–Gordon model [40]:
δ E = δ s w ε + / α + R H × δ A ε k 1 R H + 10 3 × ε k
where δA is the isotopic composition of atmospheric water vapor [‰] [41], and ε+ = (α+ − 1)·103. The α+ [unitless] and εk [‰] are the equilibrium and kinetic fractionation factors, which are, respectively, determined by Equations (5) and (6) [42] and Equations (7) and (8) [43,44].
10 3 · ln α H 2 + = 1158.8 T 3 / 10 9 1620.1 T 2 / 10 6 + 794.84 T / 10 3 161.04 + 2.9992 10 9 / T 3
10 3 · ln α O 18 + = 7.685 + 6.7123 10 3 / T 1.6664 10 6 / T 2 0.3504 10 9 / T 3
ε k H 2 = n × 1 R H 1 0.9755 × 10 3
ε k O 18 = n × 1 R H 1 0.9723 × 10 3
where RH and T in Equations (4)–(8) refer to the relative humidity [decimal fraction] and temperature [K]. The parameter n represents the aerodynamic regime above the evaporating liquid–vapor interface, which was set to 0.75 because the evaporating soil layer was expected to alternate between saturation and dry over time [43]. We estimated the α+(▪) and εk(▪) using the long-term (1981–2017) daily temperature and relative humidity from the meteorological station at the Changwu Agroecological Experiment Station (<1 km).

2.3.2. Deep Drainage

Assuming that water moves in the form of a matrix flow, the average deep drainage under farmland can be estimated using the tritium-peak method [45]:
D F = 0 L θ Z d z N
where DF, N, θ(z), and L stand for average deep drainage of farmland [mm year−1], the number of years between 1963 and the year of soil sampling [year], the soil volumetric water content at the z depth [cm3 cm−3], and the depth of the 1963 tritium peak [m], respectively.
For the apple orchards, the average deep drainage was estimated using the following equation [19]:
D A = D F S T o t a l / t
where DA, t, and ∆STotal represent the deep drainage of the apple orchard [mm year−1], the stand age of the apple tree [year], and the total deficit of soil water storage after converting farmland into an apple orchard [mm], respectively.

2.3.3. Evapotranspiration and Transpiration

Based on Equation (1), we indirectly estimated transpiration and evapotranspiration (ET = E + T) as the residual of known components.

2.4. Statistical Analysis

For a given variable (e.g., E, and D), we obtained its uncertainty based on the first-order perturbation analysis of the relevant equation. The coefficient of variation (CV, %) and standard deviation were calculated to assess the variability of soil water δ18O and lc-excess. The statistical significance of differences among treatments was evaluated using one-way analysis of variance (one-way ANOVA) and the least significant difference test (LSD), with a significance level set at p < 0.05. Furthermore, Spearman’s correlation coefficient (r, unitless) and coefficient of determination (R2, unitless) were employed to analyze the relationships between SWB components and environmental variables. Furthermore, stepwise multiple linear regression analysis was used to identify the primary controlling factors of the relevant variable.

3. Results

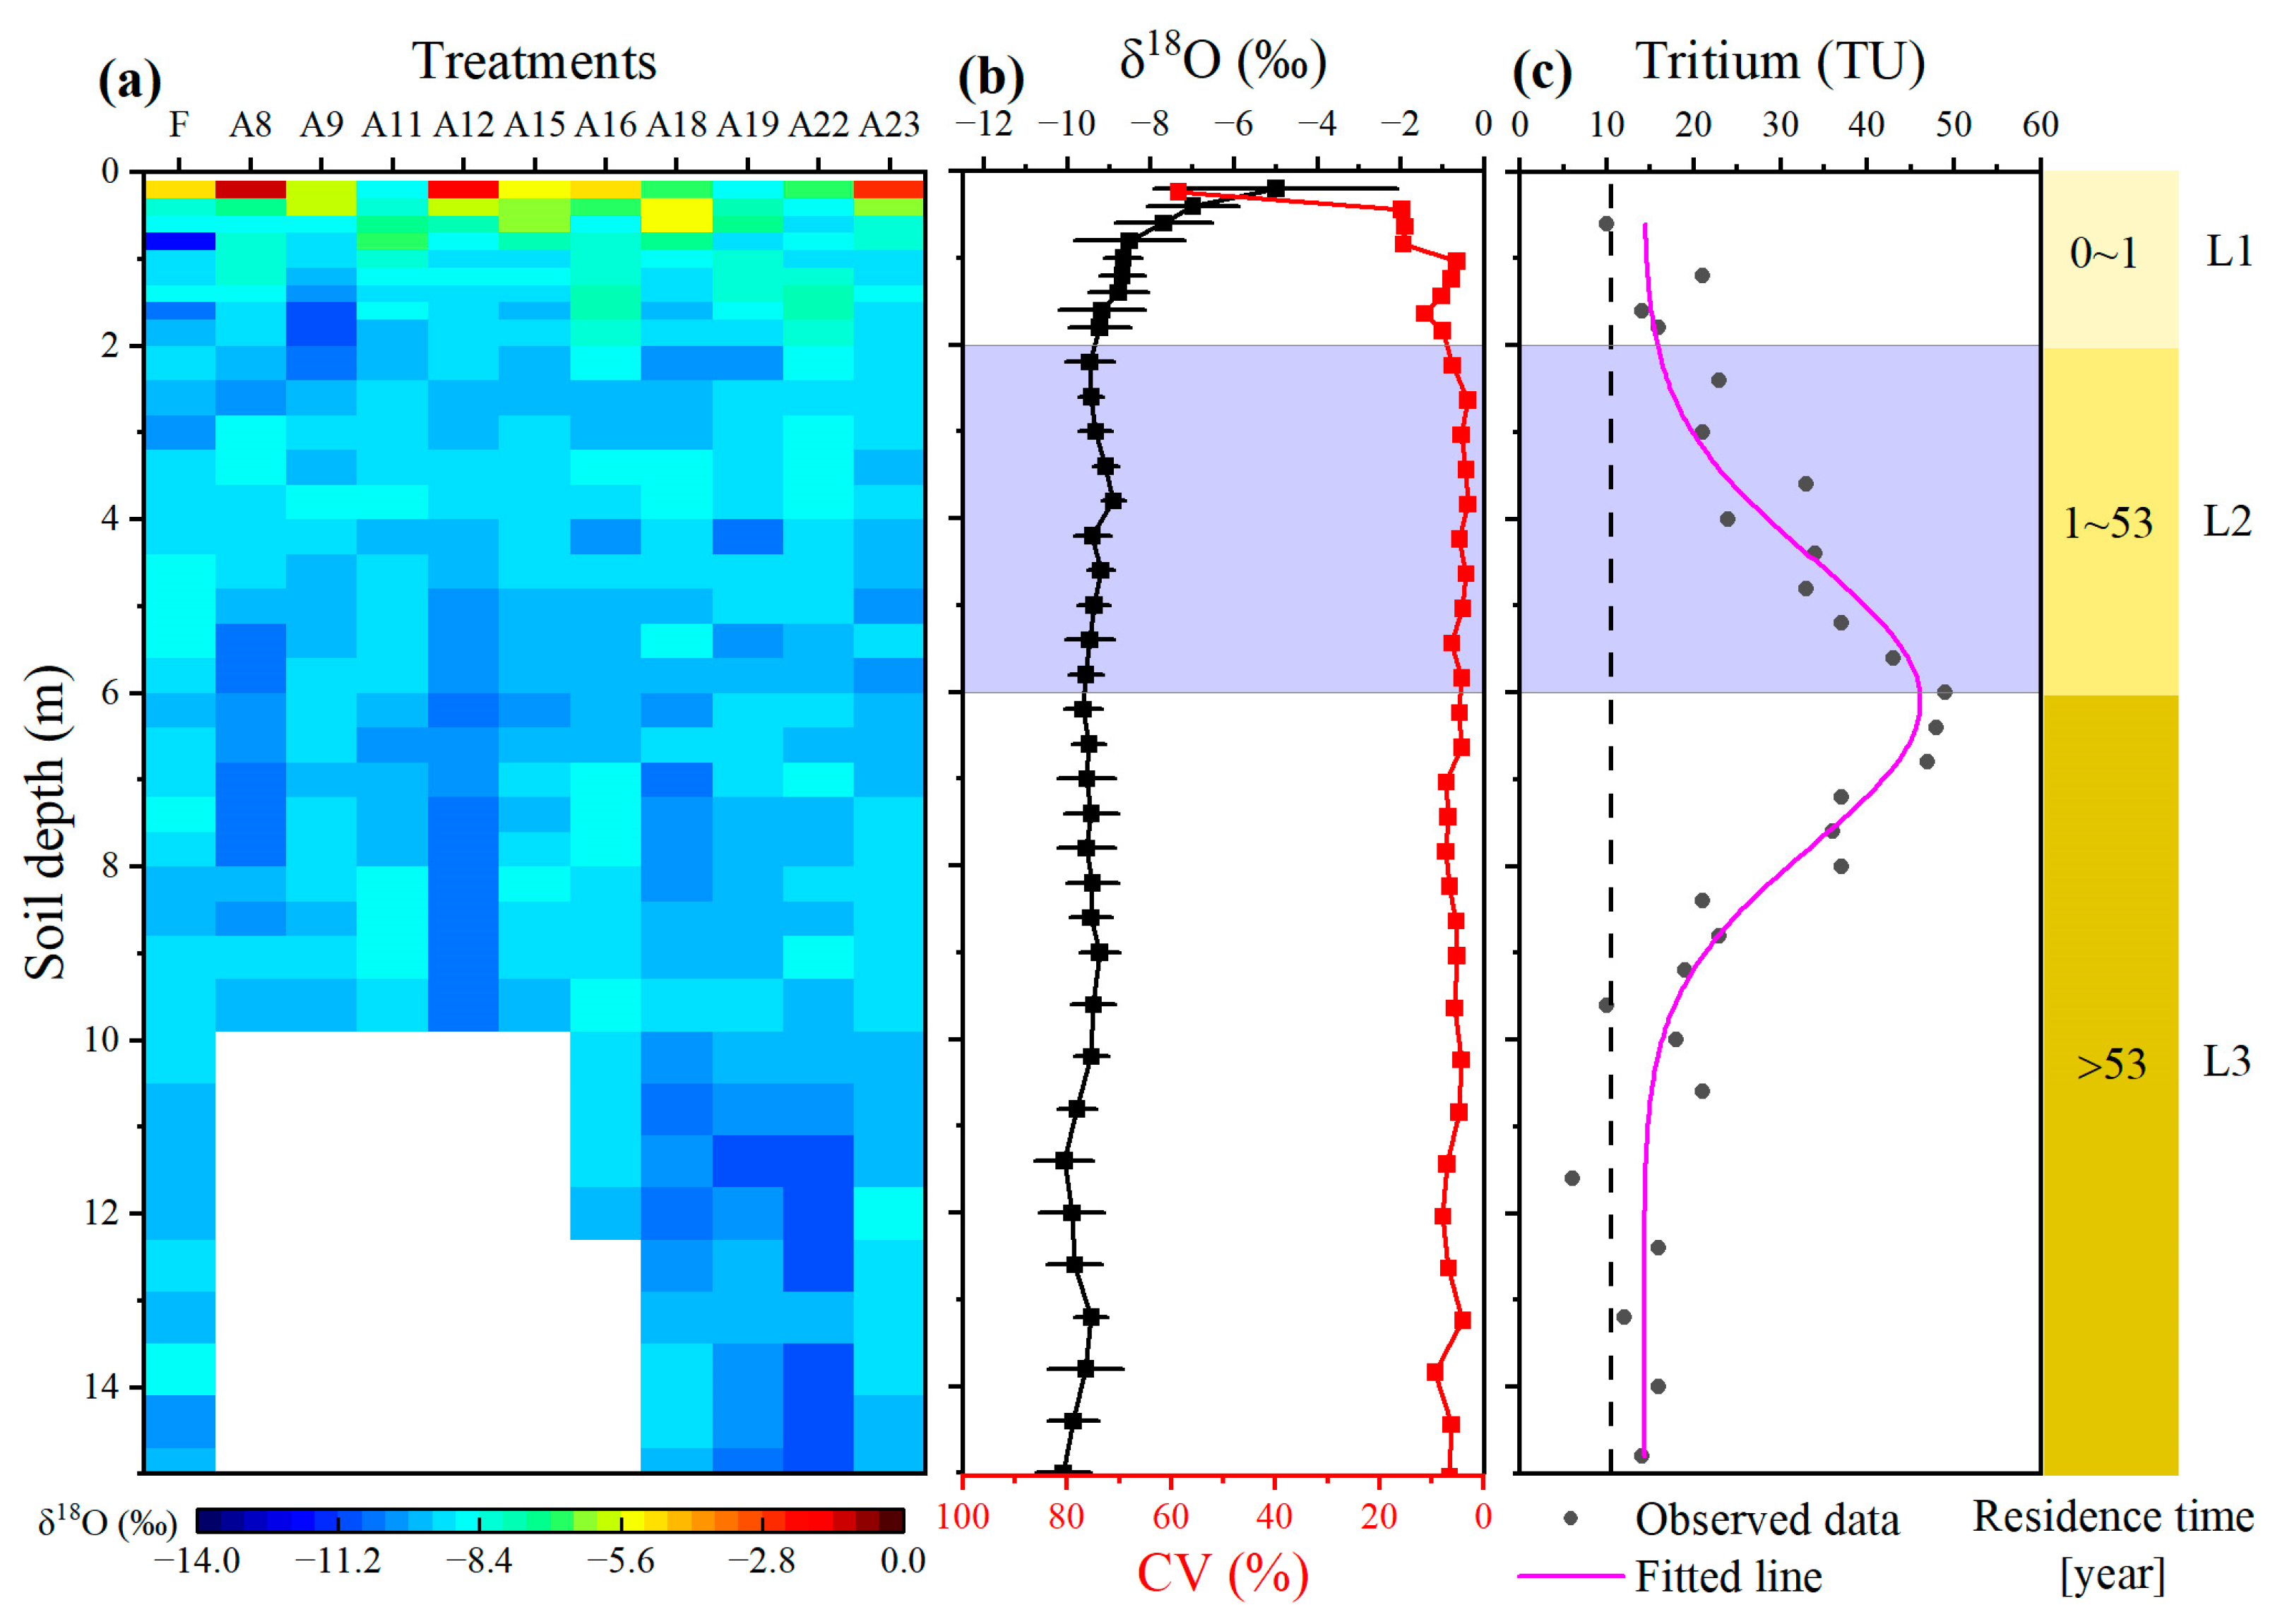
3.1. Water Stable Isotope and Tritium Profiles

Across all treatments, soil water δ18O exhibited consistent vertical distributions (Figure 2a and Table 2): shallow soils (0–2 m) displayed a higher standard deviation compared to deep soils (below 2 m), indicating greater fluctuations in shallow soils. The vertical variations in δ18O in shallow soils may be attributed to dynamics of precipitation infiltration, soil evaporation, and water movement, suggesting that water in shallow soils has a shorter residence time, possibly less than one year. We found that a distinct bell-shaped tritium distribution was detected, with a peak at 6.1 m below the soil surface under the farmland (Figure 2c). The tritium abundance at the peak was 40–50 TU, corresponding to the tritium from 1963 precipitation after four half-lives of decay [45]. Given that a matrix flow is predominant at our study site, this suggests that the water residence time in soils deeper than 6.1 m was older than 53 years, while soils shallower than 6.1 m were younger than 53 years. Therefore, based on the vertical distribution of water stable isotopes and tritium, the entire soil profile was divided into three layers (Figure 2c): L1 (0–2 m), L2 (2–6 m), and L3 (below 6 m).
The residence time of L2 soil water (1–53 years) encompasses the stand age of apple orchards (8–23 years) (Figure 2c), allowing for the examination of treatment effects on water stable isotopes. The δ18O of L2 soil water showed minimal variations among treatments at all soil depths below 2.0 m (CV < 10%) (Figure 2b and Table 2), but the average δ18O and lc-excess of L2 soil water varied significantly with treatments (one-way ANOVA, p < 0.05). These lc-excess values were significantly below 0 ‰, indicating that stable isotopes of soil water exhibited detectable fractionation signatures, which was most likely due to soil evaporation. Interestingly, significant differences in δ18O or lc-excess were observed in the L2 soil layer between different land use types (farmland vs. apple orchard) or stand ages of the apple orchard (Table 2). However, water stable isotopes (δ18O, lc-excess, and δ2H) of L2 soil water under apple orchards showed poor correlations with stand age, tree height, diameter at breast height, maximum depth of fine root, and leaf area index (p > 0.05) (Figure 3a). These results together suggested that land use types and stand ages have minimal impact on water stable isotopes, indicating limited differences in soil evaporation among treatments.

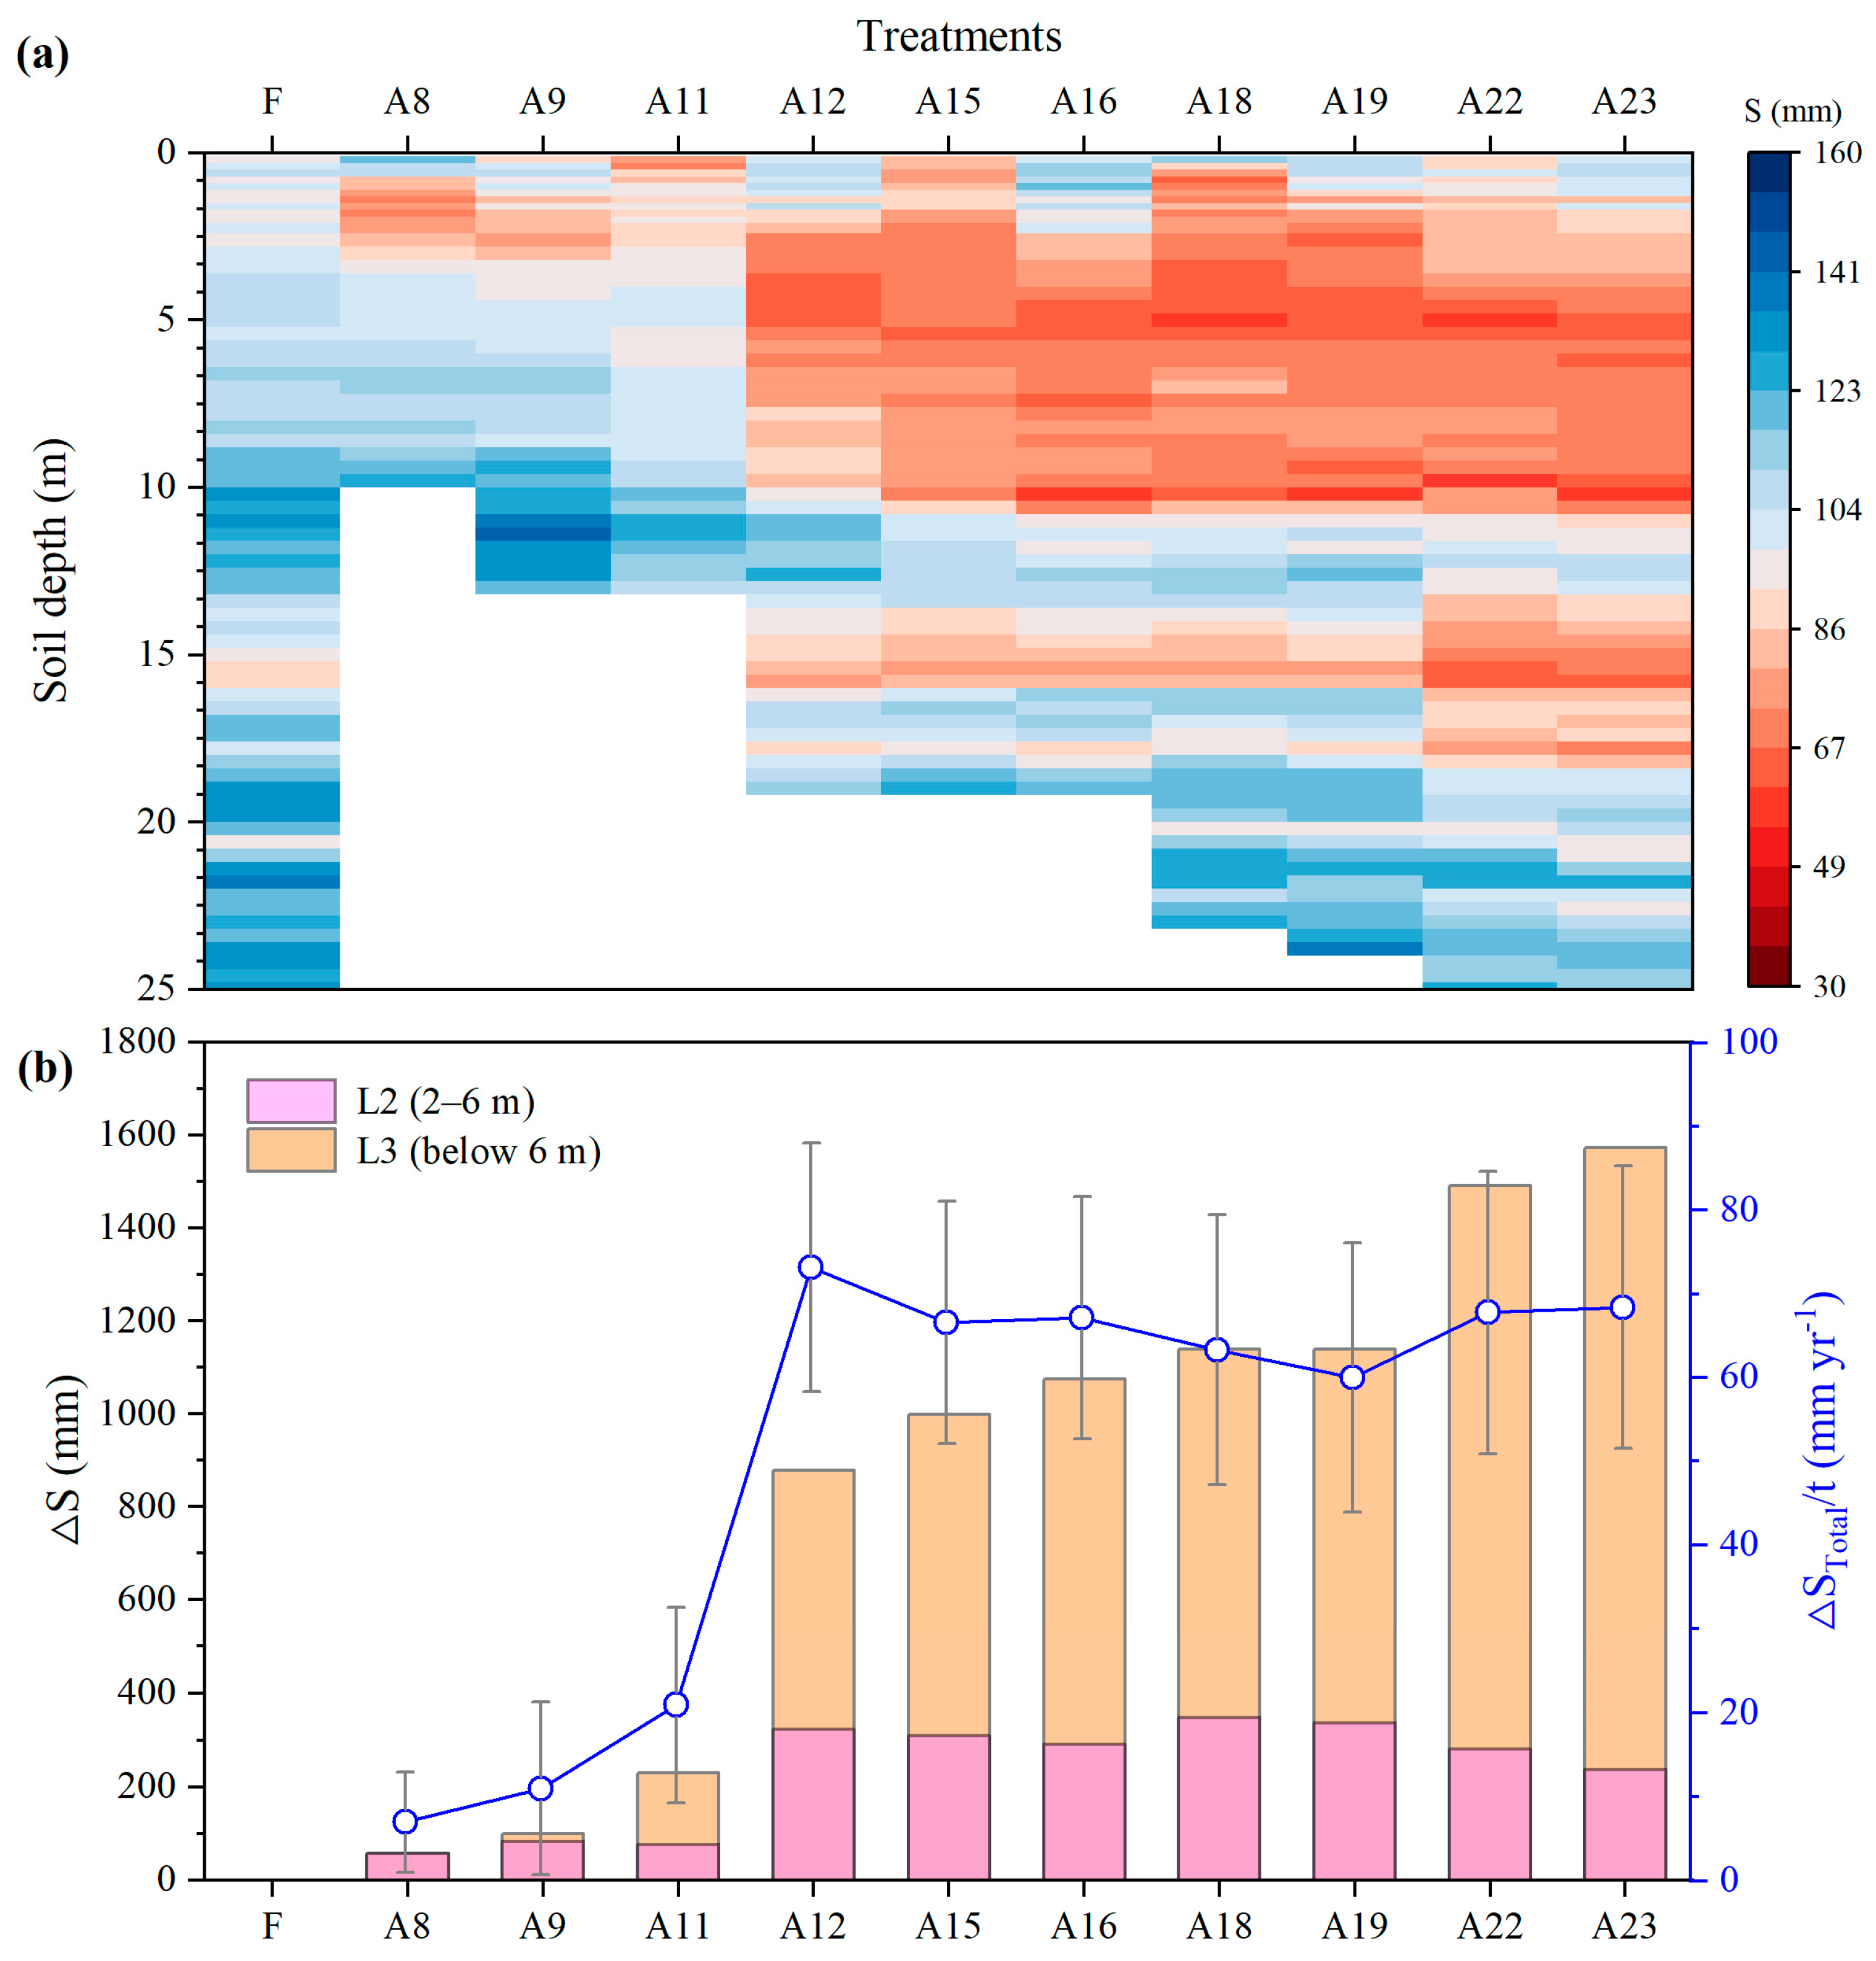
3.2. Soil Water Storage under Farmland and Apple Orchards

The soil water storage in deep soils (below 2 m) under apple orchards was significantly lower compared to that of the nearby farmland (Figure 4a). The total deficit of deep soil water storage (∆STotal = ∆SL2 + ∆SL3) under apple orchards ranged from 57 mm to 1573 mm. The L2 soil layer contributed 57–349 mm to the total deficit, whereas the L3 soil layer accounted for 0–1300 mm. (Figure 4b). The ∆STotal was smaller than the average annual precipitation (581 mm) from stand ages of 8 to 11 years, but far greater than the average annual precipitation from stand ages of 12 to 23 years. Moreover, the annual deficit rate (∆STotal/t) ranged from 7 mm year−1 to 73 mm year−1, with relatively higher rates observed in stand ages of 12 to 23 years (60–73 mm year−1).
The ∆STotal under apple orchards were strongly positively correlated to stand age (r = 1.00, p < 0.001; R2 = 0.91), maximum depth of fine root (r = 0.99, p < 0.001; R2 = 0.90), and diameter at breast height (r = 0.88, p < 0.001; R2 = 0.85) (Figure 3b and Figure 5). However, we noted that they were weakly correlated to either tree height (r = 0.30, p > 0.05) or leaf area index (r = 0.29, p > 0.05). Furthermore, stepwise multiple linear regression analysis showed that stand age accounted for the greatest variation in the ∆STotal (β = 0.95, p < 0.001), which can be attributed to the strong correlations between stand age, maximum depth of fine root, and diameter at breast height (Figure 3b). These findings collectively suggested that the deficit of deep soil water storage in apple orchards was predominantly influenced by stand age.

3.3. Components of Soil Water Balance

According to the tritium-peak method, deep drainage under the farmland was estimated at 33.0 mm year−1, accounting for 6% of the average annual precipitation (Figure 6). For apple orchards aged 8 to 11 years, the estimated deep drainage varied from 12 mm year−1 to 26 mm year−1. However, deep drainage was found to be negligible for apple orchards aged 12 to 23 years, due to the higher annual deficit rate of soil water storage. Based on the SWB equation [Equation (1)], ET/P values were estimated to be 94% for the farmland, 95%–98% for apple orchards aged 8 to 11 years, and 105%–107% for apple orchards aged 12 to 23 years. Furthermore, we estimated soil evaporation loss fraction (E/P) using stable isotopes of L2 soil water. The E/P values ranged from 13% to 20%, and exhibited a strong negative correlation with lc-excess in L2 soil water (E/P = −4.02 lc-excess + 0.93, R2 = 0.97, p < 0.001). This is reasonable because lc-excess serves as an indicator of evaporation intensity, with higher evaporation leading to lower lc-excess and higher E/P values. Finally, T/P and T/ET were estimated as the residuals of known components, with values of 78%–94% and 82%–88%, respectively.
The ET/P values under apple orchards showed a negative correlation with ∆STotal (r = −0.64, p < 0.05) (Figure 3b), while they exhibited a positive correlation with stand age (r = 0.64, p < 0.05) and maximum depth of fine roots (r = 0.63, p < 0.05). On the other hand, T/P values under apple orchards were negatively correlated with ∆STotal (r = −0.64, p < 0.05), but showed poor correlation with apple orchard characteristics (SA, MRD, DBH, TH, and LAI) (p > 0.05). These findings suggest that ET/P and T/P in apple orchards were primarily influenced by ∆STotal. Interestingly, we observed that T/ET had weak correlations with apple orchard characteristics (p > 0.05), but were strongly negatively correlated with E/P (r = −0.99, p < 0.001) and positively correlated with T/P (r = −0.76, p < 0.05).

4. Discussion

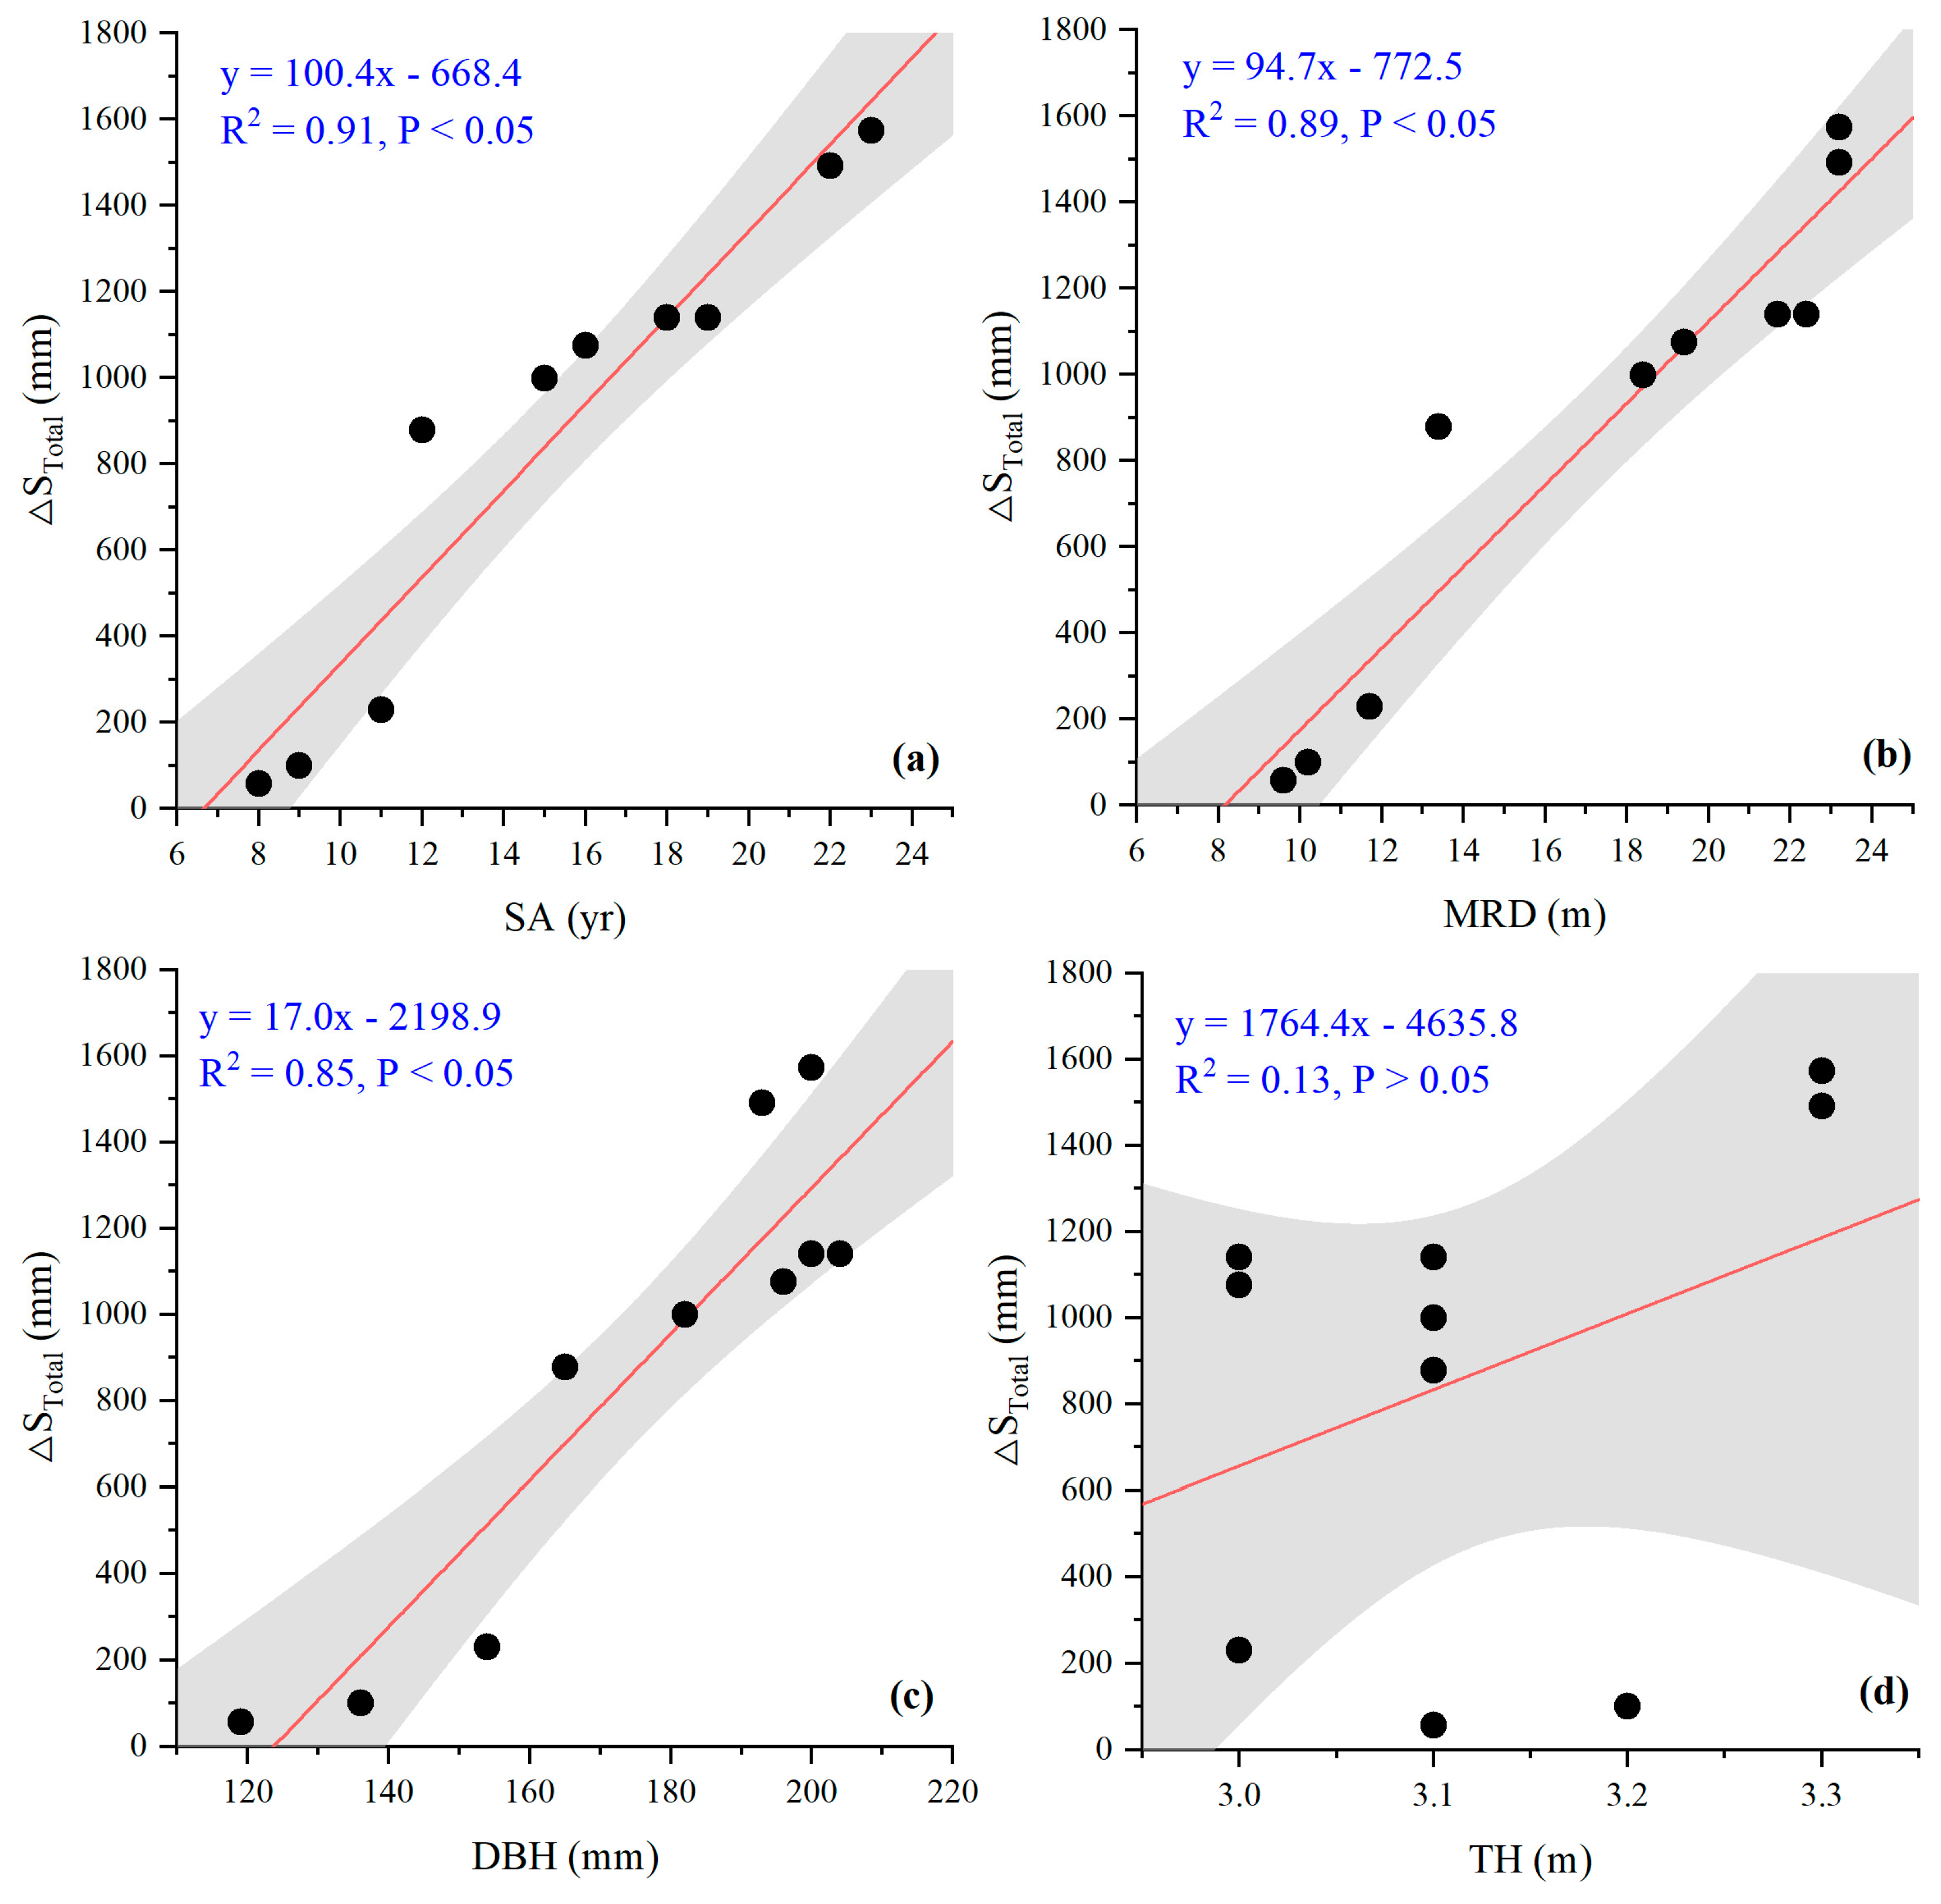
4.1. Deep Soil Water Storage Decreased by Apple Trees

We used the ‘Paired Plot’ method to evaluate the impact of apple trees on SWB. Thus, the reliability of this method was carefully validated. First, all treatments were conducted in close proximity to each other (<1 km) in a flat landscape, with soil evenly distributed horizontally at the study area [34]. Specifically, particle size analysis showed that the vertical profiles of soil texture were uniformly horizontally distributed among the five apple orchards (A8, A11, A15, A18, and A22) (Table 1). Second, despite occasional wet or hot years in the past three decades, there were minimal fluctuations in average precipitation over consecutive years [36]. Third, the apple orchards were previously converted from similar farmlands, maintaining a consistent tree density with 3.5 m between rows and 3 m between plants within rows. Overall, these sites shared similar hydrometeorological, topographical, and soil conditions, with the only differing factors being land use types and stand ages, thus fulfilling the criteria of the ‘Paired Plot’ method.
Our results showed that water storage in deep soils (below 2 m) under the apple orchards was considerably lower than that of the farmland (Figure 4). As deep soil water content shows little temporal variation throughout the year [36], the differences in deep soil water storage are likely due to treatments applied using the ‘Paired Plot’ method. In addition, correlation analysis suggested that the deficits of deep soil water storage were strongly correlated to stand age, maximum depth of fine root, and diameter at breast height, and stand age was the predominantly influencing factor (Figure 3b and Figure 5). This indicates a stand-age-related pattern of deep soil water storage deficit, further confirming the treatment effects. Therefore, we acknowledged that the decreased deep soil water storage under apple orchards was predominantly influenced by apple tree growth.

4.2. Are the Estimated Components of Soil Water Balance Reliable?

To investigate the impact of deep-rooted apple trees on SWB, we estimated all components of SWB by combing water stable isotopes, tritium, and soil water contents. Thus, we compared our estimated SWB components with data from local or global scales to verify the accuracy of our results and methodology (Table 3). The deep drainage was 0–33 mm year−1, which was consistent with the estimates (0–58 mm year−1) from the same site and other locations in the CLP [19,30,46]. The ET/P was 95%–107%, similar to the estimates (93%−114%) from the CLP [30]. The E/P was 13%–20%, which was similar to previous estimates (5%–40%) [31,32,47], and was also in line with the observations under similar vegetation covers in similar and other water-limited regions [6,7,48,49]. Moreover, T/ET was 82%−87% in this study, which agrees well with estimates from CLP (59%−95%) [30] and global meta-analysis (60%−90%) [7,48,49]. We understand that the data reported in the literature were collected under various vegetation covers and calculated using different methods. Despite these differences, multiple lines of evidence suggested that the employed methods of this study presented reliable results for SWB components and would provide an alternative approach for related studies.

4.3. How Do Deep-Rooted Apple Trees Impact Soil Water Balance?

Based on our ‘Paired Plot’ experiment, three main findings were obtained: (1) soil water storage in deep soils under apple orchards was significantly lower compared to that of the nearby farmland (Figure 4); (2) stand age had a predominant influence on ∆STotal (Figure 3 and Figure 5); and (3) ET/P and T/P in apple orchards were primarily affected by ∆STotal (Figure 3). These results indicated that the conversion of farmland to apple orchard leads to reduced soil water storage and increased T and ET, with these changes being correlated with the stand age of the apple trees. Because the soil evaporation among our treatments had limited differences (Figure 3), the decline in deep soil water storage can be attributed to the higher water requirements of apple trees to meet the greater T demand compared to farmland. Therefore, changes in SWB under apple orchards should be driven by root water uptake through the well-established deep-rooting system. This finding is consistent with previous studies conducted in the same region [23].
How do the water uptake strategies of the apple trees’ deep root system alter SWB? The ∆STotal under apple orchards was strongly positively correlated to stand age and maximum depth of fine root (Figure 3 and Figure 5). This suggested that deep soil water deficit under apple orchards was likely due to the long-term cumulative effects of root water uptake. Our tritium profile suggested that water infiltration is primarily controlled by a slow matrix flow, and as soil depth increases, the residence time of soil water also increases, which exceeds 53 years below 6 m (Figure 2). This means that in the context of a sub-humid climate (aridity index is 0.65), once apple trees deplete the deep soil water, it becomes challenging for precipitation to replenish it [37]. Under such a situation, as the apple tree ages, its transpiration demand increases (Figure 6), prompting the development of deeper root systems to access more water. This phenomenon was referred to as “one-off” root water uptake to distinguish this mode of root water uptake from the type that is characteristic of humid regions [36].
We also noted that despite the substantial deep soil water deficit in apple trees, the annual deficit rate is relatively small (7–73 mm year−1) compared to the annual precipitation (Figure 6). This indicates that deep soil water contributes only a small proportion to root water uptake, with shallow soils still dominating the process. Previous studies have demonstrated that the percentage of deep soil water utilized by apple trees varies over time, with levels reaching up to 60% during intense short-term meteorological droughts or towards the end of the growing season [53,54,55]. This suggests that short-term water scarcity prompts apple trees to access water from deep soils through their extensive root systems. This finding is consistent with observations in various ecosystems worldwide [56,57,58,59,60,61,62], which highlights that utilizing deep soil water is a vital self-regulatory mechanism for ecosystems to mitigate short-term droughts.
Overall, the main factor driving changes in SWB under apple orchards is the water uptake process dominated by the deep root system. This process is primarily stimulated by the increased transpiration demand of the apple trees and short-term water scarcity. While it enhances transpiration in the presence of sufficient water in deep soils, it inhibits transpiration by reducing stomatal conductance when deep soil water is depleted [58,63]. To ensure the long-term sustainability of apple orchards in this region, it is crucial to implement measures that effectively balance water supply and ecological water consumption. Strategies such as mulching to reduce surface evaporation, accurate monitoring of soil water dynamics, improved short-term meteorological drought forecasting, and precise irrigation under suitable conditions are essential. Additionally, pruning older apple trees to reduce transpiration-related water consumption, implementing management practices like crop rotation and thinning in orchards to decrease water usage, and facilitating deep soil water recharge are recommended. The ultimate goal is to minimize water consumption in orchards, allowing for increased rainfall infiltration and sustainable utilization of soil water and groundwater resources while maintaining the economic benefits for residents.
Additionally, our findings also have implications for afforestation at the CLP. A series of afforestation programs, overarched by the Grain-for-Green project in 1999, have been implemented since the 1950s [64]. These programs have successfully enhanced soil stability, but have also led to unintended consequences [13,65]. For example, the extensive root systems of newly planted trees have caused a reduction in deep water storage that cannot be easily replenished [24,37,66], posing a challenge to the ecological sustainability of reforestation efforts. While previous studies have mainly focused on examining the influence of climatic, soil, vegetation, and topographic factors on deep soil water storage [65,67], limited attention has been given to understanding how SWB components respond to afforestation. Therefore, insights gained from our study on deep-rooted apple trees, could also have significant implications for afforestation programs.

4.4. Limitation of This Study

In this study, water stable isotopes, tritium, and soil water content were used together to calculate each component of SWB. This allowed us to separate SWB and understand the impact of apple tree growth on soil hydrological processes. By examining the distribution patterns of water stable isotopes, tritium, and soil water content, we found that even though these measurements were taken only once, they provided valuable information on soil hydrological processes over the entire life cycle of apple trees post-planting. For instance, the soil water balance of A8 reflects the average water balance over the eight years following tree planting. However, the changes in soil water balance due to vegetation growth are a long-term dynamic process that the methods used in this study were unable to fully capture. While various methods exist to decouple and close the soil water balance, such as field monitoring, modeling, and isotope approaches [6,7], numerical simulation is essential for achieving closure with limited monitoring data. It is important to note that numerical simulation requires prior information to effectively constrain and refine the model for improved accuracy and reliability. Therefore, combining water stable-isotope-tracing technology with numerical simulation can enhance simulation accuracy and provide a better understanding of the dynamic evolution of water balance resulting from apple tree planting. Exploring this dynamic evolution will be a key focus of our future research.

5. Conclusions

Growing apple trees on the Loess Plateau, China, leads to a substantial deep soil water deficit, posing a serious threat to the sustainable development of apple production. To understand the impacts of deep-rooted apple trees on soil water balance in this region, we conducted a “Paired Plot” experiment to achieve this objective by decoupling SWB components using water stable isotopes, tritium, and soil water contents from deep soil cores under apple orchards with a stand age gradient of 8–23 years. The results showed that deep soil water storage under apple orchards was notably reduced compared to nearby farmland, showing a stand age-related pattern of deep soil water deficit. By analyzing the changing patterns of SWB components, we found that the main factor driving this deficit is the water uptake process controlled by the deep root system, which is triggered by the increased transpiration demand of apple trees and short-term water scarcity. The new insights gained from our study on deep-rooted apple trees could also have significant implications for afforestation programs in this region. These findings have implications for understanding soil water dynamics, sustainable agroforestry management, and soil water resources protection in this region and other similar water-limited areas.

Author Contributions

Conceptualization, W.X.; Methodology, W.X. and H.L.; Formal analysis, M.L.; Investigation, M.L.; Data curation, H.L.; Writing—original draft, W.X.; Writing—review & editing, B.S., J.S. and Y.T.; Project administration, W.X. and B.S.; Funding acquisition, W.X. All authors have read and agreed to the published version of the manuscript.

Funding

This research was funded by Natural Science Foundation of China [42207091, 41630860, and 41877017].

Data Availability Statement

All relevant data are within the manuscript and raw data will be made available on request after publication.

Acknowledgments

We are especially grateful to the editors and anonymous reviewers for their helpful comments and suggestions, which have improved the quality of this manuscript. We also appreciate the technical help from Jingjing Jin, Institute of Water-saving Agriculture in Arid Areas of China, Northwest A&F University.

Conflicts of Interest

The authors declare no conflict of interest.

References

  1. Chen, C.; Park, T.; Wang, X.; Piao, S.; Xu, B.; Chaturvedi, R.K.; Fuchs, R.; Brovkin, V.; Ciais, P.; Fensholt, R.; et al. China and India lead in greening of the world through land-use management. Nat. Sustain. 2019, 2, 122–129. [Google Scholar] [CrossRef] [PubMed]
  2. Vereecken, H.; Amelung, W.; Bauke, S.L.; Bogena, H.; Brüggemann, N.; Montzka, C.; Vanderborght, J.; Bechtold, M.; Blöschl, G.; Carminati, A.; et al. Soil hydrology in the Earth system. Nat. Rev. Earth Environ. 2022, 3, 573–587. [Google Scholar] [CrossRef]
  3. Sprenger, M.; Leistert, H.; Gimbel, K.; Weiler, M. Illuminating hydrological processes at the soil-vegetation-atmosphere interface with water stable isotopes. Rev. Geophys. 2016, 54, 674–704. [Google Scholar] [CrossRef]
  4. Hoek van Dijke, A.J.; Herold, M.; Mallick, K.; Benedict, I.; Machwitz, M.; Schlerf, M.; Pranindita, A.; Theeuwen, J.J.E.; Bastin, J.-F.; Teuling, A.J. Shifts in regional water availability due to global tree restoration. Nat. Geosci. 2022, 15, 363–368. [Google Scholar] [CrossRef]
  5. Zhang, M.F.; Wei, X.H. Deforestation, forestation, and water supply. Science 2021, 371, 990–991. [Google Scholar] [CrossRef]
  6. Stoy, P.C.; El-Madany, T.S.; Fisher, J.B.; Gentine, P.; Gerken, T.; Good, S.P.; Klosterhalfen, A.; Liu, S.G.; Miralles, D.G.; Perez-Priego, O.; et al. Reviews and syntheses: Turning the challenges of partitioning ecosystem evaporation and transpiration into opportunities. Biogeosciences 2019, 16, 3747–3775. [Google Scholar] [CrossRef]
  7. Kool, D.; Agam, N.; Lazarovitch, N.; Heitman, J.L.; Sauer, T.J.; Ben-Gal, A. A review of approaches for evapotranspiration partitioning. Agric. For. Meteorol. 2014, 184, 56–70. [Google Scholar] [CrossRef]
  8. Zhang, M.F.; Liu, N.; Harper, R.; Li, Q.; Liu, K.; Wei, X.H.; Ning, D.Y.; Hou, Y.P.; Liu, S.R. A global review on hydrological responses to forest change across multiple spatial scales: Importance of scale, climate, forest type and hydrological regime. J. Hydrol. 2017, 546, 44–59. [Google Scholar] [CrossRef]
  9. Zhou, S.; Yu, B.; Lintner, B.R.; Findell, K.L.; Zhang, Y. Projected increase in global runoff dominated by land surface changes. Nat. Clim. Change 2023, 13, 442–449. [Google Scholar] [CrossRef]
  10. Schwarzel, K.; Zhang, L.; Montanarella, L.; Wang, Y.; Sun, G. How afforestation affects the water cycle in drylands: A process-based comparative analysis. Glob. Change Biol. 2020, 26, 944–959. [Google Scholar] [CrossRef]
  11. Zhu, Y.J.; Jia, X.X.; Shao, M.A. Loess Thickness Variations Across the Loess Plateau of China. Surv. Geophys. 2018, 39, 715–727. [Google Scholar] [CrossRef]
  12. Shi, H.; Shao, M.A. Soil and water loss from the Loess Plateau in China. J. Arid. Environ. 2000, 45, 9–20. [Google Scholar] [CrossRef]
  13. Fu, B.J.; Wang, S.; Liu, Y.; Liu, J.B.; Liang, W.; Miao, C.Y. Hydrogeomorphic Ecosystem Responses to Natural and Anthropogenic Changes in the Loess Plateau of China. Annu. Rev. Earth Planet. Sci. 2017, 45, 223–243. [Google Scholar] [CrossRef]
  14. Fu, B.J.; Liu, Y.; Lu, Y.H.; He, C.S.; Zeng, Y.; Wu, B.F. Assessing the soil erosion control service of ecosystems change in the Loess Plateau of China. Ecol. Complex. 2011, 8, 284–293. [Google Scholar] [CrossRef]
  15. Liang, W.; Bai, D.; Wang, F.Y.; Fu, B.J.; Yan, J.P.; Wang, S.; Yang, Y.T.; Long, D.; Feng, M.Q. Quantifying the impacts of climate change and ecological restoration on streamflow changes based on a Budyko hydrological model in China’s Loess Plateau. Water Resour. Res. 2015, 51, 6500–6519. [Google Scholar] [CrossRef]
  16. Hu, J.Y.; Wu, Y.P.; Wang, L.J.; Sun, P.C.; Zhao, F.B.; Jin, Z.D.; Wang, Y.Q.; Qiu, L.J.; Lian, Y.Q. Impacts of land-use conversions on the water cycle in a typical watershed in the southern Chinese Loess Plateau. J. Hydrol. 2021, 593, 125741. [Google Scholar] [CrossRef]
  17. Qiu, L.J.; Wu, Y.P.; Wang, L.J.; Lei, X.H.; Liao, W.H.; Hui, Y.; Meng, X.Y. Spatiotemporal response of the water cycle to land use conversions in a typical hilly-gully basin on the Loess Plateau, China. Hydrol. Earth Syst. Sci. 2017, 21, 6485–6499. [Google Scholar] [CrossRef]
  18. Jian, S.Q.; Zhao, C.Y.; Fang, S.M.; Yu, K. Effects of different vegetation restoration on soil water storage and water balance in the Chinese Loess Plateau. Agric. For. Meteorol. 2015, 206, 85–96. [Google Scholar] [CrossRef]
  19. Zhang, Z.Q.; Li, M.; Si, B.C.; Feng, H. Deep rooted apple trees decrease groundwater recharge in the highland region of the Loess Plateau, China. Sci. Total Environ. 2018, 622–623, 584–593. [Google Scholar] [CrossRef]
  20. Li, J.; Chen, B.; Li, X.F.; Zhao, Y.J.; Ciren, Y.J.; Jiang, B.; Hu, W.; Cheng, J.M.; Shao, M.A. Effects of deep soil desiccation on artificial forestlands in different vegetation zones on the Loess Plateau of China. Acta Ecol. Sin. 2008, 28, 1429–1445. [Google Scholar] [CrossRef]
  21. Gao, X.D.; Zhao, X.N.; Wu, P.T.; Yang, M.; Ye, M.T.; Tian, L.; Zou, Y.F.; Wu, Y.; Zhang, F.S.; Siddique, K.H.M. The economic–environmental trade-off of growing apple trees in the drylands of China: A conceptual framework for sustainable intensification. J. Clean. Prod. 2021, 296, 126497. [Google Scholar] [CrossRef]
  22. Wang, D.; Wang, L. Canopy interception of apple orchards should not be ignored when assessing evapotranspiration partitioning on the Loess Plateau in China. Hydrol. Process. 2018, 33, 372–382. [Google Scholar] [CrossRef]
  23. Tao, Z.; Li, H.C.; Si, B.C. Stand age and precipitation affect deep soil water depletion of economical forest in the loess area. Agric. For. Meteorol. 2021, 310, 108636. [Google Scholar] [CrossRef]
  24. Wang, Y.Q.; Shao, M.A.; Sun, H.; Fu, Z.H.; Fan, J.; Hu, W.; Fang, L.C. Response of deep soil drought to precipitation, land use and topography across a semiarid watershed. Agric. For. Meteorol. 2020, 282–283, 107866. [Google Scholar] [CrossRef]
  25. Wang, Y.Q.; Hu, W.; Sun, H.; Zhao, Y.L.; Zhang, P.P.; Li, Z.M.; Zhou, Z.X.; Tong, Y.P.; Liu, S.Z.; Zhou, J.X.; et al. Soil moisture decline in China’s monsoon loess critical zone: More a result of land-use conversion than climate change. Proc. Natl. Acad. Sci. USA 2024, 121, e2322127121. [Google Scholar] [CrossRef] [PubMed]
  26. Turkeltaub, T.; Jia, X.X.; Zhu, Y.J.; Shao, M.A.; Binley, A. Recharge and Nitrate Transport Through the Deep Vadose Zone of the Loess Plateau: A Regional-Scale Model Investigation. Water Resour. Res. 2018, 54, 4332–4346. [Google Scholar] [CrossRef]
  27. Huang, Y.N.; Evaristo, J.; Li, Z. Multiple tracers reveal different groundwater recharge mechanisms in deep loess deposits. Geoderma 2019, 353, 204–212. [Google Scholar] [CrossRef]
  28. Huang, T.M.; Pang, Z.H.; Edmunds, W.M. Soil profile evolution following land-use change: Implications for groundwater quantity and quality. Hydrol. Process. 2013, 27, 1238–1252. [Google Scholar] [CrossRef]
  29. Gates, J.B.; Scanlon, B.R.; Mu, X.M.; Zhang, L. Impacts of soil conservation on groundwater recharge in the semi-arid Loess Plateau, China. Hydrogeol. J. 2011, 19, 865–875. [Google Scholar] [CrossRef]
  30. Li, B.B.; Shi, P.J.; Li, Z. Partitioning and controlling factors of evapotranspiration: 1. Hydrological modeling constrained with isotope-based water balance decoupling. Agric. Ecosyst. Environ. 2024, 364, 108908. [Google Scholar] [CrossRef]
  31. Al-Oqaili, F.; Good, S.P.; Peters, R.T.; Finkenbiner, C.; Sarwar, A. Using stable water isotopes to assess the influence of irrigation structural configurations on evaporation losses in semiarid agricultural systems. Agric. For. Meteorol. 2020, 291, 108083. [Google Scholar] [CrossRef]
  32. Xiang, W.; Si, B.C.; Li, M.; Li, H.; Lu, Y.W.; Zhao, M.H.; Feng, H. Stable isotopes of deep soil water retain long-term evaporation loss on China’s Loess Plateau. Sci. Total Environ. 2021, 784, 147153. [Google Scholar] [CrossRef] [PubMed]
  33. Zhu, X.M.; Li, Y.S.; Peng, X.L.; Zhang, S.G. Soils of the loess region in China. Geoderma 1983, 29, 237–255. [Google Scholar] [CrossRef]
  34. Tian, H.Y.; Fang, F.R.; Wang, Z.Q.; Li, S.Y.; Qiao, J.B.; Han, X.Y.; Zhu, Y.J.; Liu, W.Z. A mosaic pattern of apple orchards and farmland affects the distribution of soil water and nutrients in their adjacent areas on the Chinese Loess Plateau. Catena 2024, 237, 107776. [Google Scholar] [CrossRef]
  35. Wang, D.; Wang, L. Rainfall partitioning and its effects on regional water balances: Evidence from the conversion of traditional cropland to apple orchards in a semi-humid region. Hydrol. Process. 2020, 34, 4628–4639. [Google Scholar] [CrossRef]
  36. Li, H.J.; Si, B.C.; Wu, P.T.; McDonnell, J.J. Water mining from the deep critical zone by apple trees growing on loess. Hydrol. Process. 2019, 33, 320–327. [Google Scholar] [CrossRef]
  37. Xiang, W.; Evaristo, J.; Li, Z. Recharge mechanisms of deep soil water revealed by water isotopes in deep loess deposits. Geoderma 2020, 369, 114321. [Google Scholar] [CrossRef]
  38. Landwehr, J.M.; Coplen, T.B. Line-conditioned excess: A new method for characterizing stable hydrogen and oxygen isotope ratios in hydrologic systems. In International Conference on Isotopes in Environmental Studies; IAEA: Vienna, Austria, 2006; pp. 132–135. [Google Scholar]
  39. Lyu, S.D.; Wang, J. Soil Water Stable Isotopes Reveal Surface Soil Evaporation Loss Dynamics in a Subtropical Forest Plantation. Forests 2021, 12, 1648. [Google Scholar] [CrossRef]
  40. Craig, H.; Gordon, L.I. Deuterium and Oxygen 18 Variations in the Ocean and Marine Atmosphere. In Proceedings of the Symposium on Marine Geochemistry, Stable Isotopes in Oceanographic Studies and Paleotemperatures, Pisa, Italy, 1 January 1965; Laboratorio di Geologica Nucleare: Spoleto, Italy, 1965; pp. 9–130. [Google Scholar]
  41. Gibson, J.J.; Birks, S.J.; Yi, Y. Stable isotope mass balance of lakes: A contemporary perspective. Quat. Sci. Rev. 2016, 131, 316–328. [Google Scholar] [CrossRef]
  42. Horita, J.; Wesolowski, D.J. Liquid-Vapor Fractionation of Oxygen and Hydrogen Isotopes of Water from the Freezing to the Critical-Temperature. Geochim. Cosmochim. Acta 1994, 58, 3425–3437. [Google Scholar] [CrossRef]
  43. Benettin, P.; Volkmann, T.H.M.; von Freyberg, J.; Frentress, J.; Penna, D.; Dawson, T.E.; Kirchner, J.W. Effects of climatic seasonality on the isotopic composition of evaporating soil waters. Hydrol. Earth Syst. Sci. 2018, 22, 2881–2890. [Google Scholar] [CrossRef]
  44. Horita, J.; Rozanski, K.; Cohen, S. Isotope effects in the evaporation of water: A status report of the Craig-Gordon model. Isot. Environ. Health Stud. 2008, 44, 23–49. [Google Scholar] [CrossRef] [PubMed]
  45. Lin, R.F.; Wei, K.Q. Tritium profiles of pore water in the Chinese loess unsaturated zone: Implications for estimation of groundwater recharge. J. Hydrol. 2006, 328, 192–199. [Google Scholar] [CrossRef]
  46. Huang, T.M.; Ma, B.Q.; Pang, Z.H.; Li, Z.; Li, Z.B.; Long, Y. How does precipitation recharge groundwater in loess aquifers? Evidence from multiple environmental tracers. J. Hydrol. 2020, 583, 124532. [Google Scholar] [CrossRef]
  47. Mahindawansha, A.; Külls, C.; Kraft, P.; Breuer, L. Investigating unproductive water losses from irrigated agricultural crops in the humid tropics through analyses of stable isotopes of water. Hydrol. Earth Syst. Sci. 2020, 24, 3627–3642. [Google Scholar] [CrossRef]
  48. Schlesinger, W.H.; Jasechko, S. Transpiration in the global water cycle. Agric. For. Meteorol. 2014, 189, 115–117. [Google Scholar] [CrossRef]
  49. Sutanto, S.J.; van den Hurk, B.; Dirmeyer, P.A.; Seneviratne, S.I.; Rockmann, T.; Trenberth, K.E.; Blyth, E.M.; Wenninger, J.; Hoffmann, G. HESS Opinions “A perspective on isotope versus non-isotope approaches to determine the contribution of transpiration to total evaporation”. Hydrol. Earth. Syst. Sci. 2014, 18, 2815–2827. [Google Scholar] [CrossRef]
  50. Zhao, W.Z.; Liu, B.; Chang, X.X.; Yang, Q.Y.; Yang, Y.T.; Liu, Z.L.; Cleverly, J.; Eamus, D. Evapotranspiration partitioning, stomatal conductance, and components of the water balance: A special case of a desert ecosystem in China. J. Hydrol. 2016, 538, 374–386. [Google Scholar] [CrossRef]
  51. Zhang, Y.C.; Shen, Y.J.; Sun, H.Y.; Gates, J.B. Evapotranspiration and its partitioning in an irrigated winter wheat field: A combined isotopic and micrometeorologic approach. J. Hydrol. 2011, 408, 203–211. [Google Scholar] [CrossRef]
  52. Scott, R.L.; Knowles, J.F.; Nelson, J.A.; Gentine, P.; Li, X.; Barron-Gafford, G.; Bryant, R.; Biederman, J.A. Water Availability Impacts on Evapotranspiration Partitioning. Agric. For. Meteorol. 2021, 297, 108251. [Google Scholar] [CrossRef]
  53. Gao, X.D.; Zhao, X.N.; Li, H.C.; Guo, L.; Lv, T.; Wu, P.T. Exotic shrub species (Caragana korshinskii) is more resistant to extreme natural drought than native species (Artemisia gmelinii) in a semiarid revegetated ecosystem. Agric. For. Meteorol. 2018, 263, 207–216. [Google Scholar] [CrossRef]
  54. Shi, P.J.; Gai, H.Q.; Li, Z. Partitioned Soil Water Balance and Its Link with Water Uptake Strategy Under Apple Trees in the Loess-Covered Region. Water Resour. Res. 2023, 59, e2022WR032670. [Google Scholar] [CrossRef]
  55. Zhao, L.H.; Gao, X.D.; He, N.N.; Zhao, X.N. Ecohydrological advantage of young apple tree-based agroforestry and its response to extreme droughts on the semiarid Loess Plateau. Agric. For. Meteorol. 2022, 321, 108969. [Google Scholar] [CrossRef]
  56. Miguez-Macho, G.; Fan, Y. Spatiotemporal origin of soil water taken up by vegetation. Nature 2021, 598, 624–628. [Google Scholar] [CrossRef] [PubMed]
  57. McCormick, E.L.; Dralle, D.N.; Hahm, W.J.; Tune, A.K.; Schmidt, L.M.; Chadwick, K.D.; Rempe, D.M. Widespread woody plant use of water stored in bedrock. Nature 2021, 597, 225–229. [Google Scholar] [CrossRef] [PubMed]
  58. Chitra-Tarak, R.; Xu, C.; Aguilar, S.; Anderson-Teixeira, K.J.; Chambers, J.; Detto, M.; Faybishenko, B.; Fisher, R.A.; Knox, R.G.; Koven, C.D.; et al. Hydraulically-vulnerable trees survive on deep-water access during droughts in a tropical forest. New Phytol. 2021, 231, 1798–1813. [Google Scholar] [CrossRef]
  59. McLaughlin, B.C.; Blakey, R.; Weitz, A.P.; Feng, X.; Brown, B.J.; Ackerly, D.D.; Dawson, T.E.; Thompson, S.E. Weather underground: Subsurface hydrologic processes mediate tree vulnerability to extreme climatic drought. Glob. Change Biol. 2020, 26, 3091–3107. [Google Scholar] [CrossRef]
  60. Szutu, D.J.; Papuga, S.A. Year-Round Transpiration Dynamics Linked with Deep Soil Moisture in a Warm Desert Shrubland. Water Resour. Res. 2019, 55, 5679–5695. [Google Scholar] [CrossRef]
  61. Rempe, D.M.; Dietrich, W.E. Direct observations of rock moisture, a hidden component of the hydrologic cycle. Proc. Natl. Acad. Sci. USA 2018, 115, 2664–2669. [Google Scholar] [CrossRef]
  62. Yang, F.T.; Feng, Z.M.; Wang, H.M.; Dai, X.Q.; Fu, X.L. Deep soil water extraction helps to drought avoidance but shallow soil water uptake during dry season controls the inter-annual variation in tree growth in four subtropical plantations. Agric. For. Meteorol. 2017, 234, 106–114. [Google Scholar] [CrossRef]
  63. Yang, M.; Gao, X.D.; Zhao, X.N.; Wang, S.F. Quantifying the importance of deep root water uptake for apple trees’ hydrological and physiological performance in drylands. J. Hydrol. 2022, 606, 127471. [Google Scholar] [CrossRef]
  64. Feng, X.M.; Fu, B.J.; Piao, S.; Wang, S.H.; Ciais, P.; Zeng, Z.Z.; Lu, Y.H.; Zeng, Y.; Li, Y.; Jiang, X.H.; et al. Revegetation in China’s Loess Plateau is approaching sustainable water resource limits. Nat. Clim. Change 2016, 6, 1019–1022. [Google Scholar] [CrossRef]
  65. Huang, L.M.; Shao, M.A. Advances and perspectives on soil water research in China’s Loess Plateau. Earth-Sci. Rev. 2019, 199, 102962. [Google Scholar] [CrossRef]
  66. Shao, R.; Zhang, B.Q.; He, X.G.; Su, T.X.; Li, Y.; Long, B.; Wang, X.J.; Yang, W.J.; He, C.S. Historical Water Storage Changes Over China’s Loess Plateau. Water Resour. Res. 2021, 57, e2020WR028661. [Google Scholar] [CrossRef]
  67. Jia, X.X.; Shao, M.A.; Wei, X.R.; Zhu, Y.J.; Wang, Y.Q.; Hu, W. Policy development for sustainable soil water use on China’s Loess Plateau. Sci. Bull. 2020, 65, 2053–2056. [Google Scholar] [CrossRef]
Figure 1. The geographical location of the Loess Plateau (a), study area (b), climate characteristics (c), land use (d), and a diagram illustrating the experimental design (e). Uppercase letters F and A represent farmland and apple orchard, and the numbers after A are the stand age of apple orchards (in years).
Forests 15 00930 g001
Figure 2. Vertical distributions of soil water δ18O (a), averaged soil water δ18O of all treatments (b), and tritium under the farmland (c). In (c), the dash line represents the detection limit for the Liquid Scintillation Counter, and the pink tritium curve is fitted by the Gauss equation.
Forests 15 00930 g002
Figure 3. Spearman’s correlations between apple orchard characteristics (SA, MRD, DBH, TH, and LAI) and water stable isotopes (δ2H, δ18O, and lc-excess) in L2 soil layer (a), and soil water balance components (b), where statistically significant correlations are indicated with * (p ≤ 0.05) and ** (p ≤ 0.001).
Forests 15 00930 g003
Figure 4. Vertical distribution of soil water storage (S) for the treatments (a) and the deficit of soil water storage (∆S) and the annual deficit rate (∆STotal/t) under apple orchards (b), where ∆STotal is the sum of ∆SL2 and ∆SL3.
Forests 15 00930 g004
Figure 5. Relationships of the total deficit of soil water storage (∆STotal) under apple orchards between apple orchard characteristics (SA (a), MRD (b), DBH (c), and TH (d)). The shaded area represents the 95% confidence interval.
Forests 15 00930 g005
Figure 6. The estimated components of soil water balance under farmland and apple orchards. D, E, T, and ET represent deep drainage, soil evaporation, transpiration, and evapotranspiration, respectively.
Forests 15 00930 g006
Table 1. Basic information of the treatments, where SA, TH, DBH, MRD, and LAI represent the stand age, tree height, diameter at breast height, maximum depth of fine root (<2 mm), and leaf area index, respectively.
TreatmentsLand Use TypesSampling DateSoil Depth
[m]
Clay
[%]
Silt
[%]
Sand
[%]
SA
[year]
TH
[m]
DBH
[mm]
MRD
[m]
LAI
[m2 m−2]
FfarmlandApril 20172519.1 (4.4)72.0 (4.3)8.9 (3.0)-----
A8apple orchardJuly 20161018.2 (3.5)71.6 (4.1)10.2 (4.0)83.1 (0.2)119 (8.7)9.6 (0.4)1.7 (0.7)
A9apple orchardApril 201713---93.213610.21.6 (0.6)
A11apple orchardJuly 20161320.2 (4.8)70.0 (5.5)9.8 (3.2)113.0 (0.1)154 (11.9)11.7 (0.6)2.1 (0.8)
A12apple orchardApril 201719---123.116513.42.1 (0.7)
A15apple orchardJuly 20161919.7 (4.6)70.7 (5.1)9.6 (2.6)153.1 (0.1)182 (13.9)18.4 (1.1)2.5 (0.7)
A16apple orchardApril 201719---163.019619.42.5 (0.6)
A18apple orchardJuly 20162321.2 (4.4)69.9 (4.3)8.9 (2.4)183.0 (0.1)200 (15.4)21.7 (0.9)2.2 (0.5)
A19apple orchardApril 201724---193.120422.42.1 (0.7)
A22apple orchardJuly 20162520.8 (4.1)70.0 (4.4)9.2 (2.7)223.3 (0.2)193 (16.8)23.2 (0.8)1.9 (0.5)
A23apple orchardApril 201725---233.320023.21.9 (0.5)
Number is mean and standard deviation (in bracket). The data of clay, silt, and sand were derived from [23], where particle size limits are based on the classification method proposed by the United States Department of Agriculture with 0.05 to 2 mm for sand, 0.002–0.05 mm for silt, and 0–0.002 mm for clay.
Table 2. Statistical characteristics of water stable isotopes in different soil layers (L1, 0–2 m; L2, 2–6 m; L3, below 6 m), where number is mean and standard deviation (in bracket). Different letters indicate significant differences according to the post hoc LSD test (α = 0.05).
Treatmentsδ18O [‰]lc-excess [‰]
L1L2L3L1L2L3
F−8.9 (1.9)−9.1 (0.4) ab−9.3 (0.4)−2.6 (2.0)−4.0 (0.6) bcd−3.7 (1.2)
A8−7.7 (2.4)−9.5 (0.6) cd−10.1 (0.5)−4.9 (3.2)−3.4 (0.6) ab−3.4 (1.2)
A9−8.9 (1.9)−9.4 (0.4) bcd−9.2 (0.2)−4.5 (1.5)−3.7 (0.5) ab−3.5 (0.7)
A11−8.3 (0.8)−9.1 (0.3) abc−9.3 (0.5)−2.1 (1.3)−3.8 (1.0) abc−3.2 (1.3)
A12−7.4 (3.2)−9.6 (0.3) d−10.4 (0.2)−5.7 (4.5)−3.1 (0.7) a−1.9 (0.9)
A15−7.9 (1.6)−9.4 (0.3) bcd−9.3 (0.3)−2.7 (0.9)−3.3 (0.7) ab−3.5 (0.9)
A16−7.6 (1.2)−9.3 (0.4) bcd−9.0 (0.4)−3.3 (2.0)−3.4 (0.4) ab−4.7 (0.9)
A18−7.9 (1.7)−9.3 (0.5) bcd−9.8 (0.5)−4.6 (2.4)−4.6 (1.3) cd−4.9 (1.6)
A19−8.4 (0.6)−9.5 (0.6) d−9.7 (0.5)−2.7 (1.5)−3.1 (1.5) a−3.9 (1.3)
A22−8.2 (0.8)−8.9 (0.4) a−9.9 (0.8)−1.8 (0.8)−4.7 (1.1) d−4.2 (1.5)
A23−7.7 (2.1)−9.5 (0.3) cd−9.3 (0.3)−3.7 (2.5)−3.1 (1.0) a−5.0 (0.8)
Table 3. Intercomparison of the estimated components of soil water balance at different sites based on different methods or scales.
IDLocationsMethodsLand Use TypesP
[mm year−1]
D
[mm year−1]
E/P
[%]
E/ET
[%]
T/ET
[%]
References
1Changwu, ChinaIsotope & water balanceFarmland, apple5810–3313–2013–1982–87This study
2Changwu, ChinaIsotope & HYDRUSFarmland, apple5811–10--64–74[30]
3Changwu, ChinaChloride mass balanceFarmland, apple5813–58---[19]
4The Loess Plateau, ChinaIsotopeFarmland, grassland346–723-5–15--[32]
5Heihe, ChinaWater balanceWoodland105–114--20–2773–80[50]
6Luancheng, ChinaIsotopeFarmland480---60–80[51]
7AZ, San Pedro River, USAWater use efficiencyWoodland261--22–4456–78[52]
8GlobalMeta-analysisFarmland, orchard---20–4060–80[7]
9GlobalMeta-analysisNatural forest, shrub---10–3565–90[7]
10GlobalMeta-analysisDeciduous Forests234–896-9–36--[48]
Disclaimer/Publisher’s Note: The statements, opinions and data contained in all publications are solely those of the individual author(s) and contributor(s) and not of MDPI and/or the editor(s). MDPI and/or the editor(s) disclaim responsibility for any injury to people or property resulting from any ideas, methods, instructions or products referred to in the content.

