1. Introduction
Pine wilt disease (PWD), caused by the pine wood nematode, is a forest disease characterized by high pathogenicity, rapid spread, and a wide transmission pathway, resulting in severe damage to pine forest resources in China [
1]. This disease has been classified as a quarantine pest in more than 40 countries, with China experiencing substantial direct economic losses and ecological service value depletion [
2]. Owing to the extensive forested area and the high costs and limited scope of manual inspection and monitoring, there is a need for efficient, cost-effective, and accurate monitoring techniques. In recent years, the advancement of UAV (Unmanned Aerial Vehicle) remote sensing technology has demonstrated significant potential for application in the monitoring of pine wood nematode disease, leveraging its operational ease, adaptability, extensive coverage, and real-time capabilities [
3].
The use of UAV remote sensing for monitoring pine blight outbreaks has undergone significant evolution over the past few decades. Traditional machine learning algorithms, such as SVM (Support Vector Machine), RF (Random Forest), and ANNs (Artificial Neural Networks), have been developed and optimized by integrating spectral and spatial features. These methods have been successfully employed for identifying pine blight tree damage in Multi-Spectral Imagery (MSI) and Hyper-Spectral Imagery (HSI) datasets. However, classical machine learning necessitates intricate feature selection and combination work, posing challenges for leveraging in-depth image information [
4].
In recent years, with the development of deep learning object classification and detection technology, researchers have gradually applied it to PWD detection [
5,
6]. For instance, Qin et al. [
7] utilized a proposed SCANet (spatial-context-attention network) to diagnose pine nematode disease in UAV-based MSI datasets, achieving an average overall accuracy of 79.33%. Wu et al. [
8] used Faster R-CNN (Region-CNN) and YOLOv3 for early diagnosis of infected trees, demonstrating that YOLOv3 is more suitable for PWD detection. Gong et al. [
9] identified pine blight spots affected by pine wilt using YOLOv5, achieving a mean Average Precision (mAP) of 84.5%. Similarly, Sun et al. [
10] utilized the improved MobileNetv2-YOLOv4 algorithm to identify abnormal discoloration blight caused by pine wilt nematode disease, and the improved model achieved higher detection accuracy of 86.85%.
Although current deep learning methods have achieved some results in disease detection, realizing real-time detection on UAV platforms still faces great challenges. Changes in UAV flight altitude and speed lead to too small and different scales of disease and pest targets in trees, making detection difficult. In addition, limited by the computational resources, storage, and communication capabilities of the UAV platform, it is difficult for the existing deep learning-based methods to achieve a balance between detection accuracy and speed due to the complexity of their models.
Aiming at the above problems and difficulties, this paper takes the YOLOv5 model as the baseline network, redesigns and optimizes the feature extraction network, neck network, and loss function, and proposes ViTeYOLO, a lightweight pine wilt detection method based on Vision Transformer-enhanced YOLO, to improve its detection accuracy for PWD and achieve light weight. The main contributions of this paper are as follows:
A lightweight Multi-Scale Attention module (MSA) is introduced to construct an EfficientViT feature extraction network, which achieves efficient global information extraction and multi-scale learning through efficient hardware operations, reducing network computational complexity;
A Content-Aware Cross-Scale bidirectional fusion neck network (CACSNet) is proposed, which uses the Content-Aware Reassembly Feature Enhancement (CARAFE) operator to replace the bilinear difference in PANET (Path Aggregation Network) for upsampling, and uses cross-scale weighting for feature fusion to improve the expression ability of fine-grained features of diseased trees, prevent small target feature loss, and improve detection accuracy;
Optimization of the loss function and introduction of EIOU (Efficient Intersection over Union) loss to help the model better balance the size and shape information of the target, improving the accuracy and robustness of PWD detection.
3. Materials and Methods
In this paper, we redesigned the feature extraction network based on the baseline network YOLOv5 and proposed a lightweight pine wilt detection method based on ViT-enhanced YOLO. Firstly, we constructed a lightweight EfficientViT feature extraction network with lightweight MSA as the core to replace YOLOv5’s CSPDarkNet53(DarkNet53 with Cross-stage Partial Connections). Secondly, a cross-scale feature fusion neck network (CACSNET) was designed, which uses the CARAFE operator to replace the bilinear difference in the original model for upsampling, and then performs cross scale feature fusion. Finally, EIOU was introduced to optimize the loss function. The comprehensive architecture of the proposed Light-ViTeYOLO is shown in
Figure 2.
Below, we will analyze YOLOv5 and provide a detailed explanation of the proposed Light-ViTeYOLO.
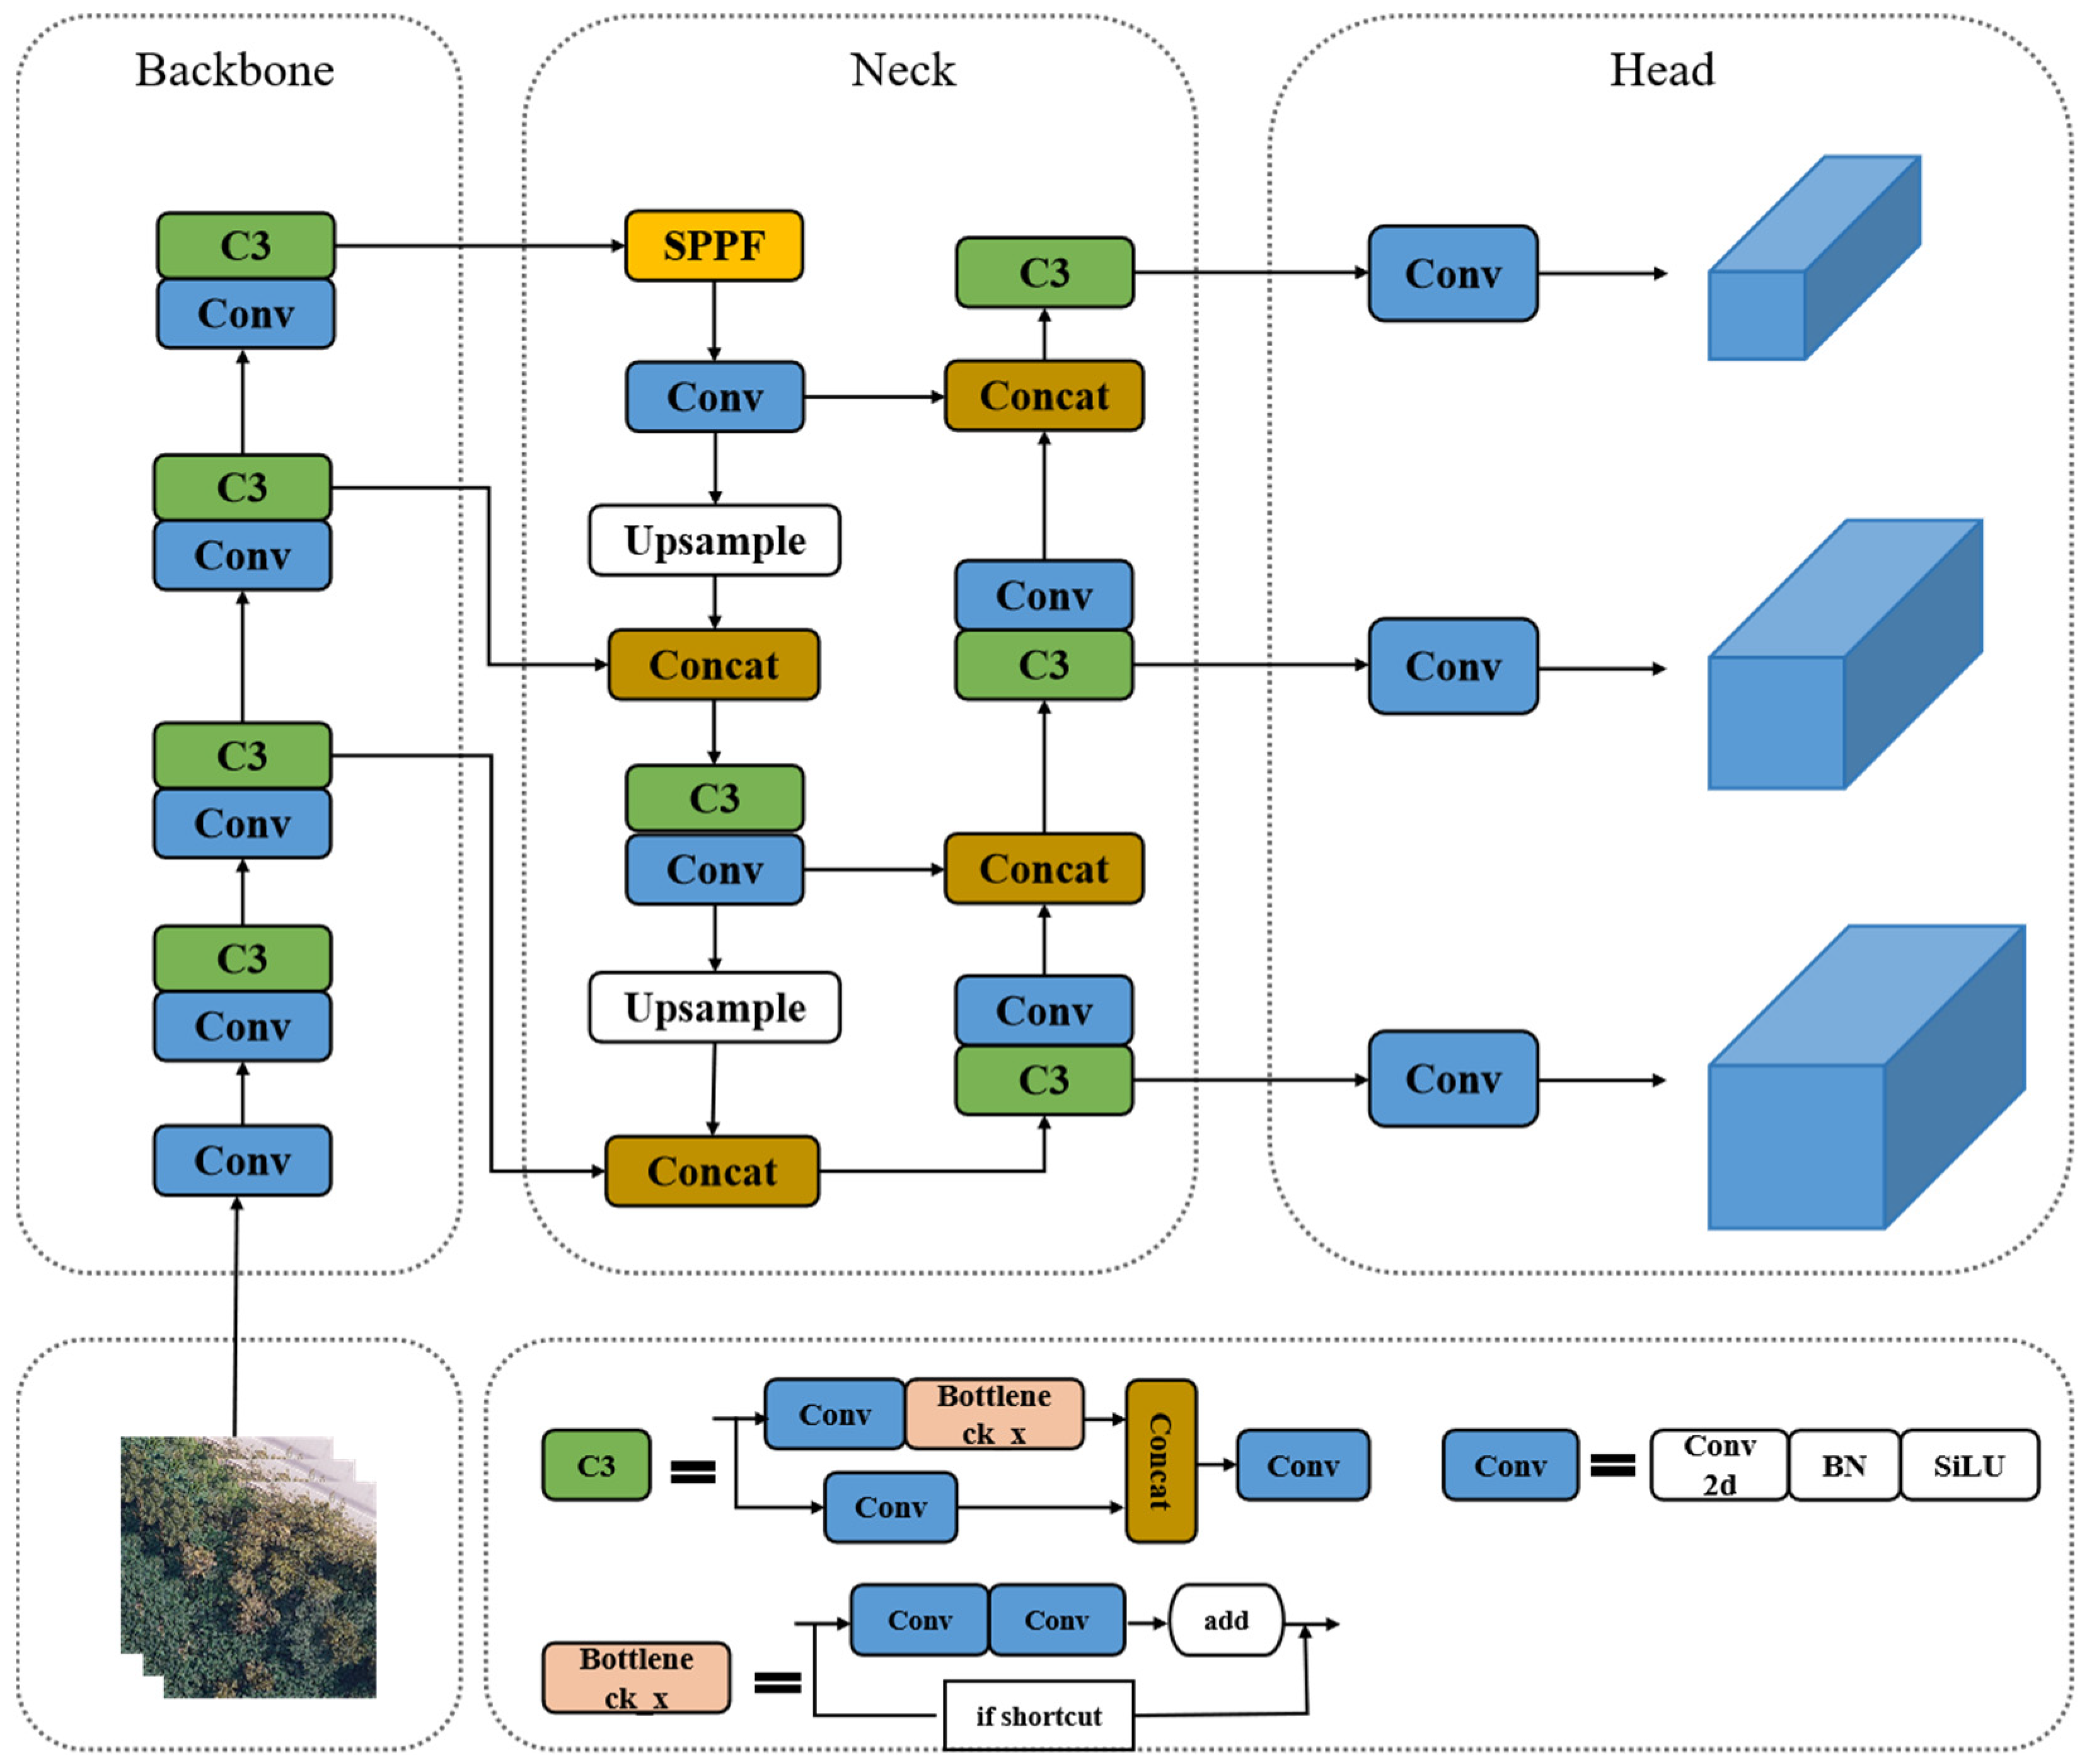
3.1. Baseline Network YOLOv5
The network structure of YOLOv5 can be divided into the following three parts: the backbone, the neck segment, and the head output segment, with the specific structure depicted in
Figure 3.
After the input image undergoes preprocessing, it is fed into the backbone feature extraction network, CSPDarkNet53, associated with multiple convolutional operations. This process transforms the image into a feature map and facilitates the extraction of semantic and structural information from the input image. Subsequently, at the neck layer, a feature pyramid PANet is established at varying scales, with each feature map comprising different resolutions corresponding to receptive fields of different scales. Finally, YOLOv5 utilizes the output of detection frame processed by the NMS (Non-maximum Suppression)- as the ultimate target detection result.
However, YOLOv5’s use of a series of convolutional modules for feature extraction results in a complex network and the inability to effectively capture global information. Consequently, the bilinear interpolation used in the neck network cannot utilize the semantic information of the feature maps, and the perception domain is limited to the sub-pixel domain. The above design cannot be suitable for the real-time detection requirements of multi-scale and small targets in PWD detection tasks. In light of this, the following improvements will be carried out.
3.2. Redesign of Backbone Feature Extraction Network
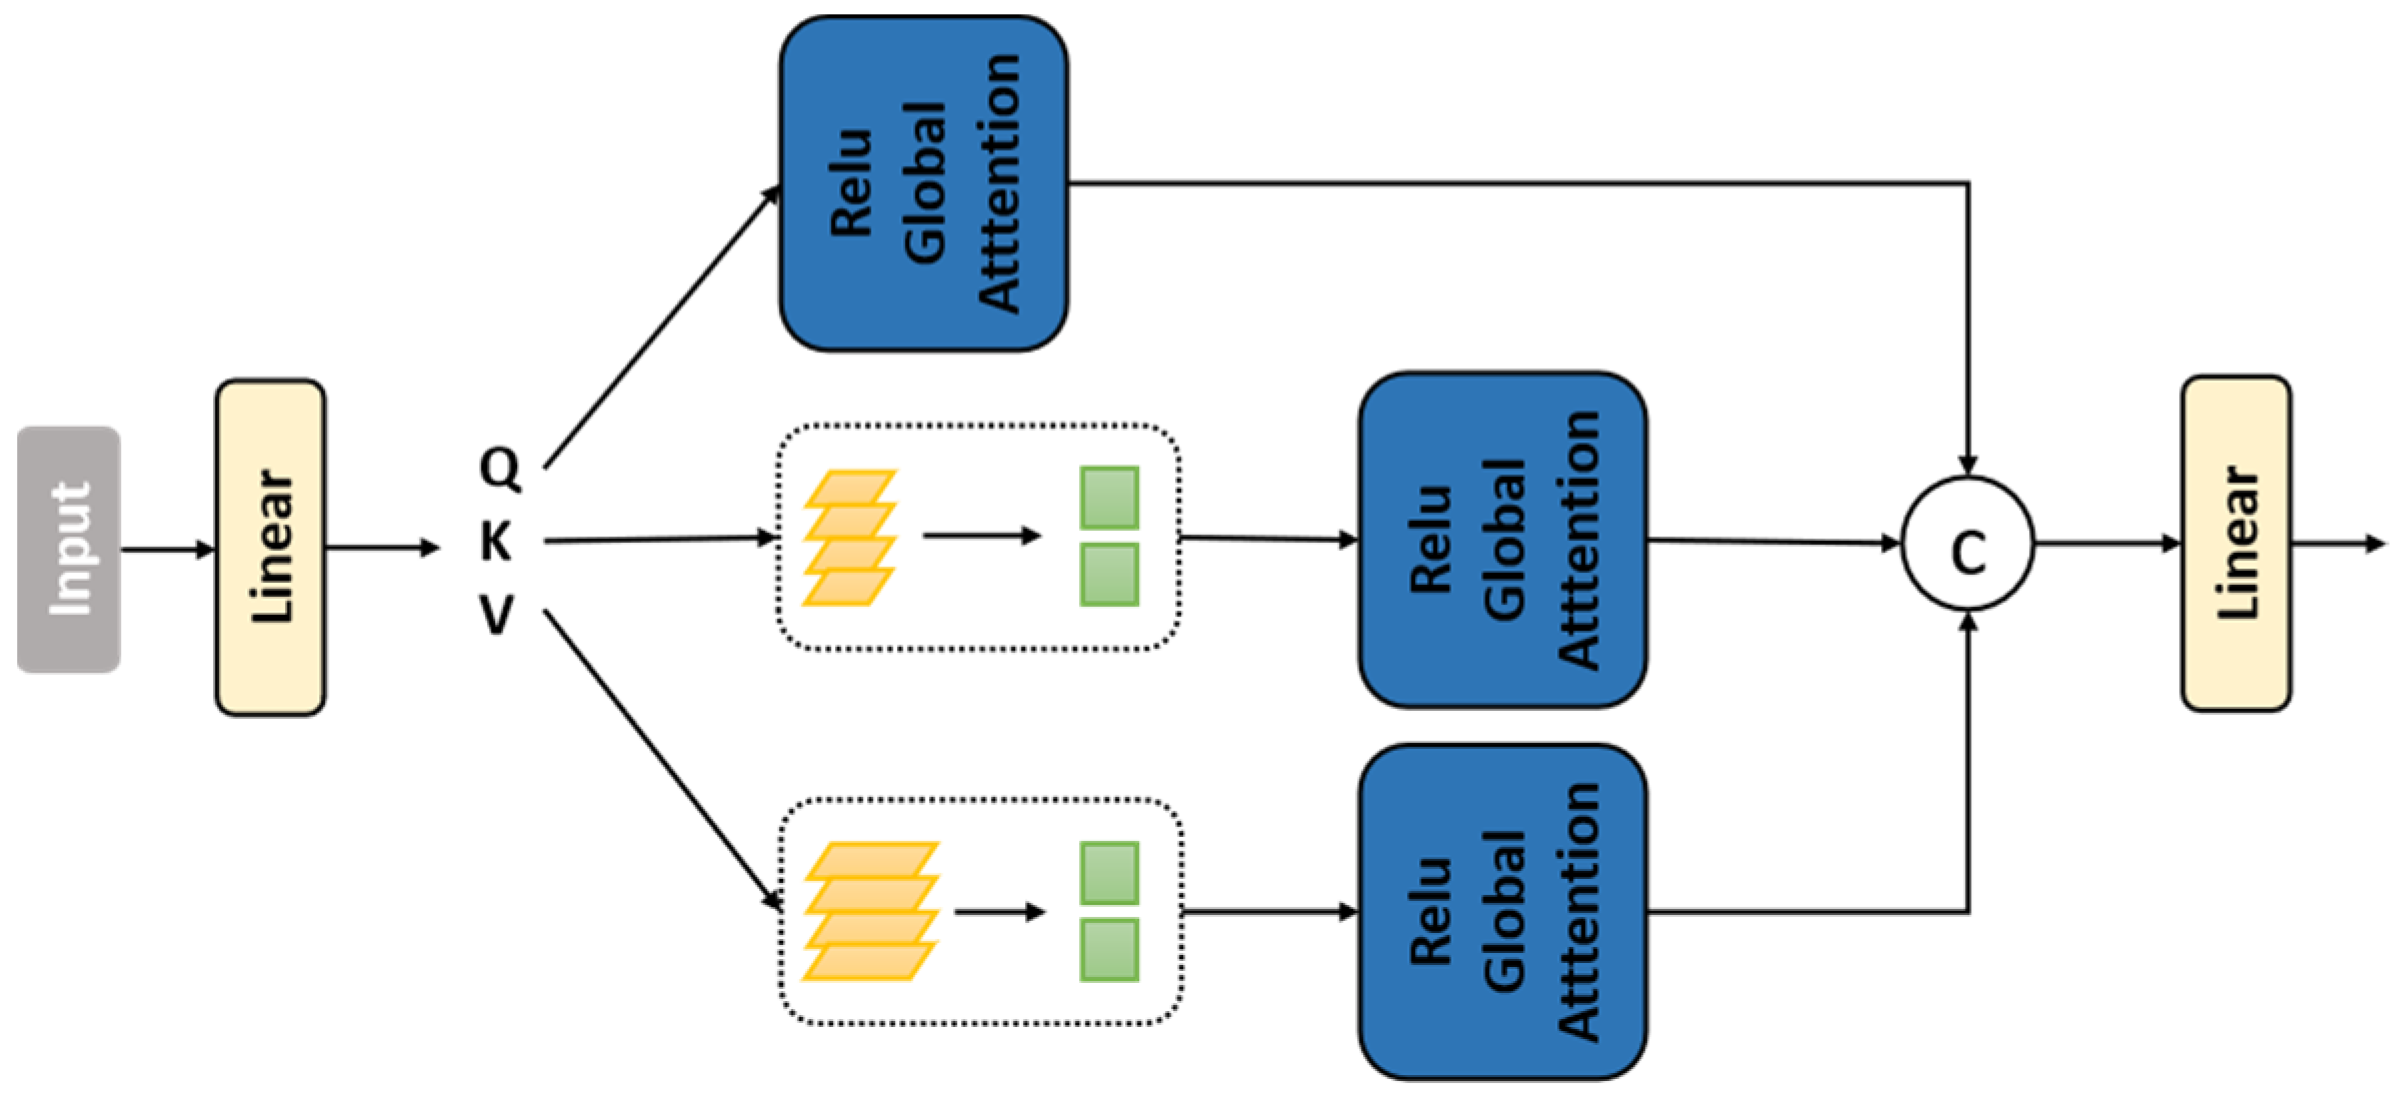
In this paper, an examination of the structure of the visual transformer (ViT) has revealed that the main computational bottleneck is the softmax attention module, which exhibits quadratic computational complexity with respect to the input resolution. To address this issue, the lightweight Multi-Scale Attention (MSA) module introduced in
Section 2.2 is specifically designed to enhance execution speed, delivering a substantial inference speedup while maintaining accuracy.
Based on this, we construct the EfficientViT module with lightweight MSA as the core, which is used for the design of the feature extraction network in this paper. The redesigned EfficientViT feature extraction model is shown in
Figure 4 (left), with the EfficientViT module shown in
Figure 4 (right).
The EfficientViT module comprises the lightweight MSA module and the MBConv module [
22]. The lightweight MSA module is employed for contextual information extraction, while the MBConv module facilitates local information extraction. Notably, the linear attention utilized by the lightweight MSA module has limitations in capturing localized details, potentially leading to a notable loss in accuracy. To mitigate this shortcoming, a deep convolutional MBConv module is integrated behind the MSA to enhance linear attention. This strategy incurs low computational overhead while significantly augmenting the capability of linear attention in local feature extraction.
The EfficientViT model adheres to the standard backbone head/decoder architecture, reflecting the following design features:
- (1)
The backbone network incorporates an input backbone and four stages, characterized by diminishing feature map size and escalating channel numbers;
- (2)
Lightweight MSAs are integrated into stages 3 and 4;
- (3)
For downsampling, the model employs MBConv with a step size of 2.
The outputs of Stage 2, Stage 3, and Stage 4 collectively generate a feature map pyramid, serving as the input for feature fusion in the neck network. The detailed architecture configurations of EfficientViT variants is shown in the following
Table 1.
Here, C denotes the number of channels, L denotes the number of blocks, H denotes the feature map height, and W denotes the feature map width.
In this paper, the above-designed EfficientViT model replaces the feature extraction network CSPDarkNet53 of YOLOv5, aiming to achieve efficient hardware operation through a lightweight MSA design to improve the accelerated inference performance of the model, to achieve global awareness and multi-scale learning to ensure that performance is not sacrificed, and ultimately, to enable the proposed model to realize the real-time PWD detecting task.
3.3. Design of CACSNet Neck Networks
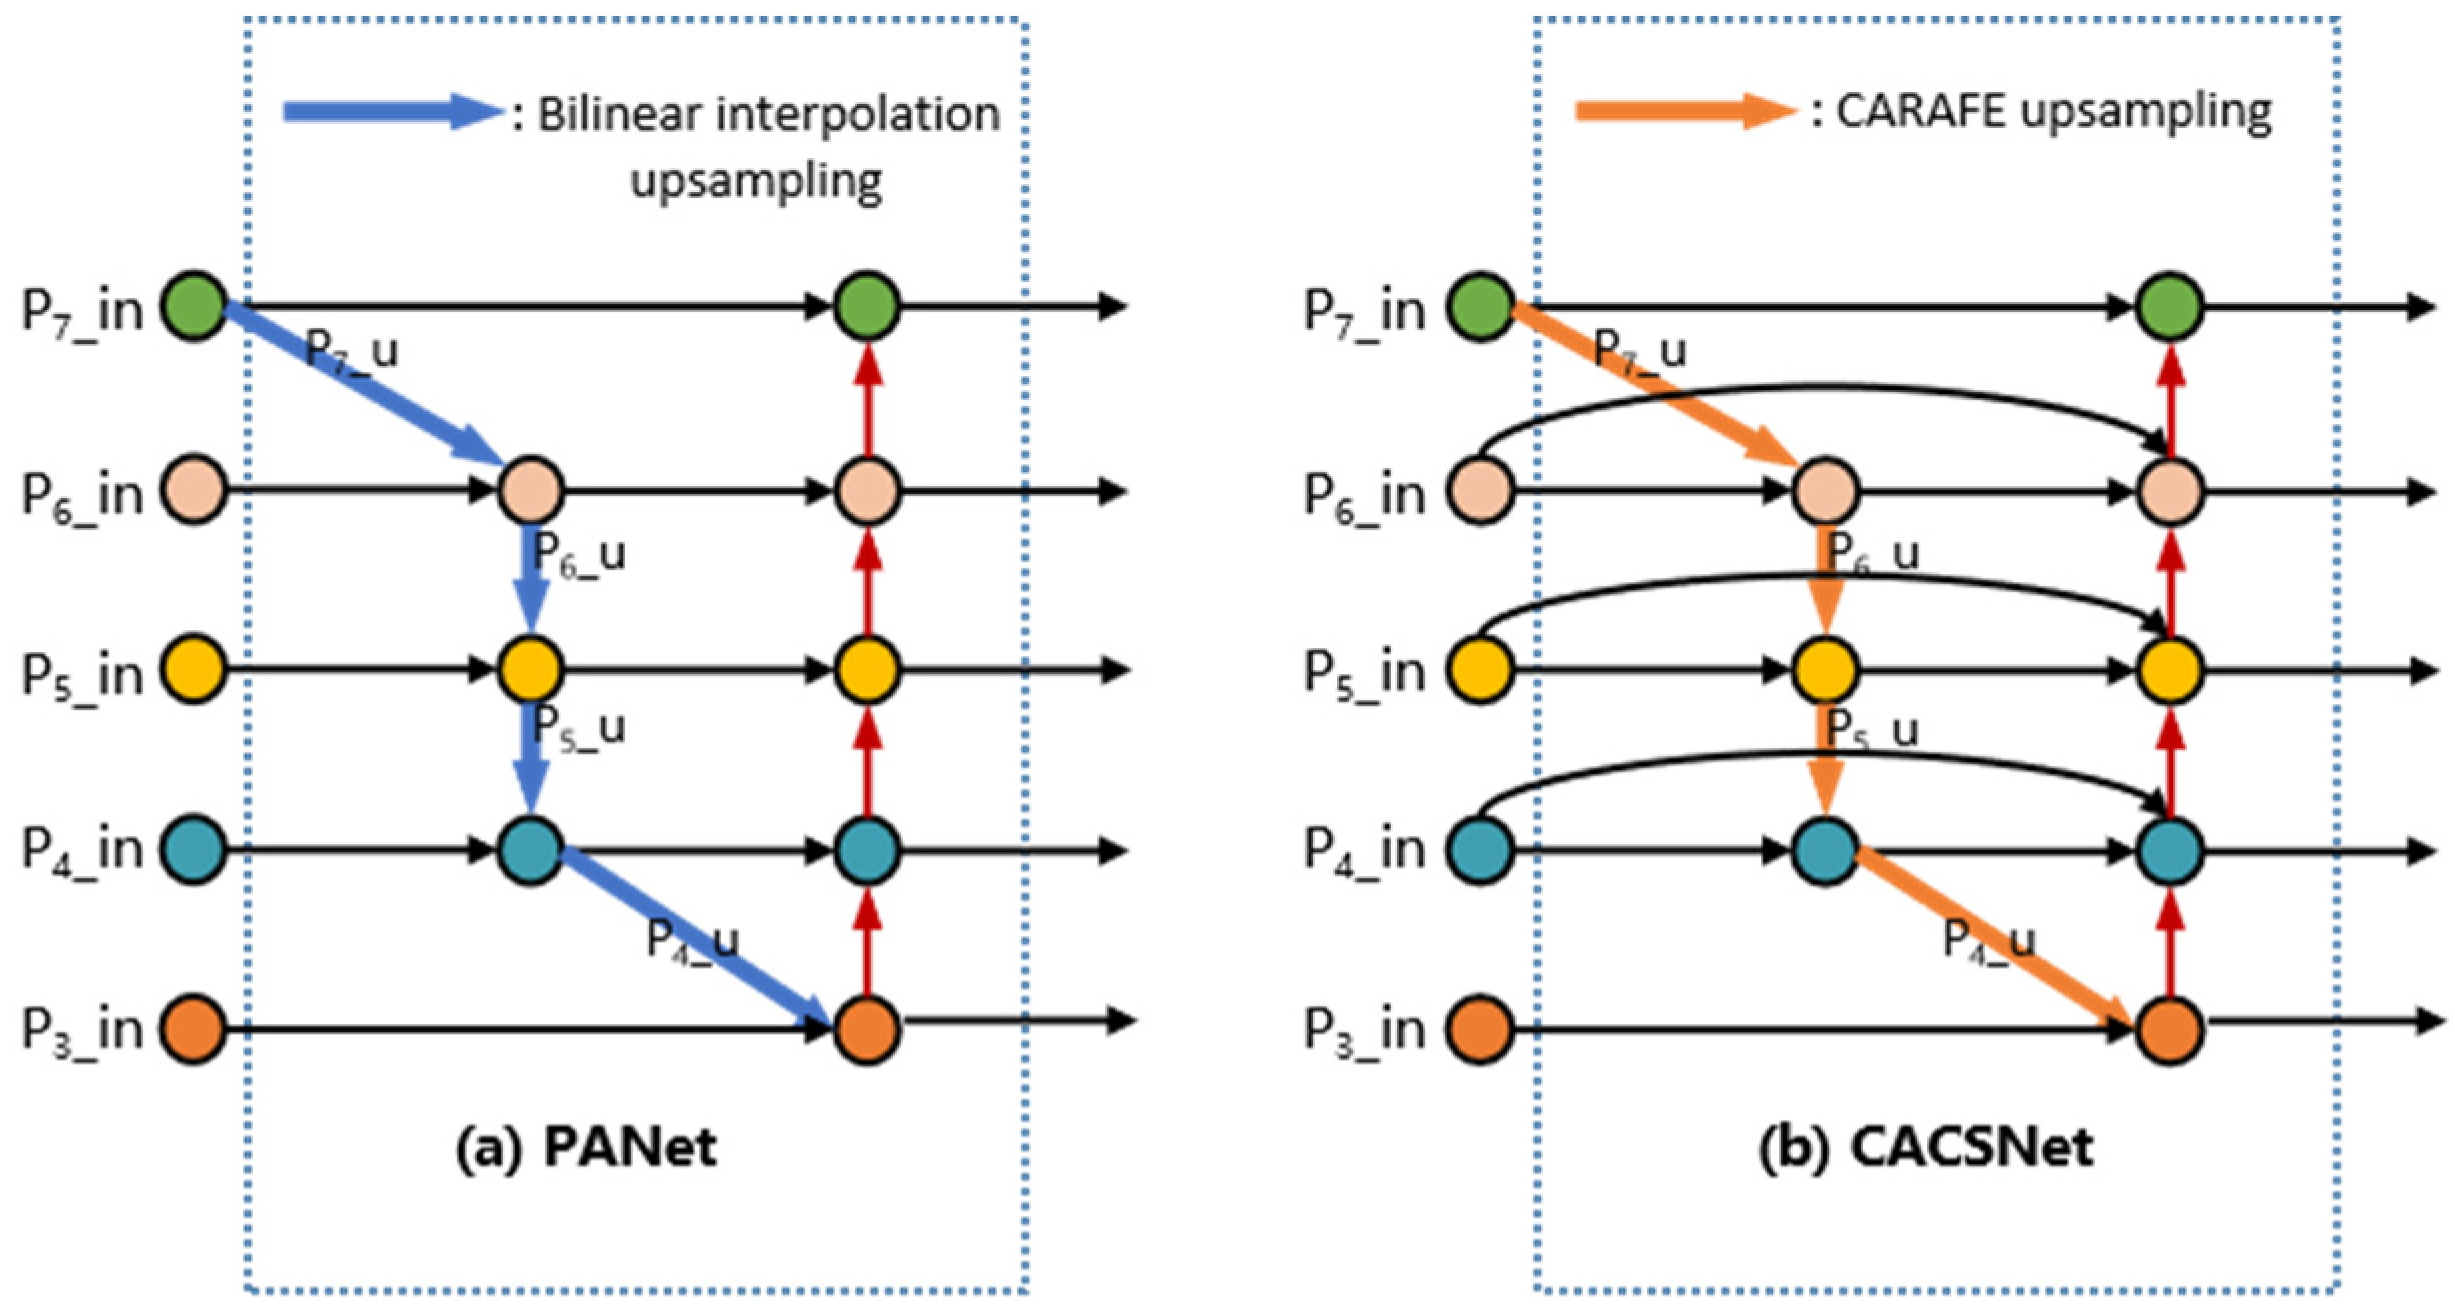
YOLOv5 uses PANET as a neck network for feature extraction and fusion, and as a key operation of the feature pyramid, the feature upsampling method uses bilinear interpolation. This method is unable to utilize the semantic information of the feature map and the perceptual domain is limited to the sub-pixel domain. In order to further optimize the performance, in this paper, PANET is improved and a content-aware cross-scale bi-directional fusion network (CACSNet) is designed as a new neck network. The specific improvements are described as follows.
Firstly, we use the CARAFE [
23] operator as the new up-sampling kernel to complete the up-sampling operation of the neck network (P7_u,P6_u,P5_u,P4_u in
Figure 5b) to realize the up-sampling based on the input content. The implementation specifically consists of two steps: the first step is to predict the reorganization kernel of each target location based on its content, and the second step is to restructure the features with the predicted kernel.
Given a feature map X of size C × H × W and an up-sampling rate α (α is an integer), CARAFE will generate a new feature map of size C × αH × αW and, for any target location of , its corresponding original location is , where and . Here, we denote as the k × k subregion of X centered at location l, i.e., the neighbors of .
In the first step, the kernel prediction module
predicts the spatially variant kernels
for each position
based on the neighborhoods of
, as shown in Equation (3). The second step is the restructuring step shown in Equation (4), where
is the content-aware reassembly module, which reassembles the neighborhoods of
with the kernel
.
where weights are generated in a content-aware manner. In addition, for each location there exists multiple sets of such up-sampling weights, and then feature up-sampling is accomplished by generating features rearranged into spatial blocks. CARAFE up-sampling can aggregate and reorganize the contextual information around the target within a large perceptual field, which improves the ability to express feature details and introduces little computational overhead.
Furthermore, to prevent the loss of feature information related to small targets during the feature extraction process, the paper incorporates cross-scale weighting for feature fusion in the neck layer (see
Figure 5). This is achieved by introducing additional connections (depicted as curved edges in
Figure 5) between the feature input nodes from the backbone network and the output nodes of the neck network at the same level. This approach facilitates the fusion of more original image features to maximize the retention of features related to individual diseased trees.
3.4. Optimization of Loss Function
In target detection, the loss function is critical in quantifying the disparity between the model’s predicted output and the actual target, driving continual learning during training to enhance the performance of the detection task. Typically, loss functions in object detection encompass bounding box regression loss, classification loss, and object presence loss. While YOLOv5 employs the CIOU (complete concatenated intersection) loss function for bounding box regression, this approach has limitations in handling variations in object location and size. As the CIOU loss function does not directly consider target location information, the model may prioritize the wrong bounding box location during optimization, leading to mismatches between the detected and actual disease areas and affecting detection accuracy. Moreover, the CIOU loss function exhibits reduced sensitivity to the degree of deformation in small targets, resulting in suboptimal model performance for detecting small targets.
To address these limitations, this paper adopts the EIOU loss function as an alternative. EIOU loss better balances detection accuracy by integrating position and size information of the target frame. By combining width and height information of the target frame and considering the intersection region-to-minimum closure region ratio, the EIOU loss function effectively addresses target size changes and deformation issues, enhancing detection accuracy and robustness. The EIOU loss function is calculated as follows:
The loss function comprises three components: the overlap loss (), the center distance loss (), and the width-height loss (). The first two components follow the approach used in CIOU. However, the width-height loss directly minimizes the disparity between the widths and heights of the target box and the predicted box, thereby accelerating convergence. Here, and are the width and height of the minimum enclosing box covering both boxes. represents the Euclidean distance between the center points of the anchor box and the ground truth box, represents the Euclidean distance between the width of the anchor box and the ground truth box, and represents the Euclidean distance between the height of the anchor box and the ground truth box.
4. Experiment and Performance Analysis
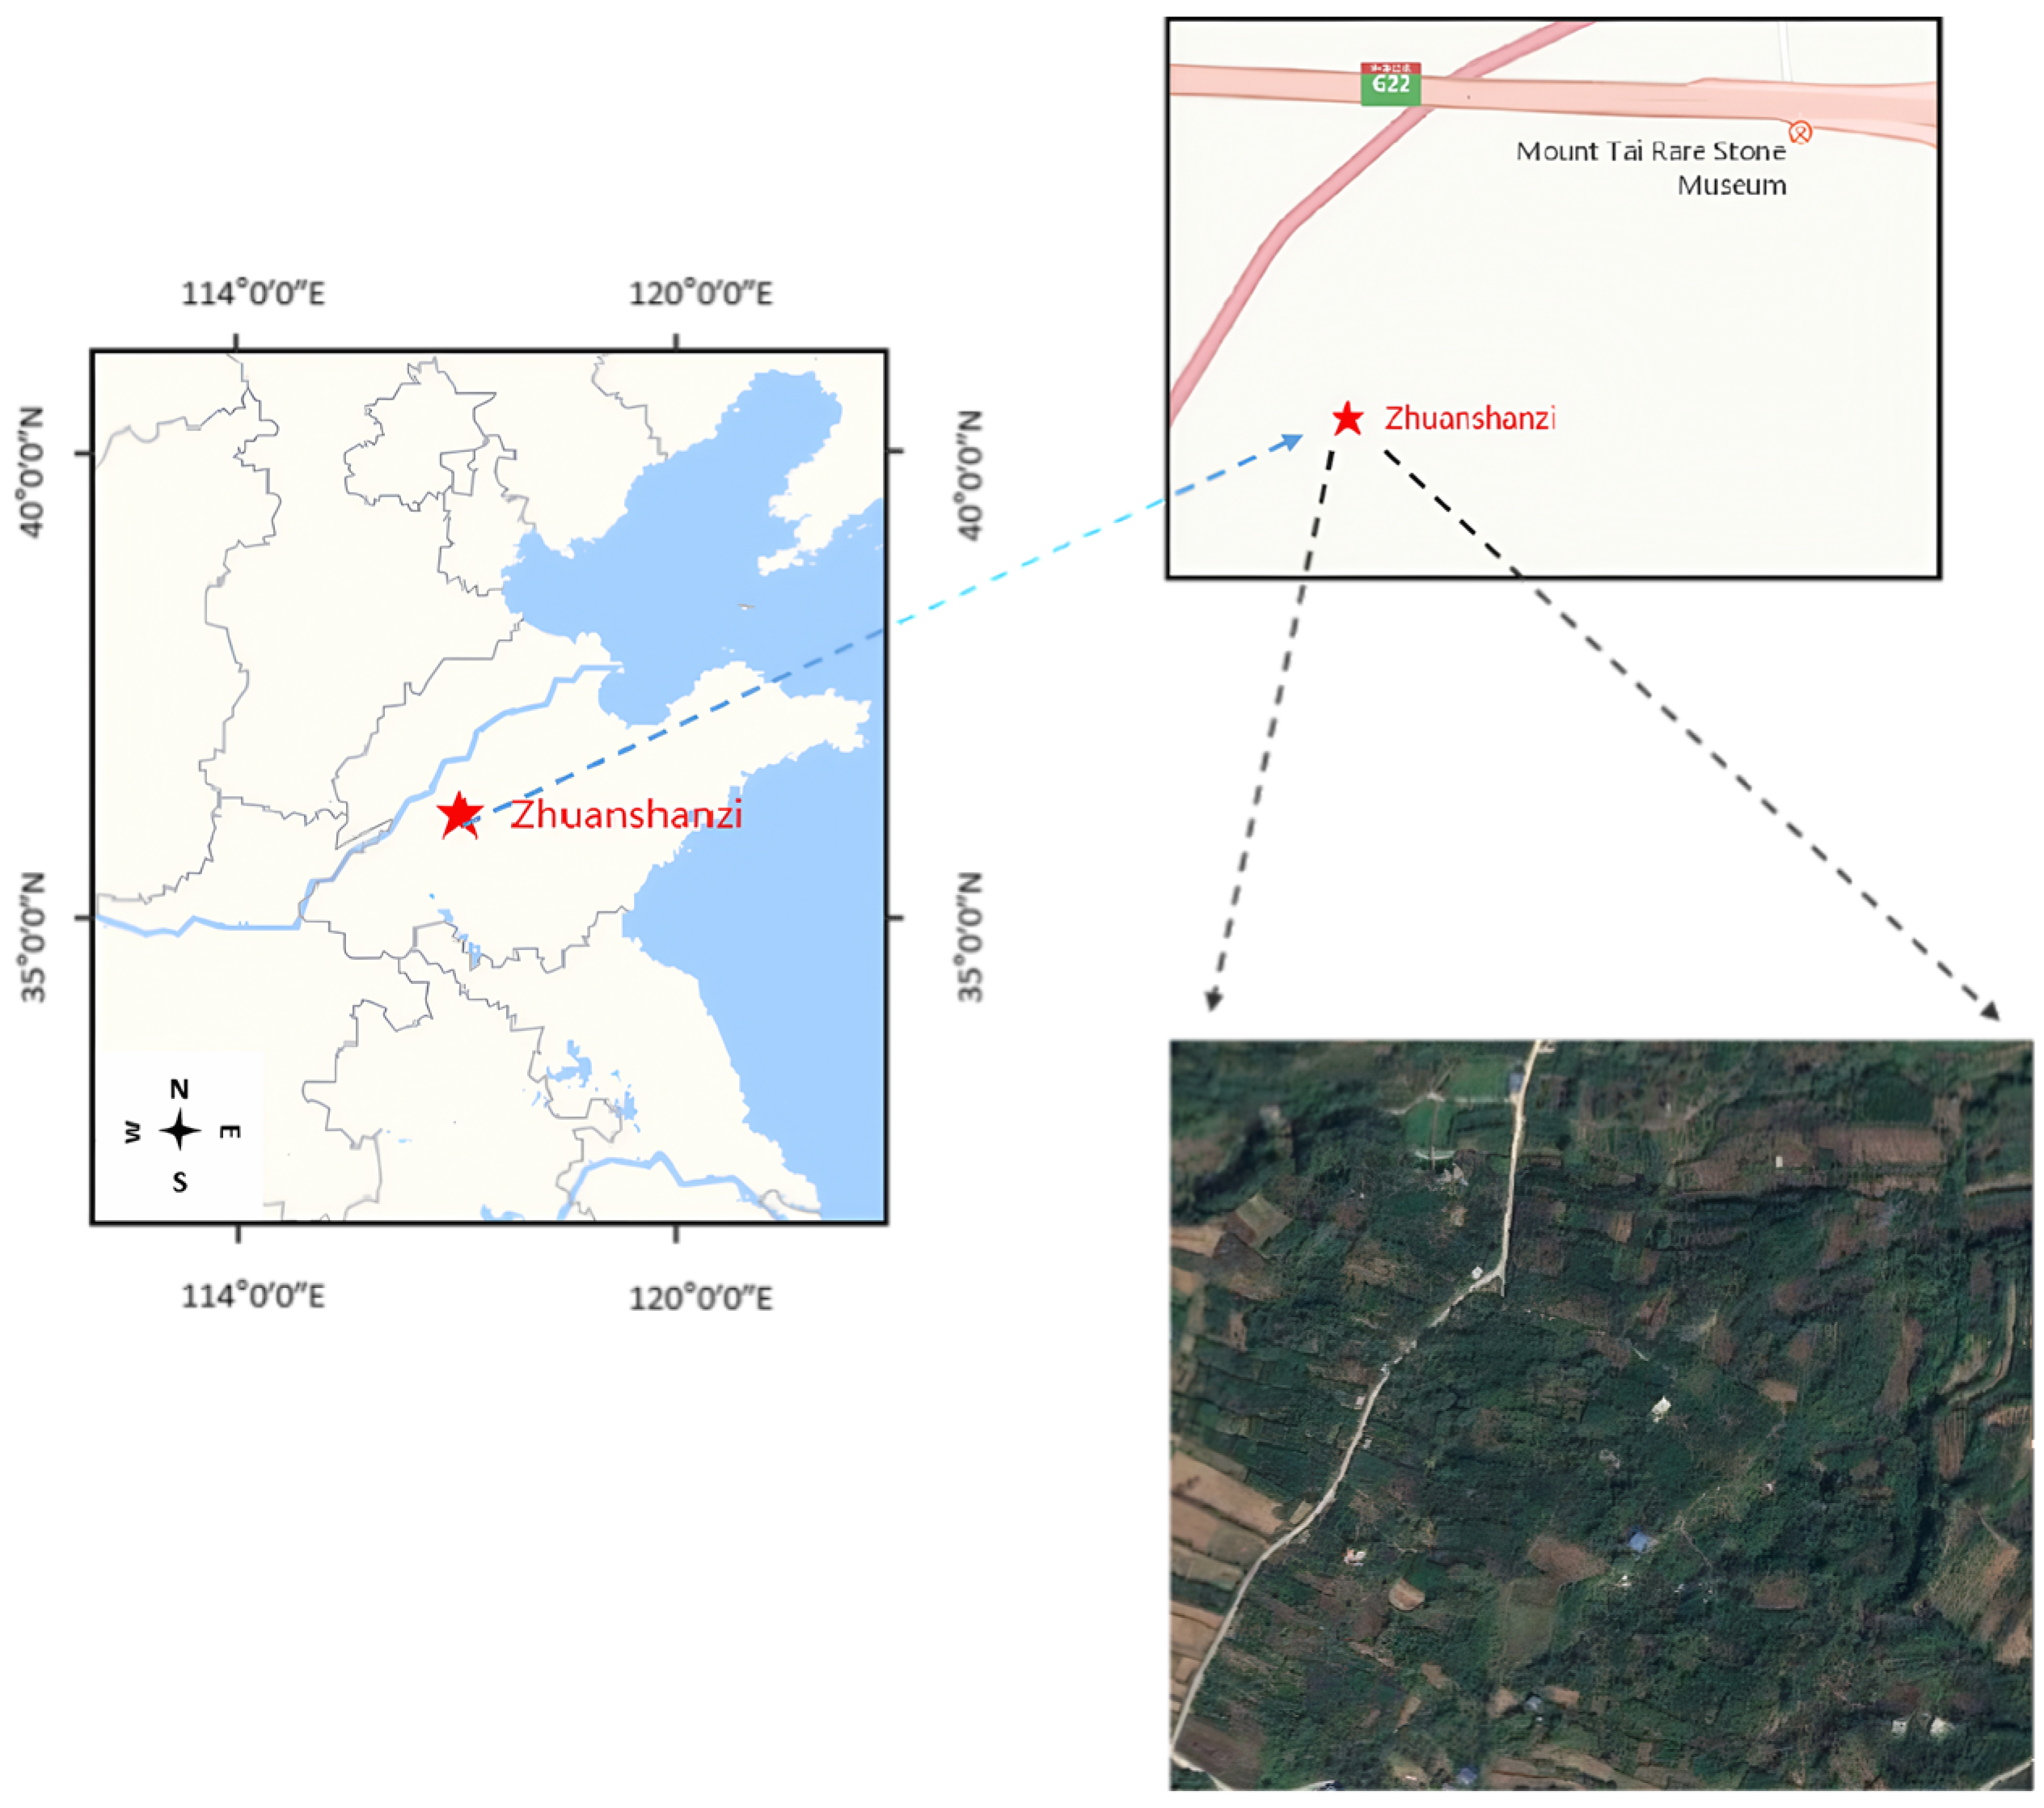
4.1. Research Area and Data Acquisition
The image data for this study were obtained from the forest field of Zhuanshanzi, Tai’an City, Shandong Province, China (latitude 31°14′ N, longitude 117°01′ E, altitude 40 m).
Figure 6 illustrates a schematic of the data acquisition site. In order to mitigate the effects of wind, shadows, strong light, weak light, and reflections on image quality, we selected the time frame from 2 PM to 5 PM on 3 May and 4 May 2022 for image data collection. This specific time period was chosen due to its favorable meteorological conditions.
We utilized a DJI Mavic Air 2 drone, which is outfitted with a 48-megapixel visible light camera, to capture the image data. The camera of this drone boasts a maximum flight time of 34 min, a maximum flight range of 18.5 km, and a maximum flight speed of 19 m per second. The resulting images were stored in JPEG format with a resolution of 6000 × 4000 pixels. Throughout the flights, the drone’s speed and direction were manually controlled, while the camera remained fixed perpendicular to the ground at a 90-degree angle. The drone was equipped with precise GPS and GLONASS positioning capabilities, enabling accurate recording of the location and altitude of each image. The flight altitude of the drone was maintained at approximately 300 m.
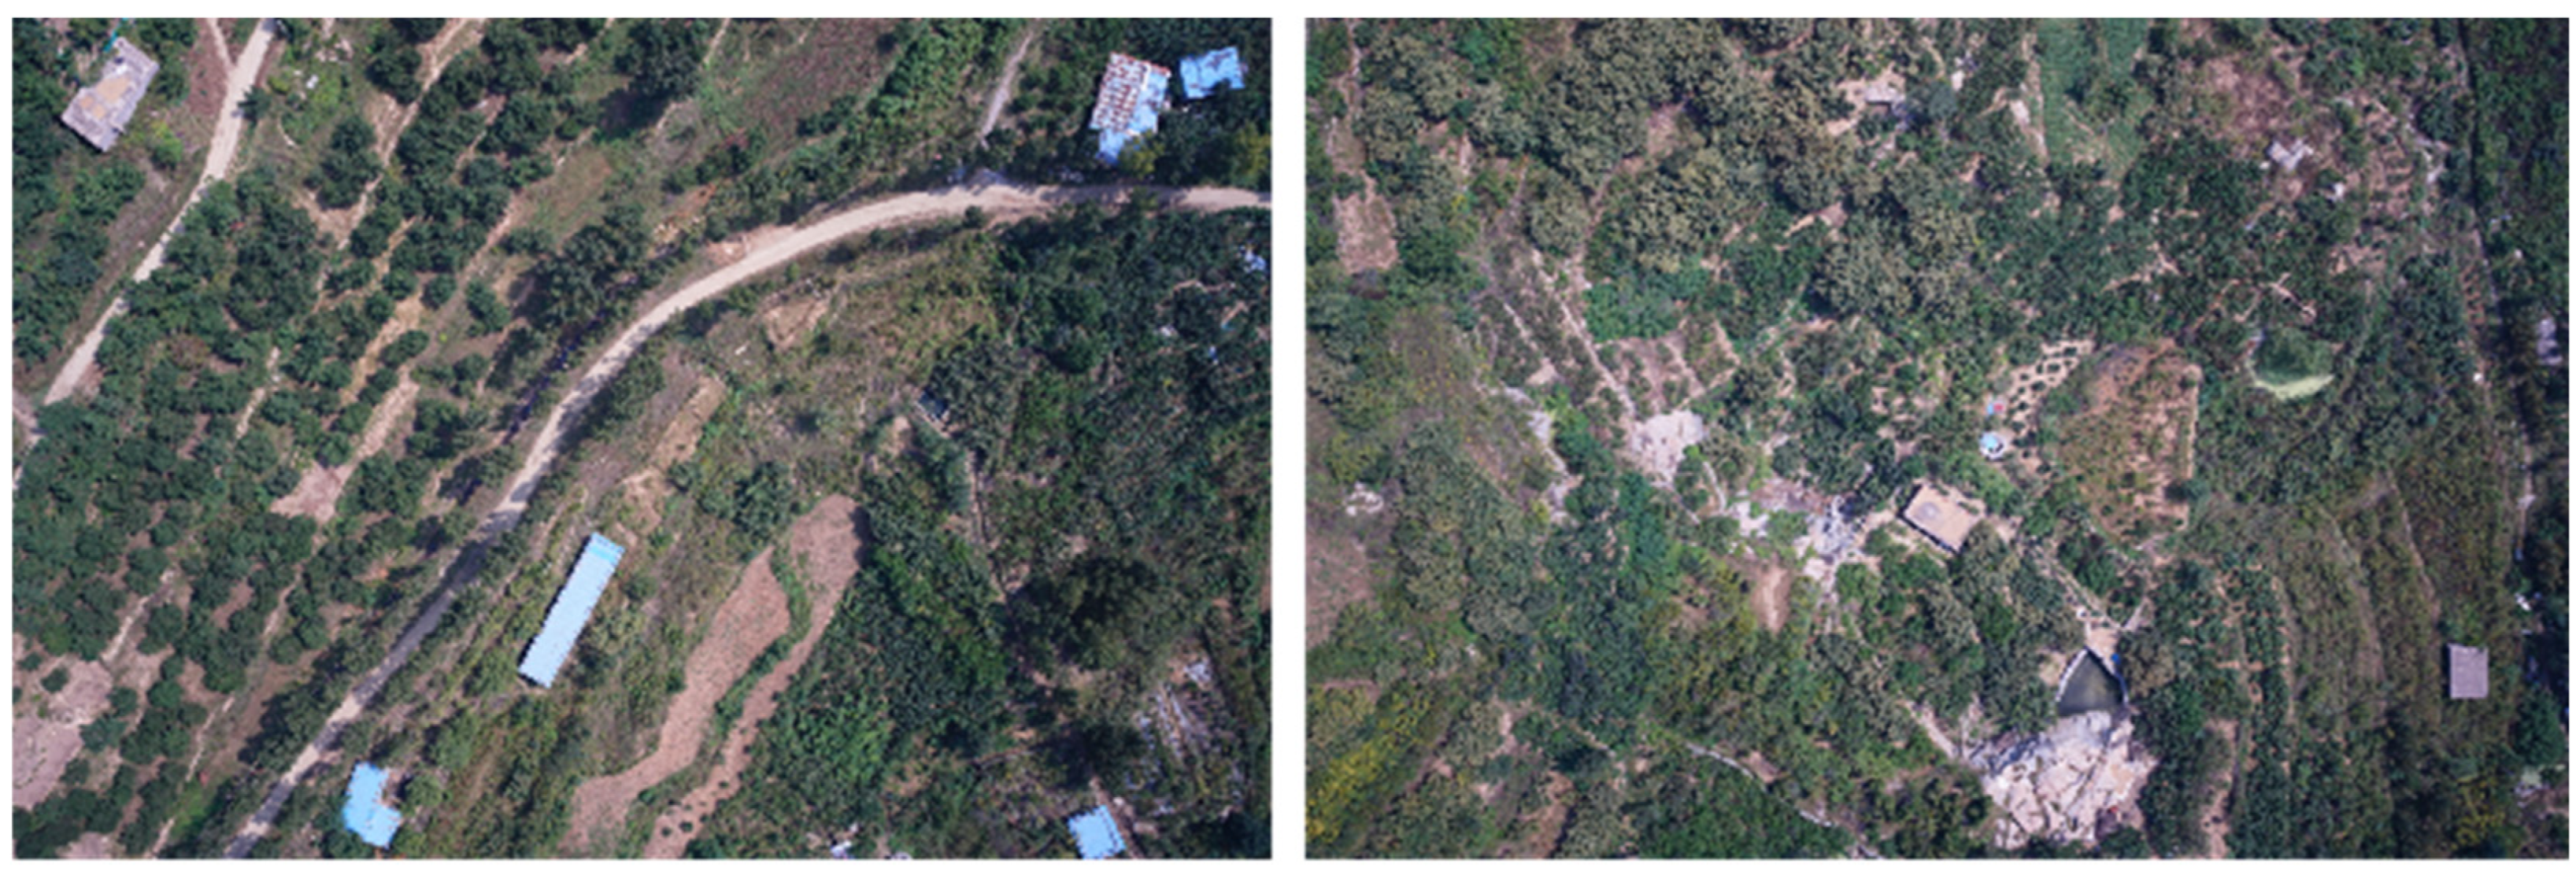
Figure 7 shows examples of forestry images captured by the drone, showcasing a resolution of 6000 × 4000 pixels.
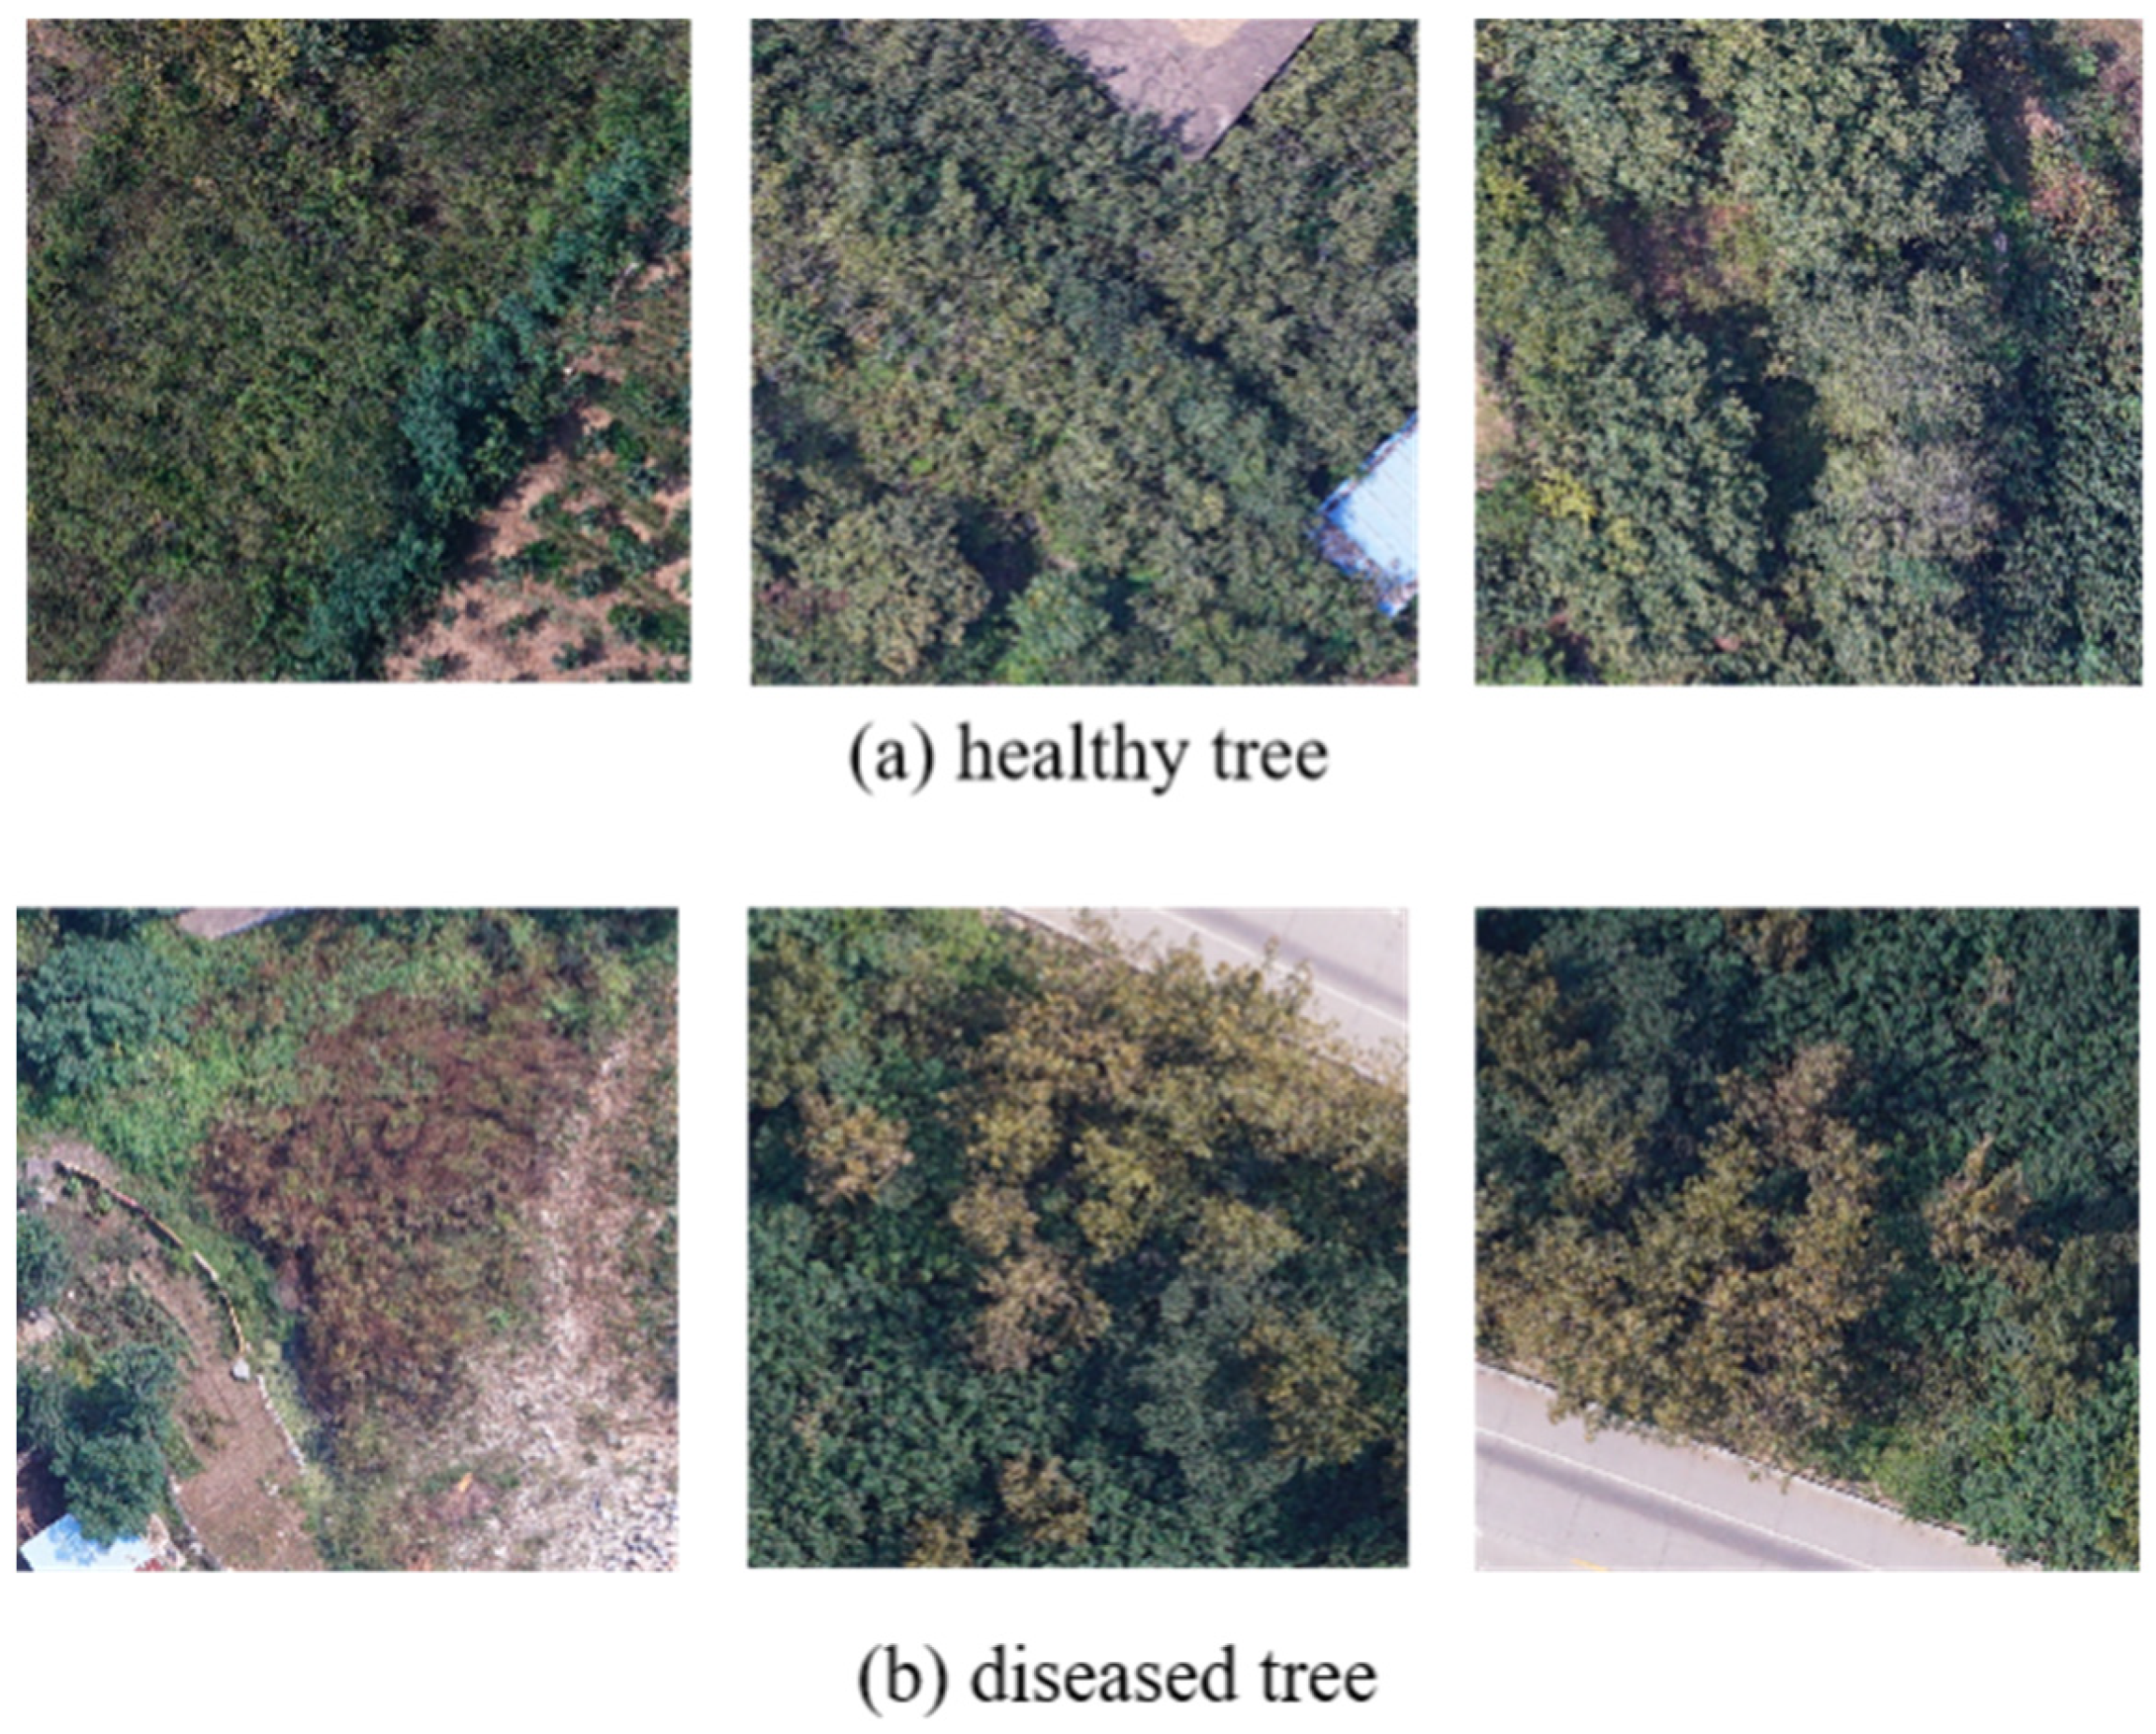
To enhance the usability of the collected drone images, we adhered to the steps outlined below. Firstly, due to the images’ high resolution and extensive spatial coverage, it would necessitate significant computational resources to directly use all images for training a network model, given the limited number of sample images. Consequently, we opted to extract image patches of 640 × 640 pixels from 300 drone forestry images gathered in the study area. Subsequently, 10,000 image patches were randomly selected for the training set, while 1200 image patches were utilized for the validation set. In order to perform image analysis and applications, we use the image annotation tool LabelImg and annotate the diseased trees in the images under the guidance of forestry experts. A segmented tree image is shown in
Figure 8.
4.2. Experimental Configuration
We implemented and trained the neural network model using the PyTorch deep learning framework on the Linux operating system.
Table 2 presents the exhaustive hardware and software environment arrangement for the experiments.
4.3. Experimental Indicators
To ensure a precise assessment of the new model’s performance, we utilized several performance evaluation metrics: Average Precision (AP), recall, model parameters, Giga Floating-point Operations Per second (GFLOPs), and Frames Per Second (FPS).
AP represents the average precision of a single target class, providing an overall measure of the model’s detection performance. The AP is calculated using the following formula:
Here, Precision denotes the proportion of correctly predicted boxes to the total predicted boxes, while Recall represents the proportion of predicted boxes to all actual boxes. To further assess the accuracy of the detector, we employed two metrics: Average Precision at an IOU threshold of 0.5 (AP@0.5) and Average Precision with IOU thresholds ranging from 0.5 to 0.95 (AP@0.5:0.95).
We use the model parameters and GFLOPs to measure the model complexity and size, while FPS is used to measure the running speed of algorithms, representing the number of images that can be processed per second. The smaller the number of model parameters and GFLOPs, the lower the model complexity and size. The larger the FPS, the faster the algorithm processing speed, which is more conducive to the deployment of the model on edge devices.
Assuming a convolutional layer with a size of
(
is the number of input channels,
is the number of output channels) and an output feature map size of
, the formula for calculating the parameters of the convolutional layer is as follows:
The formula for calculating the FLOPs of the convolutional layer is as follows:
While GFLOPs = FLOPs × 10
9.
4.4. Performance Comparison of Different Methods
4.4.1. Performance Comparison of Different Methods
In order to evaluate the effectiveness of our proposed model, this paper lists several representative methods and compares them with the algorithm proposed in this paper in terms of model detection performance and model complexity. The specific results can be seen in
Table 3 and
Table 4.
Table 3 and
Table 4 show the comparison results with YOLOv5 [
9], Faster R-CNN [
24], RetinaNet [
25], YOLOv5, YOLOv6 [
26], YOLOv7 [
27], and YOLOx [
28] on the test set in terms of recall, mAP, Parameter, GFLOPs, and FPS.
From
Table 3, it can be seen that the proposed algorithm exhibits a significant improvement in mAP@0.5:0.95 compared to other algorithms, with slightly lower recall rates than RetinaNET, YOLOv6, YOLOX, and only slightly lower mAP@0.5 compared to YOLOv5. In the task of pine wilt disease (PWD) detection, accurate detection of diseased areas is a prerequisite for subsequent disease control, and a higher mAP@0.5:0.95 demonstrates that the proposed algorithm achieves good detection results in the PWD task.
From
Table 4, it is evident that the proposed algorithm significantly reduces parameter number and computational complexity compared to other algorithms. The YOLOv7 and YOLOX, which are the most lightweight, have reduced by more than 40%. At the same time, the algorithm’s inference speed is superior to all other models except YOLOv5, meeting the real-time requirements of drone scenarios.
Based on
Table 3 and
Table 4, compared with other algorithms, Light-ViTeYOLO proposed in this paper achieves the minimum number of parameters and computational complexity, with suboptimal inference speed. While achieving a lightweight model, mAP@0.5 0.95 (%) reaches its maximum, mAP@0.5 (%) reached the second highest. Although the recall and mAP@0.5 (%) of Light-ViTeYOLO did not reach the optimal level, it is only slightly lower than the optimal algorithm. Light-ViTeYOLO has obvious advantages in lightweight level. The FPS of Light-ViTeYOLO is lower than that of YOLOv5. However, the number of parameters and computation is nearly 50% less than that of YOLOv5, and mAP@0.5:0.95(%) is almost 4% higher than that of YOLOv5.
The impact of lightweight networks on the detection performance of powdery mildew was also compared. The experimental results are shown in
Section 4.4.3.
Based on the above analysis, the proposed algorithm ensures detection accuracy, has high detection precision, and simultaneously significantly reduces model complexity and inference speed. Light-ViTeYOLO is more suitable for PWD detection tasks than other algorithms.
4.4.2. Ablation Experiment
Light-ViTeYOLO proposed in this paper redesigned the feature extraction network of YOLOv5, proposed a neck network, and optimized the loss function. In order to evaluate the effectiveness of each module of our method, comparative experiments were conducted on the PWD dataset, and the improvement scheme was incrementally added. The specific experimental results are shown in
Table 5.
From
Table 5, it can be observed that after using EfficientViT for global feature extraction, the parameter count and GFLOPs were effectively reduced. While mAP@0.5 showed a slight decrease, there was a significant improvement in mAP@0.5:0.95, indicating that EfficientViT significantly improved efficiency in feature extraction without sacrificing performance. After optimizing the neck network and loss function, there was no change in the parameter count and GFLOPs, while mAP@0.5 and mAP@0.5:0.95 were further improved. This indicates that the new neck network and optimization of the loss function have improved the performance of object detection without increasing the number of parameters and calculations, and does not affect the operational efficiency of the model. Compared to the original YOLOv5 model, mAP@0.5:0.95 of proposed Light-ViTeYOLO increased by more than 3 percentage points, while the model’s parameter count reduced by 44.6%, and computational complexity reduced by 53.2%.
4.4.3. Feature Extraction Performance Analysis of EfficientViT
We integrate multiple typical visual Transformer models and lightweight networks on the core architecture of the YOLOv5 network for experimental comparison in order to analyze object detection performance and model complexity of the EfficientViT in pine wilt disease detection. As shown in
Table 6, ViT [
12], BoTNet [
29], and CoNet [
30] are typical ViT models, while Shufflenetv2 [
31], Mobilenetv3 [
32], RepVGG [
33], and GhostNet [
34] are classic lightweight feature extraction networks. It can be seen from the experimental results that the AP@0.5 0.95(%) of three ViT models is about 7.5 percent higher than the four classic lightweight networks, but the ViT parameter count and computational complexity are significantly higher than those of lightweight networks. After integrating EfficientViT, the model has almost the same number of parameters and computational complexity as the lightweight network, which is about 50% lower than the ViT model. However, its detection performance is improved by nearly 6 percentage points compared to the lightweight network, slightly lower than ViT. Overall, the improved EfficientViT method, combined with the optimization of the neck network and loss function, achieves the best performance in terms of model accuracy and complexity.
4.4.4. Performance Analysis of the Training Process
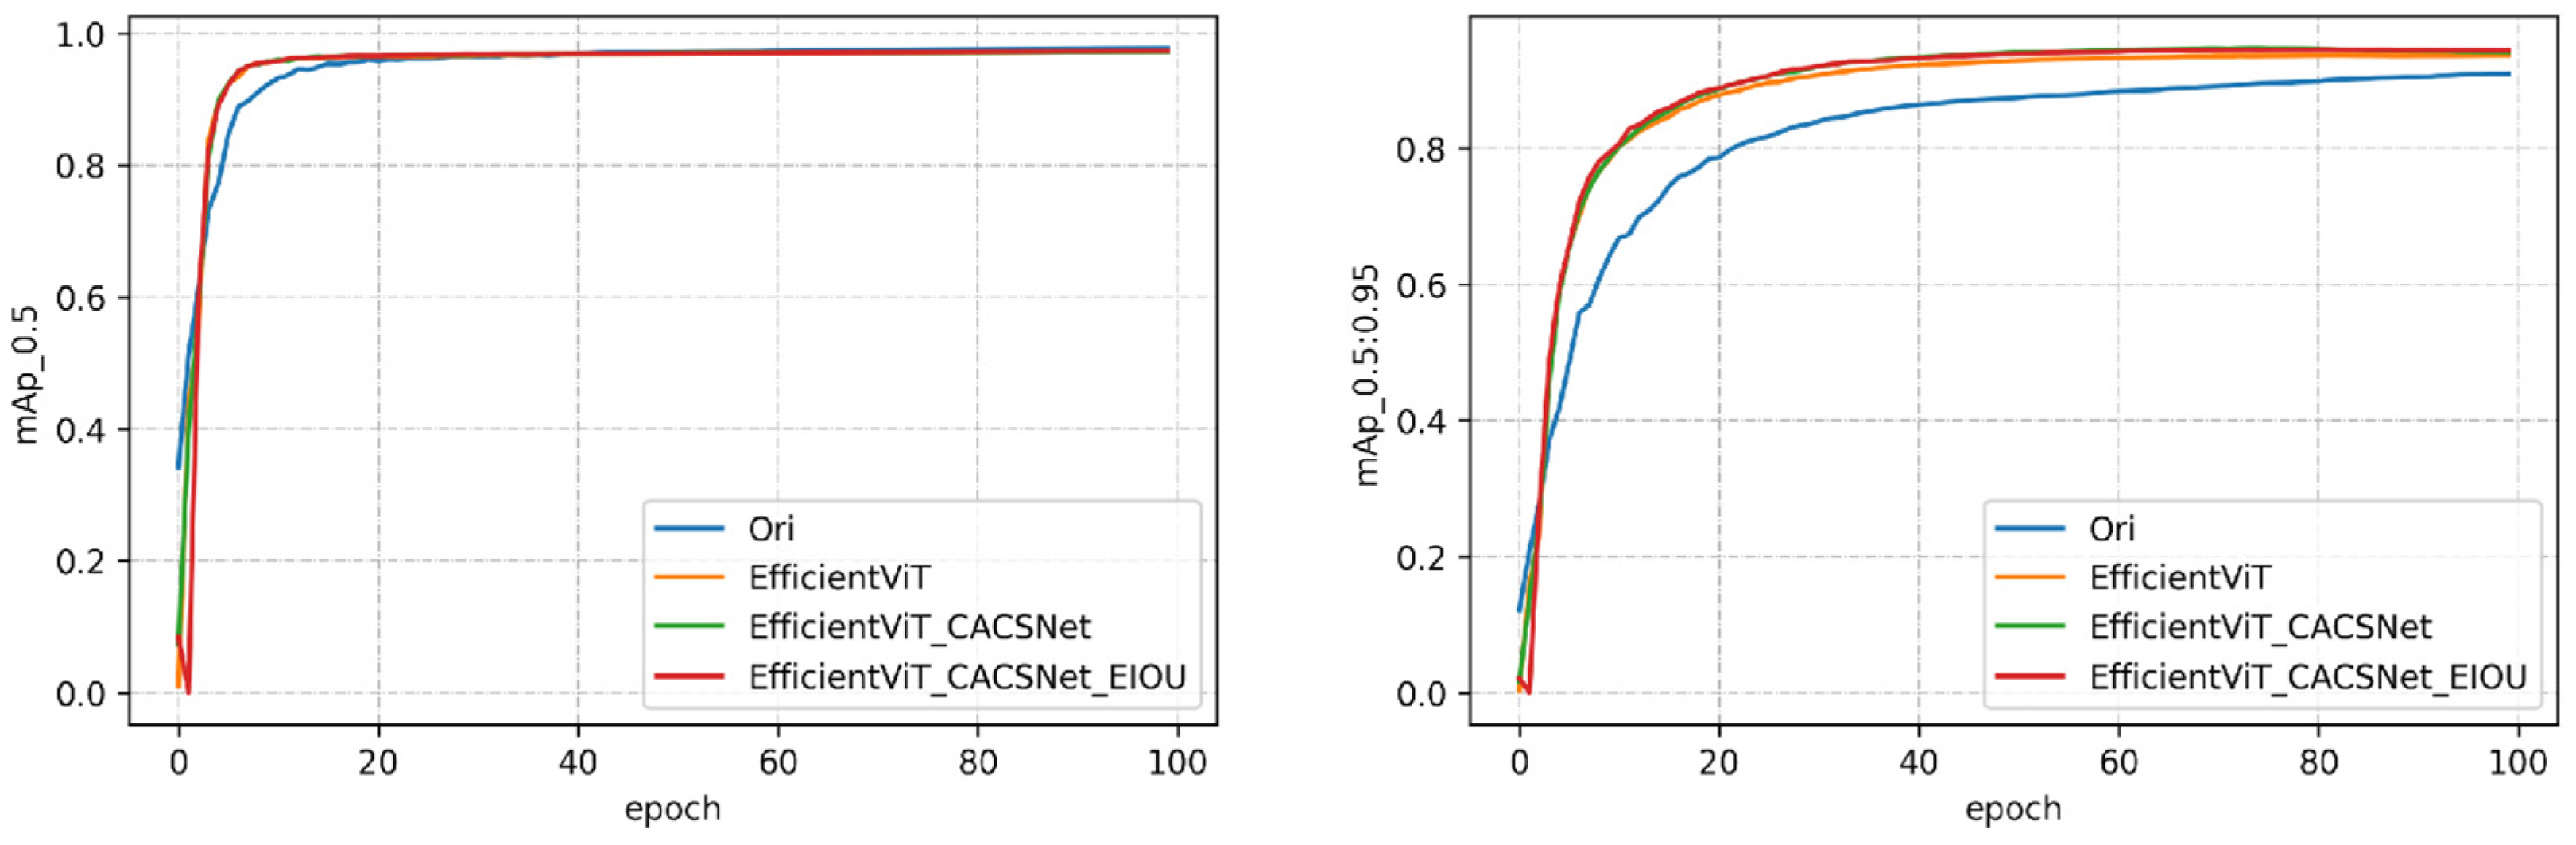
We compared the changes in mAP@0.5 and mAP@0.5:0.95 during the training process of the original YOLOv5 model and its iterations with the inclusion of EfficientViT, optimization of the CACSNET neck network, and EIOU loss function, as shown in
Figure 9; the left graph reflects that the mAP@0.5 of the four models sharply increases at the beginning of training, then tends to plateau around 10 iterations. The mAP@0.5 of the improved models remains similar to that of the original model in the final iterations, indicating that the improved models start to change faster than the original model.
In the right graph, the mAP@0.5:0.95 of the improved models quickly surpasses the original model, after which the values of all four models gradually increase and plateau around 60 iterations. Ultimately, the mAP@0.5:0.95 of the improved models is significantly better than that of the original model, with the proposed model achieving the highest mAP@0.5:0.95. From the above analysis, it is evident that the models exhibit faster training accuracy after the improvements compared to the original model. This demonstrates that the various optimizations proposed in this article have a promoting effect on the model’s performance, and the reduction in model parameters and computational complexity has not had a major impact on the model’s performance. This highlights the strong generalization ability of the lightweight model.
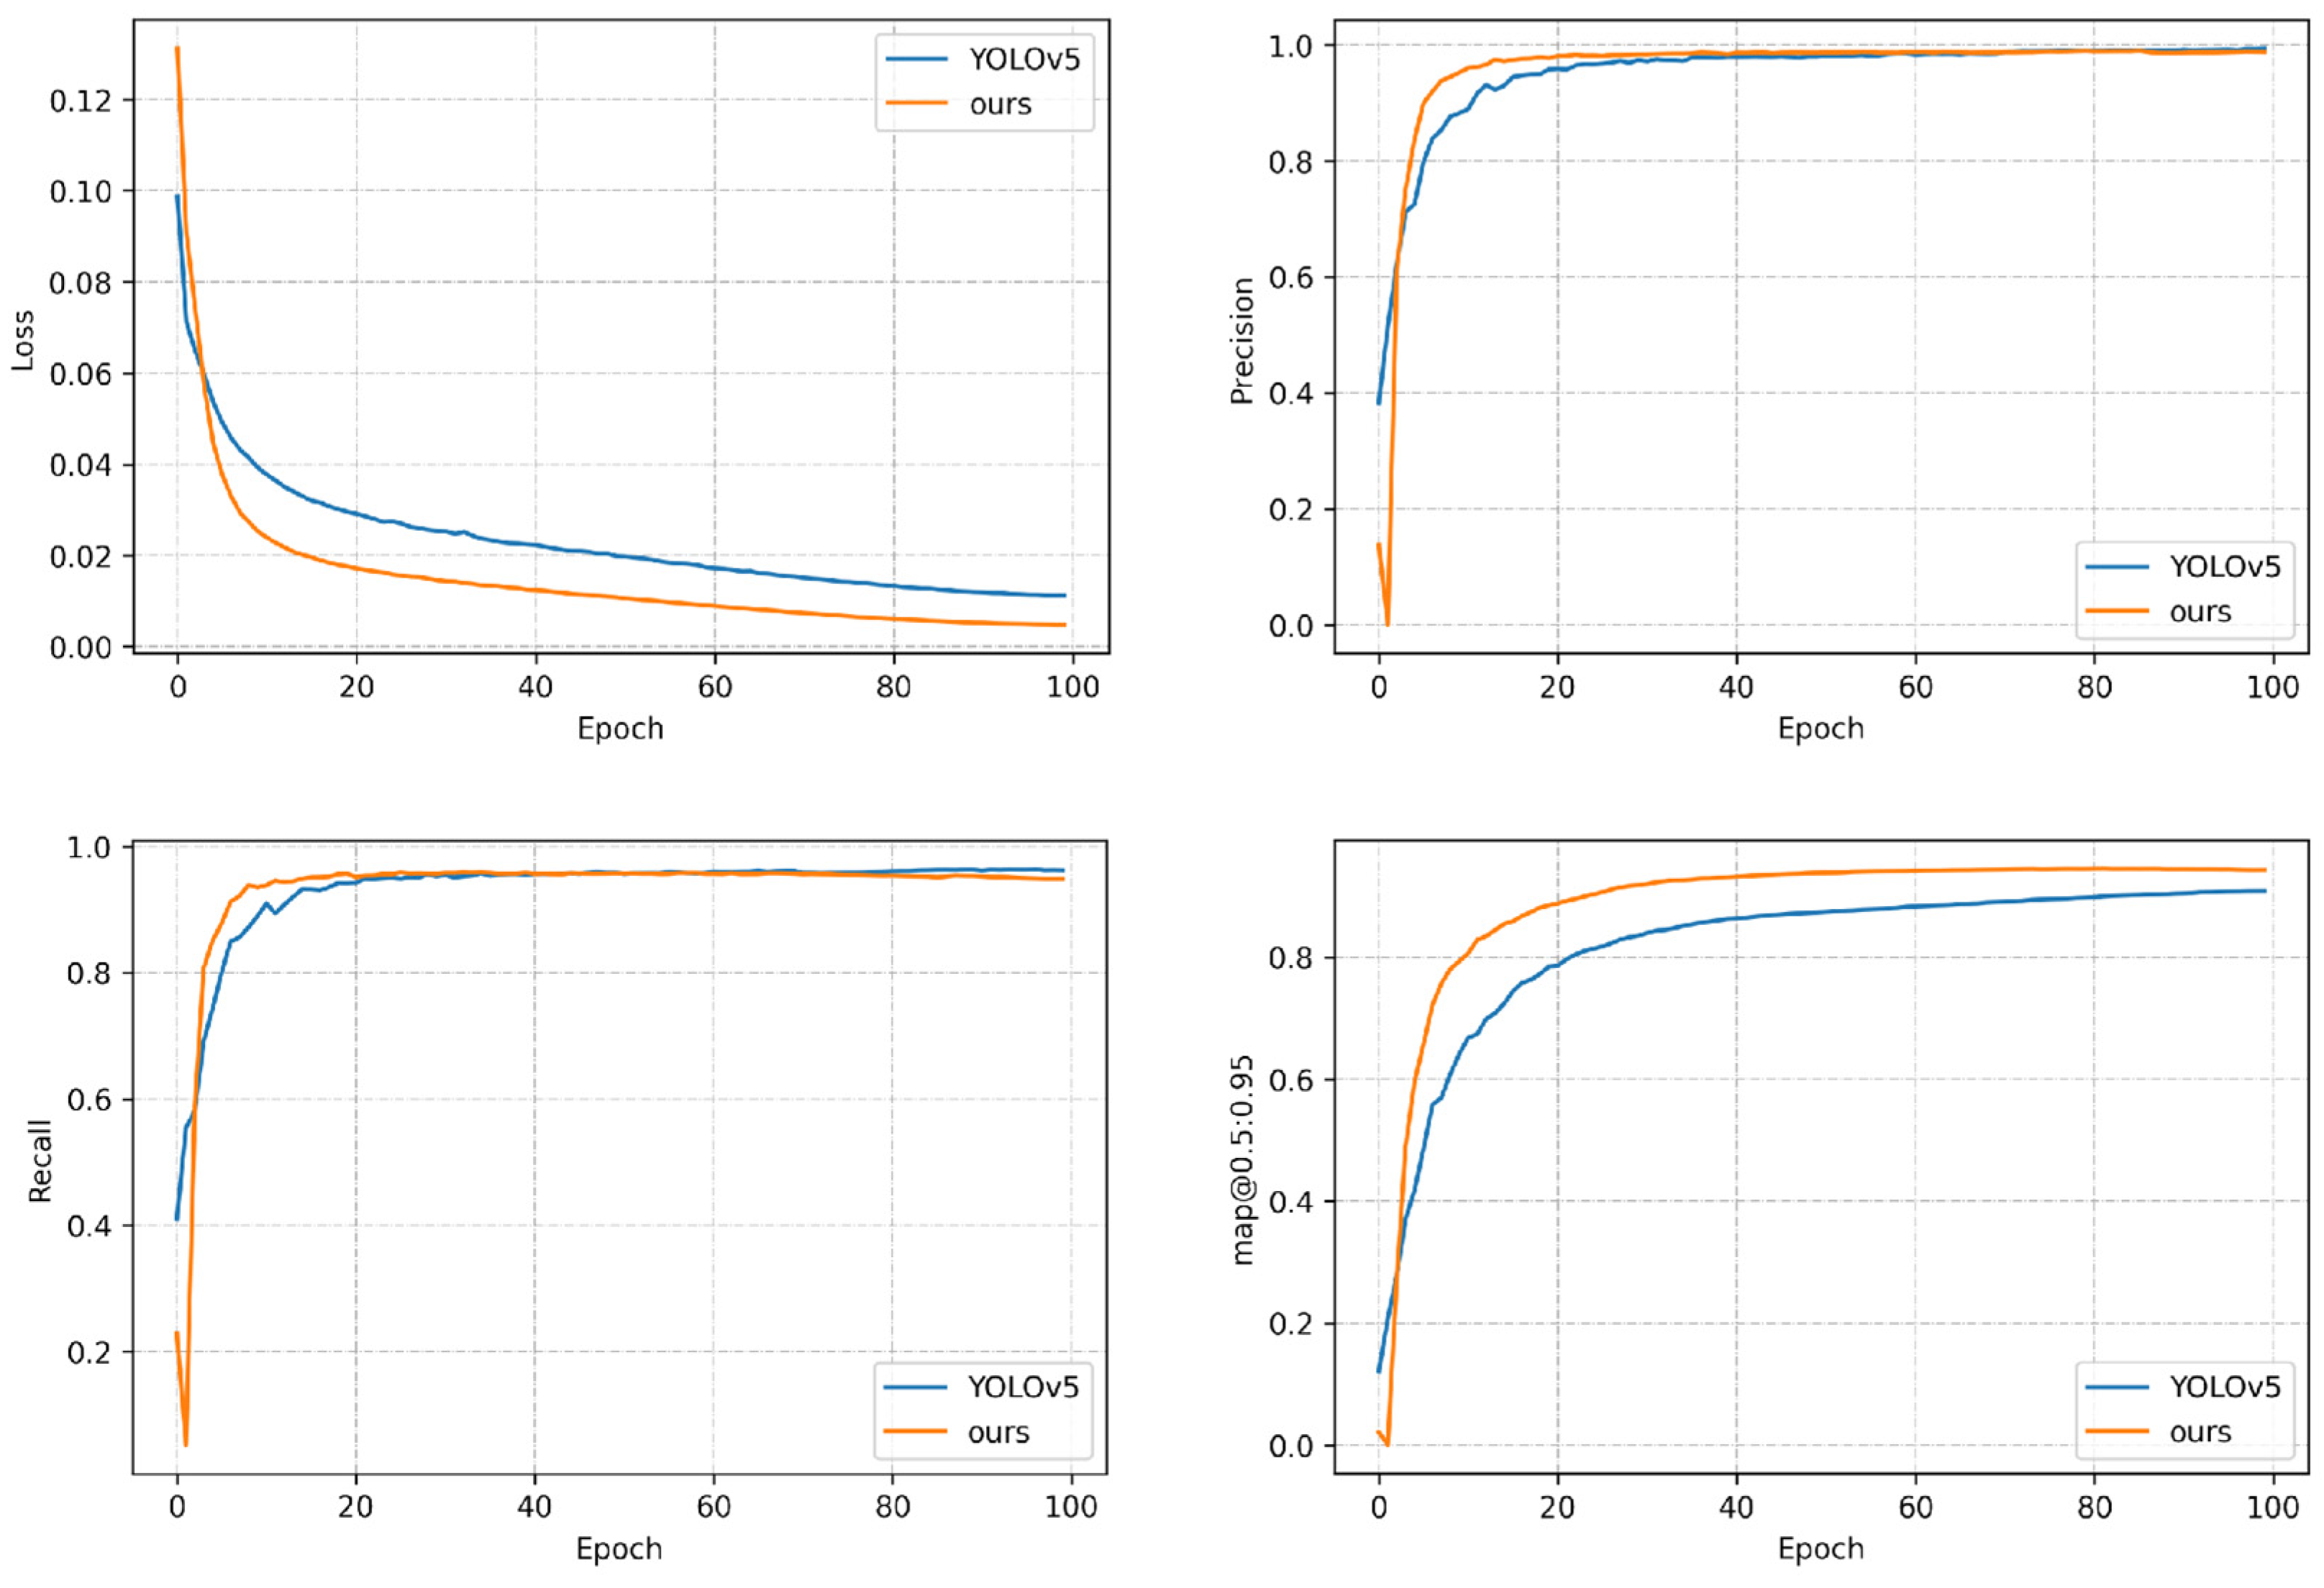
We compared the loss values, precision, recall, and AP@0.5:0.95 of the proposed model with YOLOv5 by plotting curves during the training process. As depicted in
Figure 10, it is observed that during the initial training phase, the values of each model metric undergo rapid changes, and after approximately 100 iterations, the loss function values exhibit less fluctuation, signifying a relatively stable state. Concurrently, the model’s precision and recall also reach a relatively balanced state. Although the mAP continues to increase gradually, the rate of change is minimal, suggesting that the model has essentially converged at this juncture. The trends of the various metrics in the graph reveal that the proposed model matches or surpasses YOLOv5 in all metrics, underscoring the robustness of the proposed model’s object representation.
5. Conclusions
In current methods for pine wilt disease detection, convolutional neural networks (CNNs) are commonly utilized for network architecture, leveraging their strong performance in feature extraction. However, the sensory field of CNNs is constrained by kernel size and network depth, limiting their capacity to effectively model long-term dependencies. On the other hand, Transformers are adept at capturing global and rich contextual information, but their high computational demands hinder their practicality for real-time monitoring scenarios, such as UAV-based applications. To address these challenges, this paper introduces Light-ViTeYOLO, a lightweight PWD detection method based on Vision Transformer-enhanced YOLOv5. By incorporating a lightweight Multi-Scale Attention (MSA) to redesign the backbone network process and enhancing the neck and head, the proposed method achieves impressive performance in terms of detection accuracy, model complexity, and inference speed. Notably, this approach manages to exceed the detection accuracy of many target detectors even with significantly reduced parameters. This achievement marks a successful balance between model accuracy and efficiency, underscoring its strong robustness. The use of drones carrying our detection method for real-time detection of pine wilt disease-discolored wood may lead to higher economic results, including benefits in terms of improved detection efficiency, reduced costs, reduced risk of disease transmission, and optimized decision support. However, the specific economic effects still need to be professionally assessed based on actual applications and relevant cost data. Therefore, we have the following outlook for future work:
The method proposed in this paper has been experimentally verified on a standard platform. The next step is to deploy the application on a drone hardware platform through algorithms to further verify its feasibility and potential economic benefits;
Combining the method proposed in this paper with satellite-based forest monitoring to further strengthen the monitoring of pine tree discoloration caused by pine wilt disease. Integrating drone images with satellite images for multi-scale analysis from both macroscopic and local perspectives, comprehensively monitoring diseases through data fusion and analysis;
Applying the method proposed in this paper to the detection of other forest diseases, such as bark beetle damage.


 ,
, 


