

Enhancing Tree Species Identification in Forestry and Urban Forests through Light Detection and Ranging Point Cloud Structural Features and Machine Learning


Abstract
1. Introduction
2. Materials and Methods
2.1. Trees and Scanning
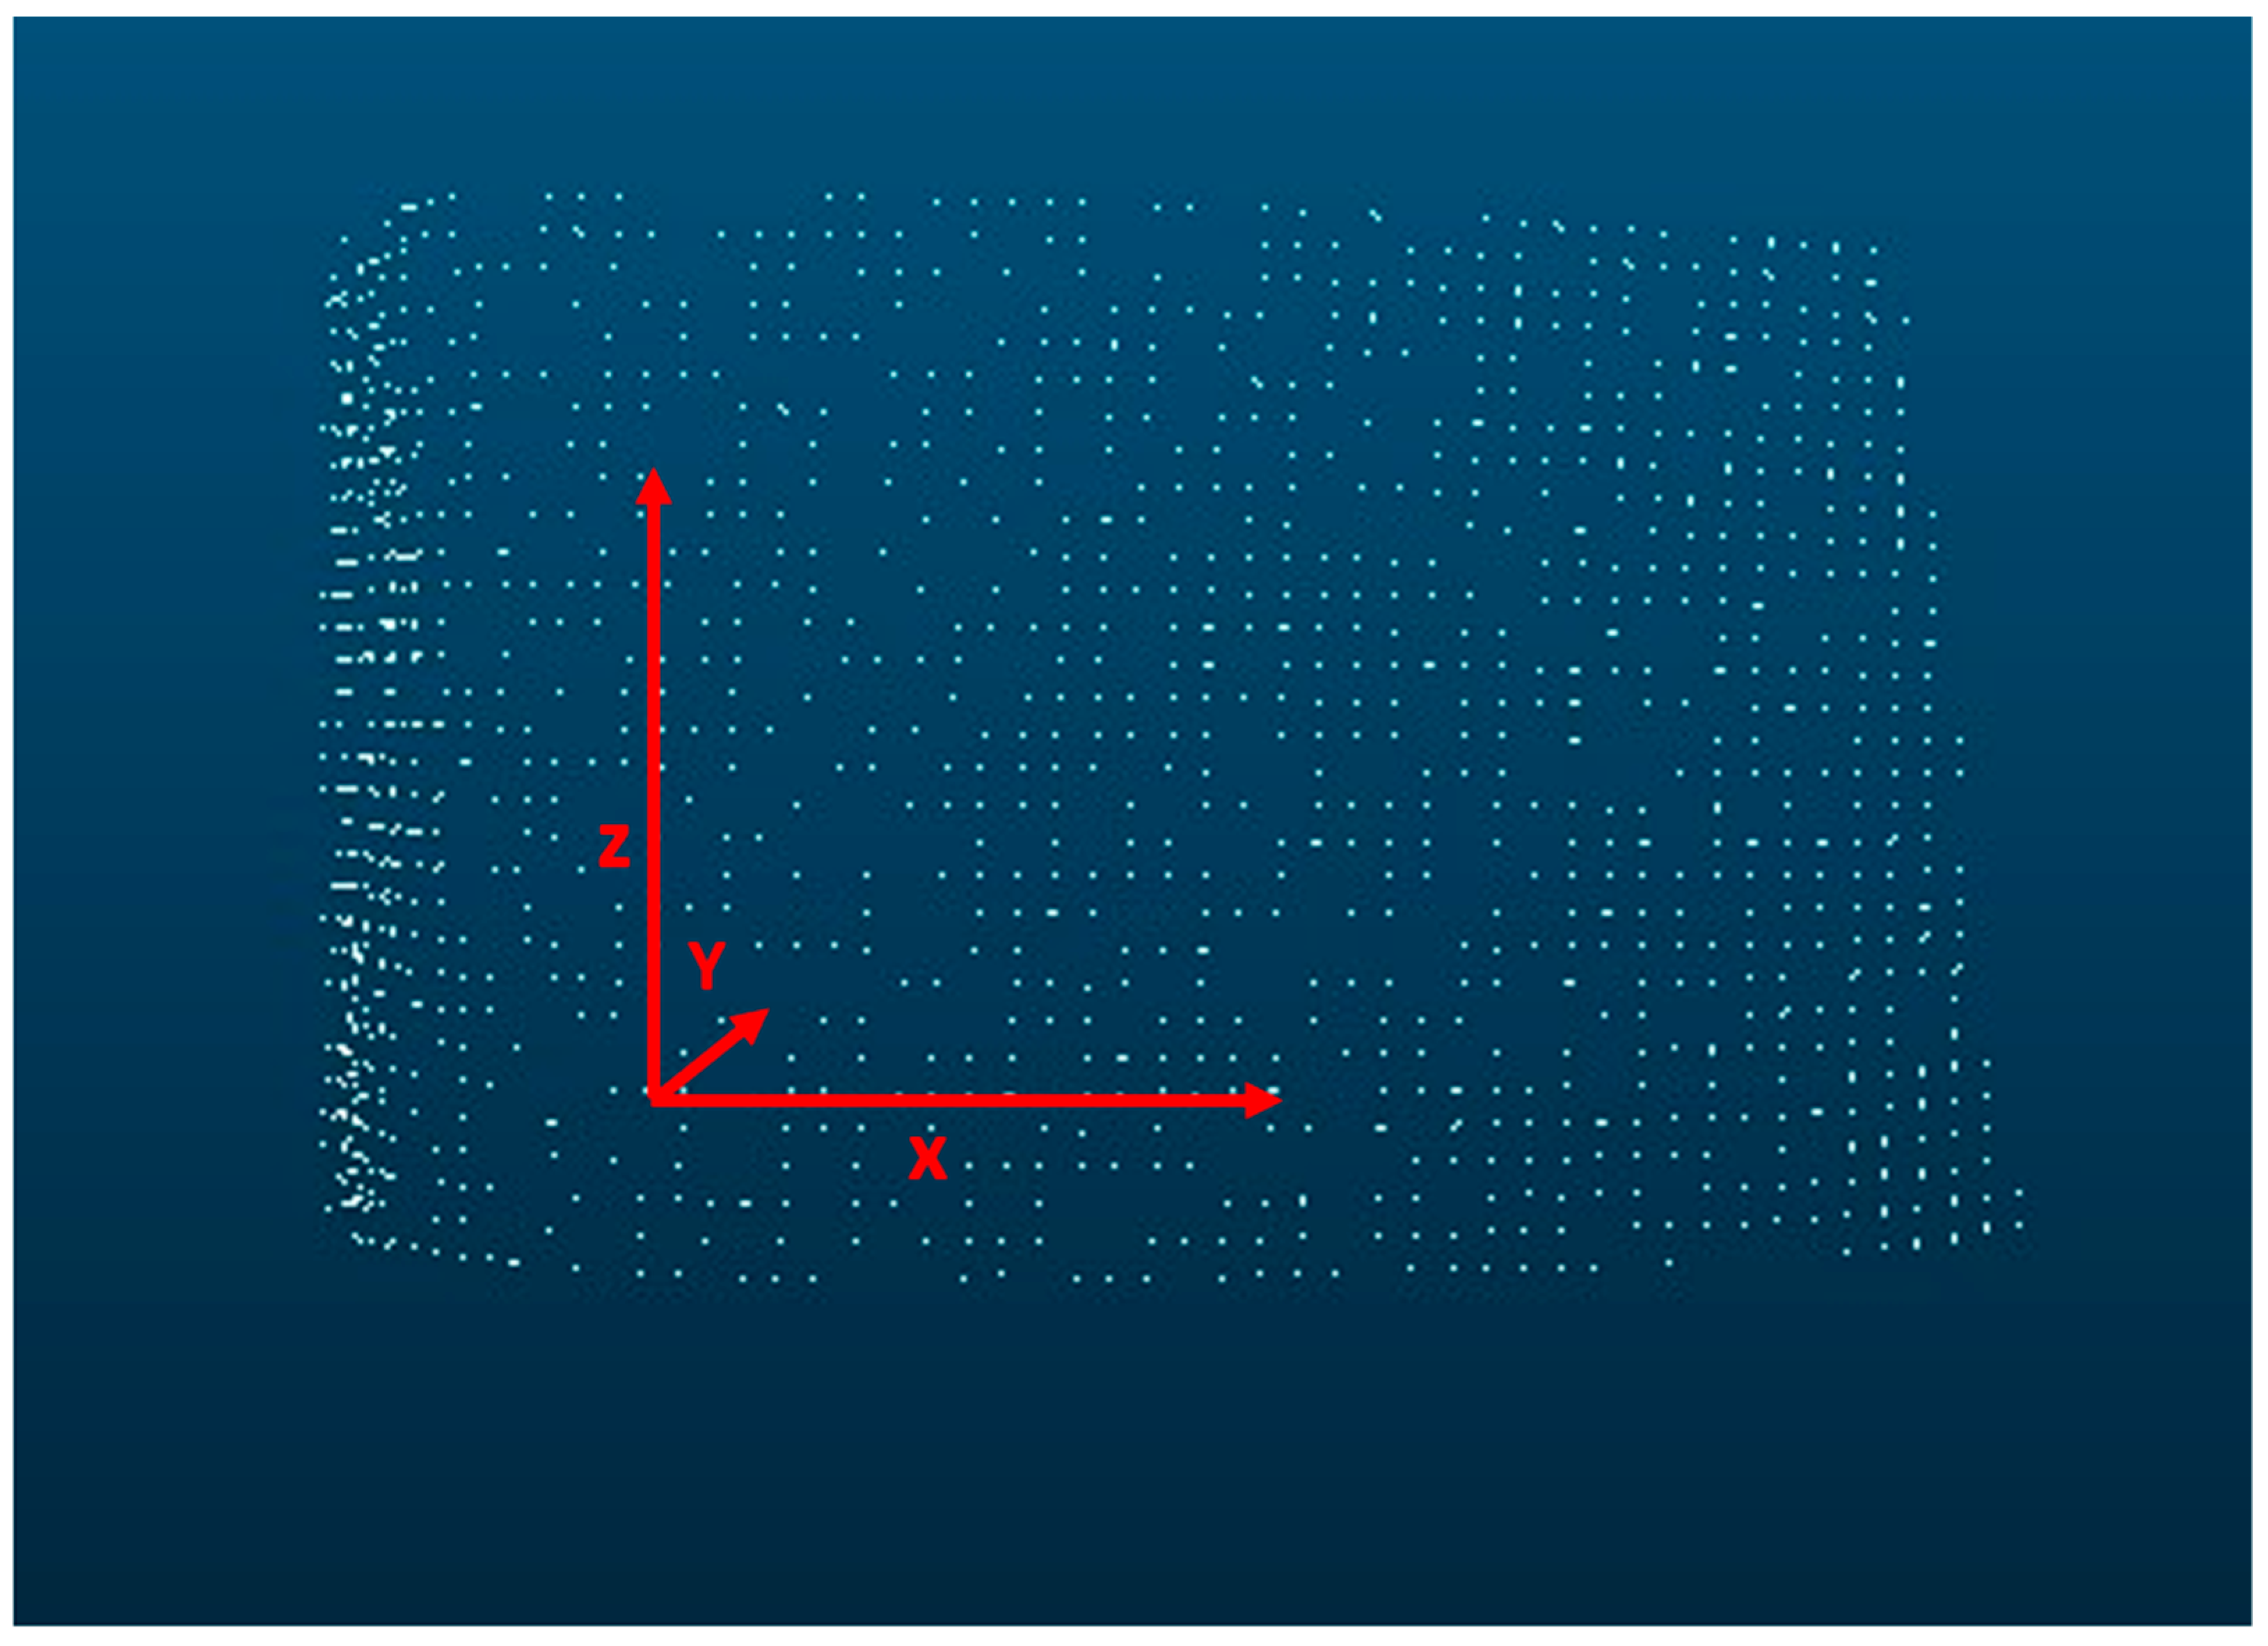
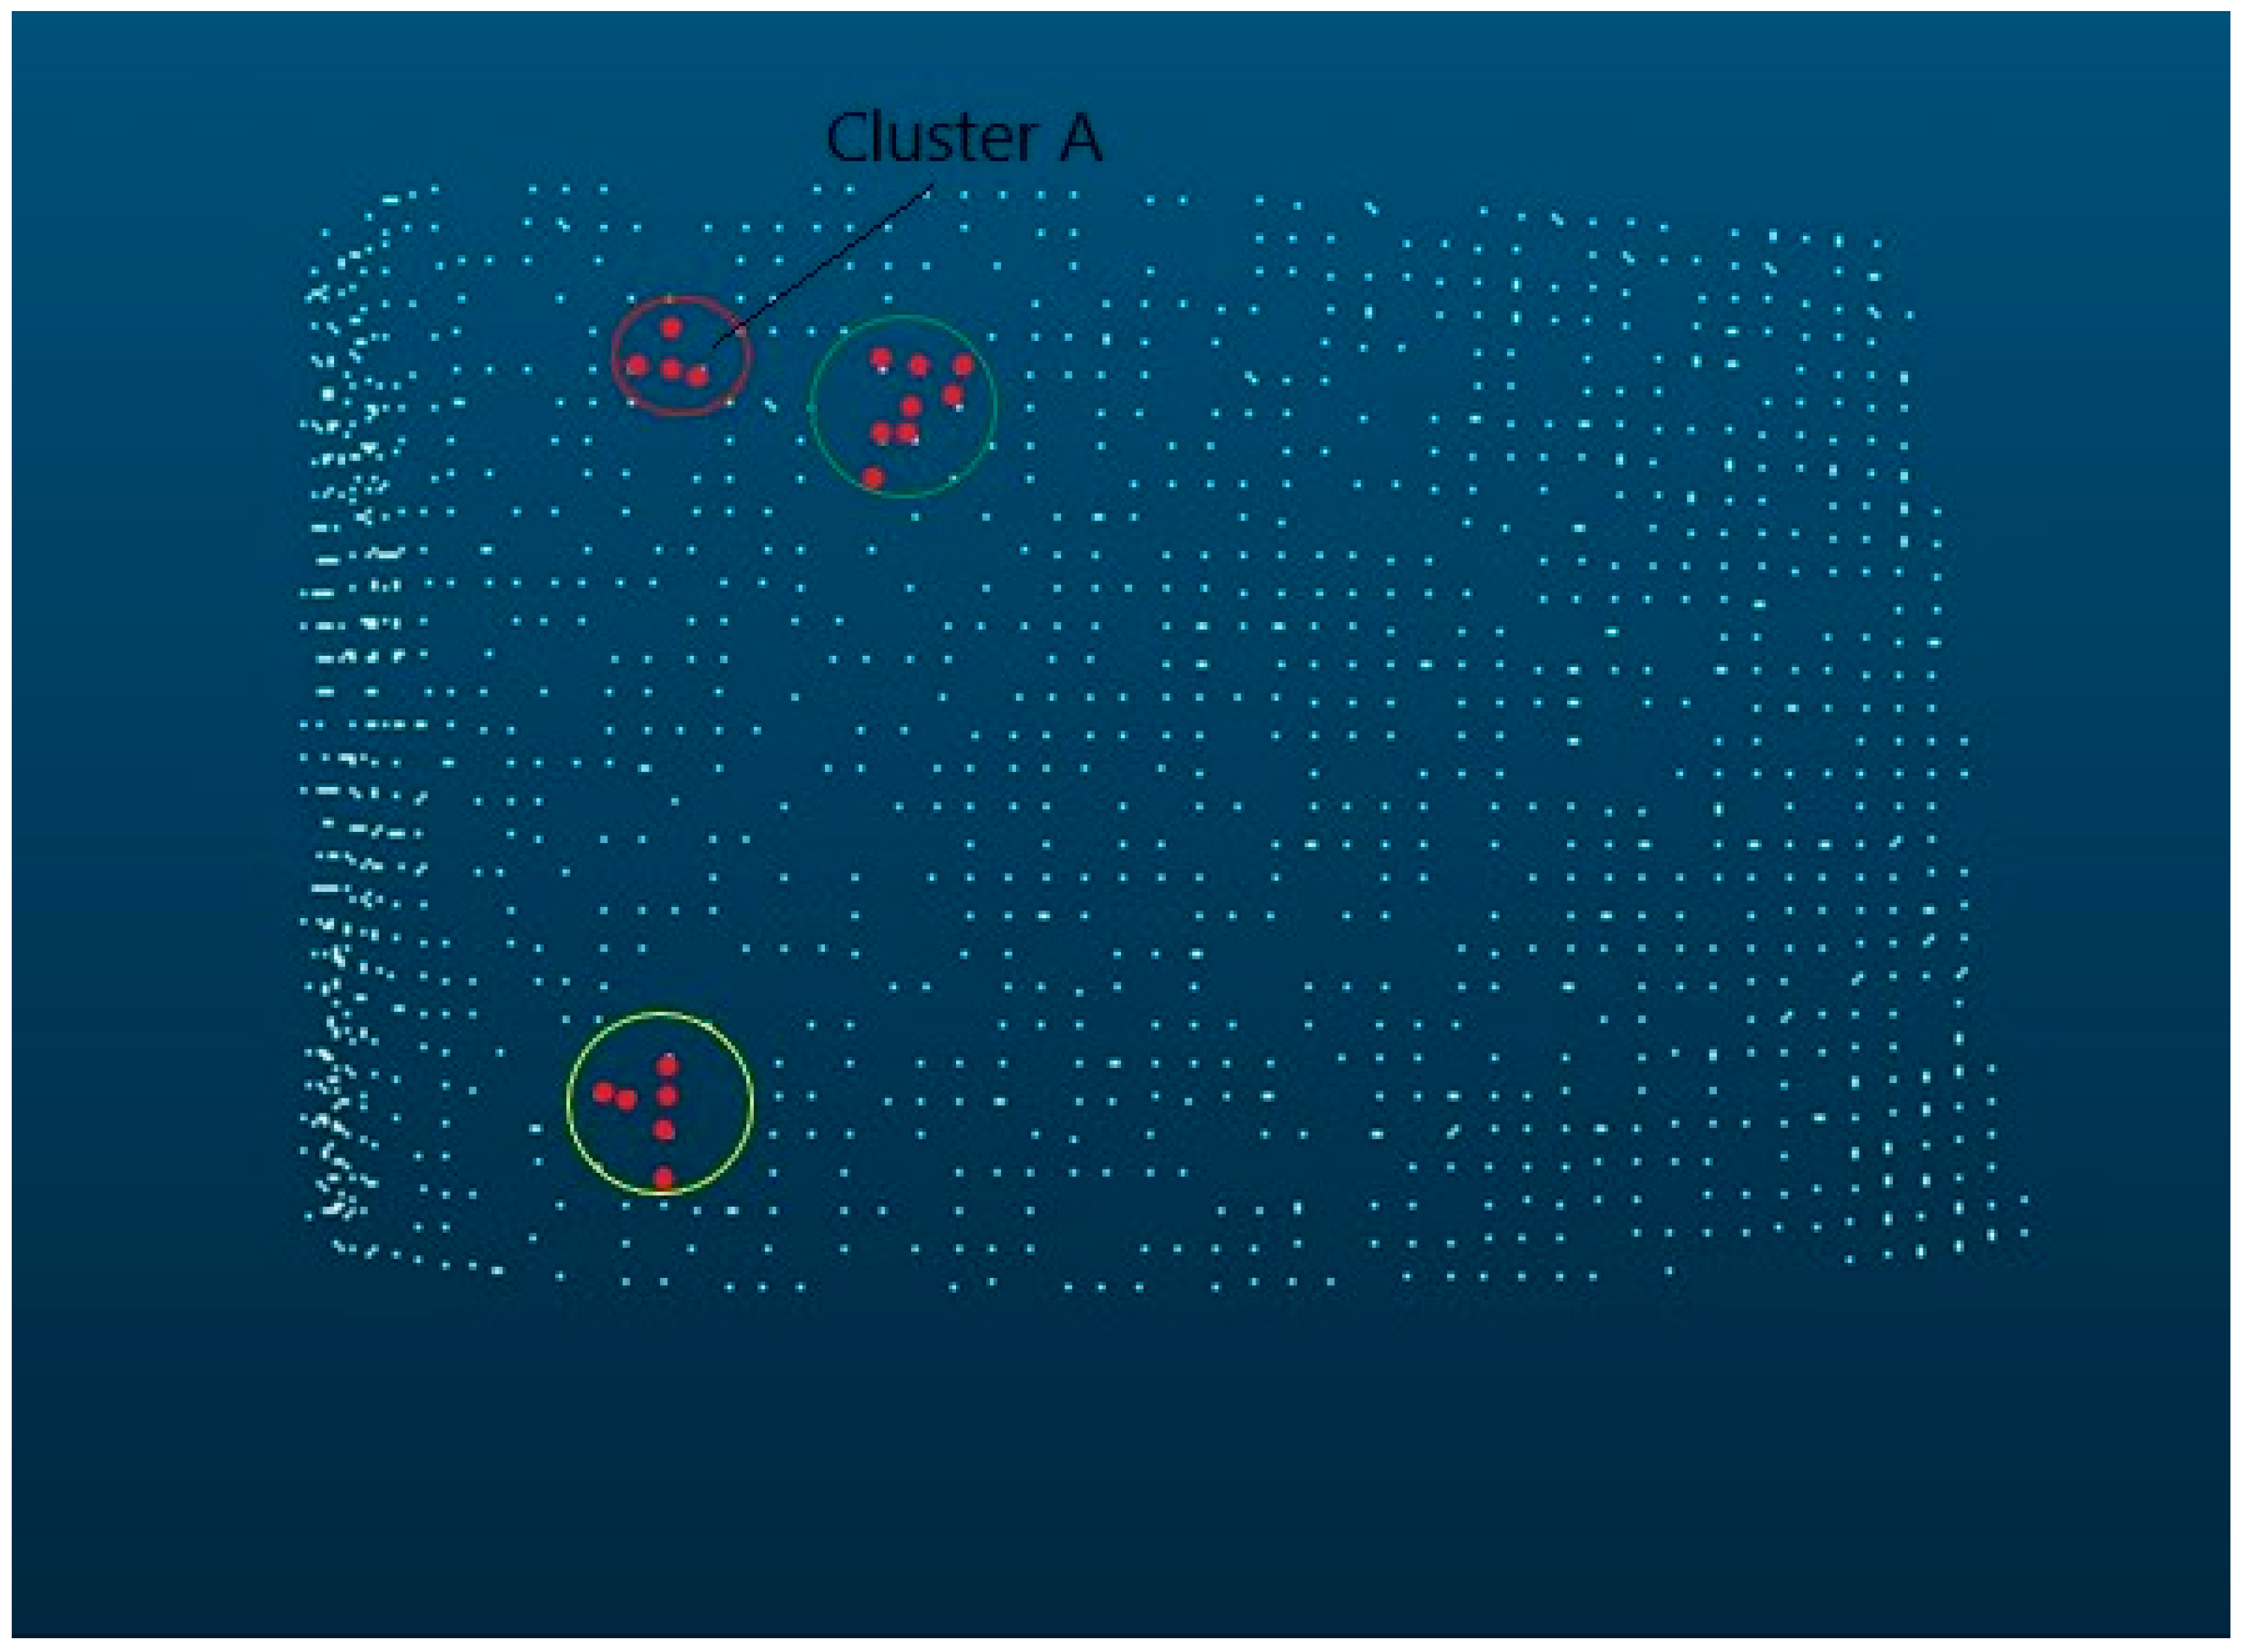
2.2. Feature Creation
- Rib width;
- Depth between two adjacent ribs;
- Distance between the ribs;
- Shape of the ribs, fissures, roughness, etc.
- Axiom 1: Each model has at least one cluster.
- Axiom 2: Every model has no zero cluster.
- Axiom 3: More than one successor cluster can exist.
- Axiom 4: Each cluster contains information about its predecessors.
- Axiom 5: If no subsequent cluster exists, the number of predecessors defines the length of the ridge. This forms the 15th element of the cluster vector.
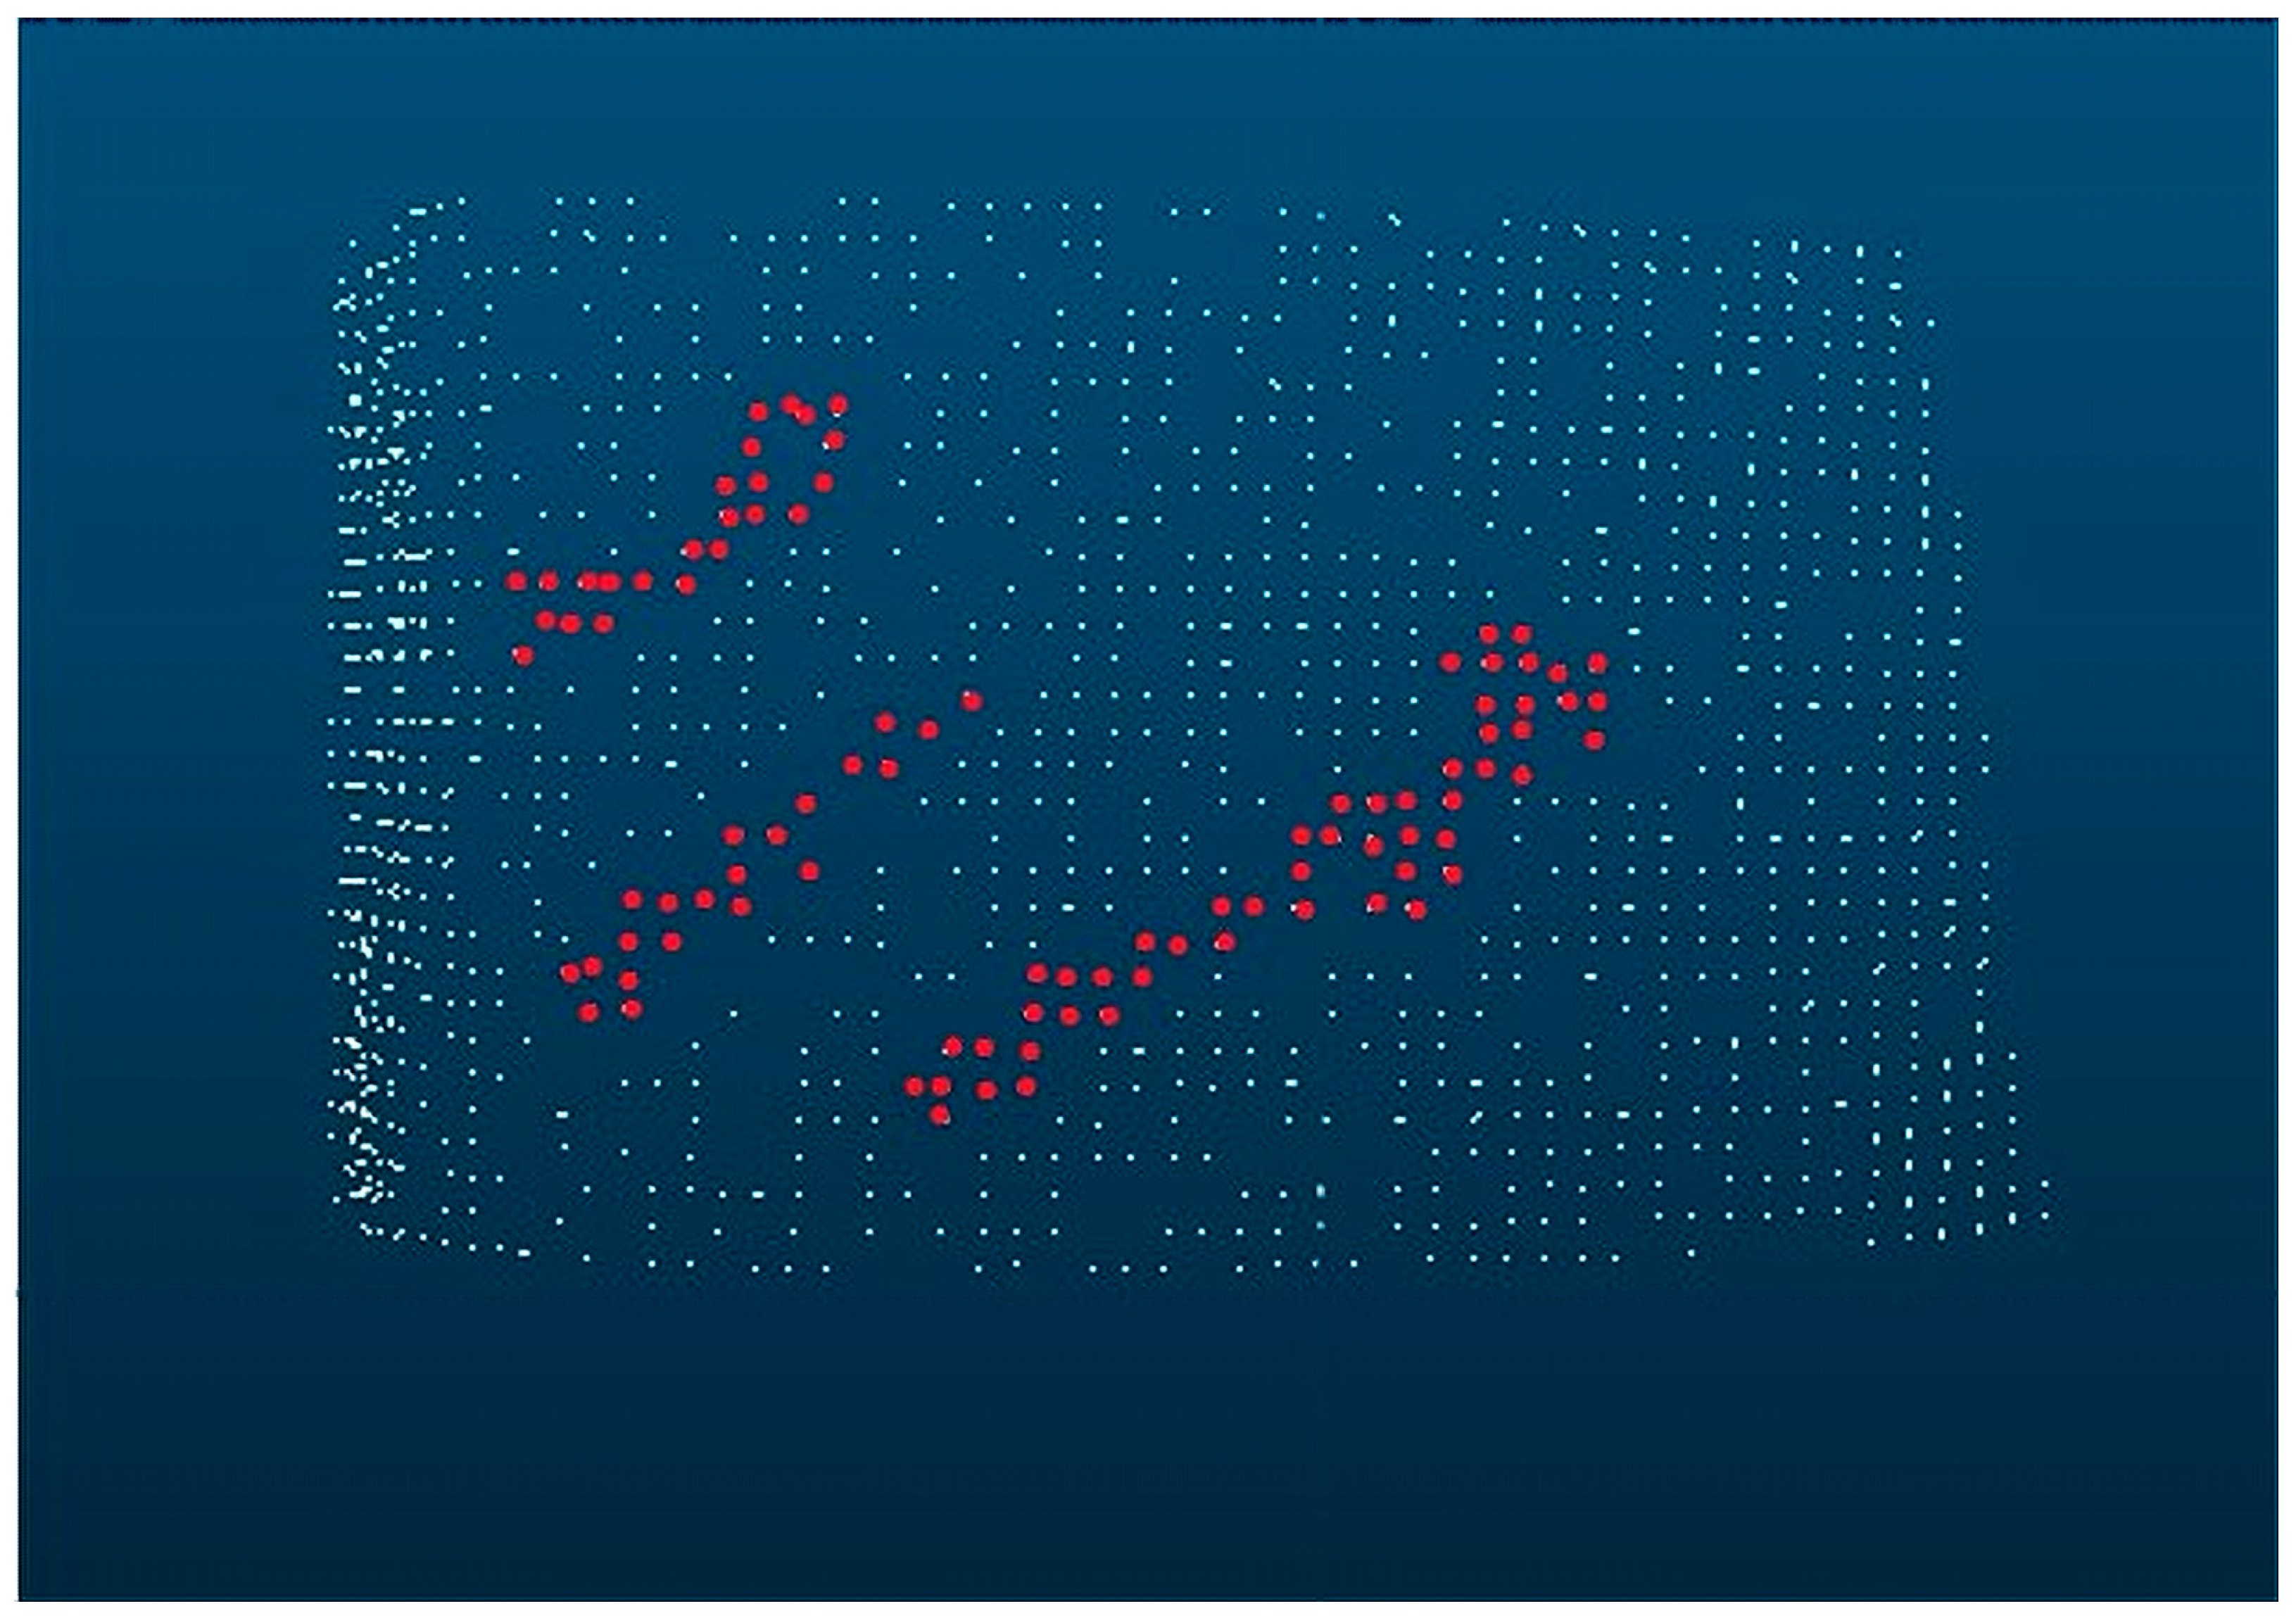
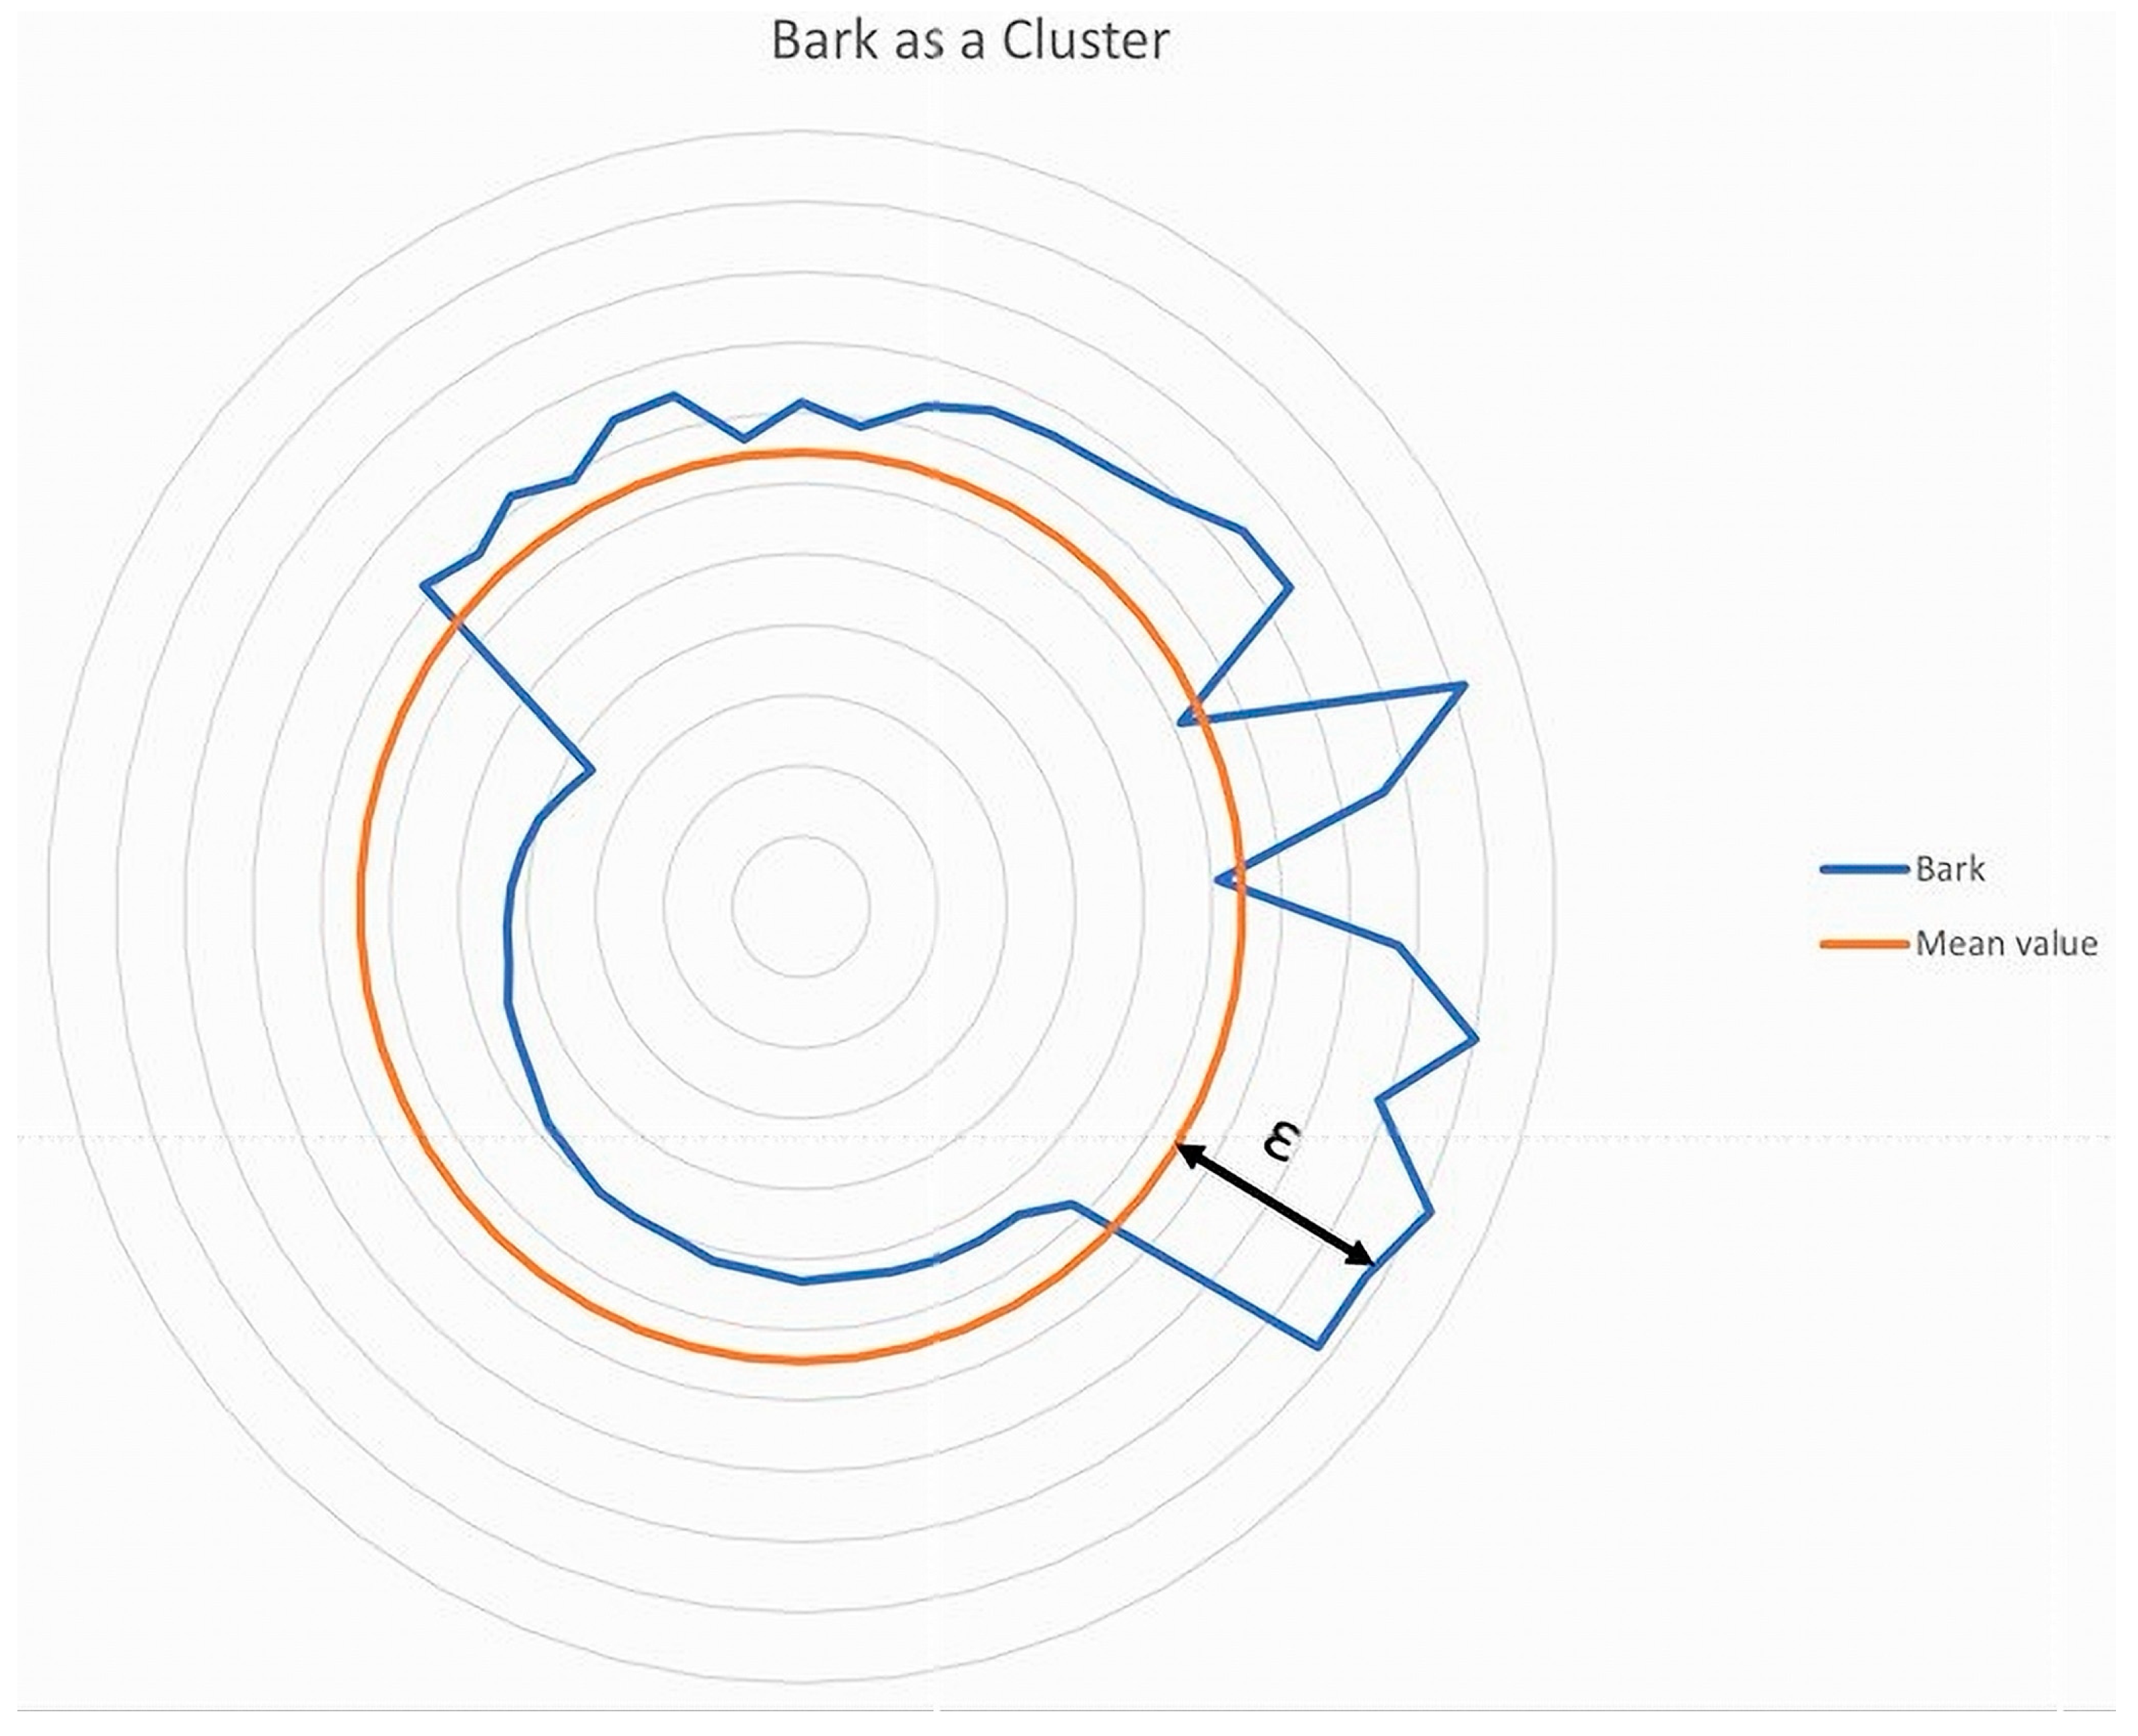
- Axiom 6: All clusters with similar properties and a spatial proximity form elements of a bark rib.
- Geometric description of the bark;
- Rib characteristics.
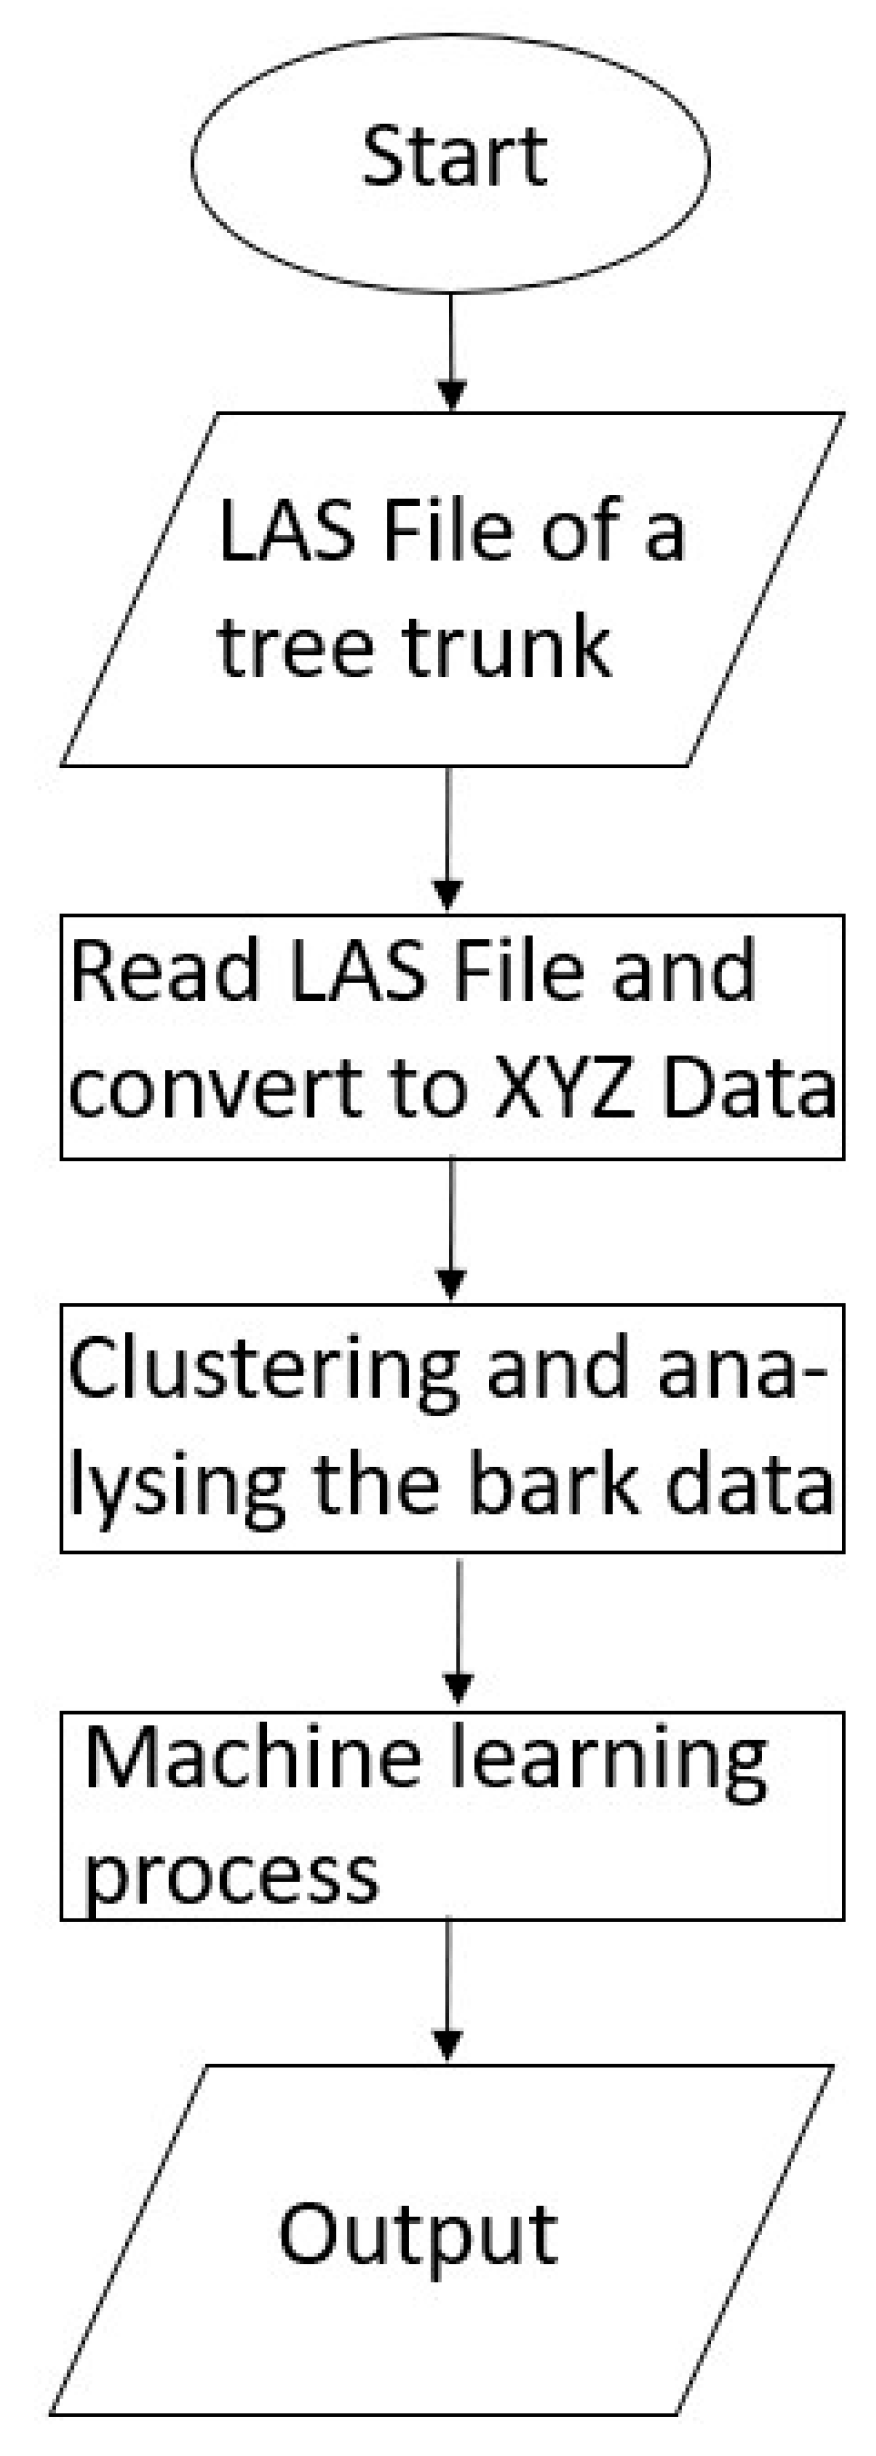
2.3. Machine Learning
- Decision trees;
- Random forests;
- XGBoost;
- Support vector machines.
- True Positive (TP);
- False Positive (FP);
- True Negative (RN);
- False Negative (FN).
- Geometric description of the bark;
- Rib characteristics.
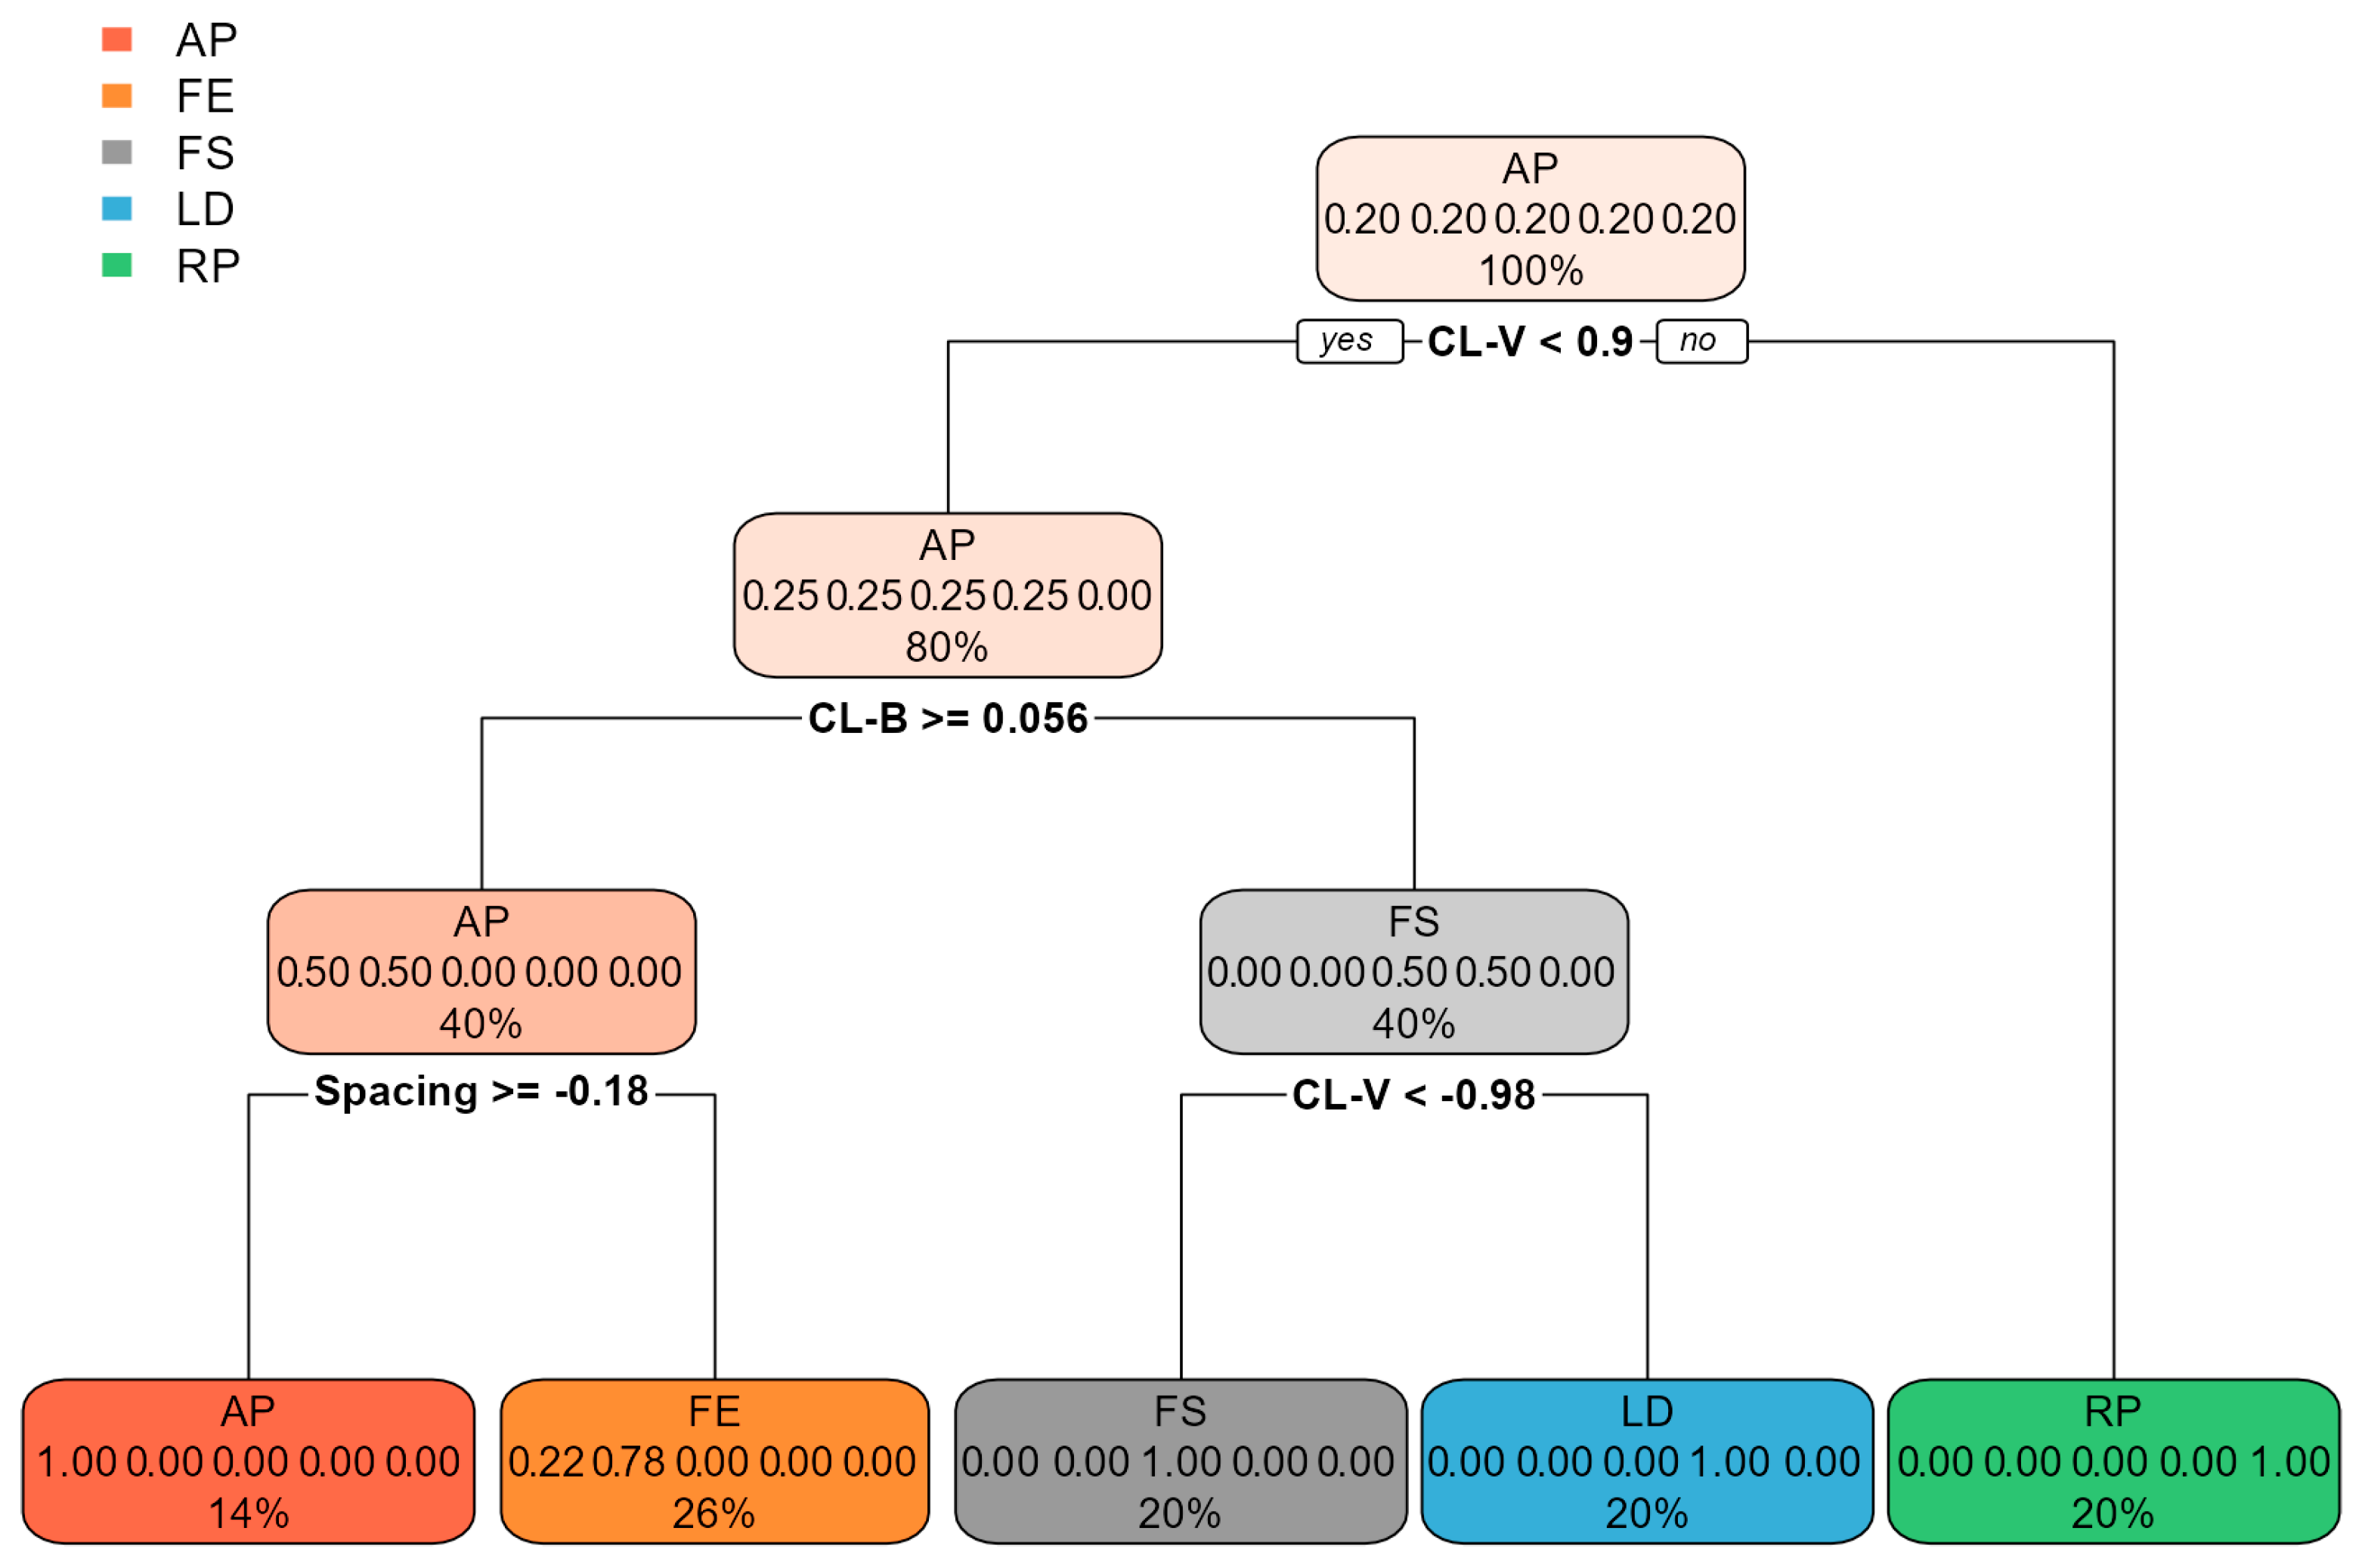
2.3.1. Decision Trees
2.3.2. Random Forests
2.3.3. XGBoost
2.3.4. Support Vector Machines
3. Results
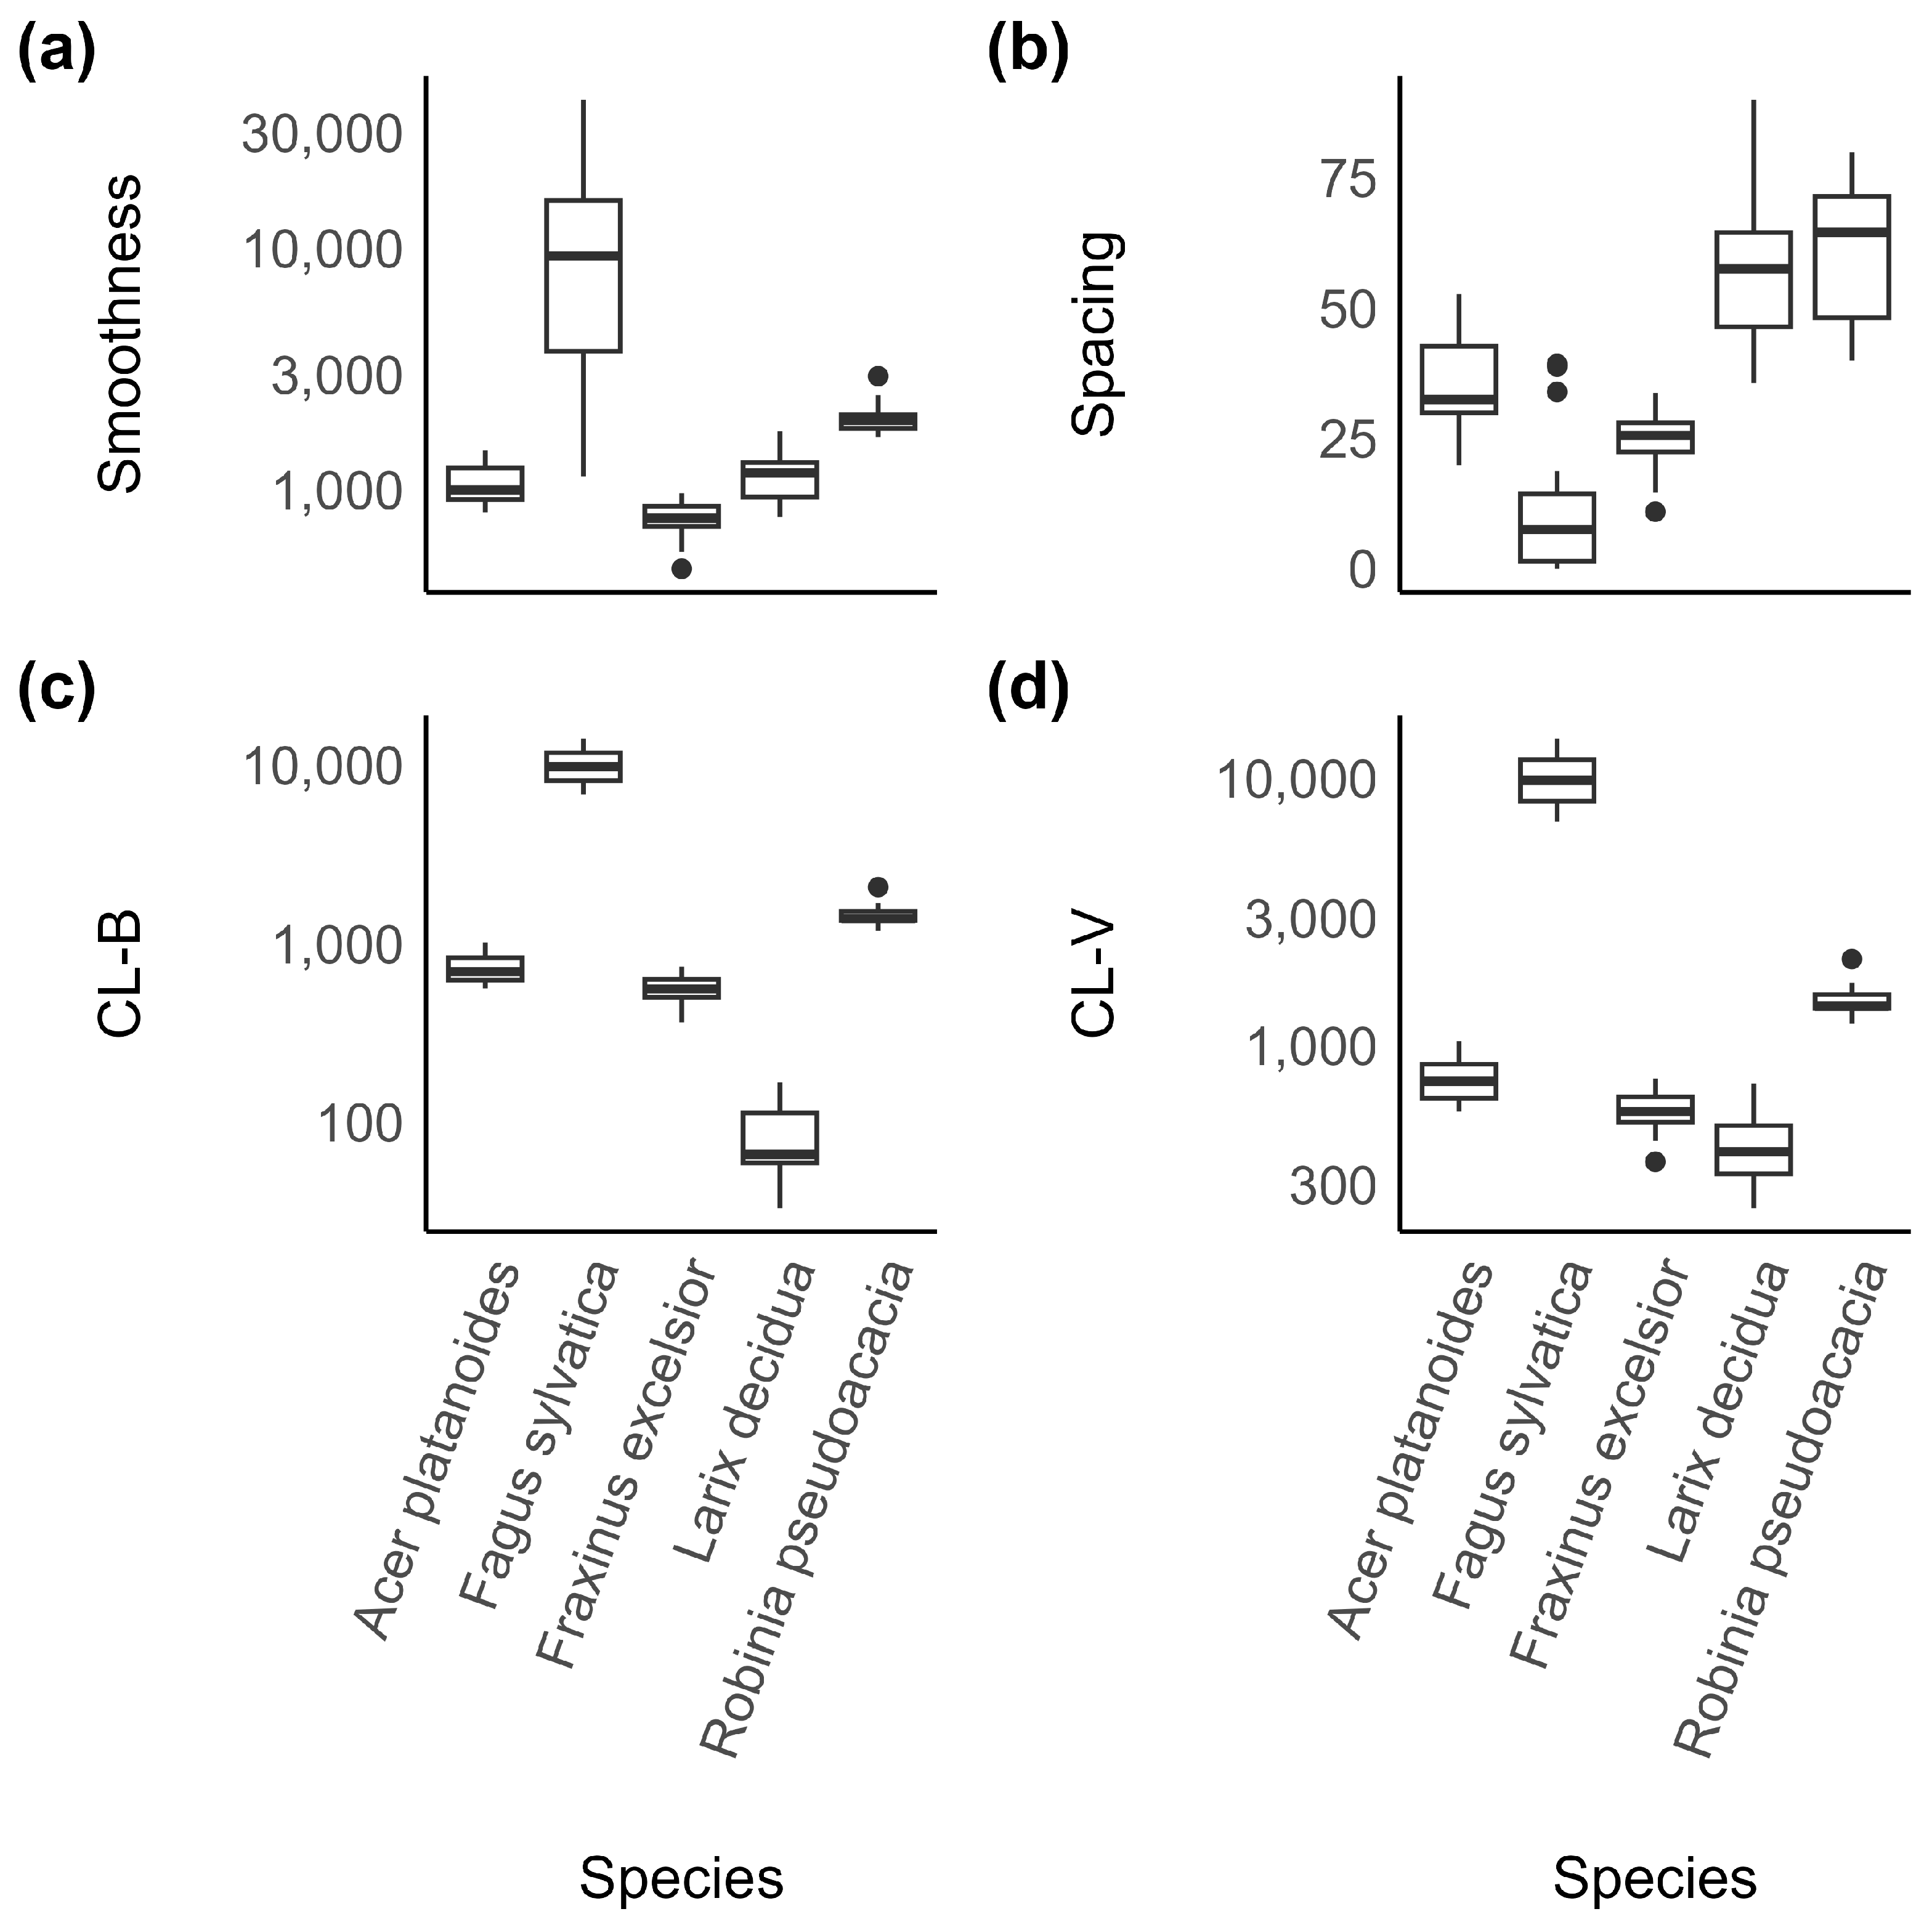
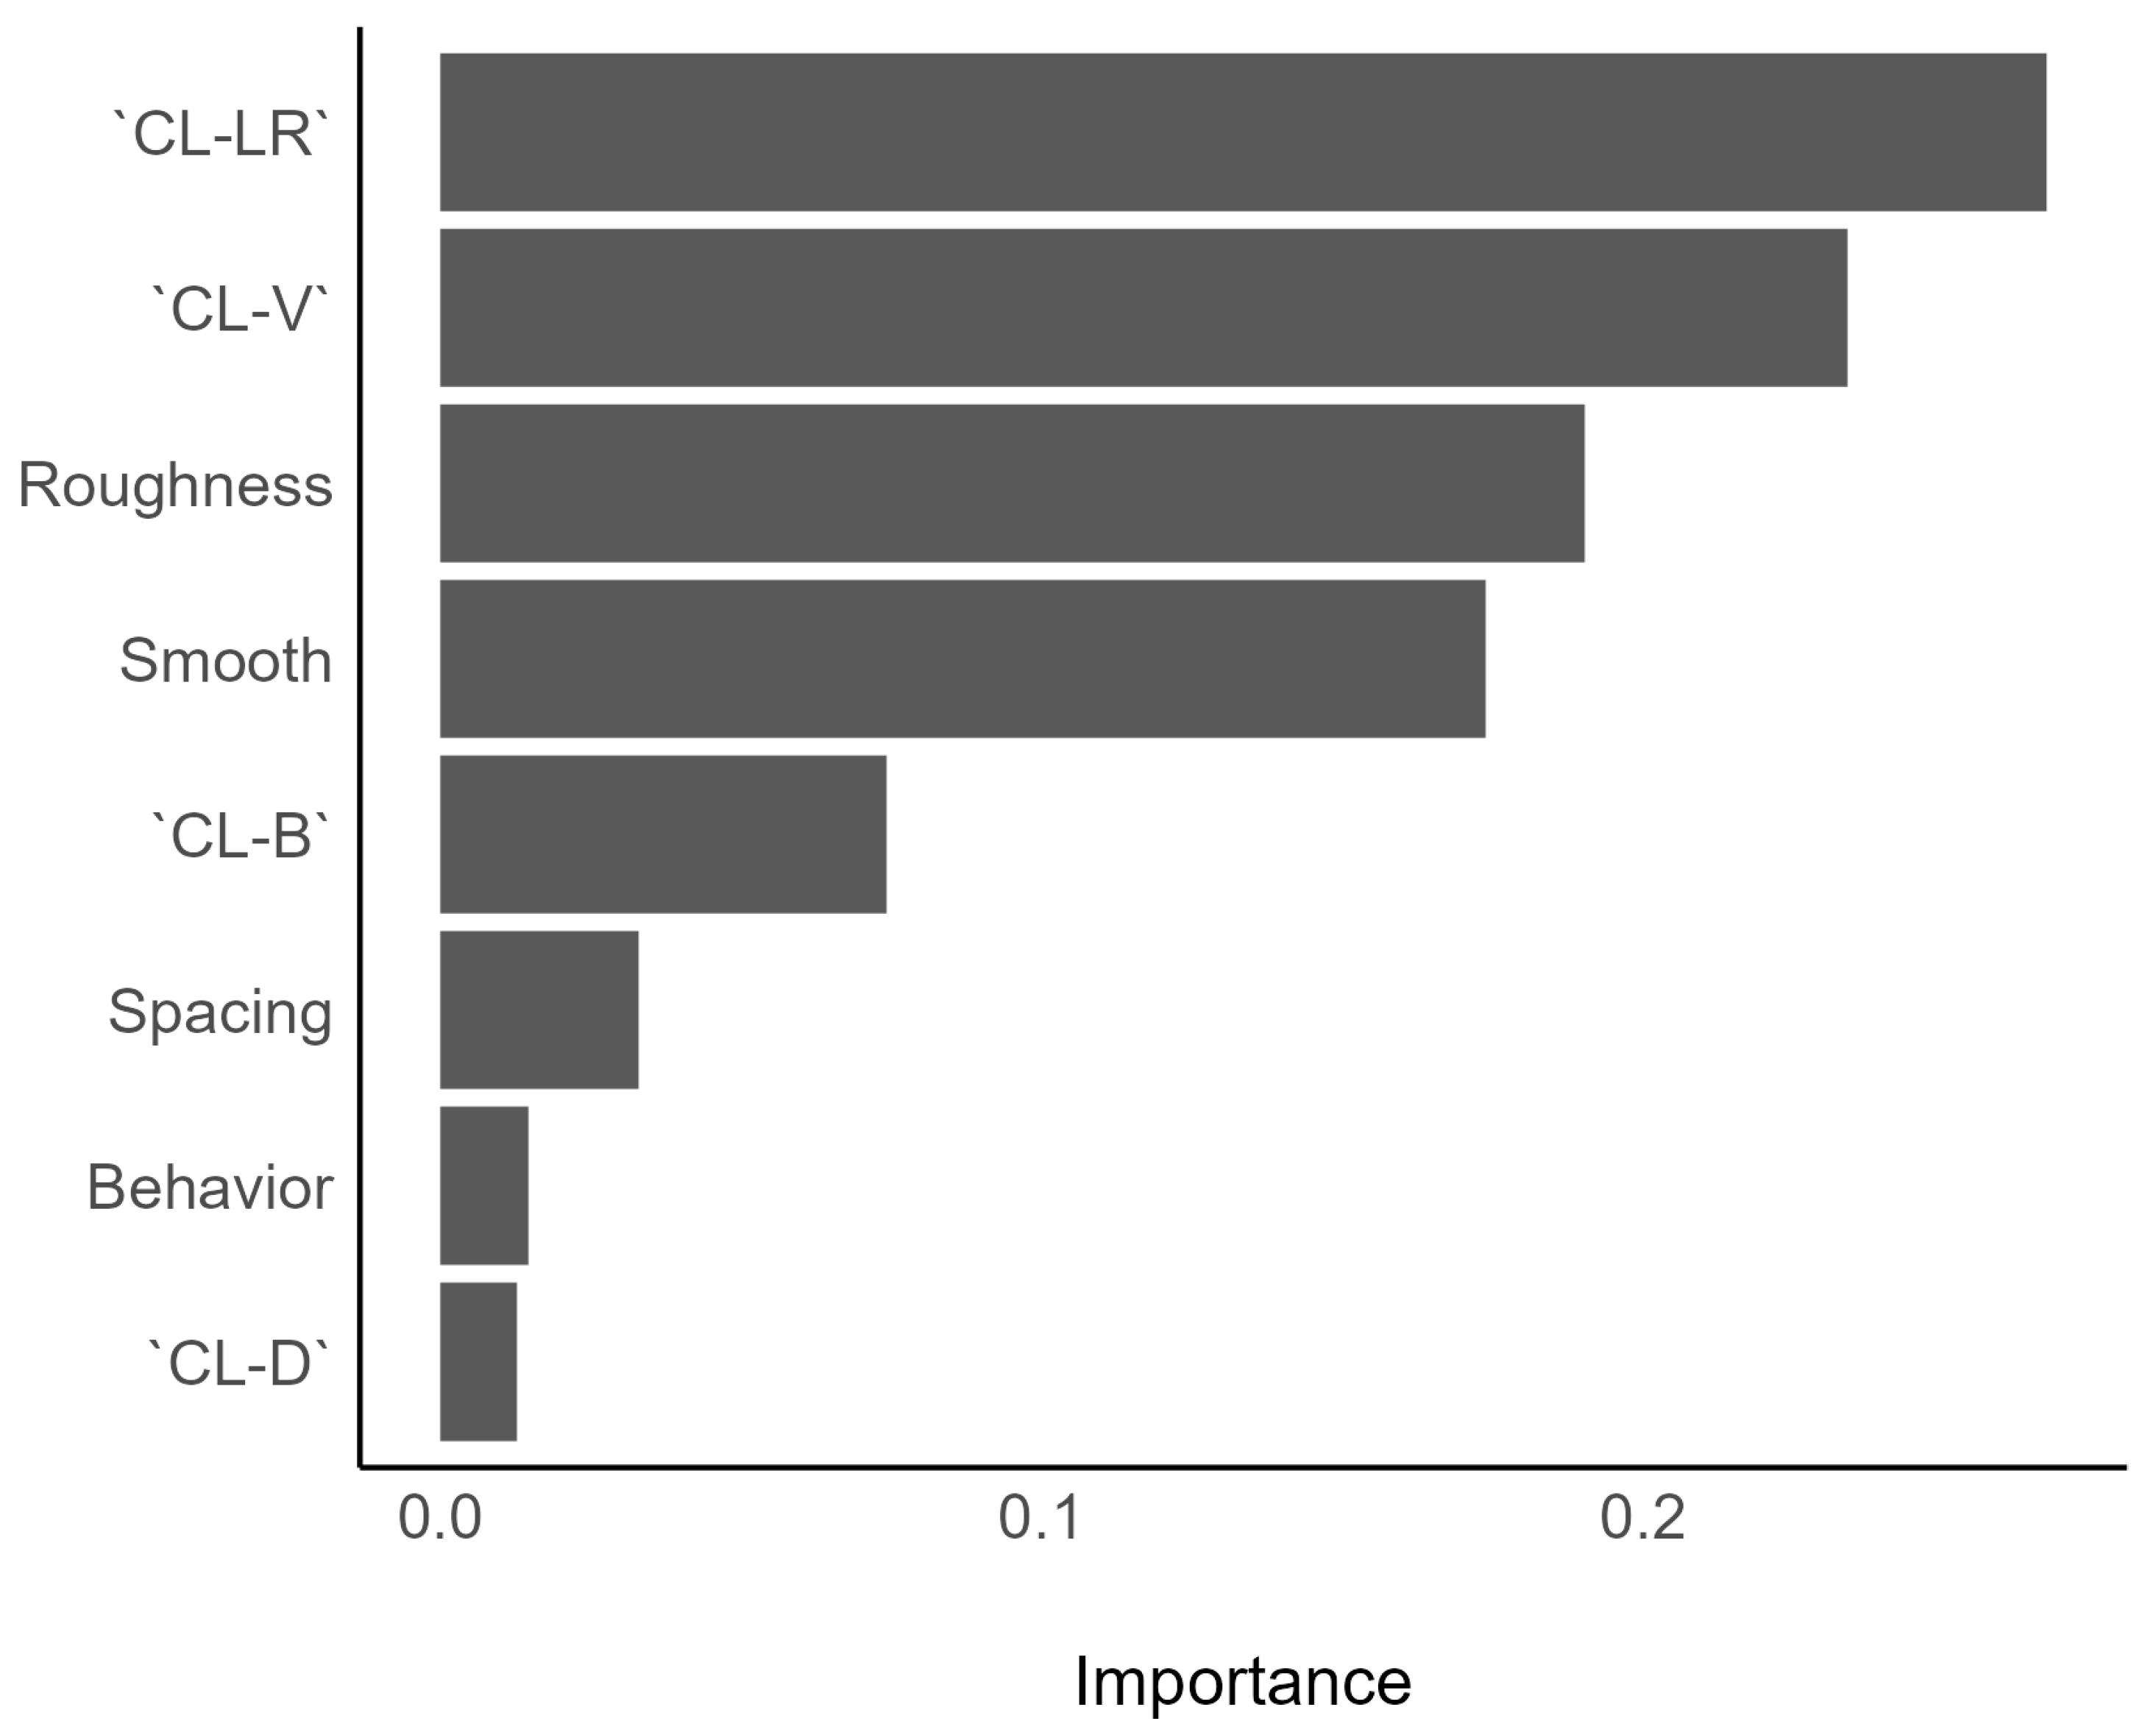
3.1. Features
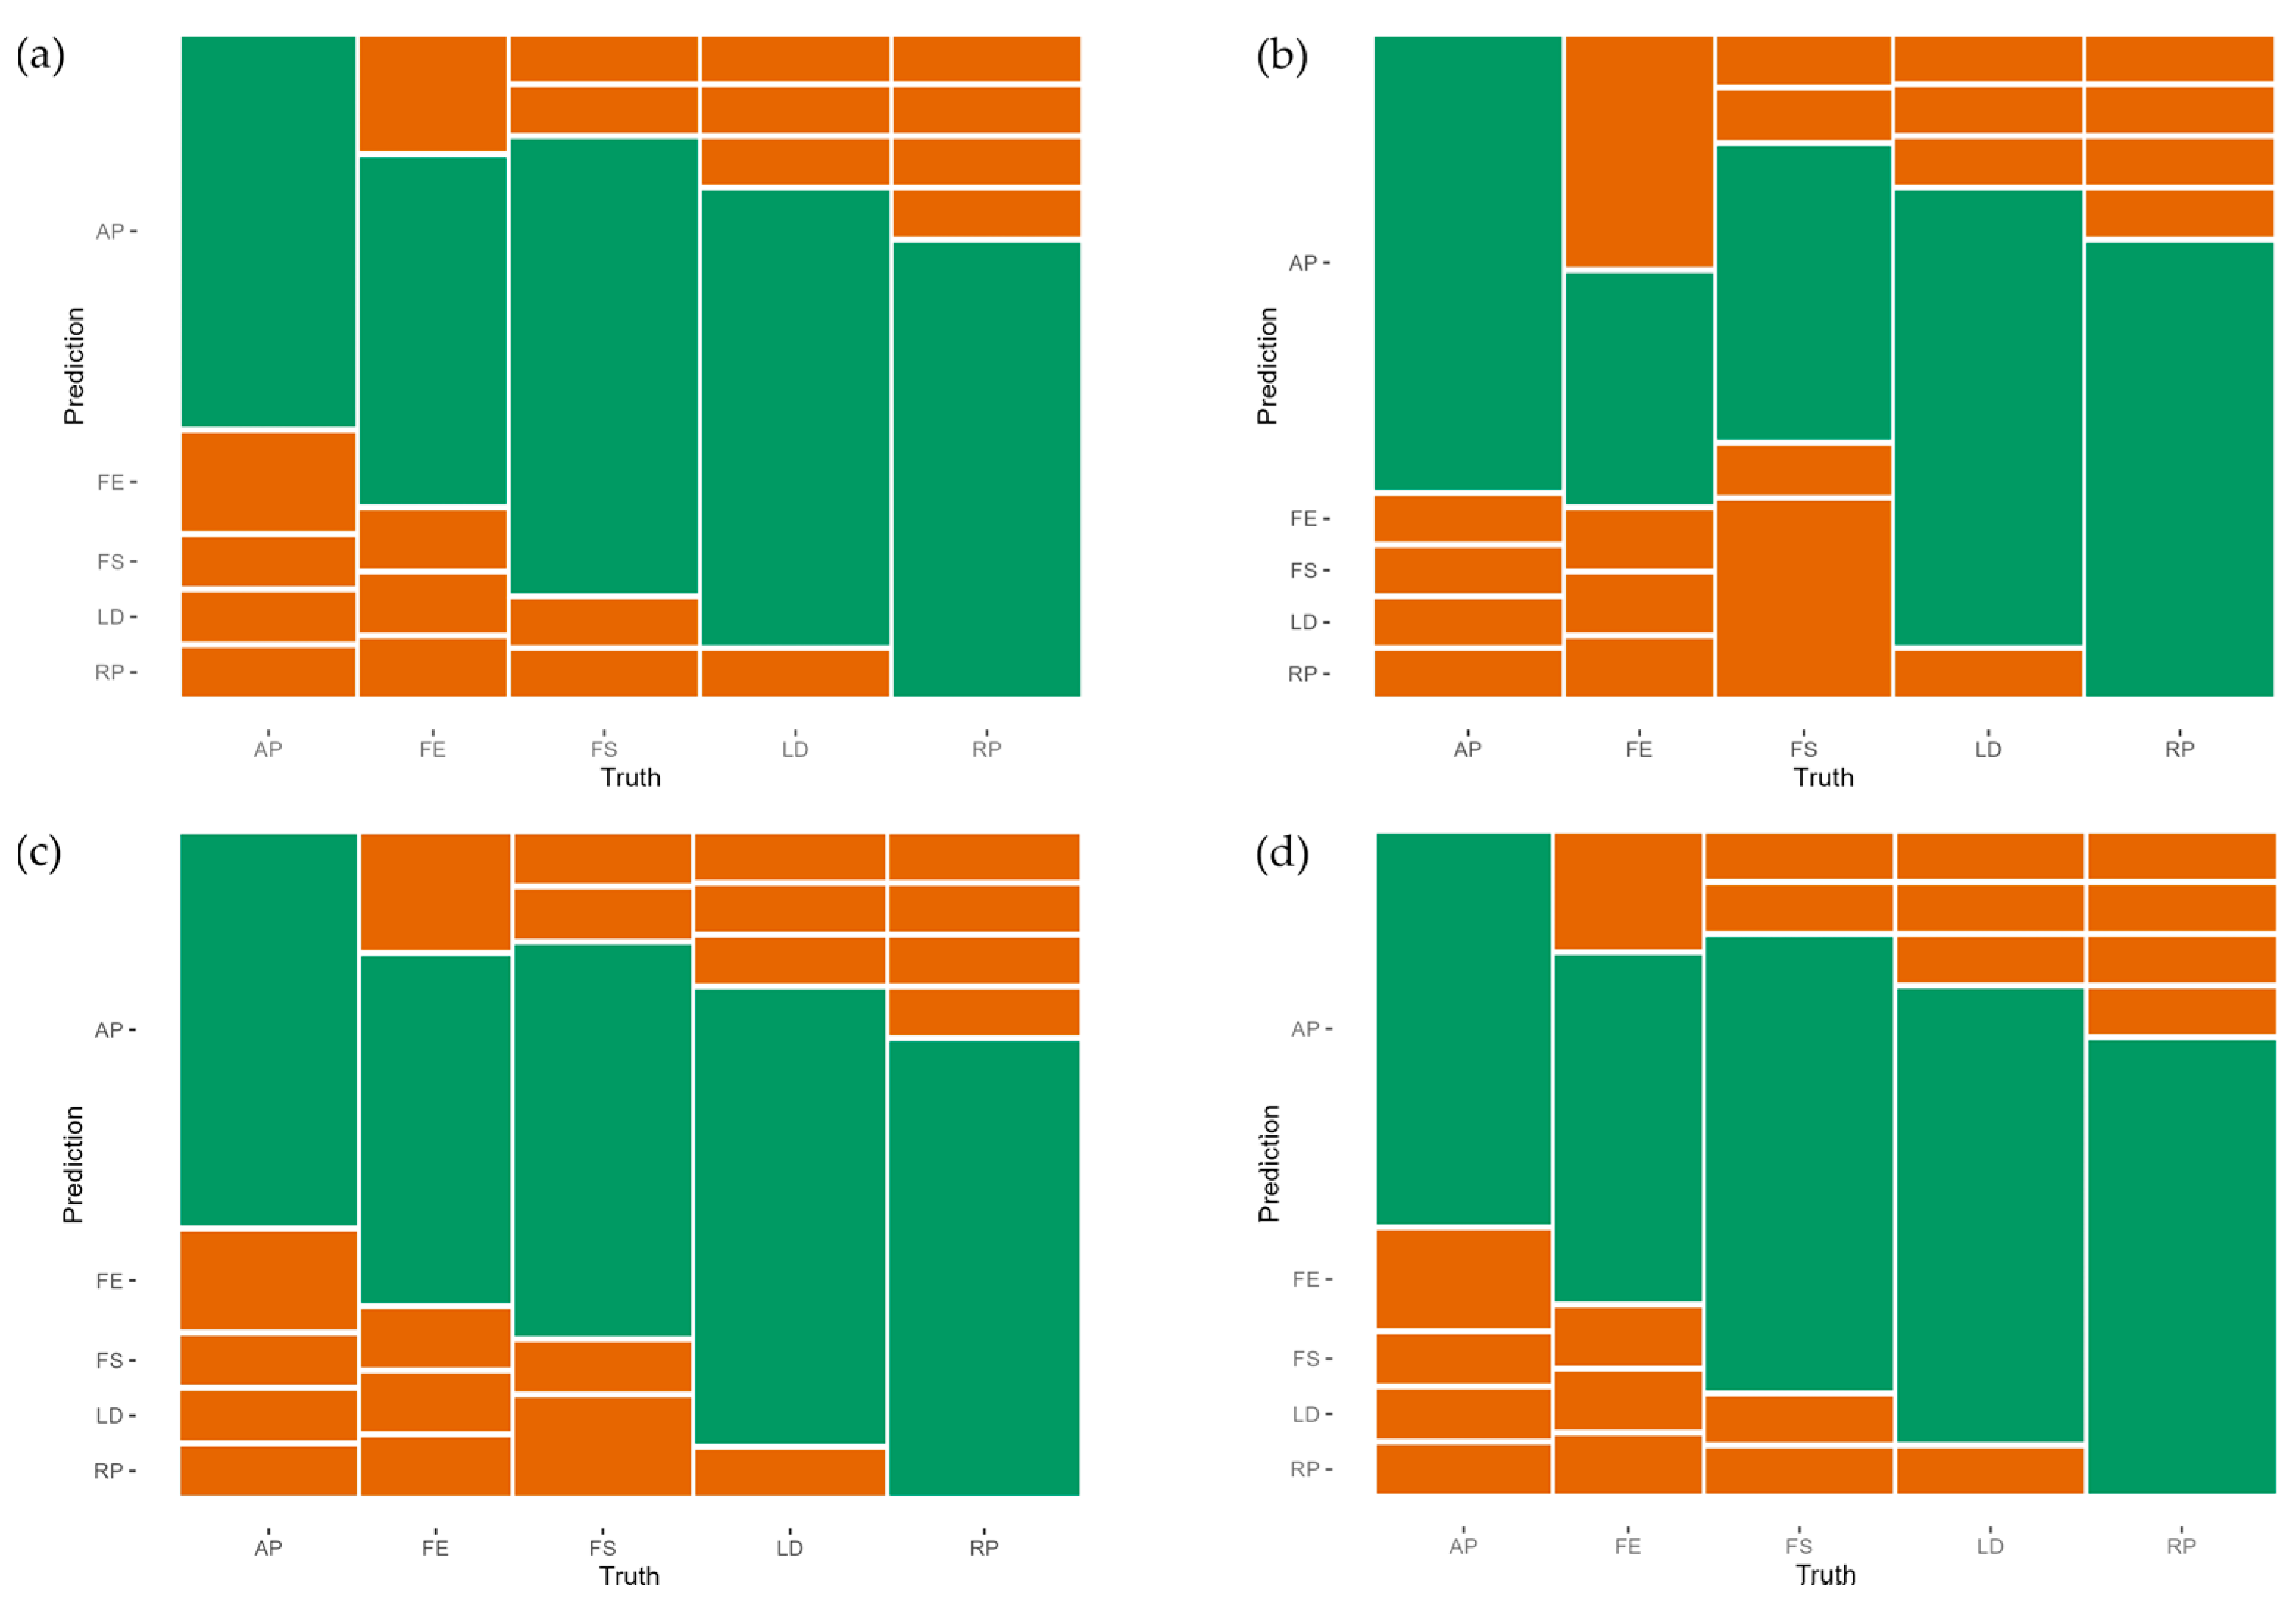
3.2. Machine Learning
4. Discussion
5. Conclusions
Author Contributions
Funding
Data Availability Statement
Acknowledgments
Conflicts of Interest
References
- Kushwaha, S.K.P.; Singh, A.; Jain, K.; Cabo, C.; Mokros, M. Integrating Airborne and Terrestrial Laser Scanning for Complete 3D Model Generation in Dense Forest. In Proceedings of the IGARSS 2023—2023 IEEE International Geoscience and Remote Sensing Symposium, Pasadena, CA, USA, 16–21 July 2023; pp. 3137–3140. [Google Scholar]
- Chen, S.; Liu, H.; Feng, Z.; Shen, C.; Chen, P. Applicability of Personal Laser Scanning in Forestry Inventory. PLoS ONE 2019, 14, e0211392. [Google Scholar] [CrossRef]
- Hyyppä, J.; Yu, X.; Kaartinen, H.; Kukko, A.; Jaakkola, A.; Liang, X.; Wang, Y.; Holopainen, M.; Vastaranta, M.; Hyyppa, H. Forest Inventory Using Laser Scanning; Shan, J., Toth, C.K., Eds.; CRC Press-Taylor & Francis Group: Boca Raton, FL, USA, 2018; pp. 379–412. ISBN 978-1-4987-7228-0. [Google Scholar]
- Brede, B.; Terryn, L.; Barbier, N.; Bartholomeus, H.M.; Bartolo, R.; Calders, K.; Derroire, G.; Krishna Moorthy, S.M.; Lau, A.; Levick, S.R.; et al. Non-Destructive Estimation of Individual Tree Biomass: Allometric Models, Terrestrial and UAV Laser Scanning. Remote Sens. Environ. 2022, 280, 113180. [Google Scholar] [CrossRef]
- Arseniou, G.; MacFarlane, D.W.; Calders, K.; Baker, M. Accuracy Differences in Aboveground Woody Biomass Estimation with Terrestrial Laser Scanning for Trees in Urban and Rural Forests and Different Leaf Conditions. Trees 2023, 37, 761–779. [Google Scholar] [CrossRef]
- Wang, F.; Sun, Y.; Jia, W.; Li, D.; Zhang, X.; Tang, Y.; Guo, H. A Novel Approach to Characterizing Crown Vertical Profile Shapes Using Terrestrial Laser Scanning (TLS). Remote Sens. 2023, 15, 3272. [Google Scholar] [CrossRef]
- Demol, M.; Verbeeck, H.; Gielen, B.; Armston, J.; Burt, A.; Disney, M.; Duncanson, L.; Hackenberg, J.; Kükenbrink, D.; Lau, A.; et al. Estimating Forest Above-ground Biomass with Terrestrial Laser Scanning: Current Status and Future Directions. Methods Ecol. Evol. 2022, 13, 1628–1639. [Google Scholar] [CrossRef]
- Vazirabad, Y.F.; Karslioglu, M.O. Lidar for Biomass Estimation; Matovic, D., Ed.; Intech Europe: Rijeka, Croatia, 2011; pp. 3–26. ISBN 978-953-307-492-4. [Google Scholar]
- Calders, K.; Verbeeck, H.; Burt, A.; Origo, N.; Nightingale, J.; Malhi, Y.; Wilkes, P.; Raumonen, P.; Bunce, R.G.H.; Disney, M. Laser Scanning Reveals Potential Underestimation of Biomass Carbon in Temperate Forest. Ecol. Solut. Evid. 2022, 3, e12197. [Google Scholar] [CrossRef]
- Dassot, M.; Barbacci, A.; Colin, A.; Fournier, M.; Constant, T. Tree Architecture and Biomass Assessment from Terrestrial LiDAR Measurements: A Case Study for Some Beech Trees (Fagus sylvatica). Silvilaser Full Proc. 2010, 206–215. [Google Scholar]
- Sun, C.; Huang, C.; Zhang, H.; Chen, B.; An, F.; Wang, L.; Yun, T. Individual Tree Crown Segmentation and Crown Width Extraction from a Heightmap Derived From Aerial Laser Scanning Data Using a Deep Learning Framework. Front. Plant Sci. 2022, 13, 914974. [Google Scholar] [CrossRef]
- Wu, L.; Shi, Y.; Zhang, F.; Zhou, Y.; Ding, Z.; Lv, S.; Xu, L. Estimating Carbon Stocks and Biomass Expansion Factors of Urban Greening Trees Using Terrestrial Laser Scanning. Forests 2022, 13, 1389. [Google Scholar] [CrossRef]
- Imai, Y.; Setojima, M.; Yamagishi, Y.; Fujiwara, N. Tree-Height Measuring Characteristics of Urban Forests by Lidar Data Different in Resolution. In Proceedings of the Geo-Imagery Bridging Continents, Istanbul, Turkey, 12–23 July 2004; pp. 2–5. [Google Scholar]
- Guo, Y.; Luka, A.; Wei, Y. Modeling Urban Tree Growth for Digital Twins: Transformation of Point Clouds into Parametric Crown Models. J. Digit. Landsc. Archit. 2022, 213–223. [Google Scholar] [CrossRef]
- Uzquiano, S.; Barbeito, I.; San Martín, R.; Ehbrecht, M.; Seidel, D.; Bravo, F. Quantifying Crown Morphology of Mixed Pine-Oak Forests Using Terrestrial Laser Scanning. Remote Sens. 2021, 13, 4955. [Google Scholar] [CrossRef]
- Ma, Q.; Lin, J.; Ju, Y.; Li, W.; Liang, L.; Guo, Q. Individual Structure Mapping over Six Million Trees for New York City USA. Sci. Data 2023, 10, 102. [Google Scholar] [CrossRef] [PubMed]
- Münzinger, M.; Prechtel, N.; Behnisch, M. Mapping the Urban Forest in Detail: From LiDAR Point Clouds to 3D Tree Models. Urban For. Urban Green. 2022, 74, 127637. [Google Scholar] [CrossRef]
- Zieba-Kulawik, K.; Skoczylas, K.; Wezyk, P.; Teller, J.; Mustafa, A.; Omrani, H. Monitoring of Urban Forests Using 3D Spatial Indices Based on LiDAR Point Clouds and Voxel Approach. Urban For. Urban Green. 2021, 65, 127324. [Google Scholar] [CrossRef]
- Zieba-Kulawik, K.; Wezyk, P. Monitoring 3D Changes in Urban Forests Using Landscape Metrics Analyses Based on Multi-Temporal Remote Sensing Data. Land 2022, 11, 883. [Google Scholar] [CrossRef]
- César de Lima Araújo, H.; Silva Martins, F.; Tucunduva Philippi Cortese, T.; Locosselli, G.M. Artificial Intelligence in Urban Forestry—A Systematic Review. Urban For. Urban Green. 2021, 66, 127410. [Google Scholar] [CrossRef]
- Matasci, G.; Coops, N.C.; Williams, D.A.R.; Page, N. Mapping Tree Canopies in Urban Environments Using Airborne Laser Scanning (ALS): A Vancouver Case Study. For. Ecosyst. 2018, 5, 31. [Google Scholar] [CrossRef]
- Plowright, A.A.; Coops, N.C.; Eskelson, B.N.I.; Sheppard, S.R.J.; Aven, N.W. Assessing Urban Tree Condition Using Airborne Light Detection and Ranging. Urban For. Urban Green. 2016, 19, 140–150. [Google Scholar] [CrossRef]
- Degerickx, J.; Roberts, D.A.; McFadden, J.P.; Hermy, M.; Somers, B. Urban Tree Health Assessment Using Airborne Hyperspectral and LiDAR Imagery. Int. J. Appl. Earth Obs. Geoinf. 2018, 73, 26–38. [Google Scholar] [CrossRef]
- Michałowska, M.; Rapiński, J. A Review of Tree Species Classification Based on Airborne LiDAR Data and Applied Classifiers. Remote Sens. 2021, 13, 353. [Google Scholar] [CrossRef]
- Sakharova, E.K.; Nurlyeva, D.D.; Fedorova, A.A.; Yakubov, A.R.; Kanev, A.I. Issues of Tree Species Classification from LiDAR Data Using Deep Learning Model. In Advances in Neural Computation, Machine Learning, and Cognitive Research V; Kryzhanovsky, B., Dunin-Barkowski, W., Redko, V., Tiumentsev, Y., Klimov, V.V., Eds.; Springer International Publishing: Cham, Switzerland, 2022; pp. 319–324. [Google Scholar]
- Hartling, S.; Sagan, V.; Sidike, P.; Maimaitijiang, M.; Carron, J. Urban Tree Species Classification Using a WorldView-2/3 and LiDAR Data Fusion Approach and Deep Learning. Sensors 2019, 19, 1284. [Google Scholar] [CrossRef] [PubMed]
- Liu, M.; Han, Z.; Chen, Y.; Liu, Z.; Han, Y. Tree Species Classification of LiDAR Data Based on 3D Deep Learning. Measurement 2021, 177, 109301. [Google Scholar] [CrossRef]
- Xi, Z.; Hopkinson, C.; Rood, S.B.; Peddle, D.R. See the Forest and the Trees: Effective Machine and Deep Learning Algorithms for Wood Filtering and Tree Species Classification from Terrestrial Laser Scanning. ISPRS J. Photogramm. Remote Sens. 2020, 168, 1–16. [Google Scholar] [CrossRef]
- Seidel, D.; Annighöfer, P.; Thielman, A.; Seifert, Q.E.; Thauer, J.-H.; Glatthorn, J.; Ehbrecht, M.; Kneib, T.; Ammer, C. Predicting Tree Species From 3D Laser Scanning Point Clouds Using Deep Learning. Front. Plant Sci. 2021, 12, 635440. [Google Scholar] [CrossRef]
- Qian, C.; Yao, C.; Ma, H.; Xu, J.; Wang, J. Tree Species Classification Using Airborne LiDAR Data Based on Individual Tree Segmentation and Shape Fitting. Remote Sens. 2023, 15, 406. [Google Scholar] [CrossRef]
- Fassnacht, F.E.; Latifi, H.; Stereńczak, K.; Modzelewska, A.; Lefsky, M.; Waser, L.T.; Straub, C.; Ghosh, A. Review of Studies on Tree Species Classification from Remotely Sensed Data. Remote Sens. Environ. 2016, 186, 64–87. [Google Scholar] [CrossRef]
- Qiao, Y.; Zheng, G.; Du, Z.; Ma, X.; Li, J.; Moskal, L. Tree-Species Classification and Individual-Tree-Biomass Model Construction Based on Hyperspectral and LiDAR Data. Remote Sens. 2023, 15, 1341. [Google Scholar] [CrossRef]
- Hakula, A.; Ruoppa, L.; Lehtomäki, M.; Yu, X.; Kukko, A.; Kaartinen, H.; Taher, J.; Matikainen, L.; Hyyppä, E.; Luoma, V.; et al. Individual Tree Segmentation and Species Classification Using High-Density Close-Range Multispectral Laser Scanning Data. ISPRS Open J. Photogramm. Remote Sens. 2023, 9, 100039. [Google Scholar] [CrossRef]
- Ahlswede, S.; Schulz, C.; Gava, C.; Helber, P.; Bischke, B.; Förster, M.; Arias, F.; Hees, J.; Demir, B.; Kleinschmit, B. TreeSatAI Benchmark Archive: A Multi-Sensor, Multi-Label Dataset for Tree Species Classification in Remote Sensing. Earth Syst. Sci. Data 2023, 15, 681–695. [Google Scholar] [CrossRef]
- Liu, B.; Huang, H.; Su, Y.; Chen, S.; Li, Z.; Chen, E.; Tian, X. Tree Species Classification Using Ground-Based LiDAR Data by Various Point Cloud Deep Learning Methods. Remote Sens. 2022, 14, 5733. [Google Scholar] [CrossRef]
- Liu, B.; Chen, S.; Huang, H.; Tian, X. Tree Species Classification of Backpack Laser Scanning Data Using the PointNet++ Point Cloud Deep Learning Method. Remote Sens. 2022, 14, 3809. [Google Scholar] [CrossRef]
- Hell, M.; Brandmeier, M.; Briechle, S.; Krzystek, P. Classification of Tree Species and Standing Dead Trees with Lidar Point Clouds Using Two Deep Neural Networks: PointCNN and 3DmFV-Net. PFG 2022, 90, 103–121. [Google Scholar] [CrossRef]
- Cetin, Z.; Yastikli, N. The Use of Machine Learning Algorithms in Urban Tree Species Classification. ISPRS Int. J. Geo-Inf. 2022, 11, 226. [Google Scholar] [CrossRef]
- Faizal, S. Automated Identification of Tree Species by Bark Texture Classification Using Convolutional Neural Networks. Int. J. Res. Appl. Sci. Eng. Technol. 2022, 10, 1384–1392. [Google Scholar] [CrossRef]
- Misra, D.; Crispim-Junior, C.; Tougne, L. Patch-Based CNN Evaluation for Bark Classification. In Computer Vision—ECCV 2020 Workshops; Bartoli, A., Fusiello, A., Eds.; Springer: Cham, Switzerland, 2020; pp. 197–212. ISBN 978-3-030-65413-9. [Google Scholar]
- Abdollahnejad, A.; Panagiotidis, D. Tree Species Classification and Health Status Assessment for a Mixed Broadleaf-Conifer Forest with UAS Multispectral Imaging. Remote Sens. 2020, 12, 3722. [Google Scholar] [CrossRef]
- Terryn, L.; Calders, K.; Disney, M.; Origo, N.; Malhi, Y.; Newnham, G.; Raumonen, P.; Åkerblom, M.; Verbeeck, H. Tree Species Classification Using Structural Features Derived from Terrestrial Laser Scanning. ISPRS J. Photogramm. Remote Sens. 2020, 168, 170–181. [Google Scholar] [CrossRef]
- Xu, Z.; Shen, X.; Cao, L.; Coops, N.C.; Goodbody, T.R.H.; Zhong, T.; Zhao, W.; Sun, Q.; Ba, S.; Zhang, Z.; et al. Tree Species Classification Using UAS-Based Digital Aerial Photogrammetry Point Clouds and Multispectral Imageries in Subtropical Natural Forests. Int. J. Appl. Earth Obs. Geoinf. 2020, 92, 102173. [Google Scholar] [CrossRef]
- Mizoguchi, T.; Ishii, A.; Nakamura, H. Individual Tree Species Classification Based on Terrestrial Laser Scanning Using Curvature Estimation and Convolutional Neural Network. Int. Arch. Photogramm. Remote Sens. Spat. Inf. Sci. 2019, XLII-2-W13, 1077–1082. [Google Scholar] [CrossRef]
- Nguyen, H.M.; Demir, B.; Dalponte, M. A Weighted SVM-Based Approach to Tree Species Classification at Individual Tree Crown Level Using LiDAR Data. Remote Sens. 2019, 11, 2948. [Google Scholar] [CrossRef]
- Marrs, J.; Ni-Meister, W. Machine Learning Techniques for Tree Species Classification Using Co-Registered LiDAR and Hyperspectral Data. Remote Sens. 2019, 11, 819. [Google Scholar] [CrossRef]
- Dalponte, M.; Frizzera, L.; Gianelle, D. Individual Tree Crown Delineation and Tree Species Classification with Hyperspectral and LiDAR Data. PeerJ 2019, 6, e6227. [Google Scholar] [CrossRef] [PubMed]
- Wang, K.; Wang, T.; Liu, X. A Review: Individual Tree Species Classification Using Integrated Airborne LiDAR and Optical Imagery with a Focus on the Urban Environment. Forests 2018, 10, 1. [Google Scholar] [CrossRef]
- Mizoguchi, T.; Ishii, A.; Nakamura, H.; Inoue, T.; Takamatsu, H. Lidar-Based Individual Tree Species Classification Using Convolutional Neural Network. In Proceedings of the Videometrics, Range Imaging, and Applications XIV; Remondino, F., Shortis, M.R., Eds.; SPIE: Bellingham, WA, USA, 2017; Volume 10332, p. UNSP103320O. [Google Scholar]
- Shen, X.; Cao, L. Tree-Species Classification in Subtropical Forests Using Airborne Hyperspectral and LiDAR Data. Remote Sens. 2017, 9, 1180. [Google Scholar] [CrossRef]
- Matsuki, T.; Yokoya, N.; Iwasaki, A. Hyperspectral Tree Species Classification of Japanese Complex Mixed Forest with the Aid of LiDAR Data. IEEE J. Sel. Top. Appl. Earth Obs. Remote Sens. 2015, 8, 2177–2187. [Google Scholar] [CrossRef]
- Othmani, A.; Voon, L.F.C.L.Y.; Stolz, C.; Piboule, A. Single Tree Species Classification from Terrestrial Laser Scanning Data for Forest Inventory. Pattern Recognit. Lett. 2013, 34, 2144–2150. [Google Scholar] [CrossRef]
- Yao, W.; Krzystek, P.; Heurich, M. Tree Species Classification and Estimation of Stem Volume and DBH Based on Single Tree Extraction by Exploiting Airborne Full-Waveform LiDAR Data. Remote Sens. Environ. 2012, 123, 368–380. [Google Scholar] [CrossRef]
- Dalponte, M.; Bruzzone, L.; Gianelle, D. Tree Species Classification in the Southern Alps Based on the Fusion of Very High Geometrical Resolution Multispectral/Hyperspectral Images and LiDAR Data. Remote Sens. Environ. 2012, 123, 258–270. [Google Scholar] [CrossRef]
- Heinzel, J.; Koch, B. Exploring Full-Waveform LiDAR Parameters for Tree Species Classification. Int. J. Appl. Earth Obs. Geoinf. 2011, 13, 152–160. [Google Scholar] [CrossRef]
- Korpela, I.; Ørka, H.; Maltamo, M.; Tokola, T.; Hyyppä, J. Tree Species Classification Using Airborne LiDAR—Effects of Stand and Tree Parameters, Downsizing of Training Set, Intensity Normalization, and Sensor Type. Silva Fenn. 2010, 44, 156. [Google Scholar] [CrossRef]
- Weiss, U.; Biber, P.; Laible, S.; Bohlmann, K.; Zell, A. Plant Species Classification Using a 3D LIDAR Sensor and Machine Learning. In Proceedings of the 2010 Ninth International Conference on Machine Learning and Applications, Washington, DC, USA, 12–14 December 2010; pp. 339–345. [Google Scholar]
- Voss, M.; Sugumaran, R. Seasonal Effect on Tree Species Classification in an Urban Environment Using Hyperspectral Data, LiDAR, and an Object-Oriented Approach. Sensors 2008, 8, 3020–3036. [Google Scholar] [CrossRef]
- Luo, H.; Khoshelham, K.; Chen, C.; He, H. Individual Tree Extraction from Urban Mobile Laser Scanning Point Clouds Using Deep Pointwise Direction Embedding. ISPRS J. Photogramm. Remote Sens. 2021, 175, 326–339. [Google Scholar] [CrossRef]
- Hamraz, H.; Contreras, M.A.; Zhang, J. Forest Understory Trees Can Be Segmented Accurately within Sufficiently Dense Airborne Laser Scanning Point Clouds. Sci. Rep. 2017, 7, 6770. [Google Scholar] [CrossRef] [PubMed]
- Cui, Z.; Li, X.; Li, T.; Li, M. Improvement and Assessment of Convolutional Neural Network for Tree Species Identification Based on Bark Characteristics. Forests 2023, 14, 1292. [Google Scholar] [CrossRef]
- Kim, T.K.; Hong, J.; Ryu, D.; Kim, S.; Byeon, S.Y.; Huh, W.; Kim, K.; Baek, G.H.; Kim, H.S. Identifying and Extracting Bark Key Features of 42 Tree Species Using Convolutional Neural Networks and Class Activation Mapping. Sci. Rep. 2022, 12, 4772. [Google Scholar] [CrossRef]
- Othmani, A.A.; Jiang, C.; Lomenie, N.; Favreau, J.-M.; Piboule, A.; Voon, L.F.C.L.Y. A Novel Computer-Aided Tree Species Identification Method Based on Burst Wind Segmentation of 3D Bark Textures. Mach. Vis. Appl. 2016, 27, 751–766. [Google Scholar] [CrossRef]
- Whitmore, T.C. Studies in Systematic Bark Morphology. I. Bark Morphology in Dipterocarpaceae. New Phytol. 1962, 61, 191–207. [Google Scholar] [CrossRef]
- Zeidler, E. Springer-Handbuch Der Mathematik I–IV; Springer Fachmedien: Wiesbaden, Germany, 2013. [Google Scholar]
- Brieskorn, E. Lineare Algebra Und Analytische Geometrie III; Springer Spektrum: Wiesbaden, Germany, 2019; Volume III. [Google Scholar]
- Bronstein, I.N.; Semendjajew, K.A.; Zeideler, E.; Herausgeber, W. Teubner-Taschenbuch Der Mathematik; B. G. Teubner Stuttgart: Leibzig, Germany, 1996. [Google Scholar]
- Barner, M.; Flor, F. Analysis II; de Gruyter: Berlin, Germany; New York, NY, USA, 1989. [Google Scholar]
- Landis, J.R.; Koch, G.G. The Measurement of Observer Agreement for Categorical Data. Biometrics 1977, 33, 159–174. [Google Scholar] [CrossRef]
- R Core Team R: A Language and Environment for Statistical Computing; R Foundation for Statistical Computing: Vienna, Austria, 2021.
- Salbitano, F.; Borelli, S.; Conigliaro, M.; Chen, Y. Guidelines on Urban and Peri-Urban Forestry; FAO Forestry Paper; Food and Agriculture Organization of the United Nations: Rome, Italy, 2016; ISBN 978-92-5-109442-6. [Google Scholar]
- Edgar, C.B.; Nowak, D.J.; Majewsky, M.A.; Lister, T.W.; Westfall, J.A.; Sonti, N.F. Strategic National Urban Forest Inventory for the United States. J. For. 2020, 119, 86–95. [Google Scholar] [CrossRef]
- Morgenroth, J.; Östberg, J. Measuring and Monitoring Urban Trees and Urban Forests. In Routledge Handbook of Urban Forestry; Routledge: London, UK, 2017; pp. 33–48. [Google Scholar]
- Whitmore, T.C. Studies in Systematic Bark Morphology: IV. The Bark of Beech, Oak and Sweet Chestnut. New Phytol. 1963, 62, 161–169. [Google Scholar] [CrossRef]


| Species | n | Mean Diameter, m |
|---|---|---|
| Acer platanoides | 18 | 0.29 ± 0.06 |
| Fraxinus excelsior | 14 | 0.22 ± 0.05 |
| Robinia pseudoacacia | 17 | 0.59 ± 0.15 |
| Larix decidua | 17 | 0.30 ± 0.05 |
| Fagus sylvatica | 19 | 0.72 ± 0.29 |
| Parameter | Acronym | Explanation |
|---|---|---|
| Geometric description | ||
| Follow cluster left/right | CL-LR | The subsequent cluster of the rib is oriented to the right or left. |
| Follow clusters form diagonal left/right | CL-D | The sum of the subsequent clusters of a rib form diagonals that run to the right or left. |
| Follow clusters vertical | CL-V | The subsequent cluster of a rib is located vertically below its predecessor. |
| Follow clusters horizontal | CL-H | The subsequent cluster of a rib is located horizontally next to its predecessor. |
| Follow clusters branched | CL-B | The subsequent clusters of a rib form a branch. |
| Follow clusters in right angle left | CL-AL | The angle formed between a subsequent cluster (to the left of the perpendicular) and a perpendicular that intersects the predecessor. |
| Follow clusters in right angle right | CL-AR | The angle formed between a subsequent cluster (to the right of the perpendicular) and a perpendicular that intersects the predecessor. |
| Rib characteristics | ||
| Horizontal behavior | The horizontal proportion of gradients, slopes, and horizontal components in a bark grid. | |
| Rib spacing | The distance between two rib clusters. | |
| Roughness | The roughness is defined by the sum of all cluster points with a higher or lower ε value of a rib. | |
| Proportion of smooth surface | Proportion of smooth to rough (ribbed) surface. |
| Accuracy | Roc Auc | κ | |
|---|---|---|---|
| Decision tree | 0.83 | 0.943 | ❌ |
| Random forests | 0.916 | 0.985 | ❌ |
| XGBoost | 0.96 | ❌ | 0.95 |
| Support vector machines | 0.92 | ❌ | 0.9 |
Disclaimer/Publisher’s Note: The statements, opinions and data contained in all publications are solely those of the individual author(s) and contributor(s) and not of MDPI and/or the editor(s). MDPI and/or the editor(s) disclaim responsibility for any injury to people or property resulting from any ideas, methods, instructions or products referred to in the content. |
© 2024 by the authors. Licensee MDPI, Basel, Switzerland. This article is an open access article distributed under the terms and conditions of the Creative Commons Attribution (CC BY) license (https://creativecommons.org/licenses/by/4.0/).
Share and Cite
Rust, S.; Stoinski, B. Enhancing Tree Species Identification in Forestry and Urban Forests through Light Detection and Ranging Point Cloud Structural Features and Machine Learning. Forests 2024, 15, 188. https://doi.org/10.3390/f15010188
Rust S, Stoinski B. Enhancing Tree Species Identification in Forestry and Urban Forests through Light Detection and Ranging Point Cloud Structural Features and Machine Learning. Forests. 2024; 15(1):188. https://doi.org/10.3390/f15010188
Chicago/Turabian StyleRust, Steffen, and Bernhard Stoinski. 2024. "Enhancing Tree Species Identification in Forestry and Urban Forests through Light Detection and Ranging Point Cloud Structural Features and Machine Learning" Forests 15, no. 1: 188. https://doi.org/10.3390/f15010188
APA StyleRust, S., & Stoinski, B. (2024). Enhancing Tree Species Identification in Forestry and Urban Forests through Light Detection and Ranging Point Cloud Structural Features and Machine Learning. Forests, 15(1), 188. https://doi.org/10.3390/f15010188