Article

A Deep Learning Method for Log Diameter Measurement Using Wood Images Based on Yolov3 and DeepLabv3+

1
School of Physical Science & Technology, Guangxi University, Nanning 530004, China
2
School of Electrical Engineering, Guangxi University, Nanning 530004, China
3
Guangxi Academy of Sciences, Nanning 530007, China
*
Authors to whom correspondence should be addressed.
Forests 2024, 15(5), 755; https://doi.org/10.3390/f15050755
Submission received: 21 March 2024 / Revised: 21 April 2024 / Accepted: 24 April 2024 / Published: 25 April 2024
(This article belongs to the Section Wood Science and Forest Products)

Abstract

:
Wood volume is an important indicator in timber trading, and log diameter is one of the primary parameters used to calculate wood volume. Currently, the most common methods for measuring log diameters are manual measurement or visual estimation by log scalers, which are laborious, time consuming, costly, and error prone owing to the irregular placement of logs and large numbers of roots. Additionally, this approach can easily lead to misrepresentation of data for profit. This study proposes a model for automatic log diameter measurement that is based on deep learning and uses images to address the existing problems. The specific measures to improve the performance and accuracy of log-diameter detection are as follows: (1) A dual network model is constructed combining the Yolov3 algorithm and DeepLabv3+ architecture to adapt to different log-end color states that considers the complexity of log-end faces. (2) AprilTag vision library is added to estimate the camera position during image acquisition to achieve real-time adjustment of the shooting angle and reduce the effect of log-image deformation on the results. (3) The backbone network is replaced with a MobileNetv2 convolutional neural network to migrate the model to mobile devices, which reduces the number of network parameters while maintaining detection accuracy. The training results show that the mean average precision of log-diameter detection reaches 97.28% and the mean intersection over union (mIoU) of log segmentation reaches 92.22%. Comparisons with other measurement models demonstrate that the proposed model is accurate and stable in measuring log diameter under different environments and lighting conditions, with an average accuracy of 96.26%. In the forestry test, the measurement errors for the volume of an entire truckload of logs and a single log diameter are 1.20% and 0.73%, respectively, which are less than the corresponding error requirements specified in the industry standards. These results indicate that the proposed method can provide a viable and cost-effective solution for measuring log diameters and offering the potential to improve the efficiency of log measurement and promote fair trade practices in the lumber industry.

1. Introduction

Taking log diameter and length measurements are essential and recurring tasks in forestry work that provide vital data for calculating log volume [1]. Through analyzing these data, forest plantation plans can be better managed. With the development of technology, harvesting machines have been commonly used to achieve equal-length felling of logs. However, manual methods are still being employed for log diameter measurements. This type of measurement method has a high work intensity, is time-consuming, and the results are often subjective. This may lead to exaggerated or falsely reported data from the measurers for personal interests that negatively affect the fairness of market transactions [2,3]. At present, there are relatively few mature, commercially available methods for detecting log diameters. Therefore, the development of a new method for the rapid and objective measurement of log diameters is of practical importance. It would assist trading parties in promptly verifying timber quantities and preventing log substitution or theft during a transportation. Moreover, it would enable forest managers to better understand tree-related data, thereby enhancing forest resource management effectiveness.
With technology advancing, researchers are actively exploring efficient approaches for detecting and measuring logs. These methods are primarily categorized into laser-based approaches [4,5,6] and vision-based methods, depending on how log data is acquired. While laser measurement can collect more precise image data, vision-based methods offer advantages in terms of equipment cost and portability. Computer vision technology has undergone tremendous development over the past few decades, offering new possibilities for log-diameter measurements. Image processing techniques are commonly used for fast-diameter estimation, and several studies have been conducted by scholars centered around these aspects of log-region detection, log-end segmentation, and log-profile counting. Chen et al. [7] proposed a method to detect log-diameter classes using binocular vision. They achieved log-area detection by using a maximum threshold and connectivity domain identification, and the log diameter was obtained by fitting a mathematical model to the segmented end face using the reconstructed 3D coordinates. Lin et al. [8] proposed a contour-recognition method for bundled logs. This method combined principal component analysis [9] with histogram statistics in the hue, saturation, and value (HSV) color space [10] to analyze the color features of the pictures to separate the log-end faces. Finally, the diameter of each identified log was obtained by applying reference-scale pixel calculations. Xinxiu et al. [11] obtained log pixels by transforming an image into the CIELAB color space [12] and realizing K-means clustering [13] for the A and B color channels on the transformed image. The clustering results were then subjected to the Hough transform [14], and the log root count was realized by Hough fitting to the logs while realizing the segmentation of the connected region. The counting accuracy was 95.78%. Although many log-measurement methods based on traditional image-processing techniques have been proposed, these approaches have strict requirements for lighting, log shape, shading degree, and background. Images taken in an actual forestry field have interference factors that make it difficult for the above methods to be widely used for log-diameter measurement, such as different degrees of log shading, irregular cutting, and uneven lighting.
In recent years, convolutional neural networks that can effectively learn features from training samples, particularly in image data analysis, have been widely used in agriculture and forestry. Kuznetsova et al. [15] used Yolov3 as the detection system for a fruit-picking robot and achieved the results, with an average apple detection time of 19 ms, 7.8% misidentified apples, and 9.2% unidentified apples. Cai et al. [16] proposed a method for segmenting spotted fragrant tree leaf images using a modified DeepLabv3+ network. The model exhibited excellent segmentation performance for different levels of scattered spot segmentation that could quickly assess the disease condition, and thus contributed to garden conservation. Zhu et al. [17] proposed a two-stage DeepLabv3+ algorithm with adaptive losses to segment apple leaf disease images in complex scenarios. The model achieved intersection-over-union (IoU) values of 98.70% for leaf segmentation and 86.56% for spot extraction, providing an effective solution for leaf and disease spot extraction in complex environments. There have also been studies using convolutional neural networks to detect log-ends. Samdangdech et al. [18] achieved detection and counting of log sections at the end of lumber trucks by labeling segmentation of pixel points in log end and non-log region through the Single Shot MultiBox Detector (SSD) [19] and VGG16 network [20]. Lin et al. [21] designed a wood volume detection system combining yolov3-tiny and Hough transforms with good robustness.
Single-stage object-detection algorithms have been proposed to improve detection speed in the field of object detection, such as the SSD and You Only Look Once (YOLO) algorithms [22]. Unlike the SSD series, which has redundant parameters and a large model structure, the YOLO series is characterized by its simple structure and fast recognition speed [23]. In the YOLO families, Yolov3 performs better in detecting dense and small objects than other versions, and its stability and reliability have been confirmed in research. Detecting logs is essentially a single-class dense object detection, so Yolov3 is very viable for detecting the end of logs. However, the ultimate goal is to obtain log diameters, and traditional image processing methods cannot adapt well to tightly packed logs with complex end conditions. Therefore, a new end-faces segmentation method is needed. Chen et al. [24] first proposed the DeepLab series of networks as a representative algorithm for semantic segmentation based on the VGG16 network. DeepLabv3+ was proposed after continuous optimization and improvement, which adopts an encoder-decoder system and strengthens the decoder section [25]. Consequently, the model can achieve good results at the edges of semantic segmentation. Compared to segmentation based on image hue and grayscale, semantic segmentation offers better segmentation performance by dividing images into different objects from a pixel perspective. Using Deeplabv3+ for log-end segmentation can prevent the phenomenon of logs adhering to adjacent end surfaces during the image processing of timber, which will result in expansion of the log area, causing an error in the fitting range that in turn affects the log-diameter measurement results.
This study proposes a real-time, criteria-compliant, two-neural-network combination method to measure log diameters at forestry sites. Compared to traditional methods, this approach offers greater adaptability, is capable of handling various lighting conditions, and facilitates a more convenient detection process. First, the applicability of the Yolov3 algorithm and DeepLabv3+ architecture for log-diameter measurements was evaluated using a log-image dataset. Second, AprilTag vision library was used to correct the shooting angle and reduce the influence of the images on the log-diameter measurement data during measurements. Finally, the log-measurement model was tested to verify its feasibility and effectiveness in a forestry farm.

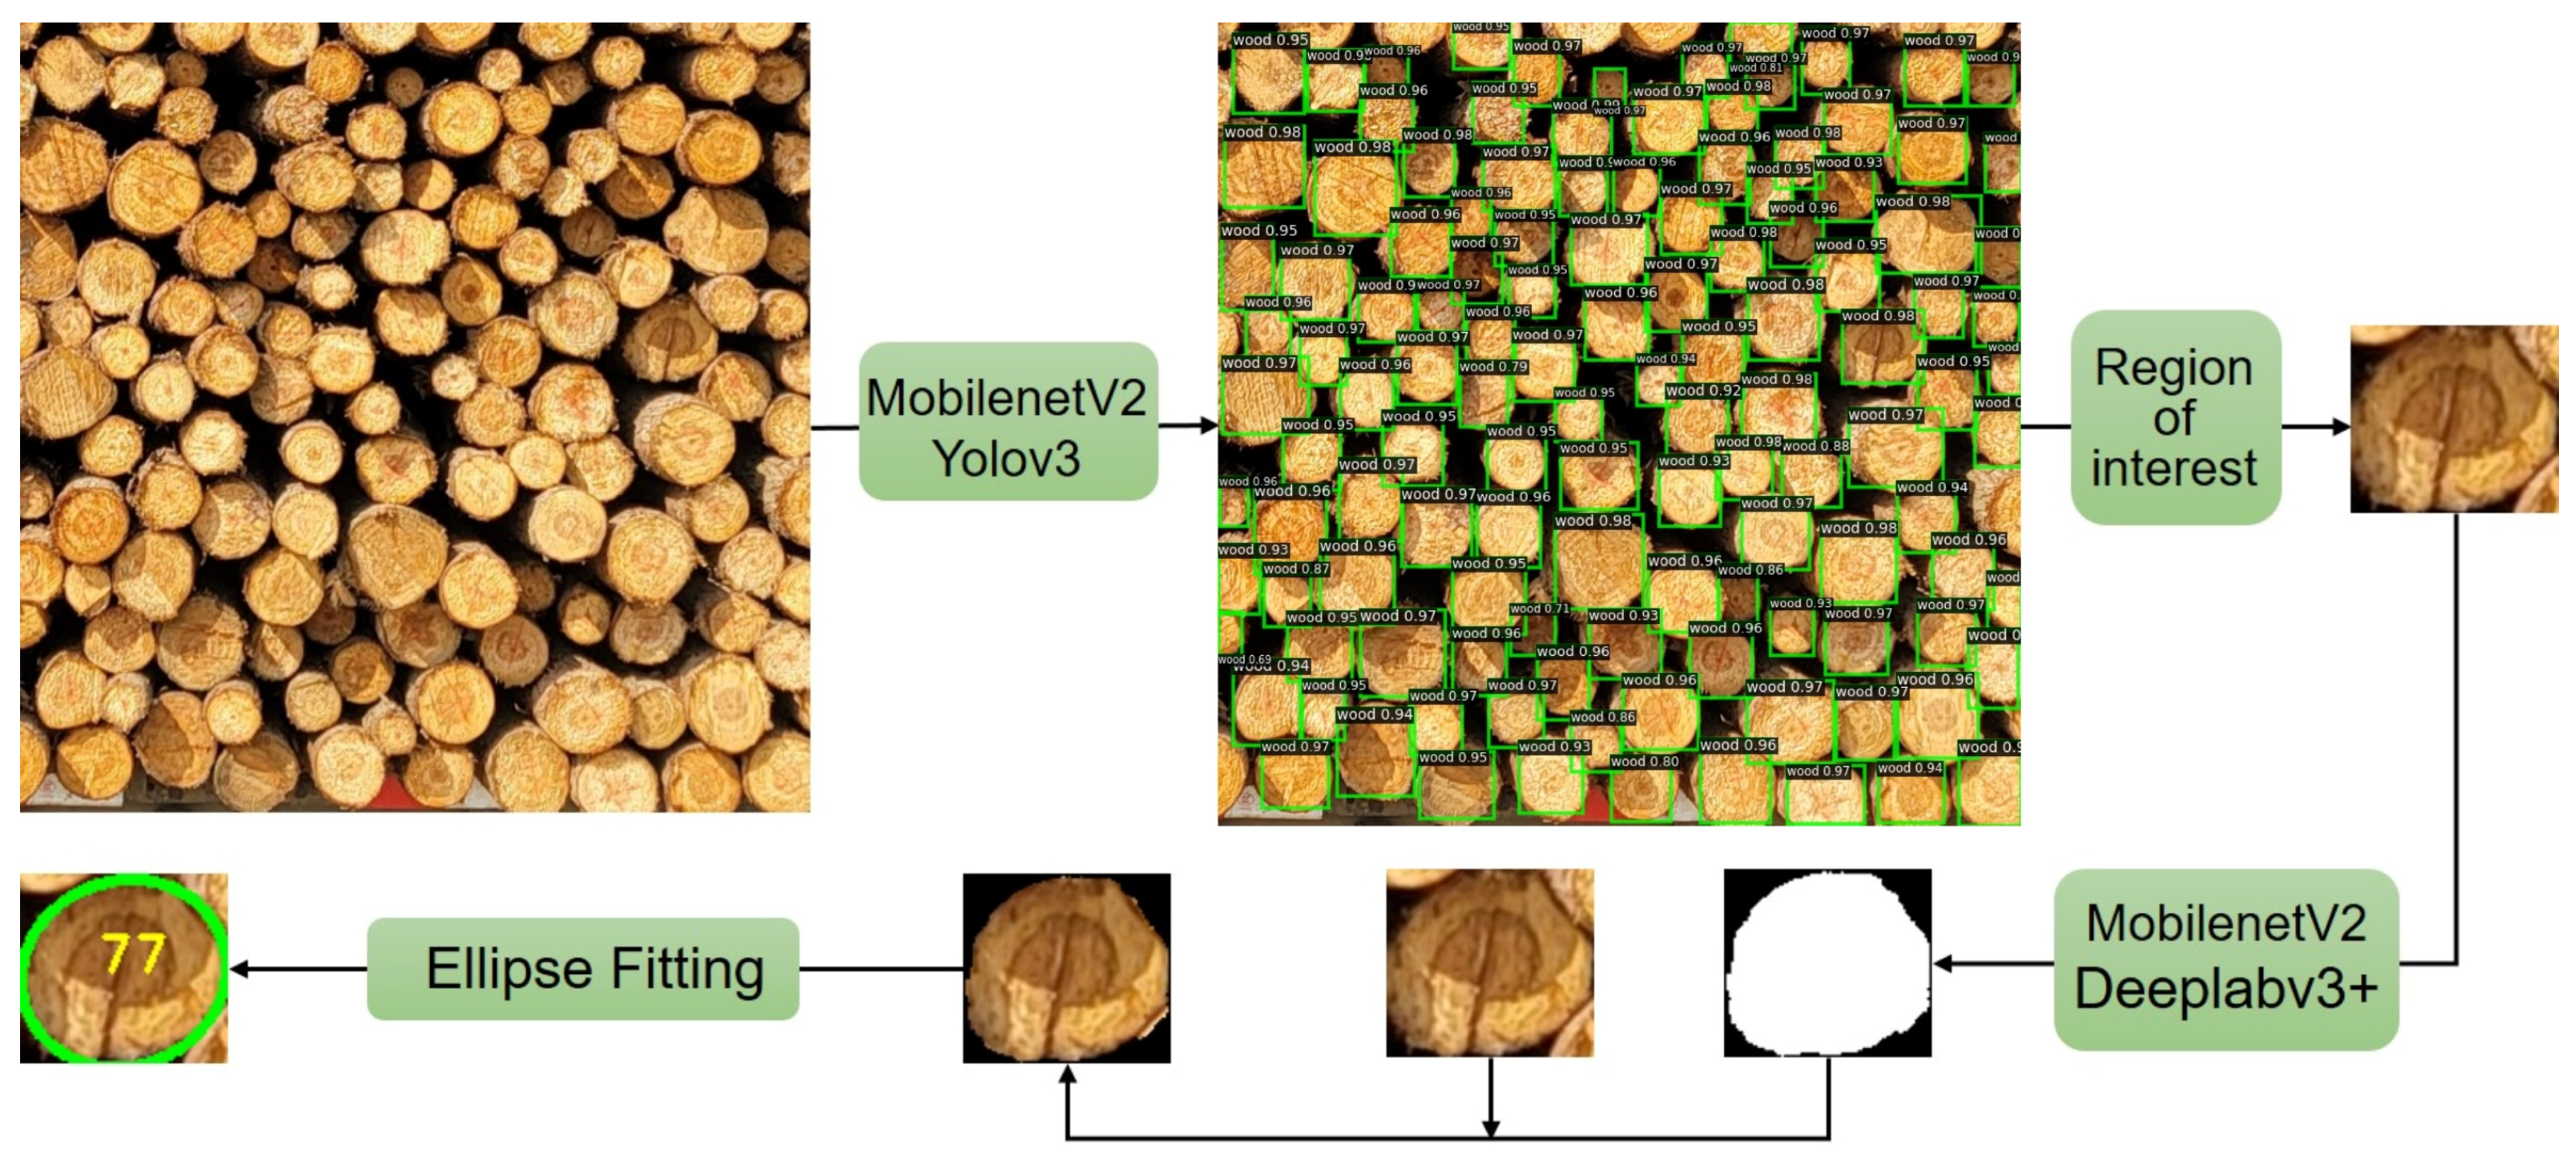
2. Materials and Methods
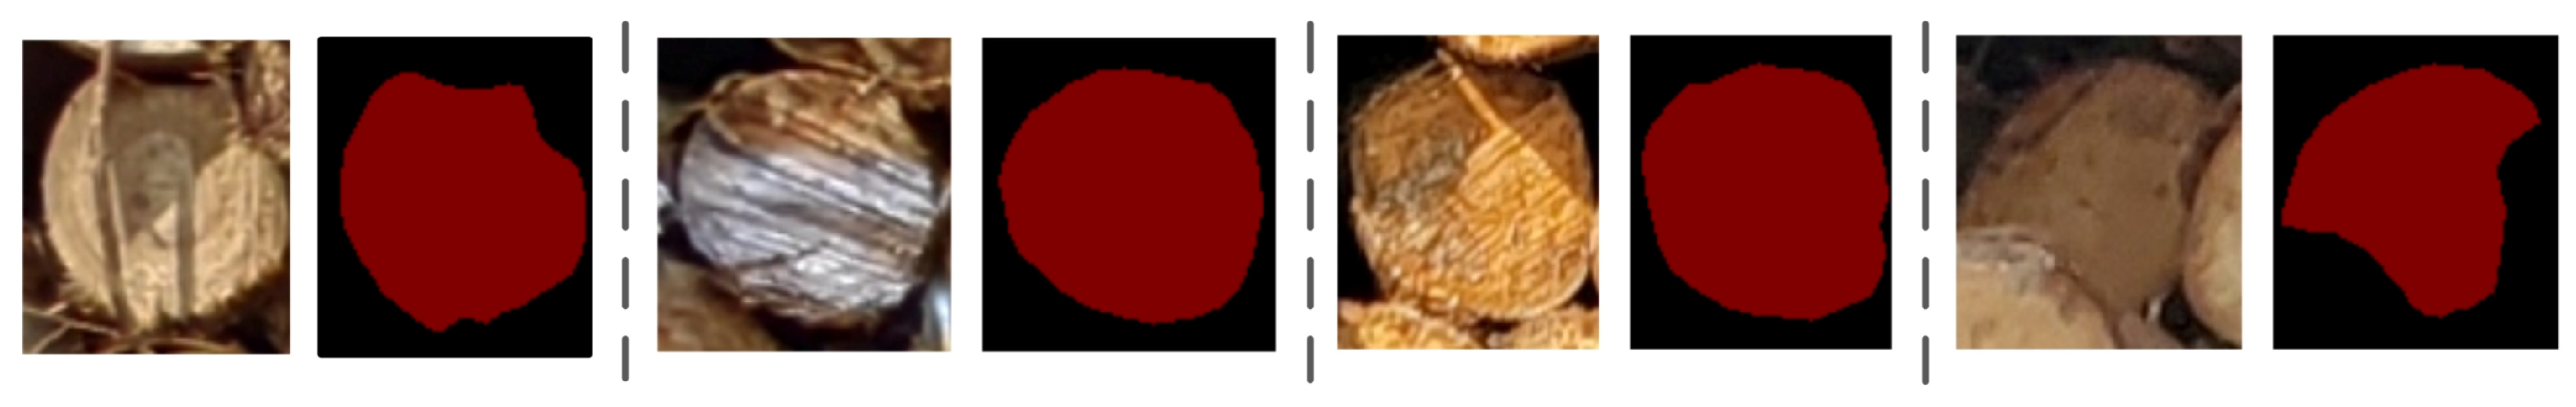
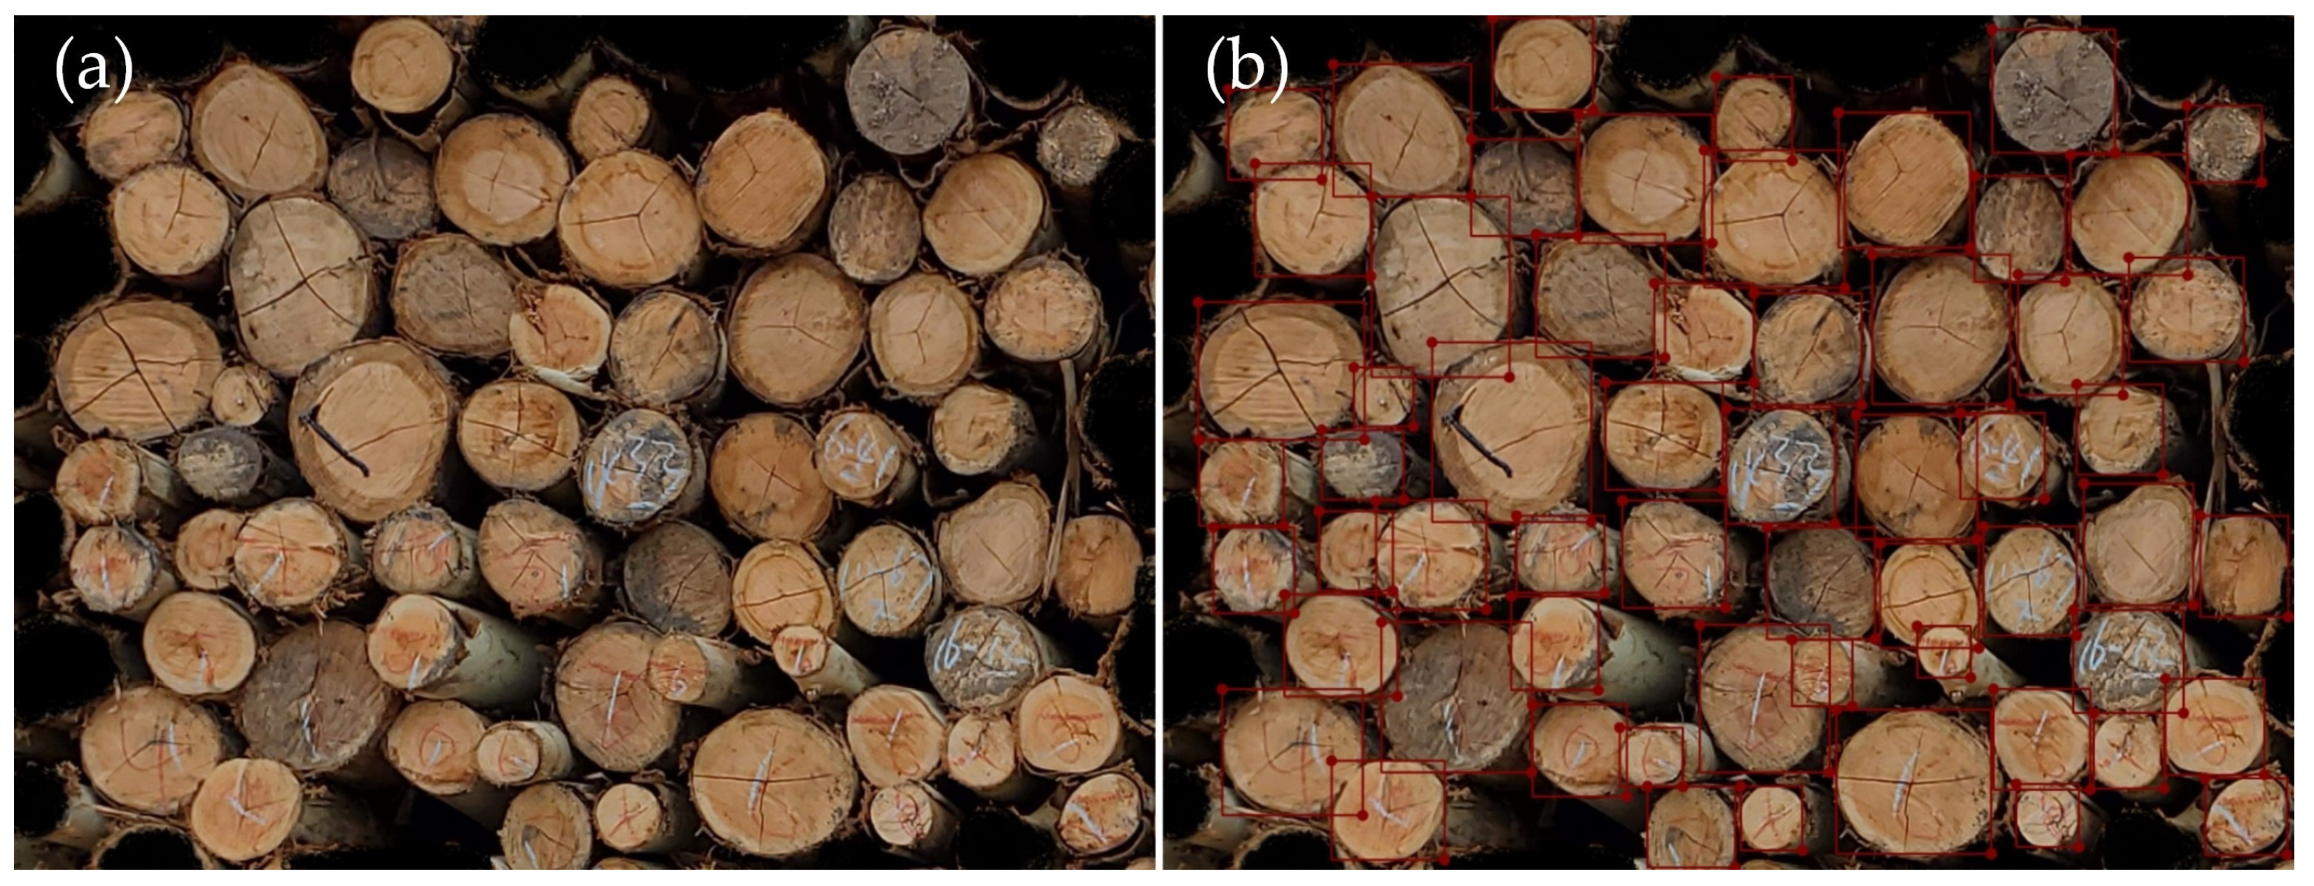
The log diameter measurement consisted of two steps: obtaining an image with the aid of AprilTag and obtaining the log diameter by processing the image using the trained model. The steps of the model used to obtain the log diameter are shown in Figure 1. First, single logs in the wood pile were separated using the MobileNetv2-Yolov3 network, and the pixel coordinates of each log were obtained relative to the image. Second, a single log image was input into the MobileNetv2-DeepLabv3+ network to separate the log-end face and obtain the contours. Finally, the log diameter was obtained by fitting based on the log contours. When manually measuring the diameter, the shortest direction of the log section was considered to be its diameter. To accommodate this characteristic, an ellipse was utilized to fit the end face, with the short axis value of the ellipse being regarded as the diameter. The MobileNetv2-Yolov3 and MobileNetv2-DeepLabv3+ network structures are presented in Section 2.2. The optimal angle adjusted according to the AprilTag is described in Section 2.3.

2.1. Dataset

The images used in this study were obtained from eucalyptus trees that were felled in a forest in Nanning, Guangxi, China. The images depicted the stacked log-ends at the side or back of a vehicle, as shown in Figure 2a,b, respectively. The imaging device is a SAMSUNG Galaxy S10+ smartphone equipped with the SM-G9750 sensor, featuring a primary camera boasting 12 million pixels. The focal length and aperture of the camera remained constant throughout the entire shooting process. A total of 25 photographs were captured using a smartphone under natural light, with the logs positioned at the center of the photograph; the cut sections were free of visible obstructions such as foliage. The number of logs in each picture ranged from 500–700. A training dataset of 56 images was obtained for Yolov3 after the non-overlapping cropping of the images. The DeepLabv3+ training dataset consisted of 750 images of individual logs recognized by Yolov3. Both datasets were labeled using the LabelImg annotation tool and randomly divided into training, testing, and validation datasets at common ratios of 70%, 20%, and 10%, respectively. The original images and Yolov3 labels from an annotation tool that assigned rectangular ground-truth bounding boxes to the log-end faces are shown in Figure 3a,b, respectively. In the annotation process of the YOLOv3 dataset, there are some rules that should be noted: First, it is imperative that the bounding boxes enclose all pixels of the target. Even in instances where the target is partially occluded, it is essential to select bounding boxes that encompass the complete set of relevant pixels, drawing upon experiences. Second, it is crucial to ensure that the starting or ending point of the annotation box does not coincide with the edges of the image. Failure to do so may result in errors during data processing by the network. The annotated data labels for DeepLabv3+ were converted into binary images, as shown in Figure 4, where red and black represent the log-section labeling and background, respectively.

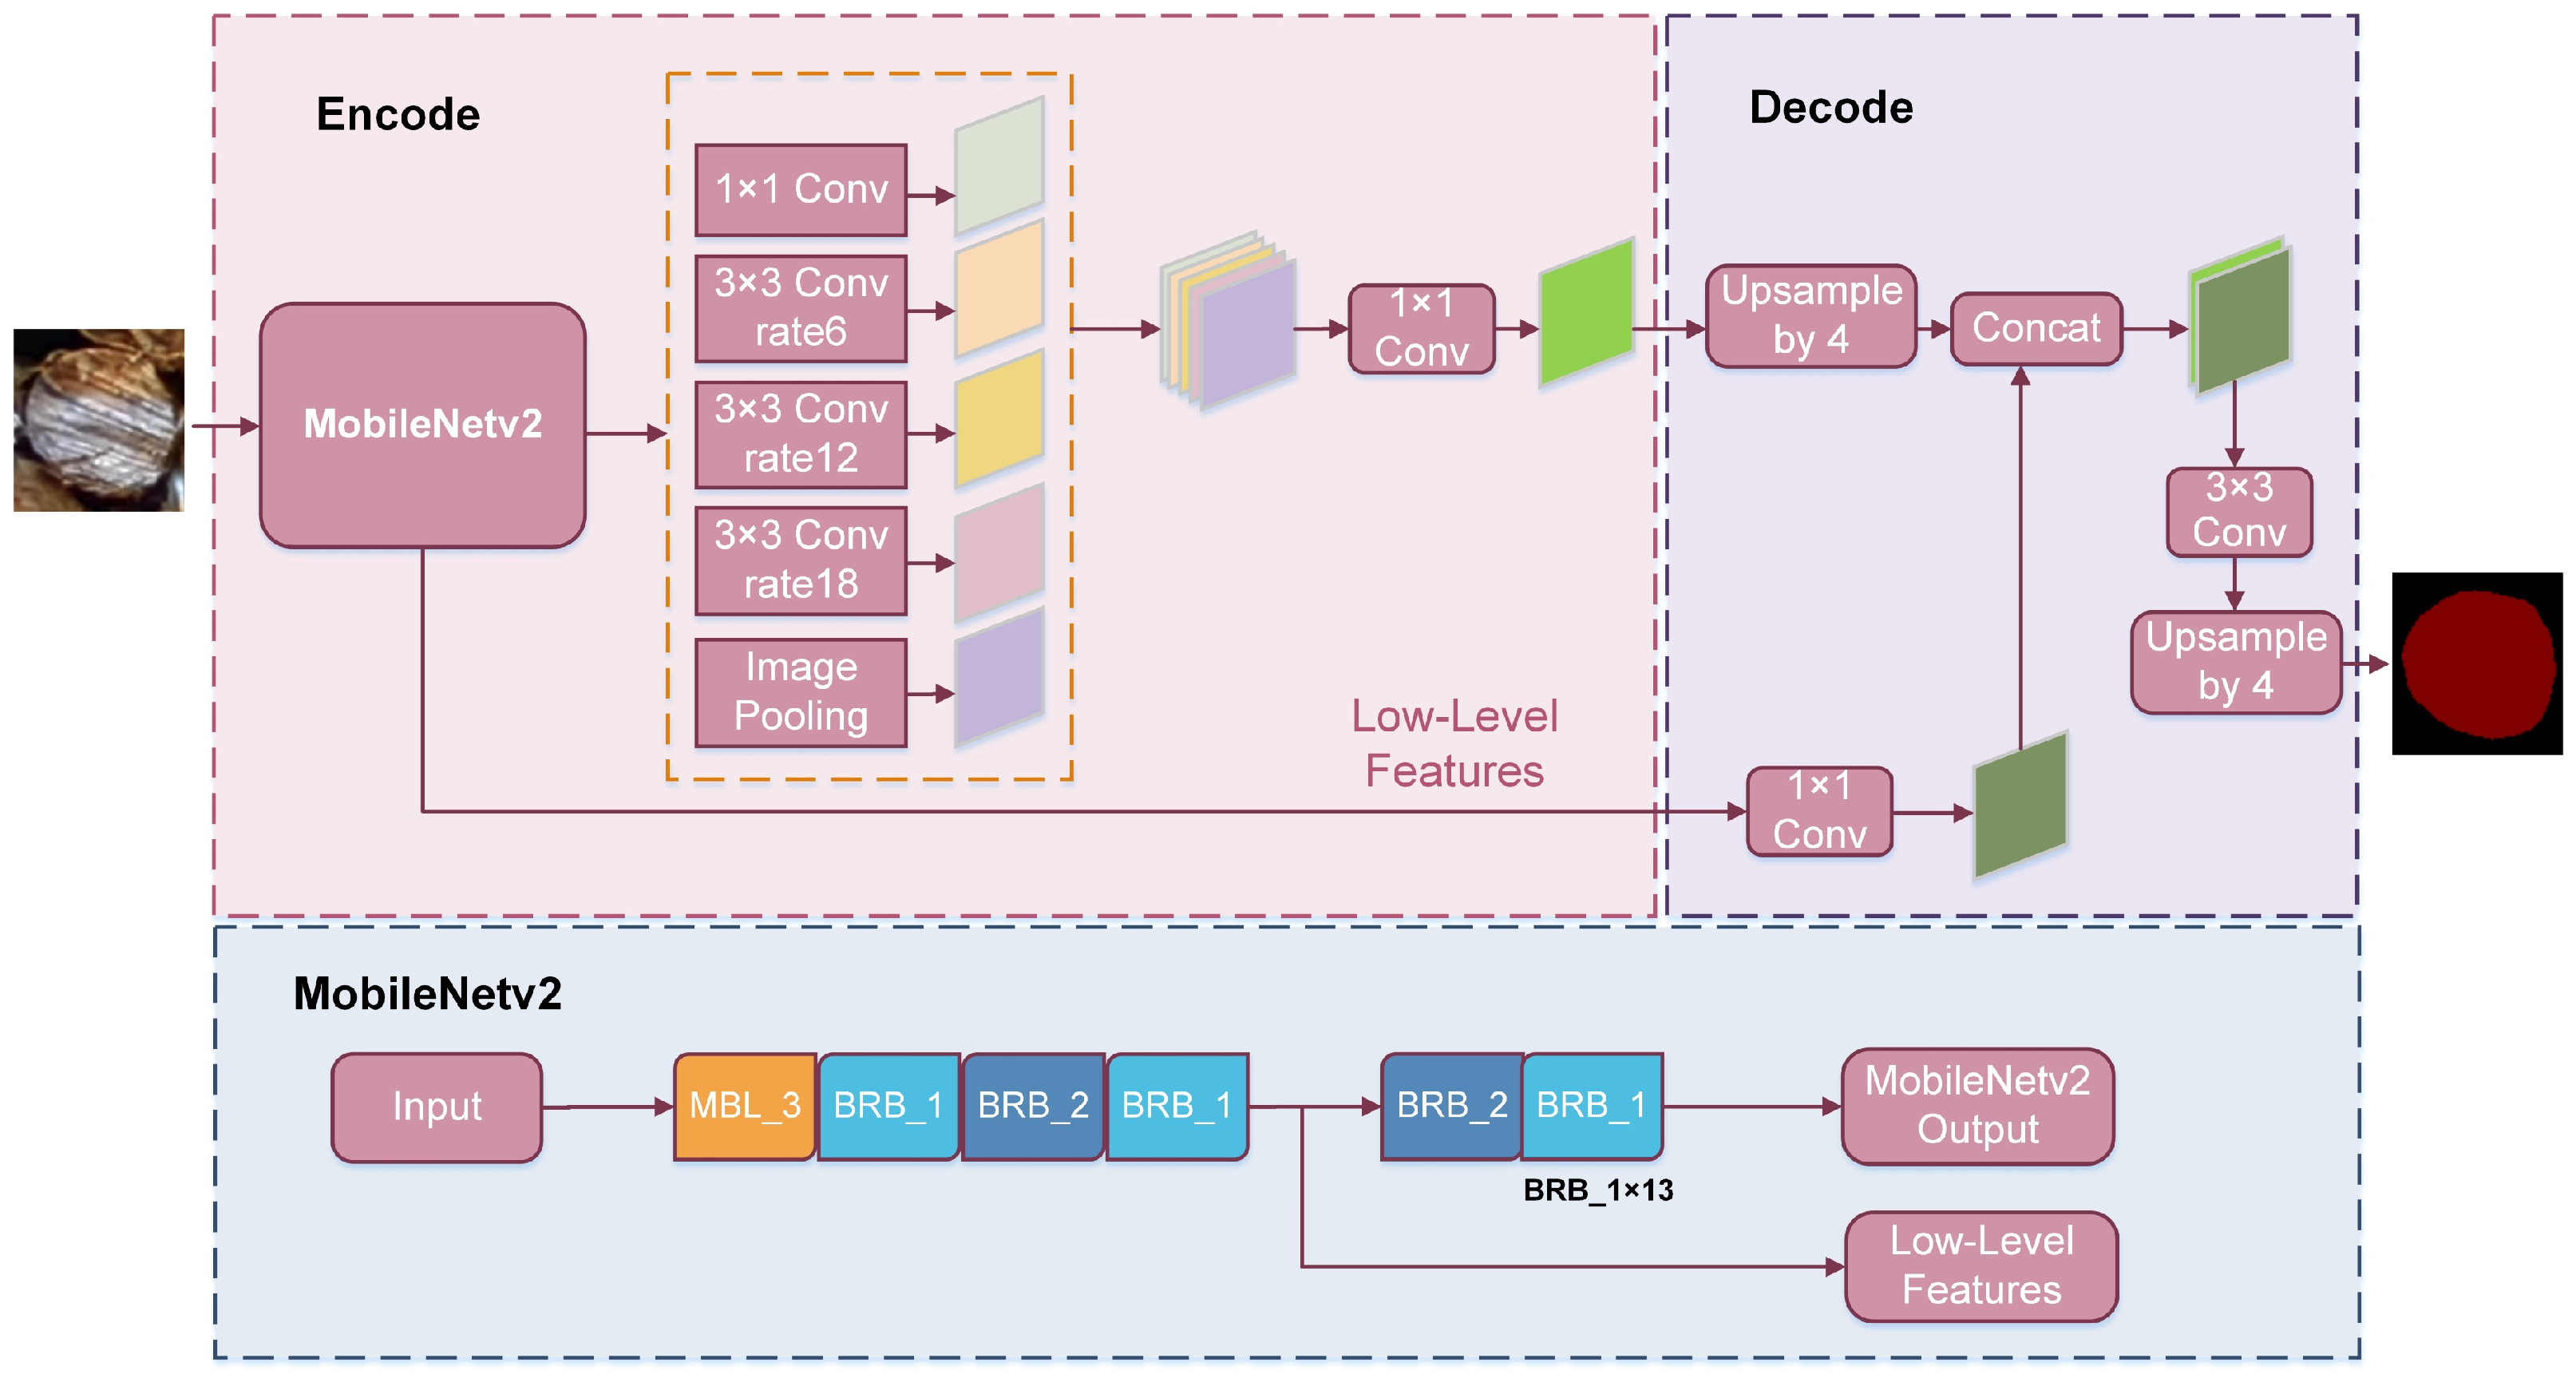
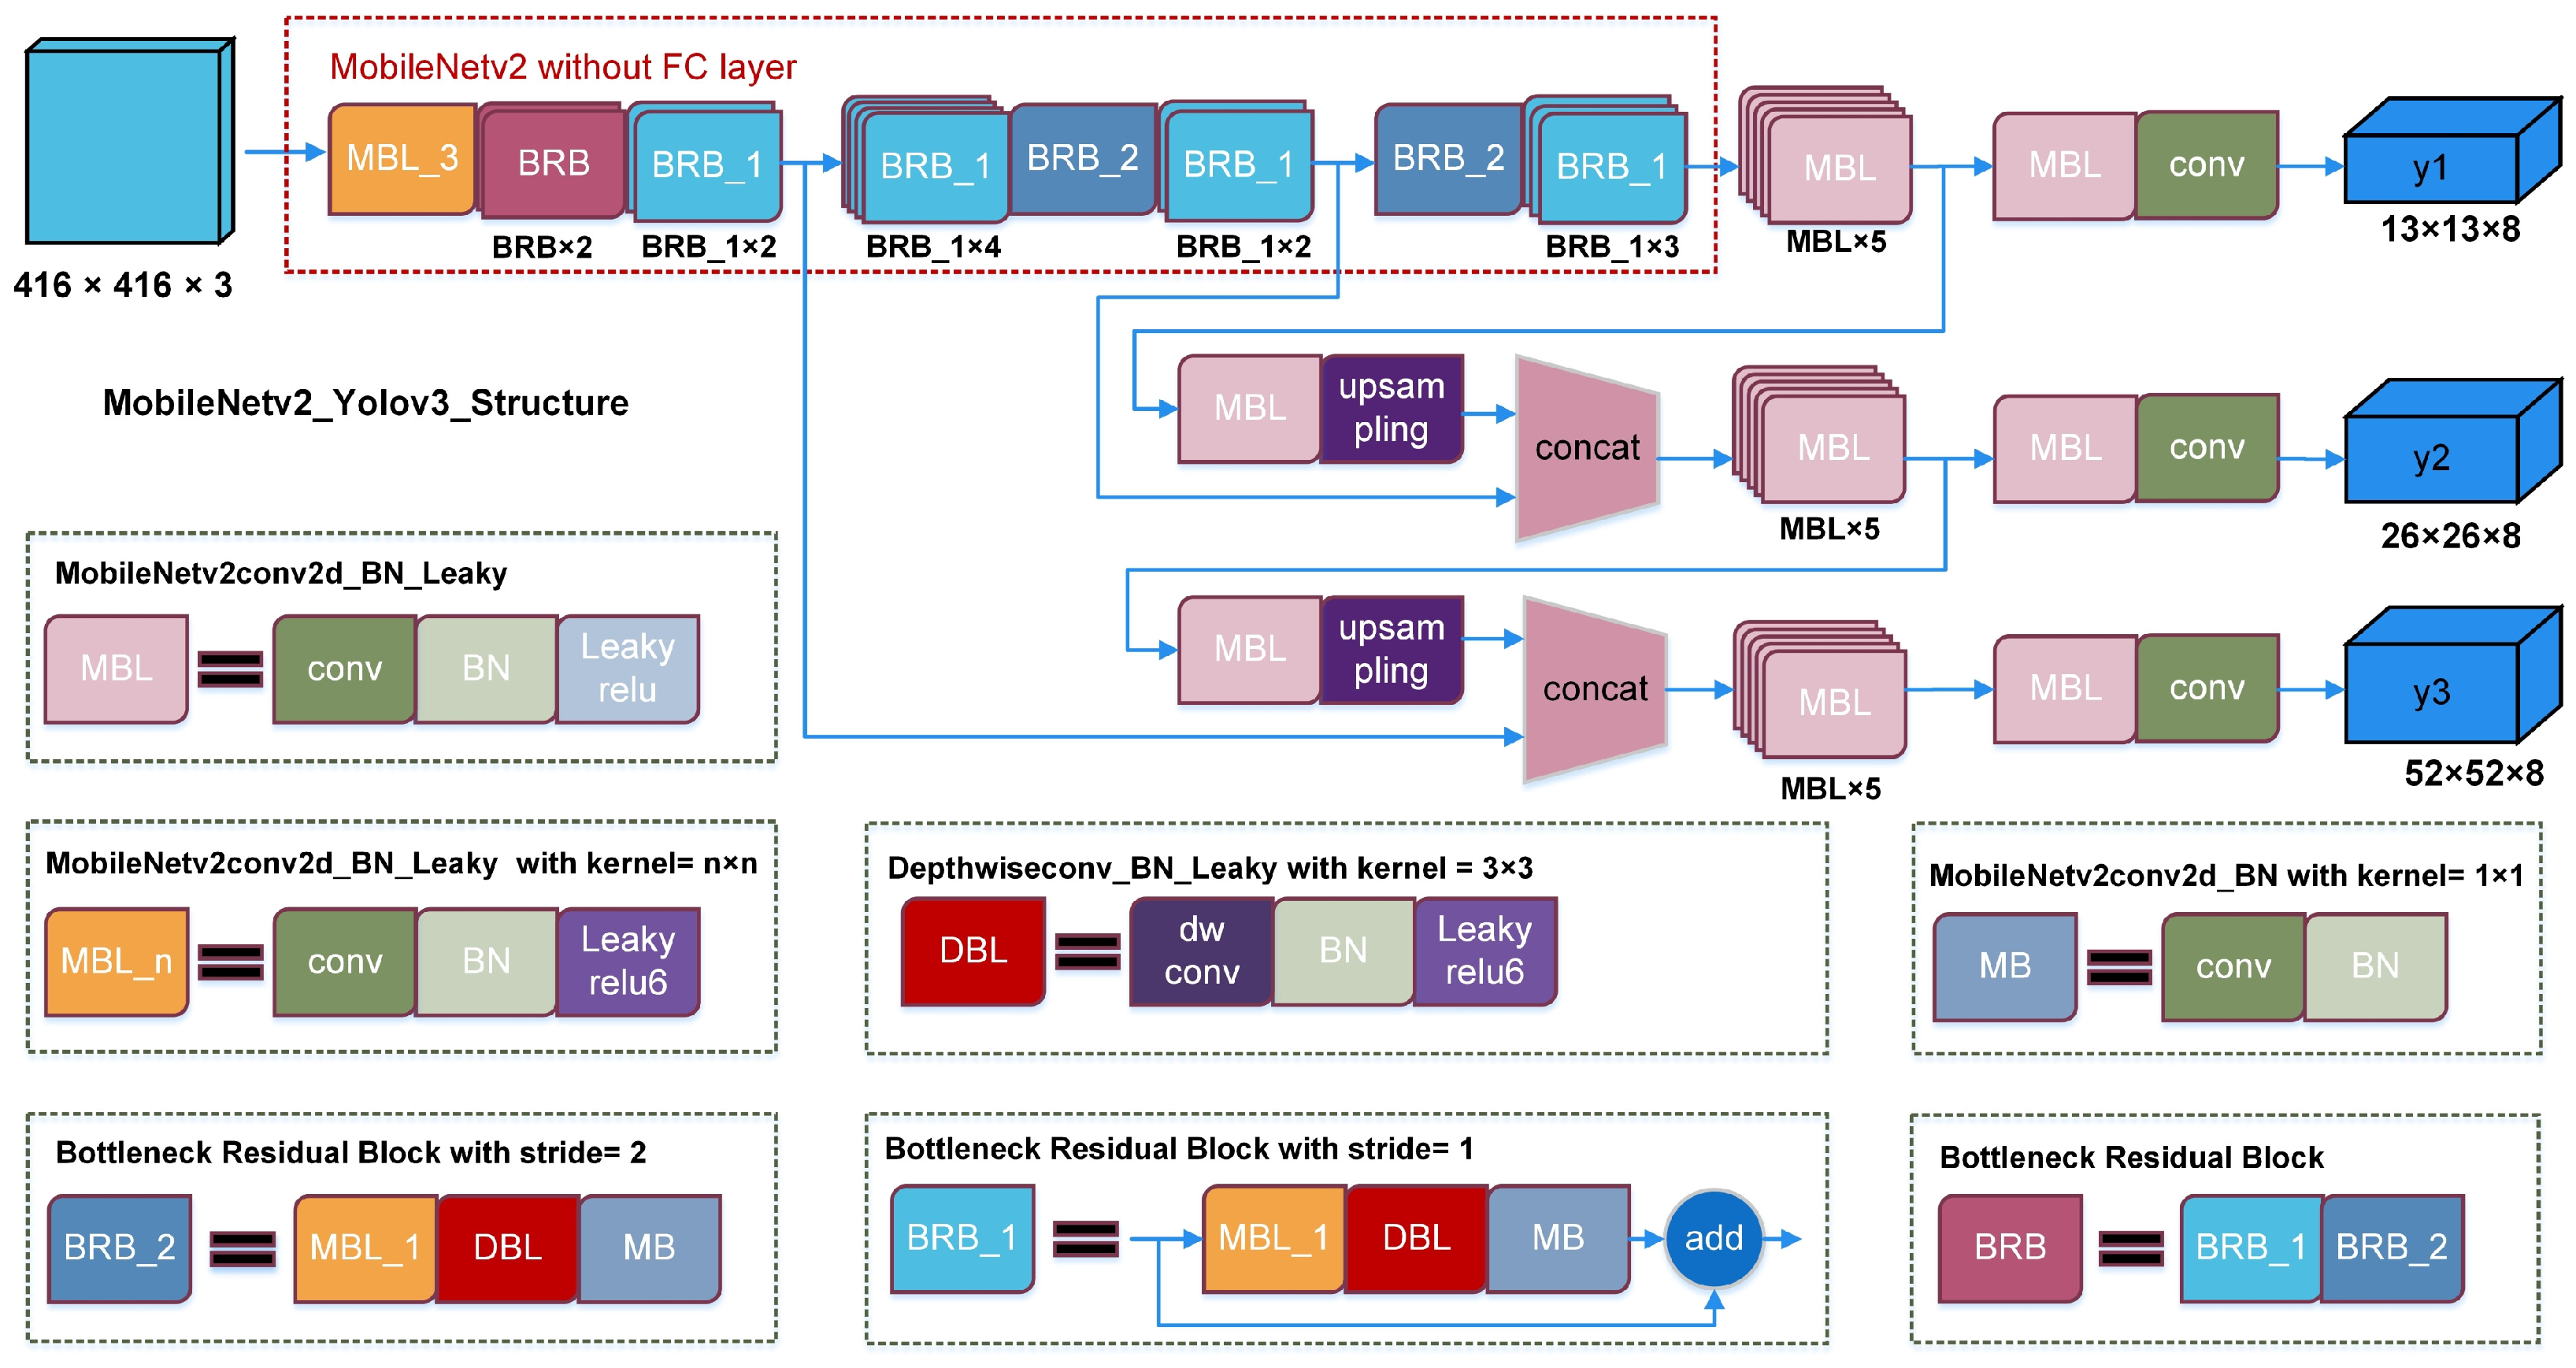
2.2. Backbone Feature Extraction Network

MobileNetV1 is a lightweight model that was proposed by Google in 2017 for cell phones [26]. MobileNetv2 is an upgraded version of MobileNetv1 that includes a bottleneck residual block (BRB) module consisting of three parts: a 1 × 1 convolution to increase the dimensionality of input features, 3 × 3 depth-separable convolution to extract features, and 1 × 1 convolution to reduce dimensionality [27]. Thus, MobileNetv2 achieves higher accuracy while maintaining a smaller model size. This is beneficial for migrating subsequent models to portable devices.
The Darknet53 backbone was replaced with MobileNetv2 in the Yolov3 network, which changed the feature image fusion method. However, the other network structures remained unchanged, as shown in the network structure diagram in Figure 5. Here, the red dashed rectangle represents the MobileNetv2 network structure. After replacement, the output of the 14th BRB was fused with an upsampled 13 × 13 feature image to obtain a 26 × 26 feature map for the 416 × 416 input image. In addition, the output of the 7th BRB was fused with an upsampled 26 × 26 feature image to obtain a 52 × 52 feature map.
Modified Aligned Xception is traditionally used for the backbone feature extraction network. Here, it was replaced with the lightweight MobileNetv2 in the encoder section of DeepLabv3+. The network structure after the replacement is shown in Figure 6. The MobileNetv2 portion of the figure shows the specific structure of the replaced backbone network and number of low-level feature output layers.

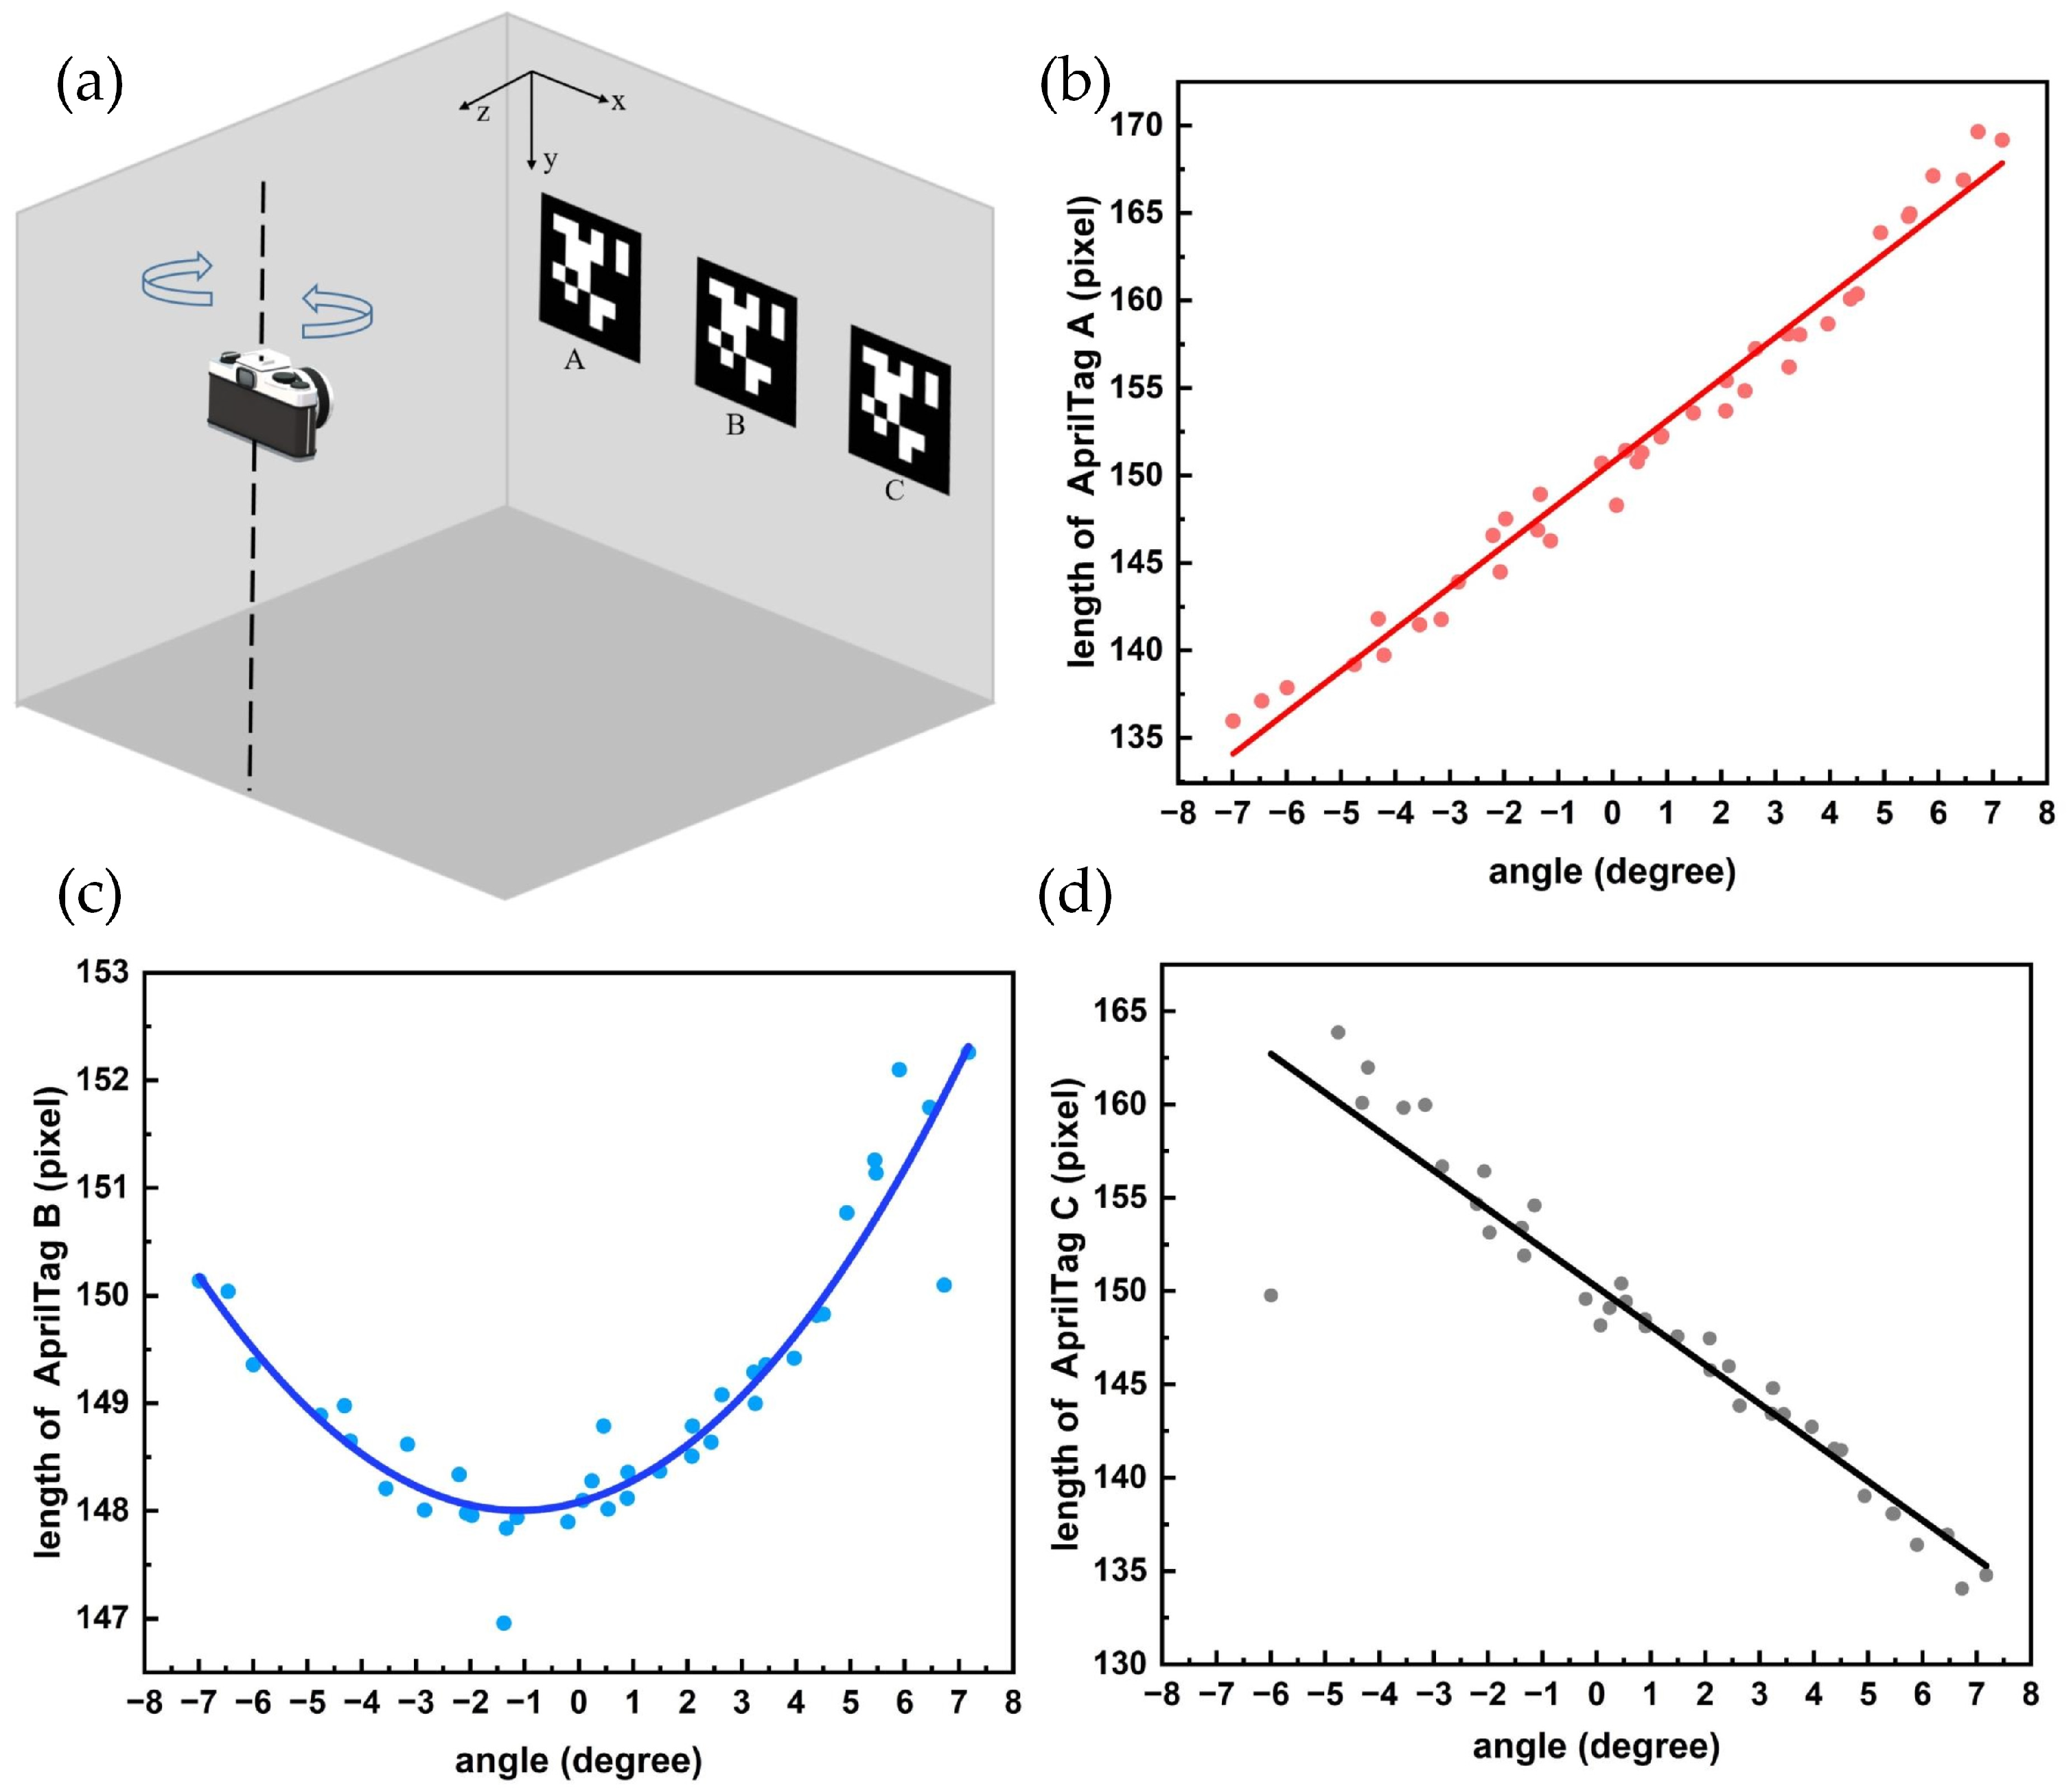
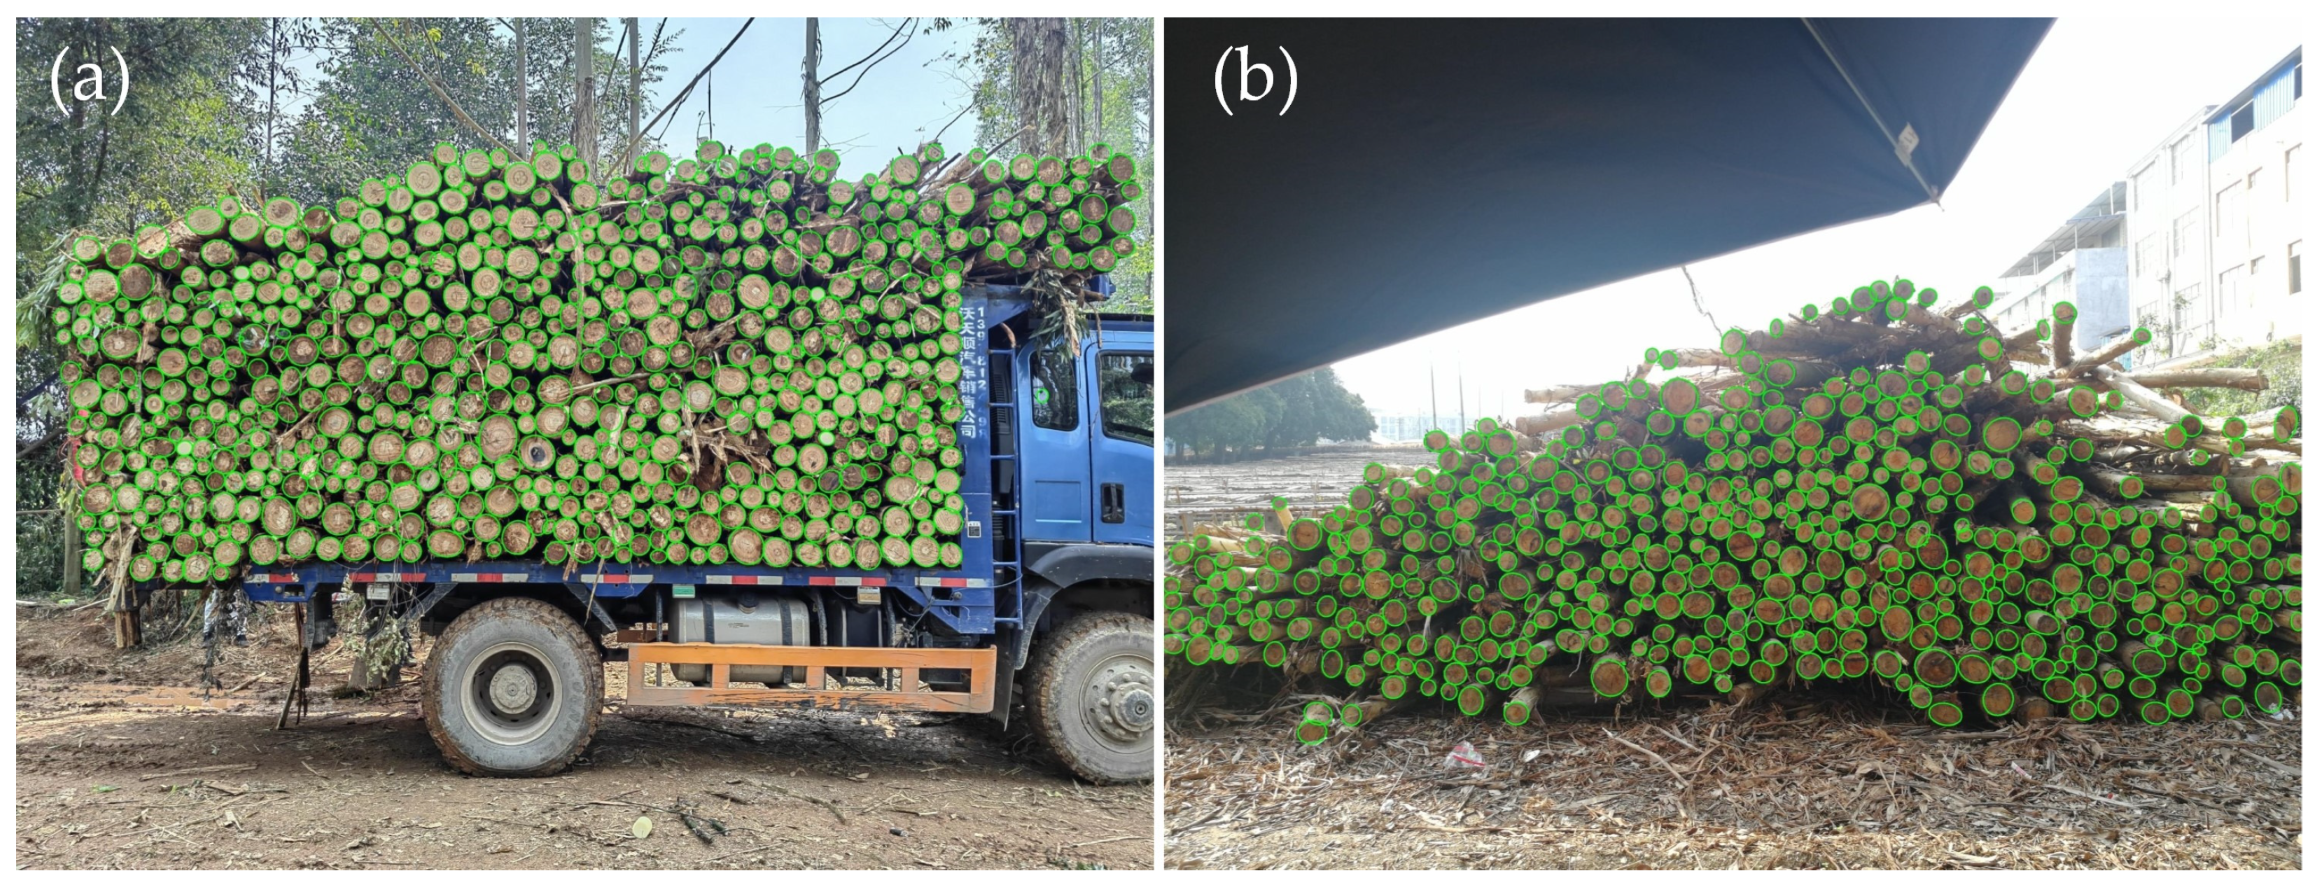
2.3. Experiment on the Best Shooting Angle

Different angles between the imaging equipment and log pile may result in varying degrees of deformation on the log-end surfaces when taking pictures, leading to deviations in the conversion of pixel diameters to physical diameters of the logs and thereby affecting the accuracy of diameter measurements. Therefore, AprilTag was used to obtain the camera position and adjust the camera placement angle in real time to reduce the impact of the shooting angle on the image [28].
AprilTag is a visual reference library similar to QR codes or barcodes that is widely used in robotics and camera calibration. The algorithm can accurately identify an AprilTag location despite a complex environment because of its uniqueness. Consequently, AprilTag can adapt to the changing environment of the forestry field. The camera calibration was conducted using Zhang’s calibration method before acquiring the angles [29]. The internal reference matrix of the camera was obtained with x- and y-axis focal lengths of 3100.3 and 3101.8, respectively. The process of obtaining the angle was as follows. First, four vertex pixel coordinates were returned by AprilTag. Second, the coordinates were combined with the internal reference matrix of the camera and corresponding points under the world coordinate system to obtain the rotation R and translation T matrices of the camera around the world coordinate system. Finally, the three-axis rotation angle of the camera coordinate system was obtained to realize a real-time display of the angle and adjust the camera position according to the method proposed by Slabaugh [30].
Variation curves were recorded for the AprilTag pixel edge lengths on the left, center, and right sides of the shooting screen with the camera’s y-axis shooting angle to determine the optimal shooting angle of the phone. According to the calibration, the camera angles were zero, negative, and positive when parallel to the shooting plane, rotated counterclockwise, and rotated clockwise, respectively. A schematic of the shooting process and results of changing the shooting angle are shown in Figure 7. The camera was positioned 3400 mm from the wall at the same height as the AprilTag, and the side length of each AprilTag was 162 mm. The results showed that the side length of AprilTag A on the left side increased with an increasing angle (Figure 7b), whereas that of AprilTag C on the right side decreased (Figure 7d). The edge length of AprilTag B at the center decreased and then increased as the angle increased (Figure 7c).
A change in the shooting angle caused a change in the pixels because the imaging principle of the camera was approximated as a small-aperture imaging model and the relationship between the lengths of the object and image satisfied:
h/H = f/d
where H denotes the length of the object, h denotes the imaging length of the object, f denotes the focal length of the camera, and d denotes the distance of the object from the camera.
d increased and f remained constant as the angle of the camera changed, causing the scale to decrease. The value of H was fixed, and h decreased to satisfy the ratio, which explains the trend of the change in the edge length. Regarding the analysis of the AprilTag A trend changes, the distance between the camera and AprilTag A gradually increased during the rotation of the camera from left to right, leading to a gradual increase in pixel length. The imaging length was obtained with a known focal length of 3101.8, object distance of 3400, object length of 162, and imaging length of 147.8 according to Equation (1). This value was closest to the pixel length when the angle was close to zero, compared to the pixel length change curve. Therefore, t the image distortion is minimized.

2.4. Evaluation Indicators

mAP and mIoU were selected to evaluate the recognition and segmentation performances, respectively. mAP is the most commonly used evaluation index in object detection experimental research and represents the average of the average precision (AP) of all categories. mAP is expressed as:
mAP = i   = 1 c AP i c
where i denotes the i detection category and c denotes the number of detected categories. AP denotes the area enclosed by the curve formed by the precision (P), recall (R), and coordinate axis. AP, P, and R are respectively expressed as:
AP = 0 1 P R R
P = T   P TP + FP
R = TP TP + FN
where TP denotes the number of correctly determined positive samples, FN denotes the number of incorrectly determined negative samples, and FP denotes the number of incorrectly determined positive samples.
mIoU is a standard measurement for semantic segmentation, representing the average ratio of the intersection to the union of the predicted bounding and ground truth boxes for all categories, which is expressed as:
mIoU = 1 c + 1 Σ i = 1 c TP Σ i = 1 c TP + FN + FP
The results of mAP and AP were consistent since only one category of logs was detected, thus the subsequent text utilized the mAP results.

2.5. Training Environment

The network models were run on the PyTorch [31] platform with a Windows 11 operating system. The computer had a 13th Gen Intel (R) Core (TM) i7-13700K CPU with a clock rate of 3.40 GHz, 32 GB RAM, and NVIDIA GeForce GTX1080 Ti graphics processor with 11 GB of RAM.
The appropriate selection of learning rate is crucial for achieving convergence to the local minimum of the objective function within a reasonably time frame. Therefore, we compared the accuracy of different models with varying initial learning rates before formal training. The results are presented in Figure 8, indicating that MobileNetv2-Yolov3 model achieved the highest accuracy at a learning rate of 0.0001 while MobileNetv2-Deeplabv3+ model performed best at a learning rate of 0.005.

3. Results

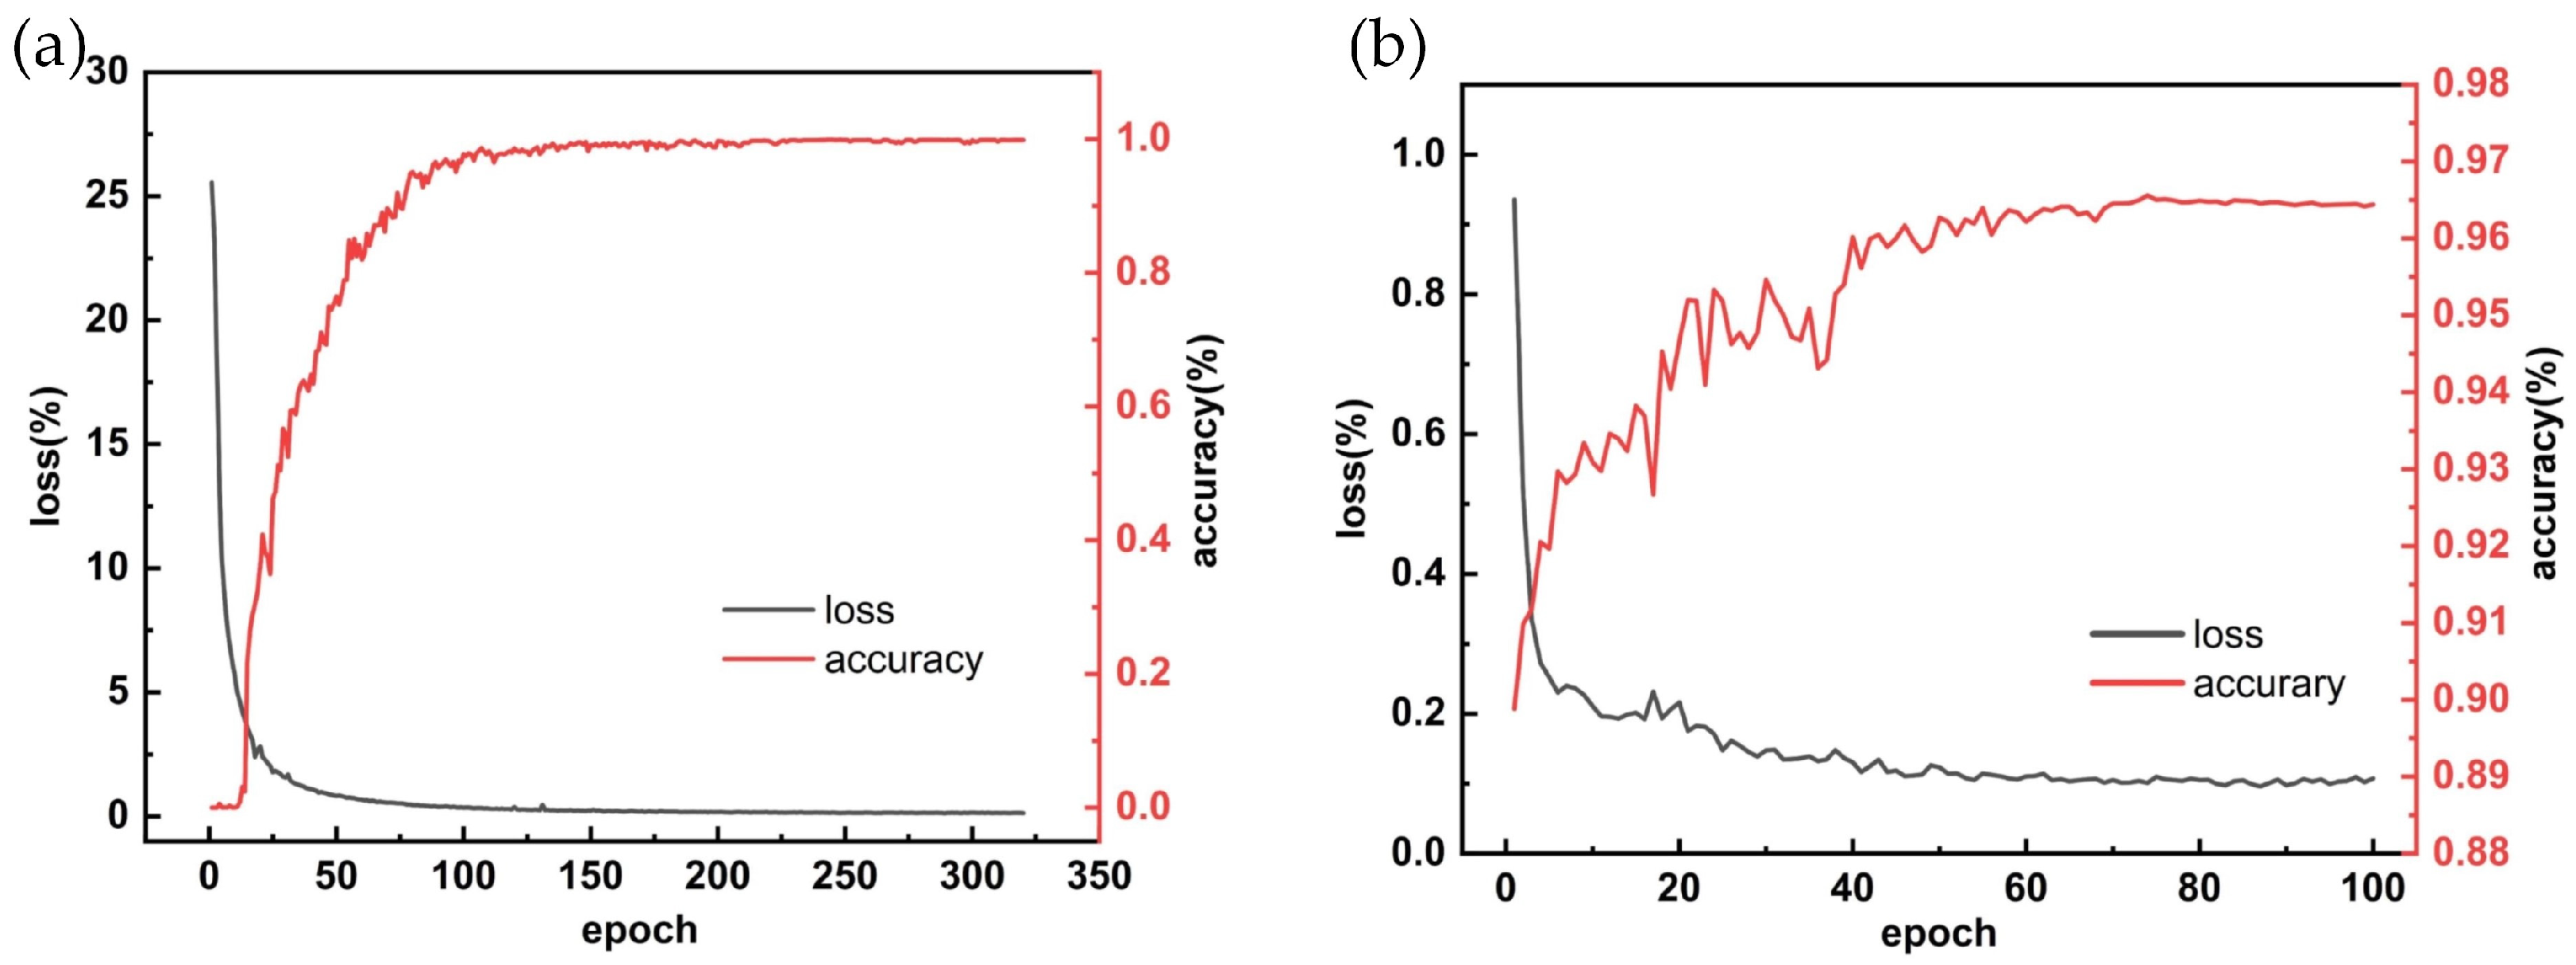
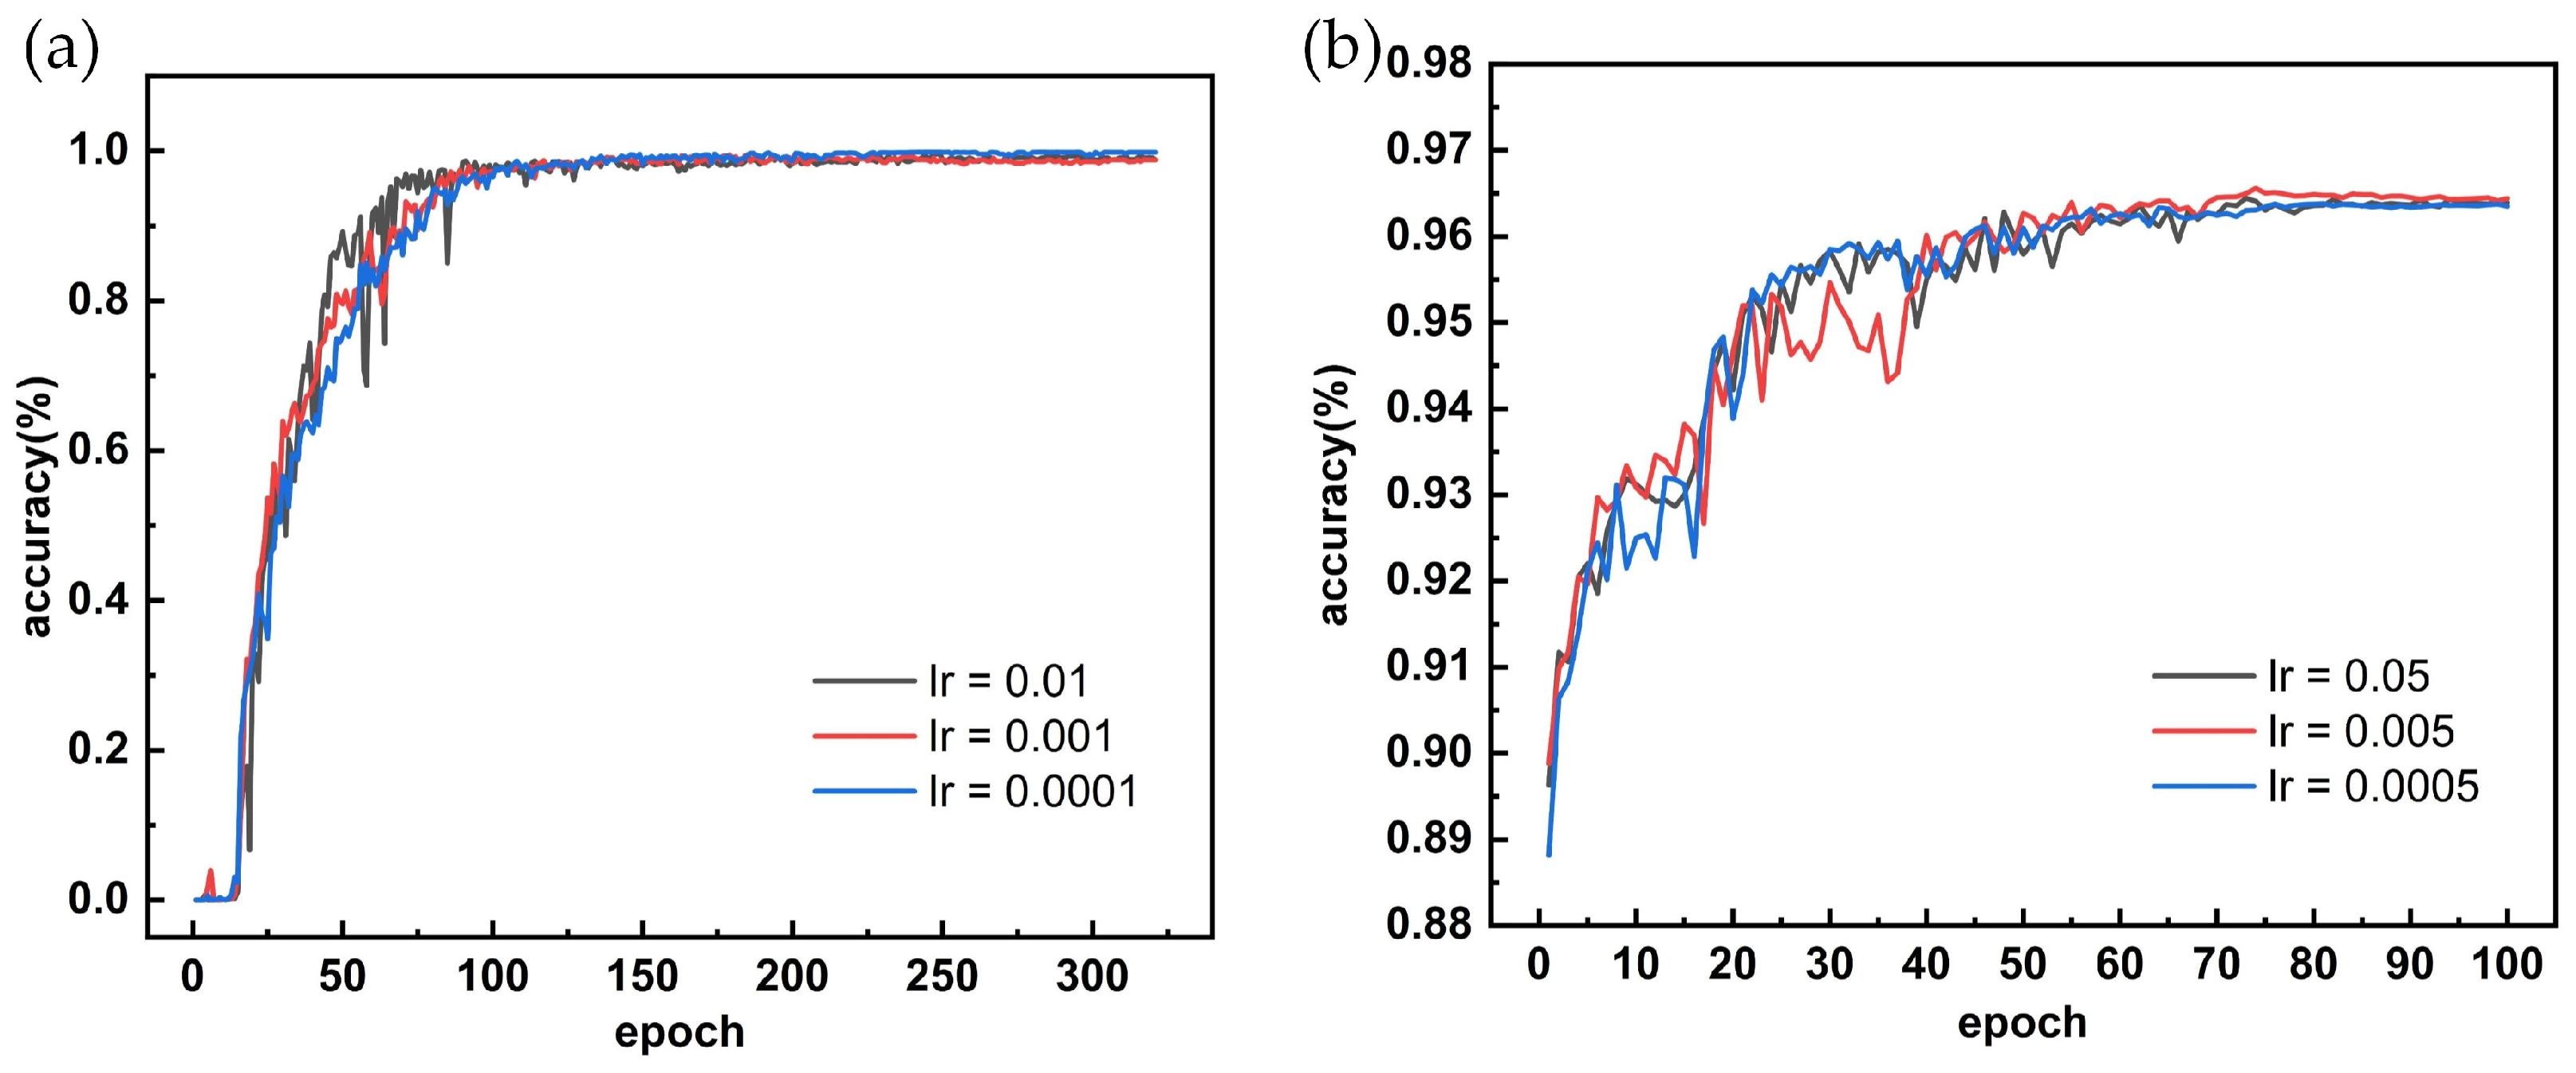
3.1. Results of Model Training

Transfer learning can reduce the impact of insufficient data on the training results, allowing even small datasets to achieve good training performance [32]. Therefore, transfer learning was applied to the proposed model to improve log recognition and segmentation. The training parameters for MobileNetv2-Yolov3 were set as follows: batch size of 6, Adam optimizer, initial learning rate of 0.0001, and 320 epochs. The training parameters for MobileNetv2-DeepLabv3+ were set as follows: batch size of 10, Adam optimizer, initial learning rate of 0.005, and 100 epochs.
The training results for the Yolov3 and DeepLabv3+ networks are shown in Figure 9, where black and red represent the changes in the loss value and accuracy rate, respectively. The loss value and accuracy rate tended to stabilize as the number of training iterations increased. Yolov3 exhibited a stable loss value after 100 iterations and stable accuracy rate after 150 iterations. DeepLabv3+ exhibited a stable loss value after 80 iterations and steady accuracy rate after 80 iterations. The precision, recall, mAP, and mIoU values of the training dataset are listed in Table 1. The training obtained a mAP of 97.28% and mIoU of 92.22%, which are high values. Therefore, the training achieved the expected effect.

3.2. Results of Log-Diameter Measurement

The model was tested in a forest, and the actual diameters of the measured logs were obtained from the pixels of the reference of the ratio of AprilTag pixel edge length to the actual length. The measurement results are shown in Figure 10 and the fitting results are shown in Figure 10d. The yellow font denotes the fitted diameters of the corresponding logs. The Yolov3 and DeepLabv3+ models performed well in identification and segmentation despite cluttered environments and occluded log ends, demonstrating good stability and recognition and segmentation performance, as shown in Figure 10b,c, respectively. Log measurements can take place in various settings depending on the needs of the forest. Figure 11 illustrates the measurement process in different environments, including on trucks and in log yards. While logs on trucks are typically organized in a neat manner, those in log yards are often randomly arranged, which can pose challenges for accurate measurements due to unstable positioning. However, the figure demonstrates that the method successfully handled log diameter measurements in diverse scenarios, showcasing its adaptability. While Figure 11a depicts a log end entirely covered by bark remaining undetected, such instances are infrequent and can be recognized and avoided during image capture.
Several vehicles loaded with logs were tested, and the comparative results of one vehicle’s measurement data are presented in Table 2. This table includes the number of logs corresponding to different diameter classes and the total log volume of the vehicle. The log volume measured by the picture was 16.558 m3, while the volume data provided by the forest site was 16.356 m3, with a measurement error of 1.2%. Twenty-two logs were randomly selected and the diameter data was measured and compared with those of a manually measured model. The comparison results are listed in Table 3, revealing an average comprehensive error of 0.73%. These results demonstrated that the measurement errors of log volume and log diameter met industry standards, which are less than 3%. Considering the natural shape of trees, the cross-sections of felled logs typically exhibit a circular appearance. Despite the differences in tree species, their cross-sections are similar. Pine trees were successfully detected during testing, demonstrating that the method can be applied to other tree species as well. Therefore, the proposed method could serve as a new solution for log diameter measurement.

4. Discussion

4.1. Comparison of Training Performance of Different Backbone Networks

The original backbone network was replaced with the MobileNetv2 network for the structural design. A comparison experiment between the original backbone and replacement network was conducted to verify the effectiveness of the replacement network, and the results are listed in Table 4 and Table 5. The experimental results showed that the replacement model parameters and training times were significantly reduced, and the accuracy was maintained at a similar level in the Yolov3 andDeepLabv3+ models. These experiments demonstrated that the replacement of the backbone network was correct.

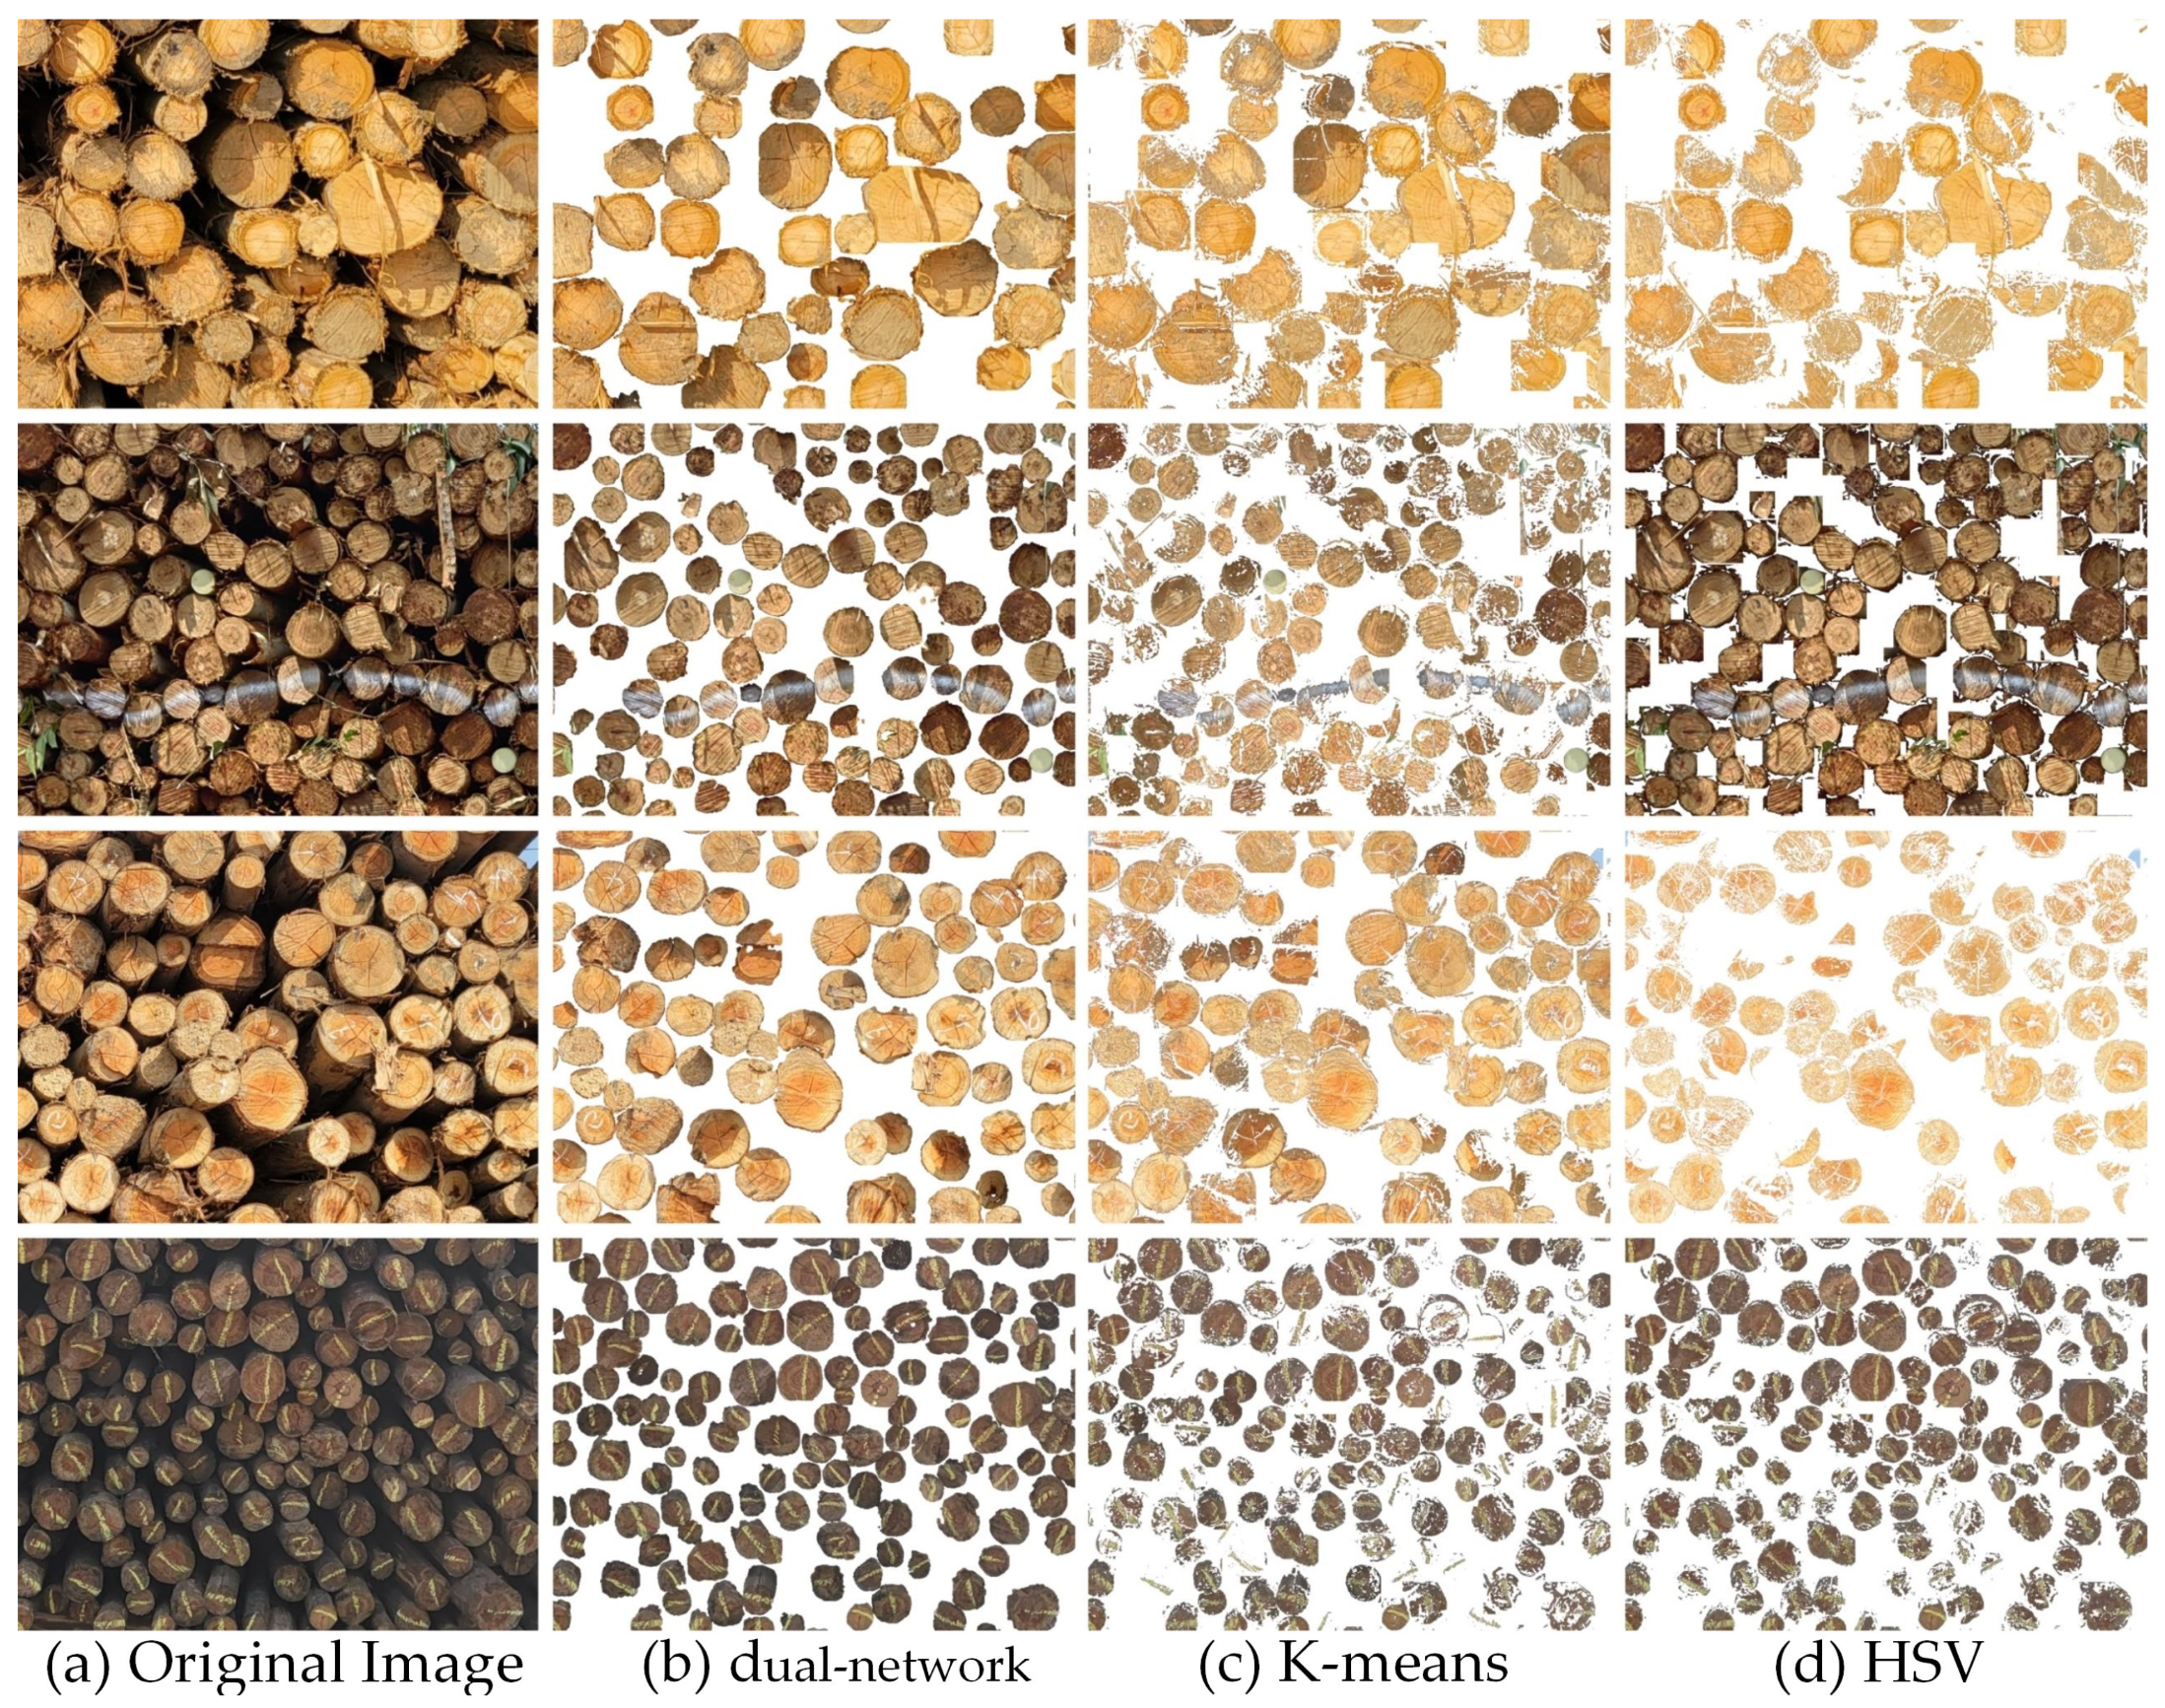
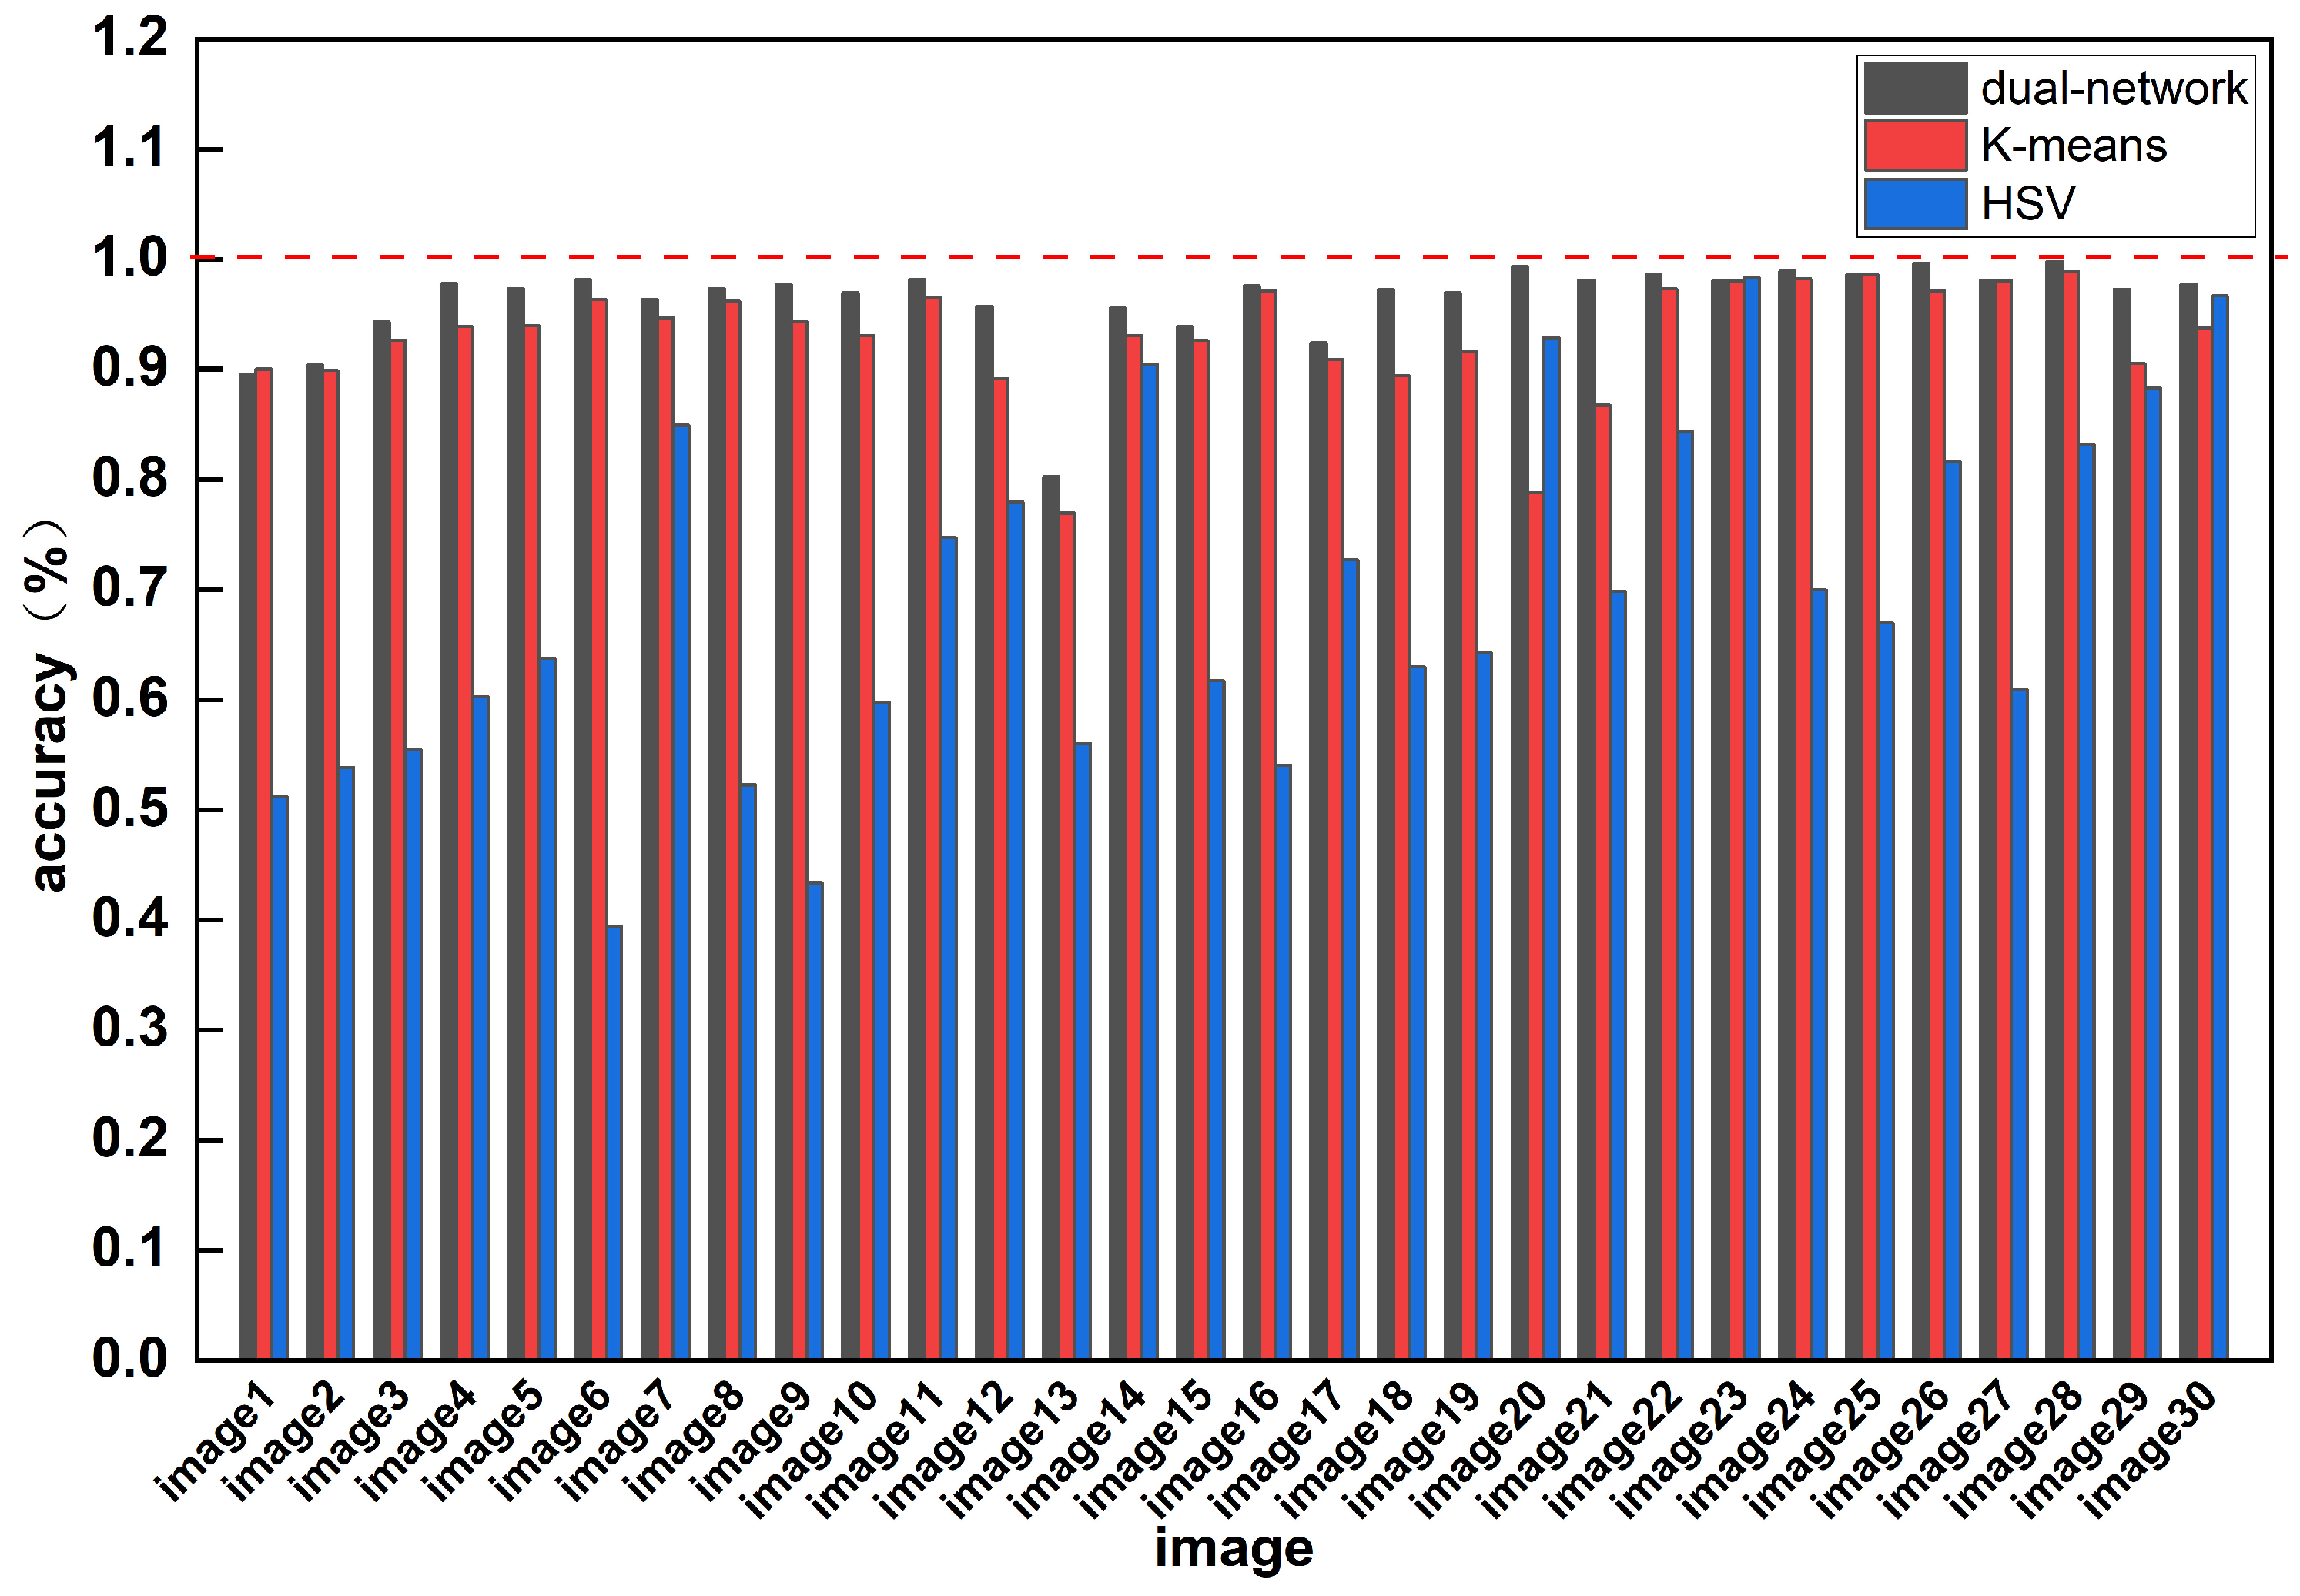
4.2. Performance Comparison of Different Segmentation Methods

Log-end faces show different states when they are affected by external factors (such as light conditions, shadows, humidity, and leaf shading). Segmentation stability for different states of log-end face conditions is a crucial challenge in measuring a log diameter by image.
A comparison was made to validate the segmentation performance and robustness of the proposed dual-network model; the method was compared with K-Means clustering and HSV thresholding. Thirty log photos from different scenes were tested and the segmentation results of dual-network model, K-means, and HSV were obtained by counting the number of log roots. The accuracy was measured as the ratio of successfully fitted logs to the total number of logs in each image, with average accuracies of 96.26%, 92.95%, and 69.09%, respectively. Some of the segmentation results are shown in Figure 12. The segmentation accuracies of the different segmentation methods for each test image are depicted in Figure 13. The segmentation accuracies show that the dual-network model achieved more than 90% accuracy for each test image, demonstrating its superior segmentation performance. The proposed model exhibited good stability when adapted to various environments, lighting conditions, and log placements. Therefore, it is appropriate to utilize the dual-network model for log diameter measurements. In the test pictures (Figure 12, the second picture), we discovered that the processing ability of the model measurement still needs to be improved when faced with a higher level of occlusion on the log end face. Due to the nature of deep learning, more log images of different forest scenes should be collected in future to improve the robustness of the proposed method to measure log diameter measurements.

4.3. Advantage Analysis of Dual-Network Detection System

The traditional measurement method is often time-consuming and labor-intensive, particularly when dealing with a large number of logs. A comparison was made to analyze the advantages of the proposed method. The detection system was compared with the traditional manual method in measurement efficiency and cost.
When it comes to measuring time, Figure 14 illustrates the log diameter measurement process in a forest farm. Ordinarily, two individuals perform manual measurement, with one taking measurements and the other recording data. A truck can contain 500–800 logs, and it takes about 30 min to manually measure each log. Moreover, measuring logs on the top of the truck requires the use of a ladder. With the proposed method, if a computer equipped with a 13th Gen Intel Core i7-13700K CPU processes the data, each vehicle can measure the diameter of all logs in about 5 min, resulting in a time saving of 25 min. Regarding measurement cost, the required equipment for the dual-networks system includes a computer and a mobile phone. The computer is used to analyze images to obtain detection results, while the mobile phone is used to capture images. There are no additional training costs for taking pictures, simply instruct the photographer to adjust the log picture parallel to the mobile phone. While manual measurement workers require a monthly salary of about 5000 RMB, the measurement system only incurs costs for purchasing a computer, a smartphone, and a printing AprilTag, which are reusable. Based on the comparative results, the proposed system effectively improves the efficiency of log diameter measurement and reduces measurement costs. The implementation of this system will contribute to enhancing the efficiency of forestry surveys, alleviating the burden on staff, and offering new solutions for modern forestry management.

5. Conclusions

Log-diameter measurement is an important task in forestry. This study proposed a criteria-compliant log-diameter measurement model using a dual network combining Yolov3 and DeepLabv3+, with MobileNetv2 as the backbone network. The study can be summarized as follows.
  • The deformation of log images caused by shooting angles was reduced using AprilTags.
  • The proposed method was trained and evaluated using a log dataset and tested in a forest.
  • A comparative study was conducted to verify the segmentation advantages of the proposed method over other commonly used segmentation methods, namely K-means clustering and HSV threshold segmentation.
The proposed log-diameter measurement model worked quickly and accurately in forest farms and was adaptable and robust to different forest farm measurement scenarios and log-end faces. The rapid and accurate measurement will help managers to manage and track the whole process of logs from harvesting to sale and realizes the digital management of forest resources. The results of the forestry tests showed that the measurement method met industry standards and could be promoted and applied, which is beneficial to forest resource management. Future research will focus on improving measurement accuracy and applicability by collecting more log image data to cover a wider range of log samples in terms of species, size, and condition, thereby enhancing the model’s ability to generalize. Additionally, efforts will be made to refine diameter measurement conversion methods and explore how to incorporate other types of data, such as infrared images, to enhance measurement accuracy.

Author Contributions

Conceptualization, H.Y.; methodology, H.Y. and Z.L.; software, Z.L.; validation, H.Y., Z.L., Y.Y. and L.Z. (Lin Zhou); writing—original draft preparation, Z.L.; writing—review and editing, H.Y., Y.L., S.H., H.N. and L.Z. (Lixia Zhai). All authors have read and agreed to the published version of the manuscript.

Funding

This research received no external funding.

Data Availability Statement

The data presented in this study are available upon request from the corresponding author. The dataset and code cannot be shared due to specific reasons.

Conflicts of Interest

The authors declare no conflicts of interest.

References

  1. Moskalik, T.; Tymendorf, Ł.; van der Saar, J.; Trzciński, G. Methods of Wood Volume Determining and Its Implications for Forest Transport. Sensors 2022, 22, 6028. [Google Scholar] [CrossRef] [PubMed]
  2. Xin, Y.; Xue, W. Counting Arithmetic of Log Pile in a Log Yard Based on Digital Image Processing. For. Eng. 2008, 24, 25–27. [Google Scholar] [CrossRef]
  3. Marti, F.; Forkan, A.R.M.; Jayaraman, P.P.; McCarthy, C.; Ghaderi, H. LogLiDAR: An Internet of Things Solution for Counting and Scaling Logs. In Proceedings of the IEEE International Conference on Pervasive Computing and Communications Workshops and other Affiliated Events (PerCom Workshops), Kassel, Germany, 22–26 March 2021; pp. 413–415. [Google Scholar] [CrossRef]
  4. Raumonen, P.; Kaasalainen, M.; Åkerblom, M.; Kaasalainen, S.; Kaartinen, H.; Vastaranta, M.; Holopainen, M.; Disney, M.; Lewis, P. Fast Automatic Precision Tree Models from Terrestrial Laser Scanner Data. Remote Sens. 2013, 5, 491–520. [Google Scholar] [CrossRef]
  5. Panagiotidis, D.; Abdollahnejad, A. Reliable Estimates of Merchantable Timber Volume from Terrestrial Laser Scanning. Remote Sens. 2021, 13, 3610. [Google Scholar] [CrossRef]
  6. Panagiotidis, D.; Abdollahnejad, A.; Slavík, M. 3D point cloud fusion from UAV and TLS to assess temperate managed forest structures. Int. J. Appl. Earth Obs. Geoinf. 2022, 112, 102917. [Google Scholar] [CrossRef]
  7. Chen, G.; Qiang, Z.; Chen, M.; Yin, H. Rapid detection algorithms for log diameter classes based on stereo vision. In Proceedings of the 4th International Conference on Systems and Informatics (ICSAI), Hangzhou, China, 11–13 November 2017. [Google Scholar]
  8. Jing, L.; Lin, Y.-H.; Wen, Y.-X.; Huang, S.-G.; Lin, Y.-K. Method for Outline Identification of Bundled Logs Based Upon Color and Spatial Features. Comput. Syst. Appl. 2013, 22, 191+196–199. [Google Scholar]
  9. Hotelling, H. Analysis of a complex of statistical variables into principal components. J. Educ. Psychol. 1933, 24, 417–441. [Google Scholar] [CrossRef]
  10. Smith, A.R. Color gamut transform pairs. ACM Siggraph Comput. Graph. 1978, 12, 12–19. [Google Scholar] [CrossRef]
  11. Zhong, X.-X.; Jing, L.; Lin, Y.-H.; Sun, L. Log Counting Method Combined with K-means Clustering and Hough Transform. J. Yibin Univ. 2016, 16, 40–43. [Google Scholar] [CrossRef]
  12. ISO/CIE 11664-4:2019; Colorimetry-Part 4: CIE 1976 L* a* b* Colour Space. ISO: Geneva, Switzerland, 2007.
  13. Pelleg, D.; Moore, A. Accelerating exact k-means algorithms with geometric reasoning. In Proceedings of the 5th ACM SIGKDD International Conference on Knowledge Discovery and Data Mining, San Diego, CA, USA, 15–18 August 1999; pp. 277–281. [Google Scholar] [CrossRef]
  14. Ballard, D.H. Generalizing the Hough transform to detect arbitrary shapes. Pattern Recognit. 1981, 13, 111–122. [Google Scholar] [CrossRef]
  15. Kuznetsova, A.; Maleva, T.; Soloviev, V. Using YOLOv3 algorithm with pre-and post-processing for apple detection in fruit-harvesting robot. Agronomy 2020, 10, 1016. [Google Scholar] [CrossRef]
  16. Cai, M.; Yi, X.; Wang, G.; Mo, L.; Wu, P.; Mwanza, C.; Kapula, K.E. Image Segmentation Method for Sweetgum Leaf Spots Based on an Improved DeeplabV3+ Network. Forests 2022, 13, 2095. [Google Scholar] [CrossRef]
  17. Zhu, S.; Ma, W.; Lu, J.; Ren, B.; Wang, C.; Wang, J. A novel approach for apple leaf disease image segmentation in complex scenes based on two-stage DeepLabv3+ with adaptive loss. Comput. Electron. Agric. 2023, 204, 107539. [Google Scholar] [CrossRef]
  18. Samdangdech, N.; Phiphobmongkol, S. Log-end cut-area detection in images taken from rear end of eucalyptus timber trucks. In Proceedings of the 15th International Joint Conference on Computer Science and Software Engineering (JCSSE), Nakhonpathom, Thailand, 11–13 July 2018; pp. 1–6. [Google Scholar]
  19. Liu, W.; Anguelov, D.; Erhan, D.; Szegedy, C.; Reed, S.; Fu, C.-Y.; Berg, A.C. SSD: Single shot multibox detector. In Proceedings of the Computer Vision–ECCV 2016: 14th European Conference, Amsterdam, The Netherlands, 11–14 October 2016; pp. 21–37. [Google Scholar]
  20. Simonyan, K.; Zisserman, A. Very deep convolutional networks for large-scale image recognition. arXiv 2014, arXiv:1409.1556. [Google Scholar] [CrossRef]
  21. Lin, Y.-h.; Zhao, H.-l.; Yang, Z.-c.; Lin, M.-t. An equal length log volume inspection system using deep-learning and Hough transformation. J. For. Eng. 2021, 1, 136–142. [Google Scholar]
  22. Redmon, J.; Divvala, S.; Girshick, R.; Farhadi, A. You only look once: Unified, real-time object detection. In Proceedings of the IEEE Conference on Computer Vision and Pattern Recognition, Las Vegas, NV, USA, 27–30 June 2016; pp. 779–788. [Google Scholar]
  23. Lin, Y.; Cai, R.; Lin, P.; Cheng, S. A detection approach for bundled log ends using K-median clustering and improved YOLOv4-Tiny network. Comput. Electron. Agric. 2022, 194, 106700. [Google Scholar] [CrossRef]
  24. Chen, L.-C.; Papandreou, G.; Kokkinos, I.; Murphy, K.; Yuille, A.L. Semantic image segmentation with deep convolutional nets and fully connected crfs. arXiv 2014, arXiv:1412.7062. [Google Scholar] [CrossRef]
  25. Chen, L.-C.; Zhu, Y.; Papandreou, G.; Schroff, F.; Adam, H. Encoder-decoder with atrous separable convolution for semantic image segmentation. In Proceedings of the European Conference on Computer Vision (ECCV), Munich, Germany, 8–14 September 2018; pp. 801–818. [Google Scholar]
  26. Howard, A.G.; Zhu, M.; Chen, B.; Kalenichenko, D.; Wang, W.; Weyand, T.; Andreetto, M.; Adam, H. Mobilenets: Efficient convolutional neural networks for mobile vision applications. arXiv 2017, arXiv:1704.04861. [Google Scholar] [CrossRef]
  27. Sandler, M.; Howard, A.; Zhu, M.; Zhmoginov, A.; Chen, L.-C. Mobilenetv2: Inverted residuals and linear bottlenecks. In Proceedings of the IEEE Conference on Computer Vision and Pattern Recognition, Salt Lake City, UT, USA, 18–23 June 2018; pp. 4510–4520. [Google Scholar]
  28. Olson, E. AprilTag: A robust and flexible visual fiducial system. In Proceedings of the IEEE International Conference on Robotics and Automation, Shanghai, China, 9–13 May 2011; pp. 3400–3407. [Google Scholar]
  29. Zhang, Z. Flexible camera calibration by viewing a plane from unknown orientations. In Proceedings of the 7th IEEE International Conference on Computer Vision, Kerkyra, Greece, 20–27 September 1999; pp. 666–673. [Google Scholar]
  30. Slabaugh, G.G. Computing Euler angles from a rotation matrix. Retrieved August 1999, 6, 39–63. [Google Scholar]
  31. Paszke, A.; Gross, S.; Massa, F.; Lerer, A.; Bradbury, J.; Chanan, G.; Killeen, T.; Lin, Z.; Gimelshein, N.; Antiga, L.; et al. Pytorch: An imperative style, high-performance deep learning library. Adv. Neural Inf. Process. Syst. 2019, 32, 8026–8037. [Google Scholar]
  32. Pan, S.J.; Yang, Q. A survey on transfer learning. IEEE Trans. Knowl. Data Eng. 2010, 22, 1345–1359. [Google Scholar] [CrossRef]
Figure 1. Flowchart of log diameter measurement.
Forests 15 00755 g001
Figure 2. Examples of stacked wood end images, capturing in different scenes: (a) in the forest farm and (b) at the wood factory.
Forests 15 00755 g002
Figure 3. Examples of annotated images for Yolov3: (a) original image and (b) annotation.
Forests 15 00755 g003
Figure 4. Examples of annotated images for DeepLabv3+. With each group of images separated by a dashed line, red and black represent the log-section labeling and background, respectively.
Forests 15 00755 g004
Figure 5. The structure of MobileNetv2-Yolov3.
Forests 15 00755 g005
Figure 6. The structure of MobileNetv2-DeepLabv3+.
Forests 15 00755 g006
Figure 7. Schematic diagram and curves of the pixel length of AprilTag codes changing with shooting angle. (a) Shooting schematic diagram, (b) AprilTag A, (c) AprilTag B, and (d) AprilTag C.
Forests 15 00755 g007
Figure 8. Accuracy change curves for different initial learning rates. (a) Yolov3 and (b) DeepLabv3+.
Forests 15 00755 g008
Figure 9. Training loss values and accuracy change curves for: (a) Yolov3 and (b) DeepLabv3+.
Forests 15 00755 g009
Figure 10. Example of a process for measuring log diameter: (a) original image, (b) Yolov3 detection, (c) DeepLabv3+ segmentation, and (d) ellipse fitting.
Forests 15 00755 g010
Figure 11. Log diameter measurements in different scenarios: (a) truck and (b) timber yard.
Forests 15 00755 g011
Figure 12. Log end face segmentation images using different methods: (a) original image, (b) dual-network, (c) K-means, and (d) HSV.
Forests 15 00755 g012
Figure 13. Segmentation accuracy of different methods for each test image.
Forests 15 00755 g013
Figure 14. The log diameter measurement process image.
Forests 15 00755 g014
Table 1. Training results for Yolov3 and DeepLabv3+.
BackboneYolov3DeepLabv3+
PrecisionRecallmAPPrecisionRecallmIoU
MobleNetv298.52%98.34%97.28%97.28%95.84%92.22%
Table 2. Comparison of log volume measurements.
Rank of Log Size (cm)68101214161820Log Volume (m3)
Log Length 2.2 mNumber of logsforest farm8415316213677379116.356
image60142163160663412416.558
Error of log volume1.2%
Table 3. Results of randomly individual log diameter measurements.
Log NumberActual Diameters
[3]
Model Measure
Diameters [3]
Error (%)
191976.06
281855.49
39290−1.97
48884−4.70
596970.54
679858.16
71271313.41
89895−3.13
99895−3.13
101001011.27
111061114.49
121011043.40
131081112.56
141061060.01
151091144.52
16109108−1.29
17142138−3.06
182042040.06
191211220.69
201241283.36
21151141−6.74
22145139−3.97
Comprehensive average error (%)0.73%
Table 4. Results of Yolov3 with different backbone.
ModelBackbonePrecisionRecallmAPNumber of
Parameters
Training
Time
Yolov3Darknet5398.91%98.37%98.34%61.52 MB73 min
MobileNetv298.35%98.34%97.28%22.25 MB67 min
Table 5. Results of DeepLabv3+ with different backbone.
ModelBackbonePrecisionRecallmIoUNumber of
Parameters
Training
Time
Deeplabv3+Xception96.34%95.98%92.61%54.71 MB178 min
MobileNetv296.05%95.84%92.22%5.81 MB55 min
Disclaimer/Publisher’s Note: The statements, opinions and data contained in all publications are solely those of the individual author(s) and contributor(s) and not of MDPI and/or the editor(s). MDPI and/or the editor(s) disclaim responsibility for any injury to people or property resulting from any ideas, methods, instructions or products referred to in the content.

