Article

The Optimization of the Steam-Heat-Treated Process of Rattan (Calamus simplicifolius) Based on the Response Surface Analysis and Its Chemical Changes

1
International Centre for Bamboo and Rattan, Beijing 100102, China
2
SFA/Beijing Key Lab of Bamboo and Rattan Science and Technology, Beijing 100102, China
*
Author to whom correspondence should be addressed.
Forests 2024, 15(4), 615; https://doi.org/10.3390/f15040615
Submission received: 16 February 2024 / Revised: 16 March 2024 / Accepted: 21 March 2024 / Published: 28 March 2024
(This article belongs to the Section Wood Science and Forest Products)

Abstract

:
The objective of this study is to investigate the impacts of steam heat treatment parameters (e.g., temperature, time, and pressure) on the impact toughness of rattan (Calamus simplicifolius). The Box–Behnken design response surface analysis was employed to optimize the steam heat treatment parameters. Impact toughness was selected as the evaluation index, with single-factor tests conducted as a baseline for comparison. Changes in chemical composition, cellulose crystallinity, and pyrolysis properties were analyzed using X-ray diffraction (XRD), Fourier transform infrared (FTIR) spectra, Thermogravimetry–Fourier transform infrared (TG-FTIR) spectra, and wet-chemistry methods for both untreated control samples and the heat-treated samples. The results show that a 1 h steam heat treatment at 160 °C under 0.1 MPa pressure has the optimal process parameters for the rattan. The achieved impact toughness value closely matches the predicted value at 71.29 kJ/m2. After the steam heat treatment, hemicellulose and cellulose contents decrease, whereas relative lignin content increases significantly, leading to improved toughness characteristics in Calamus simplicifolius samples. The TG results indicate that maximum weight loss occurs at temperatures of 352 °C, 354 °C, and 361 °C, respectively, for three different samples. This suggests that the thermal stability is enhanced as a result of the heat treatment. These findings will help optimize the heat treatments of the rattan material.

1. Introduction

Rattan species, together with bamboo, are among the most significant non-timber forest products and components of tropical and subtropical forest ecosystems. There exist 631 species, subspecies, and varieties of rattan in 11 genera worldwide [1]. China alone possesses 41 species and varieties belonging to four genera: Daemonorops, Calamus, Plectocomia, and Myrialepis [2,3]. Thanks to their excellent strength, toughness, and elasticity and easy modeling characteristics, rattan species are an excellent material for interior decoration applications such as furniture making or craft equipment weaving [4,5]. Yet, like other lignocellulosic materials, they exhibit some undesirable characteristics including dimensional instability and low resistance against mold and rot fungi decay in a humid environment [6,7,8]. The heat treatment has been known for its advantages (e.g., environmental friendliness, non-toxicity, and simplicity in processing), which make it currently the most widely employed method for industrial wood improvement [9]. In recent years, it has also been used for rattan processing and its derived composite materials [10,11]. Extensive research has been conducted on various impacts of heat treatment processes [12], including color alteration [13], changes in mechanical properties [14,15], durability assessment of heat treatment [16], alterations in chemical composition [17,18], and mass loss. The impact of the fiber percentage and cell wall thickness on the shrinkage–swelling and Modulus of Elasticity of the cane is already defined [19]. Also, changes in durability properties of two rattan species of different diameters were researched [20]. These property changes are closely related to processing parameters such as the temperature, duration, medium, and pressure applied during the heat treatment.
The single-factor analysis method is commonly employed to analyze the impacts of processing parameters [21]. However, this approach is time-consuming and is unable to analyze the interactions among different factors, which can be addressed by a simultaneous single-factor method in experimental design [22]. The response surface analysis or methodology (RSM), initially introduced by Box and Wilson in 1951, serves as an optimization technique based on experimental results or simulations for determining the optimal factor levels that yield the desired response value [23,24].
The raw material selected for this study is Calamus simplicifolius, an important commercial rattan species in China known for its exceptional mechanical properties. The response surface analysis was employed to determine the optimal steam heat treatment process for C. Simplicifolius cane. In the optimization process, independent variables such as steam heat treatment temperature, treatment time, and pressure were considered while designing the impact toughness of C. Simplicifolius cane as the response variable. This study is to quantify the impacts of steam heat treatment parameters (e.g., temperature, time, and pressure) on the impact toughness of C. Simplicifolius. A better understanding of the steam-heat-treated C. Simplicifolius properties will lead to a more efficient utilization of the heat-treated rattan, particularly in outdoor settings.

2. Materials and Methods

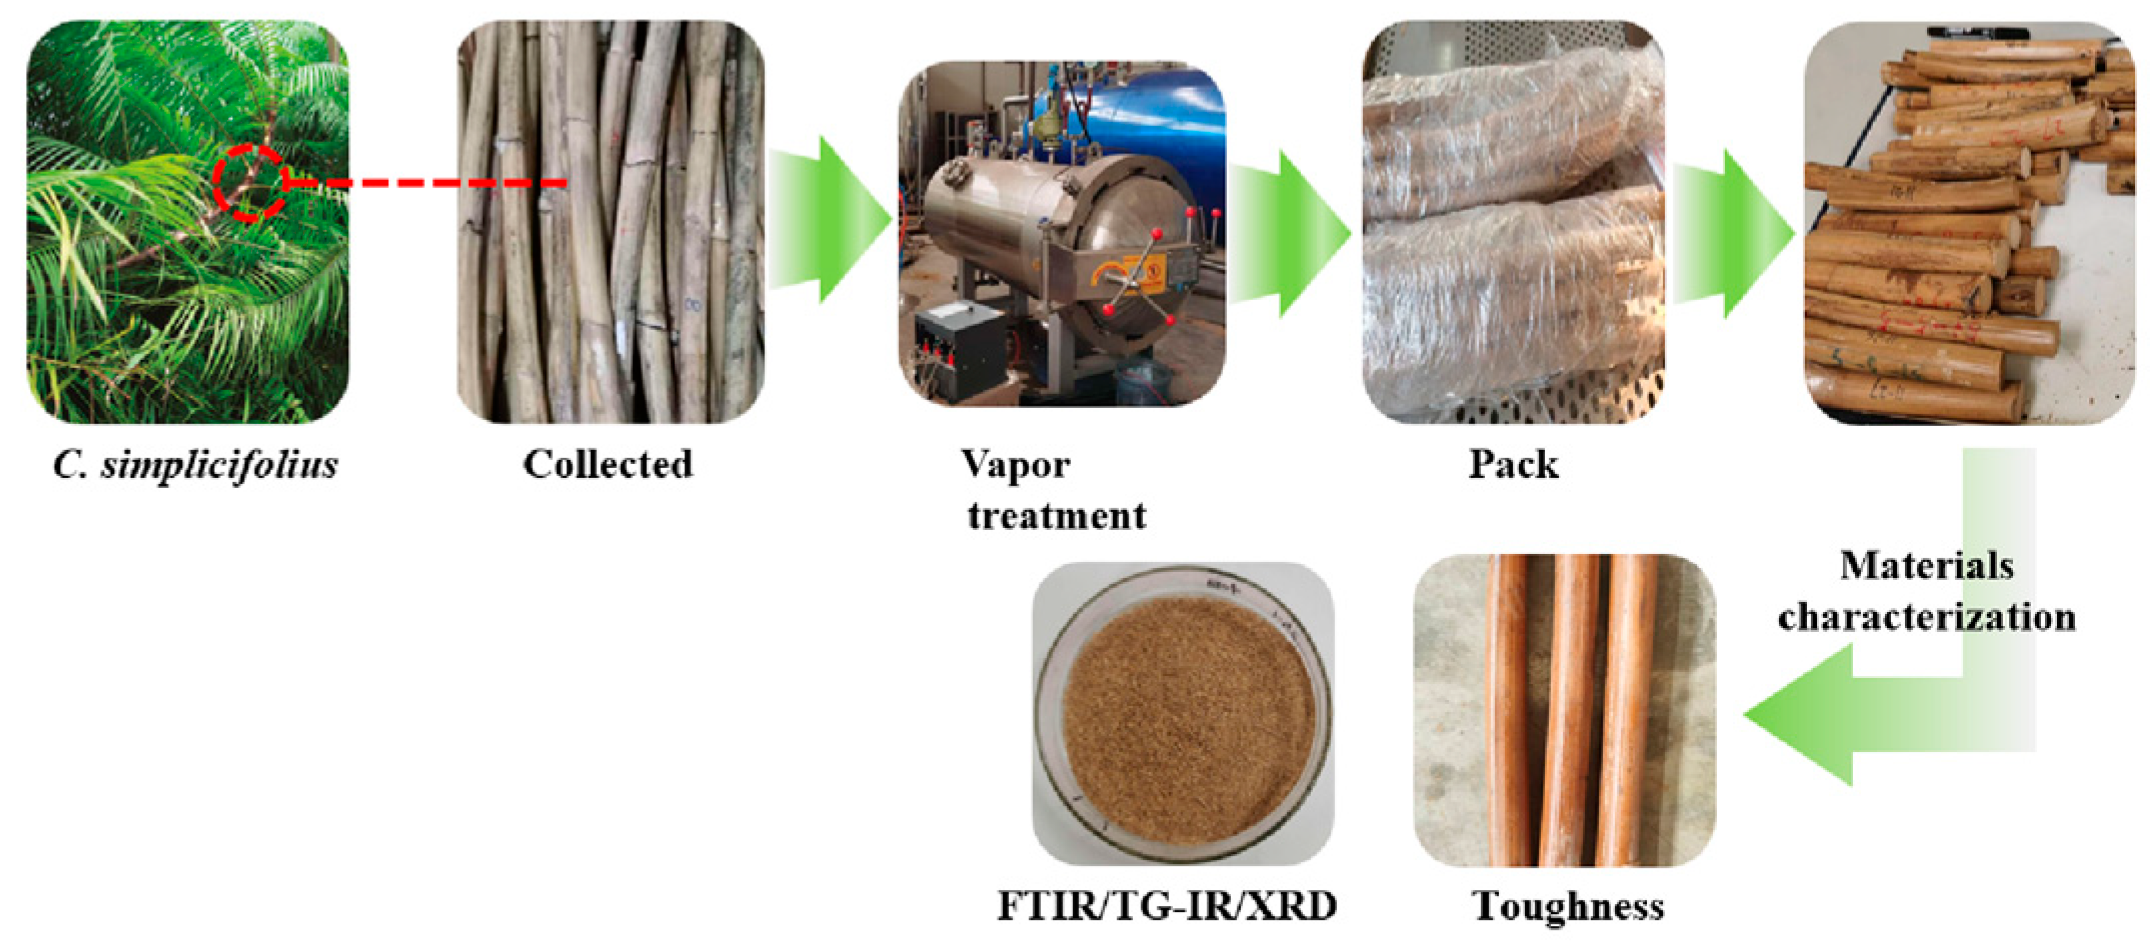
2.1. Sample Preparation

C. simplicifolius was collected from a plantation located in Pingxiang City, Guangxi, China. Three mature and defect-free rattan stems, with an average diameter (D) of 20 mm, were carefully selected for sampling. Stem samples of 60 cm in length were obtained from the central sections of the canes.

2.2. Methods

2.2.1. Heat Treatment

Single-factor experiments were conducted to optimize the variables within desired limits. The impact toughness of the samples was evaluated for the steam heat treatment temperatures of 120, 140, 160, 180, and 200 °C at a fixed heat treatment time of 1 h and a fixed pressure of 0.1 MPa. Furthermore, the influence of heat treatment time on impact toughness was analyzed for durations of 0.5, 1, 1.5, 2, and 2.5 h at a fixed temperature of 160 °C and a fixed pressure of 0.1 MPa. To investigate the effect of pressure on impact toughness, three different levels of pressure (0.1, 0.2, and 0.3 MPa) were selected while keeping the heat treatment temperature constant at 160 °C for a duration of 1 h.
The heat treatment tank used in this study was a DN 600 × 1500 mm tank (Zhucheng Antai Machinery Co., Ltd., Weifang, China) that underwent steam heat treatment. The C. Simplicifolius samples were placed inside the pre-heated steam tank at 120 °C using water steam. Following the treatments, all samples were naturally cooled to room temperature and stored in a desiccator.

2.2.2. Response Surface Design

The Box–Behnken design was employed for the heat-treated rattan based on a single-factor experiment. Three independent variables, namely steam-heat-treated temperature (120–200 °C), time (0.5–2.5 h), and pressure (0.1–0.3 MPa), were manipulated to determine their impacts on response toughness.

2.2.3. Verification of Steam Heat Treatment Conditions

The steam heat treatment conditions were optimized using the response surface analysis, and the process was repeated five times. Subsequently, the impact tests were conducted to validate the results obtained from the optimized response surface model.

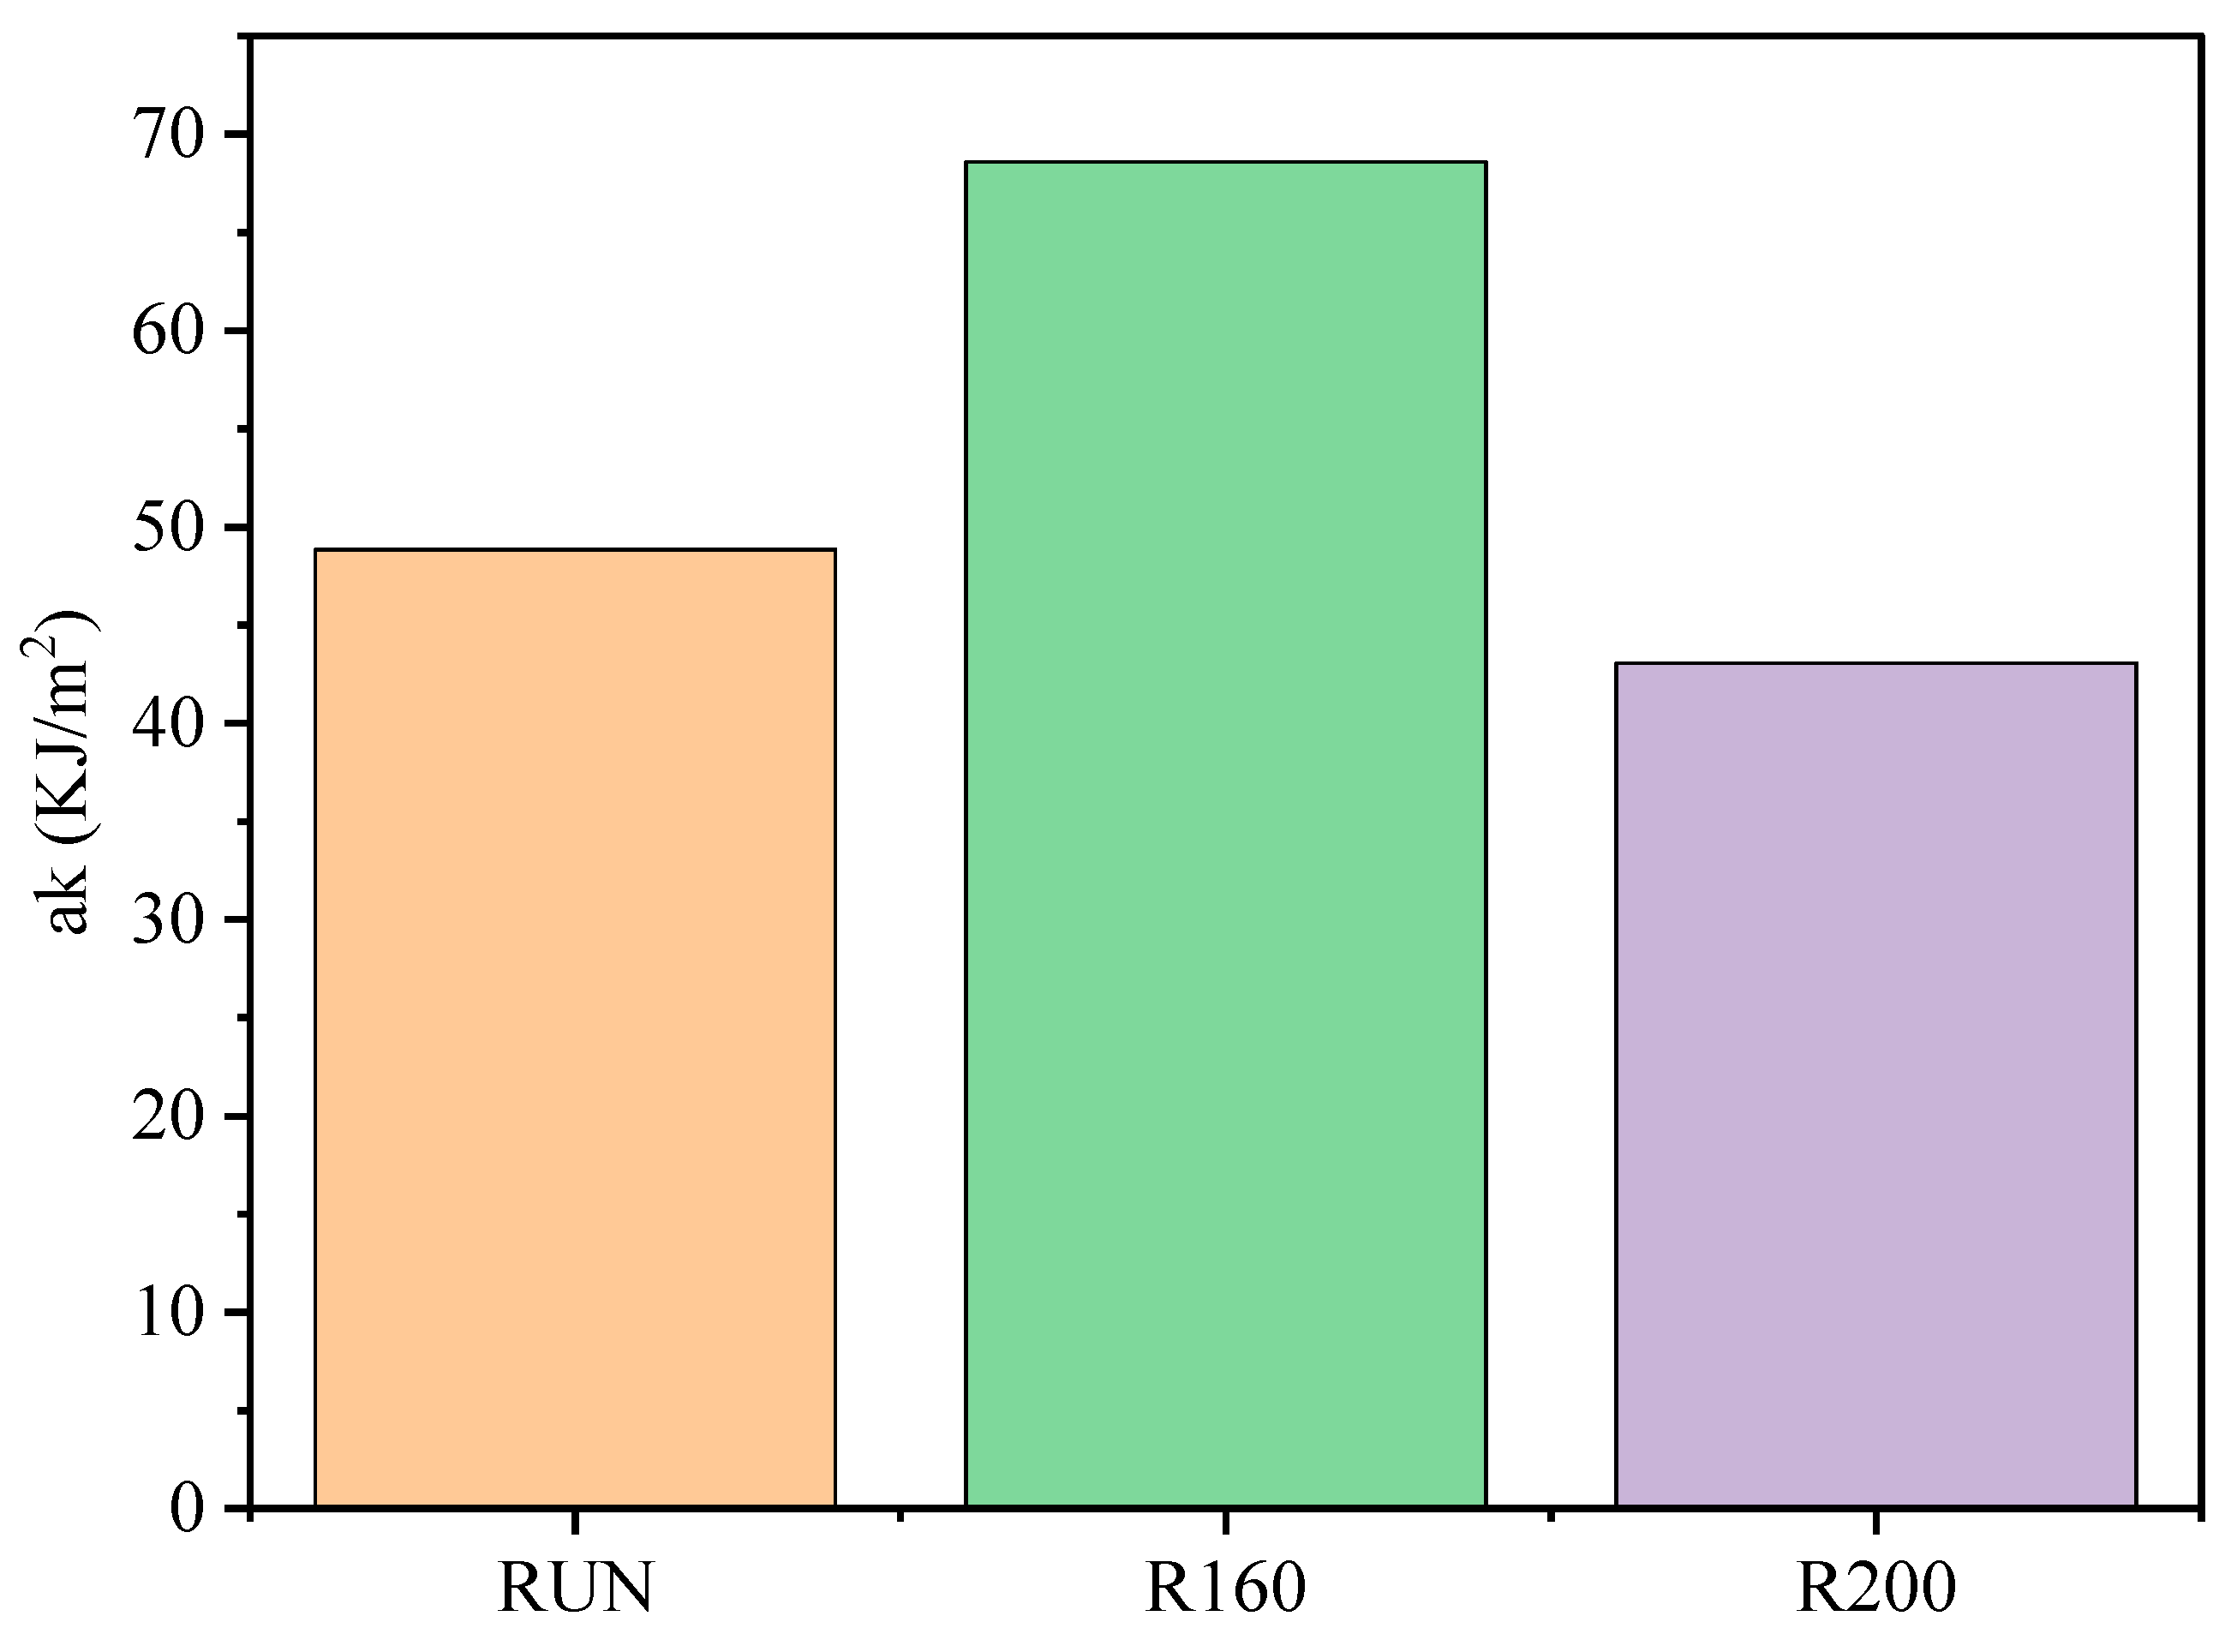
2.2.4. Impact Toughness

The sample with dimensions of 160 mm × d (longitudinal × diameter) was prepared for the impact toughness testing, as depicted in Figure 1. Twelve repeated samples from each experimental set were subjected to impact testing using an Instron 9250 machine (Boston, MA, USA), because there is no impact toughness standard for rattan, following the bamboo standards outlined in JG/T 199-2007 (2007) [25], and there is a little difference regarding the dimension. The impact toughness was obtained according to the following formula:
C = 1000 Q π 4 d 2
where
  • C—impact toughness of the specimen, kJ/m2;
  • Q—sample-absorbed energy, J;
  • d—specimen diameter, mm.

2.2.5. The Determination of Chemical Composition

The chemical composition of the samples was determined following the National Renewable Energy Laboratory (NREL) [26,27]. The extractive-free C. Simplicifolius powder (300 mg) was hydrolyzed in 3 mL of 72% H2SO4 at 30 °C for 1 h with intermittent stirring. Subsequently, 84 mL of distilled water was added, and the mixture was heated in an autoclave at 121 °C for 1 h. After the hydrolysis and filtration, glucose and hemicelluloses were analyzed using a high-performance liquid chromatograph (1200 series, Agilent, Santa Clara, CA, USA). Acid-soluble lignin content was determined spectrophotometrically at a wavelength of 205 nm using an ultraviolet–visible spectrophotometer (752 N, Jingke, Quzhou, China). The remaining residue underwent calcination in a muffle furnace at 575 °C for four hours to determine its mass. The difference in mass represents the quantity of acid-insoluble lignin. Lignin content was calculated as the sum of acid-insoluble lignin and acid-soluble lignin. Alcohol-benzene extractive content was determined following GB/T2677.6-94 (1994) [28].

2.2.6. X-ray Diffraction (XRD)

C. Simplicifolius specimens were ground into a fine powder and passed through a 200-mesh screen. Then, 2 mg of the powdered rattan was compressed into slices and subjected to an X-ray diffraction (XRD) analysis using a Bruker D2 Phaser Tabletop Diffractometer. The XRD analysis employed Cu Ka radiation (k = 1.5418 Å) at an operating voltage of 30 kV and current of 10 mA. Data were collected by scanning the 2-theta range from 10° to 60°. The results obtained from three replicate experiments were averaged, and the relative crystallinity was determined using the following equation:
C r I = I 002 I a m I 002 × 100 %
where
  • CrI—Crystallinity (%);
  • I002—The maximum intensity of the (002) lattice diffraction angle;
  • Iam—The scattering intensity of the non-crystalline background diffraction.

2.2.7. FTIR

The FTIR spectra of the samples were acquired using a Nexus 670 FTIR spectrophotometer (Thermo Nicolet, Billerica, MA, USA). The dried samples were finely ground and compressed with KBr to form pellets, followed by recording their spectra in the range of 4000 to 800 cm−1 at a resolution of 4 cm−1 and an average of 64 scans per sample. Prior to data collection, background scanning was performed for accurate background correction. Each sample underwent three repeated scans.

2.2.8. TG-FTIR

The thermogravimetric analyzer (PerkinElmer Company, Waltham, MA, USA) was utilized for the analysis of 8~10 mg of rattan powder. Nitrogen with a flow rate of 20 mL·min−1 was employed as the carrier gas, while the temperature covered ranges from room temperature to 800 °C at a heating rate of 10 °C·min−1. The thermogravimetric analysis and differential thermal analysis were conducted to obtain TG and DTG curves for the samples. The infrared spectrum was employed for the online detection of gas volatiles released during the pyrolysis process of the rattan and its components, with a recording range spanning from 4000 to 500 cm−1, resolution set at 4 cm−1, and collection time per session lasting for 5 s. Prior to the experimentation, preheating at 280 °C was applied to both the stainless steel transfer tube and Fourier infrared spectrometer (FTIR) gas tank in order to prevent the condensation of gas products. The weight loss rate was calculated based on residual mass recorded in the TG experiment:
A = m 0 m 1 m 0 × 100 %
where
  • A—The weight loss rate;
  • m0—Initial total mass of the sample;
  • m1—Residual mass of the sample recorded by TG.
In the semi-quantitative analysis of the infrared spectrum, a positive correlation was observed between the peak area and the sample concentration (Biswas et al., 2017 [29]). The relative content of pyrolysis gas was determined semi-quantitatively by fitting the infrared absorption peak using the Origin Lorentz–Gaussian function.

3. Results

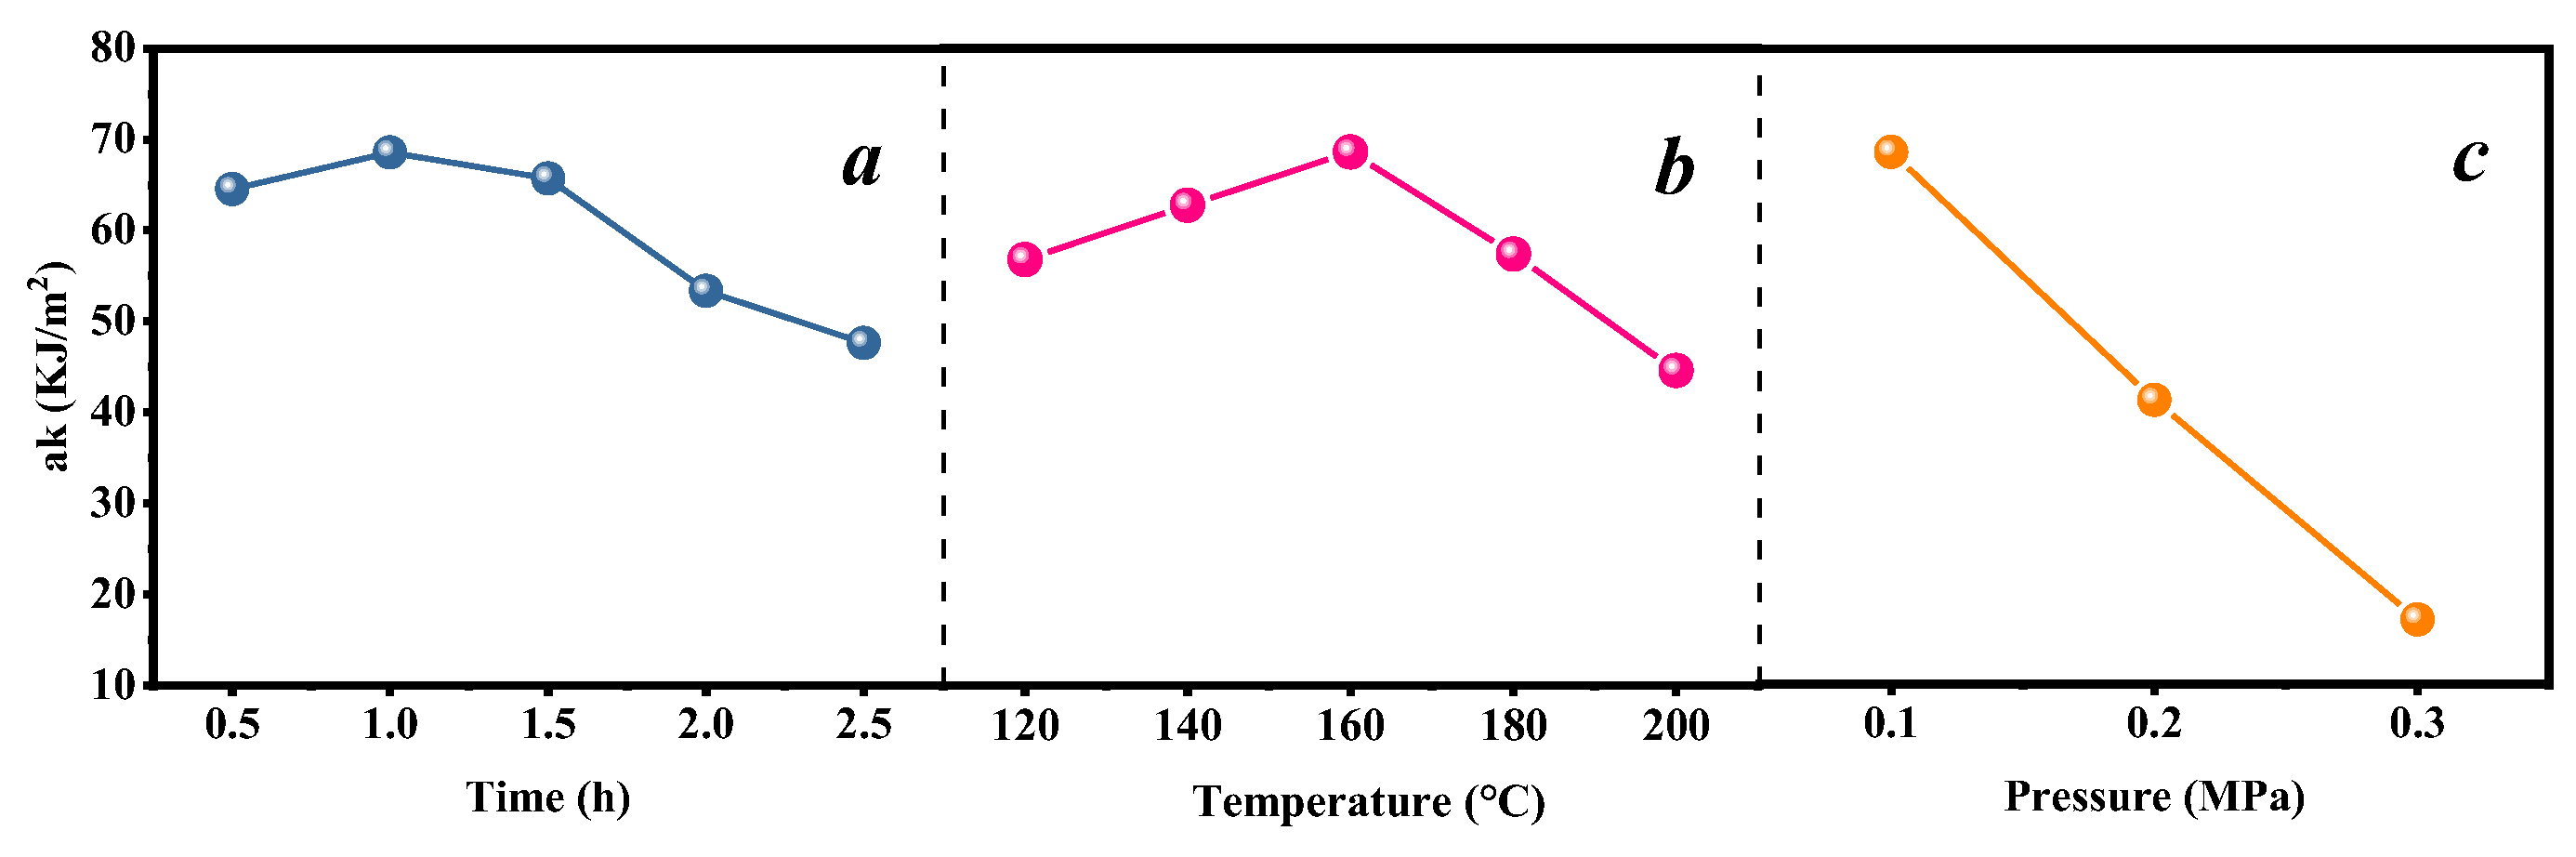
3.1. The Single-Factor Analysis

The heat treatment of C. Simplicifolius is an effective method for enhancing dimensional stability and durability against biodegradation. This study focuses on quantifying the impacts of heat treatment temperature, time, and pressure on the impact toughness of C. Simplicifolius. As depicted in Figure 2, the impact toughness initially increases with increasing heat treatment temperature until 160 °C where a maximum value is reached. Similarly, the impact toughness exhibits a similar trend with respect to heat treatment time, peaking at 68.59 kJ/m2 after 1 h of treatment. Moreover, higher pressures lead to a significant decrease in the impact toughness of C. Simplicifolius. Consequently, employing a single-factor analysis allows for determining the optimal heat treatment condition: a temperature of 160 °C, a duration of 1 h, and a pressure level of 0.1 MPa.

3.2. The Response Surface Optimization of Steam Heat Treatment Condition

According to the results of the aforementioned single-factor test, the response conditions for the steam heat treatment of C. Simplicifolius cane were set as follows: a temperature of 160 °C, a duration of 1 h, and a pressure of 0.1 MPa. The impact toughness was considered as the response value. To determine the optimal condition for steam heat treatment, a Box–Behnken (BBD) design was employed. The complete design comprises 17 runs to optimize the levels of selected variables. Table 1 presents the experimental range (maximum and minimum) and levels of independent variables in accordance with the requirements specified by the Box–Behnken design.

3.2.1. Experimental Design for the Response Surface Method and Results

Using Design-Expert 12 software, the data in Table 2 were fitted with multiple linear regression and quadratic terms, and a quadratic regression equation with impact toughness as the objective function was obtained.
Y = 40.75 − 3.06A − 1.11B − 22.42C − 2.59AB − 0.32AC + 1.04BC − 8.11A2 − 8.00B2 + 5.96C2
whereas the predicted R2 is 0.9557, and the adjusted R2 of 0.9903 indicates a high level of significance for the model used [30]. This suggests that the model demonstrates a strong correlation between the response and independent variables, as evidenced by an R2 value close to unity [31,32], thereby demonstrating its ability to accurately predict the impact toughness of C. simplicifolius cane.
The regression model was evaluated using an analysis of variance (ANOVA) test, as presented in Table 3. The significant F-value of 182.66 indicates the significance of the model, with a negligible probability (0.01%) of noise. Generally, p-values less than 0.05 indicate the significance of variables, while values greater than 0.1 suggest insignificance for parameters [29]. Specifically, the p-values for model terms A, C, AB, AC, A2, B2, and C2 demonstrate their significant impacts on the impact toughness.
The lack-of-fit F-value of 2.14 is not significant statistically compared to the pure error, suggesting that it does not have a substantial impact on the model’s fit. There is a 23.82% probability that such a large lack-of-fit F-value may occur due to random variation alone. The insignificance of the lack of fit indicates favorable model fitting.

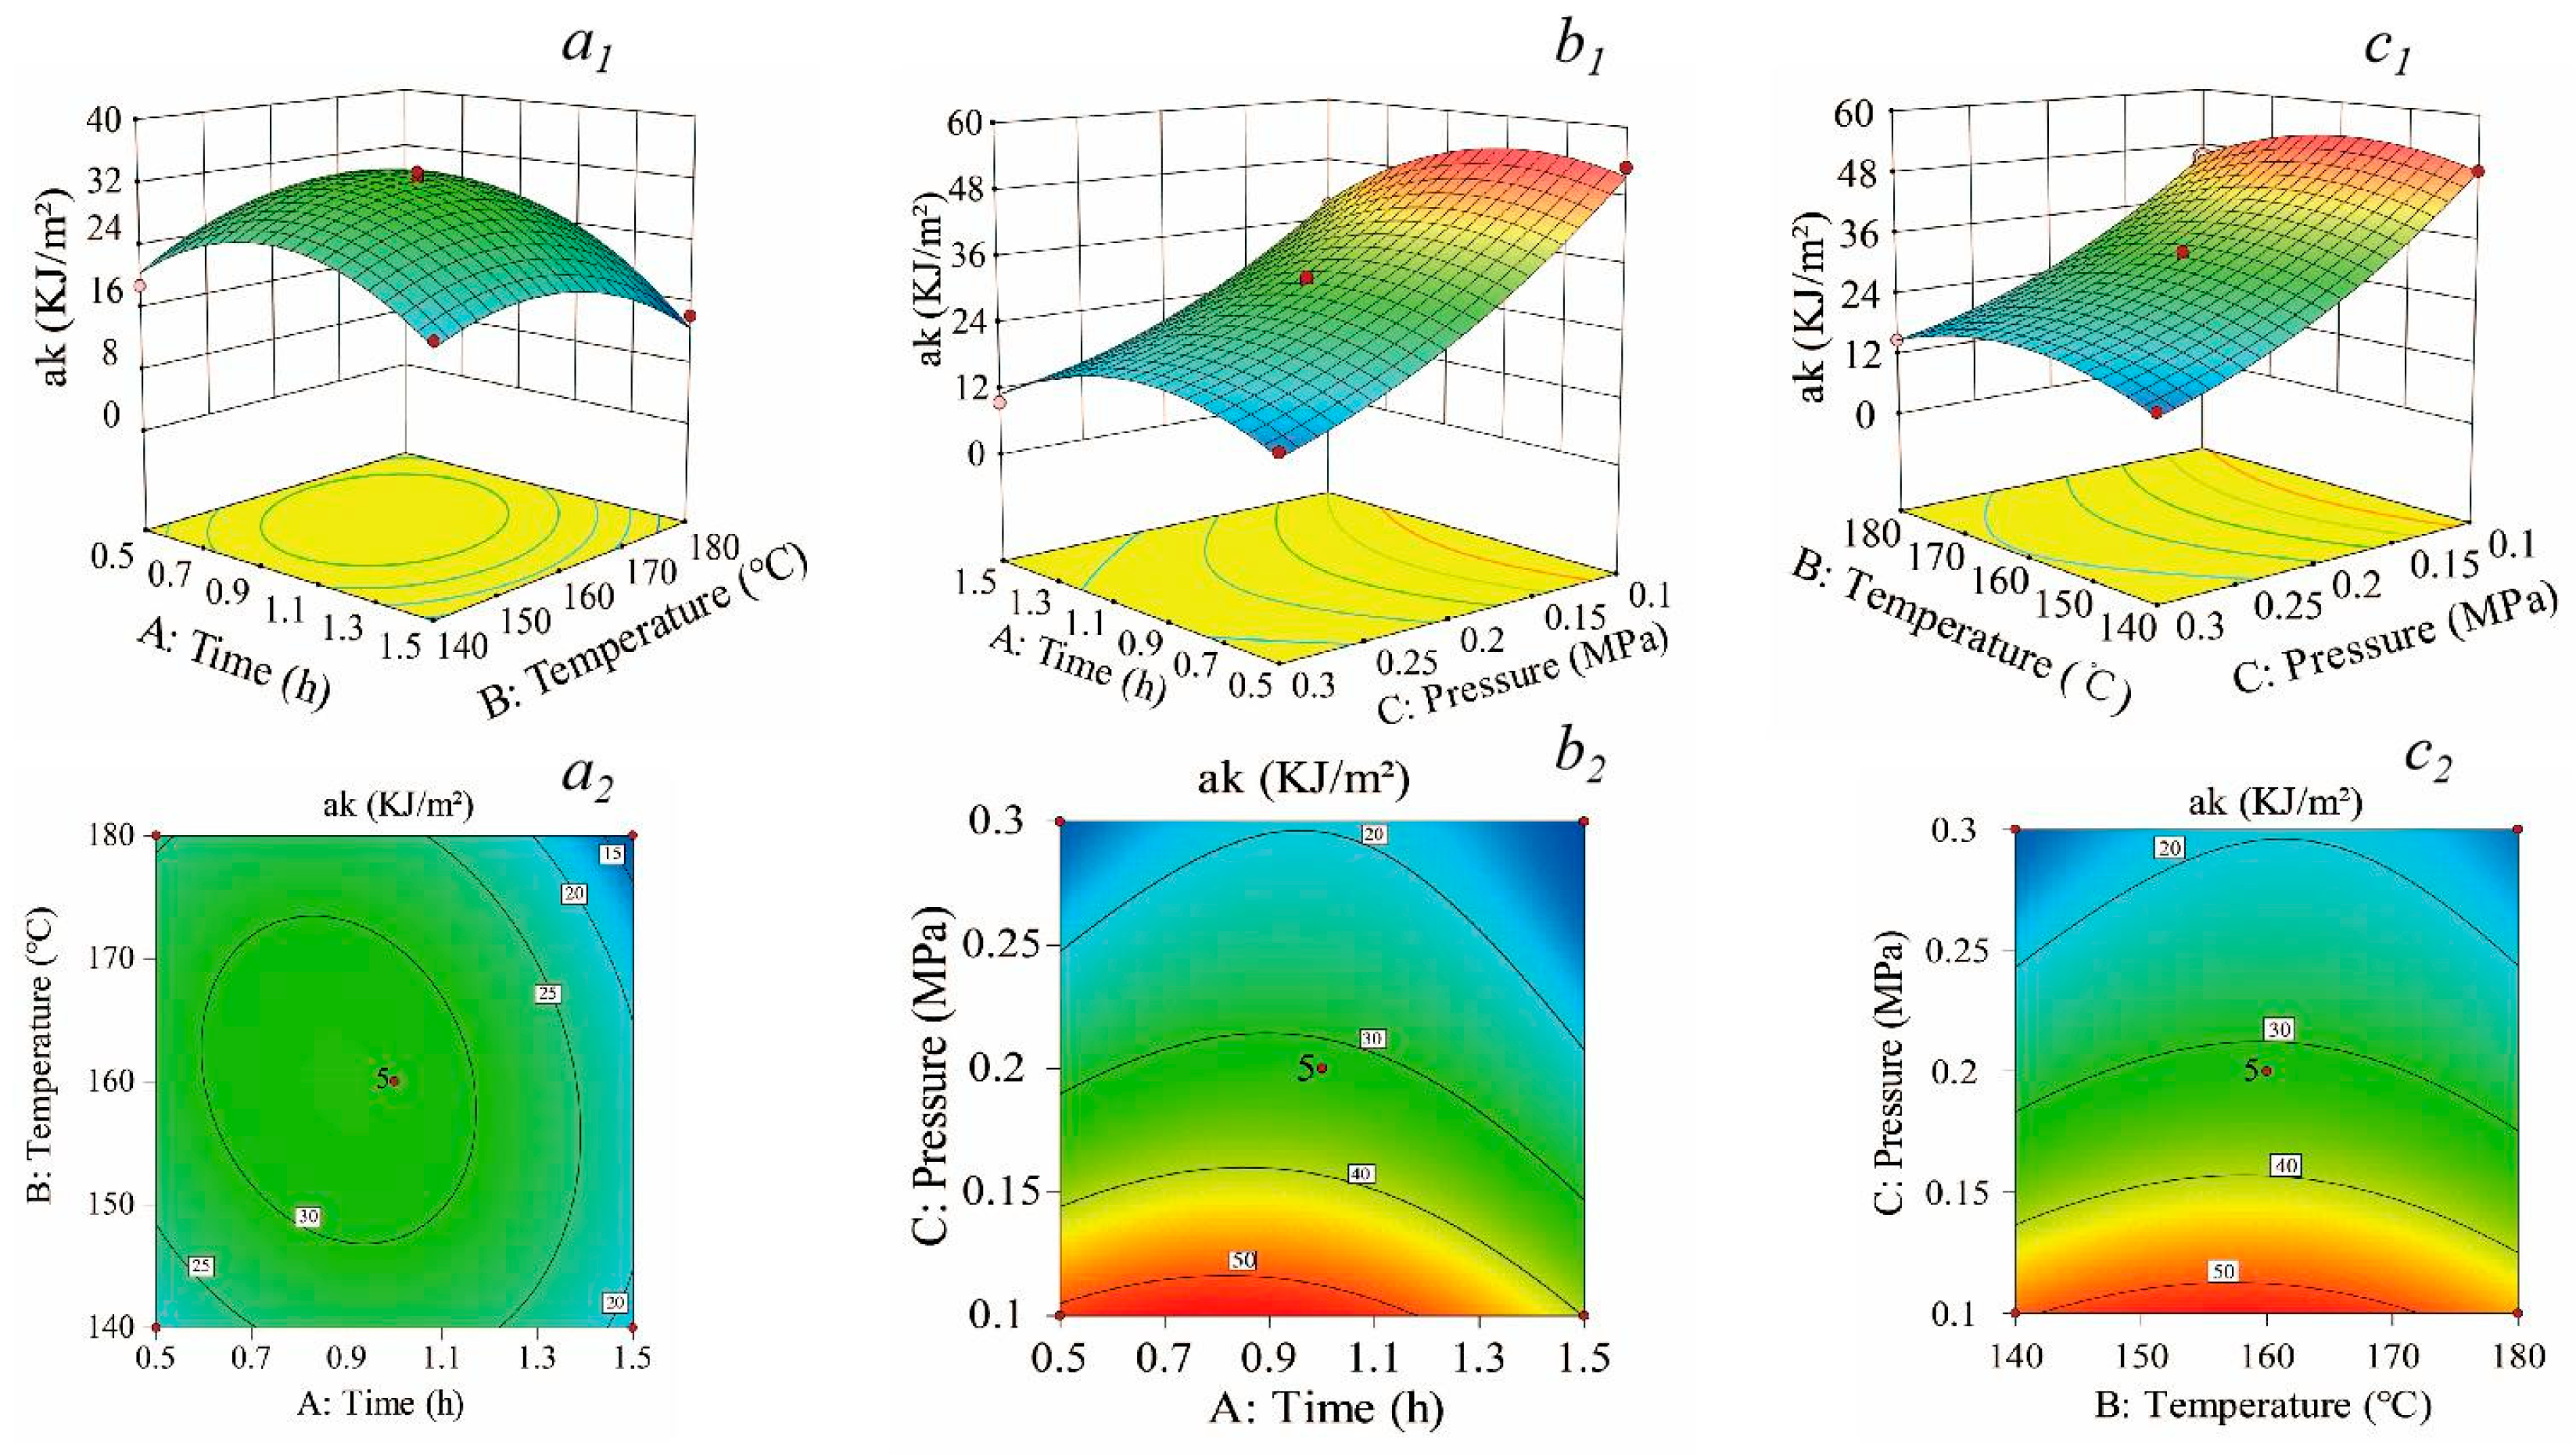
3.2.2. Interaction Analysis of Each Factor

Surface contour plots visually depict the impacts of factor interactions on the response values. When the contour lines are elliptical, the differences are significant statistically. When they are circular, the differences are not significant [33]. Figure 3 presents 3D surface and contour plots for evaluating the interactions between steam-heat-treated temperature, time, and pressure on the impact toughness response. As shown in Figure 3, there are no apparent interactions among these factors as indicated by circular contours and a relatively gentle slope in the surface plot. Through the analysis and optimization of the response surface, the optimal treatment process consists of a heat treatment time of 0.93 h at a temperature of 157.84 °C under a pressure of 0.1 MPa with a predicted impact toughness value of 69.46 KJ/m2. Considering practical test operability, a treatment duration of 1 h at a temperature of 160 °C under a pressure of 0.1 MPa was selected, resulting in an average impact toughness value obtained from five repeated tests measured as 68.59 KJ/m2.

3.3. Chemical Composition Changes

To investigate the impact of heat treatment on the chemical composition of C. Simplicifolius, we analyzed samples subjected to the optimal heat treatment conditions (R160), untreated samples (RUN), and samples treated at the highest temperature (R200) for 1 h under a pressure of 0.1 MPa. The results from the chemical composition analysis show that cellulose content and hemicellulose content decrease with increasing treatment temperature (Table 4). Similar findings were reported by Li et al. (2018) [12]. Additionally, there are no significant differences in cellulose content and hemicellulose content between samples treated at 160 °C and 200 °C. The increase in lignin content observed in the treated samples may be attributed to treatment-induced condensation and cross-link reactions of lignin or the production of compounds containing aromatic ring products [34]. Both R160 and R200 exhibit a higher lignin content compared to RUN. Generally, an elevation in temperature leads to a gradual increase in the lignin mass fraction accompanied by a simultaneous decrease in carbohydrate content [35]. Furthermore, the heat-treated samples show an increased alcohol-benzene extractive content compared to the untreated samples, with R200 exhibiting a higher level than R160. This trend is consistent with changes observed in lignin content.

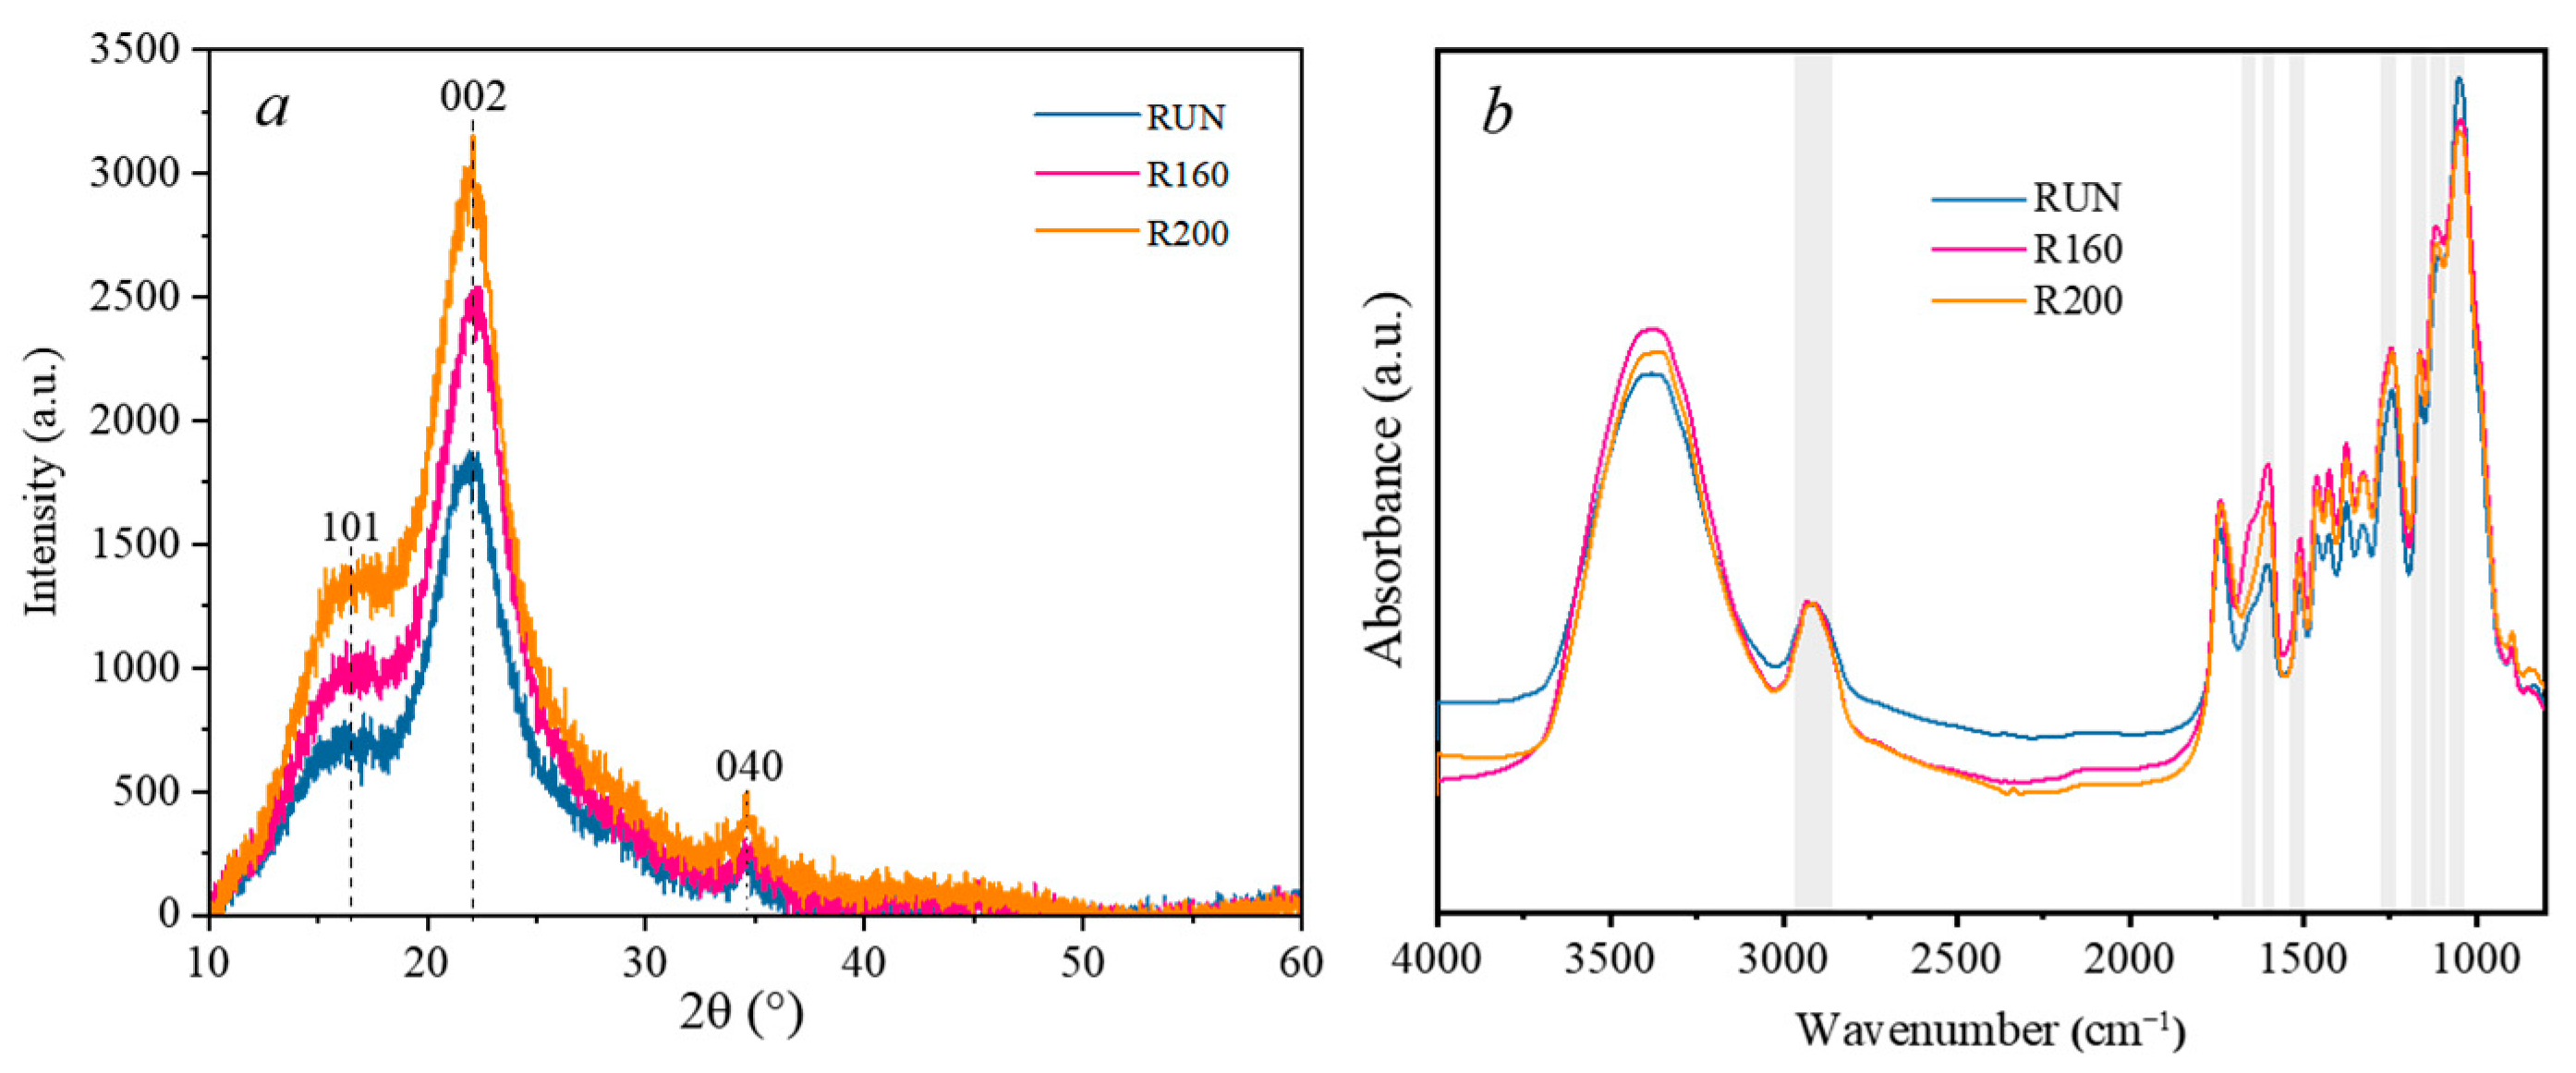
3.4. X-ray Diffraction (XRD) Analysis

The X-ray diffraction intensity curves and crystallization characteristics of C. Simplicifolius under three treatment conditions are presented in Figure 4 and Table 5. As depicted in Figure 4a, the diffraction peak position of C. Simplicifolius remains relatively stable after the heat treatment. Specifically, the (200) crystal plane diffraction peaks of C. Simplicifolius under all three treatments concentrate in a narrow range of 22–22.1°. Moreover, compared to the untreated samples, treated samples at temperatures of 160 °C and 200 °C have a higher X-ray diffraction intensity and relative crystallinity. The relative crystallinity values were determined as follows: 37.89% for specimens treated at 200 °C, 36.75% for those treated at 160 °C, and finally, a value of 35.83% was obtained for the untreated samples. Cellulose consists of both a crystalline region and an amorphous region. The observed increase in crystallinity may be attributed to water loss through condensation from hydroxyl groups within the amorphous region when exposed to specific temperatures [36]. Consequently, this leads to enhanced orderliness between microfibrils within the amorphous region and proximity to the crystalline region, resulting in an overall increase in relative crystallinity.

3.5. Fourier Transform Infrared (FTIR) Spectra

The chemical composition and functional groups of the untreated and heat-treated C. Simplicifolius were investigated using Fourier transform infrared (FTIR) spectra, as depicted in Figure 4b. The C-H bonds, which exhibit a peak value at 2900 cm−1, were selected as a reference due to their minimal changes during the heat treatment [37]. The absorption bands observed at 1049 cm−1 and 1650 cm−1 were assigned to the stretching vibrations of C-O in hemicelluloses and the bending vibrations of crystallization water, respectively [38,39]. The change in peak intensity at 1049 cm−1 is attributed to the preferential degradation of hemicelluloses at temperatures above 160 °C compared to other constituents [40]. A reduction in intensity at 1631 cm−1 indicates a decrease in hygroscopicity for heat-treated C. Simplicifolius [41,42]. The peaks observed at 1247 cm−1 (C-O stretching vibration of Ph-O-C) and 1511 cm−1/1598 cm−1 (C=C stretching of aromatic skeleton) correspond to characteristic signals of lignin. Peaks observed at 1112 cm−1 (glucose ring stretching vibration) and 1164 cm−1 (C-O-C stretching vibration) correspond to characteristic signals of cellulose [43,44,45]. Following the heat treatment, there is an increase in relative intensity between cellulose and hemicelluloses, which may be attributed to the thermal degradation of hemicelluloses. These results are consistent with both chemical component analysis findings and previous studies [40,46].

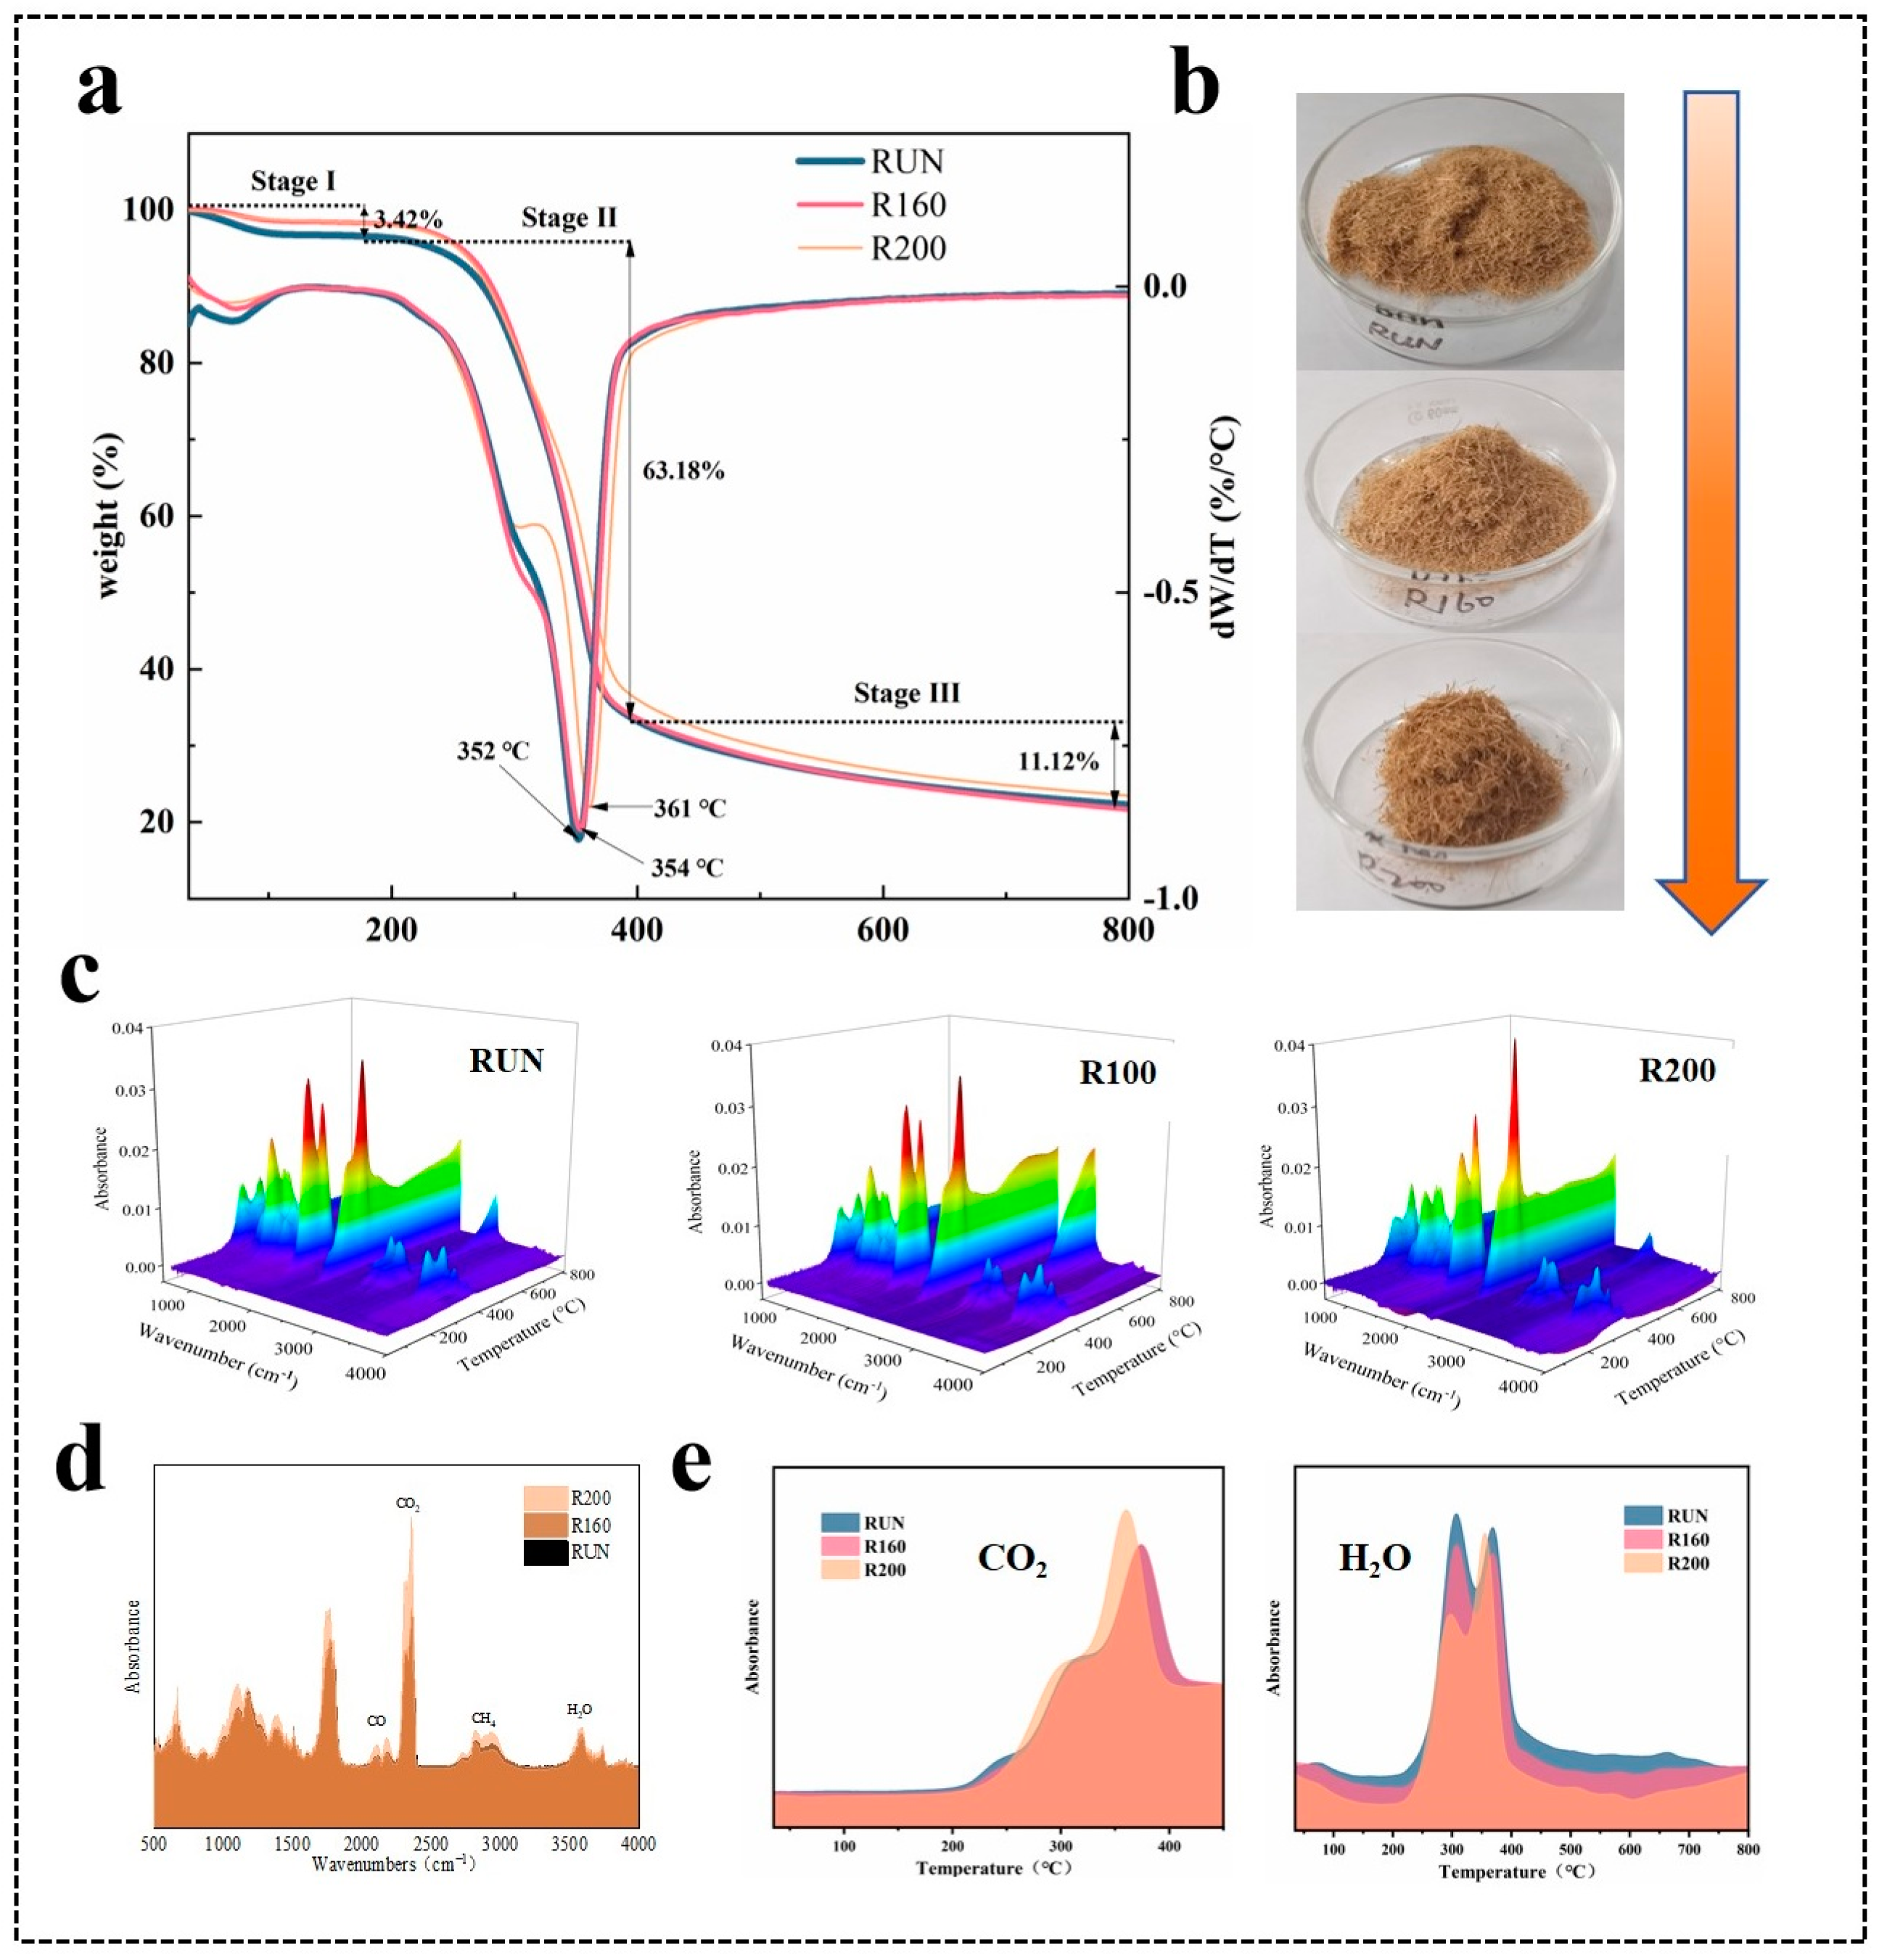
3.6. Thermogravimetry (TG)

The TG and DTG curves of the untreated and treated C. Simplicifolius are presented in Figure 5a, illustrating three distinct weight-loss stages observed in the temperature range of 30–200 °C, 200–400 °C, and 400–800 °C. It is noteworthy that all three samples undergo processes involving moisture loss, ash removal, and carbonization, which aligns with previous studies [47]. Additionally, Table 6 summarizes the mass loss of the three samples during pyrolysis. Initially, in the first stage, the mass loss rates for the three samples are recorded as 3.42%, 1.79%, and 1.87%, respectively, primarily attributed to moisture evaporation [48]. Following the steam heat treatment, a reduction in water content by approximately 45.32% and 42.40% was observed in C. Simplicifolius samples. This difference may be attributed to an increase in relative crystallinity and crystal size induced by heated steam treatment [49], coupled with reduced water content levels. At the second stage with higher temperatures, pyrolysis residues account for approximately 33.40%, 33.84%, and 36. 57% for each respective sample analyzed; hereinafter, the steam heat treatment further amplifies mass losses across all samples examined herein. However, cellulose and hemicellulose remain primary components undergoing pyrolysis during this stage [50,51]. These findings further support that following the steam heat treatment, the relative lignin content increases, whereas cellulose and hemicellulose contents decrease, which is consistent with the chemical composition analysis results.
Interestingly, the TG-DTG curves reveal a distinct shoulder peak around 300 °C for sample R200, indicating a decrease in hemicellulose content and an increase in the relative lignin content. Consequently, the thermal stability of the sample improves while the pyrolysis rate decreases [52]. Moreover, following the treatment, C. Simplicifolius exhibits maximum pyrolysis peaks at 352 °C, 354 °C, and 361 °C, respectively. This suggests that thermal stability shows a gradual enhancement. Furthermore, at the third stage of pyrolysis, the residues for the rattan samples are recorded as 21.64%, 22.25%, and 23.48%. Notably, lignin becomes the primary pyrolysis product at this stage [20]. Therefore, it is consistent with the chemical composition analysis that sample R200 demonstrates the highest mass loss rate during this stage. However, it should be noted that compared to untreated samples in this stage, there is a little pyrolysis mass loss for sample R160 due to slight differences in lignin content and mass between them according to chemical composition analysis results.
Figure 5c presents a three-dimensional FTIR spectrum analysis of the gas products generated during the pyrolysis process. The primary FTIR absorption peaks at 3560 cm−1, 2930 cm−1, 2360 cm−1, 2180 cm−1, 1060 cm−1, and 1758 cm−1 correspond to the generation of water, alkanes, carbon dioxide, and CO [53]. Figure 5d shows the spectra of pyrolysis gases at the temperatures corresponding to maximum mass loss (352 °C, 354 °C, and 361 °C) before and after the steam heat treatments. The gas components produced by pyrolysis remain consistent. However, there are slight differences in their content. This indicates that while the internal components of the rattan including cellulose, hemicellulose, and lignin remain unchanged after the treatment, the relative contents of these components have changed. To further investigate its components’ behavior during pyrolysis temperature variations, water and carbon dioxide generated from the rattan pyrolysis were separately plotted (Figure 5e). It is clear that sample R200 exhibits the maximum release of CO2 during pyrolysis at a temperature of approximately 360 °C. In relation, RUN samples show a shift towards lower temperatures. This indicates an abundance of C-O and -COOH groups present in cellulose and hemicellulose, which undergo cracking reactions, releasing most of the carbon dioxide [54], suggesting a decrease in cellulose and hemicellulose content within these components. Above 200 °C, a dehydration reaction occurs mainly due to hydroxylic compounds present in cellulose and hemicelluloses, leading to water release [19]. Furthermore, the intensity of the H2O release increases gradually with increasing treatment temperature. This confirms the conclusion regarding decreased content of cellulose and hemicellulose throughout the components.

3.7. The Influence of Heat Treatment on Impact Toughness

The increase in crystallinity theoretically leads to an increase in mechanical strength, such as bending properties, impact toughness, etc. Heat treatment will also lead to the decomposition of chemical components, so the change in mechanical properties is the result of the comprehensive action after heat treatment. After heat treatment, the impact toughness of the R160 sample increased to a certain extent compared with that of the RUN sample, while the impact toughness of the R200 sample decreased significantly (Figure 6). This result can be considered as the joint effect of the change in cellulose crystallinity and chemical composition content. When the heat treatment temperature is low, it is mainly the crystallinity of cellulose that plays a major role in enhancing the mechanical strength. With the increase in temperature, hemicellulose and cellulose degrade, and lignin content increases, which makes the brittleness of the single-leaf canina strengthen, and thus the impact toughness decreases.

4. Conclusions

The steam heat treatment process of C. Simplicifolius was optimized using the response surface analysis, and the impact toughness was determined under the optimal conditions. The results show that a heat treatment for 1 h at a temperature of 160 °C and pressure of 0.1 MPa results in an impact toughness of 68.59 kJ/m2. The experimental findings are consistent with those predicted by the response surface analysis for impact toughness.
The extractive content of the heat-treated rattan is higher than the untreated samples, while the cellulose and hemicellulose contents decrease and the relative lignin content increases with increasing temperature. Heat treatment slightly improves the relative crystallinity of the rattan. FTIR results indicate that functional groups remain unchanged under different treatments, suggesting no significant changes in the main chemical structure. TG curves show that all three samples have a maximum weight loss ratio during stage II, mainly due to pyrolysis of cellulose and hemicellulose. Combined FTIR results reveal similar types of pyrolysis gas but different contents among the three samples.

Author Contributions

M.X. and X.L.: methodology; Z.W., Z.L. and Z.S.: software; L.S.: validation; M.X., X.L., G.T. and J.M.: formal analysis; M.X.: data curation; M.X.: writing—original draft preparation. All authors have read and agreed to the published version of the manuscript.

Funding

This research was funded by the Basic Research Fund project of the International Center for Bamboo and Rattan (No. 1632020027).

Data Availability Statement

The data presented in this study are available on request from the corresponding author.

Conflicts of Interest

The authors declare no conflicts of interest.

References

  1. Vorontsova, M.S.; Clark, L.G.; Dransfield, J.; Govaerts, R.; Baker, W.J. World Checklist of Bamboos and Rattans; INBAR: Beijing, China; Royal Botanic Gardens: Kew, UK, 2016. [Google Scholar]
  2. Jiang, Z.; Wang, K. Handbook of Rattan in China; Science Press: Beijing, China, 2018; ISBN 9787030572257. [Google Scholar]
  3. Wang, K.-L. Myrialepis, a newly recorded genus in China. Plant Sci. J. 2018, 36, 11–16. [Google Scholar]
  4. Bhat, K.M.; Thulasidas, P.K.; Mohamed, C.P. Strength properties of ten South Indian canes. J. Trop. For. Sci. 1992, 5, 26–34. [Google Scholar]
  5. Lv, W.H.; Jiang, Z.H.; Liu, X.E.; Liu, J.L. Causes and Removal of Da emonorops margaritae Cane’s Discoloration. Adv. Mater. Res. 2013, 634, 909–912. [Google Scholar] [CrossRef]
  6. Hamid, N.H.; Hale, M. Decay threshold of acetylated rattan against white and brown rot fungi. Int. Wood Prod. J. 2012, 3, 96–106. [Google Scholar] [CrossRef]
  7. Sanusi, D. Rotan: Kekayaan Belantara Indonesia; Firstbox Media: Jakarta, Indonesia, 2019. [Google Scholar]
  8. Yang, L.; Liu, X.; Jiang, Z.; Tian, G.; Yang, S.; Shang, L. Compressive strength parallel to the grain in relation to moisture content in Calamus simplicifolius cane. For. Prod. J. 2020, 70, 309–316. [Google Scholar]
  9. Sandberg, D.; Haller, P.; Navi, P. Thermo-hydro and thermo-hydro-mechanical wood processing: An opportunity for future environmentally friendly wood products. Wood Mater. Sci. Eng. 2013, 8, 64–88. [Google Scholar] [CrossRef]
  10. Han, X.; Lou, Z.; Yuan, C.; Wu, X.; Liu, J.; Weng, F.; Li, Y. Study on the effect of two-step saturated steam heat treatment process on the properties of reconstituted bamboo. J. Renew. Mater. 2022, 10, 3313. [Google Scholar] [CrossRef]
  11. Wang, D.; Lin, L.; Fu, F. Fracture mechanisms of moso bamboo (Phyllostachys pubescens) under longitudinal tensile loading. Ind. Crops Prod. 2020, 153, 112574. [Google Scholar] [CrossRef]
  12. Li, D. Effect of High Temperature Heat Treatment on Properties of Single Leaf Vine; Anhui Agricultural University: Hefei, China, 2018. [Google Scholar]
  13. Kučerová, V.; Lagaňa, R.; Hýrošová, T. Changes in chemical and optical properties of silver fir (Abies alba L.) wood due to thermal treatment. J. Wood Sci. 2019, 65, 21. [Google Scholar] [CrossRef]
  14. Hoseinzadeh, F.; Zabihzadeh, S.M.; Dastoorian, F. Creep behavior of heat treated beech wood and the relation to its chemical structure. Constr. Build. Mater. 2019, 226, 220–226. [Google Scholar] [CrossRef]
  15. Yuan, T.; Huang, Y.; Zhang, T.; Wang, X.; Li, Y. Change in micro-morphology and micro-mechanical properties of thermally modified Moso bamboo. Polymers 2022, 14, 646. [Google Scholar] [CrossRef] [PubMed]
  16. Esteves, B.; Ferreira, H.; Viana, H.; Ferreira, J.; Domingos, I.; Cruz-Lopes, L.; Jones, D.; Nunes, L. Termite resistance, chemical and mechanical characterization of Paulownia tomentosa wood before and after heat treatment. Forests 2021, 12, 1114. [Google Scholar] [CrossRef]
  17. Gao, Q.; Feng, Z.; He, Y.; Hou, Y.; Ren, H.; Su, M.; Ni, L.; Liu, Z. Pyrolysis self-activation: An environmentally friendly method to transform biowaste into activated carbon for arsenic removal. Bioresour. Technol. 2023, 368, 128353. [Google Scholar] [CrossRef] [PubMed]
  18. Zhang, Y.; Yu, Y.; Lu, Y.; Yu, W.; Wang, S. Effects of heat treatment on surface physicochemical properties and sorption behavior of bamboo (Phyllostachys edulis). Constr. Build. Mater. 2021, 282, 122683. [Google Scholar] [CrossRef]
  19. Wu, S.C.; Wang, Y.C. The anatomical structure and mechanical properties of Calamus orientalis. For. Prod. Ind. 1990, 9, 79–89. [Google Scholar]
  20. Ahmed, S.A.; Hosseinpourpia, R.; Brischke, C.; Adamopoulos, S. Anatomical, physical, chemical, and biological durability properties of two rattan species of different diameter classes. Forests 2022, 13, 132. [Google Scholar] [CrossRef]
  21. Lee, S.H.; Ashaari, Z.; Lum, W.C.; Halip, J.A.; Ang, A.F.; Tan, L.P.; Chin, K.L.; Tahir, P.M. Thermal treatment of wood using vegetable oils: A review. Constr. Build. Mater. 2018, 181, 408–419. [Google Scholar] [CrossRef]
  22. Tian, C.; Wu, D. Mechanical properties of ZSM-5 extruded catalysts: Calcination process optimization using response surface methodology. Chem. Eng. Commun. 2021, 208, 1594–1606. [Google Scholar] [CrossRef]
  23. Box, G.E.P.; Hunter, W.H.; Hunter, S. Statistics for Experimenters; John Wiley and sons: New York, NY, USA, 1978. [Google Scholar]
  24. Dean, A.; Voss, D. Design and Analysis of Experiments; Springer: New York, NY, USA, 1999. [Google Scholar]
  25. JG/T 199-2007; Testing Methods for Physical and Mechanicalproperties of Bamboo Used in Building. Ministry of Construction Engineering: Beijing, China, 2007.
  26. Santoso, A.; Pari, R. Quality of rattan board with lamination process using tannin-based adhesives. In IOP Conference Series: Materials Science and Engineering; IOP Publishing: Bristol, UK, 2020; Volume 935, p. 012029. [Google Scholar]
  27. Sluiter, A.; Hames, B.; Ruiz, R.; Scarlata, C.; Sluiter, J.; Templeton, D.; Crocker, D.L.A.P. Determination of structural carbohydrates and lignin in biomass. Lab. Anal. Proced. 2008, 1617, 1–16. [Google Scholar]
  28. GB/T 2677.6-1994; Fibrous Raw Material-Determination of Solvent Extractives. The State Bureau of Quality and Technical Supervision: Beijing, China, 1994.
  29. Biswas, B.; Pandey, N.; Bisht, Y.; Singh, R.; Kumar, J.; Bhaskar, T. Pyrolysis of agricultural biomass residues: Comparative study of corn cob, wheat straw, rice straw and rice husk. Bioresour. Technol. 2017, 237, 57–63. [Google Scholar] [CrossRef]
  30. Bao, G.-R.; Chen, S.-N.; Ling, X.; Bao, S.-D.; Ha, S.; Li, F.-Q. Optimization of Cellulose Extraction from Buckwheat Straw Using Box-Behnken Response Surface Methodology. Chem. Res. Appl. 2023, 35, 532–538. [Google Scholar]
  31. Jeradechachai, T. Application of Response Surface Methodology in the Development of Gluten-Free Bread with Yellow Pea Flour Addition. Ph.D. Thesis, North Dakota State University, Fargo, ND, USA, 2012. [Google Scholar]
  32. Wang, X.; Zhang, T. Optimization on tartary buckwheat enriched steamed bread: A response surface methodology study. J. Food Process. 2015, 2015, 785042. [Google Scholar] [CrossRef]
  33. Alben, K.T. Books and Software: Design, analyze, and optimize with Design-Expert. Anal. Chem. 2002, 74, 222A–223A. [Google Scholar] [CrossRef]
  34. Boonstra, M.J.; Tjeerdsma, B. Chemical analysis of heat treated softwoods. Eur. J. Wood Wood Prod. 2006, 64, 204–211. [Google Scholar] [CrossRef]
  35. Alén, R.; Kotilainen, R.; Zaman, A. Thermochemical behavior of Norway spruce (Picea abies) at 180–225 C. Wood Sci. Technol. 2002, 36, 163–171. [Google Scholar] [CrossRef]
  36. Sun, R.H.; Li, X.J.; Liu, Y.; Hou, R.G.; Qiao, J.Z. Effects of high temperature heat treatment on FTIR and XRD characteristics of bamboo bundles. J. Cent. South Univ. For. Technol. 2013, 33, 97–100. [Google Scholar]
  37. Meng, F.; Yu, Y.; Zhang, Y.; Yu, W.-J.; Gao, J.-M. Surface chemical composition analysis of heat-treated bamboo. Appl. Surf. Sci. 2016, 371, 383–390. [Google Scholar] [CrossRef]
  38. Părpăriţă, E.; Nistor, M.T.; Popescu, M.C.; Vasile, C. TG/FT–IR/MS study on thermal decomposition of polypropylene/biomass composites. Polym. Degrad. Stab. 2014, 109, 13–20. [Google Scholar] [CrossRef]
  39. Todorović, N.; Popović, Z.; Milić, G. Estimation of quality of thermally modified beech wood with red heartwood by FT-NIR spectroscopy. Wood Sci. Technol. 2015, 49, 527–549. [Google Scholar] [CrossRef]
  40. Kocaefe, D.; Poncsak, S.; Boluk, Y. Effect of thermal treatment on the chemical composition and mechanical properties of birch and aspen. BioResources 2008, 3, 517–537. [Google Scholar] [CrossRef]
  41. Kotilainen, R.A.; Toivanen, T.J.; Alén, R.J. FTIR monitoring of chemical changes in softwood during heating. J. Wood Chem. Technol. 2000, 20, 307–320. [Google Scholar] [CrossRef]
  42. Huang, X.; Kocaefe, D.; Kocaefe, Y.; Boluk, Y.; Pichette, A. Study of the degradation behavior of heat-treated jack pine (Pinus banksiana) under artificial sunlight irradiation. Polym. Degrad. Stab. 2012, 97, 1197–1214. [Google Scholar] [CrossRef]
  43. Salem, K.S.; Kasera, N.K.; Rahman, M.A.; Jameel, H.; Habibi, Y.; Eichhorn, S.J.; French, A.D.; Pal, L.; Lucia, L.A. Comparison and assessment of methods for cellulose crystallinity determination. Chem. Soc. Rev. 2023, 52, 6417–6446. [Google Scholar] [CrossRef] [PubMed]
  44. Kostryukov, S.G.; Matyakubov, H.B.; Masterova, Y.Y.; Kozlov, A.S.; Pryanichnikova, M.K.; Pynenkov, A.A.; Khluchina, N.A. Determination of lignin, cellulose, and hemicellulose in plant materials by FTIR spectroscopy. J. Anal. Chem. 2023, 78, 718–727. [Google Scholar] [CrossRef]
  45. Popescu, M.C.; Froidevaux, J.; Navi, P.; Popescu, C.-M. Structural modifications of Tilia cordata wood during heat treatment investigated by FT-IR and 2D IR correlation spectroscopy. J. Mol. Struct. 2013, 1033, 176–186. [Google Scholar] [CrossRef]
  46. Guo, F.; Zhang, X.; Yang, R.; Salmén, L.; Yu, Y. Hygroscopicity, degradation and thermal stability of isolated bamboo fibers and parenchyma cells upon moderate heat treatment. Cellulose 2021, 28, 8867–8876. [Google Scholar] [CrossRef]
  47. Wang, X.; Wang, X.; Qin, G.; Chen, M.; Wang, J. Kinetic Study of Pine Wood Pyrolysis Using Thermogravimetric Analysis. J. Biobased Mater. Bioenergy 2018, 12, 97–101. [Google Scholar] [CrossRef]
  48. Li, D.; Yang, S.; Liu, Z.; Wang, Z.; Ji, N.; Liu, J. Effects of heat treatment under different pressures on the properties of bamboo. Polymers 2023, 15, 3074. [Google Scholar] [CrossRef]
  49. Xiang, E.; Huang, R.; Yang, S. Change in micromechanical behavior of surface densified wood cell walls in response to superheated steam treatment. Forests 2021, 12, 693. [Google Scholar] [CrossRef]
  50. Li, Y.; Du, L.; Kai, C.; Huang, R.; Wu, Q. Bamboo and high density polyethylene composite with heat-treated bamboo fiber: Thermal decomposition properties. BioResources 2013, 8, 900–912. [Google Scholar] [CrossRef]
  51. Yang, H.; Yan, R.; Chen, H.; Lee, D.H.; Zheng, C. Characteristics of hemicellulose, cellulose and lignin pyrolysis. Fuel 2007, 86, 1781–1788. [Google Scholar] [CrossRef]
  52. Wu, J.; Zhong, T.; Zhang, W.; Shi, J.; Fei, B.; Chen, H. Comparison of colors, microstructure, chemical composition and thermal properties of bamboo fibers and parenchyma cells with heat treatment. J. Wood Sci. 2021, 67, 1–11. [Google Scholar] [CrossRef]
  53. Chen, R.; Lun, L.; Cong, K.; Li, Q.; Zhang, Y. Insights into pyrolysis and co-pyrolysis of tobacco stalk and scrap tire: Thermochemical behaviors, kinetics, and evolved gas analysis. Energy 2019, 183, 25–34. [Google Scholar] [CrossRef]
  54. Dong, Z.; Liu, Z.; Zhang, X.; Yang, H.; Li, J.; Xia, S.; Chen, Y.; Chen, H. Pyrolytic characteristics of hemicellulose, cellulose and lignin under CO2 atmosphere. Fuel 2019, 256, 115890. [Google Scholar] [CrossRef]
Figure 1. Preparation process of C. Simplicifolius specimens.
Forests 15 00615 g001
Figure 2. Impact toughness under different heat treatment conditions. (a) Treatment times; (b) temperatures; (c) pressure.
Forests 15 00615 g002
Figure 3. Three-dimensional surface and contour plots indicating the effects on impact toughness. (a1,a2) The effects of time and temperature; (b1,b2) the effects of time and pressure; (c1,c2) the effects of temperature and pressure.
Forests 15 00615 g003
Figure 4. FTIR spectra (a) and XRD pattern (b) of C. Simplicifolius with different treatments.
Forests 15 00615 g004
Figure 5. Pyrolysis characteristics of three samples. (a) TG and DTG curves; (b) optical photograph; (c) 3D infrared spectra of pyrolysis gases; (d) single infrared spectra of pyrolysis gases at 352 °C, 354 °C, and 361 °C, respectively; (e) FTIR spectrum of CO2 and H2O with temperature.
Forests 15 00615 g005
Figure 6. Changes in impact toughness of C. Simplicifolius under different heat treatment conditions.
Forests 15 00615 g006
Table 1. Factors and levels used in the response surface design.
FactorLevels
−101
A: Time/h0.511.5
B: Temperature/℃140160180
C: Pressure/MPa0.10.20.3
Table 2. Response values and regression results of the steam heat treatment process for the rattan.
Run OrderABCak: kJ/m2
101−157.35
210−159.71
30−1−162.71
4−10−164.54
5−11030.01
601116.79
700038.41
810112.03
9−1−1026.03
101−1024.43
1100040.85
1200041.29
13−10118.14
1400041.01
1500042.18
160−1117.97
1711018.08
Table 3. Analysis of variance (ANOVA) of the response surface quadratic model for impact toughness.
SourceSum of SquaresDegrees of FreedomMean SquareF-Valuep-Value
Model4823.989536.00182.66<0.0001significant
A—Time74.87174.8725.510.0015
B—Temperature9.9419.943.390.1083
C—Pressure4022.1214022.121370.63<0.0001
AB26.75126.759.120.0194
AC0.412810.41280.14070.7187
BC4.3614.361.490.2621
A2276.751276.7594.31<0.0001
B2269.641269.6491.89<0.0001
C2149.711149.7151.020.0002
Residual20.5472.93
Lack of Fit12.6534.222.140.2382not significant
Pure
Error
7.8941.97
Cor Total4844.5216
Table 4. Chemical composition of the rattan under three treatments.
TreatmentAlcohol-Benzene Extractives (%)Glucose (%)Xylose (%)Lignin (%)
Acid-SolubleAcid-Insoluble
RUN2.9338.3021.903.5220.3
R1605.0430.7021.003.3921.4
R2006.5929.6020.704.2624.5
Table 5. Crystallization characteristics of C. Simplicifolius under three treatments.
Treatment(002) Crystal Plane Angle (°)I002Relative Crystallinity (%)
RUN22.05303535.83
R16022.02406536.75
R20022.07473237.89
Table 6. The residual weight of three samples at different pyrolysis stages.
TreatmentStage I (%)Stage II (%)Stage III (%)
RUN96.5833.4021.64
R16098.2133.8422.25
R20098.1336.5723.48
Disclaimer/Publisher’s Note: The statements, opinions and data contained in all publications are solely those of the individual author(s) and contributor(s) and not of MDPI and/or the editor(s). MDPI and/or the editor(s) disclaim responsibility for any injury to people or property resulting from any ideas, methods, instructions or products referred to in the content.

