Article

A Study of the Influence of the Type of Land Use on the Enzymatic Activity of Soils in Southwestern China

1
Key Laboratory of Southwest China Wildlife Resources Conservation (Ministry of Education), College of Life Sciences, China West Normal University, Nanchong 637009, China
2
Ecological Security and Protection Key Laboratory of Sichuan Province, Mianyang Normal University, Mianyang 621000, China
3
Hawkesbury Institute for the Environment, Western Sydney University, Penrith 2751, Australia
*
Authors to whom correspondence should be addressed.
Forests 2024, 15(4), 581; https://doi.org/10.3390/f15040581
Submission received: 27 February 2024 / Revised: 21 March 2024 / Accepted: 21 March 2024 / Published: 22 March 2024
(This article belongs to the Special Issue Ecosystem-Disturbance Interactions in Forests)

Abstract

:
Although soil enzyme activity can act as an effective indicator of soil nutrient status, there is some uncertainty about its accuracy within soil depth across different land uses. To assess the effects of different land uses on the interactions between soil enzyme activity and nutrient status within different soil horizons, in this study we examined soil total carbon (C), nitrogen (N), and phosphorus (P) concentrations, pH, and the activities of five hydrolytic (i.e., amylase, invertase, cellulase, acid phosphatase, and urease) and three oxidative enzymes (i.e., catalase, dehydrogenase, and phenol oxidase) involved in C, N, and P acquisition and evaluated their interactions within the topsoil (0–10 cm), subsoil (10–20 cm), and deeper soil layer (20–30 cm) under various land uses (i.e., rice field, cultivated land, bamboo plantation, forest land, and barren land). We found that the levels of hydrolytic enzyme activities and nutrient concentrations were higher in the topsoil than the deeper layer. The hydrolytic enzyme activities were positive correlated with soil C, N, and P concentrations, while the activities of oxidative enzymes showed strong associations with soil pH. Furthermore, the results of fuzzy comprehensive evaluation models suggest that the overall enzyme activity can serve as an indicator of soil nutrient status in the topsoil and subsoil, but not in the deeper layer. The depth-specific nature of soil enzyme–nutrient relationships may be attributed to different land-use management practices. Our study highlights the complex interactions between soil nutrients, pH, and enzyme activities within soil profiles, and soil enzyme activity as an indicator of soil nutrient status is depth-dependent across the different land uses. The specific functional groups of enzymes and the gradients of resources and environmental conditions within the soil profile that is partly mediated by land use play crucial roles in shaping these relationships. Our results can also provide some new insights into sustainable soil management practices under the background of intense anthropogenic activities and global change.

1. Introduction

Land-use changes such as modification in land cover and land-use intensity have dramatically disrupted the soil carbon (C), nitrogen (N), and phosphorus (P) cycles and enzyme activities [1,2,3,4]. Croplands are typically subjected to high land-use intensity with intensive management practices such as regular tilling, fertilization, irrigation, and harvesting [5]. These practices accelerate organic matter decomposition and increase nutrient availability in the soil, thereby influencing enzyme production, activity, and the microbial communities involved in nutrient transformations [6,7]. In contrast, natural forests generally experience low land-use intensity with minimal anthropogenic disturbances [8,9]. As a result, forest soils exhibit slower decomposition rates and higher organic matter and C content [10]. Consequently, enzyme activities related to organic matter decomposition, nutrient mineralization, and uptake may differ compared to soils that undergo more intense human intervention. Plantations are characterized by higher levels of human intervention as they are managed for economic productivity. Studies have indicated that nutrient dynamics and enzyme activities in plantation soils are largely influenced by specific management practices and vegetation cover [11]. Since China launched ecological engineering with the “Grain for Green Program” (GFGP, also called the sloping land conversion program) in 1999, replacing cropland with bamboo plantation has been widely applied in the vast hilly erosion-prone areas of southwestern China to reduce soil erosion and increase farmers’ income [12]. However, there is limited knowledge regarding the effects of land use on soil nutrient dynamics and enzyme activities in the vast hilly erosion-prone areas of southwestern China, particularly in relation to natural forest, plantation, and agricultural ecosystems. Further research is needed to better understand these relationships and their implications for ecosystem functioning.
The distribution and activity of enzymes can vary with soil depth due to the presence of significant gradients in resources and environmental conditions within the soil profile [13]. Generally, C inputs and nutrient availability are the highest in the topsoil and decline in the lower horizons because the topsoil is rich in C substrates and nutrients from the input of root exudates, litter, root detritus, and fertilizer [14]. We, thus, could expect a decline in microbial abundance and enzyme activities along soil profiles and as numerous studies have confirmed [15,16]. The pH of the topsoil is typically lower due to the accumulation of organic acids and the release of carbon dioxide [17]. In contrast, subsoil and deeper layers often exhibit higher pH levels, mainly influenced by the leaching of acidic substances from the surface layers and the presence of mineral compounds that buffer the pH [18,19]. Consequently, soil enzyme activities may vary within the soil profile based on the optimal pH ranges required for enzyme activity [20]. However, land-use management practices such as fertilization, tillage, and irrigation can disrupt this natural gradient of resources and environmental conditions, and affect pH, nutrients, and enzyme activities in the soil profile. Studies have reported that chemical fertilization and conventional tillage caused larger variations in soil enzyme activities within soil profiles compared to organic fertilization and no tillage [21]. Excessive irrigation, for instance, can lead to the percolation of water throughout the soil profile, carrying away essential basic cations such as calcium and magnesium [22]. This leaching process can result in the accumulation of acidic substances, subsequently reducing the pH of the soil in the deeper layers and affecting enzyme activities [23,24]. These gradients in resource availability and environmental stress, which can be partly disrupted by land-use management practices within the soil profile, are likely the primary factors influencing the distribution and activity of soil enzymes [25].
Soil enzyme activities can be highly sensitive to disturbances in nutrient cycles, and the extent of this sensitivity may vary depend on the specific enzyme category. Soil enzyme activity is often considered an indicator of soil nutrient status and fertility. Higher enzyme activities are generally associated with improved nutrient cycling and organic matter decomposition, indicating a more active and productive soil ecosystem [26]. However, negative or decoupled relationships were found for specific enzyme categories based on biochemical activities (hydrolytic and oxidative enzymes) and biogeochemical processes (C-, N-, and P-acquisition enzymes) [27,28,29]. A synthetic study has revealed that combined N and P additions enhanced C-acquisition enzymes while single additions of either N or P significantly reduced oxidative and P-acquisition enzyme activities, respectively [30]. These inconsistent patterns suggest that relying on a single soil enzyme activity as a sole indicator of soil nutrient status or fertility is unlikely to be sufficient. Early studies have attempted to propose integral enzyme indices by including enzymes that are most strongly associated with soil nutrient status [31,32]. A recent study evaluated the simultaneous determination of two to three enzyme activities in the same soil sample using combined assays and found positive and significant correlations between soil organic C content and combined enzyme activities [33]. Therefore, the primary function of soil enzyme activities may lie in their role as an integrative indicator of changes in soil nutrient status resulting from external management or environmental factors. If this has been the case, the ability of soil enzyme activities to indicate soil nutrient status may vary within soil profiles because soil nutrient conditions vary at each depth. However, studies that integrate multiple enzyme activities and link it to soil nutrient status within a soil profile remain relatively rare.
In the current study, we investigated the soil total carbon (C), nitrogen (N), and phosphorus (P) concentrations, pH, and the activities of five hydrolytic (i.e., amylase, invertase, cellulase, acid phosphatase, and urease) and three oxidative enzymes (i.e., catalase, dehydrogenase, and phenol oxidase) involved in C, N, and P acquisition and evaluated their interactions within the topsoil (0–10 cm), subsoil (10–20 cm), and deeper soil layer (20–30 cm) under five types of land uses (i.e., rice field, cultivated land, bamboo plantation, forest land, and barren land). We hypothesized that the efficacy of enzymatic activities of soils as indicators of soil nutrient status was disrupted by soil depth across different land uses, due to soil depth-dependent availability of resources and environmental conditions depending on the different land covers and associated management practices.

2. Materials and Methods

2.1. Study Sites

The study area is located in the vast hilly erosion-prone areas of northeastern Sichuan Province (105.96 E–106.66 E, 30.78 N–31.98 N), southwestern China. To capture the diversity of land cover and their associated management practices, we strategically selected five typical sites representing different land uses: rice field, cultivated land, bamboo plantation, forest land, and barren land. The rice field site has a history of cultivating single-cropping rice (Oryza sativa) for 5 years. The primary land-use management practices at this site include chemical (30%) and manure (70%) fertilization, straw incorporation, irrigation, and harvesting. The cultivated land site has a history of cultivating single-cropping peanut (Arachis hypogaea L) for 3 years. The primary management practices in cultivated land involve chemical (70%) and manure (30%) fertilization, tillage, irrigation, and harvesting. The bamboo plantation site has been dedicated to the cultivation of Bambusa emeiensis for over 20 years, following the implementation of the “Grain for Green Program” (GFGP). China’s GFGP has become one of the world’s largest ecological restoration projects and made huge contributions to ecosystem functions both in China and globally. The policies of GFGP include grazing bans and returning farmland to forest and grassland, and the aims of the project are to increase ecosystem net primary production and improve other ecosystem services [34]. Based on the GFGP, the primary management practices in the bamboo plantation are chemical (70%) and organic (30%) fertilization, shoot and culm harvesting. In contrast, the forest land site represents a secondary natural forest ecosystem without a history of fertilization. The dominant tree species in this area is Cupressus funebris. Lastly, the barren land site consists of unused land with sparse weed cover. It serves as a control where minimal land-use management practices are observed. The soil type of the study sites is classified mostly as purple soil. These study sites are dominated by the humid subtropical monsoon climate with a similar climatic condition, characterized by an annual precipitation range of 1218 to 1421 mm and an average temperature range of 17.45 to 17.86 °C in 2019. The meteorological data were obtained from the NOAA Integrated Surface Database (ISD, meteorological station codes 574110-99999 and 573060-99999, https://www.ncei.noaa.gov/products/land-based-station/integrated-surface-database, accessed on 26 February 2024). The details of site information are in Table S1.

2.2. Soil Sampling

All soil samplings were collected in August 2019. Firstly, we randomly selected four replicate sampling zones (25 m × 25 m) in each land-use site, and the distance between each sampling zone was approximately 10 m to eliminate potential edge effects. Then, four sampling plots (5 m × 5 m) were randomly selected at each sampling zone. At each sampling plot, three soil samples at each depth (0–10 cm, 10–20 cm, and 20–30 cm) were carefully collected, and then mixed together to create one representative sample at each depth. The collected soil samples were immediately placed in Ziplock bags to preserve their integrity and transported to the laboratory. After removal of the visible living plant fragment materials, each composite sample was passed through a 2 mm mesh sieve and then divided into two subsamples: one subsample was stored at 4 °C for the analyses of enzyme activities, and the other subsample was air-dried for C, N, P, and pH analyses. All the laboratory analyses were processed within two weeks.

2.3. Determination of Soil Chemical Characters

Soil pH was measured at a soil-to-water ratio of 1:2.5 using a PHS-3G digital pH meter (PB-10 pH meter Sartorius, Gottingen, Germany). Total P concentrations were determined using the ascorbic acid method and persulfate digestion method on a SpectraMax® M2 spectrometer (Molecular Devices Corporation, 1311 Orleans Dr., Sunnyvale, NS, Canada) [35]. Total C and N were determined with a C/N analyzer (Multi-N/C 2100, Analytik Jena AG, Jena, Germany).

2.4. Determination of Soil Enzyme Activities

We measured the activities of soil enzymes using the methods obtained from [36]. Briefly, the activity of amylase (EC.3.2.1.1), invertase (EC.3.2.1.26), and cellulase (EC.3.2.1.4) were incubated in starch, sucrose, and carboxymethyl cellulose substrate, respectively, at 37 °C for 24 h. The produced sugar was determined by 3,5-dinitrosalicylic acid colorimetric method. The results of amylase, invertase, and cellulase activity were expressed as mg glucose 24 h−1 g−1 dry soil. Because the soils in the study area are classified as acidic (pH < 6.8), we only determined the acid phosphates activities, and for acid phosphatase (EC.3.1.3.2) activity, the sodium phenylphosphonate colorimetric method was used with p-nitrophenyl phosphate as the substrate. Incubation was performed at 37 °C for 3 h, and the activity was expressed as mg phenol soil 24 h−1 g−1 dry soil. Urease (EC.3.5.1.5) activity was determined by phenol-sodium hypochlorite colorimetric method using urea as the substrate and incubated at 37 °C for 3 h and expressed as mg ammonium 24 h−1 g−1 dry soil.
Catalase (EC.1.11.1.6) activity was determined using the potassium permanganate titration method. The H2O2 filtrate was titrated with 0.1 mol L−1 KMnO4 in the presence of sulfuric acid until the solution turned red. The results were expressed as milliliters KMnO4 24 h−1 g−1 dry soil. Dehydrogenase (EC.1) activity was determined by assessing the enzyme’s ability to transfer hydrogen from the substrate to 2,3,5-triphenyltetrazolium chloride (TTC), which was converted to red-colored triphenyl formazan (TPF). The results were expressed as micrograms of TPF 24 h−1 g−1 dry soil. Phenol oxidase (EC.1.10.3.2) activity was determined using the pyrogallol colorimetry method with pyrogallol as the substrate. Incubation was carried out at 37 °C for 24 h, and the activity was expressed as mg pyrogallol 24 h−1 g−1 dry soil.

2.5. Fuzzy Comprehensive Evaluation Model

To test the second hypothesis, we used a fuzzy comprehensive evaluation model to integrate multiple enzyme activities and nutrient concentrations. This model allowed us to generate a fuzzy enzyme index and a fuzzy nutrient-status index. The fuzzy comprehensive evaluation model is a decision-making approach that combines fuzzy logic theory with comprehensive evaluation techniques [37]. It has been widely used to integrate various soil parameters or indicators, enabling a comprehensive assessment of soil quality [38,39,40,41]. In constructing our models, we followed a step-by-step process to obtain the fuzzy enzyme index and fuzzy nutrient-status index for each soil depth.
Step 1 Membership Function Design
In order to assess the overall enzyme activity, we considered all the enzymes measured in this study as evaluation criteria. For evaluating soil nutrient status, we included the total concentrations of C, N, and P as evaluation factors. We defined the evaluation factor domain as E = E1, E2, …, Em. Since soil enzyme activities, C, and nutrient concentrations are continuous variables, we utilized triangular membership functions, which are widely recognized and employed in fuzzy controller design [39]. To determine the degree of membership for each evaluation factor in the domain E, we conducted factor analysis on both enzyme dataset and nutrient dataset. This analysis provided us with loadings for each variable (Table S2). The variable loadings indicate the strength and direction of the relationship between the observed variable and the factor. Variables with positive loadings were assigned to Equation (1), while the variable with a negative loading was assigned to Equation (2).
e i j = ( x i j x i m i n ) ( x i m a x x i m i n )
e i j = ( x i m a x x i j ) ( x i m a x x i m i n )
where e i j is the degree of membership of enzyme/C/nutrients E i in sample j. x i j is the activity of enzyme/C/nutrients E i in sample j. x i m i n and x i m a x are the lowest and highest activity of enzyme or the lowest and highest concentration of C and nutrients E i across various land uses at each soil depth.
Step 2 Determine the weight of evaluation factors
In factor analysis, final communalities characterize the proportion of variance in each observed variable that can be explained by all the extracted factors. In this study, we used final communalities of each variable as the weight. To estimate the final communalities of each variable, we calculated the sum of squared loadings for that variable and divided it by the sum of all communalities’ values (Equation 3). The weight of the evaluation factors, denoted by the vector W = W1, W2, ..., Wm, can be represented accordingly for the m evaluation factors.
W i = j = 1 k l i j 2 i = 1 m j = 1 k l i j 2
where W i is the weight of i t h evaluation factors; l i j is the loading of i t h variable in j t h factor; k is the number of factors used in factor analysis and herein is equal to 2; m is the number of evaluation factors and herein is equal to 8 (for fuzzy enzyme index) and 3 (for fuzzy nutrient-status index).
Step 3 Determine the overall appraisal result
The final membership matrix A is synthesized by combining the weight W with the fuzzy matrix P, which can be expressed as shown in Equation (4).
A = W × P = [ W 1   W 2     W m ] [ e 11 e 1 n e m 1 e m n ]
where A is fuzzy enzyme index matrix or fuzzy nutrient-status index matrix across various land uses at each soil depth. W is the combined weight of the evaluation factors calculated by Equation (3); P is the fuzzy connection of variable i to sample j, which can be calculated from Equations (1) and (2); m is the number of evaluation factors and herein is equal to 8 (for fuzzy enzyme index) and 3 (for fuzzy nutrient-status index); and n is the number of samples, which herein is equal to 4.

2.6. Statistical Analyses

To examine the potential differences in soil nutrient concentrations, stoichiometric ratios, enzyme activities, and pH across different land uses and soil depths, we conducted two-way analysis of variance with Bonferroni correction (ANOVA, aov function, base R package) and post hoc test after two-way ANOVAs. We also examined differences in fuzzy enzyme index and fuzzy nutrient-status index across land uses at each soil depth using one-way ANOVA with Bonferroni correction and post hoc test. To characterize the effects of land use and soil depth on overall variability of pH, soil nutrients, and their ratios, as well as enzyme activities, we used principal component analysis (PCA) with the “factoextra” package in R to visualize differences. The effects of land use on all soil chemical and biological variables were examined using PERMANOVA (adonis2 function, vegan package). We also calculated the ranges of coordinates of the points on the specified axes in PCA to quantify the magnitude of overall variability of soil response variables across land uses. Additionally, to determine whether the extent of the variation of soil response variables within soil profile are affected by land use, we compared slopes of regression lines of the variation of each variable from the topsoil to the deeper layer using one-way ANOVA with Bonferroni correction.
To examine the effects of soil nutrients and pH on soil enzyme activities, we performed least absolute shrinkage and selection operator (lasso) regression with “glmnet” package in R [42]. Lasso regression is a type of linear regression that is used for feature selection and regularization, which constrains the coefficient estimates and shrinks coefficient estimates that do not significantly contribute to the correlation towards zero. Lasso regression is preferred to fit a regression model in this study because multicollinearity is present in our data [43]. We performed 10-fold cross-validation to find optimal lambda value in each regression model, and we obtained coefficients and R2 from the final model produced by the optimal lambda value. To determine the relationship between fuzzy enzyme index and fuzzy nutrient-status index, we conducted general linear regression (glm function, base R package) at three soil depths. We also conducted general linear regression to analyze the effects of pH on fuzzy enzyme index because limited data failed to perform 10-fold cross-validation in lasso regression.

3. Results

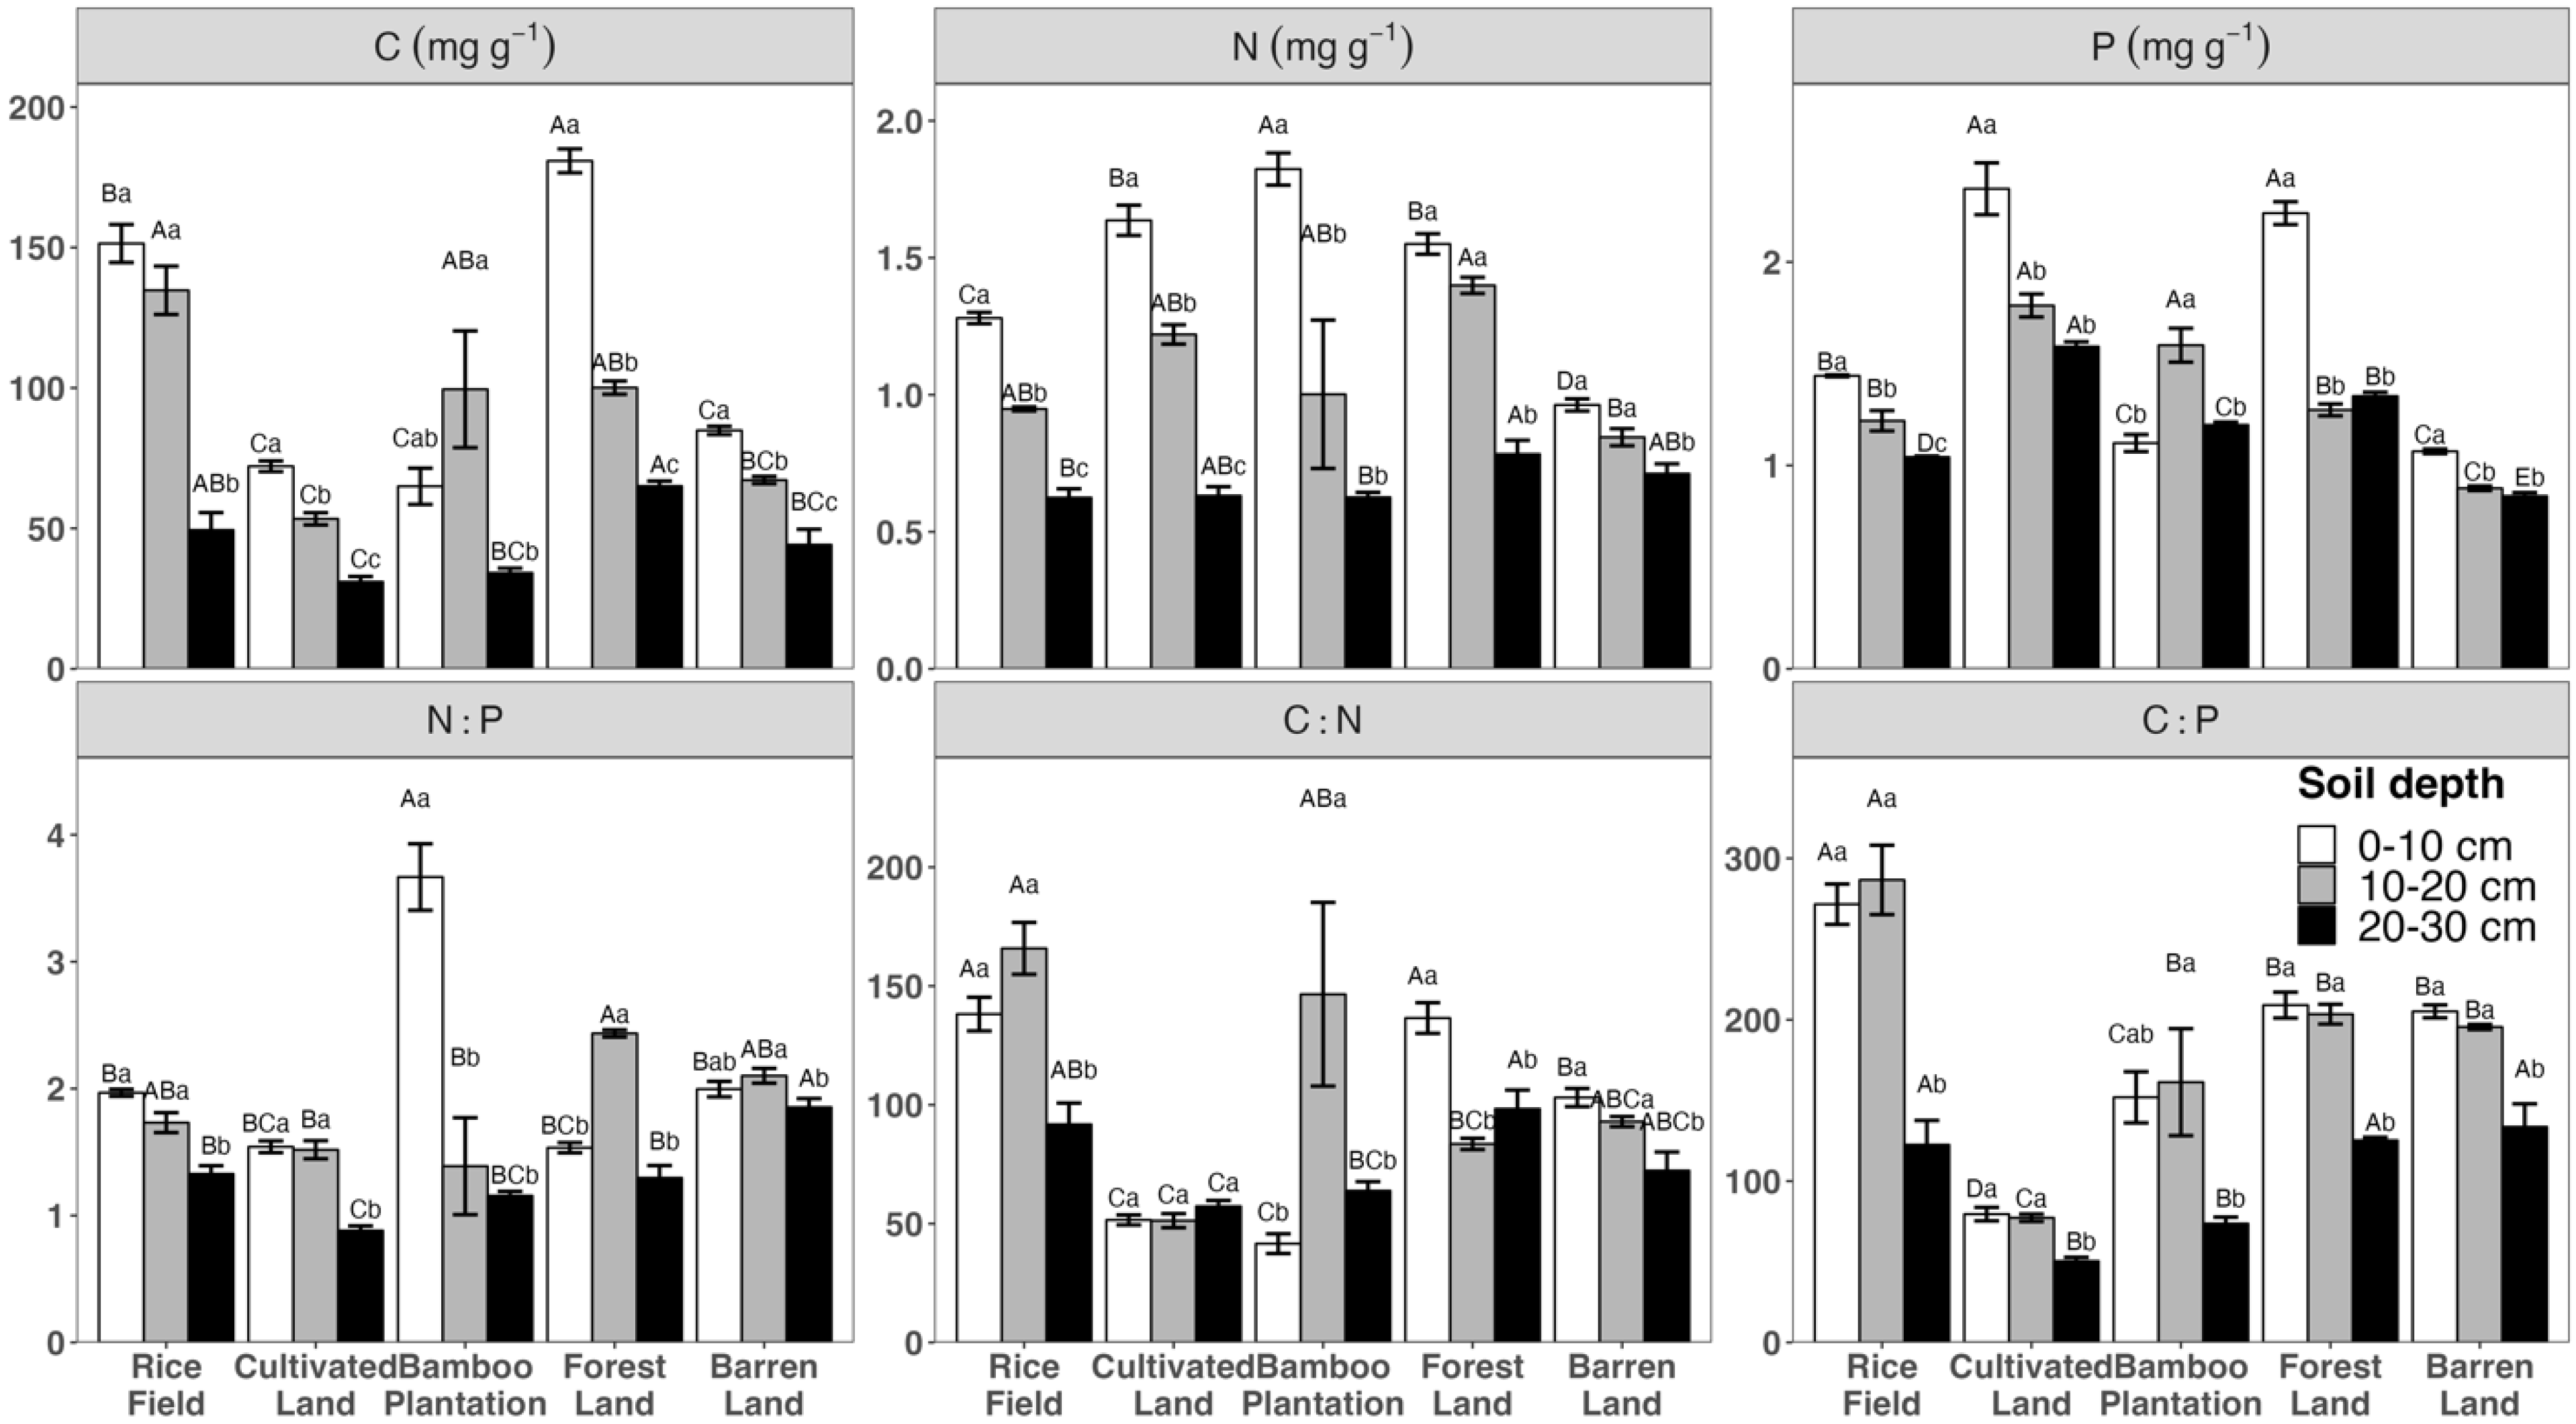
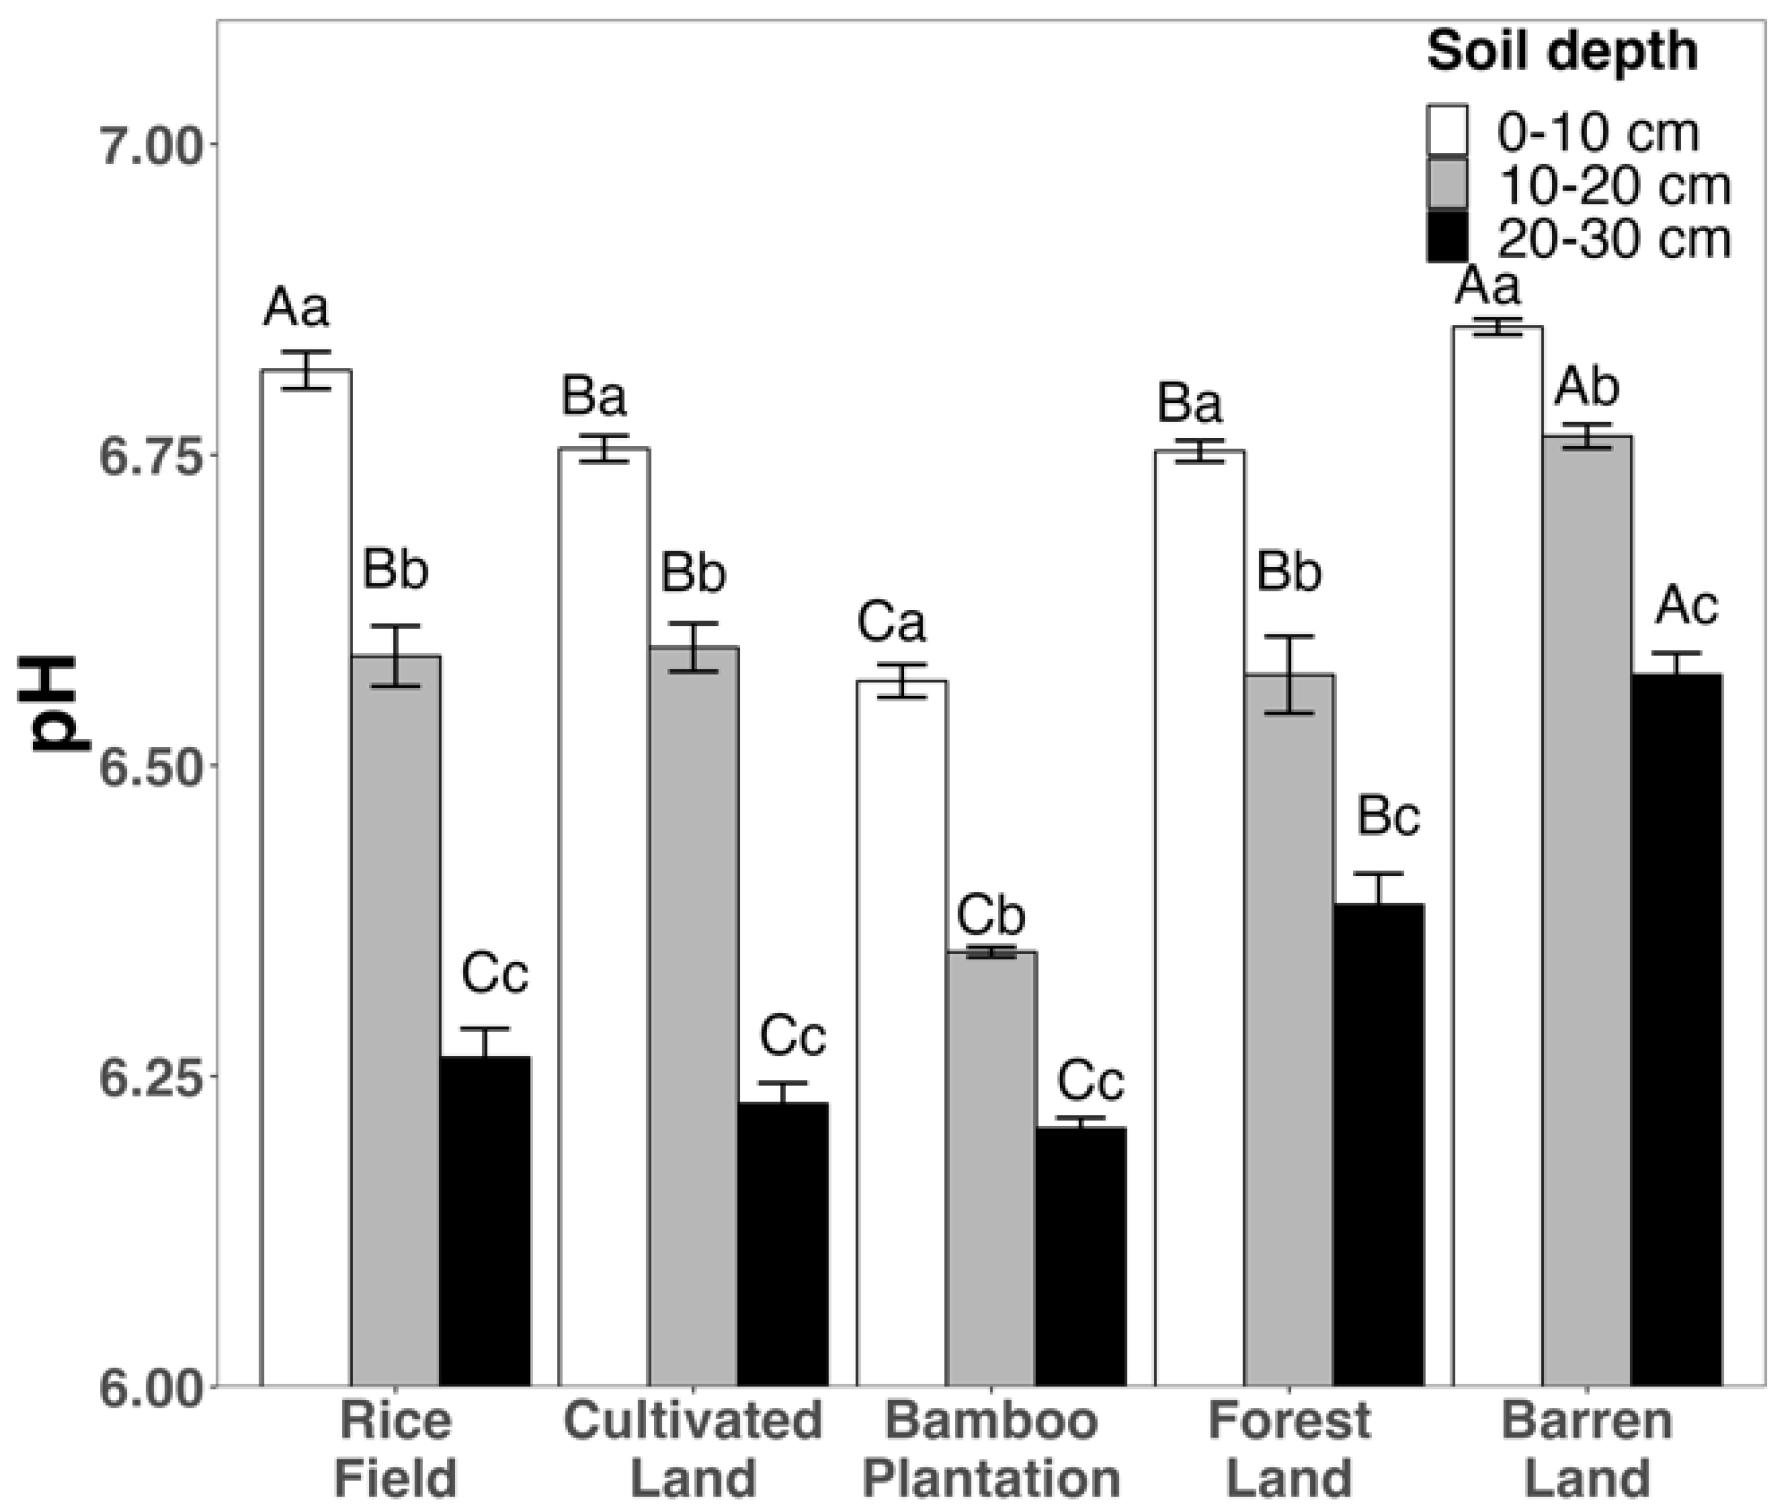
3.1. Variation in Soil Chemical Variables across Different Land Uses and Depths

Two-way ANOVAs show that land use and soil depth significantly influence all soil chemical variables in this study (Table 1). Generally, the total C, N, and P concentrations exhibited a decreasing trend from the topsoil to the subsoil and deeper layer across all land uses, although the bamboo plantation had a higher P concentration in the subsoil layer compared to the topsoil and deeper layer (Figure 1). The decreasing trend with increasing soil depths also applied to C:P ratios, although no significant differences were observed between topsoil and subsoil across all land uses. The effects of soil depths on N:P and C:N ratios depended on specific land use. In the rice field and barren land, both N:P and C:N ratios decreased with increasing soil depths. N:P ratios also decreased from the topsoil to deeper layer in the cultivated land and bamboo plantation, while forest land showed higher N:P in the subsoil than the topsoil and deeper layer. The bamboo plantation had the highest C:N in subsoil, higher than in the topsoil and deeper layer, while C:N in forest land decreased from topsoil to subsoil and the deeper layer. No significant differences between soil depths were observed on C:N in cultivated land (Figure 1).
Overall, the pH levels observed across all land uses and soil depths ranged from 6.2 to 6.9 (Figure 2). Regardless of the land use, there was a consistent decrease in soil pH from the topsoil to the subsoil and deeper layer. Notably, barren land exhibited the highest pH values in the topsoil, subsoil, and deeper layer compared to the other land uses. The rice field, cultivated land, and forest land displayed lower pH values than the barren land, while bamboo plantation had the lowest pH values in both the topsoil and subsoil. In the deeper layers, pH levels decreased from the barren land and forest land to the rice field, cultivated land, and bamboo plantation (Figure 2).

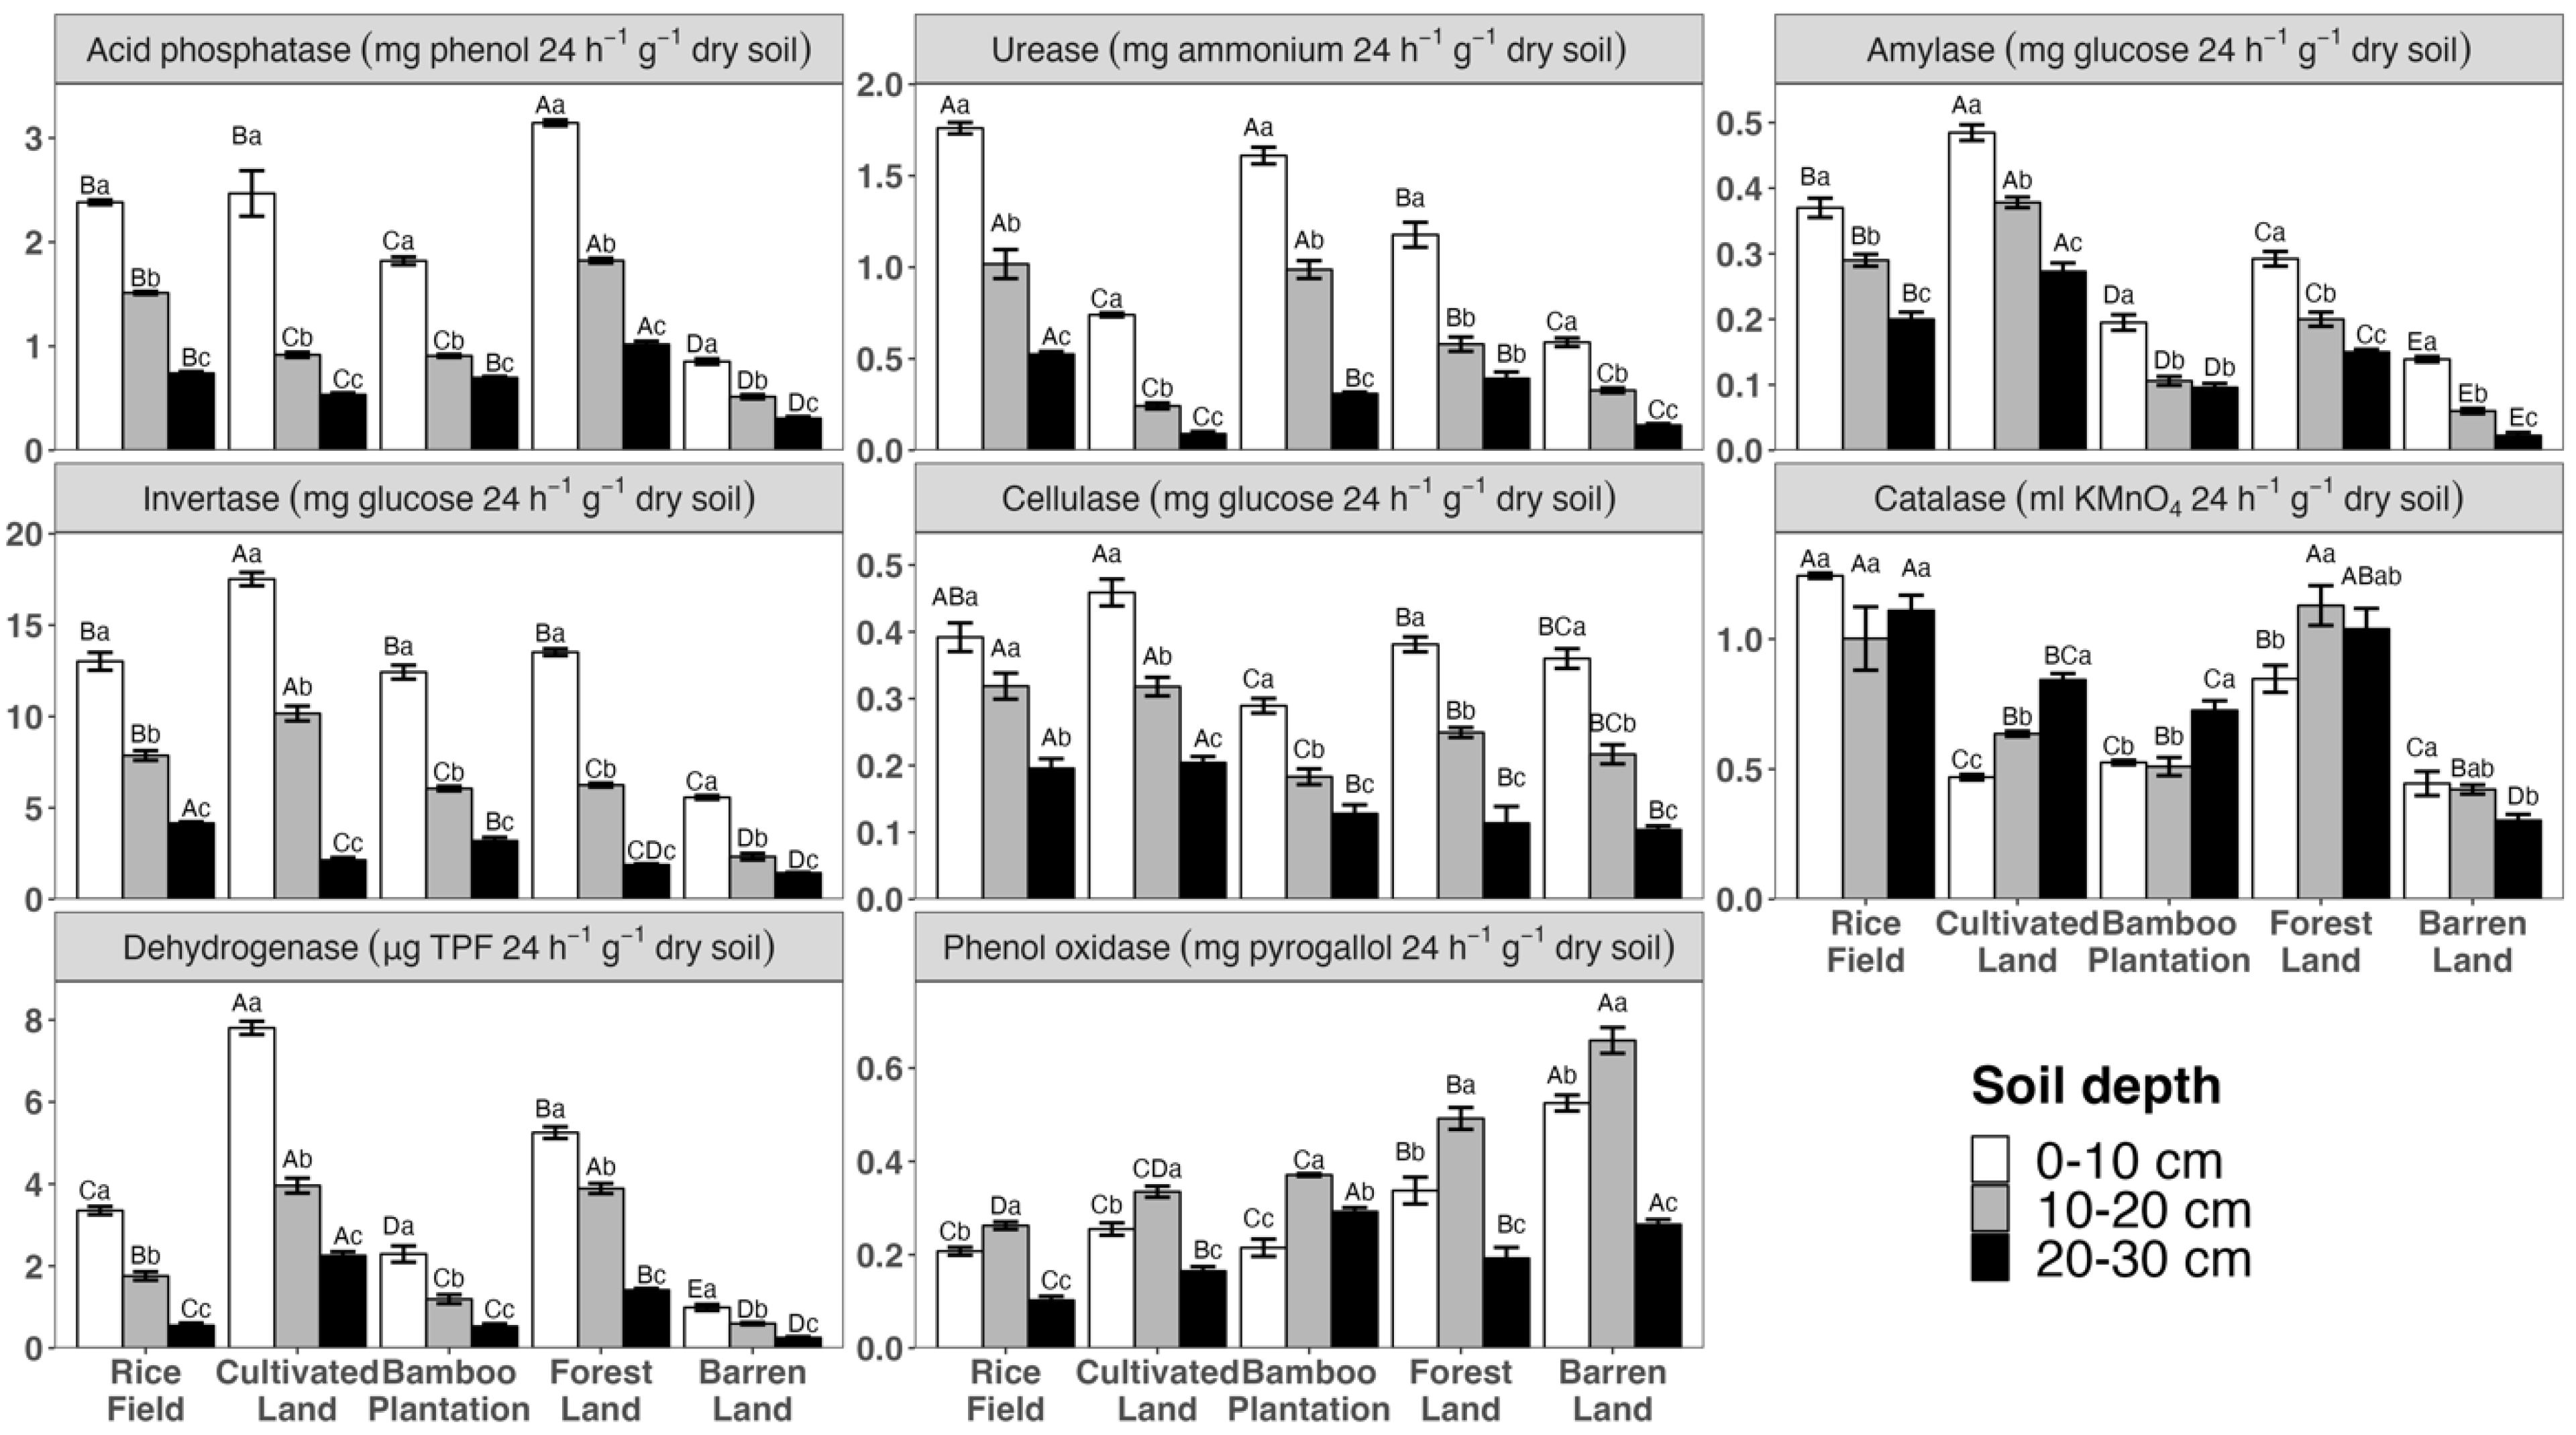
3.2. Variation in Soil Enzyme Activities across Different Land Uses and Depths

Two-way ANOVAs show that land use and soil depth significantly influence most enzyme activities (Table 1). In particular, catalase activity was not influenced by soil depth independently (df = 2, F = 4.74, p = 0.014), while cellulase activity was not affected by the land use * soil depth interaction (df = 8, F = 2.9 p = 0.011). Specifically, the activity of hydrolytic enzymes exhibited a decreasing trend from the topsoil to deeper soil layers, irrespective of the land use (Figure 3). Oxidative enzymes displayed distinct patterns across the soil layers. Specifically, dehydrogenase followed a similar pattern to hydrolytic enzymes, with the highest activities observed in the topsoil and the lowest in the deeper soil layer, regardless of the land use. Phenol oxidase exhibited higher activities in the subsoil but lower activities in both the topsoil and deeper layer. Interestingly, catalase activity did not exhibit consistent patterns across different land uses. In the cultivated land, bamboo plantation, and forest land, catalase activities increased from the topsoil to deeper layer, while in the barren land and rice field, the activities either decreased or remained unchanged, respectively (Figure 3).
The impact of land use on soil hydrolytic enzyme activities exhibited slight variations across different soil depths (Figure 3). In the topsoil and subsoil, C-decomposition hydrolytic enzymes (such as amylase, invertase, and cellulase) showed their highest activities in croplands, specifically the rice field and cultivated land. Woody lands, including the bamboo plantation and forest land, had medium enzyme activity, followed by the barren land. Acid phosphatase exhibited its highest activity in the forest land, followed by croplands such as the rice field and cultivated land, with the bamboo plantation showing a relatively lower activity, and the barren land displaying the lowest activity. Urease presented the highest activity in the rice field and bamboo plantation, and then followed by the forest land, cultivated land, and barren land. Moving deeper into the soil layers (20–30cm), the patterns for amylase and cellulase activities across different land uses remain consistent with those observed in the topsoil and subsoil. However, invertase activity showed a decline in the order of rice field, bamboo plantation, cultivated land, forest land, and barren land. Acid phosphatase retained its highest activity in the same order as in the topsoil and subsoil, with the rice field and bamboo plantation following closely, and the cultivated land and barren land displaying relatively lower activities. Urease activity was the highest in the rice field, followed by woody lands (bamboo plantation and forest land), while the cultivated land and barren land exhibited the lowest activities.
Oxidative enzymes displayed distinct patterns across various land uses (Figure 3). In both the topsoil and subsoil, the rice field and forest land showed the highest levels of catalase activity, followed by cultivated Land and bamboo Plantation. Barren land exhibited the lowest catalase activity. Dehydrogenase had relatively higher activities in cultivated land and forest land, followed by the rice field and bamboo plantation, while the barren land exhibited the lowest activity. Interestingly, phenol oxidase activities decreased with increasing anthropogenic disturbance intensity. The order of decreasing phenol oxidase activity is as follows: barren land, forest land, bamboo plantation, cultivated land, and rice field. In the deeper soil layer, catalase activity follows a similar pattern to that observed in the topsoil and subsoil. Cultivated land exhibited the highest dehydrogenase activity, followed by forest land. The rice field and bamboo plantation showed intermediate activity levels, while barren land exhibited the lowest dehydrogenase activity. Phenol oxidase activity was higher in the bamboo plantation and barren land, followed by cultivated land and forest land, with the lowest activity observed in the rice field.

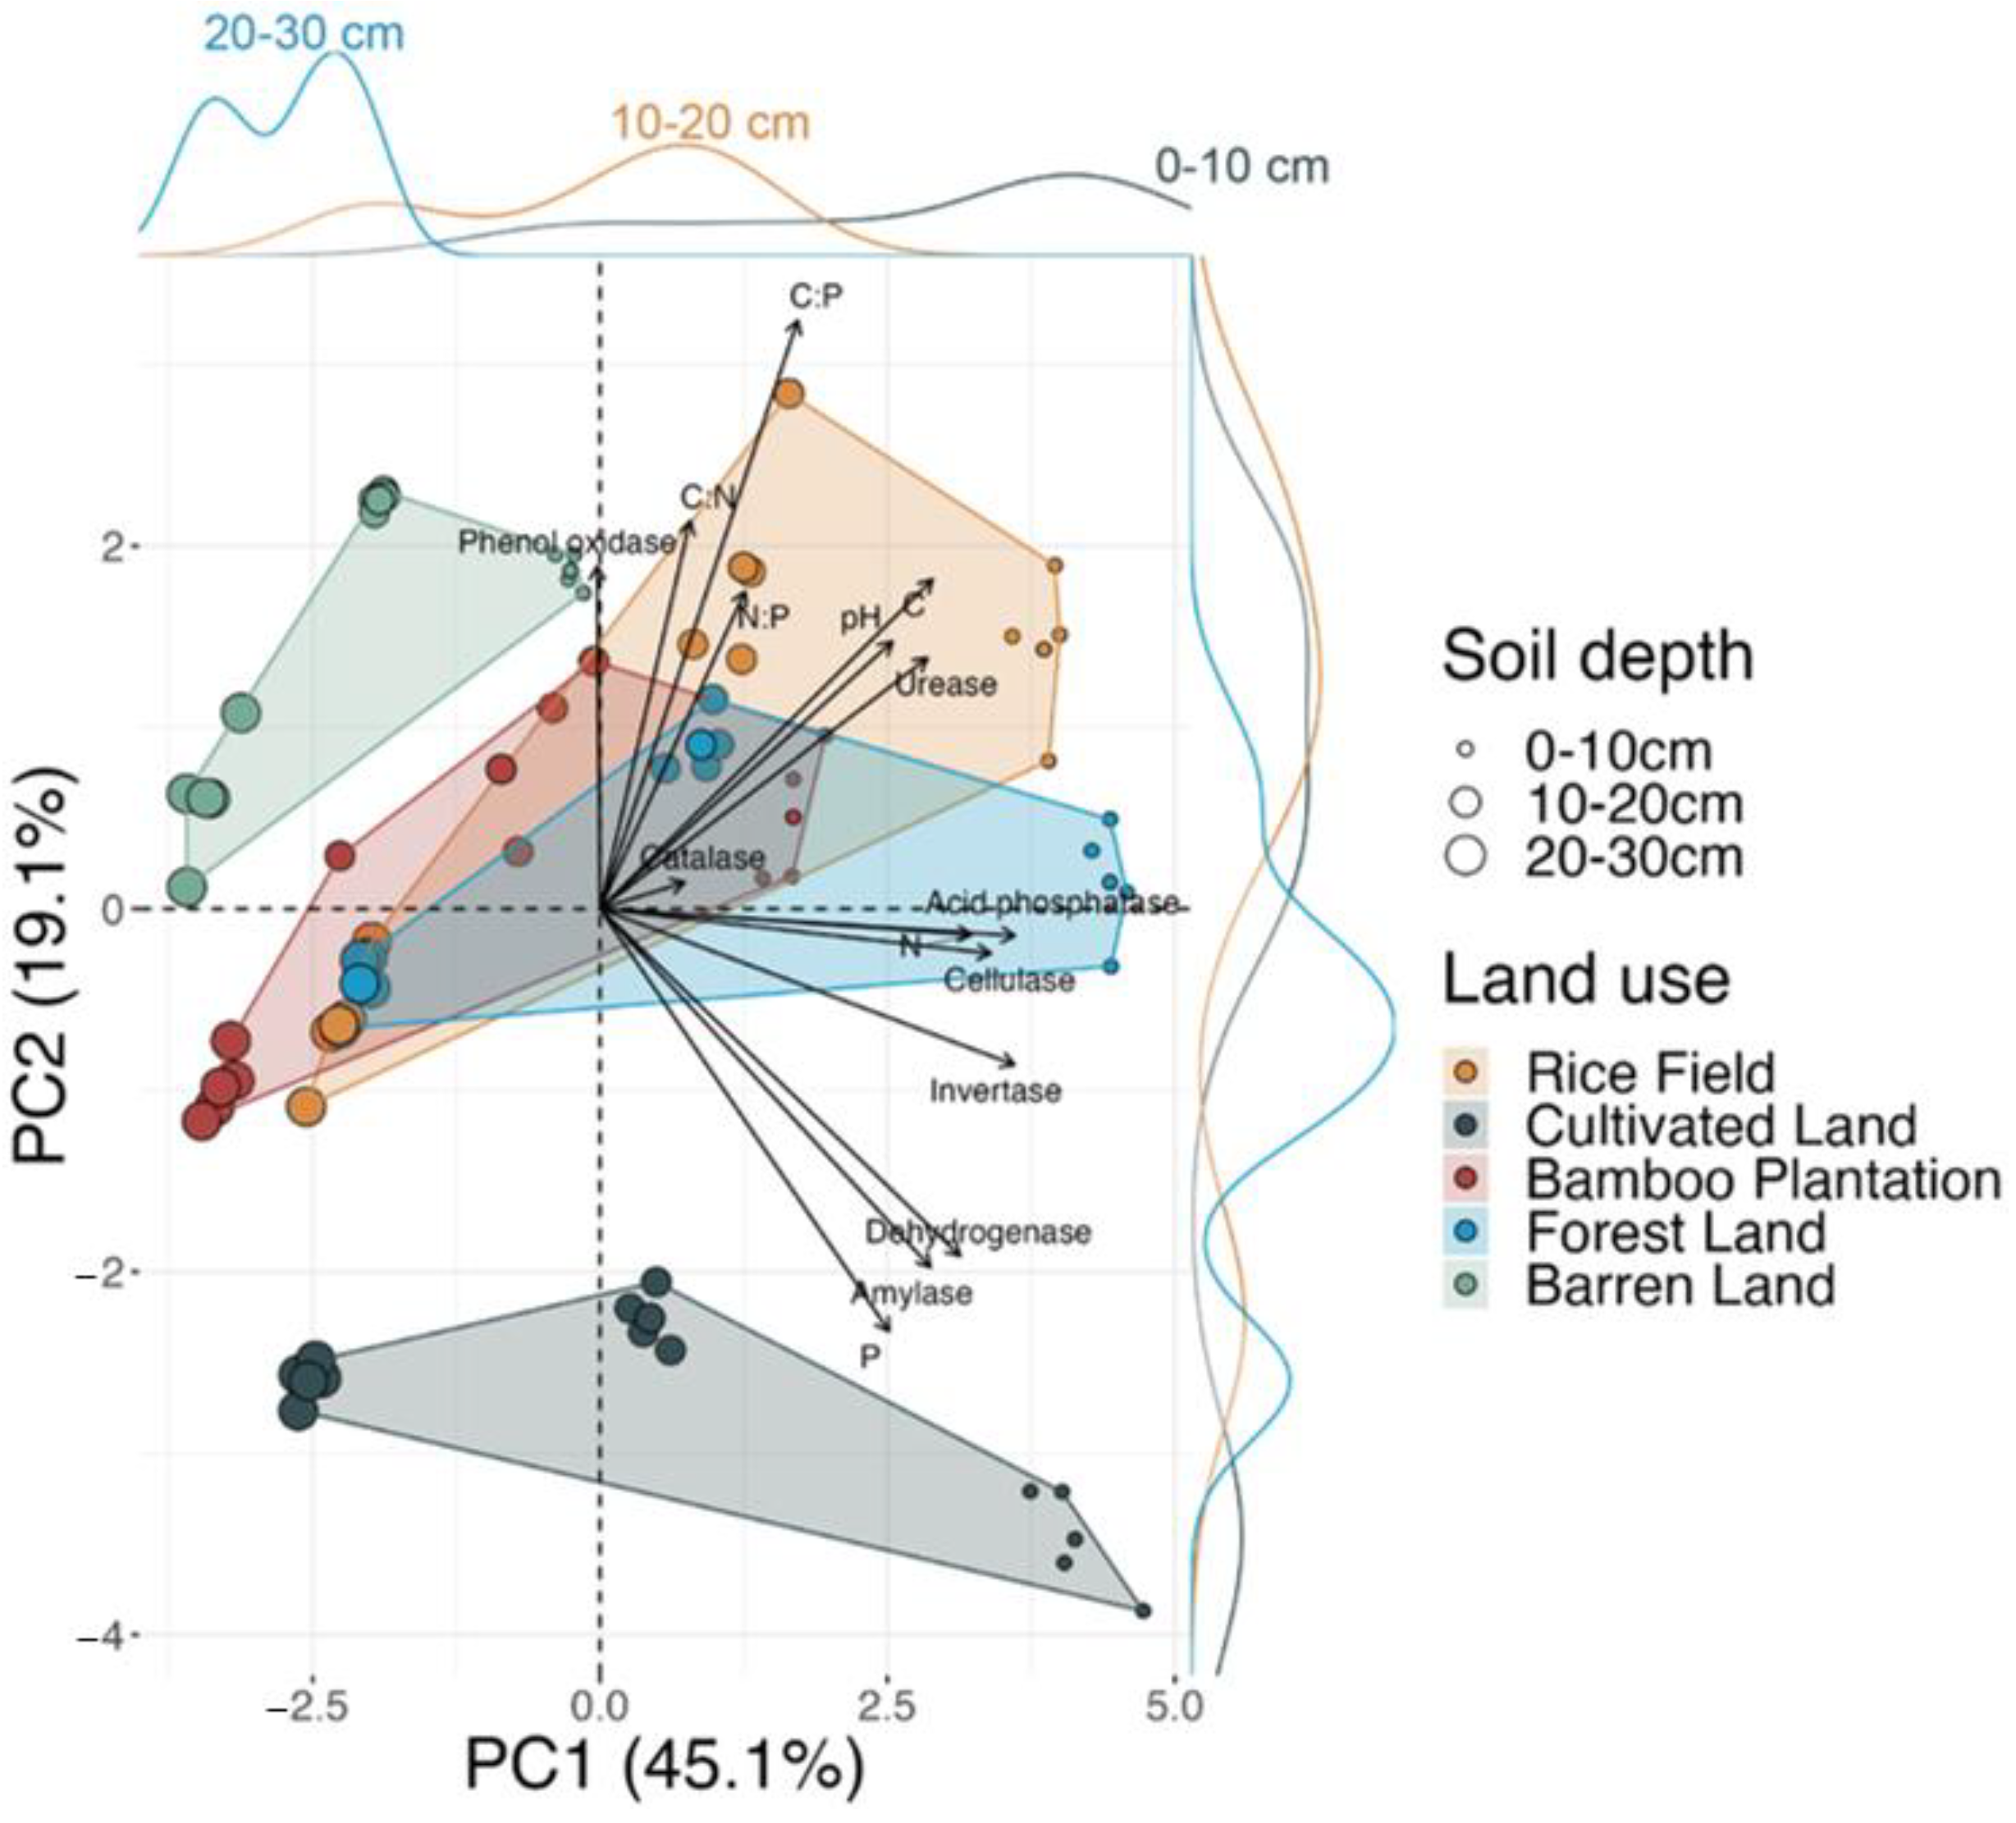
3.3. Associations between Soil Nutrients, pH, and Enzyme Activities

The results of lasso regression analysis investigating the relationships between soil nutrients, pH, and enzyme activities reveal significant positive influences of soil total C, N, and P concentrations on most hydrolytic enzyme activities (Table 2). However, the stoichiometric ratios of C, N, and P did not exhibit any effects on the enzyme activities in this study. Specifically, higher C and P concentrations were found to have positive effects on catalase activity, while increased N and P concentrations positively influenced dehydrogenase activity. No significant effects of C, N, or P concentrations on phenol oxidase activity were observed. In terms of the relative importance compared to soil total nutrient concentrations, pH appeared to have stronger influences, as indicated by higher coefficients, on all oxidative enzymes and some hydrolytic enzymes. pH showed a positive association with dehydrogenase, phenol oxidase, invertase, and cellulase activities, while it exhibited a negative relationship with catalase activity (Table 2).

3.4. Fuzzy Comprehensive Evaluation

Land use shows significant influences on the fuzzy enzyme index in the topsoil (df = 4, F = 299.8, p < 0.001), subsoil (df = 4, F = 352.2, p < 0.001), and deeper soil layer (df = 4, F = 161.4, p < 0.001). In the topsoil, cultivated land (0.68) exhibited the highest fuzzy enzyme index, followed by rice field (0.62) and forest land (0.6), with the bamboo plantation (0.4) ranking next (Figure 4A). Barren land (0.07) displayed the lowest fuzzy enzyme index. In the subsoil layer, the rice field (0.65) had the highest fuzzy enzyme index, followed by cultivated land (0.62) and forest land (0.6), with the bamboo plantation (0.35) trailing behind (Figure 4A). Barren land (0.08) showed the lowest fuzzy enzyme index. In the deeper soil layer, the rice field (0.65) exhibited the highest index, while forest land (0.47) and cultivated land (0.42) displayed relatively higher indices, though no significant differences were observed between them. The bamboo plantation (0.4) presented a relatively lower index, whereas barren land (0.09) showed the lowest fuzzy enzyme index (Figure 4A).
Similarly, land use significantly affects fuzzy nutrient-status index in the topsoil (df = 4, F = 98.93, p < 0.0001), subsoil (df = 4, F = 5.44, p < 0.0083), and deeper soil layer (df = 4, F = 10.99, p < 0.0083). In the topsoil, forest land (0.75) exhibited the highest fuzzy nutrient-status index, followed by cultivated land (0.55). The rice field (0.43) and bamboo plantation (0.36) showed a relatively lower index, while barren land (0.1) had the lowest index (Figure 4B). In the subsoil, barren land (0.27) still showed the lowest index, while no significant differences were found between other four land uses (Figure 4B). In the deeper layer, forest land (0.71) presented the highest fuzzy nutrient-status index while no significant differences were found between other four land uses (Figure 4B). Additionally, the results of general linear regression show that the fuzzy enzyme index is significantly positive correlated with fuzzy nutrient-status index in the topsoil (p < 0.0001) and subsoil (p = 0.0013), but not in the deeper layer (p = 0.43) (Figure 4C). However, the fuzzy enzyme index is significantly negative correlated with soil pH in the deeper layer (p < 0.001), but not in the topsoil (p = 0.54) and subsoil (p = 0.25) (Figure S1).

3.5. The Variability in Soil Enzyme Activities and Nutrients

Principal component analysis reveals that soil biological (soil enzyme activities) and chemical (pH, total C, N, and P concentrations, and their stoichiometric ratios) response variables are significantly different between land use (df = 4, R2 = 0.46, F = 48.82, p < 0.001), soil depth (df = 2, R2 = 0.3, F = 63.97, p < 0.001), and land use * soil depth interaction (df = 8, R2 = 0.13, F = 7.12, p < 0.001). The first two principal components (PC 1 and PC 2) of the PCA explain 64.2% of the total variations. PC 1 exhibited a stronger ability to differentiate the effects of soil depth, while PC 2 tended to capture differences related to land use. Acid phosphatase, invertase, cellulase activities, and N concentration had high loadings on PC 1, indicating their strong influence on this component. PC 2 was primarily influenced by C:P ratio, P concentration, and C:N ratio (Figure 5).
Overall, there was an increase in the variation of soil biological and chemical response variables as land-use intensity increased, with the exception of forest land. Among the different land uses, the rice field, with the highest level of anthropogenic disturbance, exhibited significant variance in PC 1 (88%) and PC 2 (59%). Cultivated land displayed the highest variance in PC 1 (98%) but relatively lower variance in PC 2 (27%). The bamboo plantation exhibited moderate variance in both PC 1 and PC 2, ranging from 72% to 38%, respectively. Forest land showed higher variance in PC 1 (91%) and lower variance in PC 2 (27%). Barren land had the lowest variance in both PC 1 (46%) and PC 2 (32%) (Table S3).
Additionally, within-depth variation, evaluated as slopes for variance of each variable from the topsoil to deeper soil layer, were significantly influenced by land use, except for cellulase and catalase activities (Table S4).

4. Discussion

The objectives of this study were to investigate the impacts of land use on soil C, N, and P concentrations and enzyme activities throughout the soil profile, as well as the potential of soil enzyme activity as an indicator of soil fertility within soil profiles. Quantified measurements on the activity of hydrolytic and oxidative enzymes under five land uses as well as the application of a fuzzy comprehensive evaluation model provide clear evidence to support our hypotheses. Overall, the study found that land cover and associated management practices had a significant impact on C, N, and P concentrations, stoichiometric ratios, and enzyme activities across soil profile. We found a trend that the extent of variability of these variables are positively correlated to land-use intensity. Higher levels of hydrolytic enzyme activities and nutrient concentrations were observed in the topsoil compared to the deeper layer. We observed a consistent relationship between hydrolytic enzyme activities and total C, N, and P concentrations. In contrast, the activities of the three oxidative enzymes showed strong associations with soil pH. Furthermore, the results of fuzzy comprehensive evaluation models suggest that the overall enzyme activity can serve as an indicator of soil nutrient status in the topsoil and subsoil, but not in the deeper soil layer. The depth-specific nature of these relationships may be attributed to different land-use management practices and the intensity of disturbances in soil nutrient cycles and enzyme activities.

4.1. The Impacts of Land Use

The results of this study provide strong evidence to support our hypothesis that land use can influence the distribution and variability of total C, N, and P concentrations, pH, and enzyme activities across the soil profile (Figure 1, Figure 2 and Figure 3, Table 1). These variables exhibit distinct patterns among the different land uses, as revealed by the separation along PC axis 1 and axis 2 (Figure 5). The PERMANOVA analysis further confirms the PCA results, demonstrating that all variables are significantly different among the five land uses (df = 4, F = 11.7, R2 = 0.46, p < 0.001). Additionally, the results of one-way ANOVAs with Bonferroni-corrected p-values indicate that each examined variable is significantly influenced by land use (Table 1).
The variations in soil chemical variables within different land uses were closely related to the specific land-use management practices. Firstly, the observed differences in total C concentrations, C:N ratios, and C:P ratios between land uses in both the topsoil and subsoil can be attributed to the distinct management practices in agricultural and natural ecosystems. Cropland, characterized by regular tillage, harvesting, and removal of plant residue, experiences a disruption of organic matter content and accelerated decomposition processes, leading to lower C concentrations in both the topsoil and subsoil. However, forest land undergoes a natural process of organic matter accumulation, where fallen leaves, branches, and other organic materials gradually accumulate on the forest floor, resulting in higher C concentrations in the topsoil. Secondly, within croplands, the contrasting patterns of C, C:N, C:P, N, and P concentrations between the rice field and cultivated land can be attributed to differences in water and nutrient management practices in agricultural ecosystems. Rice fields are typically flooded or maintained under saturated conditions for a significant portion of the growing season. This flooded environment promotes denitrification, a process where N compounds are converted into gaseous forms, leading to N loss from the soil [44]. Similarly, the flooded conditions or excessive irrigation can enhance the potential for P loss through leaching or runoff [45,46]. In our study, the rice field experienced management strategies including straw incorporation and high percentage of organic (70%) compared to inorganic fertilization (30%). These practices can enhance C accumulation in the topsoil and mitigate nutrient loss, which may explain the higher C concentrations observed in rice fields in our study [47].
Similarly, the observed changes in pH levels between different land uses provide insights into the intensive nutrient management practices in croplands, plantations, and the organic matter accumulation in natural forests [48]. The lower pH values observed in bamboo plantations and cultivated land can be attributed to the excessive use of N fertilizers. In fact, it has been widely reported that excessive N fertilizer was used in croplands in southern China to maximize crop harvest and farmer income [49]. This practice is likely even more prevalent in bamboo plantations, which are often managed by smallholder farmers in southwestern China, who are lacking in agricultural education and training on optimal fertilizer use [50,51]. Furthermore, the presence of a litter layer in forests contributes to the accumulation of organic matter, which undergoes decomposition and releases organic acids, resulting in lower pH levels in forest land compared to barren land [52].
In our study, we found that the impacts of land use on enzyme activities are mediated by changes in nutrient status and pH. Supporting evidence for this is the result of lasso regression analysis, which reveals strong correlations between enzyme activities and soil chemical variables (Table 2). Soil pH, in particular, plays a direct role in influencing enzyme structure and function [53]. For instance, certain enzymes have optimal activity at specific pH ranges [54,55]. The findings from our study indicate that the activity of oxidative enzymes is closely associated with soil pH, suggesting that the enzymatic potential for breaking down the recalcitrant fractions of soil organic material is influenced by pH levels [56]. This finding is consistent with previous studies conducted in different land-use systems [57,58] and at a global scale [53]. However, in contrast to studies that focus on ecosystem-level effects where soil pH reflects climatic controls on soil weathering, our study sites have similar climatic conditions. As a result, soil pH is more strongly associated with land cover and related management practices in our study. This suggests that changes in nutrient availability, soil organic matter composition, and microbial community composition driven by land-use management practices may contribute to the local distribution of oxidative enzyme activities [59,60].
Our study reveals significant positive correlations between almost all hydrolytic enzymes and total concentrations of C, N, and P (Table 2). Specifically, the N-acquisition enzyme (i.e., urease) exhibited a higher coefficient with C concentrations compared to N and P concentrations. However, the C-acquisition hydrolytic enzymes (e.g., amylase, invertase, cellulase) displayed higher coefficients with N and P concentrations compared to C concentrations (Table 2). These findings suggest that the enrichment of N and/or P can stimulate microbial decomposition of labile soil organic matter [61]. Further supporting evidence comes from the comparison of land uses in the topsoil and subsoil. Cultivated land showed higher N and P concentrations as well as the highest activities of C-acquisition enzymes (e.g., amylase, invertase, cellulase) compared to other land uses (Figure 1 and Figure 3). However, N or P fertilization appeared to suppress urease activity in cultivated land. These observations align with the resource allocation theory of enzyme production, which suggests that the addition of inorganic nutrients can inhibit the activities of nutrient-acquisition enzymes while potentially enhancing the activities of other enzymes [62].

4.2. The Impacts of Soil Depth

Our data provide evidence that soil depths significantly influence pH, C, nutrient-related variables, and enzyme activities (except for catalase). This finding supports the well-established understanding that soil profiles exhibit substantial gradients of resources and environments [63]. Across all land uses, we observed a declining trend in soil pH, C, N, and P concentrations, activities of all hydrolytic enzymes, and dehydrogenase activity within the soil profile (Figure 1, Figure 2 and Figure 3). Our results are in line with Gong et al. [64], who reported a downward trend for the activities of invertase, urease, catalase, and alkaline phosphatase within soil depth across the different land uses (i.e., grassland, forest, and cultivated land). This suggests that the distribution of hydrolytic enzymes within the soil profile is primarily influenced by the availability of nutrient substrates and soil pH [65]. Supporting this notion, we found significantly positive correlations between soil pH, C, N, and P concentrations, and these enzyme activities (Table 2). However, our study reveals that land use has the potential to modify the declining trend of resource and environmental conditions within the soil profile. For instance, catalase activities within the soil profile exhibited different patterns across all land uses (Figure 3), indicating that nutrient status and pH may not be the primary factors driving catalase activities within the soil profile. In fact, oxygen availability is crucial for catalase activity as it is involved in the breakdown of hydrogen peroxide [66]. Oxygen penetrates within the soil profile to a larger extent, determining the spatial variability of oxygen availability across soil layers, which can be affected by different land covers and land-use management practices [67,68]. For example, irrigation in rice fields can create waterlogged conditions throughout the depths, leading to oxygen-deficient conditions [69]. This may explain that no significant differences in catalase activities were found within the soil profile in the rice field site. Furthermore, the roots of Arachis hypogaea L., Bambusa emeiensis, and Cupressus funebris are typically distributed in the topsoil and subsoil [70,71,72]. Root respiration can deplete oxygen in the vicinity of the roots, affecting the overall oxygen availability in the soil [73]. This also can contribute to variations in oxygen availability within the soil profile, and may explain the increasing catalase activities with increasing depths observed in cultivated land, bamboo plantation, and forest land.
The variation observed within each soil depth, evaluated through the slopes of each variable from the topsoil to the deeper soil layer, is significantly influenced by land use, as supported by the results of the one-way ANOVA (Table S4). This can be attributed to the fact that land-use management practices have the ability to modify the resource and environmental conditions present in both the topsoil and subsoil, consequently influencing the characteristics of the deeper soil layers [74,75]. The extent to which land uses modify the resource and environmental conditions within the soil profile may depend on the intensity of land use [76,77]. This is further supported by the PCA results, which reveal that increasing land-use intensity is associated with an overall increase in the variability of soil chemical and biological response variables (Figure 5, Table S3). Overall, our study provides local evidence to support the potential relationships between land-use intensity and the vertical distribution and variability of soil nutrients and enzyme activities.

4.3. Fuzzy Comprehensive Evaluation Models

To the best of our knowledge, we are the first to apply fuzzy comprehensive evaluation models to analyze the relationship between overall soil enzyme activities and nutrient status. In the past, empirical indexes such as the biological index of fertility (BIF) [31] and the enzyme number (EAN) index [32] have been proposed to assess soil fertility by integrating multiple soil enzymes. Similarly, in our study, the utilization of fuzzy comprehensive evaluation models allows for a simple and integrated index to evaluate overall enzyme activities and nutrient status across different land uses. The results demonstrate that the fuzzy enzyme index and nutrient-status index are significantly influenced by land use at all soil depths, which aligns with the individual variable examinations (Figure 4, Table 1). Specifically, forest land consistently exhibits higher nutrient status within the soil profile compared to other land uses, suggesting that reduced anthropogenic disturbances in forest ecosystems help to maintain C and nutrient cycling. Actually, previous studies reported that forest conversion to croplands decreased soil C and increased nutrient loss through leaching, erosion, or runoff under intense land-use management practices [78,79].
The classic paradigm suggests that soil enzyme activities can serve as indicators of soil fertility due to their functional role in nutrient cycles and organic matter decomposition, which are closely correlated with soil fertility parameters [27,80]. In our study, the results of fuzzy comprehensive evaluation supported this paradigm in the topsoil and subsoil, but not in the deeper soil layer. The depth-specific relationship can be attributed to the large variations observed in enzyme activities and nutrient concentrations within the soil profile (Figure 1, Figure 2 and Figure 3). We observed that land use significantly influenced the change rates of enzyme activities and nutrient variables from the topsoil to the deeper layers (Table S4). One possible explanation for the lack of a significant relationship between overall enzyme activities and nutrient status in the deeper soil layer is the decoupling between total and available nutrient concentrations in the deeper soil layers. Typically, processes such as organic matter decomposition, mineral weathering, and nutrient cycling occur at a slower rate in the deeper soil layer compared to the topsoil and subsoil [81]. This slower rate can lead to the accumulation of C, N, and P, resulting in higher total concentrations in deep soil layers. However, the availability of these nutrients for plant uptake and microbial activity may be limited due to factors such as nutrient transformations, immobilization, or strong sorption to soil particles [82]. Therefore, the total nutrient status may not directly link to enzyme activities in the deeper layers. Another possible explanation is that soil enzyme activities can be primarily influenced by specific soil properties, such as clay content, water availability, or soil pH in the deeper soil layer [83,84]. Actually, the results of general linear regression confirm that soil pH influences overall enzyme activities in the deeper soil layer. The observed low nutrient status with high enzyme activity in the rice field may be associated with high water availability in the deeper soil layer, as previous studies have found [84]. Further studies on finding driving factors of soil enzyme activities in the deeper layers are needed in future. Taken together, our findings suggest that we need to consider the important roles of soil depth in determining soil enzyme activity as an indicator of soil nutrient status across different land uses.

5. Conclusions

Our data support previous assertions that land use can influence soil total C, N, P concentrations, stoichiometric ratios, and enzyme activities throughout the soil profile. Additionally, our findings provide support for the established concept that soil enzyme activities can act as indicators of soil nutrient status in the topsoil and subsoil, but not in the deeper layer. The depth-specific nature of these relationships may be attributed to the diverse land-use management practices and the intensity of disturbances in soil nutrient cycles and enzyme activities. These findings suggest that soil enzyme activity as an indicator of soil nutrient status is depth-dependent across the different land uses. Our results can also provide some new insights into soil sustainable management practices, especially under the background of intense anthropogenic activities and global change.

Supplementary Materials

The following supporting information can be downloaded at: https://www.mdpi.com/article/10.3390/f15040581/s1, Figure S1: The result of general linear regression models between soil pH and fuzzy enzyme index at three soil depths; Table S1: Details of site information. Land use intensity classification follows the criteria proposed by Yan et al. 2017; Table S2: Factor loadings in enzyme dataset and nutrient dataset; Table S3: The variability of soil response variables across different land uses. Percentage values were calculated from the ranges of coordinates of the points on the specified axes in PCA; Table S4: One-way ANOVA summary of the effects of land use on the slopes of soil biological and chemical factors within the soil profile with Bonferroni corrected p-values.

Author Contributions

Conceptualization, Z.M.; data curation, Z.M., M.L. and J.W.; formal analysis, Z.M., W.X., M.L. and J.W.; funding acquisition, Z.M. and M.L.; investigation, Z.M., Y.C. and J.W.; methodology, Z.M., W.X., Y.C., M.L. and J.W.; project administration, Z.M., Y.C. and M.L.; resources, Y.C. and M.L.; software, Z.M., W.X., Y.C. and J.W.; supervision, J.W.; validation, Y.C.; visualization, J.W.; writing—original draft, Z.M., W.X., Y.C., M.L. and J.W.; writing—review and editing, Z.M., W.X., Y.C. and J.W. All authors have read and agreed to the published version of the manuscript.

Funding

This work was supported by the Basic Scientific Research Foundation of China West Normal University (19B036), the Doctoral Scientific Research Foundation of China West Normal University (18Q047), the Sichuan Science and Technology Program (2023ZYD0102), the Scientific Research Initiation Project of Mianyang Normal University (QD2021A37), and the Foundation of Key Laboratory of Southwest China Wildlife Resources Conservation (Ministry of Education) (XNYB22-05).

Data Availability Statement

The data presented in this study are available on request from the corresponding author.

Conflicts of Interest

The authors declare that they have no competing interests.

References

  1. Dawson, J.J.C.; Smith, P. Carbon losses from soil and its consequences for land-use management. Sci. Total Environ. 2007, 382, 165–190. [Google Scholar] [CrossRef]
  2. Ross, D.J.; Tate, K.R.; Scott, N.A.; Feltham, C.W. Land-use change: Effects on soil carbon, nitrogen and phosphorus pools and fluxes in three adjacent ecosystems. Soil Biol. Biochem. 1999, 31, 803–813. [Google Scholar] [CrossRef]
  3. Wallenius, K.; Rita, H.; Mikkonen, A.; Lappi, K.; Lindström, K.; Hartikainen, H.; Raateland, A.; Niemi, R.M. Effects of land use on the level, variation and spatial structure of soil enzyme activities and bacterial communities. Soil Biol. Biochem. 2011, 43, 1464–1473. [Google Scholar] [CrossRef]
  4. Zhang, Y.; Bhattacharyya, R.; Dalal, R.C.; Wang, P.; Menzies, N.M.; Kopittke, P.M. Impact of land use change and soil type on total phosphorus and its fractions in soil aggregates. L. Degrad. Dev. 2020, 31, 828–841. [Google Scholar] [CrossRef]
  5. Miao, F.; Li, Y.; Cui, S.; Jagamma, S.; Yang, G.; Zhang, Q. Soil extracellular enzyme activities under long-term fertilization management in the croplands of China: A meta-analysis. Nutr. Cycl. Agroecosyst. 2019, 114, 125–138. [Google Scholar] [CrossRef]
  6. Monreal, C.M.; Bergstrom, D.W. Soil enzymatic factors expressing the influence of land use, tillage system and texture on soil biochemical quality. Can. J. Soil Sci. 2000, 80, 419–428. [Google Scholar] [CrossRef]
  7. Luo, Y.; Li, Q.; Shen, J.; Wang, C.; Li, B.; Yuan, S.; Zhao, B.; Li, H.; Zhao, J.; Guo, L.; et al. Effects of agricultural land use change on organic carbon and its labile fractions in the soil profile in an urban agricultural area. L. Degrad. Dev. 2019, 30, 1875–1885. [Google Scholar] [CrossRef]
  8. Fitts, L.A.; Domke, G.M.; Russell, M.B. Comparing methods that quantify forest disturbances in the United States’ national forest inventory. Environ. Monit. Assess. 2022, 194, 304. [Google Scholar] [CrossRef]
  9. Yan, H.; Liu, F.; Liu, J.; Xiao, X.; Qin, Y. Status of land use intensity in China and its impacts on land carrying capacity. J. Geogr. Sci. 2017, 27, 387–402. [Google Scholar] [CrossRef]
  10. Prescott, C.E.; Vesterdal, L. Decomposition and transformations along the continuum from litter to soil organic matter in forest soils. For. Ecol. Manag. 2021, 498, 119522. [Google Scholar] [CrossRef]
  11. Huang, Z.; Clinton, P.W.; Davis, M.R.; Yang, Y. Impacts of plantation forest management on soil organic matter quality. J. Soils Sediments 2011, 11, 1309–1316. [Google Scholar] [CrossRef]
  12. Lu, H.; Cai, C.; Zeng, X.; Campbell, D.E.; Fan, S.; Liu, G. Bamboo vs. crops: An integrated emergy and economic evaluation of using bamboo to replace crops in south Sichuan Province, China. J. Clean. Prod. 2018, 177, 464–473. [Google Scholar] [CrossRef] [PubMed]
  13. Chen, Y.; Han, M.; Yuan, X.; Cao, G.; Zhu, B. Seasonal changes in soil properties, microbial biomass and enzyme activities across the soil profile in two alpine ecosystems. Soil Ecol. Lett. 2021, 3, 383–394. [Google Scholar] [CrossRef]
  14. Shirima, D.D.; Totland, Ø.; Moe, S.R. The relative importance of vertical soil nutrient heterogeneity, and mean and depth-specific soil nutrient availabilities for tree species richness in tropical forests and woodlands. Oecologia 2016, 182, 877–888. [Google Scholar] [CrossRef] [PubMed]
  15. Avazpoor, Z.; Moradi, M.; Basiri, R.; Mirzaei, J.; Taghizadeh-Mehrjardi, R.; Kerry, R. Soil enzyme activity variations in riparian forests in relation to plant species and soil depth. Arab. J. Geosci. 2019, 12, 708. [Google Scholar] [CrossRef]
  16. Sarto, M.V.M.; Borges, W.L.B.; Bassegio, D.; Pires, C.A.B.; Rice, C.W.; Rosolem, C.A. Soil microbial community, enzyme activity, C and N stocks and soil aggregation as affected by land use and soil depth in a tropical climate region of Brazil. Arch. Microbiol. 2020, 202, 2809–2824. [Google Scholar] [CrossRef] [PubMed]
  17. Thoms, C.; Gattinger, A.; Jacob, M.; Thomas, F.M.; Gleixner, G. Direct and indirect effects of tree diversity drive soil microbial diversity in temperate deciduous forest. Soil Biol. Biochem. 2010, 42, 1558–1565. [Google Scholar] [CrossRef]
  18. Hu, A.; Yu, Z.; Liu, X.; Gao, W.; He, Y.; Li, J. The effects of irrigation and fertilization on the migration and transformation processes of main chemical components in the soil profile. Environ. Geochem. Health 2019, 41, 2631–2648. [Google Scholar] [CrossRef] [PubMed]
  19. Muneer, M.A.; Hou, W.; Li, J.; Huang, X.; Ur Rehman Kayani, M.; Cai, Y.; Yang, W.; Wu, L.; Ji, B.; Zheng, C. Soil pH: A key edaphic factor regulating distribution and functions of bacterial community along vertical soil profiles in red soil of pomelo orchard. BMC Microbiol. 2022, 22, 38. [Google Scholar] [CrossRef]
  20. Vipotnik, Z.; Michelin, M.; Tavares, T. Ligninolytic enzymes production during polycyclic aromatic hydrocarbons degradation: Effect of soil pH, soil amendments and fungal co-cultivation. Biodegradation 2021, 32, 193–215. [Google Scholar] [CrossRef]
  21. Samuel, A.D.; Domuta, C.; Ciobanu, C.; Sandor, M. Field management effects on soil enzyme activities. Rom. Agric. Res. 2008, 28, 61–68. [Google Scholar]
  22. Lehmann, J.; Schroth, G. Nutrient leaching. In Trees, Crops and Soil Fertility: Concepts and Research Methods; CABI Publishing: Wallingford, UK, 2002; pp. 151–166. [Google Scholar]
  23. Lv, H.; Zhao, Y.; Wang, Y.; Wan, L.; Wang, J.; Butterbach-Bahl, K.; Lin, S. Conventional flooding irrigation and over fertilization drives soil pH decrease not only in the top-but also in subsoil layers in solar greenhouse vegetable production systems. Geoderma 2020, 363, 114156. [Google Scholar] [CrossRef]
  24. Maxwell, T.L.; Augusto, L.; Bon, L.; Courbineau, A.; Altinalmazis-Kondylis, A.; Milin, S.; Bakker, M.R.; Jactel, H.; Fanin, N. Effect of a tree mixture and water availability on soil nutrients and extracellular enzyme activities along the soil profile in an experimental forest. Soil Biol. Biochem. 2020, 148, 107864. [Google Scholar] [CrossRef]
  25. Gao, Y.; Mao, L.; Miao, C.; Zhou, P.; Cao, J.; Zhi, Y.; Shi, W. Spatial characteristics of soil enzyme activities and microbial community structure under different land uses in Chongming Island, China: Geostatistical modelling and PCR-RAPD method. Sci. Total. Environ. 2010, 408, 3251–3260. [Google Scholar] [CrossRef] [PubMed]
  26. Dick, R.P. Soil enzyme activities as indicators of soil quality. Defin. Soil Qual. Sustain. Environ. 1994, 35, 107–124. [Google Scholar]
  27. Sinsabaugh, R.L. Phenol oxidase, peroxidase and organic matter dynamics of soil. Soil Biol. Biochem. 2010, 42, 391–404. [Google Scholar] [CrossRef]
  28. Jian, S.; Li, J.; Chen, J.I.; Wang, G.; Mayes, M.A.; Dzantor, K.E.; Hui, D.; Luo, Y. Soil extracellular enzyme activities, soil carbon and nitrogen storage under nitrogen fertilization: A meta-analysis. Soil Biol. Biochem. 2016, 101, 32–43. [Google Scholar] [CrossRef]
  29. Yokoyama, D.; Imai, N.; Kitayama, K. Effects of nitrogen and phosphorus fertilization on the activities of four different classes of fine-root and soil phosphatases in Bornean tropical rain forests. Plant Soil 2017, 416, 463–476. [Google Scholar] [CrossRef]
  30. Xiao, W.; Chen, X.; Jing, X.; Zhu, B. A meta-analysis of soil extracellular enzyme activities in response to global change. Soil Biol. Biochem. 2018, 123, 21–32. [Google Scholar] [CrossRef]
  31. Stefanic, G.; Eliade, G.; Chirnogeanu, I. Researches concerning a biological index of soil fertility. In Proceedings of the 5th Symposium on Soil Biology, Iasi, Romania, 17 February 1981; Romanian National Society of Soil Sciences: Bucharest, Romania, 1984. [Google Scholar]
  32. Beck, T. Methods and application of soil microbiological analysis at the Landensanstalt fllr Bodenkultur und Pflanzenbau (LBB) in Munich for the determination of some aspects of soil fertility. In Proceedings of the 5th Symposium on Soil Biology, Iasi, Romania, 17 February 1981; Romanian National Society of Soil Sciences: Bucharest, Romania, 1984; pp. 13–20. [Google Scholar]
  33. Acosta-Martinez, V.; Cano, A.; Johnson, J. Simultaneous determination of multiple soil enzyme activities for soil health-biogeochemical indices. Appl. Soil Ecol. 2018, 126, 121–128. [Google Scholar] [CrossRef]
  34. Liu, J.; Li, S.; Ouyang, Z.; Tam, C.; Chen, X. Ecological and socioeconomic effects of China’s policies for ecosystem services. Proc. Natl. Acad. Sci. USA 2008, 105, 9477. [Google Scholar] [CrossRef]
  35. Kovar, J.L.; Pierzynski, G.M. Methods of Phosphorus Analysis for Soils, Sediments, Residuals, and Waters, 2nd ed.; Southern Cooperative Series Bulletin No. 408; North Carolina State University: Raleigh, NC, USA, 2009. [Google Scholar]
  36. Guan, S.Y. Soil Enzymes and Their Research Methodology; China Agriculture Press: Beijing, China, 1986. [Google Scholar]
  37. Zadeh, L.A. Fuzzy logic. Computer 1988, 21, 83–93. [Google Scholar] [CrossRef]
  38. Shen, G.; Lu, Y.; Wang, M.; Sun, Y. Status and fuzzy comprehensive assessment of combined heavy metal and organo-chlorine pesticide pollution in the Taihu Lake region of China. J. Environ. Manag. 2005, 76, 355–362. [Google Scholar] [CrossRef]
  39. Xue, Y.; Liu, S.; Hu, Y.; Yang, J. Soil quality assessment using weighted fuzzy association rules. Pedosphere 2010, 20, 334–341. [Google Scholar] [CrossRef]
  40. Wang, D.; Bai, J.; Wang, W.; Zhang, G.; Cui, B.; Liu, X.; Li, X. Comprehensive assessment of soil quality for different wetlands in a Chinese delta. L. Degrad. Dev. 2018, 29, 3783–3794. [Google Scholar] [CrossRef]
  41. Wu, C.; Liu, G.; Huang, C.; Liu, Q. Soil quality assessment in Yellow River Delta: Establishing a minimum data set and fuzzy logic model. Geoderma 2019, 334, 82–89. [Google Scholar] [CrossRef]
  42. Tibshirani, R. Regression shrinkage and selection via the lasso. J. R Stat. Soc. Ser. B 1996, 58, 267–288. [Google Scholar] [CrossRef]
  43. Dormann, C.F.; Elith, J.; Bacher, S.; Buchmann, C.; Carl, G.; Carré, G.; García Marquéz, J.R.; Gruber, B.; Lafourcade, B.; Leitão, P.J.; et al. Collinearity: A review of methods to deal with it and a simulation study evaluating their performance. Ecography 2013, 36, 27–46. [Google Scholar] [CrossRef]
  44. Reddy, K.R.; Patrick, W.H.; Broadbent, F.E. Nitrogen transformations and loss in flooded soils and sediments. Crit. Rev. Environ. Sci. Technol. 1984, 13, 273–309. [Google Scholar] [CrossRef]
  45. Allison, S.D.; Vitousek, P.M. Responses of extracellular enzymes to simple and complex nutrient inputs. Soil Biol. Biochem. 2005, 37, 937–944. [Google Scholar] [CrossRef]
  46. Qi, D.; Wu, Q.; Zhu, J. Nitrogen and phosphorus losses from paddy fields and the yield of rice with different water and nitrogen management practices. Sci. Rep. 2020, 10, 9734. [Google Scholar] [CrossRef] [PubMed]
  47. Xia, L.; Lam, S.K.; Wang, S.; Zhou, W.; Chen, D.; Yan, X. Optimizing nitrogen fertilization rate to enhance soil carbon storage and decrease nitrogen pollution in paddy ecosystems with simultaneous straw incorporation. Agric. Ecosyst. Environ. 2020, 298, 106968. [Google Scholar] [CrossRef]
  48. Haynes, R.J.; Goh, K.M. Some observations on surface soil pH, base saturation and leaching of cations under three contrasting orchard soil management practices. Plant Soil 1980, 56, 429–438. [Google Scholar] [CrossRef]
  49. Zhang, W.; Yu, Y.; Li, T.; Sun, W.; Huang, Y. Net greenhouse gas balance in China’s croplands over the last three decades and its mitigation potential. Environ. Sci. Technol. 2014, 48, 2589–2597. [Google Scholar] [CrossRef] [PubMed]
  50. Xu, Q.; Jiang, P.; Xu, Z. Soil microbial functional diversity under intensively managed bamboo plantations in southern China. J. Soils Sediments 2008, 8, 177–183. [Google Scholar] [CrossRef]
  51. Zhang, J.; Jiang, J.; Tian, G. The potential of fertilizer management for reducing nitrous oxide emissions in the cleaner production of bamboo in China. J. Clean. Prod. 2016, 112, 2536–2544. [Google Scholar] [CrossRef]
  52. Mishra, S.; Singh, K.; Sahu, N.; Singh, S.N.; Manika, N.; Chaudhary, L.B.; Jain, M.K.; Kumar, V.; Behra, S.K. Understanding the relationship between soil properties and litter chemistry in three forest communities in tropical forest ecosystem. Environ. Monit. Assess. 2019, 191, 797. [Google Scholar] [CrossRef] [PubMed]
  53. Sinsabaugh, R.L.; Lauber, C.L.; Weintraub, M.N.; Ahmed, B.; Allison, S.D.; Crenshaw, C.; Contosta, A.R.; Cusack, D.; Frey, S.; Gallo, M.E.; et al. Stoichiometry of soil enzyme activity at global scale. Ecol. Lett. 2008, 11, 1252–1264. [Google Scholar] [CrossRef]
  54. Herbien, S.A.; Neal, J.L. Soil pH and phosphatase activity. Commun. Soil Sci. Plant. Anal. 1990, 21, 439–456. [Google Scholar] [CrossRef]
  55. Nannipieri, P.; Trasar-Cepeda, C.; Dick, R.P. Soil enzyme activity: A brief history and biochemistry as a basis for appropriate interpretations and meta-analysis. Biol. Fertil. Soils 2018, 54, 11–19. [Google Scholar] [CrossRef]
  56. Neina, D. The role of soil pH in plant nutrition and soil remediation. Appl. Environ. Soil Sci. 2019, 2019, 5794869. [Google Scholar] [CrossRef]
  57. Hassan, W.; Chen, W.; Cai, P.; Huang, Q. Oxidative enzymes, the ultimate regulator: Implications for factors affecting their efficiency. J. Environ. Qual. 2013, 42, 1779–1790. [Google Scholar] [CrossRef]
  58. Stursova, M.; Sinsabaugh, R.L. Stabilization of oxidative enzymes in desert soil may limit organic matter accumulation. Soil Biol. Biochem. 2008, 40, 550–553. [Google Scholar] [CrossRef]
  59. Maharjan, M.; Sanaullah, M.; Razavi, B.S.; Kuzyakov, Y. Effect of land use and management practices on microbial biomass and enzyme activities in subtropical top-and sub-soils. Appl. Soil Ecol. 2017, 113, 22–28. [Google Scholar] [CrossRef]
  60. Sandoval-Pcbrez, A.L.; Gavito, M.E.; Garcca-Oliza, F.; Jaramillo, V.J. Carbon, nitrogen, phosphorus, and enzymatic activity under different land uses in a tropical, dry ecosystem. Soil Use Manag. 2009, 25, 419–426. [Google Scholar] [CrossRef]
  61. Sardans, J.; Rivas-Ubach, A.; Penuelas, J. The elemental stoichiometry of aquatic and terrestrial ecosystems and its relationships with organismic lifestyle and ecosystem structure and function: A review and perspectives. Biogeochemistry 2012, 111, 1–39. [Google Scholar] [CrossRef]
  62. Sinsabaugh, R.L.; Moorhead, D.L. Resource allocation to extracellular enzyme production: A model for nitrogen and phosphorus control of litter decomposition. Soil Biol. Biochem. 1994, 26, 1305–1311. [Google Scholar] [CrossRef]
  63. Fierer, N.; Schimel, J.P.; Holden, P.A. Variations in microbial community composition through two soil depth profiles. Soil Biol. Biochem. 2003, 35, 167–176. [Google Scholar] [CrossRef]
  64. Gong, J.; Hou, W.; Liu, J.; Malik, K.; Kong, X.; Wang, L.; Chen, X.; Tang, M.; Zhu, R.; Cheng, C.; et al. Effects of different land use types and soil depths on soil mineral elements, soil enzyme activity, and fungal community in Karst area of Southwest China. Int. J. Environ. Res. Public Health 2022, 19, 3120. [Google Scholar] [CrossRef]
  65. Uksa, M.; Schloter, M.; Kautz, T.; Athmann, M.; Köpke, U.; Fischer, D. Spatial variability of hydrolytic and oxidative potential enzyme activities in different subsoil compartments. Biol. Fertil. Soils 2015, 51, 517–521. [Google Scholar] [CrossRef]
  66. Gu, C.; Zhang, S.; Han, P.; Hu, X.; Xie, L.; Li, Y.; Brooks, M.; Liao, X.; Qin, L. Soil enzyme activity in soils subjected to flooding and the effect on nitrogen and phosphorus uptake by oilseed rape. Front. Plant Sci. 2019, 10, 368. [Google Scholar] [CrossRef]
  67. Drenovsky, R.E.; Steenwerth, K.L.; Jackson, L.E.; Scow, K.M. Land use and climatic factors structure regional patterns in soil microbial communities. Glob. Ecol. Biogeogr. 2010, 19, 27–39. [Google Scholar] [CrossRef]
  68. Sui, X.; Zhang, R.; Frey, B.; Yang, L.; Li, M.; Ni, H. Land use change effects on diversity of soil bacterial, Acidobacterial and fungal communities in wetlands of the Sanjiang Plain, northeastern China. Sci. Rep. 2019, 9, 18535. [Google Scholar] [CrossRef]
  69. Patrick, W.H., Jr.; Mikkelsen, D.S.; Wells, B.R. Plant nutrient behavior in flooded soil. In Fertilizer Technology and Use, 3rd ed.; Wiley: Hoboken, NJ, USA, 1985; pp. 197–228. [Google Scholar]
  70. Krauss, U.; Deacon, J.W. Root turnover of groundnut (Arachis hypogaea L.) in soil tubes. Plant Soil 1994, 166, 259–270. [Google Scholar] [CrossRef]
  71. Basak, M.; Dutta, S.; Biswas, S.; Chakraborty, S.; Sarkar, A.; Rahaman, T.; Dey, S.; Das, M.; Biswas, P. Genomic insights into growth and development of bamboos: What have we learnt and what more to discover? Trees 2021, 35, 1771–1791. [Google Scholar] [CrossRef]
  72. Yang, T.; Wang, P.; Wang, W.; Jin, G.; Qiu, Y.; Shen, H.; Zhang, Z.; Zhou, Z. Early growth evaluation and biomass allocation difference between clones and families in Cupressus funebris. Eur. J. For. Res. 2023, 142, 839–850. [Google Scholar] [CrossRef]
  73. Pedersen, O.; Sauter, M.; Colmer, T.D.; Nakazono, M. Regulation of root adaptive anatomical and morphological traits during low soil oxygen. New Phytol. 2021, 229, 42–49. [Google Scholar] [CrossRef] [PubMed]
  74. Zhang, S.; Zhang, X.; Huffman, T.; Liu, X.; Yang, J. Influence of topography and land management on soil nutrients variability in Northeast China. Nutr. Cycl. Agroecosystems 2011, 89, 427–438. [Google Scholar] [CrossRef]
  75. de Paul Obade, V.; Lal, R. Soil quality evaluation under different land management practices. Environ. Earth Sci. 2014, 72, 4531–4549. [Google Scholar] [CrossRef]
  76. Acín-Carrera, M.; José Marques, M.; Carral, P.; Álvarez, A.M.; López, C.; Martín-López, B.; González, J.A. Impacts of land-use intensity on soil organic carbon content, soil structure and water-holding capacity. Soil Use Manag. 2013, 29, 547–556. [Google Scholar] [CrossRef]
  77. Tischer, A.; Sehl, L.; Meyer, U.-N.; Kleinebecker, T.; Klaus, V.; Hamer, U. Land-use intensity shapes kinetics of extracellular enzymes in rhizosphere soil of agricultural grassland plant species. Plant Soil 2019, 437, 215–239. [Google Scholar] [CrossRef]
  78. Khormali, F.; Ajami, M.; Ayoubi, S.; Srinivasarao, C.; Wani, S.P. Role of deforestation and hillslope position on soil quality attributes of loess-derived soils in Golestan province, Iran. Agric. Ecosyst. Environ. 2009, 134, 178–189. [Google Scholar] [CrossRef]
  79. Wei, X.; Shao, M.; Gale, W.; Li, L. Global pattern of soil carbon losses due to the conversion of forests to agricultural land. Sci. Rep. 2014, 4, 4062. [Google Scholar] [CrossRef] [PubMed]
  80. Utobo, E.B.; Tewari, L. Soil enzymes as bioindicators of soil ecosystem status. Appl. Ecol. Environ. Res. 2015, 13, 147–169. [Google Scholar]
  81. Kautz, T.; Amelung, W.; Ewert, F.; Gaiser, T.; Horn, R.; Jahn, R.; Javanux, M.; Kemma, A.; Kuzyakov, Y.; Munch, J.; et al. Nutrient acquisition from arable subsoils in temperate climates: A review. Soil Biol. Biochem. 2013, 57, 1003–1022. [Google Scholar] [CrossRef]
  82. Tian, Q.; Wang, X.; Wang, D.; Wang, M.; Liao, C.; Yang, X.; Liu, F. Decoupled linkage between soil carbon and nitrogen mineralization among soil depths in a subtropical mixed forest. Soil Biol. Biochem. 2017, 109, 135–144. [Google Scholar] [CrossRef]
  83. Zheng, H.; Liu, Y.; Zhang, J.; Chen, Y.; Yang, L.; Li, H.; Wang, L. Factors influencing soil enzyme activity in China’s forest ecosystems. Plant Ecol. 2018, 219, 31–44. [Google Scholar] [CrossRef]
  84. Zhu, Y.; Sun, L.; Fu, Q.; Guo, B.; Lin, Y.; Liu, X. Long-term rice cultivation improved coastal saline soil properties and multifunctionality of subsoil layers. Soil Use Manag. 2024, 40, e12918. [Google Scholar] [CrossRef]
Figure 1. Total concentrations of C, N, and P, and molar ratios of N:P, C:N, and C:P in soil across different land uses and soil depths. Capital letters indicate significant difference among means within land use, while lower case letters indicate significant differences among means between soil depths.
Forests 15 00581 g001
Figure 2. Soil pH values across different land uses and soil depths. Capital letters indicate significant difference among means within land use, while lower case letters indicate significant differences among means between soil depths.
Forests 15 00581 g002
Figure 3. Soil enzyme activities across different land uses and soil depths. Capital letters indicate significant difference among means within land uses, while lower case letters indicate significant differences among means between soil depths.
Forests 15 00581 g003
Figure 4. (A) Fuzzy enzyme index and (B) fuzzy nutrient-status index across different land uses at each soil depth. The indices were estimated using the fuzzy comprehensive evaluation method to characterize overall enzyme activities and soil nutrient status. Capital letters indicate significant difference among means within land uses. (C) The result of general linear regression models between fuzzy enzyme index and fuzzy nutrient-status index at three soil depths.
Forests 15 00581 g004
Figure 5. Projection of the first two principal components of PCA showing ordination of soil samples across land uses and soil depths as a function of nutrient and enzyme activity variables (vectors). Density plots on the top and right shows the density distribution of soil samples across three depths in PC 1 and PC 2, respectively. The densities are computed with a kernel density estimator.
Forests 15 00581 g005
Table 1. Two-way ANOVA summary of the effects of land use and soil depth on soil biological and chemical factors with Bonferroni-corrected p-values (* p < 0.0033, *** p < 0.0001).
SourceLand Use Soil DepthLand Use × Soil Depth
dfFpDfFpdfFp
Acid phosphatase4226.77***2765.45***832.35***
Urease4256.34***2720.99***827.03***
Amylase4493.47***2311.22***86.78***
Invertase4310.59***21989.9***872.28***
Cellulase436.49***2283.52***82.90.011
Catalase4104.57***24.740.01487.45***
Dehydrogenase4641.71***2843.69***876.24***
Phenol oxidase4133.28***2222.51***819.79***
C454.39***2122.01***814.22***
N413.89***2123.31***86.83***
P4173.75***2103.9***833.14***
C:N419.02***29.33*88***
N:P415.35***252.11***823.88***
C:P462.93***267.21***84.41*
pH4161.53***2736.91***814.83***
Table 2. Coefficient estimates from lasso regression models comparing the relative importance of soil C, N, and P concentrations, their stoichiometric ratios, and pH for enzyme activities. Non-zero coefficients indicate the predictors that are relevant for each regression model. Missing values indicate no significant correlations were found. R2 were obtained from the final model produced by the optimal lambda value.
Acid PhosphataseUreaseAmylaseInvertaseCellulaseCatalase DehydrogenasePhenol Oxidase
R20.740.550.520.670.60.370.790.26
C0.440.910.040.250.080.49
N0.390.130.280.660.17 0.67
P0.78 1.621.020.550.152.05
C:N 0.03
N:P
C:P
pH 3.186.62−8.242.295.27
Disclaimer/Publisher’s Note: The statements, opinions and data contained in all publications are solely those of the individual author(s) and contributor(s) and not of MDPI and/or the editor(s). MDPI and/or the editor(s) disclaim responsibility for any injury to people or property resulting from any ideas, methods, instructions or products referred to in the content.

