Review

Evaluating the Research Status of the Remote Sensing-Mediated Monitoring of Forest Biomass: A Bibliometric Analysis of WOS

by
Yonglei Shi
1,2,
Zhihui Wang
2,*,
Guojun Zhang
3,
Xiaoyan Wei
3,
Wentao Ma
3 and
Haoran Yu
4
1
Co-Innovation Center for the Sustainable Forestry in Southern China, Nanjing Forestry University, Nanjing 210037, China
2
Key Laboratory of Soil and Water Conservation on the Loess Plateau, Yellow River Institute of Hydraulic Research, Yellow River Conservancy Commission, Zhengzhou 450003, China
3
Ningxia Soil and Water Conservation Monitoring Station, Yinchuan 750002, China
4
College of Landscape Architecture, Nanjing Forestry University, Nanjing 210037, China
*
Author to whom correspondence should be addressed.
Forests 2024, 15(3), 524; https://doi.org/10.3390/f15030524
Submission received: 6 February 2024 / Revised: 8 March 2024 / Accepted: 11 March 2024 / Published: 12 March 2024
(This article belongs to the Special Issue Biomass Estimation and Carbon Stocks in Forest Ecosystems—Volume II)

Abstract

:
Forests serve as the largest carbon reservoir in terrestrial ecosystems, playing a crucial role in mitigating global warming and achieving the goal of “carbon neutrality”. Forest biomass is intrinsically related to carbon sinks and sources in forest ecosystems, and thus, the accurate monitoring of forest biomass is of great significance in ensuring ecological security and maintaining the global carbon balance. Significantly, remote sensing is not only able to estimate forest biomass at a large spatial scale but does so quickly, accurately, and without loss. Moreover, it can obtain forest biomass in areas inaccessible to human beings, which have become the main data source for forest biomass estimation at present. For this reason, this study analyzes the current research status, research hotspots, and future research trends in the field of remote sensing monitoring of forest biomass based on 1678 forest biomass remote sensing monitoring results from 1985 to 2023 obtained from the Web of Science Core Collection database. The results showed that the following: (1) The number of publications showed an exponential upward trend from 1985 to 2023, with an average annual growth rate of 2.64%. The top ten journals contributed to 53.76% of the total number of publications and 52.89% of the total number of citations in the field. (2) In particular, Remote Sensing of Environment has maintained a leading position in the field for an extended period, boasting the highest impact factor. Additionally, the author Saatchi S. stands out with the highest total number of citations for articles. (3) Keyword clustering analysis revealed that the main research topics in the remote sensing monitoring of forest biomass can be categorized into the following: optical remote sensing, LiDAR remote sensing, SAR remote sensing, and carbon stock. The explosion of keywords in the last six years indicates that an increasing number of researchers are focusing on carbon, airborne LiDAR data, biomass mapping, and constructing optimal biomass models.

1. Introduction

Forests are the largest carbon reservoirs in terrestrial ecosystems, storing more than 70% of the carbon in these systems [1]. Remarkably, it has been reported that forests globally can offset more than 25% of anthropogenic carbon emissions annually, establishing themselves as an important guarantee for mitigating atmospheric CO2 concentrations and achieving the goal of “carbon neutrality” [2]. Additionally, forest biomass serves as a source of nutrients for the entire forest ecosystem and is closely related to the carbon sinks and sources within it [3,4]. Therefore, the accurate monitoring of forest biomass is crucial for ensuring ecological security, maintaining the global carbon balance, and preparing for future climate change [5,6].
Traditional forest biomass estimation primarily utilizes methods such as the clearcut method, standard timber method, and regression method [7]. While these traditional methods boast higher accuracy, they are plagued by drawbacks: they are time-consuming and labor-intensive, cannot facilitate continuous, large-scale monitoring, and are notably destructive to the ecological environment [8]. In contrast, remote sensing emerges as a superior alternative, offering quick, accurate, non-destructive large-scale forest biomass estimation. Moreover, it can access forest biomass in areas otherwise unreachable by humans, thus becoming the main data source for forest biomass estimation. Remote sensing technology varies according to the type of sensor used, and can be classified into optical remote sensing [1], radar remote sensing (SAR) [9], and light detection and ranging (LiDAR) remote sensing [10]. Each type of remote sensing datum presents unique strengths and limitations in forest biomass estimation [11]. Optical remote sensing, the most widely used type, is susceptible to weather influences and prone to the “saturation” phenomenon in high-biomass areas [10]. Conversely, SAR remote sensing overcomes weather-related limitations, providing insights into the forest canopy level and vertical structure, making it a promising data source for biomass inversion [12]. However, SAR’s effectiveness varies with different wavelengths, each having its own saturation points [10]. Meanwhile, SAR is sensitive to moisture. In comparison, LiDAR, unlike optical images and SAR backscattering coefficients, avoids the saturation effect in high-biomass and structurally complex forest areas [13]. Yet, the limitations of LiDAR lie in its limited scope and higher cost of data acquisition.
Forest biomass is not only a key indicator for assessing forest health, carbon sequestration capacity, and productivity, but also an important variable for quantifying forest structure and function [14]. It encompasses aboveground biomass (branches and leaves) and belowground biomass (roots), representing the accumulation of annual net primary production over the plants’ life cycle in a forest [15]. Typically, the longer a forest exists, the more biomass it tends to accumulate. Due to the challenge of obtaining below-ground biomass in the field, previous remote sensing forest biomass monitoring primarily focused on above-ground biomass, with below-ground biomass mostly estimated using the ratio coefficient of above-ground to below-ground biomass. To estimate forest biomass based on remote sensing data, regression models or machine learning methods are often employed to construct forest biomass models. These models are then synergized with remote sensing data to quantitatively invert forest biomass [16,17,18]. As a field of significant research value and potential, the application of remote sensing technology in studying forest biomass has emerged as a prevalent approach. Consequently, the results of related studies have garnered considerable attention from researchers.
Although a significant volume of studies on the remote sensing monitoring of forest biomass have been published, a comprehensive analysis of research hotspots and future development trends in this area remains insufficiently explored. Bibliometric analysis can effectively review research hotspots, trends, and even predict future directions in a research field [19]. This approach enables researchers to both quantitatively and qualitatively analyze the published literature, exploring underlying structures and deep mechanisms [20]. Given the continuous development of bibliometric analysis software such as CiteSpace [21], Bibliometrix R-package [22], and VOSviewer [23], bibliometrics has become increasingly popular among researchers. Concerning the analyzed tools, Bibliometrix contains a more extensive set of techniques and is suitable for practitioners due to Biblioshiny [24,25]. VOSviewer has fantastic visualization and is capable of loading and exporting information from many sources [25,26]. CiteSpace is a freely available software tool for analyzing, detecting, and visualizing trends and patterns in the scientific literature [27,28]. In this context, this study’s metrological visualization and analysis of literature related to the remote sensing monitoring of forest biomass aims to shed light on the current research status and emerging trends in this domain. Furthermore, it aspires to provide a robust scientific reference for future research on the remote sensing monitoring of forest biomass.

2. Materials and Methods

2.1. Data Sources

The data used in this study were obtained from the Web of Science (WOS) Core Collection database. The literature search was conducted on 8 January 2024, and the following parameters were set for the topic search to ensure that an accurate dataset was obtained: TS = (“forest biomass*” or “tree biomass*” or “forest aboveground biomass*” or “plantation* biomass*”) and TS = (“remote sensing*” or “RS” or “LiDAR” or “SAR” or “optical”). The language was set to English. The publication type was set to “articles” and “review articles”. In total, 1678 publications were retrieved, including 1623 articles and 55 review articles, and the selected publications were exported in text format, containing the title, year, author, keywords, abstract, country, citation, and other details of each publication.

2.2. Methods

Bibliometric analysis can scientifically map trends in the evolution of topics in the field, identify emerging topics, and predict future research directions via searching and analyzing publications, literature sources, and references. In this study, 1678 works from the literature related to the remote sensing monitoring of forest biomass were visualized, analyzed, and data-mined using Citespace 5.7.R 5, Bibliometrix 4.1.4 R-package, VOSviewer 1.6.20, and Microsoft Excel 365. Among them, Bibliometrix 4.1.4 R-package is a web-based online open-source tool written in R, which developed by Massimo Aria from the University of Naples Federico II in the Italy. VOSviewer 1.6.20 is a freely available text mining software developed by Van Eck and Waltman (Leiden University) in the Netherlands. Citespace 5.7.R 5 is a powerful document visualization analysis software invented by Chaomei Chen in the United States of America.
The obtained publication information was imported into the Bibliometrix 4.1.4 interface in order to facilitate the analysis of the number of publications, citations, journals, and authors, and of the institutional information, per year. Performance analysis can be utilized to assess the contribution of authors, institutions, countries, and journals to the volume of publications in the field. In this study, the growth of publications from 1985 to 2023 was revealed by counting the number of published articles annually using Excel 365. CiteSpace 5.7.R 5 was used to draw a knowledge graph of the remote sensing monitoring of forest biomass and obtain the co-occurrence network, intellectual base, and research hotspots related to it, so as to provide reference for objectively understanding the research conducted in this field. Keywords are the core vocabulary of a publication and can reflect the topic of the paper. Co-occurrence was defined as the number of times that two terms emerged in the same paper. Keyword co-occurrence analysis involved calculating the occurrences of the author keywords extracted from the collected 1678 papers using VOSviewer 1.6.20. Keyword theme evolution can be used to show the research hotspots in different periods; in this study, Bibliometrix 4.1.4 software was used to clearly explore the past research shifts and future trends of keywords by dividing the time slices into four periods (1985–2000, 2001–2008, 2009–2016, and 2017–2023). Keyword outbreak can be used to reveal the more popular topics in recent years, based on Citespace 5.7.R 5 software, to obtain the top 20 keywords; from this, important keywords that have exploded in the last 6 years were analyzed.

3. Results

3.1. Basic Characteristics of the Publication

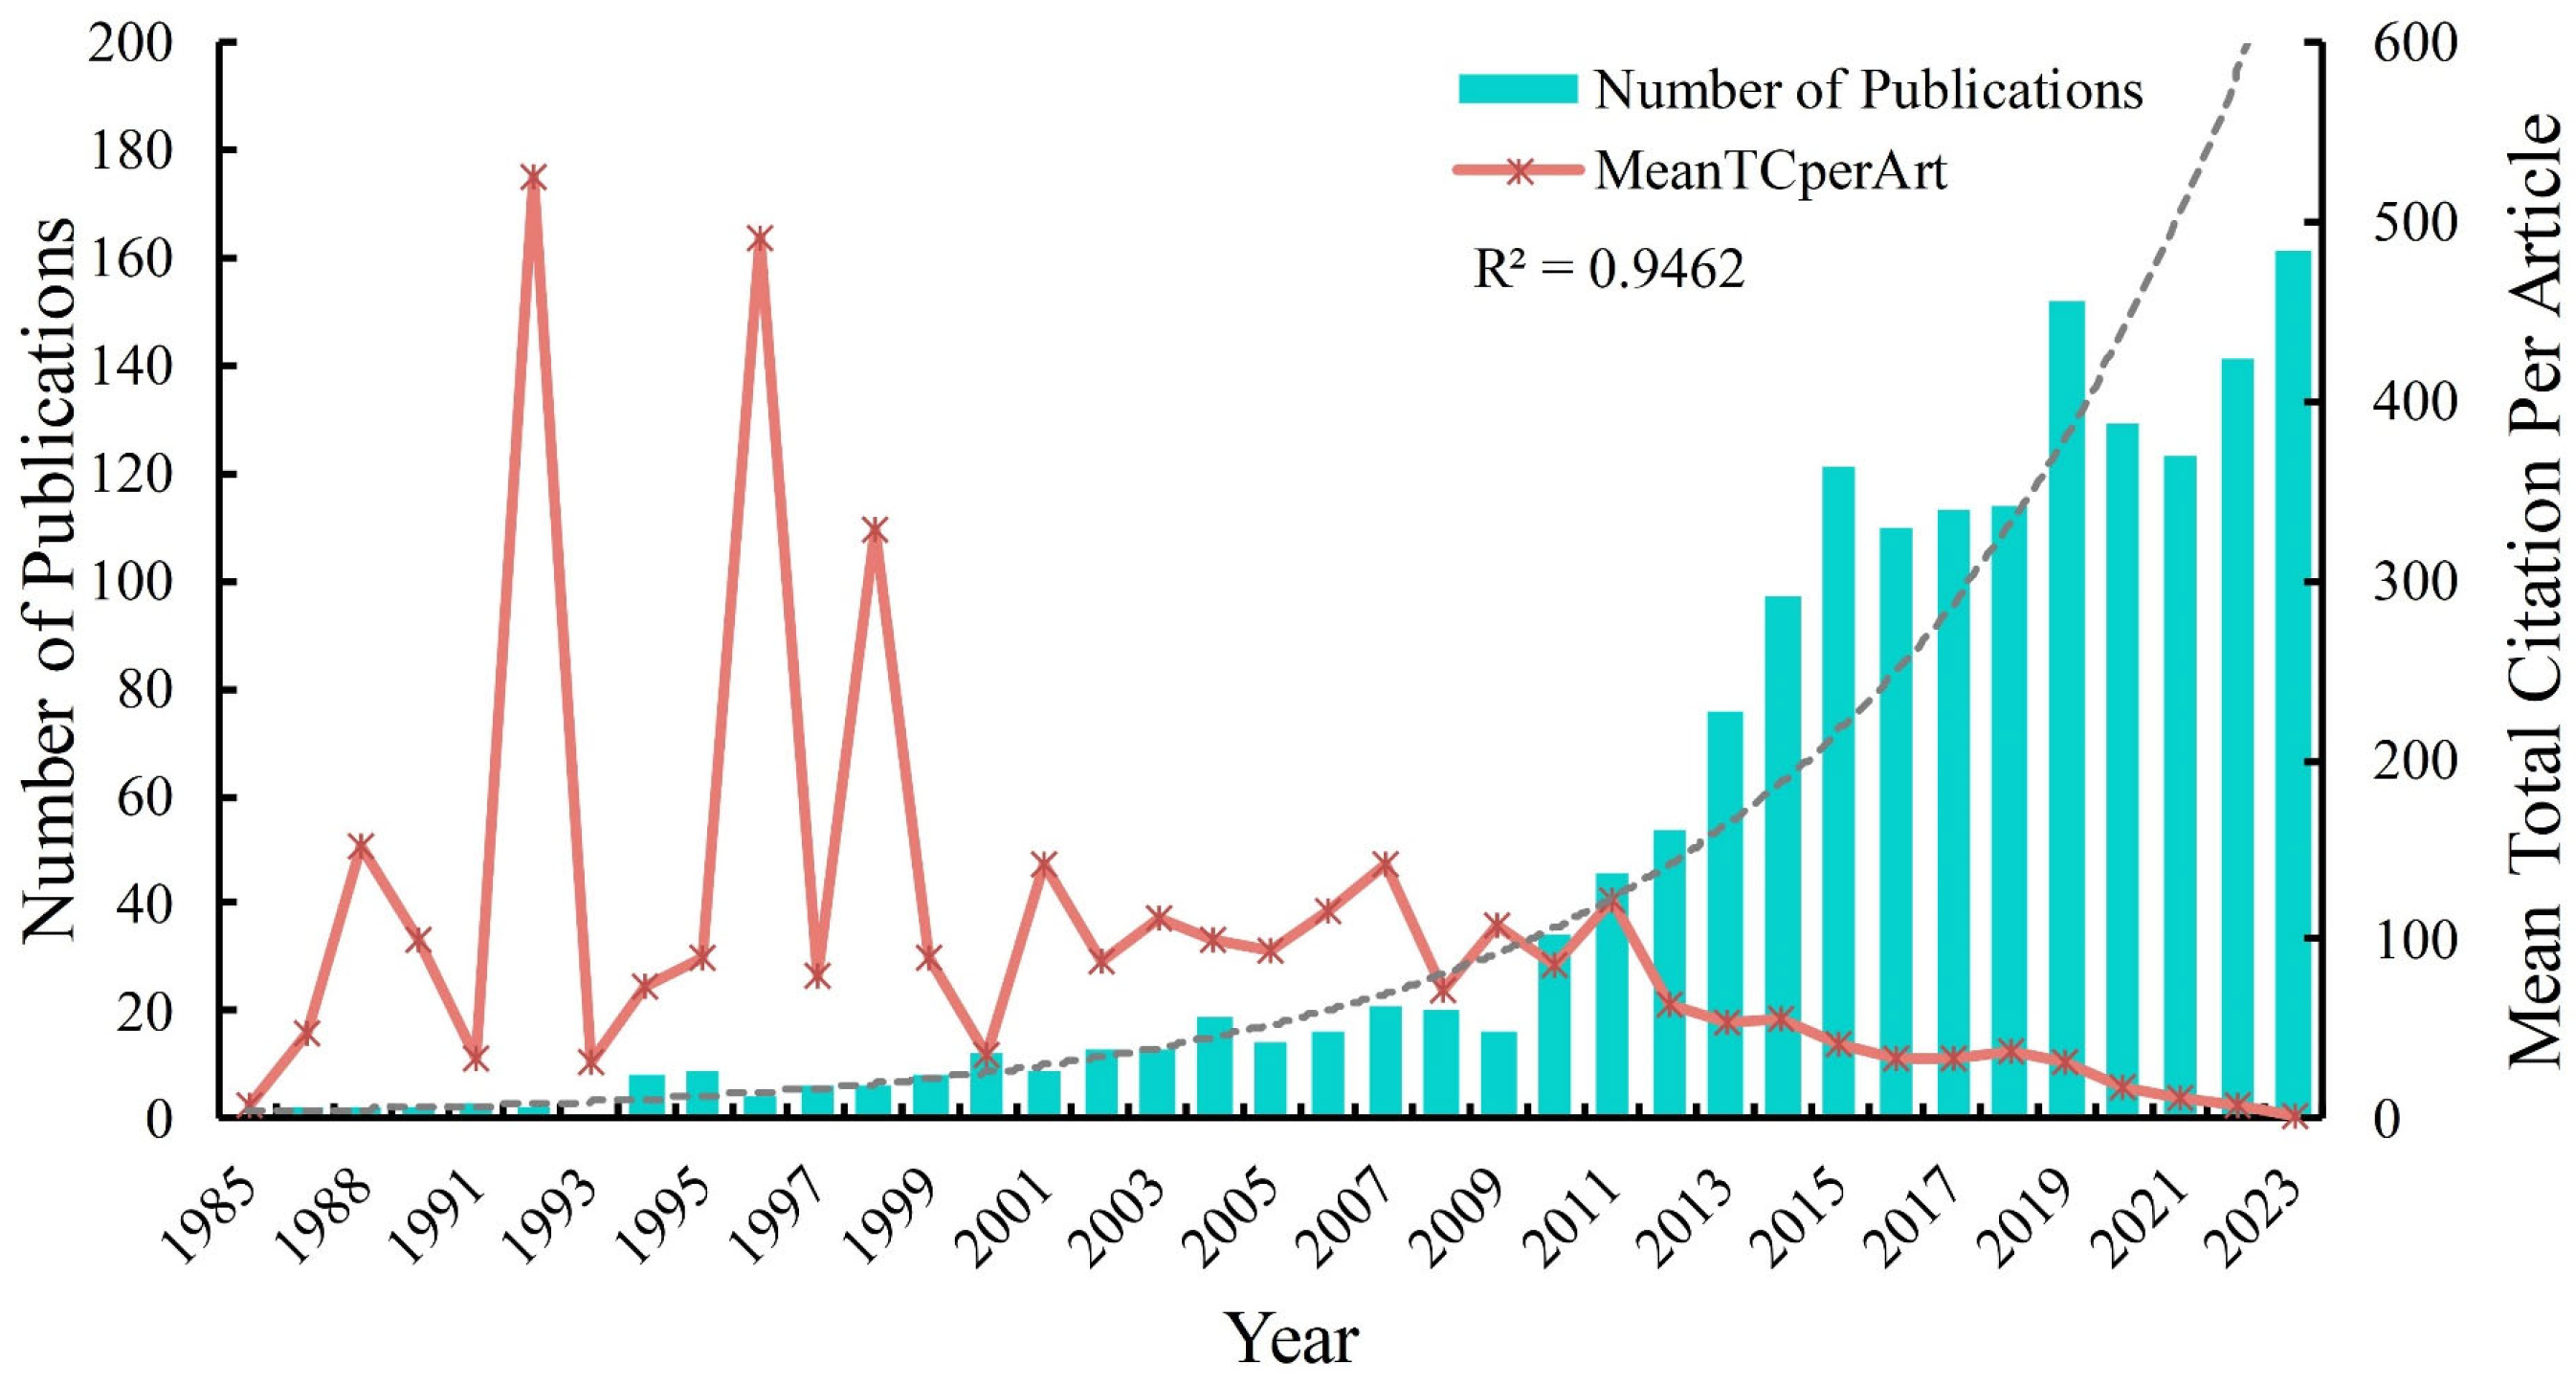
3.1.1. Quantity of Publication and Citations

The number of published papers reflects, to some extent, the year-to-year changes and future trends of research topics. The year-to-year trend of the number of publications related to the remote sensing monitoring of forest biomass obtained from WOS is shown in Figure 1. The horizontal axis indicates the year, and the vertical axis indicates the number of publications and the number of citations [28]. With the launch of the first civilian SAR satellite (Seasat) in 1978, the application of SAR for monitoring in various fields was promoted. Schreier et al. (1984) [29] determined, in a terrain mapping study in Canada, that airborne LiDAR data would be useful for vegetation canopy height determination. This discovery propelled the future application of airborne LiDAR in forest biomass monitoring. The purpose of the Copernicus program is to achieve global, continuous, high-quality, large-scale Earth observation capabilities, providing accurate, timely, and easily accessible information to understand and mitigate climate change. With the implementation of the Copernicus program in 2011, it has spurred a wave of interest in forest biomass monitoring. With the publication of the first relevant article on the topic in 1985 (‘Remote sensing forest biomass: an evaluation using high resolution remote sensor data and loblolly pine plots’), the curtain was raised on the remote sensing monitoring of forest biomass. An exponential fit (Figure 1, R2 = 0.9152) to the number of publications indicated an exponential upward trend in the number of publications from 1985 to 2023. In addition, in terms of the number of publications, there were two inflection points in the publication of forest biomass remote sensing monitoring studies; the first inflection point was in 2010, when the number of annual publications exceeded 30 for the first time. This may have been related to the Copernicus program. The second inflection point was in 2015, when the number of publications exceeded 100 for the first time. This may have been related to the convening of the United Nations Climate Change Conference in 2015. From 2015 to 2023, the average annual number of publications was 129.33, with an average annual growth rate of 4.75%. In addition, after 2021, the number of studies in the literature again had an increasing trend, which may have been related to the Chinese government’s dual-carbon target in 2021. In terms of the average number of citations per article, 1992 had the highest average number of citations per article (526), which may have been related to the fact that both articles published in that year received high citations (487 and 567 citations, respectively) [30,31].

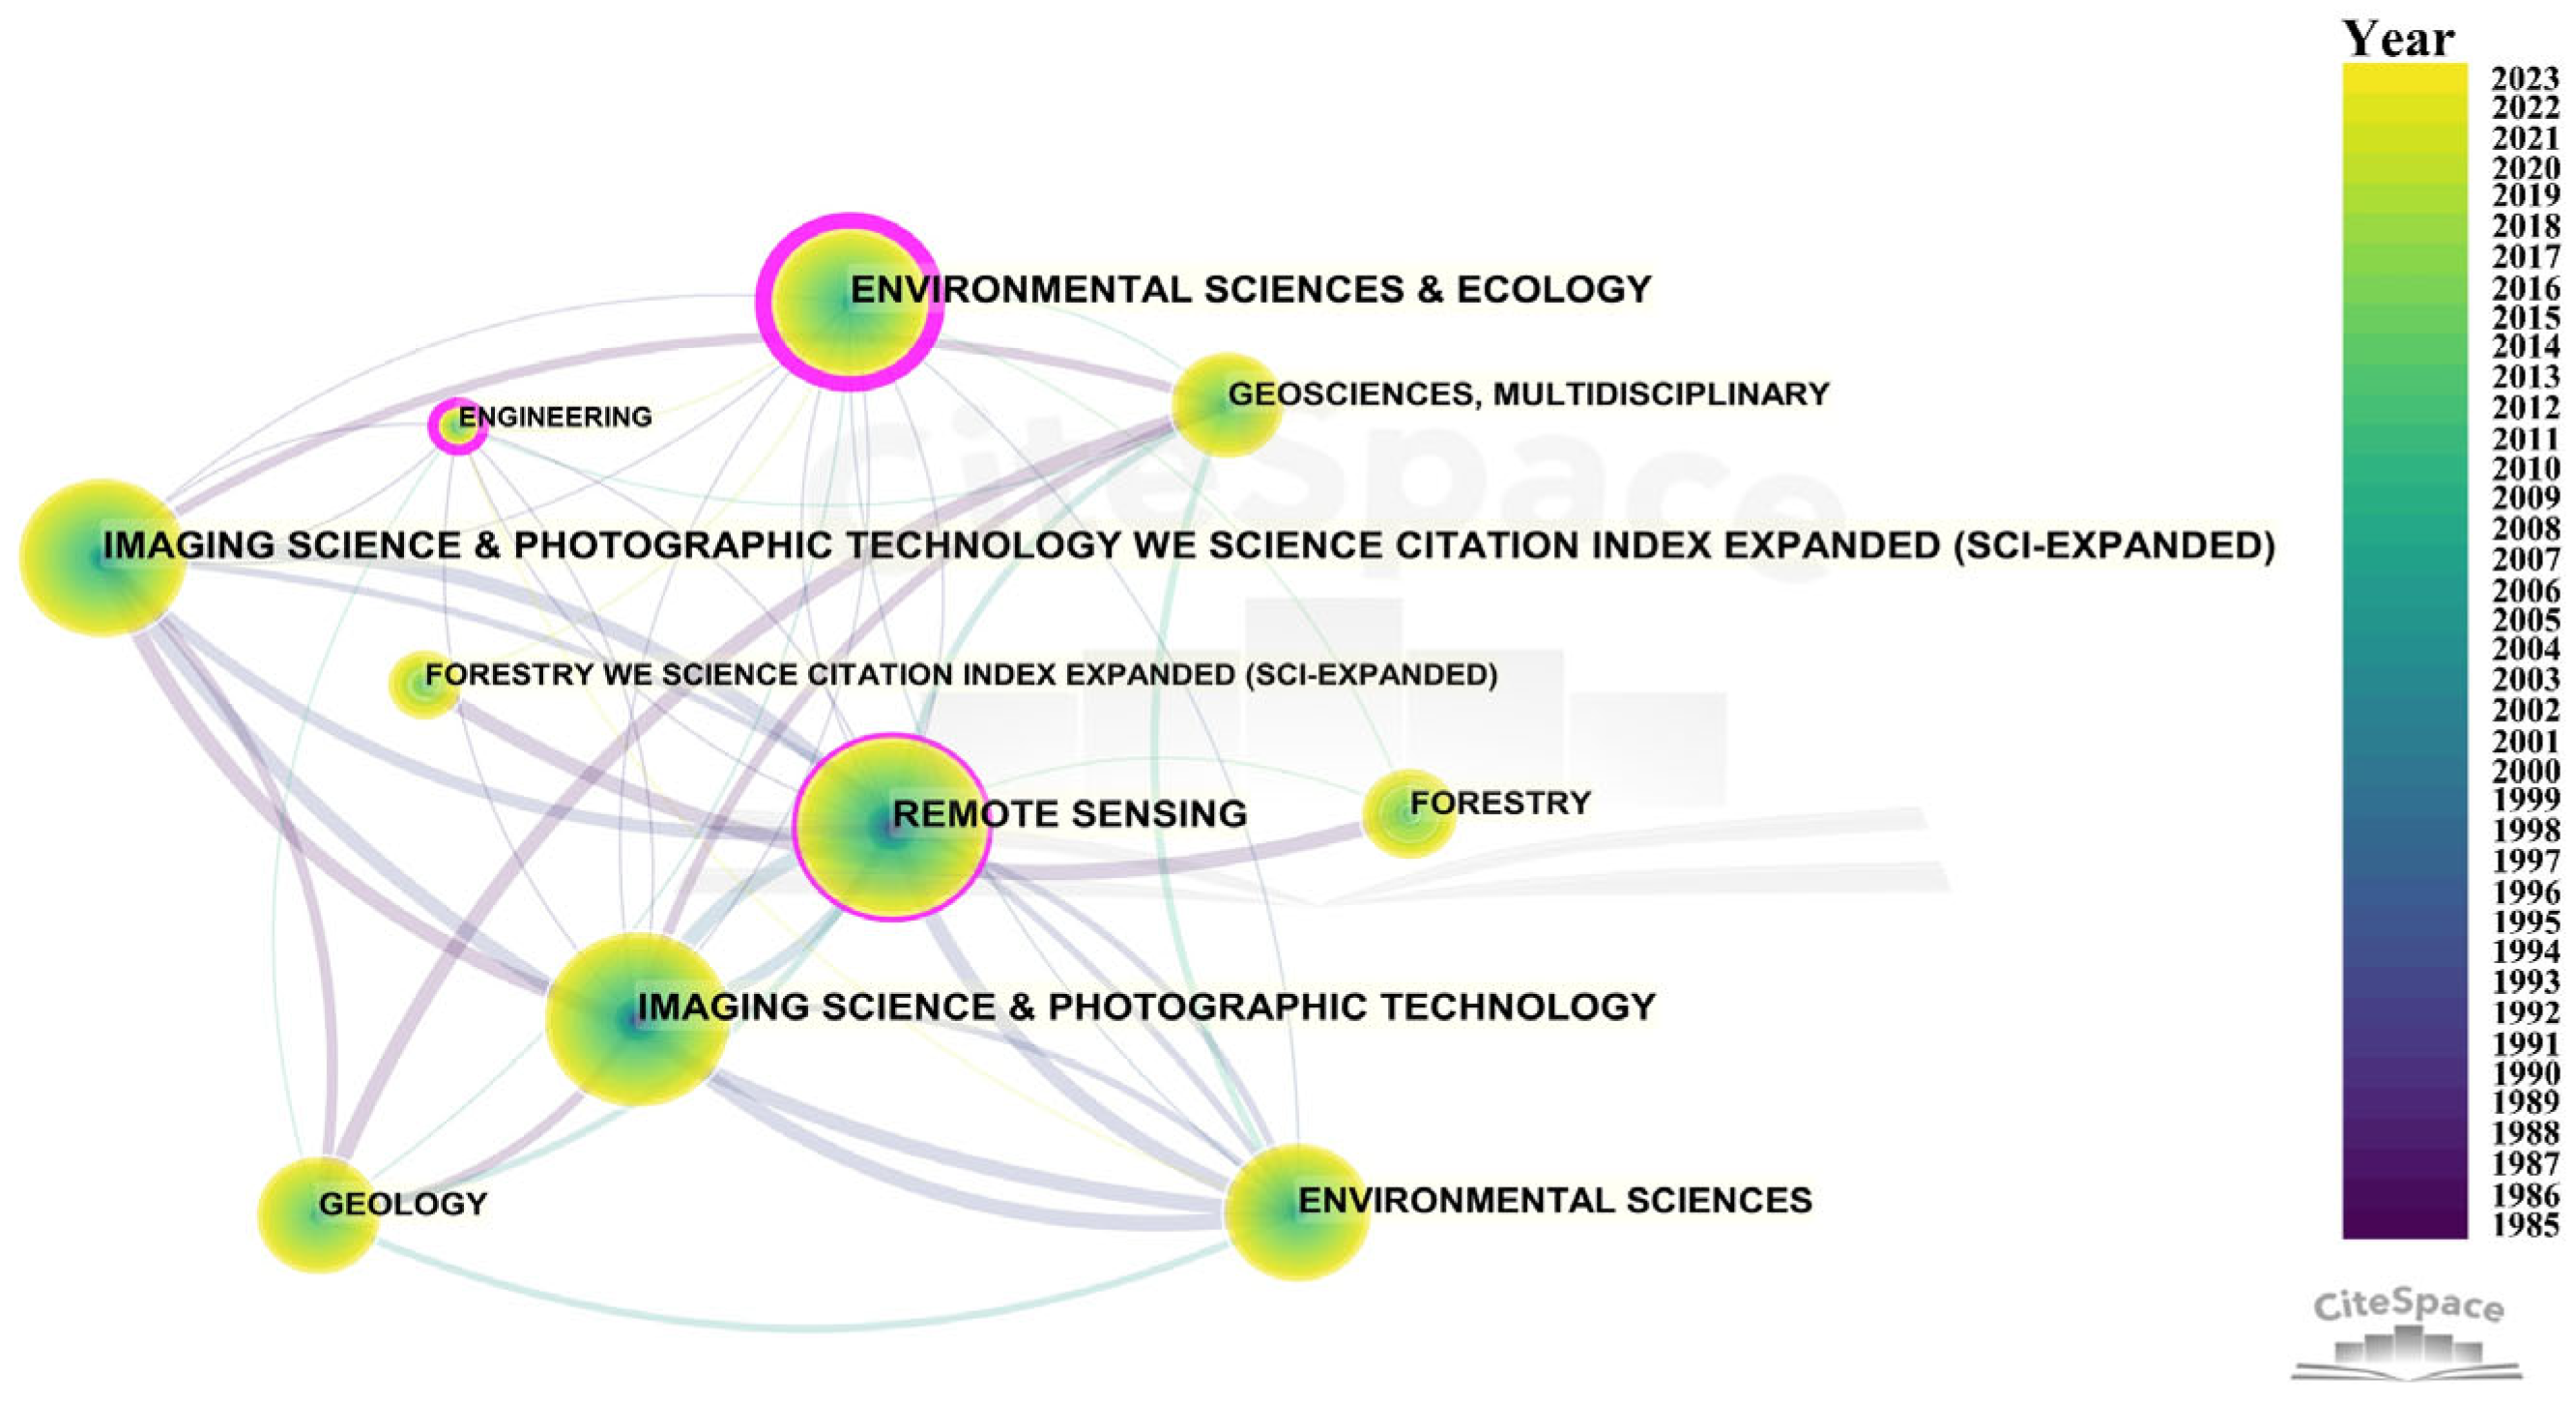
3.1.2. Subject Category Analysis

The analysis of the disciplinary categories of publications shows that the remote sensing monitoring of forest biomass is associated with 66 disciplines, indicating that this theme is a multidisciplinary research topic. In addition, the top 10 disciplinary categories in terms of number of publications are shown in Table 1, from which it can be seen that remote sensing (892 publications, 53.16%) is the most relevant discipline to the theme, followed by Imaging Science photographic technology (761 publications, 45.35%), and environmental sciences (705 publications, 42.01%).
Discipline correlation analysis can be used to explain the intrinsic connections between different disciplines. The covariance mapping of discipline categories generated based on Citespace is shown in Figure 2, which contains 42 nodes and 141 connections. Each node represents a discipline category. The amount of subject category publications is positively correlated with the node size, while the color of the rings and links corresponds to the year; the thicker the annual ring is, the more publications are published in that period of time, and the thickness of the connecting line between the nodes is positively correlated with the strength of the subject category co-occurrence [32]. The remote sensing monitoring of forest biomass involves multiple disciplines, as can be seen in Figure 2; remote sensing exists as a mediator connecting different disciplines, and the links include environmental sciences and ecology, imaging science photographic technology, environmental sciences, geosciences multidisciplinary, forestry, geology, and other disciplines. The above results indicate that the remote sensing monitoring of forest biomass requires the intersection of different fields and multiple disciplines.

3.2. Journal and Author Analysis

The 1678 publications related to the remote sensing monitoring of forest biomass analyzed in this paper were published in 261 journals. Table 2 shows the top 10 journals in terms of the number of publications. In general, the average number of citations per paper (TC/NP) of a journal is a relatively good indicator of a journal’s impact in that research area [28]. In addition, the journal impact factor (IF) and H Index are also important factors to with which to measure its value. As can be seen in Table 2, the journals Remote Sensing and Remote Sensing of Environment published more than 100 articles on the remote sensing monitoring of forest biomass. Remote Sensing of Environment has been a longtime leader in the field with the highest IF (14.2) and H Index (77). The top ten journals involve remote sensing, forestry, ecology, geochemistry geophysics, and other research fields, indicating the cross-disciplinary nature of the remote sensing monitoring of forest biomass. It can also be seen that the top ten journals cumulatively published 890 papers related to the topic, accounting for 53.04% of the total number of publications, and received 44,277 citations, accounting for 43.09% of the total number of citations. IEEE Transactions on Geoscience and Remote Sensing has the highest TC/TP (102.52), followed by Remote Sensing of Environment (86.97) and ISPRS Journal of Photogrammetry and Remote Sensing (81.91). From this, it can also be seen that on the subject of the remote sensing monitoring of forest biomass, MDPI (333) published the most articles, followed by ELSEVIER (286) and IEEE-INST (164), while SPIE (27) published the least.
The year-to-year variation in the top ten journals in terms of the number of forest biomass remotely sensed and monitored is shown in Figure 3. The journals Remote Sensing and Remote Sensing of Environment are highly favored by researchers; 247 and 194 articles were published, respectively. This is followed by the Forests and IEEE Transactions on Geoscience and Remote Sensing journals. In addition, most of the journals experienced rapid growth after 2012. MDPI (Remote Sensing and Forests) journals have shown exponential growth with a faster growth rate. The Remote Sensing of Environment journal showed exponential growth though to 2019, but the growth rate slowed down after 2019.
The H index is used to assess the number of citations of papers published by a particular researcher in a particular field and is an important indicator of the impact of papers published in a particular field. The top ten authors with the highest H index are Naesset E. (21), Gobakken T. (21), Saatchi S. (20), Herold M. (19), Nelson R. (19), Sun G. Q. (18), Phillips O. L. (15), Dubayah R. (15), Asner G. P. (15), Avitabile V. (15), and Wang C. (15) (Table 3). The top ten most influential authors were Nelson R., who was the first to start researching the field and also had the highest TC/TP for his article, Saatchi S., whose article had the highest total number of citations (1967), and Naesset E., whose article had the highest H index (21) and TP (34). The 1678 papers analyzed involved 6698 authors, with an average of 3.40 authors per paper and 0.29 contributions per author. According to the published papers in the last five years, Herold M. has been more active in recent years.

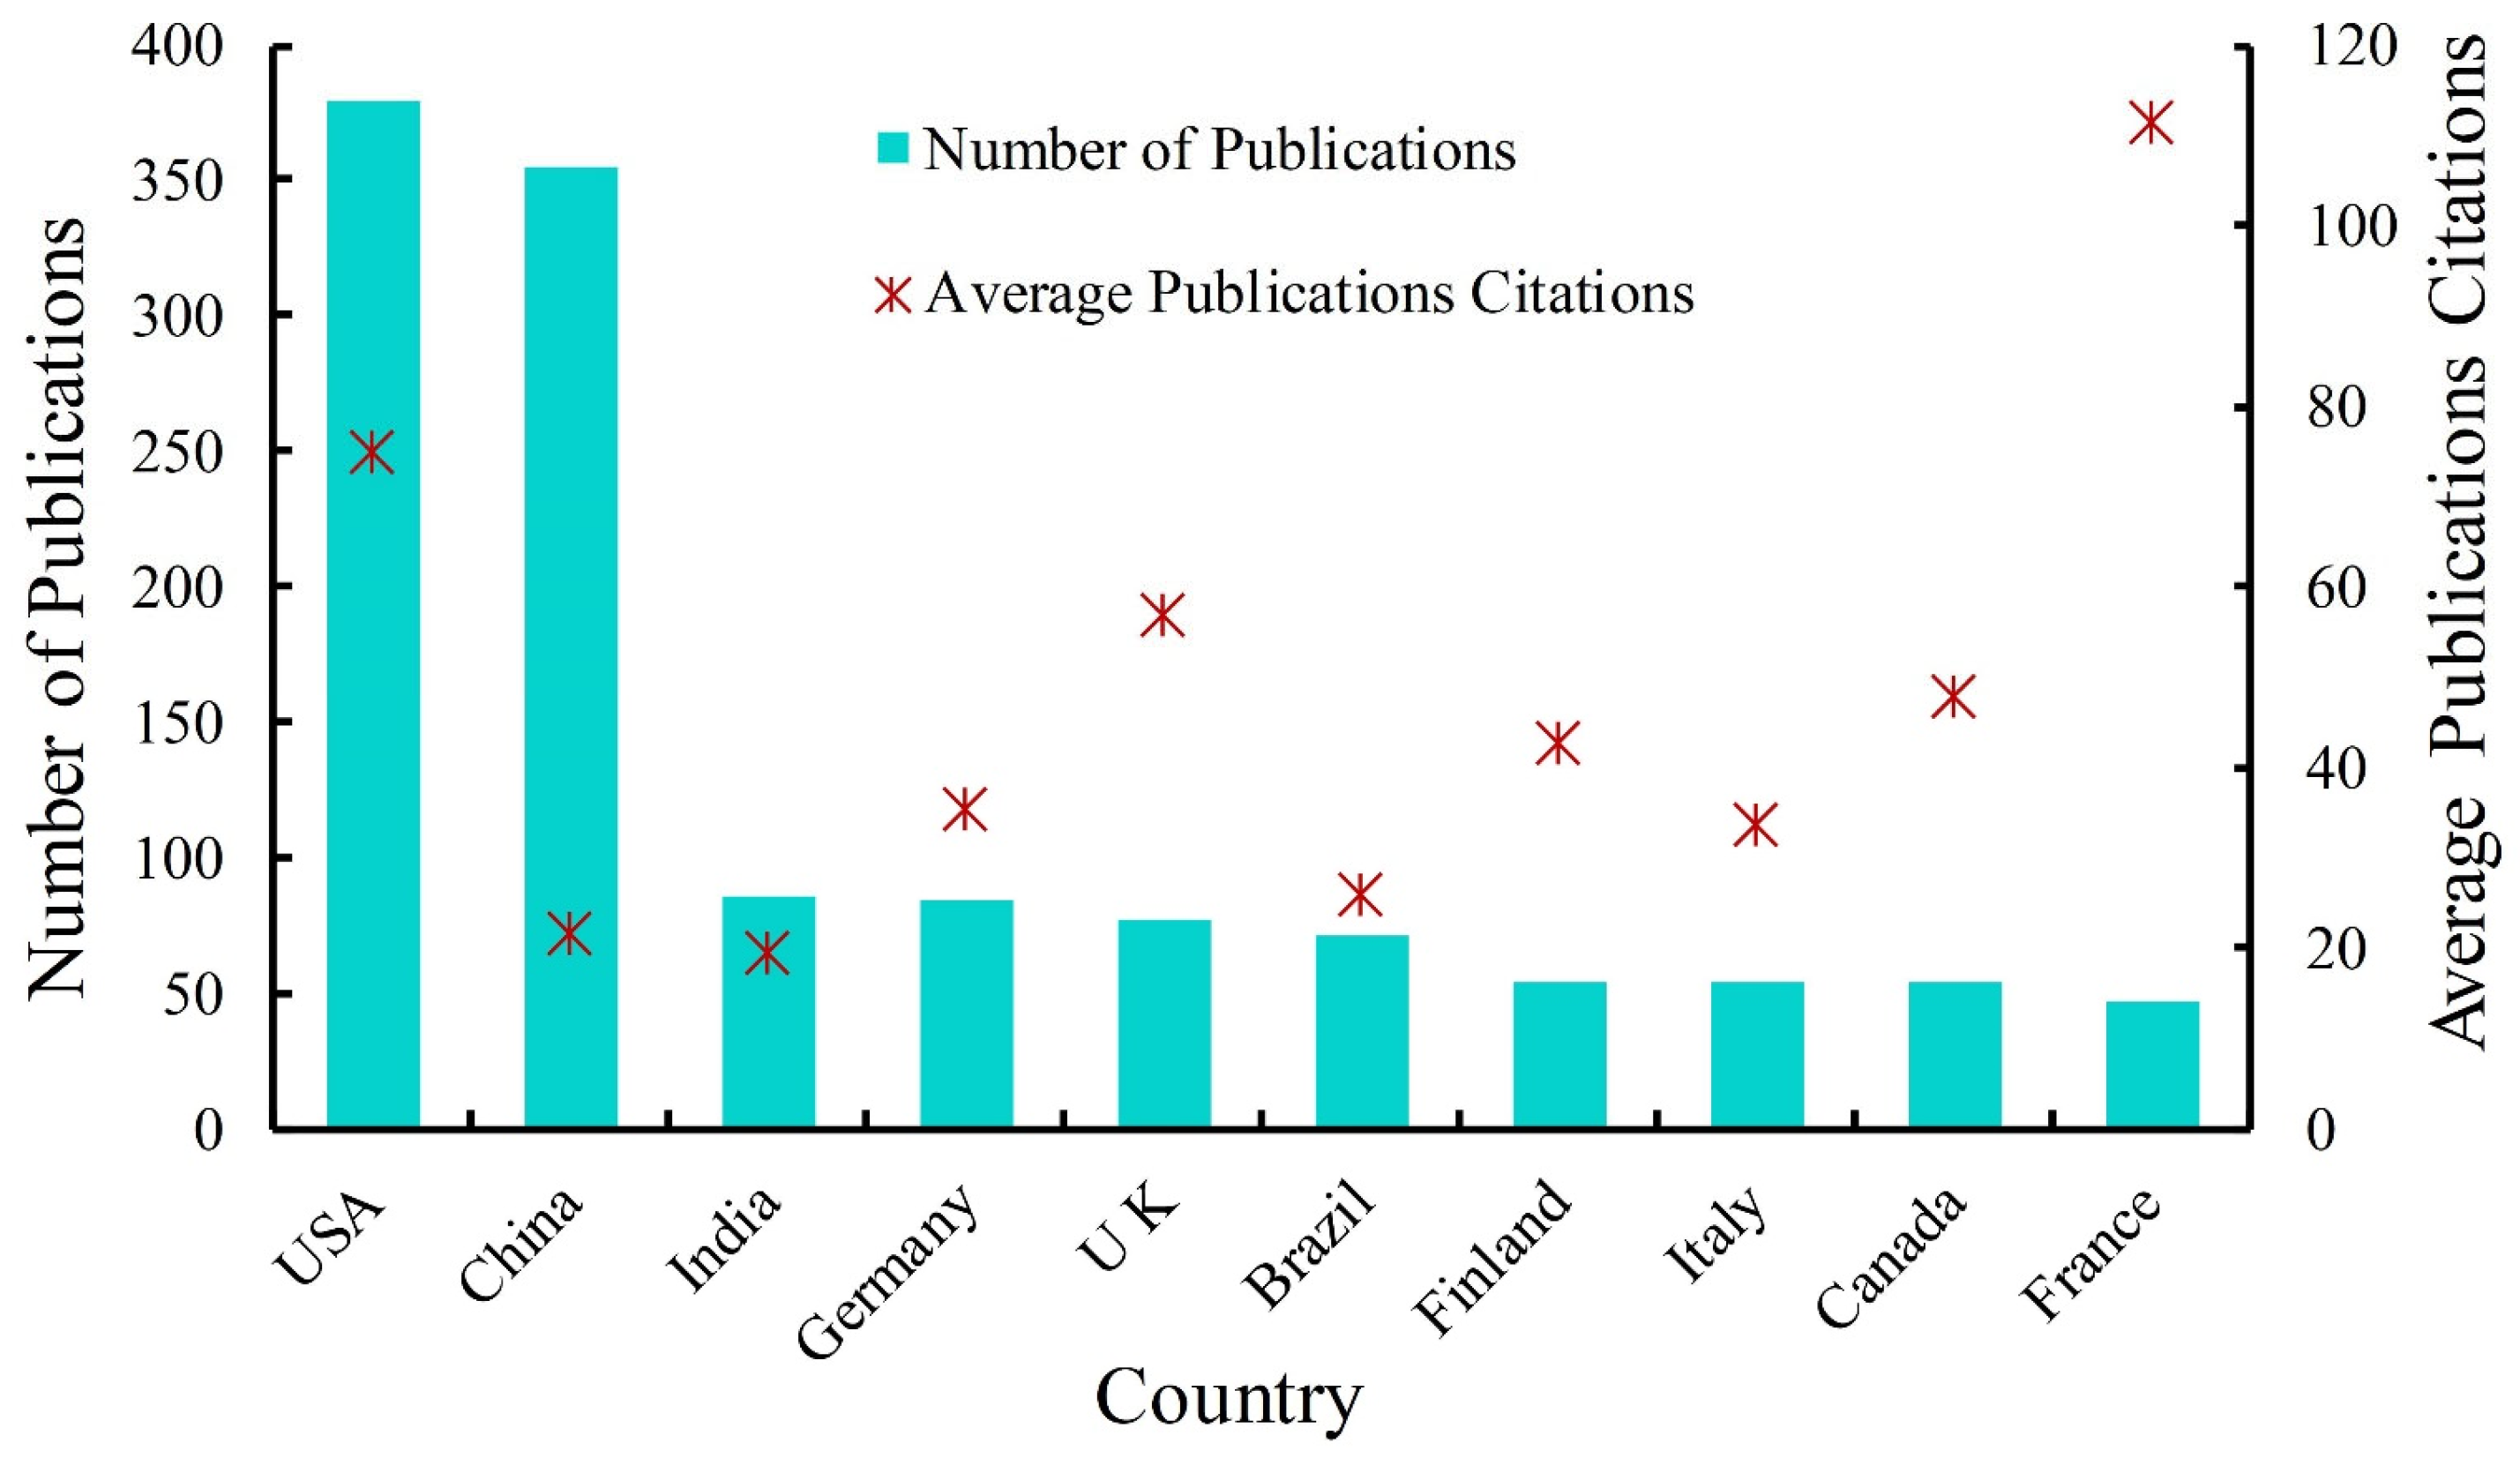
3.3. Country and Institution Analysis

The corresponding authors of the 1678 publications analyzed in this analysis were from 66 countries. Figure 4 shows the top 10 most influential countries. In order of the number of publications, USA (380), China (355), India (86), Germany (85), United Kingdom (77), Brazil (71), Finland (55), Italy (55), Canada (54), and France (48 articles) were the most influential. It is also possible to rank the top ten countries in terms of the average number of citations of their papers; the country with the highest average number of citations is France (111.4), which is the result of multiple highly cited articles [31,32,33]. This is followed by USA (74.8 citations) and United Kingdom (57.1 citations). China (21.7) and India (19.7) have a relatively low average number of citations.
The 10 most influential issuing organizations are listed in Table 4. Chinese Academy of Sciences ranked first with 139 articles issued, followed by the University of Maryland College Park (97 articles) and the United States Forest Service (88 articles). In total, 4 of the top 10 institutions (1st, 6th, 9th, and 10th) belong to China, and in terms of affiliation, the University of Chinese Academy of Sciences is part of the Chinese Academy of Sciences. Four institutions belong to the United States (the second, third, fourth, and fifth, respectively). The remaining two are located in Northern Europe. California Institute of Technology has the highest TC/TP (112.99), which may be related to the high number of citations received by four articles published by this institution [32,34,35,36], whereas National Aeronautics and Space Administration’s high TC/TP of 84.47 may be attributed to Saatchi’s publication in the journal Proceedings of The National Academy of Sciences of The United States of America [34].

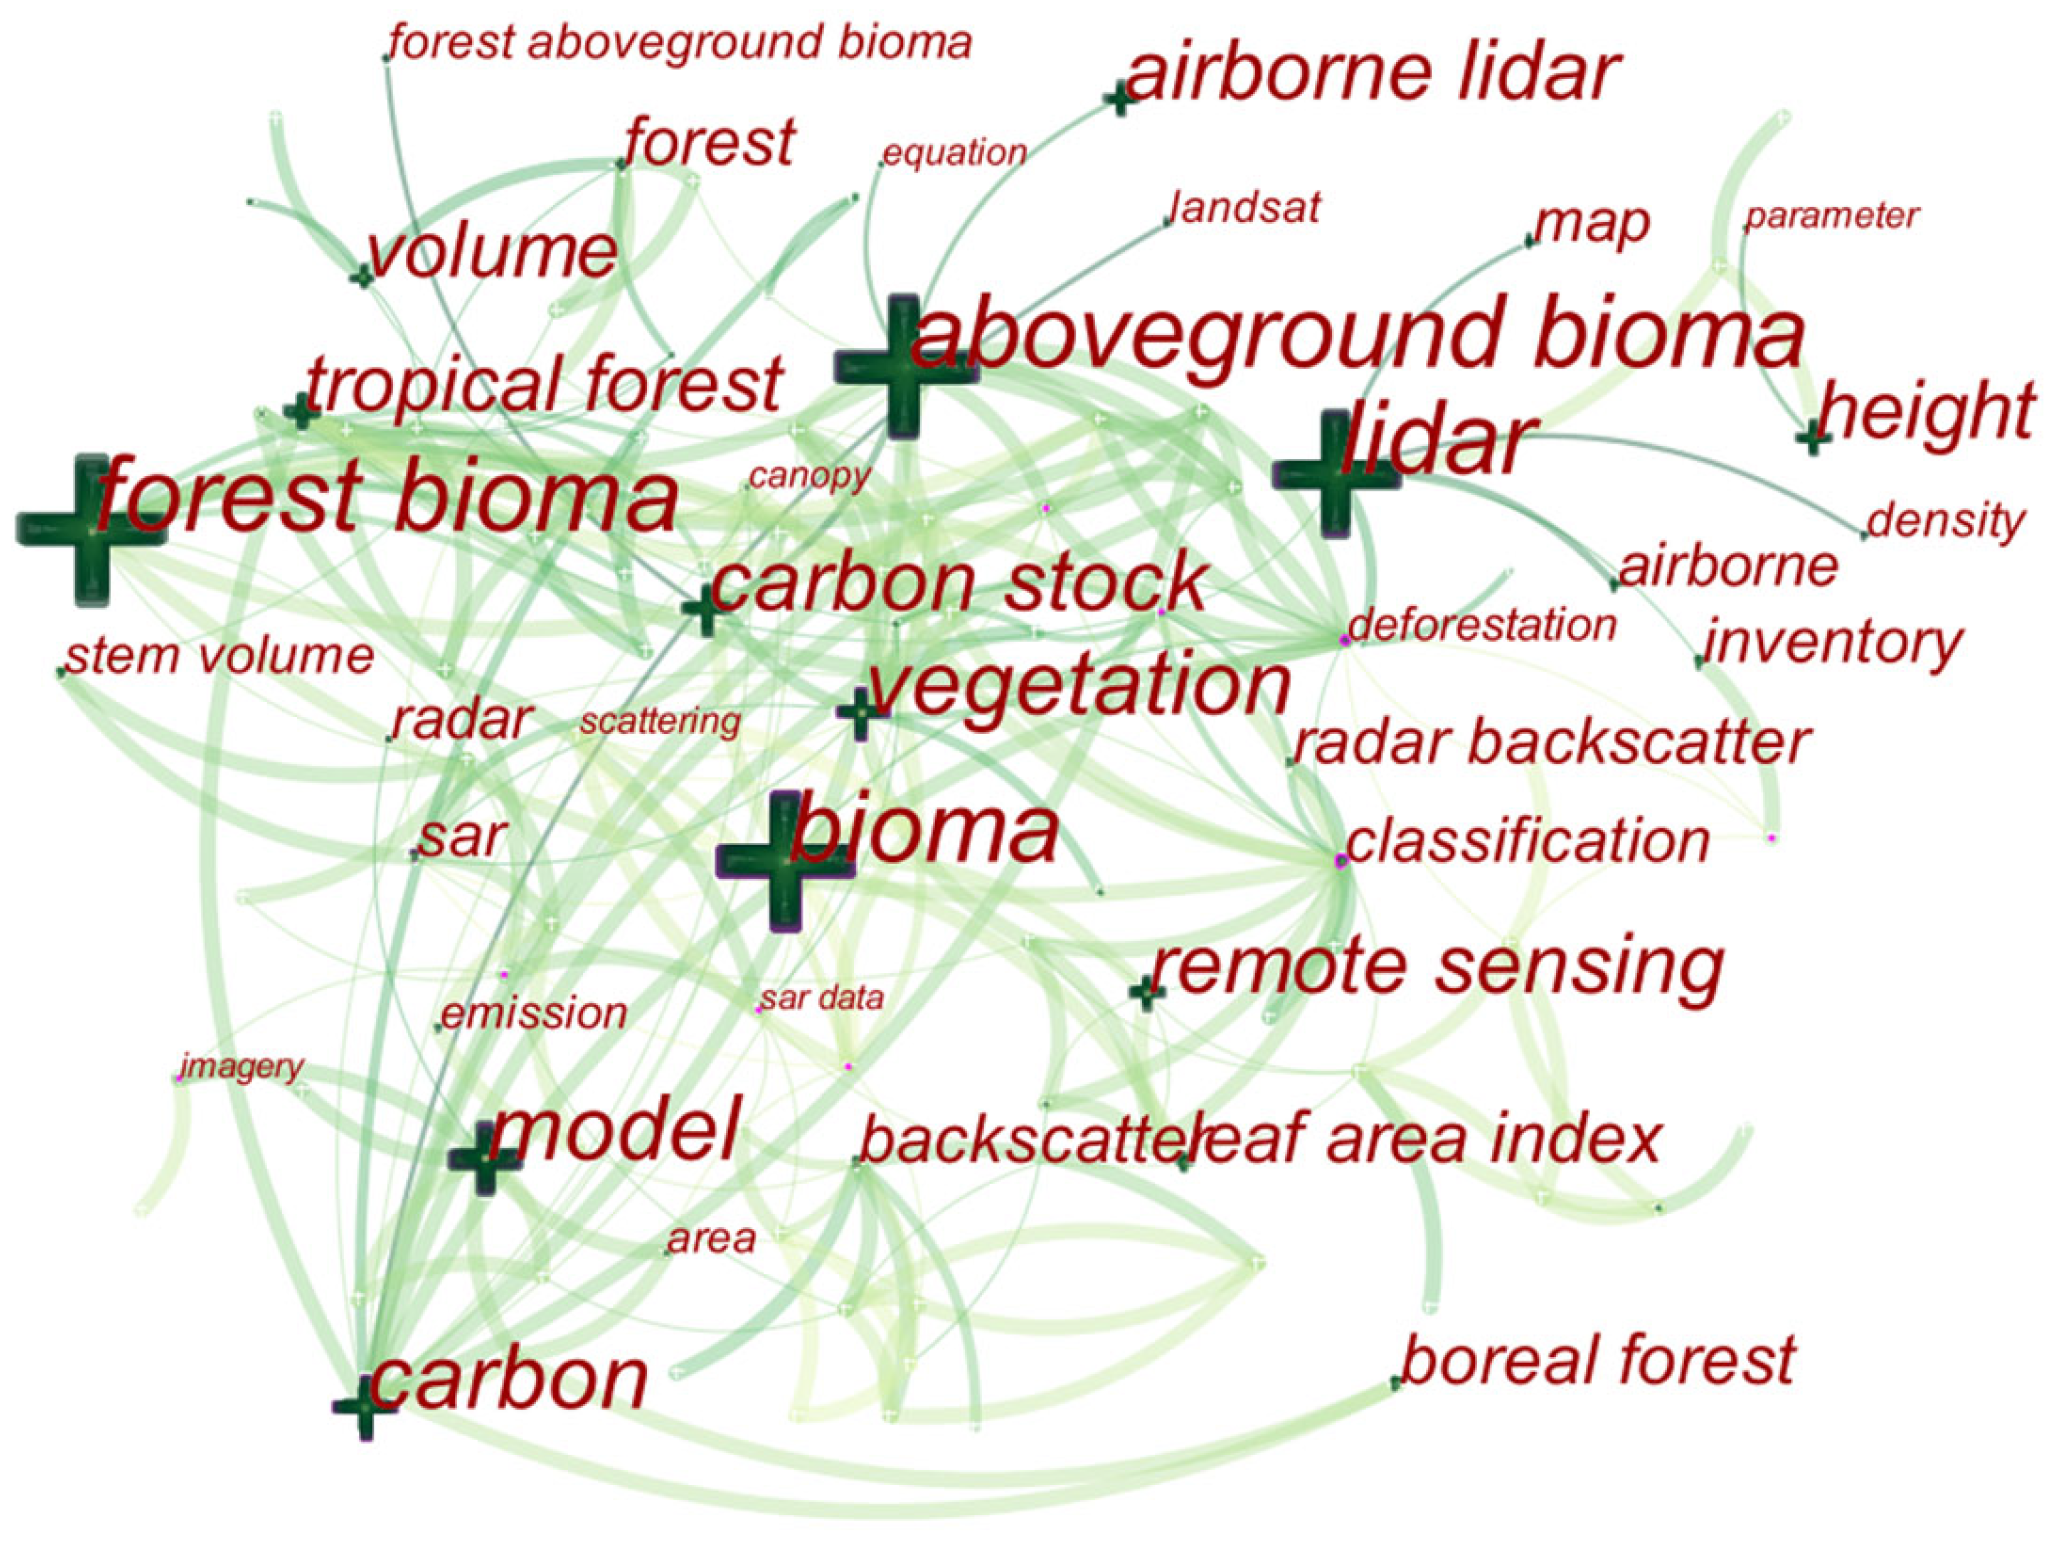
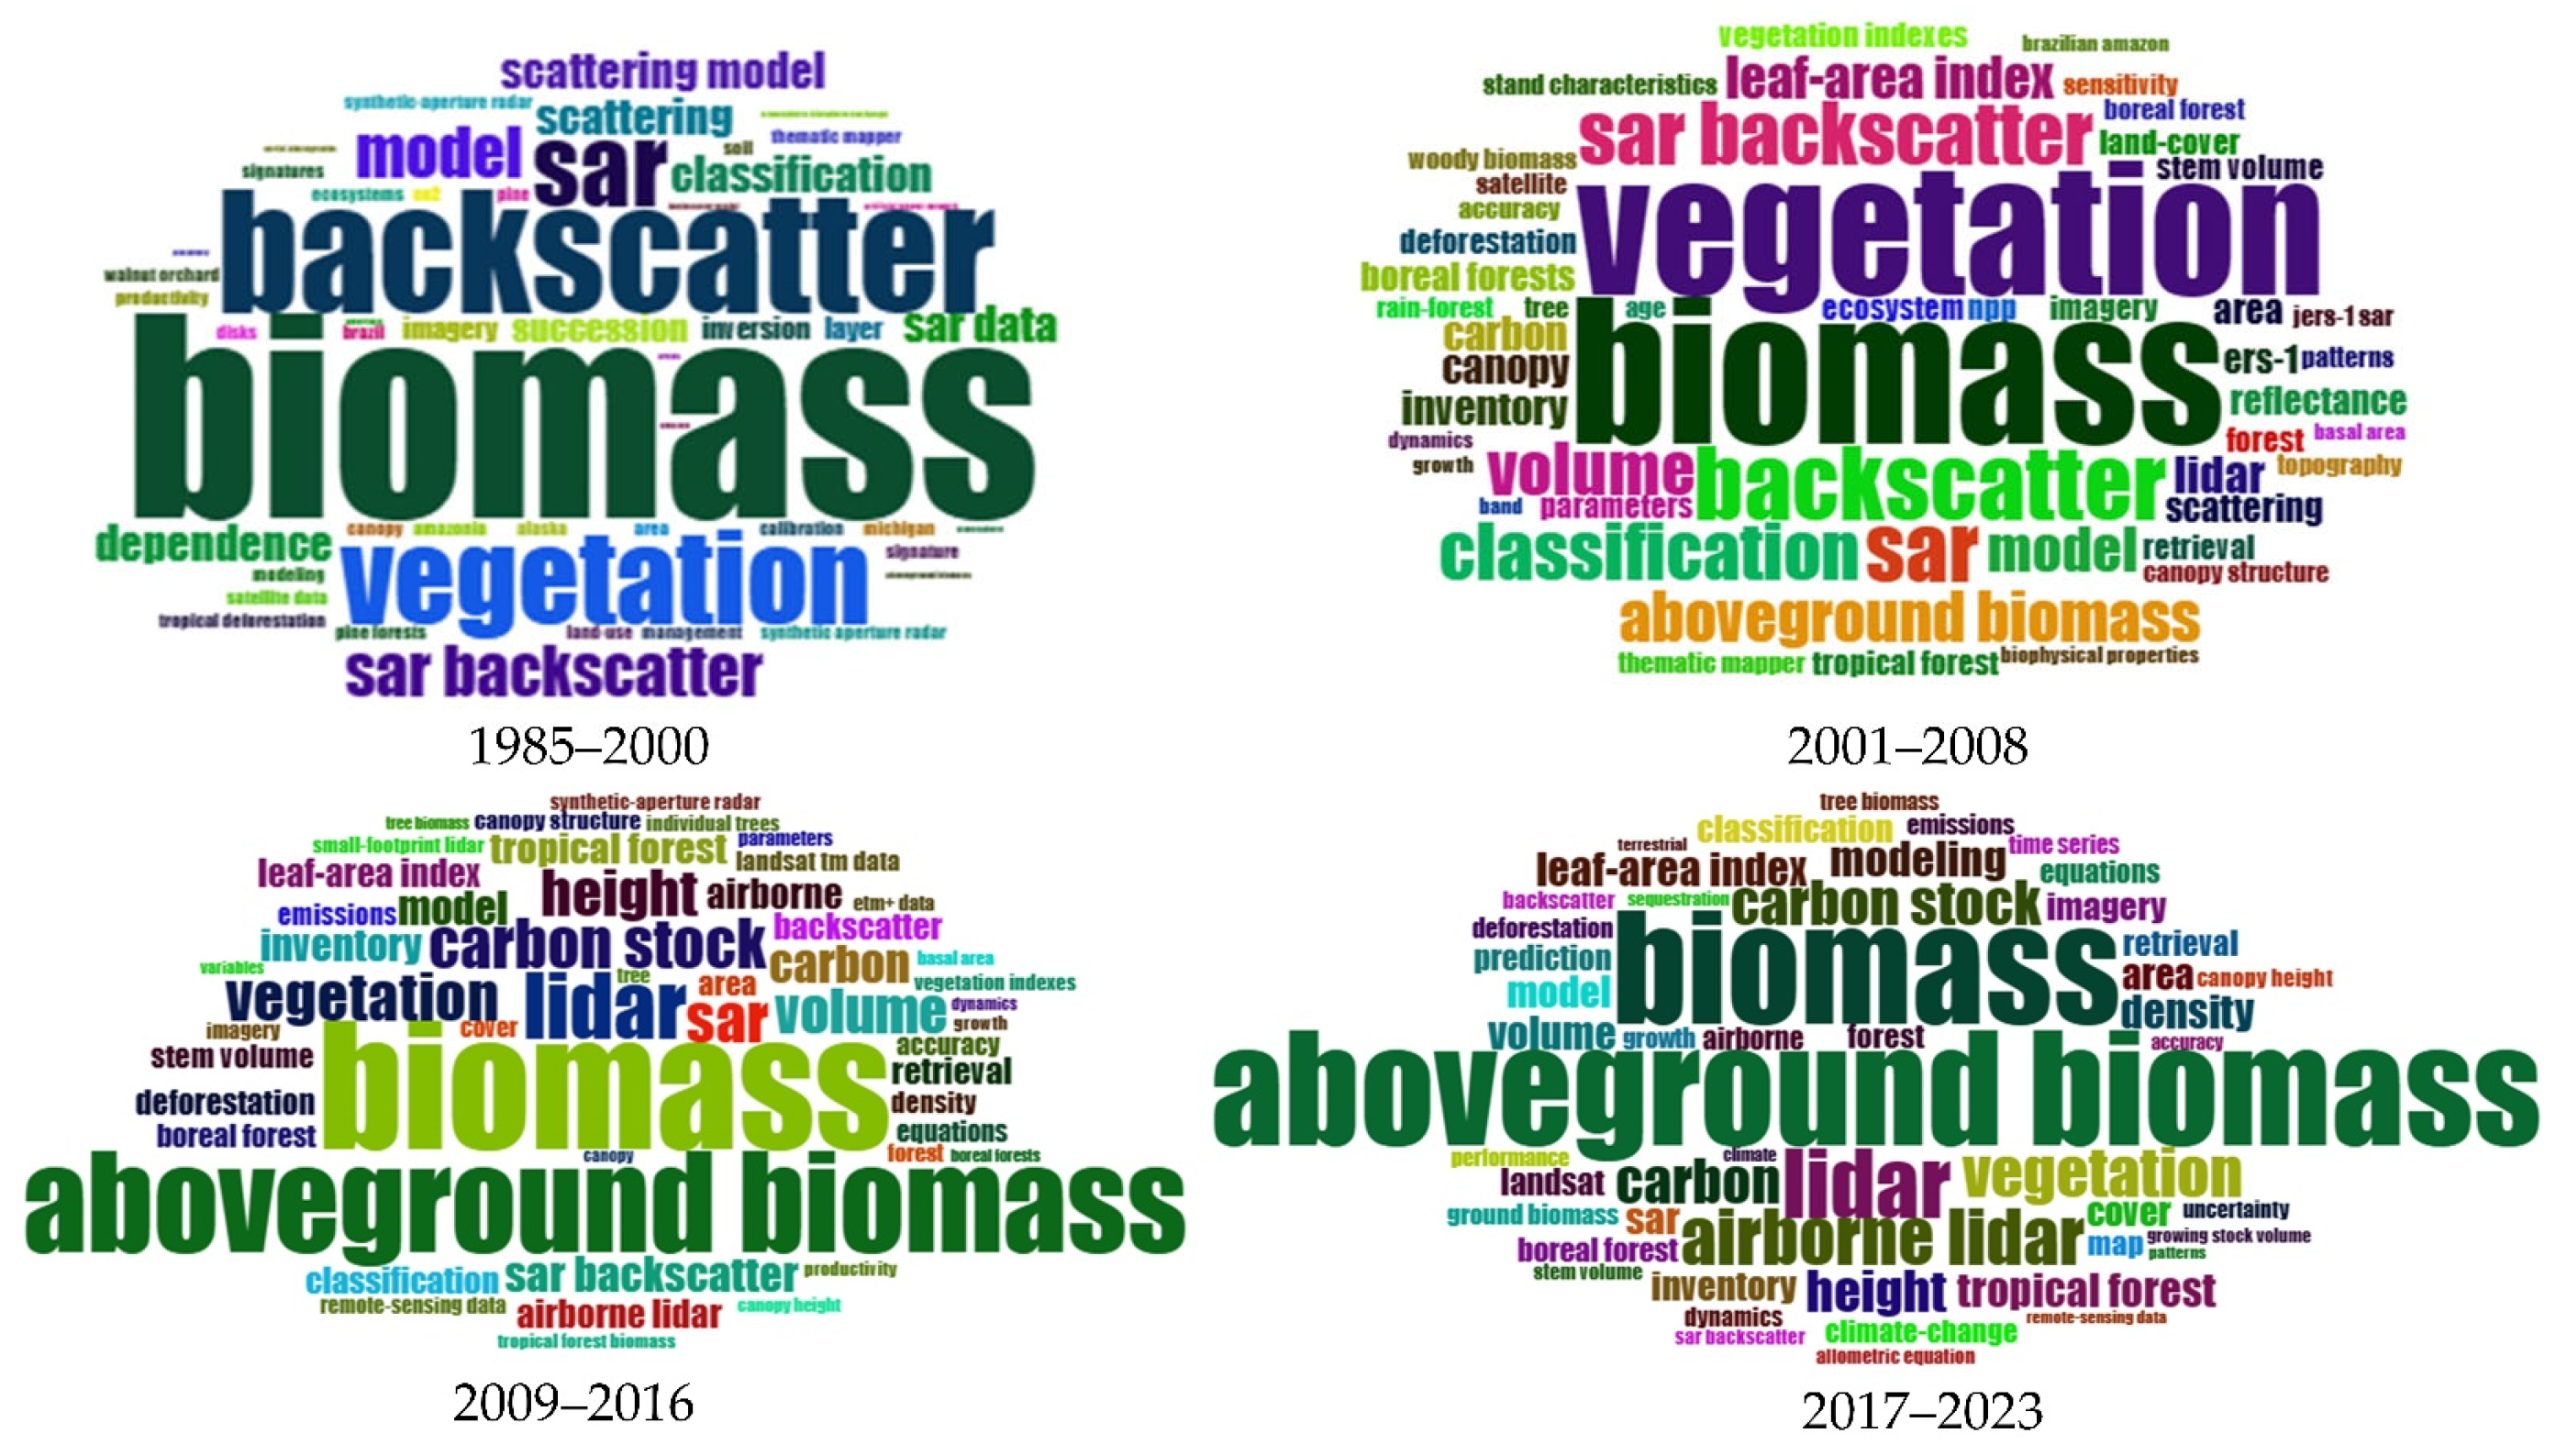
3.4. Keywords Analysis

Keywords can express the topic of the paper [37], reflect the research progress and predict the future development trend in this research area [38,39]. In addition, based on keywords it is also possible to identify emerging terms that have not yet received widespread attention, revealing emerging directions in remote sensing monitoring of forest biomass. In this study, we used Citespace 5.7.R 5 to analyze the co-occurrence of author’s keywords, and found that there were terms with the same meaning in the generated keyword maps (e.g., biomass maps and biomass mapping, allometric models and allometric model, etc.). Therefore, this study merged the keywords before keyword analysis.
Undoubtedly, forest biomass, as the keyword of this study, appeared the most times (419 times) and had the highest mediational centrality (Figure 5). forest biomass was closely related to aboveground biomass (402), LiDAR (391), biomass (391), and vegetation (330), model (183), carbon (180), etc. The above keywords all appeared a high number of times and became important nodes in the network.
In order to better explore the research themes presented by the keywords, this study was based on VOSviewer 1.6.20 software for keyword clustering analysis, and the keyword threshold in this study was set to 9 times to construct the co-occurrence network. Figure 6 depicts the author keyword co-occurrence graph. The size of the nodes in the graph indicates the frequency of occurrence of author keywords, and the width of the link lines represents the frequency of co-occurrence between different author keywords [40,41]. It can be seen that the co-occurrence classes out four clusters, each containing 12–32 author keywords.
The yellow cluster is related to optical remote sensing, including the keywords aboveground, Landsat, and leaf area index. Optical remote sensing is currently the most widely used data source for biomass estimation [42,43]. Optical remote sensing has an early start and long continuity, and it has been applied to biomass estimation research since as early as the 1980s [44]. With the continuous development of optical remote sensing sensors, more and more high-temporal- and -spatial-resolution sensors have been gradually used to estimate forest biomass [45], and the more widely used sensors at home and abroad include Landsat, Sentinel-2, Wordview, GF-2, etc. [46,47,48,49]. To use optical remote sensing data for biomass estimation, a statistical model between remote sensing features (e.g., vegetation index; texture features) and measured data is usually established first, and then the constructed biomass model is used for biomass inversion at the regional scale [18,50]. However, traditional regression models (e.g., linear, exponential, logarithmic, and polynomial) sometimes fail to accurately describe the complex nonlinear relationships between biomass and remote sensing features [51]. In recent years, with the not-so-considerable development of artificial intelligence algorithms (e.g., machine learning), machine learning algorithms, such as SVM and RF, have been widely used for forest biomass estimation [18].
The green cluster is related to SAR remote sensing, including the keywords biomass, forest, and radar. Unlike traditional optical remote sensing, SAR overcomes the limitations of weather effects (e.g., cloudy, foggy, etc.) and has the ability to obtain features such as forest canopy level shape and vertical structure, which has greater potential in forest biomass inversion [52]. Numerous scholars have linked different bands (the I-band, P-band, etc.), polarization modes, and radar backscattering intensities of SAR with forest biomass to study the relationship between it and biomass [53], and a study showed that the radar backscattering coefficient and forest biomass were positively correlated. In addition, the sensitivity of backscattering coefficients of different bands to forest biomass was different, while the L-band and P-band had high robustness with forest structural parameters (tree age, tree height, biomass, etc.) in previous studies, and were often used for tree height and biomass inversion [54,55].
The blue cluster is related to LiDAR remote sensing, including the keywords LiDAR, airborne LiDAR, and height. LiDAR technology is able to obtain three-dimensional structural information of forest trees, realizing the leap from the two-dimensional to three-dimensional study of forest trees [13], and it is one of the most effective and accurate techniques for estimating forest biomass [56,57]; LiDAR data overcome the saturation of vegetation indices and SAR in inverted biomass in high-density forest areas [58]. Based on LiDAR data, forest biomass is usually inverted using either direct or indirect methods; the direct method is to establish a regression model with forest biomass by using the characteristic factors such as density, intensity, and height extracted from the point cloud data, and the indirect method is to firstly obtain the structural parameters of the forest, and then to establish the relationship between the forest parameters and the forest biomass [59]. Although the structural parameters acquired using ground-based LiDAR combined with anisotropic growth equations or structural quantitative modeling combined with single-tree density can obtain single-tree or sample-plot scale biomass with high accuracy, the data acquisition range is limited and cannot satisfy regional-scale biomass monitoring [60]. With the development of UAVs, UAV-mounted LiDAR can acquire large-scale forest structural information, but due to the limited density of the point cloud, it is not possible to acquire the structural parameters of the breast diameter, which is closely related to biomass. Therefore, the single-tree biomass from ground-based LiDAR inversion is usually used as the true value to obtain forest biomass by modeling with the characteristic factors (tree height, crown spread, height percentile, etc.) extracted from UAV LiDAR data [61]. However, UAVs are limited by flight time and magnetic field, and the range of data acquisition is still limited and is often used for typical forest or specific tree species studies [62].
The red clusters in our analysis are closely associated with carbon stocks, prominently featuring keywords like ‘carbon’, ‘carbon stock’, and ‘remote sensing’. Forests, as the cornerstone of terrestrial ecosystems, play a pivotal role in maintaining the terrestrial carbon cycle and stabilizing global climate conditions. Significantly, forest carbon stock is not only a crucial indicator of forest ecosystem structure and function but also forms the foundation for studying carbon sinks and their potential. This can be inferred from forest biomass using the carbon content coefficient [63,64]. Typically, research on forest carbon stock primarily focuses on typical forest areas, with forest type data usually derived from land use remote sensing interpretation. Previous studies have identified tree age as a key determinant of forest structure and function, influencing biomass accumulation [65], net primary productivity [66], and other aspects. However, predicting tree age is fraught with uncertainties and does not increase uniformly over time. Furthermore, environmental factors like climate, soil, and stand conditions also impact forest growth and variations in carbon density [65]. In a related development, the Chinese government’s 2020 strategic decision to aim for a carbon peak by 2030 and carbon neutrality by 2060 has spurred increasing interest among Chinese scholars in monitoring forest carbon stock changes [67,68,69].
Keyword bursts, as indicated in Table 5, provide insights into the areas garnering greater interest over specific periods [70]. The red lines in the table represent cycles of keyword bursts [71]. It is evident that in the past six years, keywords such as ‘Carbon’, ‘Map’, ‘Model’, and ‘Airborne LiDAR’ have been particularly active. The Paris Agreement in 2016, with its commitment to carbon neutrality, has catalyzed research in carbon sequestration. Concurrently, advancements in UAVs and the miniaturization of LiDAR equipment have made UAV Airborne LiDAR a leading data source for forest biomass monitoring. Mostly, remotely sensed data are employed to construct inverse forest biomass models, each with its own limitations, making the pursuit of an optimal model a hot research area. Additionally, forest biomass mapping analysis, aimed at assessing biomass status on global or regional scales, has emerged as another significant research focus in recent years.
Figure 7 illustrates the evolution of authors’ keywords in the field of forest biomass monitoring, where the size of the keywords corresponds to their frequency of occurrence [28]. The analysis reveals distinct phases in the technological and thematic focus over the years.
Before 2000, the predominant keywords were ‘biomass’, ‘SAR’, and ‘backscatter’, indicating an initial focus on forest biomass monitoring using SAR technology. The period 2001–2008 marked the gradual introduction of LiDAR technology in forest biomass monitoring. The emphasis began to shift towards aboveground biomass monitoring, reflecting the emerging role of LiDAR as a novel tool. In 2009–2016, LiDAR technology increasingly replaced SAR as the primary method for forest biomass monitoring. This era also saw rapid advancements in extracting forest structural parameters (like tree height and volume) and a nascent interest in carbon stock monitoring. In 2017–2023, LiDAR continued to dominate the technological landscape for forest biomass monitoring. Meanwhile, optical remote sensing (e.g., Landsat, Sentinel-2) witnessed extensive application. Research focusing on typical forests surged, and the use of UAV LiDAR for biomass monitoring began to rise. Concurrently, in response to global warming and to track forest carbon sequestration capacity, there was a growing focus on ‘carbon’, ‘carbon stock’, and ‘density’.

4. Conclusions

This paper employs a bibliometric methodology to analyze research in the field of the remote sensing monitoring of forest biomass, utilizing the Web of Science core dataset as its primary data source. Our analysis reveals that the number of publications has experienced an exponential upward trend from 1985 to 2023, with an impressive average annual growth rate of 4.75%. Significantly, the top ten journals have contributed to 53.04% of the total publications and 43.09% of the total citations in this field. In terms of disciplinary impact, Remote Sensing, Imaging Science and Photographic Technology, and Environmental Sciences emerge as the three most influential disciplines in this research area. Notably, the journal Remote Sensing of Environment has consistently led the field, boasting the highest IF and H-index. Furthermore, IEEE Transactions on Geoscience and Remote Sensing stands out as the journal with the highest average number of citations. Among individual contributors, Saatchi S. is distinguished as the author with the highest total number of citations for their articles.
Based on the keyword clustering analysis, the principal research topics in forest biomass remote sensing monitoring can be categorized into four key areas: optical remote sensing, LiDAR remote sensing, SAR remote sensing, and carbon stock analysis. Notably, the keyword explosion over the past six years indicates an increasing focus among researchers on carbon, airborne LiDAR data, along with efforts in biomass mapping and the construction of optimal biomass models. Furthermore, there is a discernible shift in the methodology of forest biomass monitoring, evolving from single-datum biomass estimation to a synergistic approach utilizing multiple data sources.
However, this study is not without its limitations. First, our analysis relied solely on the Web of Science core dataset for literature collection, excluding other potential datasets. Additionally, while research hotspots and topic evolution were identified, a detailed analysis of each hotspot was not conducted. Lastly, in the keyword burst analysis, both CiteSpace 5.7.R 5 and Bibliometrix 4.1.4 software were employed, yet neither tool can analyze author keywords. This limitation may have affected the comprehensiveness of the final generated keywords.

Author Contributions

Y.S.: conceptualization, data curation, formal analysis, writing—original draft, and writing—review and editing; Z.W.: conceptualization, writing—original draft, and writing—review and editing; G.Z., X.W. and W.M.: supervision; H.Y.: formal analysis. All authors have read and agreed to the published version of the manuscript.

Funding

This research was funded by the Joint Funds of the National Natural Science Foundation of China (grant no. U2243212), and Science Foundation for Young Elite Talents of YRCC (grant no. HQK-202307).

Data Availability Statement

Not applicable.

Conflicts of Interest

The authors declare no conflicts of interest.

References

  1. Song, C. Optical remote sensing of forest leaf area index and biomass. Prog. Phys. Geogr. Earth Environ. 2013, 37, 98–113. [Google Scholar] [CrossRef]
  2. Xiao, J.; Chevallier, F.; Gomez, C.; Guanter, L.; Hicke, J.A.; Huete, A.R.; Ichii, K.; Ni, W.; Pang, Y.; Rahman, A.F.; et al. Remote sensing of the terrestrial carbon cycle: A review of advances over 50 years. Remote Sens. Environ. 2019, 233, 111383. [Google Scholar] [CrossRef]
  3. Dixon, R.K.; Brown, S.; Houghton, R.A.; Solomon, A.M.; Trexler, M.C.; Wisniewski, J. Carbon Pools and Flux of Global Forest Ecosystems. Science 1994, 263, 185–190. [Google Scholar] [CrossRef]
  4. Zhu, X.; Liu, D. Improving forest aboveground biomass estimation using seasonal Landsat NDVI time-series. ISPRS J. Photogramm. Remote Sens. 2015, 102, 222–231. [Google Scholar] [CrossRef]
  5. Kumar, L.; Mutanga, O. Remote sensing of above-ground biomass. Remote Sens. 2017, 9, 935. [Google Scholar] [CrossRef]
  6. Piao, S.; He, Y.; Wang, X.; Chen, F. Estimation of China’s terrestrial ecosystem carbon sink: Methods, progress and prospects. Sci. China Earth Sci. 2022, 65, 641–651. [Google Scholar] [CrossRef]
  7. Sun, Z.; Qian, W.; Huang, Q.; Lv, H.; Yu, D.; Ou, Q.; Lu, H.; Tang, X. Use Remote Sensing and Machine Learning to Study the Changes of Broad-Leaved Forest Biomass and Their Climate Driving Forces in Nature Reserves of Northern Subtropics. Remote Sens. 2022, 14, 1066. [Google Scholar] [CrossRef]
  8. Mohd Zaki, N.A.; Latif, A.Z. Carbon sinks and tropical forest biomass estimation: A review on role of remote sensing in aboveground-biomass modelling. Geocarto Int. 2016, 32, 701–716. [Google Scholar] [CrossRef]
  9. Sinha, S.; Jeganathan, C.; Sharma, L.K.; Nathawat, M.S. A review of radar remote sensing for biomass estimation. Int. J. Environ. Sci. Technol. 2015, 12, 1779–1792. [Google Scholar] [CrossRef]
  10. Yang, Q.; Niu, C.; Liu, X.; Feng, Y.; Ma, Q.; Wang, X.; Tang, H.; Guo, Q. Mapping high-resolution forest aboveground biomass of China using multisource remote sensing data. GISci. Remote Sens. 2023, 60, 2203303. [Google Scholar] [CrossRef]
  11. Liu, X.; Yang, L.; Liu, Q. Review of forest above ground biomass inversion methods based on remote sensing technology. J. Remote Sens. 2015, 19, 62–74. [Google Scholar]
  12. Zeng, P.; Shi, J.; Huang, J.; Zhang, Y.; Zhang, W. Component forest above ground biomass estimation using LiDAR and SAR data. In Proceedings of the IGARSS 2022–2022 IEEE International Geoscience and Remote Sensing Symposium, Kuala Lumpur, Malaysia, 17–22 July 2022; pp. 6395–6398. [Google Scholar]
  13. Guo, Q.; Su, Y.; Hu, T.; Guan, H.; Jin, S.; Zhang, J.; Zhao, X.; Xu, K.; Wei, D.; Kelly, M.; et al. Lidar boosts 3D ecological observations and modelings: A review and perspective. IEEE Geosci. Remote Sens. Mag. 2020, 9, 232–257. [Google Scholar] [CrossRef]
  14. Mario, J.; Loureiro, P.; Sachsida, A. The Dynamics of Land-use in Brazilian Amazon. Ecol. Econ. 2012, 84, 23–36. [Google Scholar]
  15. Hertel, D.; Moser, G.; Culmsee, H.; Erasmi, S.; Horna, V.; Schuldt, B.; Leuschner, C. Below- and above-ground biomass and net primary production in a paleotropical natural forest (Sulawesi, Indonesia) as compared to neotropical forests. For. Ecol. Manag. 2009, 258, 1904–1912. [Google Scholar] [CrossRef]
  16. Wang, L.; Zhou, X.; Zhu, X.; Dong, Z.; Guo, W. Estimation of Biomass in Wheat Using Random Forest Regression Algorithm and Remote Sensing Data. Crop J. 2016, 4, 212–219. [Google Scholar] [CrossRef]
  17. Huang, H.; Liu, C.; Wang, X.; Zhou, X.; Gong, P. Integration of Multi-Resource Remotely Sensed Data and Allometric Models for Forest Aboveground Biomass Estimation in China. Remote Sens. Environ. 2019, 221, 225–234. [Google Scholar] [CrossRef]
  18. Yan, X.G.; Li, J.; Smith, A.R.; Yang, D.; Ma, T.Y.; Su, Y.T.; Shao, J.H. Evaluation of machine learning methods and multi-source remote sensing data combinations to construct forest above-ground biomass models. Int. J. Digit. Earth 2023, 16, 4471–4491. [Google Scholar] [CrossRef]
  19. Donthu, N.; Kumar, S.; Mukherjee, D.; Pandey, N.; Lim, W.M. How to conduct a bibliometric analysis: An overview and guidelines. J. Bus. Res. 2021, 133, 285–296. [Google Scholar] [CrossRef]
  20. Wang, B.; Zhang, Q.; Cui, F. Scientific research on ecosystem services and human well-being: A bibliometric analysis. Ecol. Indic. 2021, 125, 107449. [Google Scholar] [CrossRef]
  21. Chen, C. CiteSpace II: Detecting and visualizing emerging trends and transient patterns in scientific literature. J. Am. Soc. Inf. Sci. Technol. 2006, 57, 359–377. [Google Scholar] [CrossRef]
  22. Dervis, H. Bibliometric analysis using Bibliometrix an R Package. J. Scientom. Res. 2019, 8, 156–160. [Google Scholar] [CrossRef]
  23. van Eck, N.; Waltman, L. Software survey: VOSviewer, a computer program for bibliometric mapping. Scientometrics 2010, 84, 523–538. [Google Scholar] [CrossRef]
  24. Aria, M.; Cuccurullo, C. bibliometrix: An R-tool for comprehensive science mapping analysis. J. Informetr. 2017, 11, 959–975. [Google Scholar] [CrossRef]
  25. Moral-Munoz, J.A.; Herrera-Viedma, E.; Santisteban-Espejo, A.; Cobo, M.J. Software tools for conducting bibliometric analysis in science: An up-to-date review. Prof. Inf. 2020, 29, e290103. [Google Scholar] [CrossRef]
  26. van Eck, N.J.; Waltman, L. Citation-based clustering of publications using CitNetExplorer and VOSviewer. Scientometrics 2017, 111, 1053–1070. [Google Scholar] [CrossRef] [PubMed]
  27. Pan, X.; Yan, E.; Cui, M.; Hua, W. Examining the usage, citation, and diffusion patterns of bibliometric mapping software: A comparative study of three tools. J. Informetr. 2018, 12, 481–493. [Google Scholar] [CrossRef]
  28. Huang, L.; Zhou, M.; Lv, J.; Chen, K. Trends in global research in forest carbon sequestration: A bibliometric analysis. J. Clean. Prod. 2020, 252, 1199008. [Google Scholar] [CrossRef]
  29. Schreier, H.; Lougheed, J.; Gibson, J.; Russell, J. Calibrating an airborne laser profiling system. Remote Sens. Environ. 1984, 50, 1591–1598. [Google Scholar]
  30. Dobson, M.C.; Ulaby, F.T.; Le Toan, T.; Beaudoin, A.; Christensen, N. Dependence of radar backscatter on coniferous forest biomass. IEEE Trans. Geosci. Remote Sens. 1992, 30, 412–415. [Google Scholar] [CrossRef]
  31. Letoan, T.; Beaudoin, A.; Guyon, D. Relating Forest Biomass to Sar Data. IEEE Trans. Geosci. Remote Sens. 1992, 30, 403–411. [Google Scholar] [CrossRef]
  32. Toan, T.L.; Quegan, S.; Davidson, M.W.J.; Balzter, H.; Ulander, L. The BIOMASS mission: Mapping global forest biomass to better understand the terrestrial carbon cycle. Remote Sens. Environ. 2011, 115, 2850–2860. [Google Scholar] [CrossRef]
  33. Cloude, S.R.; Pottier, E. A review of target decomposition theorems in radar polarimetry. IEEE Trans. Geosci. Remote Sens. 1996, 34, 498–518. [Google Scholar] [CrossRef]
  34. Saatchi, S.S.; Harris, N.L.; Brown, S.; Lefsky, M.; Mitchard, E.T.A.; Salas, W.; Zutta, B.R.; Buermann, W.; Lewis, S.L.; Hagen, S.; et al. Benchmark map of forest carbon stocks in tropical regions across three continents. Proc. Natl. Acad. Sci. USA 2011, 108, 9899–9904. [Google Scholar] [CrossRef]
  35. Markus, T.; Neumann, T.; Martino, A.; Abdalati, W.; Brunt, K.; Csatho, B.; Farrell, S.; Fricker, H.; Gardner, A.; Harding, D.; et al. The Ice, Cloud, and land Elevation Satellite-2 (ICESat-2): Science requirements, concept, and implementation. Remote Sens. Environ. 2017, 190, 260–273. [Google Scholar] [CrossRef]
  36. Saatchi, S.S.; Houghton, R.A.; Dos Santos Alvala, R.C.; Soares, J.V.; Yu, Y. Distribution of aboveground live biomass in the Amazon basin. Glob. Chang. Biol. 2007, 13, 816–837. [Google Scholar] [CrossRef]
  37. SobirovIvanovna, P. The role of keywords in disclosing the meaning of artistic text. Int. J. Progr. Sci. Technol. 2020, 24, 40–42. [Google Scholar]
  38. Tian, X.; Geng, Y.; Sarkis, J.; Zhong, S. Trends and features of embodied flows associated with international trade based on bibliometric analysis. Resour. Conserv. Recycl. 2018, 131, 148–157. [Google Scholar] [CrossRef]
  39. Wang, Z.; Zhao, Y.; Wang, B. A bibliometric analysis of climate change adaptation based on massive research literature data. J. Clean. Prod. 2018, 199, 1072–1082. [Google Scholar] [CrossRef]
  40. Colares, G.S.; Dell’Osbel, N.; Wiesel, P.G.; Oliveira, G.A.; Lemos, P.; Da, S.F.; Lutterbeck, C.A.; Kist, L.T.; Machado, E.L. Floating Treatment Wetlands: A Review and Bibliometric Analysis. Sci. Total Environ. 2020, 714, 136776. [Google Scholar] [CrossRef]
  41. Zhong, C.; Li, T.; Bi, R.; Sanganyado, E.; Huang, J.; Jiang, S.; Zhang, Z.; Du, H. A systematic overview, trends and global perspectives on blue carbon: A bibliometric study (2003–2021). Ecol. Indic. 2023, 148, 110063. [Google Scholar] [CrossRef]
  42. Lu, D. The Potential and Challenge of Remote Sensing-based Biomass Estimation. Int. J. Remote Sens. 2006, 27, 1297–1328. [Google Scholar] [CrossRef]
  43. Shi, Y.; Wang, Z.; Liu, L.; Li, C.; Peng, D.; Xiao, P. Improving Estimation of Woody Aboveground Biomass of Sparse Mixed Forest over Dryland Ecosystem by Combining Landsat-8, GaoFen-2, and UAV Imagery. Remote Sens. 2021, 13, 4859. [Google Scholar] [CrossRef]
  44. Eriksson, L.E.B.; Santoro, M.; Wiesmann, A.; Schmullius, C.C. Multitemporal JERS Repeat-Pass Coherence for Growing-Stock Volume Estimation of Siberian Forest. IEEE Trans. Geosci. Remote Sens. 2003, 41, 1561–1570. [Google Scholar] [CrossRef]
  45. Cooper, S.; Okujeni, A.; Pflugmacher, D.; van der Linden, S.; Hostert, P. Combining simulated hyperspectral EnMAP and Landsat time series for forest aboveground biomass mapping. Int. J. Appl. Earth Obs. Geoinf. 2021, 98, 102307. [Google Scholar] [CrossRef]
  46. Zhang, X.; Li, L.; Liu, Y.; Wu, Y.; Tang, J.; Xu, W.; Wang, L.; Ou, G. Improving the accuracy of forest aboveground biomass using Landsat 8 OLI images by quantile regression neural network for Pinus densata forests in southwestern China. Front. For. 2023, 6, 1162291. [Google Scholar] [CrossRef]
  47. Astola, H.; Häme, T.; Sirro, L.; Molinier, M.; Kilpi, J. Comparison of Sentinel-2 and Landsat 8 imagery for forest variable prediction in boreal region. Remote Sens. Environ. 2019, 223, 257–273. [Google Scholar] [CrossRef]
  48. Maack, J.; Kattenborn, T.; Fassnacht, F.E.; Enssle, F.; Hernandez, J.; Corvalan, P.; Koch, B. Modeling forest biomass using very-high-resolution data-combining textural, spectral and photogrammetric predictors derived from spaceborne stereo images. Eur. J. Remote Sens. 2015, 48, 245–261. [Google Scholar] [CrossRef]
  49. Yu, Y.; Pan, Y.; Yang, X.; Fan, W. Spatial Scale Effect and Correction of Forest Aboveground Biomass Estimation Using Remote Sensing. Remote Sens. 2022, 14, 2828. [Google Scholar] [CrossRef]
  50. Ge, j.; Hou, M.; Liang, T.; Feng, Q.; Meng, X.; Liu, J.; Bao, X.; Gao, H. Spatiotemporal dynamics of grassland aboveground biomass and its driving factors in North China over the past 20 years. Sci. Total Environ. 2022, 826, 154226. [Google Scholar] [CrossRef]
  51. Rana, P.; Popescu, S.; Tolvanen, A.; Gautam, B.; Srinivasan, S.; Tokola, T. Estimation of tropical forest aboveground biomass in Nepal using multiple remotely sensed data and deep learning. Int. J. Remote Sens. 2023, 44, 5147–5171. [Google Scholar] [CrossRef]
  52. Timothy, D.; Onisimo, M.; Cletah, S.; Adelabu, S.; Tsitsi, B. Remote sensing of aboveground forest biomass: A review. Trop. Ecol. 2016, 57, 125–132. [Google Scholar]
  53. Vreugdenhil, M.; Wagner, W.; Bauer-Marschallinger, B.; Pfeil, I.; Teubner, I.; Rüdiger, C.; Strauss, P. Sensitivity of Sentinel-1 Backscatter to Vegetation Dynamics: An Austrian Case Study. Remote Sens. 2018, 10, 1396. [Google Scholar] [CrossRef]
  54. Santoro, M.; Cartus, O. Research Pathways of Forest Above-Ground Biomass Estimation Based on SAR Backscatter and Interferometric SAR Observations. Remote Sens. 2018, 10, 608. [Google Scholar] [CrossRef]
  55. Hamdan, O.; Aziz, H.; Abd, R. Remotely sensed L-band SAR data for tropical forest biomass estimation. J. Trop. For. Sci. 2011, 23, 318–327. [Google Scholar]
  56. Popescu, S.C.; Wynne, R.H.; Nelson, R.F. Measuring individual tree crown diameter with lidar and assessing its influence on estimating forest volume and biomass. Can. J. Remote Sens. 2003, 29, 564–577. [Google Scholar] [CrossRef]
  57. Lin, J.; Chen, D.; Yang, S.; Liao, X. Precise aboveground biomass estimation of plantation forest trees using the novel allometric model and UAV-borne LiDAR. Front. For. 2023, 6, 1166349. [Google Scholar] [CrossRef]
  58. Zhang, L.; Zhang, X.; Shao, Z. Integrating Sentinel-1 and 2 with LiDAR data to estimate aboveground biomass of subtropical forests in northeast Guangdong, China. Int. J. Digi. Earth. 2023, 16, 158–182. [Google Scholar] [CrossRef]
  59. Gleason, C.; Im, J. Forest biomass estimation from airborne LiDAR data using machine learning approaches. Remote Sens. Environ. 2012, 125, 80–91. [Google Scholar] [CrossRef]
  60. Brede, B.; Terryn, L.; Barbier, N.; Bartholomeus, H.M.; Bartolo, R.; Calders, K.; Derroire, G.; Krishna Moorthy, S.M.; Lau, A.; Levick, S.R.; et al. Non-Destructive Estimation of Individual Tree Biomass: Allometric Models, Terrestrial and UAV Laser Scanning. Remote Sens. Environ. 2022, 280, 113180. [Google Scholar] [CrossRef]
  61. Jaakkola, A.; Hyyppa, J.; Yu, X.; Kukko, A.; Kaartinen, H.; Liang, X.; Hyyppa, H.; Wang, Y. Autonomous Collection of Forest Field Reference—The Outlook and a First Step with UAV Laser Scanning. Remote Sens. 2017, 9, 785. [Google Scholar] [CrossRef]
  62. Tian, Y.; Zhang, Q.; Huang, H.; Huang, Y.; Tao, J.; Zhou, G.; Zhang, Y.; Yang, Y.; Lin, J. Aboveground biomass of typical invasive mangroves and its distribution patterns using UAV-LiDAR data in a subtropical estuary: Maoling River estuary, Guangxi, China. Ecol. Indic. 2022, 136, 108694. [Google Scholar] [CrossRef]
  63. Gibbs, H.K.; Brown, S.; Niles, J.O.; Foley, J.A. Monitoring and Estimating Tropical Forest Carbon Stocks: Making REDD a Reality. Environ. Res. Lett. 2007, 2, 045023. [Google Scholar] [CrossRef]
  64. Zhang, C.H.; Ju, W.M.; Chen, J.M.; Wang, X.Q.; Yang, L.; Zheng, G. Disturbance-induced reduction of biomass carbon sinks of China’s forests in recent years. Environ. Res. Lett. 2015, 10, 114021. [Google Scholar] [CrossRef]
  65. Tian, H.; Zhu, J.; He, X.; Chen, X.; Jian, Z.; Li, C.; Ou, Q.; Li, Q.; Huang, G.; Liu, C.; et al. Using machine learning algorithms to estimate stand volume growth of Larix and Quercus forests based on national-scale Forest Inventory data in China. For. Ecosyst. 2022, 9, 100037. [Google Scholar] [CrossRef]
  66. He, L.; Chen, J.M.; Pan, Y.; Birdsey, R.; Kattge, J. Relationships between Net Primary Productivity and Forest Stand Age in U.S. Forests. Glob. Biogeochem. Cycles 2012, 26, 394–415. [Google Scholar] [CrossRef]
  67. Chang, Z.; Wigneron, J.; Wang, Y.; Fan, L.; Ciais, P.; Chave, J.; Fensholt, R.; Chen, J.; Yuan, W.; Ju, W.; et al. Estimating aboveground carbon dynamic of China using optical and microwave remote sensing datasets from 2013–2019. J. Remote Sens. 2023, 3, 5. [Google Scholar] [CrossRef]
  68. Chen, Y.; Feng, X.; Fu, B.; Ma, H.; Zohner, C.M.; Crowther, T.W.; Huang, Y.; Wu, X.; Wei, F. Maps with 1 km resolution reveal increases in above-and belowground forest biomass carbon pools in China over the past 20 years. Earth Syst. Sci. Data 2023, 15, 897–910. [Google Scholar] [CrossRef]
  69. Sun, J.; Zhang, Y.; Chai, G.Q. Estimation and Simulation of Forest Carbon Stock in Northeast China Forestry Based on Future Climate Change and LUCC. Remote Sens. 2022, 14, 3653. [Google Scholar] [CrossRef]
  70. Zhang, Y.; Zhao, D.; Liu, H.; Huang, X.; Deng, J.; Jia, R.; He, X.; Tahir, M.N.; Lan, Y. Research Hotspots and Frontiers in Agricultural Multispectral Technology: Bibliometrics and Scientometrics Analysis of the Web of Science. Front. Plant Sci. 2022, 13, 955340. [Google Scholar] [CrossRef] [PubMed]
  71. Li, T.; Cui, L.; Xu, Z.; Hu, R.; Joshi, P.K.; Song, X.; Tang, L.; Xia, A.; Wang, Y.; Guo, D.; et al. Quantitative Analysis of the Research Trends and Areas in Grassland Remote Sensing: A Scientometrics Analysis of Web of Science from 1980 to 2020. Remote Sens. 2021, 13, 1279. [Google Scholar] [CrossRef]
Figure 1. Trends in the quantity of publications and citations identified via WOS that are related to forest biomass using remote sensing from 1985 to 2023.
Forests 15 00524 g001
Figure 2. A visualization of the co-occurring subject category network.
Forests 15 00524 g002
Figure 3. Time series change of journals.
Forests 15 00524 g003
Figure 4. The publications and average publications citations of countries.
Forests 15 00524 g004
Figure 5. A visualization of the keyword co-occurring network.
Forests 15 00524 g005
Figure 6. Co-occurrence network based on author keywords.
Forests 15 00524 g006
Figure 7. The evolution of the “word cloud”, 1985–2023.
Forests 15 00524 g007
Table 1. Top 10 subject categories sorted by the number of articles.
SubjectTPRation%
Remote sensing89253.16
Imaging Science Photographic Technology76145.35
Environmental sciences70542.01
Geosciences multidisciplinary38422.88
Forestry29917.82
Engineering electrical electronic1559.24
Geography physical1317.81
Ecology1247.39
Geochemistry geophysics1086.44
Meteorology atmospheric sciences623.69
Note: TP: total publications between 2001 and 2023.
Table 2. Top 10 journal sorted by the number of articles.
SourcesTPTCTC/TPIFH Index
Remote Sensing247616224.955.642
Remote Sensing of Environment1941687286.9714.277
Forests86118013.723.020
IEEE Transactions on Geoscience and Remote Sensing818304102.523.632
International Journal of Remote Sensing80369246.153.829
Forest Ecology and Management57242442.538.839
IEEE Journal of Selected Topics in Applied Earth Observations and Remote Sensing42100323.885.517
International Journal of Applied Earth Observation and Geoinformation41134932.907.224
ISPRS Journal of Photogrammetry and Remote Sensing35286781.9112.427
Journal of Applied Remote Sensing2742415.701.710
Note: IF: five-year impact factor from the 2022 edition of Journal Citation Reports® in WOS. TC: the total citations for a journal. TC/TP: average number of citations per paper for a journal.
Table 3. Top 10 influential authors sorted by H index.
AuthorsH IndexTPTCTC/TPPY_StartTP (2019–2023)
Naesset E.2134147143.2620107
Gobakken T.2132136142.5320104
Saatchi S.2027196772.85199511
Herold M.1925114445.76201417
Nelson R.19202154107.7019880
Sun G. Q.1827137851.0419945
Phillips O. L.1519177393.32201313
Dubayah R.1520101750.85200311
Asner G. P.151989847.2620025
Avitabile V.151687954.9420128
Wang C.152276234.6420089
Table 4. Top 10 most productive institutions between 2001 and 2023.
AffiliationCountryTPTCTC/TP
Chinese Academy of SciencesChina139426730.70
University of Maryland College ParkUSA97410642.33
United States Forest ServiceUSA88499256.73
National Aeronautics and Space AdministrationUSA75641085.47
California Institute of TechnologyUSA718022112.99
Chinese Academy of ForestryChina45105323.40
Norwegian University of Life SciencesNorway44167838.14
Swedish University of Agricultural SciencesSweden38180847.58
University of Chinese Academy of SciencesChina37123533.38
Nanjing forestry UniversityChina3482424.24
Table 5. Keywords with bursts in the last six years.
Key WordsStrengthBeginEnd2001–2023
carbon6.3720182021▂ ▂ ▂ ▂ ▂ ▂ ▂ ▂ ▂ ▂ ▂ ▂
▂ ▂ ▂ ▂ ▂  ▃ ▃ ▃ ▃  ▂ ▂
map10.6120192021▂ ▂ ▂ ▂ ▂ ▂ ▂ ▂ ▂ ▂ ▂ ▂
▂ ▂ ▂ ▂ ▂ ▂  ▃ ▃ ▃  ▂ ▂
airborne LiDAR15.7320182022▂ ▂ ▂ ▂ ▂ ▂ ▂ ▂ ▂ ▂ ▂ ▂
▂ ▂ ▂ ▂ ▂  ▃ ▃ ▃ ▃ ▃  
model12.8520212023▂ ▂ ▂ ▂ ▂ ▂ ▂ ▂ ▂ ▂ ▂ ▂
▂ ▂ ▂ ▂ ▂ ▂ ▂ ▂  ▃ ▃ ▃
Disclaimer/Publisher’s Note: The statements, opinions and data contained in all publications are solely those of the individual author(s) and contributor(s) and not of MDPI and/or the editor(s). MDPI and/or the editor(s) disclaim responsibility for any injury to people or property resulting from any ideas, methods, instructions or products referred to in the content.

