Article

A Comprehensive Analysis of Vegetation Dynamics and Their Response to Climate Change in the Loess Plateau: Insight from Long-Term kernel Normalized Difference Vegetation Index Data

1
State Key Laboratory of Hydraulics and Mountain River Engineering & College of Water Resource and Hydropower, Sichuan University, Chengdu 610065, China
2
Sichuan Academy of Agricultural Machinery Sciences, Chengdu 610066, China
3
School of Geographical Science, Nantong University, Nantong 650500, China
*
Author to whom correspondence should be addressed.
Forests 2024, 15(3), 471; https://doi.org/10.3390/f15030471
Submission received: 19 January 2024 / Revised: 19 February 2024 / Accepted: 29 February 2024 / Published: 2 March 2024
(This article belongs to the Special Issue Application of Remote Sensing in Vegetation Dynamic and Ecology)

Abstract

:
The Loess Plateau (LP) is a typical climate-sensitive and ecologically delicate area in China. Clarifying the vegetation–climate interaction in the LP over 40+ years, particularly pre- and post-Grain to Green Program (GTGP) implementation, is crucial for addressing potential climate threats and achieving regional ecological sustainability. Utilizing the kernel Normalized Difference Vegetation Index (kNDVI) and key climatic variables (precipitation (PRE), air temperature (TEM), and solar radiation (SR)) between 1982 and 2022, we performed an extensive examination of vegetation patterns and their reaction to changes in climate using various statistical methods. Our findings highlight a considerable and widespread greening on the LP from 1982 to 2022, evidenced by a kNDVI slope of 0.0020 yr−1 (p < 0.001) and a 90.9% significantly increased greened area. The GTGP expedited this greening process, with the kNDVI slope increasing from 0.0009 yr−1 to 0.0036 yr−1 and the significantly greened area expanding from 39.1% to 84.0%. Over the past 40 years, the LP experienced significant warming (p < 0.001), slight humidification, and a marginal decrease in SR. Post-GTGP implementation, the warming rate decelerated, while PRE and SR growth rates slightly accelerated. Since the hurst index exceeded 0.5, most of the vegetated area of the LP is expected to be greening, warming, and humidification in the future. In the long term, 75% of the LP vegetated area significantly benefited from the increase in PRE, especially in relatively dry environments. In the LP, 61% of vegetated areas showed a positive correlation between kNDVI and TEM, while 4.9% exhibited a significant negative correlation, mainly in arid zones. SR promoted vegetation growth in 23% of the vegetated area, mostly in the eastern LP. The GTGP enhanced the sensitivity of vegetation to PRE, increasing the area corresponding to a significant positive correlation from 15.3% to 59.9%. Overall, PRE has emerged as the dominant climate driver for the vegetation dynamics of the LP, followed by TEM and SR. These insights contribute to a comprehensive understanding of the climate-impact-related vegetation response mechanisms, providing guidance for efforts toward regional sustainable ecological development amid the changing climate.

1. Introduction

Vegetation is pivotal within terrestrial ecosystems by aiding in the regulation of material and energy exchanges within the land–climate system [1,2]. It also contributes significantly to upholding ecosystem stability and ensuring the sustainable development of human societies [3,4,5]. Long-term satellite observations have illuminated a widespread process of vegetation greening globally since the 1980s [6], with climate change emerging as a noteworthy driving force [7]. Interactions between the vegetation and climate systems are governed by complex biophysical factors and processes, thereby amplifying the uncertainty associated with ecological strategies in response to a changing climate [8,9]. Vegetation growth on land exerts a dual influence on the global carbon–water cycle, leading to a reduction of atmospheric CO2 concentrations via photosynthesis [10] and the regulation of water fluxes via transpiration in the soil–vegetation–atmosphere continuum [11]. Simultaneously, climate change precipitates rapid alterations in plant growth and the regional coupling dynamics of carbon and water [12], thus affecting ecosystem adaptation and resilience [13]. Consequently, unraveling the drivers of climate-induced changes in vegetation growth has assumed paramount significance in addressing and forecasting potential climate threats.
The spatiotemporal patterns of vegetation are regulated by external climatic conditions, with PRR, TEM, and SR being recognized as the predominant climate regulators [14,15,16]. For instance, the physiological processes of vegetation, such as photosynthetic activity and respiratory rates, exhibit sensitivity to ambient temperature variations [17]. Specifically, vegetation in the Northern Hemisphere undergoes substantial increases in coverage attributed to the advancement and extension of the vegetative growing season resulting from warmer temperatures [18,19]. In contrast, vegetated areas in dry environments are more susceptible to water stress, with insufficient precipitation having been identified as the primary factor restricting vegetation growth [20,21]. Solar radiation (SR), which serves as a potential heat source for vegetation photosynthesis, has been confirmed as the primary driver for vegetation dynamics [22,23]. Vegetation also influences local, regional, or global climate conditions by regulating important processes such as surface energy balance, evapotranspiration, and surface water fluxes [6,11,24].
Quantitative investigations into the vegetation–climate relationship have garnered significant scholarly attention [25,26,27]. Traditional station-based observation methods, albeit valuable, face challenges in providing comprehensive, long-term, and large-scale insights into vegetation dynamics [28]. The advent of remote sensing technology has become instrumental in facilitating extensive monitoring for determining vegetation dynamics [29]. Detecting and attributing vegetation dynamics at large scales relies on various vegetation indices (VIs) derived from satellite observations, with Normalized Difference Vegetation Index (NDVI) and Enhanced Vegetation Index (EVI) being the prevailing options [30,31,32]. A strong association between the NDVI and biophysical and biochemical factors, including leaf area, chlorophyll density, green biomass, and growth conditions, is evident based on some studies [33,34,35]. Nevertheless, the precision of the data is impeded by the abundance of plants in thick foliage and its susceptibility to variations in the brightness of the canopy background [36,37]. In contrast, the EVI diminishes the effects of aerosols and soil background on different types of vegetation cover on the basis of the NDVI, yet saturation remains an issue [38,39]. Addressing these concerns, Camps-Valls et al. [40] proposed the kernel NDVI (kNDVI) grounded in kernel approach principles. In comparison to the NDVI and EVI, the kNDVI demonstrates enhanced consistency with primary productivity, saturation resistance, bias mitigation, and resilience to phenological cycles [40,41]. The kNDVI improves robustness and instability toward noise on both spatial and temporal scales and has proven effective for assessing vegetation dynamics [42,43,44].
Located in China’s climatic transition zone, the LP is characterized by limited water resources, extensive soil erosion, a delicate ecological environment, and a high susceptibility to climate change [45,46]. A number of ecological projects, notably the Grain to Green Program (GTGP) initiated in 1999 [47,48], have greatly enhanced the ecological conditions in the LP. Several research studies have investigated the impact of weather conditions on plant life in the LP region, utilizing the Global Inventory Monitoring and Modelling Studies (GIMMS) NDVI dataset from 1982 to 2015 [49,50,51]. However, the limitations of these investigations lie in the absence of data beyond 2015. In contrast, MODIS-related VIs provides contemporary insights [52,53,54], but their validity extends only to periods post-GTGP implementation. The integration of GIMMS NDVI and MODIS data has emerged as a promising strategy for overcoming these constraints [55,56]. Nonetheless, it is essential to recognize that the challenge pertaining to saturation in VIs persists.
To fill this gap, we calculated the monthly kNDVI values for the Loess Plateau based on a more-than-40-year continuous NDVI dataset, which covers both the periods pre- (1982–1999) and post-implementation (2000–2022) of the GTGP. Moreover, the variability of vegetation dynamics and its reaction to climate variation were comparatively evaluated across three distinct climatic zones. Our objectives were to (1) analyze the spatiotemporal patterns of kNDVI and important climatic factors in the LP across different time periods; (2) investigate the overall capacity of climatic variables to explain vegetation changes in the LP; and (3) assess the impact of climatic variables on vegetation dynamics and determine the primary drivers of these changes. The findings can offer theoretical backing for shaping and refining regional ecological preservation strategies amidst climate-altered conditions.

2. Materials and Methods

2.1. Study Area

The Loess Plateau, located in the northwest region of China (between 100°54′–114°33′ E and 33°43′–41°16′ N), covers a vast expanse of around 640,000 square kilometers (see Figure 1a). The LP has a varied topography, ranging from 85 to 5010 m in elevation, with its high elevation in the northwest and lower elevation in the southeast (Figure 1b). Characterized by a temperate continental climate, the LP transitions from an arid climate in the northwestern interior to a humid monsoon climate in the southeastern warm temperate zone. Based on the climate regionalization system developed by Zheng et al. [57], the LP can be categorized into three different climatic zones: arid, semi-arid, and semi-humid. This classification has been consistently employed in relevant studies [58,59]. Climate and topography interact profoundly to affect vegetation distribution in the LP [60], resulting in discernible zonal patterns (Figure 1c). Specifically, forests predominantly occupy the southeastern expanse of the LP, as well as the elevated mountainous regions. The north-central LP is predominantly covered by extensive grasslands. Furthermore, croplands are ubiquitously dispersed throughout the LP, primarily concentrated in plains, basins, and areas featuring suitable irrigation conditions and frequent human activity.

2.2. Data

2.2.1. NDVI Data

We obtained one of the longest spanning continuous GIMMS-3G+ NDVI datasets from the Oak Ridge National Laboratory Distributed Active Archive Center. The dataset was compiled using data from various AVHRR sensors, considering factors like calibration loss, orbital drift, and volcanic eruptions. The spatial resolution of this worldwide dataset is 0.0833 degrees and covers every two weeks from 1982 to 2022 [61]. To eliminate atmospheric interferences, the maximum-value composite algorithm was used to calculate monthly NDVI [22], and the noise was removed by smoothing with the Savitzky–Golay filter [62]. To minimize the influence of water bodies and snow cover, the average Growing Season NDVI was computed for the period of April to October, excluding values where the multiyear Growing Season NDVI was less than 0.1.

2.2.2. Climate Data

Data on monthly precipitation (PRE, mm) and average air temperature (TEM, °C) were acquired from the dataset titled ”1-km monthly precipitation dataset for China (1901–2022)” and “1-km monthly mean temperature dataset for China (1901–2022)” created by Peng et al. [63], respectively. The fusion of the CRU climate dataset and the WorldClim dataset was used to generate these datasets. The Delta downscaling technique was employed, and validation was carried out using data from 496 separate meteorological observation sites in China. These datasets provide monthly and 1 km temporal and spatial resolution, covering the period from 1901 to 2022. Data on solar radiation (SR, W m−2) were obtained from the TerraClimate dataset [64], spanning from 1958 to 2022, featuring a spatial resolution of 4 km. In order to maintain uniformity, all climate datasets were resampled to align with the spatiotemporal resolution of the NDVI data for further analysis.

2.3. Methods

2.3.1. Calculation of kNDVI

The kNDVI, rooted in the theory of kernel methods, is defined as follows:
k N D V I = k ( n , n ) k ( n , r ) k ( n , n ) + k ( n , r )
where NIR ( n ) and red ( r ) bands are denoted as the reflectance. The term k is used to describe the “kernel function” that can be defined as k ( n , r ) = e x p ( ( n r ) 2 / 2 σ 2 ) ) , where σ determines the measure of distance between n and r . Thus, Equation (1) can be simplified as follows:
k N D V I = 1 k ( n , r ) 1 + k ( n , r ) = t a n h n r 2 σ 2
Considering the equal distance between the NIR and red bands, Equation (1) can be further reduced to
k N D V I = t a n h N D V I 2
In this study, we used a simplified algorithm (Equation (3)) to calculate the monthly kNDVI, which was then enumerated into the average growing season kNDVI to reflect the dominant vegetation growth process.

2.3.2. Linear Regression Analysis

In order to measure the yearly changes in vegetation dynamics and climate conditions in the LP, we created a linear regression model that relates kNDVI (a meteorological factor) to time. The model parameters were estimated using the least squares method with the help of the following formulas.
slope   = n × i = 1 n   i × k N D V I i i = 1 n   i i = 1 n   k N D V I i n × i = 1 n   i 2 i = 1 n   i 2
Here, slope denotes the change rate, k N D V I i denotes the variable of the i-th value, for slope   > 0 , an increasing trend is evident, and a decreasing trend is apparent for slope   < 0 . The significance of the F-test was determined as follows:
F = S R S E / ( n 2 )
Here, S R = i = 1 n   ( k N D V I ^ i k N D V I ¯ ) 2 represents the sum of the regression squares, S E = i = 1 n   ( k N D V I i k N D V I ^ i ) 2 represents the sum of the residual squares, n 2 represents the freedom degrees of residuals, and k N D V I ^ i is the linear regression value of the variable. According to the results of the F-test, the trend of the change can be categorized as significant ( p < 0.05 ), more significant ( p < 0.01 ), and extremely significant ( p < 0.001 ).

2.3.3. Theil–Sen Median and Mann–Kendall Trend Test

The Theil–Sen median is a non-parametric statistical method of trend calculation. The Mann–Kendall trend test method is a non-parametric statistical technique [65]. The calculation formula is as follows:
β = median k N D V I j k N D V I i j i , i < j
The Mann–Kendall (MK) is a nonparametric statistical approach that does not necessitate time series to conform to a specific distribution [66]. It has been extensively utilized in trend analysis for time series of ecological and meteorological data. The MK test is conducted in the scenario where there is a kNDVI series of length n.
Z s = S 1 V a r ( S ) , S > 0 0 , S = 0 S + 1 V a r ( S ) , S < 0
S = i = 1 n 1   j = i + 1 n   sgn k N D V I j k N D V I i
V a r ( s ) = n ( n 1 ) ( 2 n + 5 ) i = 1 p   t j ( t j 1 ) ( 2 t j + 5 ) 18
s g n x j x i = 1 x j x i > 0 0 x j x i = 0 1 x j x i < 0
In this case, the kNDVI in years i and j are represented by k N D V I j and k N D V I j , respectively. The s g n is a symbolic function. The p is the number of the tied groups in the dataset, and t j is the number of data points in the j-th tied group. The significance of temporal trends is determined by 0.1, 0.05, and 0.01 levels when | Z s | > 1.64 , | Z s | > 1.96 , and | Z s | > 2.58 , respectively. In the present research, the R Package “trend” [67] was employed to conduct the MK trend test.

2.3.4. Hurst Exponent

Hurst [68] proposed the Hurst exponent (H) to evaluate the persistence of a time series. For the long-term kNDVI with a length of n, the primary computational procedures for the Hurst exponent are as follows:
(1)
Divide the original kNDVI into subsequences k N D V I τ with a length of τ and calculate the mean value of each subsequence;
k N D V I τ ¯ = 1 τ t = 1 τ   k N D V I t , τ = 1,2 , 3 , , n
(2)
Calculate the cumulative deviation ( V ( t , τ ) ) and its fluctuation range ( R ( τ ) ) for each k N D V I τ ;
V ( t , τ ) = t = 1 τ   k N D V I ( t ) k N D V I ( t ) ¯
R ( τ ) = m a x V ( t , τ ) m i n V ( t , τ ) , 1 t τ ; τ = 1,2 , 3 , , n
(3)
Calculate the standard deviation ( S τ ) for the deviation of each subsequence; then, the H exponent can be found from the following expression:
S τ = [ 1 τ t = 1 τ   ( N D V I ( t ) k N D V I ( t ) ¯ ) 2 ] 1 2
R ( τ ) S ( τ ) = ( c τ ) H
The H exponent indicates whether changes in kNDVI are persistent or not, with H > 0.5 , H < 0.5 , and H = 0.5 representing the presence of persistence, anti-persistence, and non-persistence for kNDVI, respectively.

2.3.5. Partial Correlation Analysis

The correlation between vegetation dynamics and a single climatic variable is frequently impacted by additional variables, leading to correlation coefficients (CC) that may not accurately portray the true degree of correlation. Consequently, to mitigate the influence of other variables, we employed second-order Pearson partial correlation analysis. This analytical approach allowed for the control of two additional variables, facilitating a focused analysis of the correlation between the kNDVI and individual climatic variables. The primary calculation procedures of the partial correlation coefficient (PCC) are outlined as follows [22]:
R x y = i = 1 n   ( x i x ¯ ) ( y i y ¯ ) i = 1 n   x i x ¯ 2 i = 1 n   y i y ¯ 2
R x y , z = R x y R x z × R y z 1 R x z 2 1 R y z 2
R x y , z w = R x y , z R x w , z R y w , z 1 R x w , z 2 1 R y w , z 2
Here, R x y denotes the CC between x and y ; R x y , z represents the PCC between the x and y when z is controlled; and R x y , z w represents the PCC between the variables x and y   when controlling for the variables z and w . The significance of the PCC was determined by the t-test:
t = R n q 2 1 R 2
Here, R represents the PCC, n denotes the sample size, and q signifies the order of partial correlation. The statistical variable t follows a t-distribution with n q 2 degrees of freedom.

2.3.6. Multiple Correlation Analysis

Multiple correlation analysis describes the joint influence of a set of independent variables (two or more) on a single dependent variable [69], and the degree of this multiple correlation can be measured using the multiple correlation coefficient (MCC). In this study, the PCC was applied to estimate the MCC between the kNDVI and the three climatic variables using the following formula [70]:
R x , y z w = 1 1 R x y 2 1 R x z , y 2 1 R x w , y z 2
F = R x , y z w 2 1 R x , y z w 2 × n k 1 k
Here, R x , y z w is the multiple correlation coefficient (MCC). To ascertain the importance of the MCC, the F-test is conducted, with n and k denoting the number of samples and independent variables, respectively.
In this study, all map graphics were plotted using the software ArcGIS 10.6, while the other graphics were plotted by Origin 2021.

3. Results

3.1. Spatial-Temporal Patterns of kNDVI and Climate Variables

3.1.1. Intra-Annual Variability in Vegetation Dynamics and Climate Factors

In various climatic zones of the LP, Figure 2 illustrates the fluctuation of kNDVI and climate factors throughout the year. Throughout the year, the kNDVI in the arid and semi-arid regions displayed a curved pattern, with its highest points occurring in August at 0.10 ± 0.02 and 0.22 ± 0.04, respectively (Figure 2a). In contrast, the semi-humid zone displayed a double-peak pattern, with kNDVI peaks occurring in May and August, corresponding to values of 0.39 ± 0.03 and 0.42 ± 0.03, respectively. This pattern aligns with the agricultural cycle, as the semi-humid zone serves as the primary production area for winter wheat, maturing in May and harvested thereafter. The intra-annual precipitation in the LP exhibited pronounced seasonality, concentrating between June and September, constituting over 70% of the annual precipitation (Figure 2b). In the arid, semi-arid, and semi-humid regions, rainfall exhibited a single-peaked pattern, occurring predominantly in August, July, and July, with respective amounts of approximately 54 ± 22, 95 ± 27, and 124 ± 36 mm. Temperature patterns on the LP displayed a single-peaked distribution throughout the year, with the highest TEM occurring in July (Figure 2c). During the period from October to March of the next year, the temperatures experienced in the arid and semi-arid regions were similar, and they were both lower than the temperatures in the semi-humid zone. In contrast, during the months of June to August, the temperatures in the arid and semi-humid regions were comparable but higher than those in the semi-arid region. Solar radiation on the LP followed a unimodal pattern, peaking in June (Figure 2d). The highest SR values were ordered as arid region (275 ± 14 W m−2), semi-arid region (261 ± 15 W m−2), and semi-humid region (251 ± 19 W m−2).

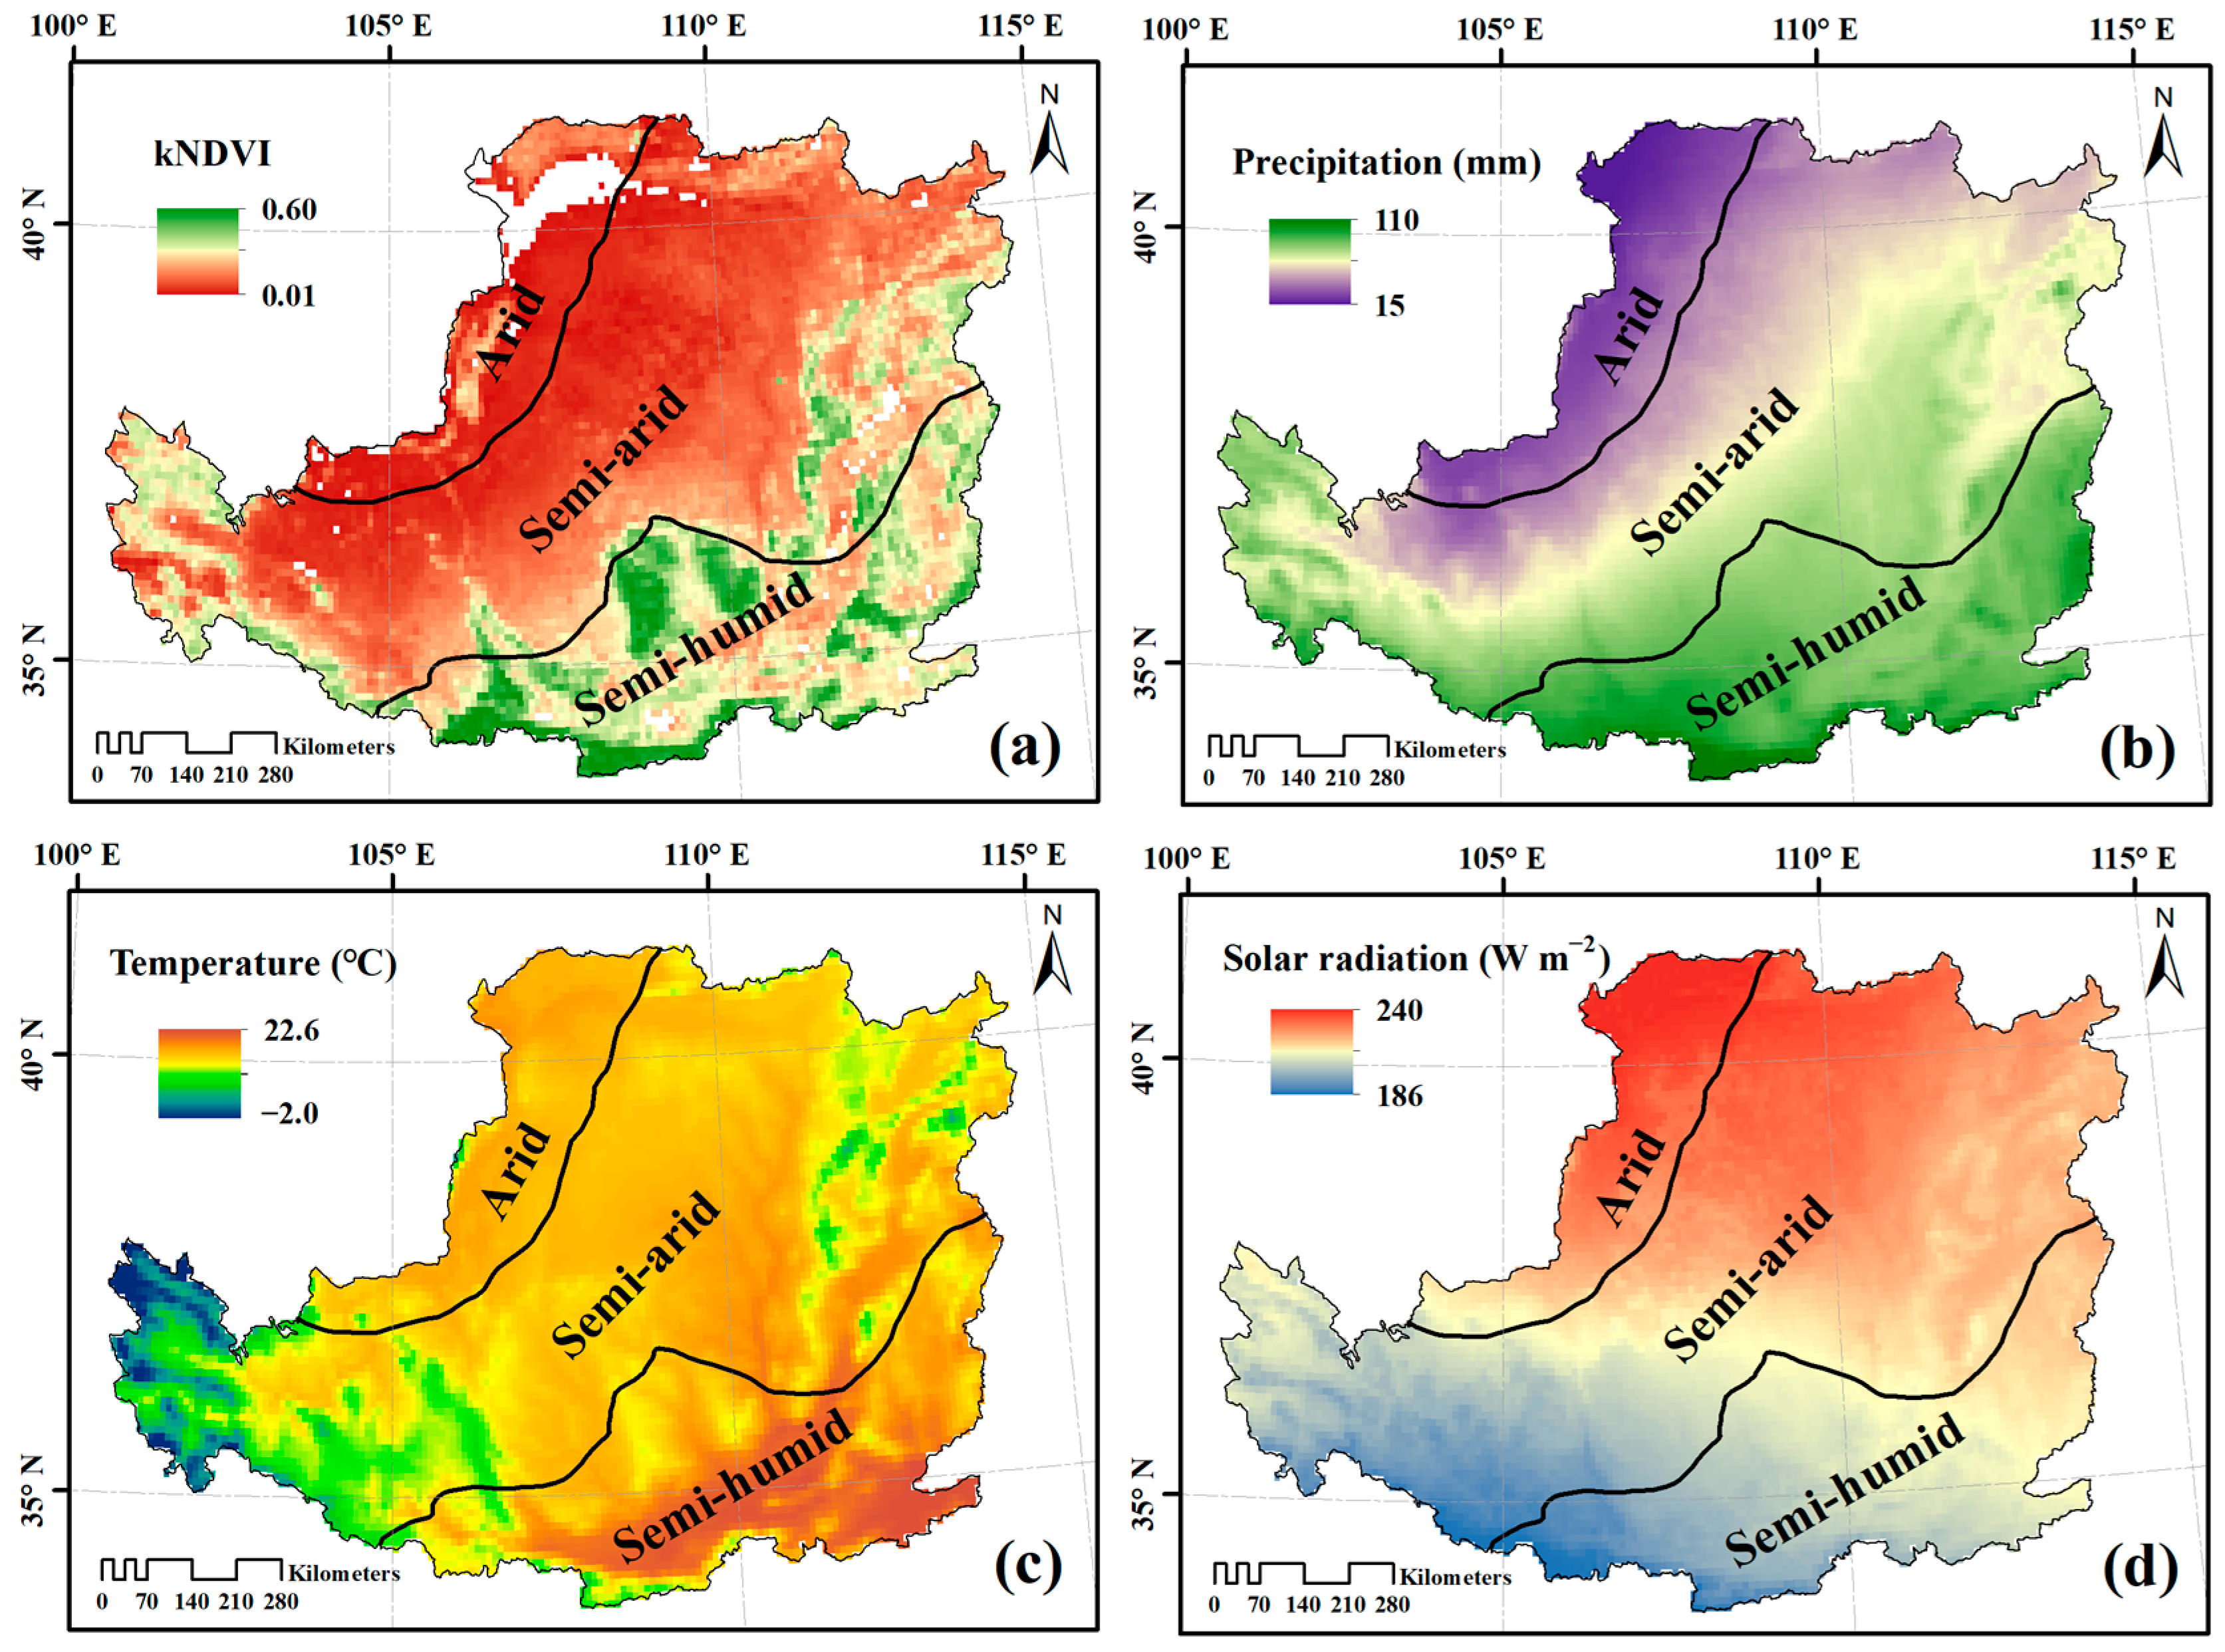
3.1.2. Spatial Patterns of kNDVI and Climate Variables during the Growing Season

From 1982 to 2022, the average kNDVI and climate variables during the vegetation growing season on the LP showed spatial heterogeneity (Figure 3). A latitudinal zonal distribution of kNDVI values was observed on the LP, with an increasing kNDVI from northwest to southeast (Figure 3a). In the semi-humid zone, the kNDVI exhibited a higher value of 0.35 ± 0.11, which was followed by the semi-arid zone with a value of 0.15 ± 0.10. Conversely, the arid zone had a lower kNDVI value of 0.06 ± 0.05. The LP exhibited a latitudinal zonal distribution of average rainfall during the growing season, with lower values in the northwest and higher values in the southeast. The rainfall gradually increased from the northwest to the southeast, as depicted in Figure 3b. The growing season mean precipitation values in each climatic zone were ranked as follows: semi-humid zone (79.0 ± 6.8 mm), semi-arid zone (57.4 ± 11.5 mm), and arid zone (28.5 ± 5.7 mm). As illustrated in Figure 3c, in the semi-humid zone, a high temperature of 17.8 ± 2.5 °C was observed, followed by the arid zone with a temperature of 16.8 ± 1.1 °C, and the semi-arid zone with a temperature of 14.9 ± 3.2 °C. The mean solar radiation (SR) declined from the northeastern region to the southwestern region, exhibiting SR values of 231 ± 8 W m−2, 218 ± 12 W m−2, and 208 ± 8 W m−2 in the arid, semi-arid, and semi-humid zones, respectively (Figure 3d).

3.2. Spatio-Temporal Trends of kNDVI and Climate Variables

3.2.1. Temporal Trends in Regional kNDVI and Climate Variables

In order to examine how effective the GTGP project has been in restoring vegetation in the LP, we segmented the study period into three sub-periods: before the GTGP was implemented (1982–1999), after the GTGP was implemented (2000–2022), and the entire period (1982–2022). Furthermore, the trends of vegetation dynamics and climatic variables in different climatic zones of the LP during various periods were analyzed (Figure 4). The LP experienced highly significant vegetation greening during 1982–2022, with a slope of 0.0020 yr−1 (p < 0.001) for kNDVI. The variation in vegetation changes differed among different climatic zones, with arid, semi-arid, and semi-humid zones experiencing slopes of 0.0007 yr−1, 0.0023 yr−1, and 0.0022 yr−1, respectively. The implementation of the GTGP accelerated vegetation greening on the LP. Specifically, the slopes of the kNDVI during 1982–1999 were 0.0006 yr−1 (p < 0.05), 0.0006 yr−1 (p < 0.001), 0.0008 yr−1 (p < 0.05), and 0.0014 yr−1 (p > 0.05), respectively. In contrast, the corresponding kNDVI variations during 2000–2022 were 4, 2, 5, and 2.4 times higher than those before the implementation of GTGP, respectively (p < 0.001).
Climatic conditions on the LP have also changed over the past 40 years, demonstrating spatiotemporal heterogeneity. In general, the LP indicated a trend of increasing temperature and humidity, with variations in PRE and TEM of 0.1698 mm per year (p > 0.05) and 0.0325 °C per year (p < 0.001), respectively. However, SR exhibited a slight decline. In all climatic zones, the patterns of PRE and TEM were in line with those of LP overall, showing notable warming (p < 0.001) and a slight increase in humidity (p > 0.05). With the exception of the minor rise in SR within the semi-humid zone, all remaining climatic zones exhibited a slight decline in SR. Following the execution of the GTGP, both LP and all climatic zones displayed a steady slowdown in the rate of warming, a slight uptick in PRE, and a marginal improvement in SR. Specifically, the TEM changed from a highly significant increase (p < 0.001) to a slight increase (p > 0.05) compared to the pre-GTGP implementation period. Precipitation shifted from experiencing a slight decrease to registering a slight increase overall, except in the semi-arid area, where a consistent slight increase was observed. Apart from a slight rise in SR in the semi-humid region, the remaining climatic zones exhibited a transition from a minor decline to a minor growth in SR.

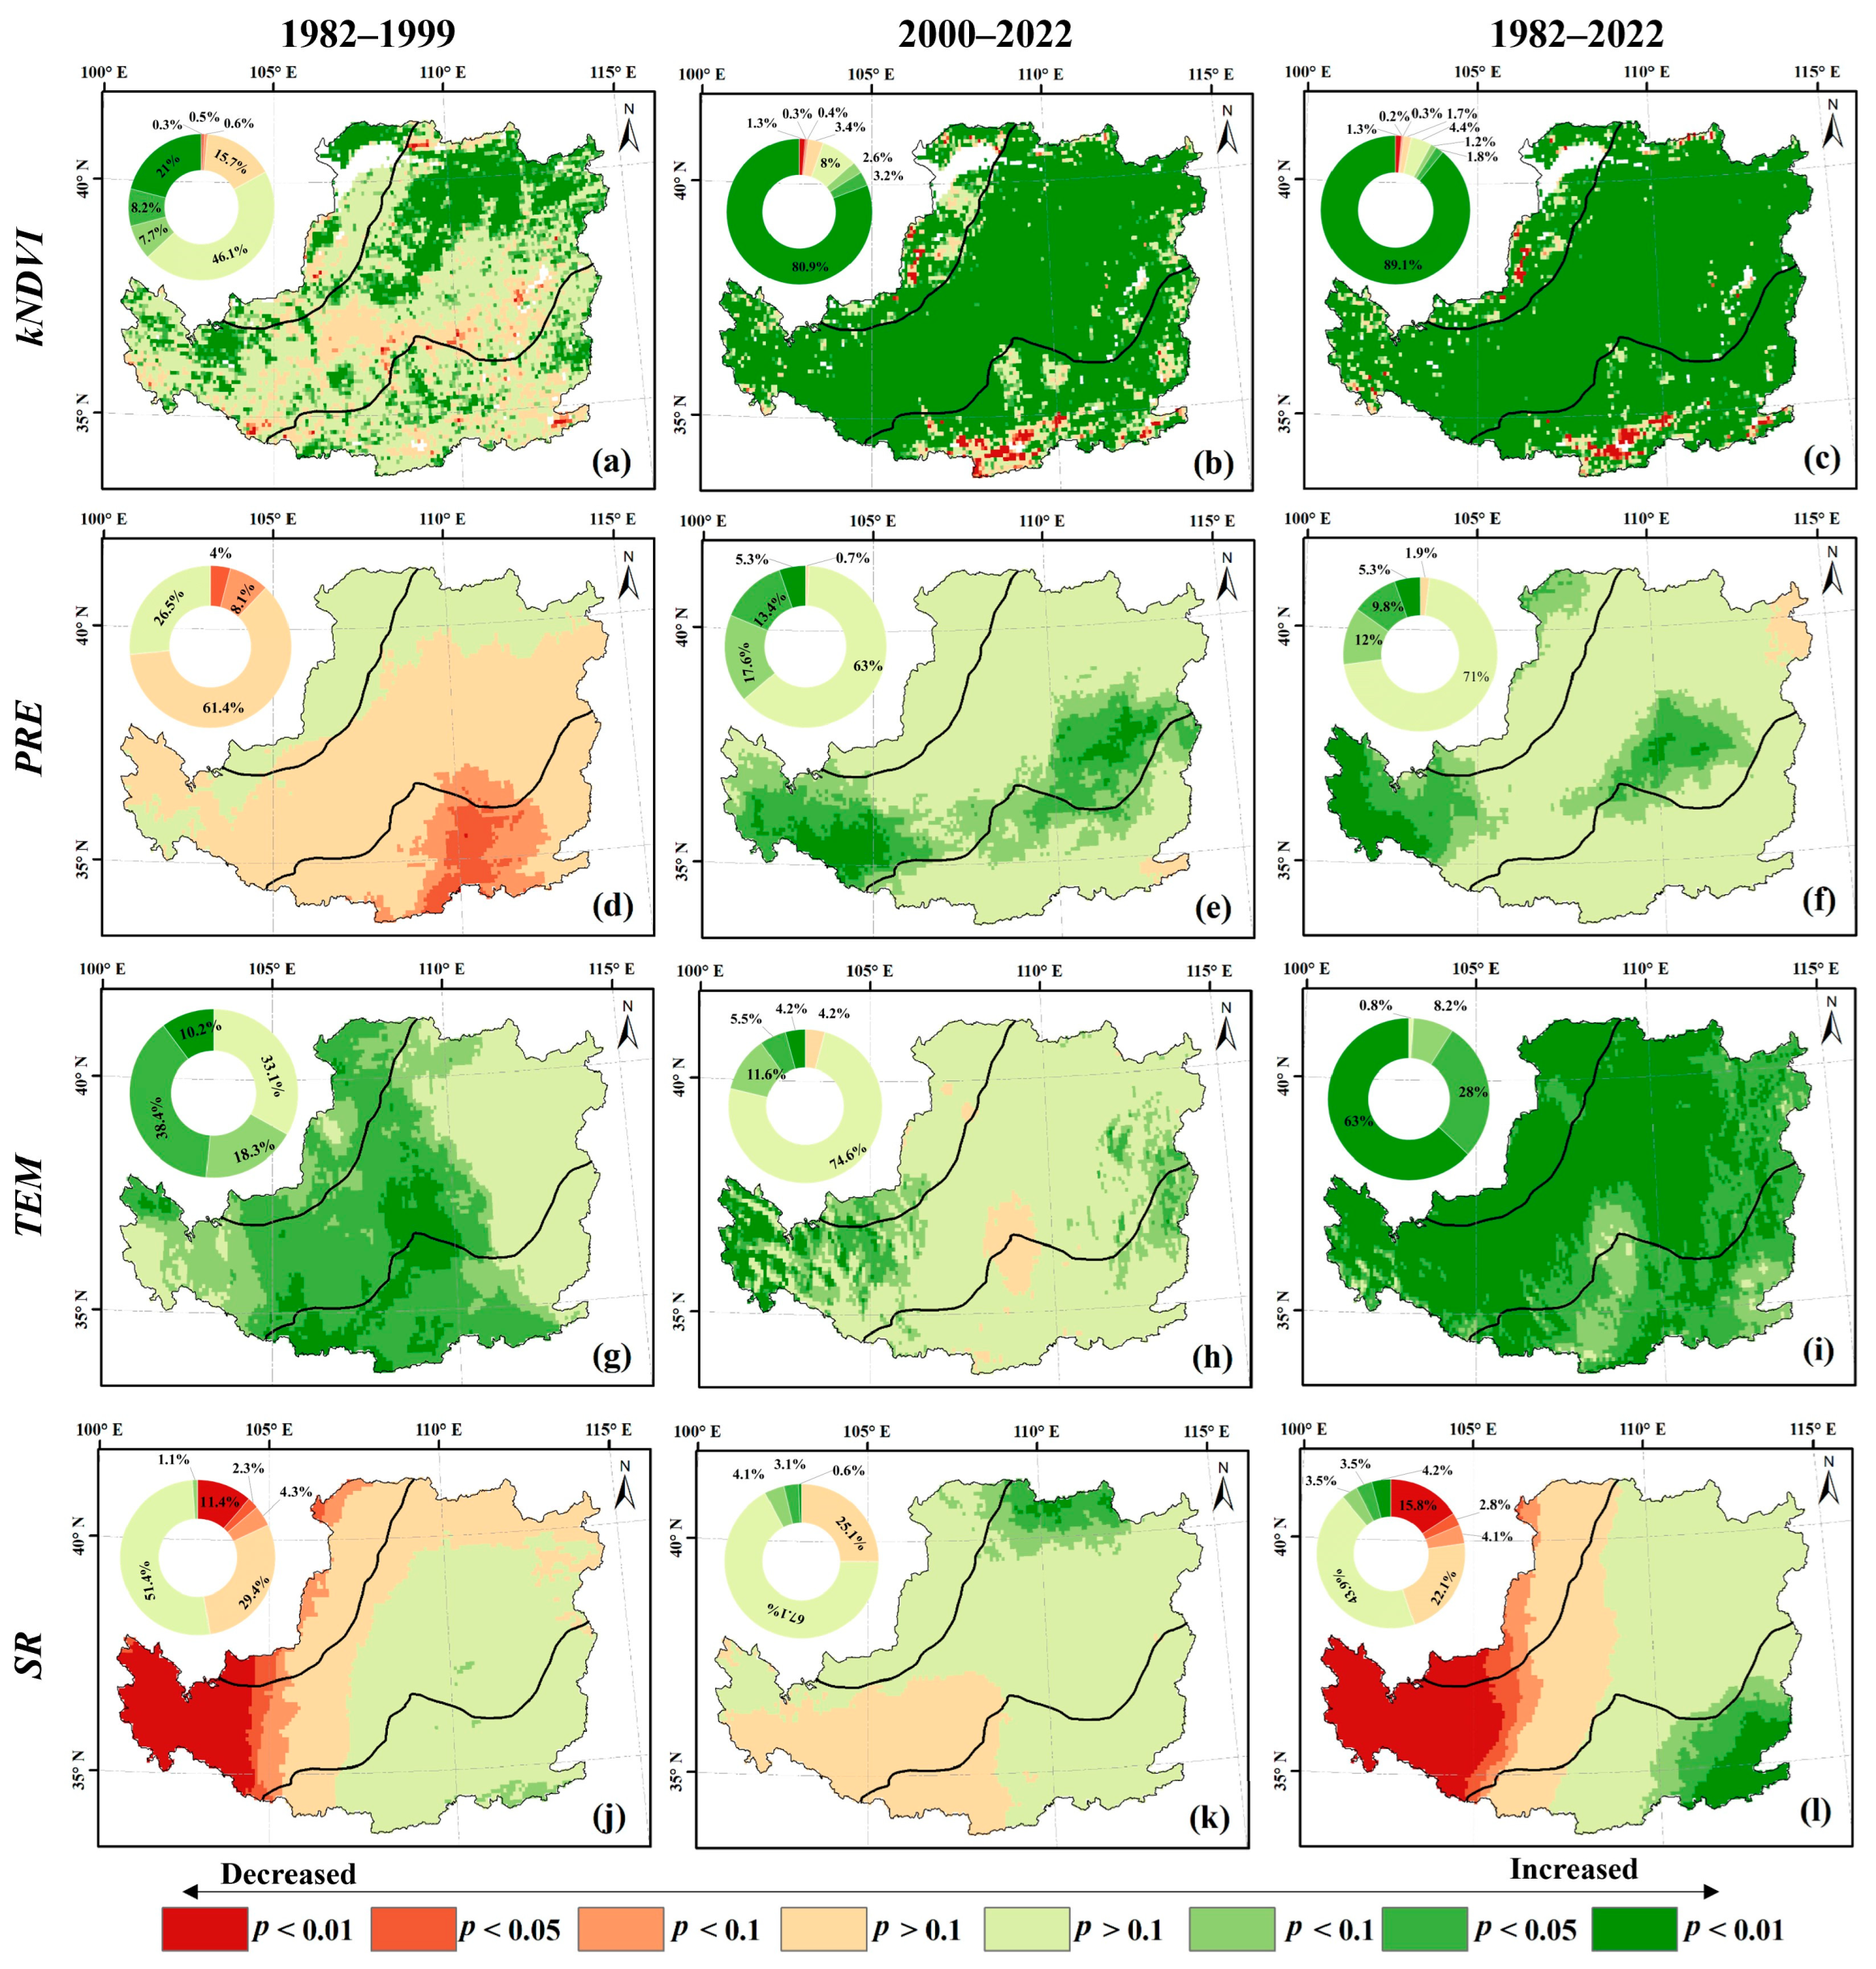
3.2.2. Spatial Trends in Regional kNDVI and Climate Variables

The trends of vegetation dynamics and climate conditions in the LP have been characterized by spatial heterogeneity over the past 40 years, with typical differences in the phases defined by the GTGP, as shown in Figure 5. From 1982 to 2022, the LP experienced extensive greening, with 96.5% of the LP demonstrating an increase in kNDVI, of which 90.9% of the LP showed a significant increase. Urban areas like Xi’an and Yinchuan exhibited a concentrated browning trend. Following the implementation of the GTGP, the vegetated area exhibiting a greening trend increased from 83.0% to 94.6%, and the area experiencing significant greening expanded from 29.1% to 84.0% in the LP. The GTGP implemented in 1999 is thought to have significantly contributed to fostering the greening of the LP, leading to a broader spectrum and a more pronounced pattern of vegetation expansion.
The LP experienced an extensive wetting process during 1982–2022, with 98.8% of the LP experiencing an increasing trend in PRE, of which 15.3% of the LP showed a significant increase, mostly located in the western and central LP. A continuous increase in temperature was noticed throughout the LP, with over 90% of the region displaying a notable warming pattern. Solar radiation has been characterized by a spatial pattern of decreasing and increasing from west to east over the past 40 years, with significant decreases (18.8%) concentrated in the western part of the plateau and significant increases (7.8%) in the southeastern part. In comparison to the time prior to the GTGP being put into effect, the proportion of the region witnessing a rise in PRE rose from 26.7% to 99.3%, while the portion undergoing notable alteration shifted from 4.0% (a substantial decline primarily in the southeastern region of the LP) to 18.9% (a substantial growth concentrated in the semi-arid zone). After the implementation of the GTGP, the warming rate slowed down in the LP, and the area experiencing significant warming decreased from 49.0% to 9.7%. After the GTGP was put into effect, there was a noticeable rise in SR. The portion of land experiencing increased SR expanded from 52.9% to 75.5%, while the portion with notable alterations decreased from 13.8% (mainly in the western region of the LP) to 3.7% (mainly in the northern region of the LP), indicating a significant increase.

3.2.3. Persistence of Variations in Vegetation Dynamics and Climate Variables

From 1982 to 2022, the Hurst exponent of the kNDVI was greater than 0.5 (indicative of the persistence of vegetation dynamics) in 98.7% of areas of the LP, suggesting that the LP will tend toward greening in the future. In contrast, the areas with the Hurst exponent of the kNDVI less than 0.5 were concentrated in a few urban areas, where kNDVI changes in the future may be opposite to the historical trend (Figure 6a). In the majority (78.7%) of the LP, the rainfall exhibited persistence (H > 0.5), mainly in the semi-arid and semi-humid regions, suggesting the possibility of sustained moisture increase in the coming years. The arid zone, however, showed anti-persistence (H < 0.5), revealing that slight aridity may be predominant in the arid zone in the future. The LP shows consistent warming, as the H exponent exceeded 0.5. In the future, three-quarters of the LP will be characterized by persistent changes in SR, with an emphasis on persistent decreases in the western LP and persistent increases in the southeastern LP. Overall, in the future, the LP will remain featured by vegetation greening, a warmer and wetter climate, and a slight weakening of SR.

3.3. Response of Vegetation Dynamics to Changing Climate

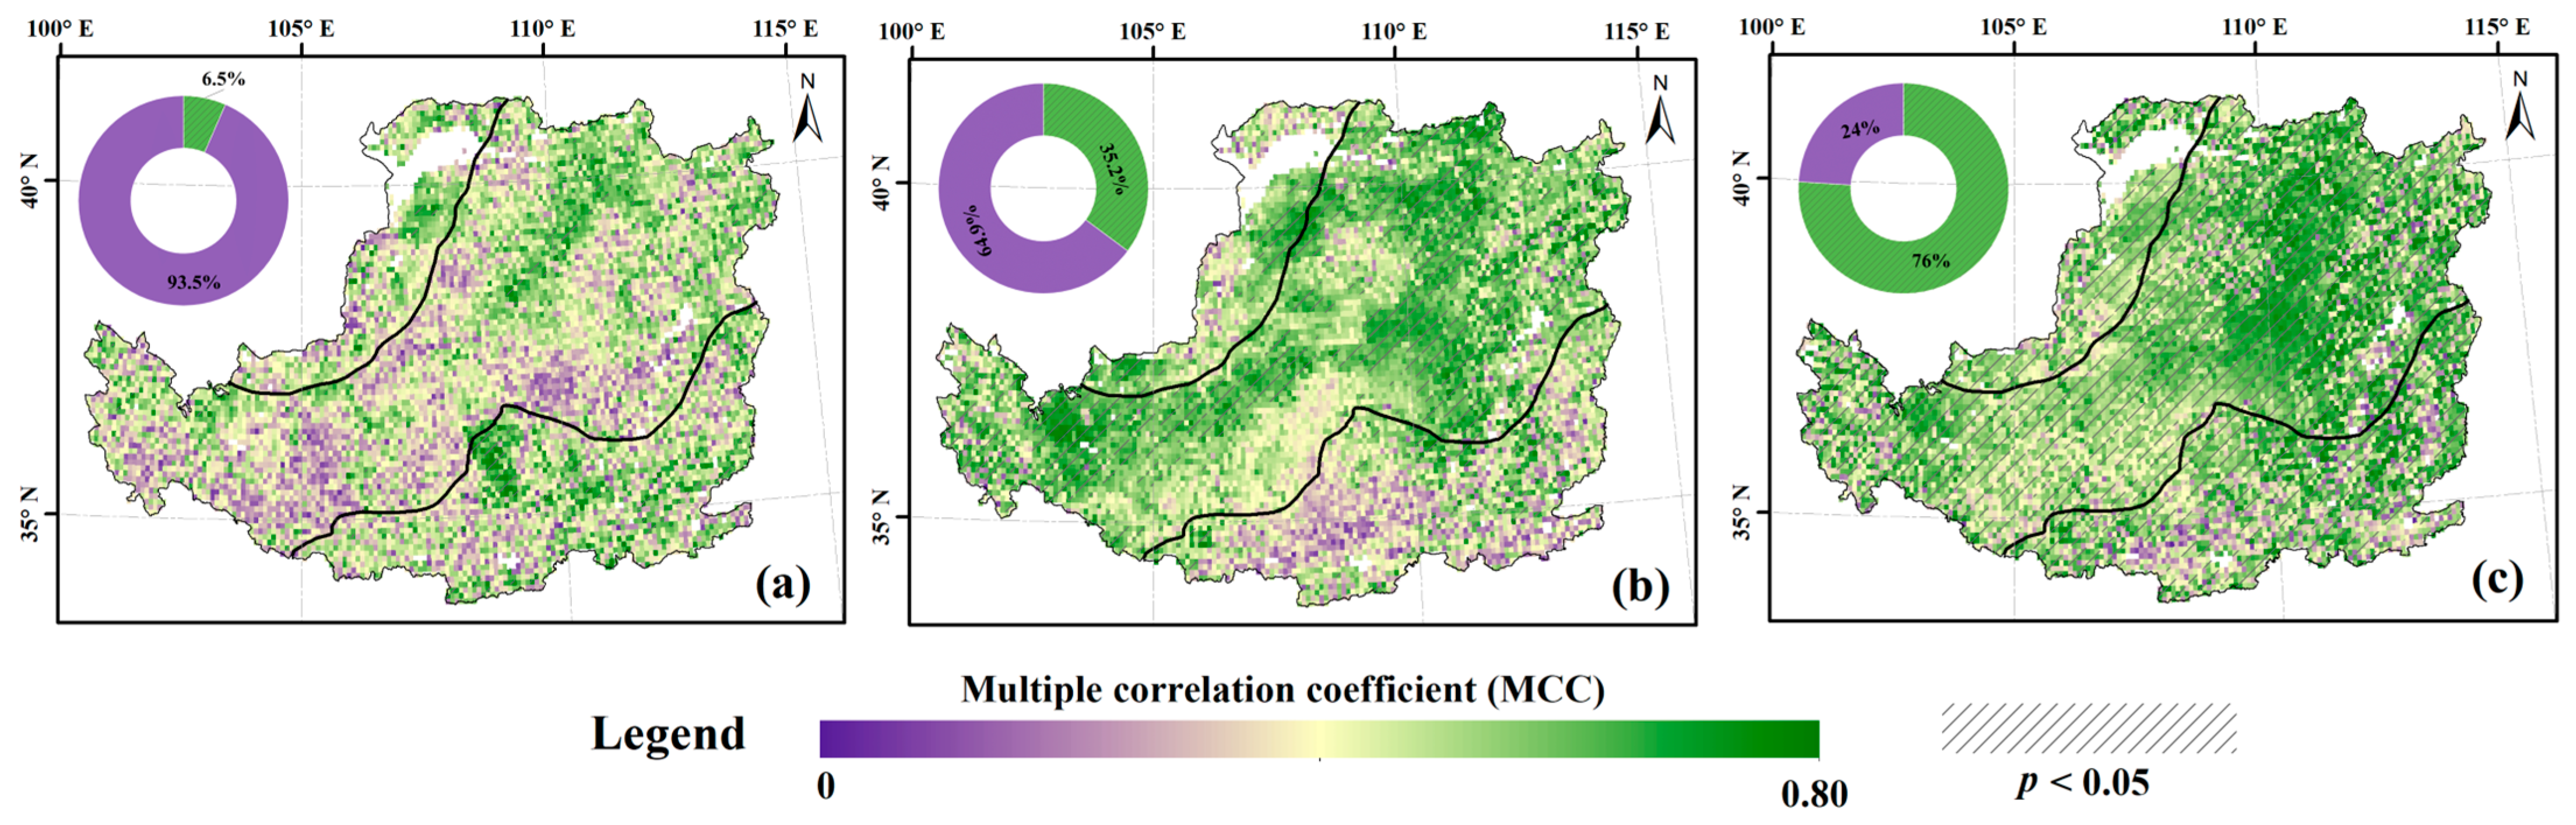
3.3.1. Sensitivity of Vegetation Dynamics to Climate Variables

The relationship between kNDVI and climate variables was further investigated by conducting a partial correlation analysis (Figure 7). A strong relationship was observed between kNDVI and PRE in 76.1% of the LP from 1982 to 2022. Out of these, 75% showed a significant positive correlation, primarily in arid and semi-arid regions. In the semi-humid zone, a majority of the LP showed a mere 1.1% occurrence of an adverse relationship between kNDVI and PRE. Following the implementation of the GTGP, vegetation exhibited heightened sensitivity to PRE, as evidenced by the rise in areas displaying positive correlation and significant positive correlation between the kNDVI and PRE, which increased from 44.1% to 65.1% and 15.3% to 59.9%, respectively.
Over the past four decades, the TEM has had a significant impact on 65.9% of the vegetated regions in the LP. Within these regions, a majority of 61% displayed a notable and favorable association between kNDVI and TEM, primarily observed in semi-arid and semi-humid areas. Conversely, 4.9% of the vegetated areas are significantly negatively affected by TEM, distributed widely in arid zones. As compared to the pre-GTGP, there were comparable areas with a positive and negative correlation between the kNDVI and TEM, whereas areas with significant positive correlations increased from 11.9% to 17.7%, while those with significant negative correlations increased from 1% to 2.7%. Out of all the LP, 42.7% had positive correlations between kNDVI and SR, while 57.3% had negative correlations. Among them, 23.1% and 1.6% were significant, respectively. The regions where SR significantly affected the vegetated area were primarily found in the northeastern semi-arid zone (with a positive correlation) and the central semi-humid zone (with a negative correlation). With the implementation of the GTGP, the area with positive responses of the kNDVI to SR increased from 40.8% to 45%, of which the positive response area increased from 7% to 12.3%, mainly concentrated in the transition zone from semi-arid to semi-humid zones. The proportion of regions exhibiting negative responses of the kNDVI to SR declined from 59.2% to 55%, accompanied by a decrease in the area displaying a noteworthy negative correlation from 2.8% to 2%. These changes were primarily concentrated within the semi-humid zones.

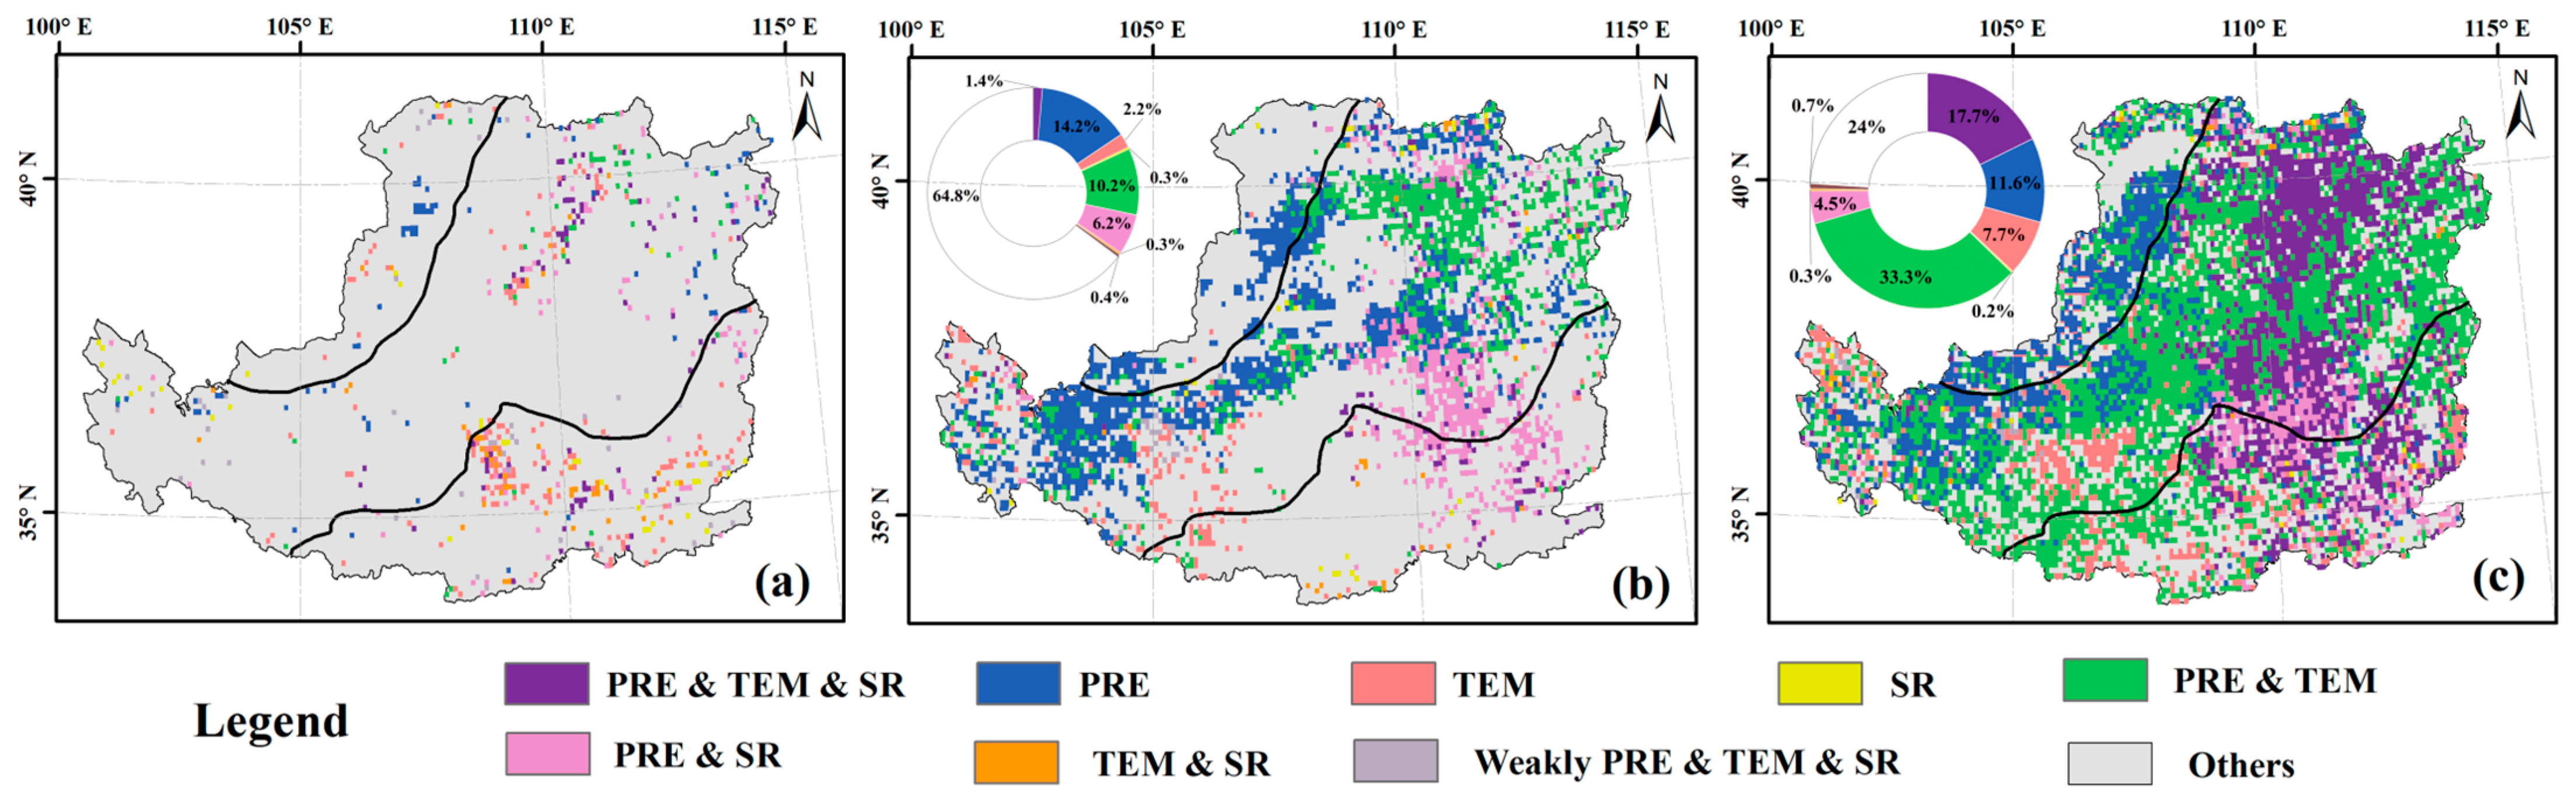
3.3.2. Driving Patterns of Climate Change-Related Vegetation Dynamics

Figure 8 shows the multiple correlation coefficients indicating the influence of the main climate factors (PRE, TEM, and SR) on kNDVI in the LP. Prior to the implementation of the GTGP, most vegetated areas were not significantly affected by climate change, while the area wherein integrated climate contributed significantly to vegetation dynamics amounted to 6.5% (Figure 8a). The GTGP’s implementation led to a notable rise in the vegetated region’s response to climate change, reaching 35.2%. This increase was particularly prominent in arid and semi-arid zones, where the impact of climate change on the vegetated area has significantly grown (Figure 8b). From a long-term perspective (1982–2022), climate change generated a widespread effect on vegetation dynamics in the LP, with 76% of the LP being significantly affected. In the eastern semi-arid region, the areas with the greatest MCC were usually found, where the kNDVI rose as TEM and PRE increased while SR decreased. The greening of vegetation in the semi-arid zone showed an upward trend as PRE increased and TEM decreased while SR decreased. Vegetation growth in the southwest semi-arid zone was positively influenced by rising PRE and TEM, as well as declining SR. It is important to mention that in mainly urban construction areas (for example, Xi’an and Yinchuan), the growth of vegetation may be hindered by rises in PRE, TEM, and SR.
Furthermore, we superimposed the regions with significant multiple correlation coefficients and partial correlations to categorize the climate variables driving vegetation dynamics on the LP, as summarized in Table 1 and presented in Figure 9. The extent to which climate change significantly affected vegetation dynamics prior to the implementation of the GTGP was limited. Following the implementation of the GTGP, the vegetation of the LP gradually recovered and was more sensitive to climate change. Among the climate variables analyzed, PRE had the widest impact on vegetation during this period, with rainfall-related factors (involving Types 1, 2, 5, and 6) significantly affecting 32% area of the LP. Temperature is the second most significant driver, significantly affecting 14.1% of the vegetated area, involving Types 1, 3, 5, and 7. Radiation-related significantly affected areas accounted for 8.2%, involving Types 1, 4, 6, and 7. During the period from 1982 to 2022, the dominant factor influencing changes in vegetation on the LP was the combination of PRE and TEM (Type 5), covering approximately 33.3% of the area. This type was primarily found in the semi-arid zone. Following this, the combined impact of PRE, TEM, and SR accounted for 17.7% of vegetated areas, mainly located in the northeastern part of the semi-arid zone, with some localized areas in the semi-humid zone. Precipitation significantly influenced vegetation dynamics (Type 2), with an area coverage of 11.6%, mainly distributed in the arid zone. Overall, PRE is the dominant climatic driver impacting vegetation dynamics in the LP, with 67.1% of the relevant area being significantly impacted. In particular, PRE is the determinant climate variable driving vegetation changes in the arid zone. Temperature is the second most impactful climate driver of vegetation dynamics in the LP, corresponding to 59% of the significantly influenced area, with more than half of the area being jointly influenced by PRE and TEM. Additionally, SR plays a crucial role in altering vegetation in the LP, impacting an extensive region of 22.8%, mainly within the semi-arid and semi-humid zones located in the northeast.

4. Discussion

4.1. Temporal and Spatial Fluctuations in the Dynamics of Vegetation and Climate Factors in the LP

By analyzing the changes in vegetation and climate in the LP over time, this study examines the spatial and temporal variations using monthly KNDVI and climate data (PRE, TEM, and SR) from 1982 to 2022. The main focus is on comparing the variability before and after the GTGP was implemented, which offers insights into evaluating the effectiveness of this ecological conservation project. The findings suggest that the LP has shown variation in space and time within a year and between years in terms of kNDVI and climate factors from 1982 to 2022. Generally, the kNDVI and climatic variables presented a single-peak distribution within a year, with peaks occurring in August for the kNDVI and PRE, in July for TEM, and in June for SR. Distinct variations in kNDVI were observed among different climatic zones, particularly in the semi-humid region. In the semi-humid region, there was a dual peak observed in the kNDVI, aligning with the peaks occurring in May and August, respectively. This pattern aligns with the agricultural cycle, as the semi-humid zone serves as the primary production area for winter wheat, maturing in May and harvested thereafter [28,71]. This has been confirmed in previous studies, emphasizing the influence of crop-specific phenology on the intra-annual dynamics of regional vegetation.
Between 1982 and 2022, the LP underwent a substantial and noteworthy process of vegetation greening, with more than 90% of its area displaying a significant upward trend in terms of the kNDVI. All of our findings suggest a consistent and significant trend of vegetation greening on the LP [49,72,73,74], despite variations in the rate and extent of increase in the vegetation index compared to previous studies. The difference may be due to the different types and lengths of the VIs employed. Compared with the period pre-GTGP implementation, the vegetation condition in the LP has dramatically improved, with the change slope of the kNDVI ranging from 0.009 yr−1 (p < 0.05) to 0.0036 yr−1 (p < 0.001), and the area with a significant increasing trend increasing from 29.1% to 84.0%. This indicates that the GTGP project’s execution effectively improved the vegetation state of the LP, particularly in the semi-arid region [47,75,76,77]. In contrast, rapid urbanization has exacerbated vegetation degradation in urban areas (e.g., Xi’an, Yinchuan, etc.), reminding people to reconcile social development and ecological protection [78,79]. Furthermore, the LP has undergone substantial warming and slight humidification over the past 40 years [80,81]. After the GTGP was implemented, the warming trend of the LP slowed down, and the humidification trend slightly increased.

4.2. Climate Change Plays a Crucial Role in Driving Changes in Vegetation Dynamics

Vegetation change and its relevance to climate variations are a crucial focus within global climate change research. Hydrothermal conditions are the primary climatic factors controlling vegetation growth, with TEM, PRE, and SR being closely linked to photosynthesis by vegetation. The findings of our research indicated that a significant majority (75%) of the vegetated regions in the LP experienced a rise in PRE between 1982 and 2022. These particular areas were predominantly located in arid and semi-arid zones, highlighting the crucial role of PRE in promoting vegetation growth in regions with limited water availability [82,83]. In these zones, PRE is the predominant recharge source of soil moisture and affects vegetation growth by influencing soil moisture content [84,85]. In the semi-humid zone, the correlation between kNDVI and PRE is generally negative and not statistically significant. The delay in vegetation growth due to the water deficit was caused by the ample PRE and elevated soil moisture content in the semi-humid area [86]. Furthermore, the forest ecosystems in the semi-humid region have extensively spread root systems, facilitating the absorption of nutrients from the lower layers of soil. Additionally, their physiological attributes equip them with enhanced resilience to water scarcity [87]. Additionally, the increased cloudiness and decreased SR caused by PRE affect photosynthesis, thereby discouraging vegetation growth [88,89]. The irrigation zone is another typical region with low sensitivity to PRE variations (dominated by negative correlations), where irrigation attenuates the dependence of crop growth on PRE [90,91]. After the GTGP was implemented, the sensitivity of the LP vegetation to PRE increased, reminding those responsible for the development of sustainable ecological conservation policies to adapt to the regional water resources situation [92].
Overall, increasing TEM widely promoted vegetation growth in the LP. The possible reasons for this are that the warming climate prolonged the vegetation growing season [18,93] and facilitated soil organic matter and nutrient availability [94,95], thereby promoting vegetation growth. A majority of the vegetated regions in the dry zone exhibited a notable inverse relationship between the kNDVI and TEM. Over the past 40 years, the LP has experienced a significant increase in TEM but slight changes in PRE, resulting in increased evaporation and accelerated soil moisture depletion, thus limiting vegetation growth. This phenomenon remains valid for SR as well, as enhanced SR also amplifies regional evaporation and exacerbates water deficits. Moreover, it is noteworthy that higher climate variables do not necessarily mean continuous acceleration of vegetation growth despite the significant correlation between vegetation and kNDVI. Put simply, there is a set limit for how much climate can affect vegetation [96,97]. Once this limit is surpassed, the relationship between vegetation and climate may turn adverse.

4.3. Potential and Uncertainty

Our study period covers the longest available NDVI series (from 1982 to 2022), and the kNDVI was calculated to minimize the effects of aerosol and soil background on different types of vegetation cover for the NDVI. Furthermore, we systematically evaluated the spatiotemporal vegetation (climate) dynamics in different climatic zones of the LP during different periods (including the periods before and after the implementation of GTGP) using various statistical methods and further deeply explored the response of vegetation dynamics to key climatic factors. The results of this research offer fresh insights for tackling the risk of vegetation due to climate and promoting sustainable ecological development in the LP region amidst the changing climate. However, some limitations need to be noted. Firstly, more data sources and data fusion methods may be employed to improve spatial resolution and reduce uncertainty. Secondly, future studies should consider incorporating other climate variables, such as the deficit of water vapor pressure (VPD). Additionally, this study examines the correlation between the kNDVI and concurrent climate factors, with a notable absence of research on the temporal impacts of climate on vegetation (such as climate time lag and cumulative effects), which will be addressed in our forthcoming research.

5. Conclusions

This study conducted a systematic analysis of vegetation and climate change in the LP by utilizing kNDVI and important climate variables (PRE, TEM, and SR) data spanning from 1982 to 2022. It examined the spatiotemporal patterns of vegetation and climate change, investigated how vegetation responds differently to climate variations, and determined the primary climatic factors that influence vegetation dynamics. The studies were conducted at various times (prior to and following the implementation of GTGP, as well as throughout the entire duration of the study) and in diverse climate regions (dry, semi-dry, and semi-moist zones). The main findings are summarized below.
Throughout the year, except for the kNDVI, which exhibits a bimodal pattern in the semi-humid region (with peaks in May and August), all climatic zones displayed unimodal distributions of the kNDVI and climatic factors. This highlights the significant impact of local farming methods on vegetation changes. Over the last forty years, there has been significant spatial variation in the evolution of vegetation changes and climate conditions across LP. These variations have been particularly evident in distinct phases identified by the GTGP. Specifically, more than 90% of the LP underwent significant greening, with a kNDVI slope of 0.0020 yr−1 (p < 0.001). Compared with the pre-GTGP period, the kNDVI slope of the LP increased threefold during the GTGP period, and the significantly greened area expanded by 54.9%, especially in the semi-arid areas. These findings emphasize the remarkable effectiveness of the GTGP in improving the vegetation conditions in the LP. Climate change in the LP is primarily characterized by significant warming and slight humidification, accompanied by a slight decrease in SR. Since the introduction of the GTGP, there has been a clear slowdown in the warming process, while the rates of PRE and SR increase have shown a notable rise. The arid and semi-arid zones saw a significant increase in PRE, benefiting approximately 75% of the vegetated areas in the LP. Increased TEM facilitated vegetation growth across 61% of the LP region while inhibiting vegetation growth in 4.9% of the area concentrated in the arid zone. Solar radiation, although exerting a limited influence, significantly affected 24.7% of the vegetated area. The GTGP’s implementation exacerbated the dependence of vegetation on PRE in the LP, with the area wherein the kNDVI and PRE were significantly positively correlated increasing by 44.6%. The key climatic variables discussed herein played a crucial role in explaining vegetation dynamics across 76% of the LP’s vegetated area over the past four decades. Precipitation has emerged as the dominant climatic driver, significantly impacting 67.1% of the relevant area, especially in the arid zone, followed by TEM and SR, covering 59% and 22.8% of the significantly influenced area, respectively. The findings offer a valuable understanding of the intricate connections between vegetation changes and climate in the LP, adding theoretical guidance to the advancement and adaptation of regional ecological conservation strategies in the face of global warming.

Author Contributions

Conceptualization, S.J. and C.Z.; Methodology, Q.Y. and S.J.; Software, Q.Y.; Validation, S.J. and C.Z.; Formal analysis, Q.H. and Q.Y.; Data curation, Q.Y.; Writing—original draft preparation, Q.H.; Writing—review and editing, C.Z. and S.J.; Visualization, Q.H. and Q.Y.; supervision, C.Z. and S.J.; Funding acquisition, Q.H. and S.J. All authors have read and agreed to the published version of the manuscript.

Funding

This research was funded by the National Natural Science Foundation of China (52279041 and 52309055), Fundamental Research Funds for the Central Universities (YJ202259), and the Sichuan Science and Technology Program (2023NZZJ0021, 2023YFN0024, and 2023NZZJ0015).

Data Availability Statement

The Global Vegetation Greenness (NDVI) from AVHRR GIMMS-3G+ (1982–2022) is available at https://daac.ornl.gov/cgi-bin/dsviewer.pl?ds_id=2187, accessed on 20 October 2023. The 1 km monthly precipitation dataset for China (1901–2022) is available at https://data.tpdc.ac.cn/zh-hans/data/faae7605-a0f2-4d18-b28f-5cee413766a2, accessed on 20 October 2023. The 1 km monthly mean temperature dataset for China (1901–2022) is available at https://data.tpdc.ac.cn/zh-hans/data/71ab4677-b66c-4fd1-a004-b2a541c4d5bf, accessed on 20 October 2023. The Terra Climate data are available at https://developers.google.com/earthengine/datasets/catalog/IDAHO_EPSCOR_TERRACLIMATE?hl=en, accessed on 20 October 2023.

Conflicts of Interest

The authors declare no conflicts of interest.

References

  1. Gu, Z.; Duan, X.; Shi, Y.; Li, Y.; Pan, X. Spatiotemporal variation in vegetation coverage and its response to climatic factors in the Red River Basin, China. Ecol. Indic. 2018, 93, 54–64. [Google Scholar] [CrossRef]
  2. Chen, J.M.; Ju, W.; Ciais, P.; Viovy, N.; Liu, R.; Liu, Y.; Lu, X. Vegetation structural change since 1981 significantly enhanced the terrestrial carbon sink. Nat. Commun. 2019, 10, 4259. [Google Scholar] [CrossRef]
  3. Xue, J.; Gui, D.; Lei, J.; Sun, H.; Zeng, F.; Mao, D.; Jin, Q.; Liu, Y. Oasification: An unable evasive process in fighting against desertification for the sustainable development of arid and semiarid regions of China. Catena 2019, 179, 197–209. [Google Scholar] [CrossRef]
  4. Wang, X.; Dong, X.; Liu, H.; Wei, H.; Fan, W.; Lu, N.; Xu, Z.; Ren, J.; Xing, K. Linking land use change, ecosystem services and human well-being: A case study of the Manas River Basin of Xinjiang, China. Ecosyst. Serv. 2017, 27, 113–123. [Google Scholar] [CrossRef]
  5. Gbohoui, Y.P.; Paturel, J.-E.; Tazen, F.; Mounirou, L.A.; Yonaba, R.; Karambiri, H.; Yacouba, H. Impacts of climate and environmental changes on water resources: A multi-scale study based on Nakanbé nested watersheds in West African Sahel. J. Hydrol. Reg. Stud. 2021, 35, 100828. [Google Scholar] [CrossRef]
  6. Piao, S.; Wang, X.; Park, T.; Chen, C.; Lian, X.; He, Y.; Bjerke, J.W.; Chen, A.; Ciais, P.; Tømmervik, H.; et al. Characteristics, drivers and feedbacks of global greening. Nat. Rev. Earth Environ. 2020, 1, 14–27. [Google Scholar] [CrossRef]
  7. Zhu, Z.; Piao, S.; Myneni, R.B.; Huang, M.; Zeng, Z.; Canadell, J.G.; Ciais, P.; Sitch, S.; Friedlingstein, P.; Arneth, A.; et al. Greening of the Earth and its drivers. Nat. Clim. Chang. 2016, 6, 791–795. [Google Scholar] [CrossRef]
  8. Heimann, M.; Reichstein, M. Terrestrial ecosystem carbon dynamics and climate feedbacks. Nature 2008, 451, 289–292. [Google Scholar] [CrossRef] [PubMed]
  9. Arneth, A.; Harrison, S.P.; Zaehle, S.; Tsigaridis, K.; Menon, S.; Bartlein, P.; Feichter, J.; Korhola, A.; Kulmala, M.; O’donnell, D. Terrestrial biogeochemical feedbacks in the climate system. Nat. Geosci. 2010, 3, 525–532. [Google Scholar] [CrossRef]
  10. Forzieri, G.; Alkama, R.; Miralles, D.G.; Cescatti, A. Satellites reveal contrasting responses of regional climate to the widespread greening of Earth. Science 2017, 356, 1180–1184. [Google Scholar] [CrossRef] [PubMed]
  11. Zeng, Z.; Piao, S.; Li, L.Z.X.; Zhou, L.; Ciais, P.; Wang, T.; Li, Y.; Lian, X.; Wood, E.F.; Friedlingstein, P.; et al. Climate mitigation from vegetation biophysical feedbacks during the past three decades. Nat. Clim. Chang. 2017, 7, 432–436. [Google Scholar] [CrossRef]
  12. Li, C.; Fu, B.; Wang, S.; Stringer, L.C.; Wang, Y.; Li, Z.; Liu, Y.; Zhou, W. Drivers and impacts of changes in China’s drylands. Nat. Rev. Earth Environ. 2021, 2, 858–873. [Google Scholar] [CrossRef]
  13. Morecroft, M.D.; Duffield, S.; Harley, M.; Pearce-Higgins, J.W.; Stevens, N.; Watts, O.; Whitaker, J. Measuring the success of climate change adaptation and mitigation in terrestrial ecosystems. Science 2019, 366, eaaw9256. [Google Scholar] [CrossRef] [PubMed]
  14. Sun, R.; Chen, S.; Su, H. Climate dynamics of the spatiotemporal changes of vegetation NDVI in northern China from 1982 to 2015. Remote Sens. 2021, 13, 187. [Google Scholar] [CrossRef]
  15. Cao, D.; Zhang, J.; Xun, L.; Yang, S.; Wang, J.; Yao, F. Spatiotemporal variations of global terrestrial vegetation climate potential productivity under climate change. Sci. Total Environ. 2021, 770, 145320. [Google Scholar] [CrossRef] [PubMed]
  16. Dymond, C.C.; Johnson, E.A. Mapping vegetation spatial patterns from modeled water, temperature and solar radiation gradients. ISPRS J. Photogramm. Remote Sens. 2002, 57, 69–85. [Google Scholar] [CrossRef]
  17. Hu, Y.; Jiang, L.; Wang, S.; Zhang, Z.; Luo, C.; Bao, X.; Niu, H.; Xu, G.; Duan, J.; Zhu, X. The temperature sensitivity of ecosystem respiration to climate change in an alpine meadow on the Tibet plateau: A reciprocal translocation experiment. Agric. For. Meteorol. 2016, 216, 93–104. [Google Scholar] [CrossRef]
  18. Jeong, S.J.; Ho, C.H.; Gim, H.J.; Brown, M.E. Phenology shifts at start vs. end of growing season in temperate vegetation over the Northern Hemisphere for the period 1982–2008. Glob. Chang. Biol. 2011, 17, 2385–2399. [Google Scholar] [CrossRef]
  19. Zhao, J.; Zhang, H.; Zhang, Z.; Guo, X.; Li, X.; Chen, C. Spatial and temporal changes in vegetation phenology at middle and high latitudes of the Northern Hemisphere over the past three decades. Remote Sens. 2015, 7, 10973–10995. [Google Scholar] [CrossRef]
  20. Vicente-Serrano, S.M.; Gouveia, C.; Camarero, J.J.; Beguería, S.; Trigo, R.; López-Moreno, J.I.; Azorín-Molina, C.; Pasho, E.; Lorenzo-Lacruz, J.; Revuelto, J. Response of vegetation to drought time-scales across global land biomes. Proc. Natl. Acad. Sci. USA 2013, 110, 52–57. [Google Scholar] [CrossRef]
  21. Zhan, C.; Liang, C.; Zhao, L.; Jiang, S.; Niu, K.; Zhang, Y. Drought-related cumulative and time-lag effects on vegetation dynamics across the Yellow River Basin, China. Ecol. Indic. 2022, 143, 109409. [Google Scholar] [CrossRef]
  22. Zhan, C.; Liang, C.; Zhao, L.; Jiang, S.; Niu, K.; Zhang, Y.; Cheng, L. Detection and attribution of vegetation dynamics in the National Barrier Zone of China by considering climate temporal effects. Int. J. Appl. Earth Obs. Geoinf. 2023, 116, 103140. [Google Scholar] [CrossRef]
  23. Wang, H.; Liu, D.; Lin, H.; Montenegro, A.; Zhu, X. NDVI and vegetation phenology dynamics under the influence of sunshine duration on the Tibetan plateau. Int. J. Climatol. 2015, 35, 687–698. [Google Scholar] [CrossRef]
  24. Malhi, Y.; Franklin, J.; Seddon, N.; Solan, M.; Turner, M.G.; Field, C.B.; Knowlton, N. Climate change and ecosystems: Threats, opportunities and solutions. Philos. Trans. R. Soc. B 2020, 375, 20190104. [Google Scholar] [CrossRef]
  25. Zhong, L.; Ma, Y.; Xue, Y.; Piao, S. Climate change trends and impacts on vegetation greening over the Tibetan Plateau. J. Geophys. Res. Atmos. 2019, 124, 7540–7552. [Google Scholar] [CrossRef]
  26. Luo, M.; Sa, C.; Meng, F.; Duan, Y.; Liu, T.; Bao, Y. Assessing extreme climatic changes on a monthly scale and their implications for vegetation in Central Asia. J. Clean. Prod. 2020, 271, 122396. [Google Scholar] [CrossRef]
  27. Wu, L.; Ma, X.; Dou, X.; Zhu, J.; Zhao, C. Impacts of climate change on vegetation phenology and net primary productivity in arid Central Asia. Sci. Total Environ. 2021, 796, 149055. [Google Scholar] [CrossRef]
  28. Zhan, C.; Liang, C.; Zhao, L.; Jiang, S.; Niu, K.; Zhang, Y.; Cheng, L. Vegetation dynamics and its response to climate change in the Yellow River Basin, China. Front. Environ. Sci. 2022, 10, 892747. [Google Scholar] [CrossRef]
  29. Zeng, Y.; Hao, D.; Huete, A.; Dechant, B.; Berry, J.; Chen, J.M.; Joiner, J.; Frankenberg, C.; Bond-Lamberty, B.; Ryu, Y. Optical vegetation indices for monitoring terrestrial ecosystems globally. Nat. Rev. Earth Environ. 2022, 3, 477–493. [Google Scholar] [CrossRef]
  30. Ma, X.; Huete, A.; Tran, N.N. Interaction of seasonal sun-angle and savanna phenology observed and modelled using MODIS. Remote Sens. 2019, 11, 1398. [Google Scholar] [CrossRef]
  31. Misra, G.; Cawkwell, F.; Wingler, A. Status of phenological research using Sentinel-2 data: A review. Remote Sens. 2020, 12, 2760. [Google Scholar] [CrossRef]
  32. De Beurs, K.M.; Henebry, G.M.; Owsley, B.C.; Sokolik, I. Using multiple remote sensing perspectives to identify and attribute land surface dynamics in Central Asia 2001–2013. Remote Sens. Environ. 2015, 170, 48–61. [Google Scholar] [CrossRef]
  33. Stagakis, S.; Markos, N.; Sykioti, O.; Kyparissis, A. Monitoring canopy biophysical and biochemical parameters in ecosystem scale using satellite hyperspectral imagery: An application on a Phlomis fruticosa Mediterranean ecosystem using multiangular CHRIS/PROBA observations. Remote Sens. Environ. 2010, 114, 977–994. [Google Scholar] [CrossRef]
  34. Berni, J.A.; Zarco-Tejada, P.J.; Suárez, L.; Fereres, E. Thermal and narrowband multispectral remote sensing for vegetation monitoring from an unmanned aerial vehicle. IEEE Trans. Geosci. Remote Sens. 2009, 47, 722–738. [Google Scholar] [CrossRef]
  35. Le Maire, G.; François, C.; Soudani, K.; Berveiller, D.; Pontailler, J.-Y.; Bréda, N.; Genet, H.; Davi, H.; Dufrêne, E. Calibration and validation of hyperspectral indices for the estimation of broadleaved forest leaf chlorophyll content, leaf mass per area, leaf area index and leaf canopy biomass. Remote Sens. Environ. 2008, 112, 3846–3864. [Google Scholar] [CrossRef]
  36. Thenkabail, P.S.; Smith, R.B.; De Pauw, E. Hyperspectral vegetation indices and their relationships with agricultural crop characteristics. Remote Sens. Environ. 2000, 71, 158–182. [Google Scholar] [CrossRef]
  37. Gao, X.; Huete, A.R.; Ni, W.; Miura, T. Optical–biophysical relationships of vegetation spectra without background contamination. Remote Sens. Environ. 2000, 74, 609–620. [Google Scholar] [CrossRef]
  38. Tsutsumida, N.; Shin, N.; Miura, T. Evaluation of land surface phenology for autumn leaf color change based on citizen reports across Japan. Remote Sens. 2022, 14, 2017. [Google Scholar] [CrossRef]
  39. Matsushita, B.; Yang, W.; Chen, J.; Onda, Y.; Qiu, G. Sensitivity of the enhanced vegetation index (EVI) and normalized difference vegetation index (NDVI) to topographic effects: A case study in high-density cypress forest. Sensors 2007, 7, 2636–2651. [Google Scholar] [CrossRef]
  40. Camps-Valls, G.; Campos-Taberner, M.; Moreno-Martínez, Á.; Walther, S.; Duveiller, G.; Cescatti, A.; Mahecha, M.D.; Muñoz-Marí, J.; García-Haro, F.J.; Guanter, L. A unified vegetation index for quantifying the terrestrial biosphere. Sci. Adv. 2021, 7, eabc7447. [Google Scholar] [CrossRef]
  41. Wang, Q.; Moreno-Martínez, Á.; Muñoz-Marí, J.; Campos-Taberner, M.; Camps-Valls, G. Estimation of vegetation traits with kernel NDVI. ISPRS J. Photogramm. Remote Sens. 2023, 195, 408–417. [Google Scholar] [CrossRef]
  42. Feng, X.; Tian, J.; Wang, Y.; Wu, J.; Liu, J.; Ya, Q.; Li, Z. Spatio-Temporal Variation and Climatic Driving Factors of Vegetation Coverage in the Yellow River Basin from 2001 to 2020 Based on kNDVI. Forests 2023, 14, 620. [Google Scholar] [CrossRef]
  43. Liu, T.; Zhang, Q.; Li, T.; Zhang, K. Dynamic Vegetation Responses to Climate and Land Use Changes over the Inner Mongolia Reach of the Yellow River Basin, China. Remote Sens. 2023, 15, 3531. [Google Scholar] [CrossRef]
  44. Forzieri, G.; Dakos, V.; McDowell, N.G.; Ramdane, A.; Cescatti, A. Emerging signals of declining forest resilience under climate change. Nature 2022, 608, 534–539. [Google Scholar] [CrossRef]
  45. Huang, L. Advances and perspectives on soil water research in China’s Loess Plateau. Earth Sci. Rev. 2019, 199, 102962. [Google Scholar] [CrossRef]
  46. Chen, C.; Zhao, G.; Zhang, Y.; Bai, Y.; Tian, P.; Mu, X.; Tian, X. Linkages between soil erosion and long-term changes of landscape pattern in a small watershed on the Chinese Loess Plateau. Catena 2023, 220, 106659. [Google Scholar] [CrossRef]
  47. Ni, X.; Guo, W.; Li, X.; Li, S. Heterogeneity of increases in net primary production under intensified human activity and climate variability on the Loess Plateau of China. Remote Sens. 2022, 14, 4706. [Google Scholar] [CrossRef]
  48. Wu, X.; Wang, S.; Fu, B.; Liu, J. Spatial variation and influencing factors of the effectiveness of afforestation in China’s Loess Plateau. Sci. Total Environ. 2021, 771, 144904. [Google Scholar] [CrossRef] [PubMed]
  49. Guo, W.; He, H.; Li, X.; Zeng, W. Greater Greening Trend in the Loess Plateau of China Inferred from Long-Term Remote Sensing Data: Patterns, Causes and Implications. Forests 2022, 13, 1630. [Google Scholar] [CrossRef]
  50. Zhao, A.; Yu, Q.; Feng, L.; Zhang, A.; Pei, T. Evaluating the cumulative and time-lag effects of drought on grassland vegetation: A case study in the Chinese Loess Plateau. J. Environ. Manag. 2020, 261, 110214. [Google Scholar] [CrossRef]
  51. Wang, L.; She, D.; Xia, J.; Meng, L.; Li, L. Revegetation affects the response of land surface phenology to climate in Loess Plateau, China. Sci. Total Environ. 2023, 860, 160383. [Google Scholar] [CrossRef] [PubMed]
  52. Dong, Y.; Yin, D.; Li, X.; Huang, J.; Su, W.; Li, X.; Wang, H. Spatial–temporal evolution of vegetation NDVI in association with climatic, environmental and anthropogenic factors in the loess plateau, China during 2000–2015: Quantitative analysis based on geographical detector model. Remote Sens. 2021, 13, 4380. [Google Scholar] [CrossRef]
  53. Chen, S.; Zhang, Q.; Chen, Y.; Zhou, H.; Xiang, Y.; Liu, Z.; Hou, Y. Vegetation Change and Eco-Environmental Quality Evaluation in the Loess Plateau of China from 2000 to 2020. Remote Sens. 2023, 15, 424. [Google Scholar] [CrossRef]
  54. Niu, Z.; He, H.; Yu, P.; Sitch, S.; Zhao, Y.; Wang, Y.; Jain, A.K.; Vuichard, N.; Si, B. Climate Change and CO2 Fertilization Have Played Important Roles in the Recent Decadal Vegetation Greening Trend on the Chinese Loess Plateau. Remote Sens. 2023, 15, 1233. [Google Scholar] [CrossRef]
  55. Xiu, L.; Yao, X.; Chen, M.; Yan, C. Effect of ecological construction engineering on vegetation restoration: A case study of the loess plateau. Remote Sens. 2021, 13, 1407. [Google Scholar] [CrossRef]
  56. Song, Y.; Wang, Y.; Jin, L.; Shi, W.; Aryal, J.; Comber, A. Quantitative contribution of the Grain for Green Program to vegetation greening and its spatiotemporal variation across the Chinese Loess Plateau. Land Degrad. Dev. 2022, 33, 1878–1891. [Google Scholar] [CrossRef]
  57. Zheng, J.-Y.; Yin, Y.; Li, B. A new scheme for climate regionalization in China. Acta Geogr. Sin. 2010, 65, 3–12. [Google Scholar]
  58. Zhao, A.; Zhang, A.; Cao, S.; Liu, X.; Liu, J.; Cheng, D. Responses of vegetation productivity to multi-scale drought in Loess Plateau, China. Catena 2018, 163, 165–171. [Google Scholar] [CrossRef]
  59. Xie, B.; Jia, X.; Qin, Z.; Shen, J.; Chang, Q. Vegetation dynamics and climate change on the Loess Plateau, China: 1982–2011. Reg. Environ. Chang. 2016, 16, 1583–1594. [Google Scholar] [CrossRef]
  60. Hou, X. Vegetation atlas of China. In The Editorial Board of Vegetation Map of China; Chinese Academy of Science: Beijing, China, 2001; pp. 113–124. [Google Scholar]
  61. Pinzon, J.E.; Pak, E.W.; Tucker, C.J.; Bhatt, U.S.; Frost, G.V.; Macander, M.J. Global Vegetation Greenness (NDVI) from AVHRR GIMMS-3G+, 1981–2022; ORNL DAAC: Oak Ridge, TN, USA, 2023. [Google Scholar] [CrossRef]
  62. Cai, Y.; Zhang, F.; Duan, P.; Jim, C.Y.; Chan, N.W.; Shi, J.; Liu, C.; Wang, J.; Bahtebay, J.; Ma, X. Vegetation cover changes in China induced by ecological restoration-protection projects and land-use changes from 2000 to 2020. Catena 2022, 217, 106530. [Google Scholar] [CrossRef]
  63. Peng, S.; Ding, Y.; Liu, W.; Li, Z. 1 km monthly temperature and precipitation dataset for China from 1901 to 2017. Earth Syst. Sci. Data 2019, 11, 1931–1946. [Google Scholar] [CrossRef]
  64. Abatzoglou, J.T.; Dobrowski, S.Z.; Parks, S.A.; Hegewisch, K.C. TerraClimate, a high-resolution global dataset of monthly climate and climatic water balance from 1958–2015. Sci. Data 2018, 5, 170191. [Google Scholar] [CrossRef]
  65. Sen, P.K. Estimates of the regression coefficient based on Kendall’s tau. J. Am. Stat. Assoc. 1968, 63, 1379–1389. [Google Scholar] [CrossRef]
  66. Mann, H.B. Nonparametric tests against trend. Econom. J. Econom. Soc. 1945, 13, 245–259. [Google Scholar] [CrossRef]
  67. Pohlert, T. Trend: Non-Parametric Trend Tests and Change-Point Detection. R Package Version 1.1.5. 2023. Available online: https://CRAN.R-project.org/package=trend (accessed on 20 October 2023).
  68. Hurst, H.E. Long-term storage capacity of reservoirs. Trans. Am. Soc. Civ. Eng. 1951, 116, 770–799. [Google Scholar] [CrossRef]
  69. Green, P.E. Mathematical Tools for Applied Multivariate Analysis; Academic Press: Cambridge, MA, USA, 2014. [Google Scholar]
  70. Liu, Y.; Wang, X.; Guo, M.; Tani, H.; Matsuoka, N.; Matsumura, S. Spatial and temporal relationships among NDVI, climate factors, and land cover changes in Northeast Asia from 1982 to 2009. GISci. Remote Sens. 2011, 48, 371–393. [Google Scholar] [CrossRef]
  71. Duo, A.; Zhao, W.; Gong, Z.; Zhang, M.; Fan, Y. Temporal analysis of climate change and its relationship with vegetation cover on the north China plain from 1981 to 2013. Acta Ecol. Sin 2017, 37, 576–592. [Google Scholar]
  72. Shi, S.; Yu, J.; Wang, F.; Wang, P.; Zhang, Y.; Jin, K. Quantitative contributions of climate change and human activities to vegetation changes over multiple time scales on the Loess Plateau. Sci. Total Environ. 2021, 755, 142419. [Google Scholar] [CrossRef] [PubMed]
  73. Yang, C.; Fu, M.; Feng, D.; Sun, Y.; Zhai, G. Spatiotemporal changes in vegetation cover and its influencing factors in the loess Plateau of China based on the geographically weighted regression model. Forests 2021, 12, 673. [Google Scholar] [CrossRef]
  74. Li, W.; Zhou, J.; Xu, Z.; Liang, Y.; Shi, J.; Zhao, X. Climate impact greater on vegetation NPP but human enhance benefits after the Grain for Green Program in Loess Plateau. Ecol. Indic. 2023, 157, 111201. [Google Scholar] [CrossRef]
  75. Liu, K.; Li, X.; Wang, S.; Zhang, X. Unrevealing past and future vegetation restoration on the Loess Plateau and its impact on terrestrial water storage. J. Hydrol. 2023, 617, 129021. [Google Scholar] [CrossRef]
  76. Liu, Y.; Yang, P.; Zhang, Z.; Zhang, W.; Wang, Z.; Zhang, Z.; Ren, H.; Zhou, R.; Wen, Z.; Hu, T. Diverse responses of grassland dynamics to climatic and anthropogenic factors across the different time scale in China. Ecol. Indic. 2021, 132, 108341. [Google Scholar] [CrossRef]
  77. Fu, B.; Wu, X.; Wang, Z.; Wu, X.; Wang, S. Coupling human and natural systems for sustainability: Experience from China’s Loess Plateau. Earth Syst. Dyn. 2022, 13, 795–808. [Google Scholar] [CrossRef]
  78. Kou, P.; Xu, Q.; Jin, Z.; Yunus, A.P.; Luo, X.; Liu, M. Complex anthropogenic interaction on vegetation greening in the Chinese Loess Plateau. Sci. Total Environ. 2021, 778, 146065. [Google Scholar] [CrossRef] [PubMed]
  79. Liu, J.; Wang, H.; Tang, B.; Hui, L.; Zhang, W.; Zhang, L.; Jiao, L. Analysis of Temporal and Spatial Dynamics of Ecosystem Services and Trade-Offs/Synergies during Urbanization in the Loess Plateau, China. Land 2023, 12, 2136. [Google Scholar] [CrossRef]
  80. Zhang, Q.; Yang, J.; Wang, W.; Ma, P.; Lu, G.; Liu, X.; Yu, H.; Fang, F. Climatic warming and humidification in the arid region of Northwest China: Multi-scale characteristics and impacts on ecological vegetation. J. Meteorol. Res. 2021, 35, 113–127. [Google Scholar] [CrossRef]
  81. Yang, J.; Zhang, Q.; Lu, G.; Liu, X.; Wang, Y.; Wang, D.; Liu, W.; Yue, P.; Zhu, B.; Duan, X. Climate transition from warm-dry to warm-wet in Eastern Northwest China. Atmosphere 2021, 12, 548. [Google Scholar] [CrossRef]
  82. Djebou, D.C.S.; Singh, V.P.; Frauenfeld, O.W. Vegetation response to precipitation across the aridity gradient of the southwestern United states. J. Arid. Environ. 2015, 115, 35–43. [Google Scholar] [CrossRef]
  83. Xu, H.; Wang, X.; Zhao, C.; Yang, X. Diverse responses of vegetation growth to meteorological drought across climate zones and land biomes in northern China from 1981 to 2014. Agric. For. Meteorol. 2018, 262, 1–13. [Google Scholar] [CrossRef]
  84. Cheng, R.R.; Chen, Q.W.; Zhang, J.G.; Shi, W.Y.; Li, G.; Du, S. Soil moisture variations in response to precipitation in different vegetation types: A multi-year study in the loess hilly region in China. Ecohydrology 2020, 13, e2196. [Google Scholar] [CrossRef]
  85. Fan, J.; Wang, Q.; Jones, S.B.; Shao, M. Soil water depletion and recharge under different land cover in China’s Loess Plateau. Ecohydrology 2016, 9, 396–406. [Google Scholar] [CrossRef]
  86. Fang, W.; Huang, S.; Huang, Q.; Huang, G.; Wang, H.; Leng, G.; Wang, L.; Li, P.; Ma, L. Bivariate probabilistic quantification of drought impacts on terrestrial vegetation dynamics in mainland China. J. Hydrol. 2019, 577, 123980. [Google Scholar] [CrossRef]
  87. Brunner, I.; Herzog, C.; Dawes, M.A.; Arend, M.; Sperisen, C. How tree roots respond to drought. Front. Plant Sci. 2015, 6, 547. [Google Scholar] [CrossRef]
  88. Yamasoe, M.A.; Von Randow, C.; Manzi, A.O.; Schafer, J.S.; Eck, T.F.; Holben, B.N. Effect of smoke and clouds on the transmissivity of photosynthetically active radiation inside the canopy. Atmos. Chem. Phys. 2006, 6, 1645–1656. [Google Scholar] [CrossRef]
  89. Durand, M.; Murchie, E.H.; Lindfors, A.V.; Urban, O.; Aphalo, P.J.; Robson, T.M. Diffuse solar radiation and canopy photosynthesis in a changing environment. Agric. For. Meteorol. 2021, 311, 108684. [Google Scholar] [CrossRef]
  90. Miao, C.; Yang, L.; Chen, X.; Gao, Y. The vegetation cover dynamics (1982–2006) in different erosion regions of the Yellow River Basin, China. Land Degrad. Dev. 2012, 23, 62–71. [Google Scholar] [CrossRef]
  91. Deng, X.-P.; Shan, L.; Zhang, H.; Turner, N.C. Improving agricultural water use efficiency in arid and semiarid areas of China. Agric. Water Manag. 2006, 80, 23–40. [Google Scholar] [CrossRef]
  92. Feng, X.; Fu, B.; Piao, S.; Wang, S.; Ciais, P.; Zeng, Z.; Lü, Y.; Zeng, Y.; Li, Y.; Jiang, X. Revegetation in China’s Loess Plateau is approaching sustainable water resource limits. Nat. Clim. Chang. 2016, 6, 1019–1022. [Google Scholar] [CrossRef]
  93. Liu, H.; Lu, C.; Wang, S.; Ren, F.; Wang, H. Climate warming extends growing season but not reproductive phase of terrestrial plants. Glob. Ecol. Biogeogr. 2021, 30, 950–960. [Google Scholar] [CrossRef]
  94. Brinkman, R.; Sombroek, W.G. The effects of global change on soil conditions in relation to plant growth and food production. Glob. Clim. Chang. Agric. Prod. 1996, 49–63. Available online: https://www.fao.org/3/w5183e/w5183e05.htm (accessed on 20 October 2023).
  95. Smith, P.; Fang, C.; Dawson, J.J.; Moncrieff, J.B. Impact of global warming on soil organic carbon. Adv. Agron. 2008, 97, 1–43. [Google Scholar]
  96. Beigaitė, R.; Tang, H.; Bryn, A.; Skarpaas, O.; Stordal, F.; Bjerke, J.W.; Žliobaitė, I. Identifying climate thresholds for dominant natural vegetation types at the global scale using machine learning: Average climate versus extremes. Glob. Chang. Biol. 2022, 28, 3557–3579. [Google Scholar] [CrossRef] [PubMed]
  97. Berdugo, M.; Delgado-Baquerizo, M.; Soliveres, S.; Hernández-Clemente, R.; Zhao, Y.; Gaitán, J.J.; Gross, N.; Saiz, H.; Maire, V.; Lehmann, A. Global ecosystem thresholds driven by aridity. Science 2020, 367, 787–790. [Google Scholar] [CrossRef] [PubMed]
Figure 1. Geographic maps depicting (a) the spatial positioning, (b) the topographical and climatic classification, and (c) the dispersion of the main vegetation categories on the Loess Plateau. Topographical data were obtained from Digital Elevation Models (DEMs) of the Shuttle Radar Topography Mission (SRTM) with 90 m spatial resolution. The land use data were obtained from the “China Multi-Period Land Use Remote Monitoring Data Set (CNLUCC)” provided by the Resource and Environment Science and Data Center of the Chinese Academy of Sciences (CAS).
Forests 15 00471 g001
Figure 2. Intra-annual variation in vegetation dynamics and climatic variables in different climatic zones of the Loess Plateau. (a) kNDVI; (b) precipitation; (c) temperature; (d) solar radiation. The dashed line indicates the average monthly value of the variable, while the shading indicates the variability of the monthly values.
Forests 15 00471 g002
Figure 3. Spatial patterns of growing season kNDVI and climatic variables in the Loess Plateau. (a) kNDVI; (b) precipitation; (c) temperature; (d) solar radiation.
Forests 15 00471 g003
Figure 4. Temporal trends for kNDVI and climate variables of the Loess Plateau during 1982−1999, 2000−2022, and 1982−2022. Data for the entire Loess Plateau and various climate zones are represented by dotted lines of different colors, with green, yellow, blue and purple solid lines corresponding to the Loess Plateau, arid, semi-arid and semi-humid zones, respectively. The red, green, and black dashed lines represent the slopes of change of variables during 1982−1999, 2000−2022, and 1982−2022, respectively.
Forests 15 00471 g004
Figure 5. The trends of climate variables and kNDVI in the Loess Plateau were analyzed for the periods 1982−1999, 2000−2022, and 1982−2022, focusing on their spatial patterns. kNDVI trends during (a) 1982−1999, (b) 2000−2022, and (c) 1982−2022; precipitation trends during (d) 1982−1999, (e) 2000−2022, and (f) 1982−2022; temperature trends during (g) 1982−1999, (h) 2000−2022, and (i) 1982−2022; solar radiation trends during (j) 1982−1999, (k) 2000−2022, and (l) 1982−2022.
Forests 15 00471 g005
Figure 6. Spatial patterns of the Hurst exponent for the kNDVI and climate variables in the Loess Plateau from 1982 to 2022. (a) kNDVI; (b) precipitation; (c) temperature; (d) solar radiation.
Forests 15 00471 g006
Figure 7. The spatial arrangement of partial correlation coefficients (PCC) between the kNDVI and climate factors in the Loess Plateau from 1982 to 1999, 2000 to 2022, and 1982 to 2022. Specifically, PCC between the kNDVI and precipitation during (a) 1982–1999, (b) 2000–2022, and (c) 1982–2022; PCC between the kNDVI and temperature during (d) 1982–1999, (e) 2000–2022, and (f) 1982–2022; PCC between the kNDVI and solar radiation during (g) 1982–1999, (h) 2000–2022, and (i) 1982–2022.
Forests 15 00471 g007
Figure 8. Spatial patterns of multiple correlation coefficients (MCC) between the kNDVI and climate variables during 1982−1999 (a), 2000−2022 (b), and 1982−2022 (c).
Forests 15 00471 g008
Figure 9. Spatial distributions of primary categories for climate factors affecting vegetation dynamics in the Loess Plateau from 1982 to 1999 (a), 2000 to 2022 (b), and 1982 to 2022 (c).
Forests 15 00471 g009
Table 1. Classification of vegetation dynamics-related climate drivers in the Loess Plateau.
NumberTypes of Driving FactorsClassification Rules
P C C k N D V I , P R E P C C k N D V I , T E M P C C k N D V I , S R M C C
1precipitation, temperature, and radiation t > t 0.05 t > t 0.05 t > t 0.05 F > F 0.05
2precipitation t > t 0.05 t t 0.05 t t 0.05
3temperature t t 0.05 t > t 0.05 t t 0.05
4radiation t t 0.05 t t 0.05 t > t 0.05
5precipitation and temperature t > t 0.05 t > t 0.05 t t 0.05
6precipitation and radiation t > t 0.05 t t 0.05 t > t 0.05
7temperature and radiation t t 0.05 t > t 0.05 t > t 0.05
8Weakly driven by precipitation, temperature, and radiation t t 0.05 t t 0.05 t t 0.05
9Driven by non-climate factors F F 0.05
Note: P C C k N D V I , P R E , P C C k N D V I , T E M , and P C C k N D V I , S R represent the partial correlation coefficients between the kNDVI and precipitation (PRE), temperature (TEM), and solar radiation (SR) obtained by controlling the other two variables, respectively. M C C represents the multiple correlation coefficient between the kNDVI and climate variables. t 0.05 and F 0.05 denote the significance levels of the t-test and F-test, respectively.
Disclaimer/Publisher’s Note: The statements, opinions and data contained in all publications are solely those of the individual author(s) and contributor(s) and not of MDPI and/or the editor(s). MDPI and/or the editor(s) disclaim responsibility for any injury to people or property resulting from any ideas, methods, instructions or products referred to in the content.

