Article

A Simulation Study of Noise Exposure in Sledge-Based Cable Yarding Operations

by
Stelian Alexandru Borz
1,
Piotr S. Mederski
2,* and
Mariusz Bembenek
2
1
Department of Forest Engineering, Forest Management Planning and Terrestrial Measurements, Faculty of Silviculture and Forest Engineering, Transilvania University of Brasov, Şirul Beethoven 1, 500123 Brasov, Romania
2
Department of Forest Utilization, Faculty of Forestry and Wood Technology, Poznań University of Life Sciences, Wojska Polskiego 71A, 60-625 Poznań, Poland
*
Author to whom correspondence should be addressed.
Forests 2024, 15(2), 360; https://doi.org/10.3390/f15020360
Submission received: 27 December 2023 / Revised: 8 February 2024 / Accepted: 10 February 2024 / Published: 13 February 2024
(This article belongs to the Special Issue Forest Mechanization and Harvesting—Trends and Perspectives)

Abstract

:
Ensuring the safety of forestry workers is a key challenge, particularly when working with partly mechanized harvesting systems. Cable yarding is typically used in steep terrain timber harvesting. For long-distance extraction, one of the few alternatives is to use sledge yarders, but these machines may expose workers to high doses of noise. The goal of this study was to model haulers’ exposure to noise in sledge-based cable yarding operations, based on a simulation approach that considered variable factors such as the yarding distance, lateral yarding distance, and average skyline height. Taken into consideration were 165 scenarios developed by examining the variation in yarding distance (500 to 1500 m, with a step of 100 m), lateral yarding distance (10 to 50 m, with a step of 10 m), and average skyline height above the ground (10, 15, and 20 m). The simulations assumed an 8-h working day with a break of 1 h. The models and statistics published by other studies were used to calculate the time consumption and number of work cycles completed within a working day. These data were used to compute the equivalent exposure to noise (LAeq) for each scenario, as well as for those work elements that were likely to expose the haulers to noise the most. The presented findings indicated that (i) the exposure to noise was higher than 100 dB(A), irrespective of variation in the considered factors; (ii) the trend in exposure was characterized by polynomials in relation to the extraction distance, and the magnitude of exposure was consistently affected by variation in the considered factors; and (iii) without hearing protection, the empty and loaded turns exposed workers to noise over the permissible limits. These findings strongly suggest the use of hearing protection when working in close proximity to sledge-based cable yarding operations. The methods proposed in this study in the form of simulation may help benchmark other forest operations.

1. Introduction

The wellbeing of human society largely depends on the provision of products and services by forests, of which wood accounts for a high share. Concerns about sustainable wood procurement have shaped views worldwide, including European forest policies, and scientific discourse has identified several key challenges in ensuring the sustainability of forest operations [1,2], since they are the main interface to wood procurement. There is a wide variety of methods and equipment used to harvest wood worldwide [3,4], and partly mechanized systems still account for an important share. Since most of these systems involve a certain degree of manual labor, the ergonomic conditions and workers’ exposure to harmful factors have been among the central concerns in science and practice [5].
Cable yarding is the backbone of steep terrain harvesting and accounts for an important share of operations in many parts of the world, including Europe [6,7,8]. It is mainly based on the use of tower yarders, of which processor tower yarders are the most advanced machines, being designed to extract and process trees into logs at the roadside landing [9]. Although they are common in steep terrain operations, tower yarders are typically expensive machines which require close to optimal conditions for economic use. As such, they are typically used on limited extraction distances, and many models are reliant on a well-developed forest road network, which should provide feasible inter-road distances [10].
From a limited set of cable yarding alternatives, one that is capable of working on long distances is that using sledge yarders. Although they have been replaced in many European countries by state-of-the-art tower yarders [9], sledge yarders can provide a feasible, if not the only, solution for steep terrain harvesting in low-access forests. These are machines powered by an engine mounted on a sledge-like steel frame. Self-traction capabilities, or other transportation equipment, can be used to transport the sledge to the rigging location; as the distance on which these cable yarders are used may reach up to 2 km, they may require additional support.
Although state-of-the-art tower yarders have been operational in Romania for more than 10 years, the use of sledge yarders is still common practice in mountain harvesting operations, mainly when there is a dominance of low-access forests. The most used operational configuration is that in which the sledge yarders are rigged for downhill extraction in a gravity-assisted system, because in this configuration they require fewer cables to operate (i.e., a skyline and a mainline). However, in such configurations, the sledge needs to be rigged uphill, somewhere close to the tail tree.
The use of these machines offers several advantages, such as a lower energy use in operations and lower soil disturbance, a rather low cycle time in some operational contexts, and acceptable productivity [11]. These features make sledge yarders good candidates for ensuring the economic and environmental sustainability of forest operations [12,13]. Among their disadvantages is the fact that all the workers undertake their activities outdoors, commonly in rough terrain, and at the expense of a high physical effort, particularly when considering cable work [14,15,16]. Also, for most of the machines in use, operational coordination is usually ensured by lower-level technologies such as radio communication.
Perhaps the biggest issue in some sledge yarding operations is the hauler’s potential exposure to noise. The worker should sit near the sledge and operate the machine by lever-like controls. This is achieved from a distance which places him very close to the engine. However, the exposure to noise (and vibration) largely comes from the construction of the machine itself since it may feature a speed-control device of the carriage which is based on aero-dynamic principles. The noise exposure at approximately 2 m from the machine has been found to be very high, particularly during the empty and loaded movement of the carriage on the skyline, accounting for more than 110 dB(A) [17]. This level of exposure should be of a high concern in terms of the health and safety of the workers. However, to our knowledge, no dedicated studies have been carried out to measure the level of noise pressure at worker ear level. In addition, noise exposure is typically based on the quantification of the exposure time [18,19,20,21], which should account for specific operational tasks, so as to paint an objective picture of the exposure figures that are found by studies. Unfortunately, a given distribution of tasks during a working day only provides figures on noise exposure for that kind of task distribution. This is because factors such as the operational variables (i.e., yarding distance, lateral yarding distance, and payload size) and lateral yarding methods are highly variable from one stand and felling type to another, while they may affect the distribution of time required for given tasks, and the distribution of the share of tasks within the working day; these are typical for those forest operations that involve transportation processes. In addition, different tools or machine-based tasks may be characterized by different exposure levels [18,22], which is further complicated by their degree of utilization. All these lead to difficulties in accurately characterizing the noise exposure for a given machine type, and most of the studies carried out so far have considered limited sets of conditions for evaluating noise exposure. In this context, it would be of considerable value if a simulation approach could be used to characterize the exposure to noise, starting with a limited set of data and knowledge about the studied processes.
The goal of this study was to model haulers’ exposure to noise in sledge-based cable yarding operations, based on a simulation approach that considered variable factors: the yarding distance, lateral yarding distance, and average skyline height. In particular, the aim was to (i) source raw event-based data on the exposure to noise and characterize the distribution of exposure to noise in sledge-based cable yarding operations, (ii) analyze by simulation the effect on noise exposure of variation in the considered factors, and (iii) compare the level of noise exposure found by the study against the thresholds set in various standards implemented across the world.

2. Materials and Methods
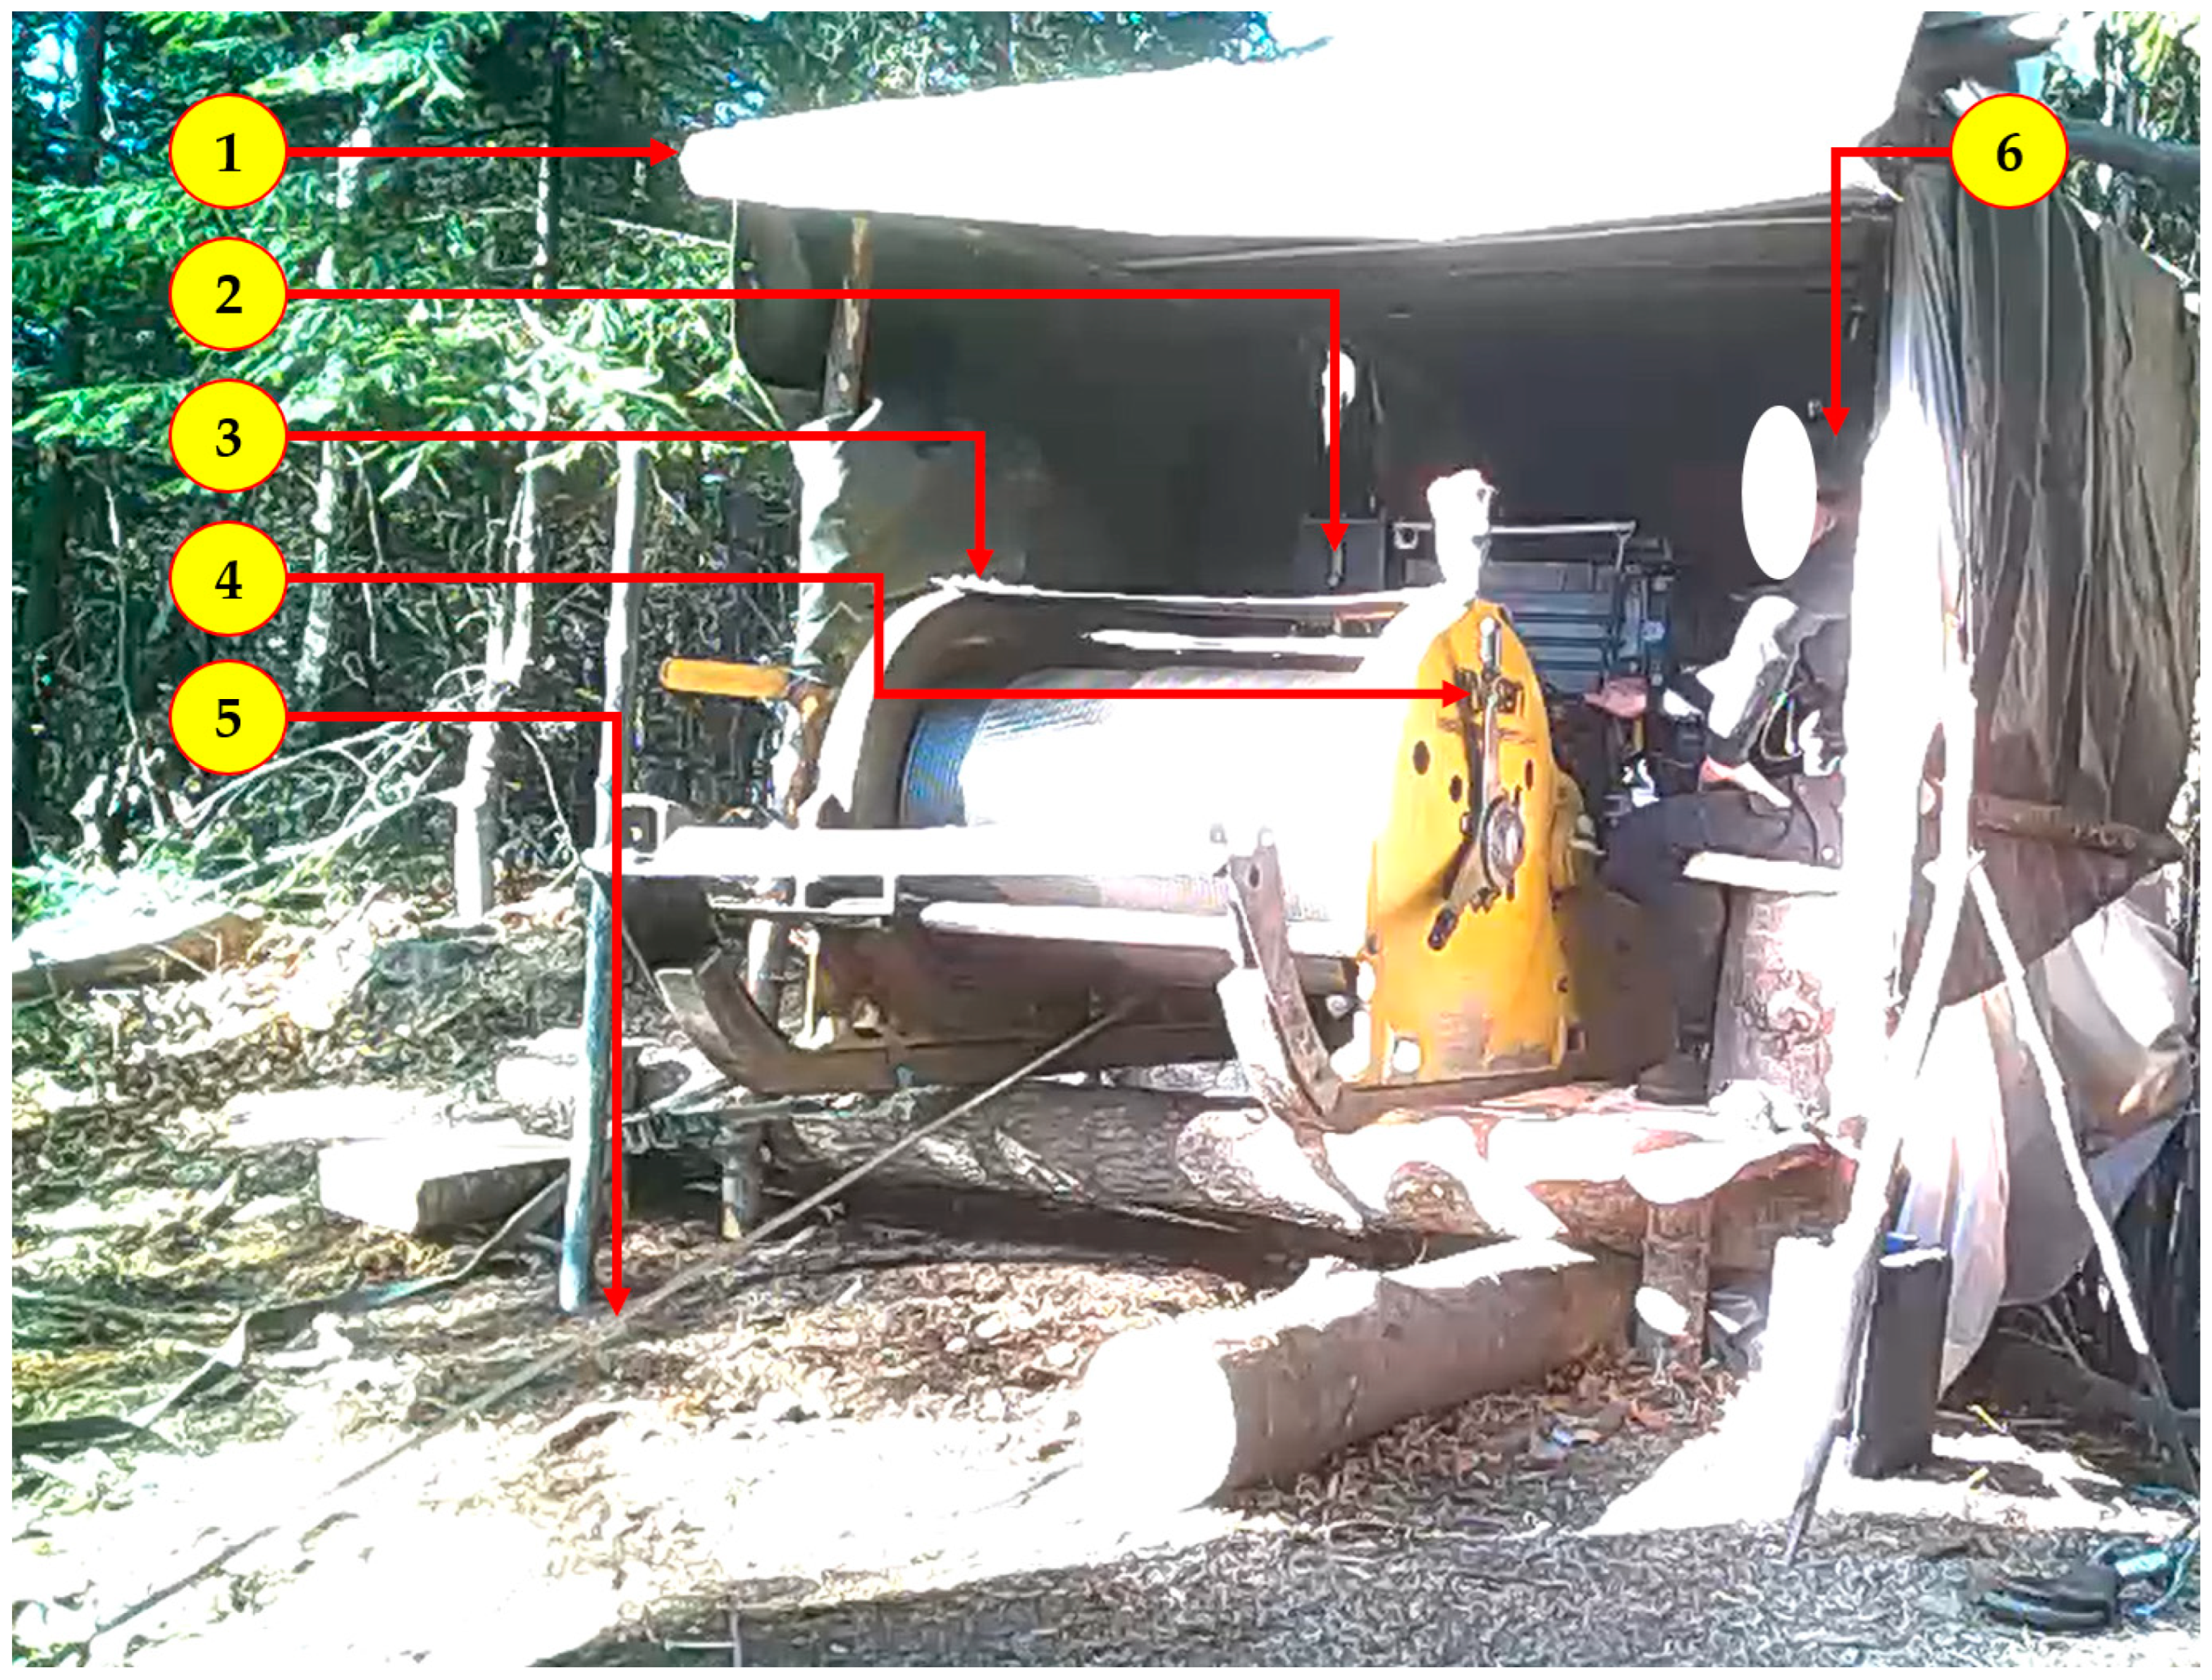
2.1. Data Sourcing

The data on actual exposure to noise and time were collected for a sledge-based cable yarder using the equipment, methods, and protocols described by Cheţa et al. [22]. This covered close to 7 h of recording taken in a single day, including observations over seven work cycles. This required the use of a miniaturized noise dosimeter placed on the worker’s helmet that was able to collect time-labelled data, as well as the use of a video camera that was placed near the machine to capture the media files needed for the event-based time characterization. The data were collected in May 2018 for a Wyssen sledge-based cable yarder which was similar to those described by Borz et al. [23]. Both the observed and similar sledge yarder models are commonly used in steep-terrain, low-access operations in Romania and internationally.
The collected media files were used to document the data on the noise exposure which was sampled at a rate of 1 Hz. The first engine starting event observed in the media files was used as a synchronization point for the sound pressure level and video data. Based on the video analysis and a careful check of the logical order of the events, 10 different events were identified and delimited (Table 1). Although the analysis of the video data was intensive in terms of time, it provided the means to accurately delimit the events by considering their real order of occurrence, so as to be able to characterize the work cycles of the machine as observed in the field. The accuracy of the data synchronization was checked in terms of the duration of each single event identified in both datasets. The observed events were conceptually related to the typical functions of the cable yarding systems and were similar to those described by Heinimann et al. [9]. This was based on the observations in the video files, particularly on the behavior of the mainline drum and on the way in which the worker used the controls of the machine.
Data processing was carried out in Microsoft Excel, into which the files collected by the noise dosimeter had been imported. The data contained in the files were coded based on the observations taken from the media files. Data coding was performed manually by adding a descriptive text for each entry in the dataset. Once the coding was completed, the data were sorted by considering the attributed codes and new sets were created for each event found, thereby constituting the main input for the statistical analysis. Figure 1 shows an example of event distribution in the time domain, as observed in the data, indicating some event examples, as described in Table 1. Figure 2 provides a view of the machine in question, along with a basic description of the features relevant for this study.
At the time of data collection, no formal procedures for human observation were required. However, the worker was informed about the purpose of the data collection and how the results would be used. These issues were also discussed with the management of the company owning and operating the machine. The worker agreed to participate in this study and the authors took the necessary precautions to protect both the identity of the worker and the company, including the location of the operations. In addition, noise exposure in this kind of operation is related to the way in which the machine is used, since the worker only controls it from a fixed location. Hence, the outcomes would have been similar for any worker since the exposure to noise is mainly controlled by the features of the workstation and of the operational pattern of the machine.

2.2. Statistical Analysis

Collecting task-based data on the sound pressure level is one of the strategies that can be used to characterize the workplace in terms of noise exposure. However, this assumes homogeneous noise exposure groups and repeatability in the collected data, among other things [20]. The approach used in this study to quantify the noise exposure for the simulation was that of first trying to extract the average values at an event level, as described in Table 1. Unfortunately, the use of mean values to infer the characteristics of a population requires assumptions on the normality of the data [24]. This assumption was tested at an event level using the Shapiro–Wilk test and led to the conclusion that none of the variables of noise exposure followed a normal distribution. To achieve reliable estimates, a parametric bootstrapping procedure was used. Bootstrapping is a numerical method used to generate confidence intervals based on simulated or resampled data and is helpful in estimating the sampling distribution of maximum likelihood parameter estimates; it works by using the most likely parameter estimates to generate a new set of statistical data that has the same structure in terms of the number and spacing of observations, then fits the simulated data and extracts the most likely parameter estimate. Finally, it estimates the confidence intervals of that parameter [25]. The procedure makes no assumptions about the distribution of the population, while the original sample is treated as a pseudo-population [26].
The Real Statistics [27] add-in for Microsoft Excel was used in this study to run the bootstrapping resampling, which is a procedure that uses replacement [26]. The original data for each event were resampled by using hypothesized parameters as the most likely figures for the mean values, as initially computed by descriptive statistics; bin ranges were adjusted to the data range for each event and the bin sizes were adjusted to the precision of the data as exported from the noise dosimeter (0.1 dB(A), actual readings). For each event, 10,000 iterations were used during the resampling procedure, and histograms showing the likelihood of frequency in the data were produced by the same add-in. The procedure itself assumed a confidence value of α = 0.05.

2.3. Simulation of Noise Exposure
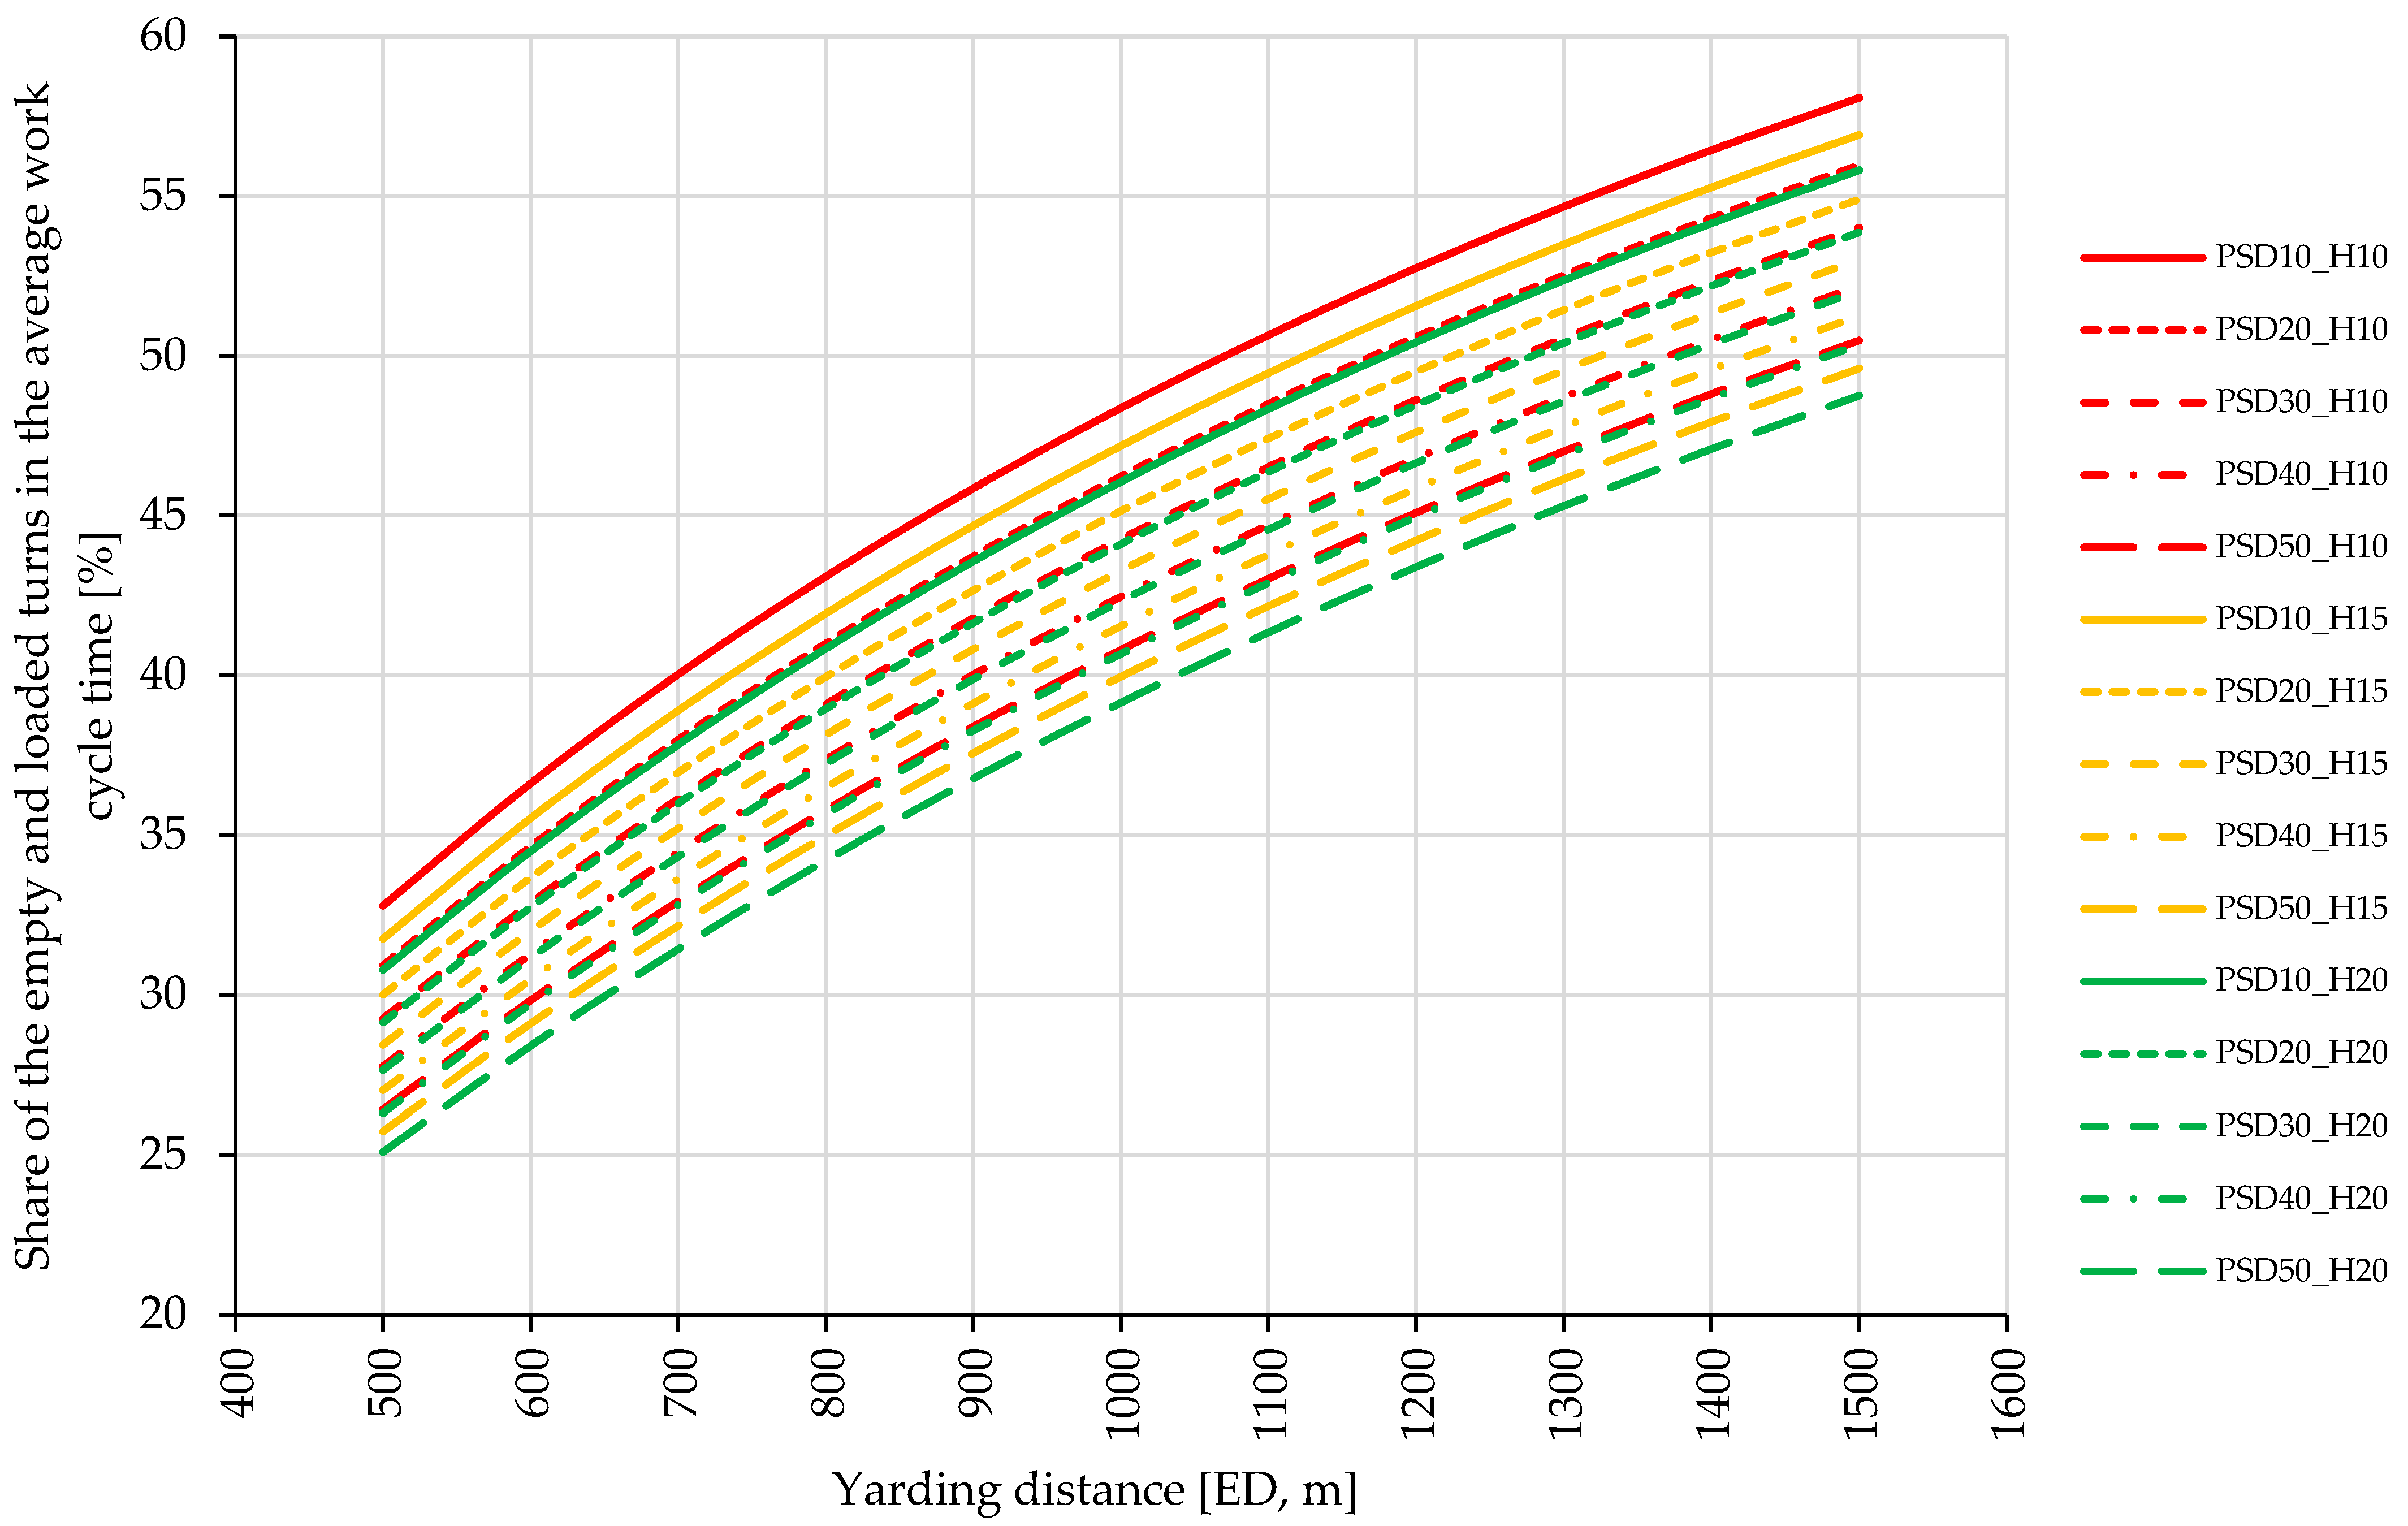
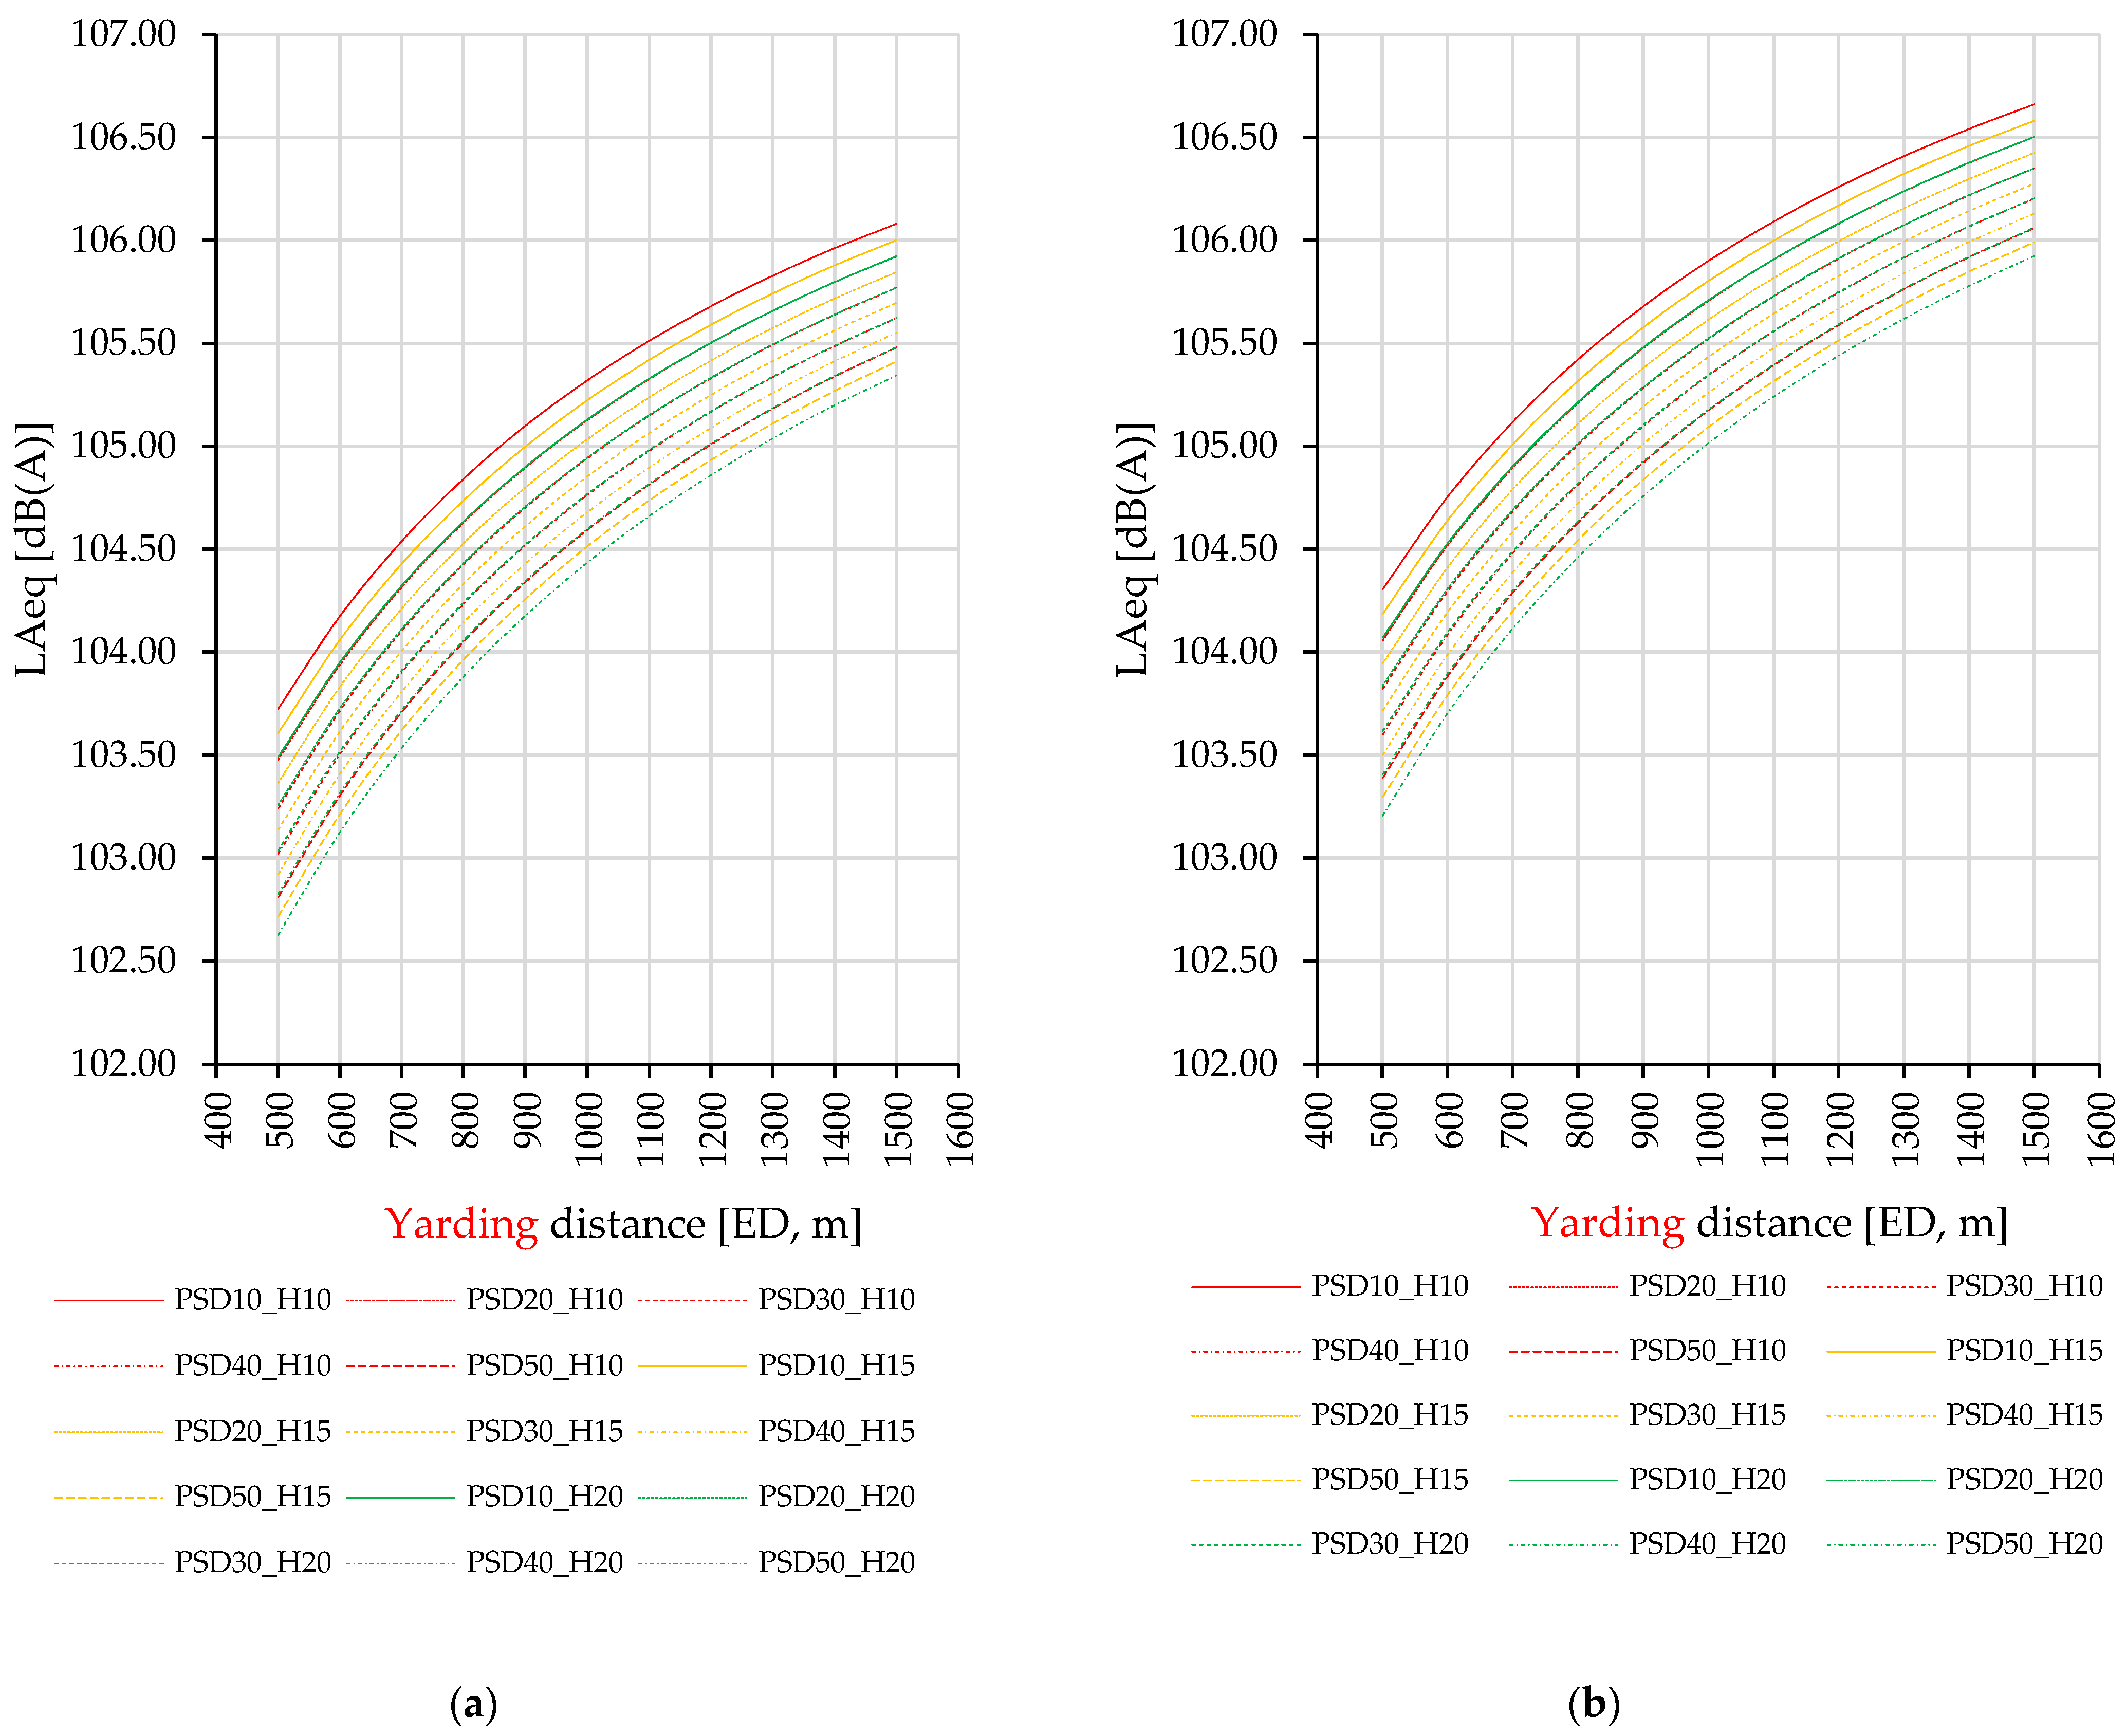
The simulation factors used in this study were those considered to be the most relevant in controlling noise exposure. The average yarding distance (i.e., the average distance from the lateral yarding site to the landing, measured in meters), average lateral yarding distance (i.e., the average distance from the place where the logs were located to the corridor), and average height of the skyline (i.e., the average height from the ground to the skyline) were used as the main factors for the simulation. To facilitate the simulation, these variables were discretized. Yarding distances (hereafter ED) of 500 to 1500 m were considered, with a step of 100 m, while the lateral yarding distances (hereafter PD) were set to between 10 and 50 m, with a step of 10 m. Skyline heights (hereafter H) considered in the simulation were 10, 15, and 20 m based on the fact that a variation in H may control variation in the duration of some of the events occurring at a lower speed which, in turn, may affect the share of events in an average work cycle, and therefore the level of exposure. Variations in the considered factors were based on the practice in Romania, but they could very well reflect the practices used in other regions.
A work cycle (CT, seconds) was defined according to Equation (1), based on the findings of previous studies and the description of European cable yarding functions [9]. The elemental time consumption data were originally calculated in seconds to fit the measurement units of the existing statistics and models of time consumption, then the results were converted into hours.
CTijk = LICtijk + ETtijk + LOCtijk + CPOtijk + CStijk + LPItijk + LILtijk + LTtijk + LOLtijk + LDtijk,
where CT is the work cycle time of cable yarding, LICt—time consumption to lift the cable at the landing, ETt—time consumption to carry on the empty turn, LOCt—time consumption to lower the cable at the lateral yarding site, CPOt—time consumption to pull out the cable from the corridor to the load, CSt—time consumption to set up chokers on the logs, LPIt—time consumption to pull in the load from the stand to the corridor, LILt—time consumption to lift the load under the carriage, LTt—time consumption to carry on the loaded turn, LOLt—time consumption to lower the load at the landing, and LDt—time consumption to unchoke the load at the landing. Note: i, j, and k stand for the given conditions of the simulation in terms of yarding distance (i), lateral yarding distance (j), and skyline height (k).
When computing the duration of the work elements, available data such as descriptive statistics and time consumption models reported in the scientific literature were used by considering the same machine. Such data were retrieved from published work by Munteanu et al. [11] and its validity, particularly that of the time consumption models, was checked against other published data. Work elements such as lifting the cable at the landing, lowering the cable at the lateral yarding site, pulling in the load, lifting the load at the lateral yarding site, and lowering the load at the landing were assumed to run at an average speed of 1 m per second, which is a reasonable figure and is consistent with previous reports and practice. To set the chokers on the logs, the average figure of 214 s was used, assuming loads of 1 to 3 logs (average of approximately 1.5 logs per load), while to detach the logs at the landing, an average figure of 100 s was used; these figures, as well as the models of time consumption for the empty turn (Equation (2)), loaded turn (Equation (3)), and for the cable pull out (Equation (4)), were adapted from [11].
ETti = 0.18 × EDi + 7,
LTti = 0.19 × EDi + 9,
CPOtj = 2.7 × PSDj + 21,
where ETti, LTti, and CPOtj have similar meanings to those in Equation (1), with the difference being that they only consider the specific conditions of the yarding (i) and lateral yarding distance (j), respectively; EDi—average yarding distance for the simulated condition i, PSDj—average lateral yarding distance for the simulated condition j.
Equation (5) was used to account for the shift time (ST) set at 8 h based on 7 h of effective work and a 1-h break (B), as is common in Romanian timber harvesting operations in terms of managing work time. The shift time considered each of the simulated conditions in terms of yarding distance, lateral yarding distance, and skyline height, and it was used to calculate the number of work cycles (NCijk) for each condition.
ST = CTijk × NCijk + B,
where ST is the shift time as a fixed time portion of 8 h, CTijk—the average cycle time for a given condition of the simulation, NCijk—number of work cycles that are fitted in the ST for condition ijk, and B—1-h break.
Equation (1) was then used in conjunction with the results for the number of work cycles from Equation (5) to calculate the time measured for each work element in a working day for a given condition of the simulation, which was complemented by plotting the share of empty and loaded turns taken together against the extraction distance. This was to see how these work elements that may expose the hauler to the most noise varied in relation to the main parameter used in the simulation.
The time results were then used to calculate the equivalent A-weighted sound pressure level (LAeq) for each condition of the simulation using the specific equation, as referenced in [18,20,22]. This was achieved by considering all the tasks within a day and their share based on the mean values extracted from the actual readings by the use of parametric bootstrapping. For work elements such as the cable pull out time, choker setting, and unchoking at the landing, as well as for the break time, the value characterizing the engine-off event was used.
The data generated by the above-described procedures were represented in the form of bivariate plots that featured labels to distinguish between the scenarios. The main factor used to develop the plots was the extraction distance. For comparison, the simulated data computed for 7 h of work by excluding the break were also plotted to provide an overview of what could happen in this scenario. Finally, the relevant standards and thresholds that are applied internationally [20,28] were brought together with the simulated data to check the situation for each scenario, as well as for the empty and loaded turns taken together. This result was also presented as a bivariate plot.

3. Results

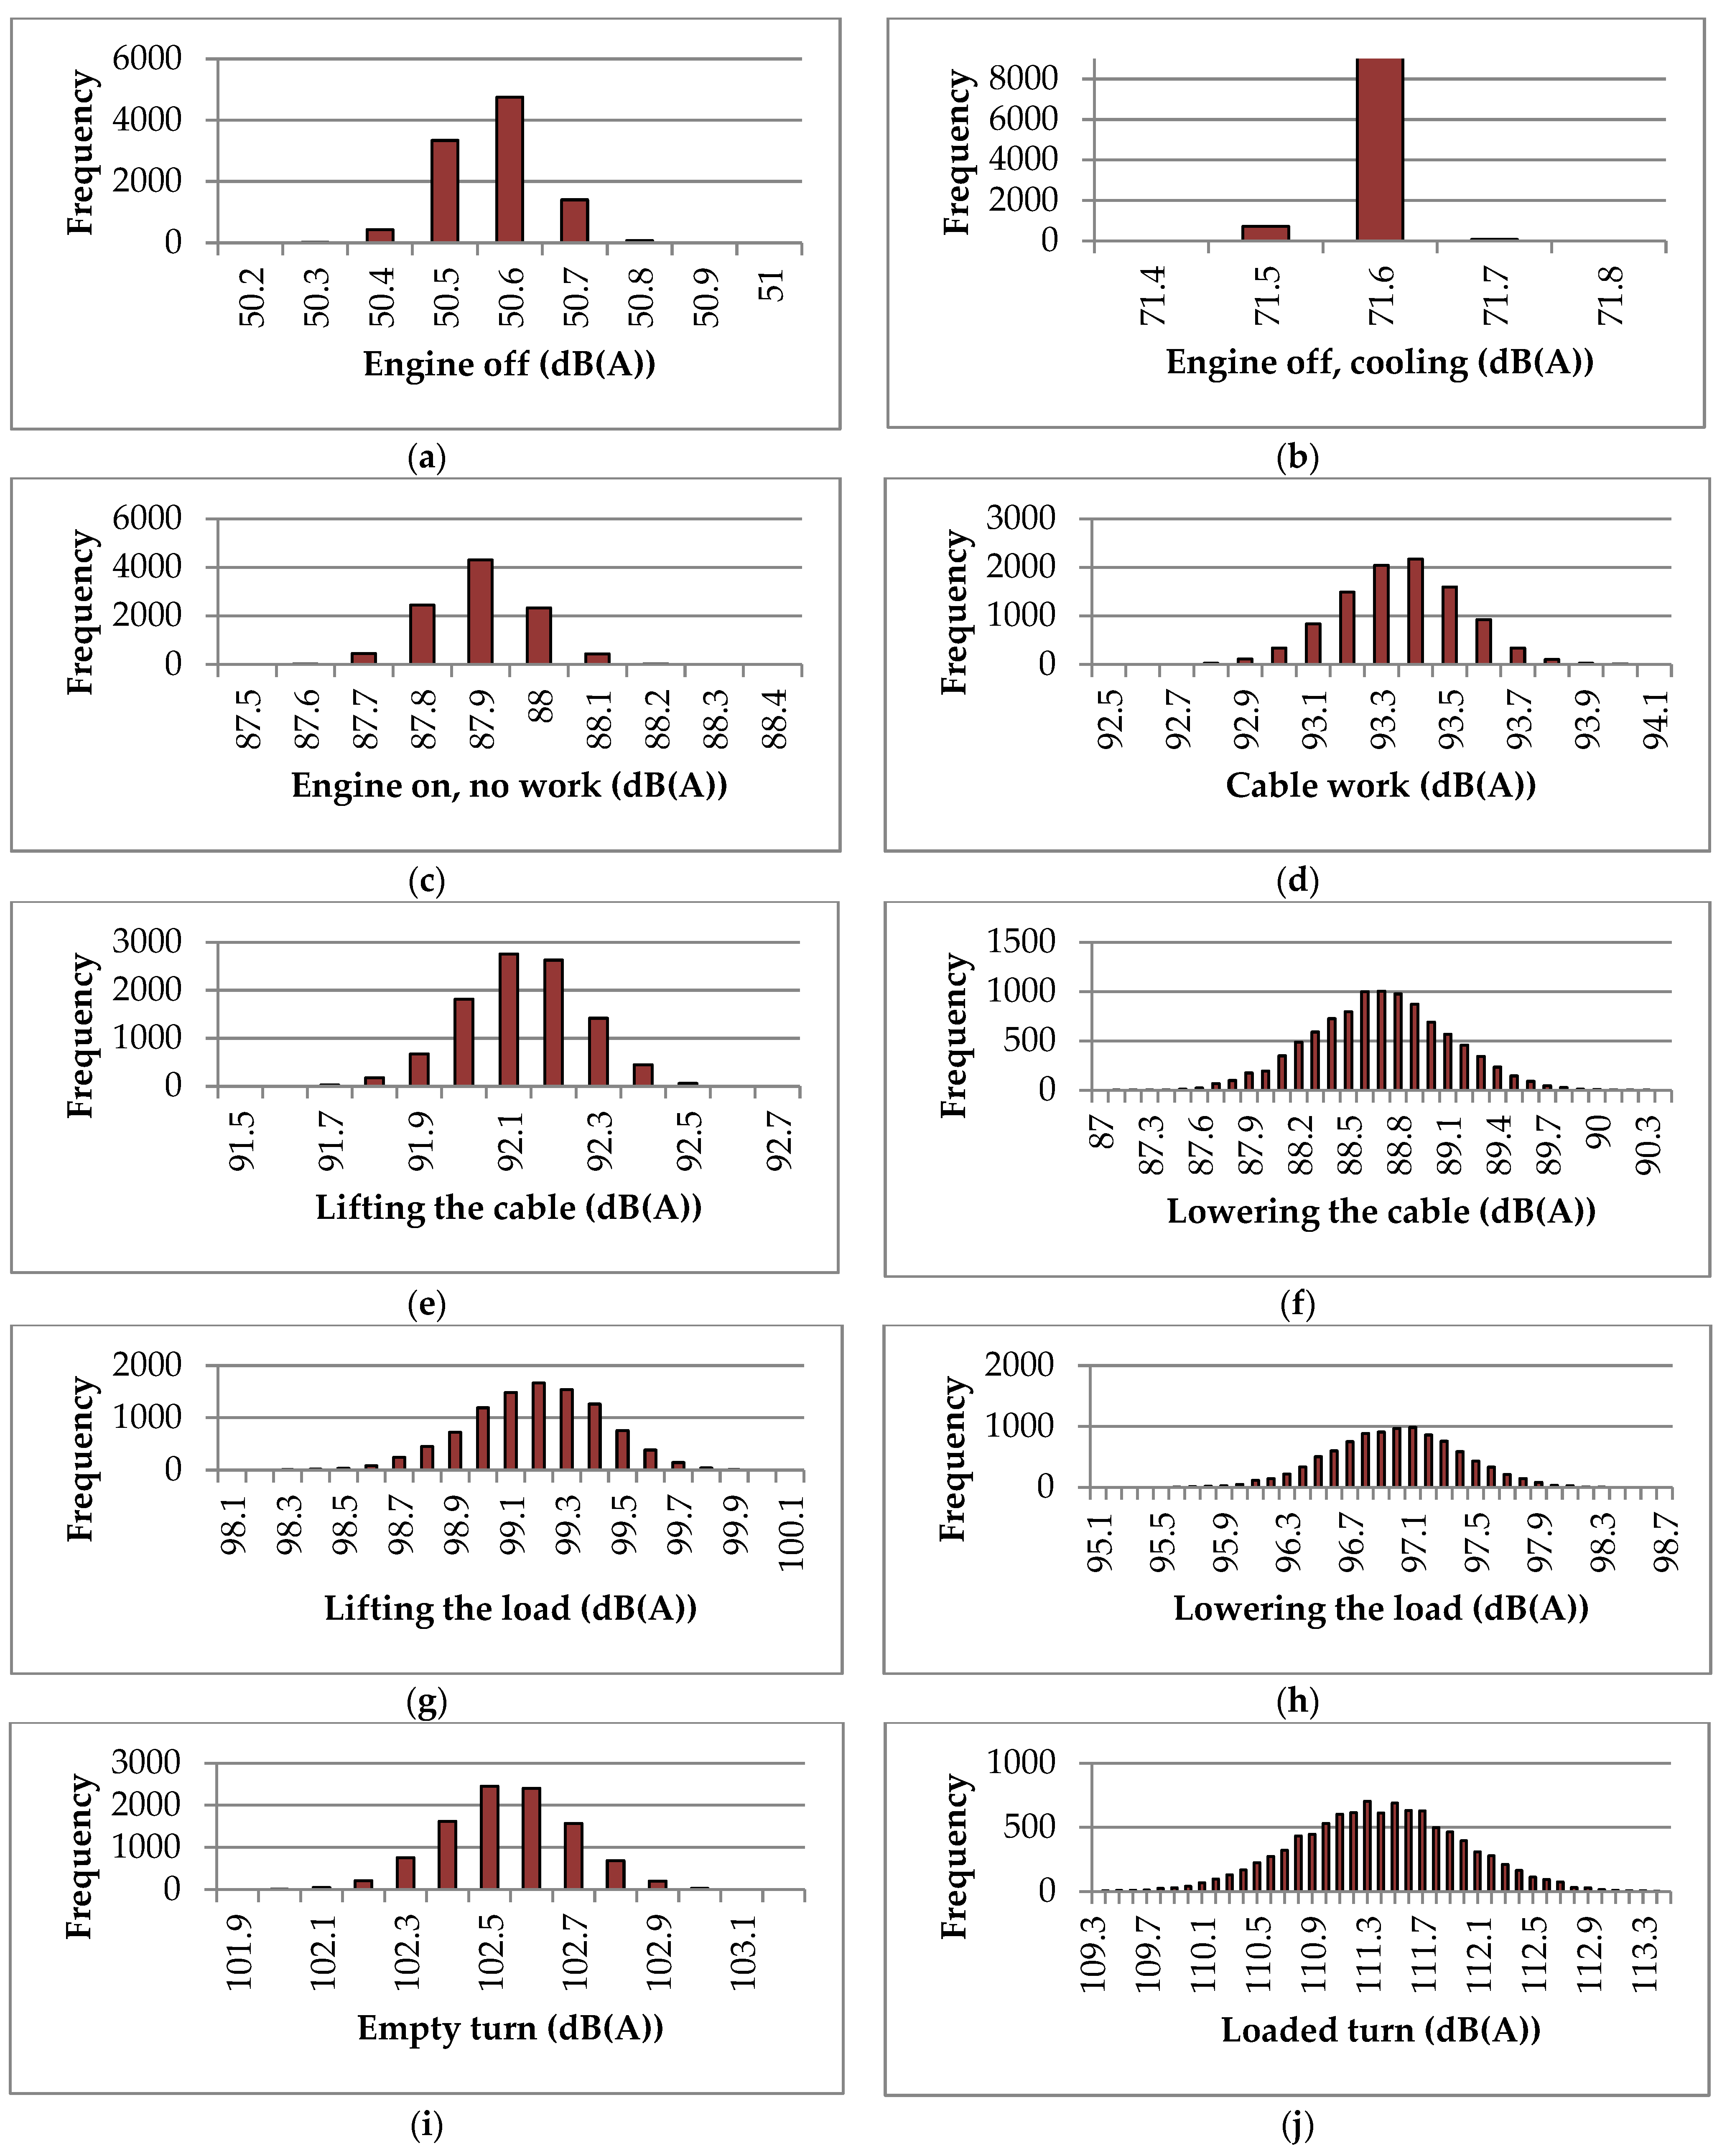
3.1. Statistics for the Source Data and Data Resampling

In total, the sample accounted for 23,574 observations collected at a sampling rate of 1 Hz (Table 2). Excluding those events in which the engine was observed to be off, cable work accounted for approximately 37%, lifting and lowering the cable for approximately 13%, lifting and lowering the load for approximately 12%, empty turns for approximately 21%, and loaded turns for approximately 18%.
Checking for the normality of the data using the Shapiro–Wilk test showed that none of the variables could be assumed to come from a normal distribution. However, the main statistical descriptors of central tendency, such as the mean and median values, were close in magnitude, as shown in Table 2. The inferred values of the pseudo-population means were close to those of the samples and the hypothesized means (Table 3). The p-values of the two-tailed tests were found to lie between 0.149 and 0.9983 (p > 0.05, α = 0.05); therefore, the null hypotheses were accepted for all the tested mean values, concluding that the pseudo-population means were not significantly different from the hypothesized values.
Given the results presented in Table 3, the mean values estimated at the pseudo-population level were used for the simulation. Additional data supporting the results from Table 2 are given in Appendix A, Figure A1, which shows the frequency histograms of the 10 events following the parametric bootstrapping.

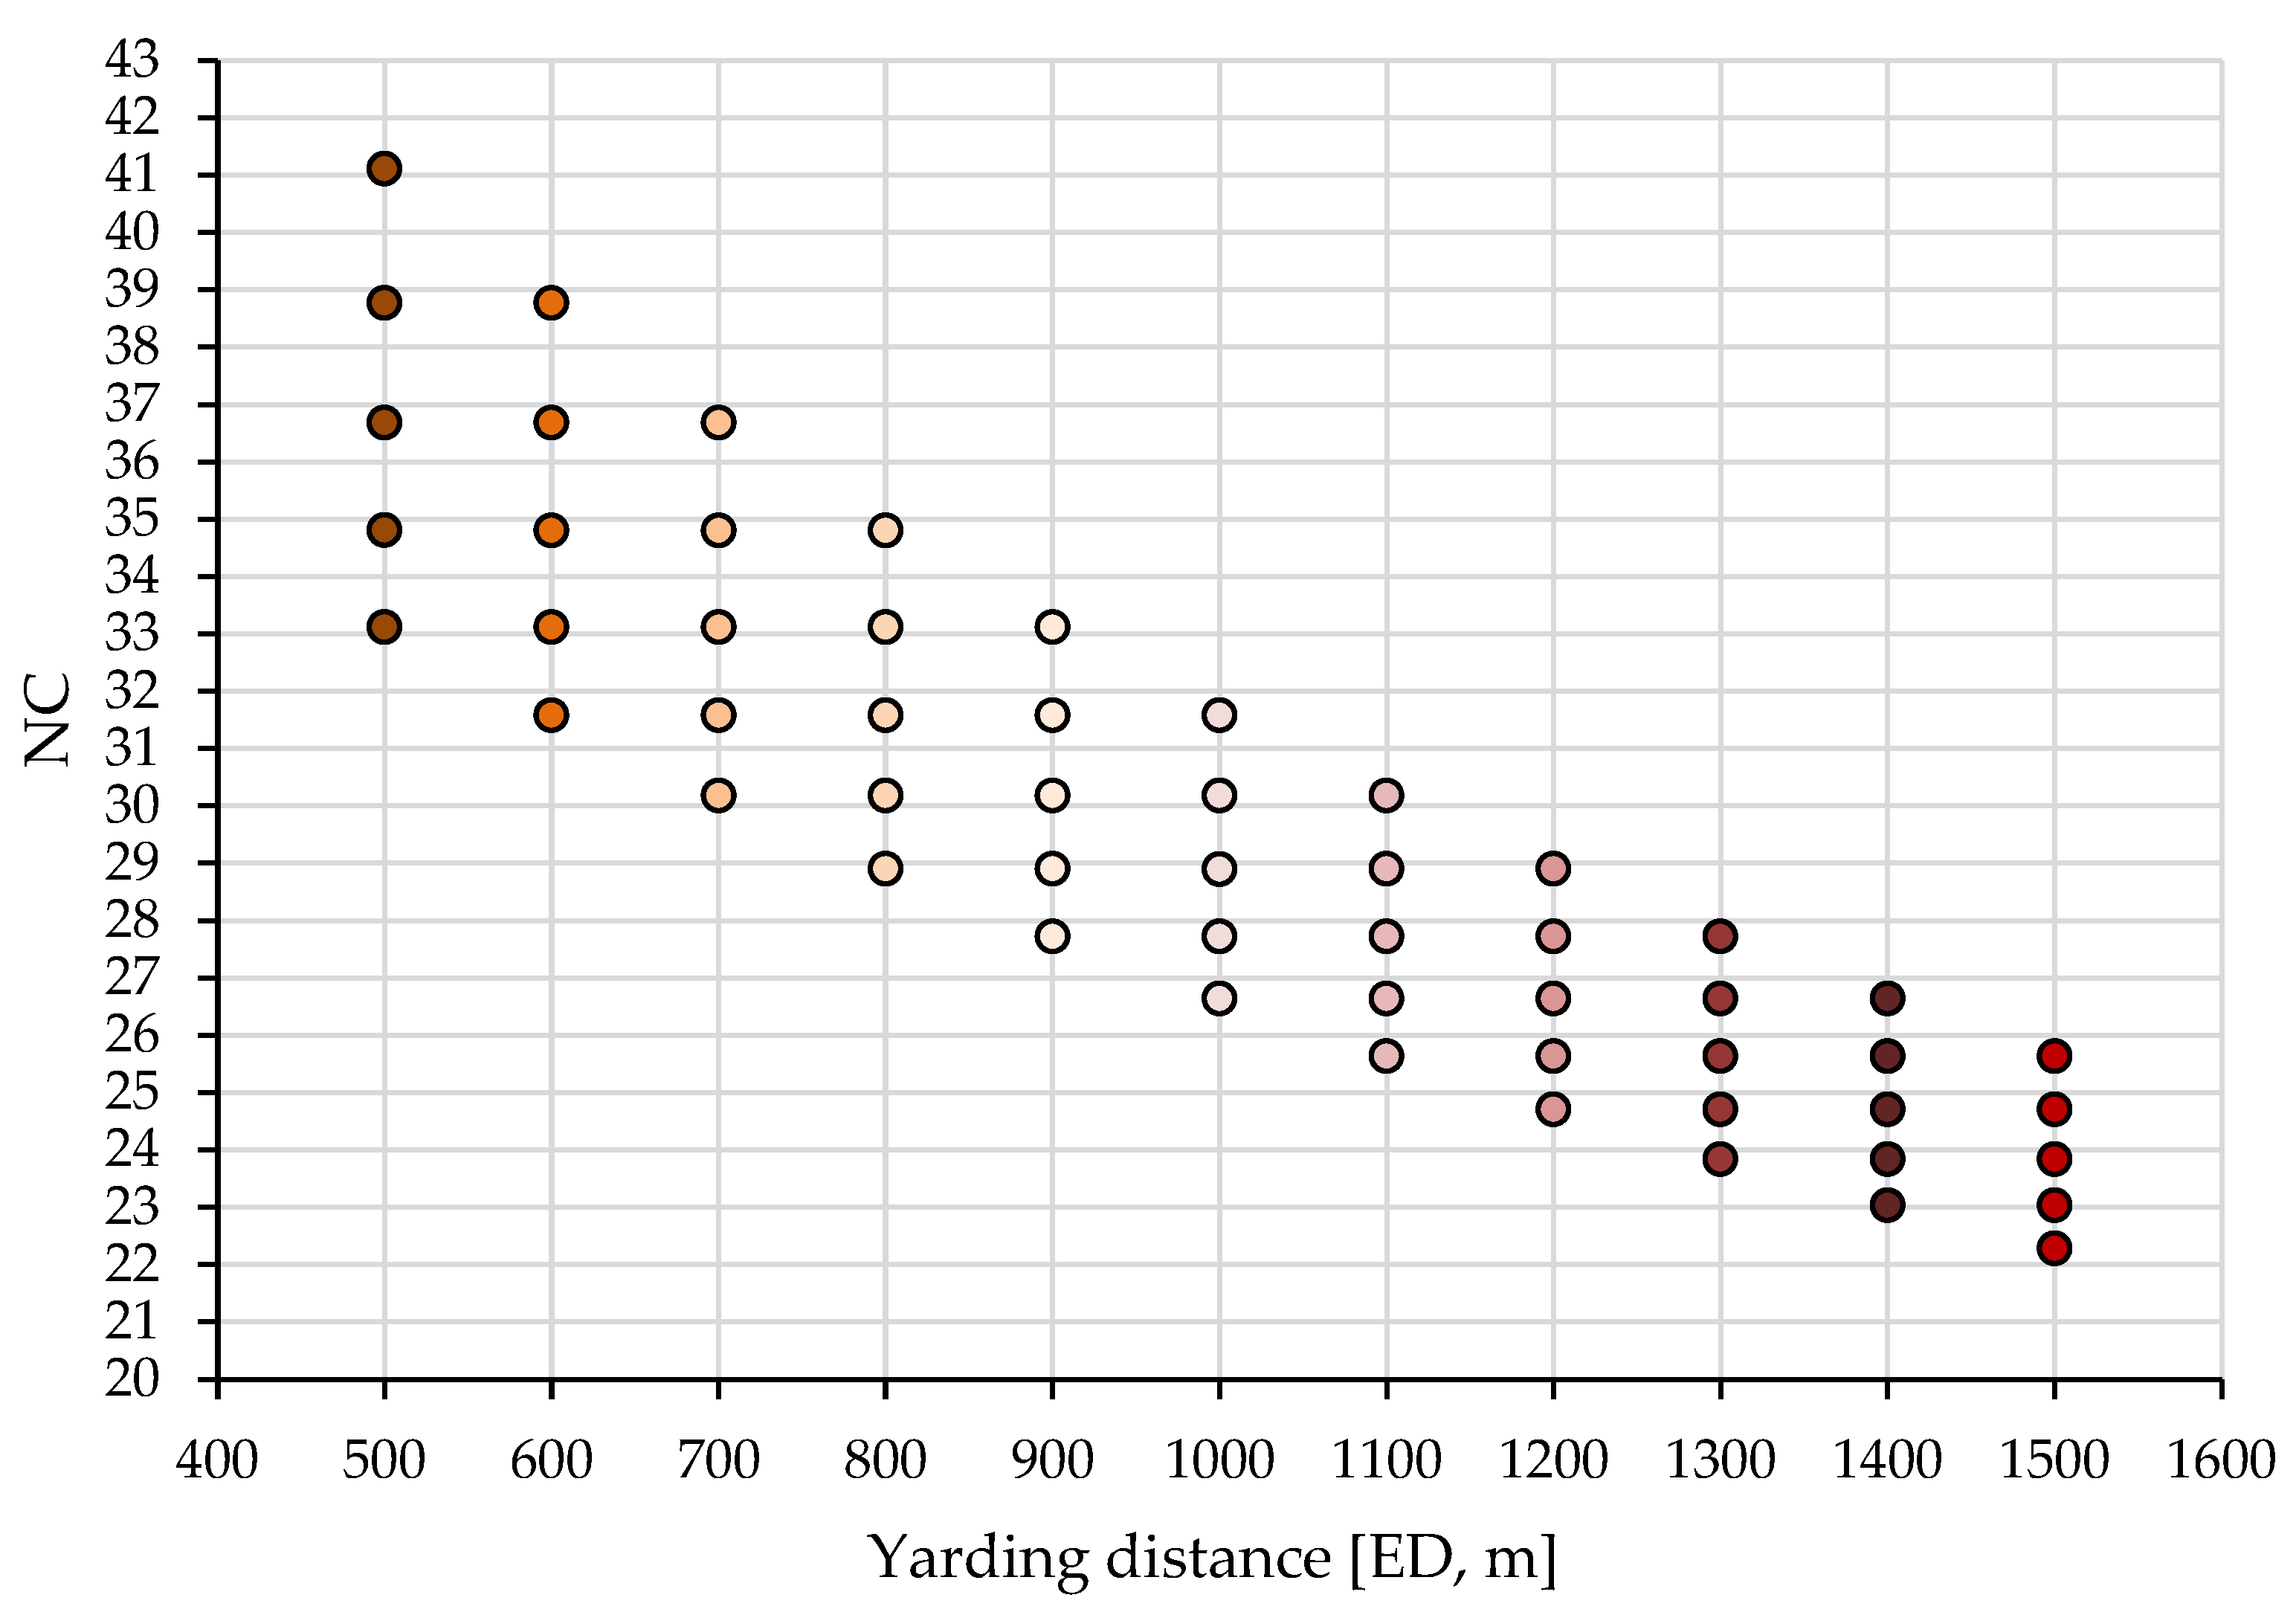
3.2. Simulated Noise Exposure

The loaded and empty turns were the events that accounted for the highest measured sound pressure level (Table 2 and Table 3). Their share in an average work cycle largely depended on the magnitude of the yarding distance (Figure 3). For yarding distances of 500 m, the share of empty and loaded turns accounted for a minimum and a maximum of 25 and 33%, which was almost doubled for yarding distances of 1500 m. There was a differentiation in the share of empty and loaded turns, which largely came from the variation in lateral yarding distance and skyline height.
For instance, at a yarding distance of 500 m, and for a skyline height of 20 m, the differences found in the share of empty and loaded turns by decreasing the lateral yarding distance from 50 to 10 m were 1 to 2% in magnitude. For the same yarding distance, the magnitude of the difference attributed to the skyline height was 1%, from 20 to 15 and from 15 to 10 m, which was also the case for a yarding distance of 1500 m. Most importantly, these incremental changes in the yarding distance, lateral skidding distance, and the skyline height were not linear; rather, they closely followed a polynomial rule.
Consistent with these rules, the equivalent exposure to noise calculated as the A-weighted sound pressure level followed a similar trend when considering the simulations under investigation. The main difference was that the exposure to noise was higher when the 1-h break was excluded from the simulation (Figure 4b as opposed to Figure 4a). There was also a differentiation in magnitude, which mostly came from the way in which the tasks were distributed in terms of the share of the working day.
For the same yarding distance, the highest exposure to noise was likely to occur when the minimum values were met in terms of lateral yarding distance and skyline height. When this happened, the share of the empty and loaded turns increased in a work cycle; therefore, the exposure to noise increased as well, since these work elements were characterized by the highest sound pressure levels. This can be seen in the shape of the continuous red lines shown in Figure 4a,b, which are curves with a non-linear increasing trend as a function of the yarding distance. Both indicate the highest magnitude of the simulated exposure to noise for the lowest values of lateral yarding distance and skyline height. However, most of the effects in the magnitude of exposure were brought by the lateral yarding distance, since distances of 10 m were characterized by the highest magnitudes of exposure, irrespective of the skyline height (Figure 4a,b). This was mainly due to a lower share of lateral yarding time at the expense of increasing the time in the empty and loaded turns. By comparing the data from the two panels in Figure 4, the differences can also be seen as a result of excluding the 1-h break. Following the simulation, the exact difference between the two was 0.58 dB(A) LAeq, indicating a rather small difference in magnitude when considering a 1-h break in the data simulation. In addition, running the simulation for an effective working day of 8 h would probably increase the level of exposure since more work cycles would fit in that time frame.
How the simulated noise exposure compared to the available standards is shown in Figure 5. Here, the permissible time spent in work for given noise levels, as referenced in the work of Helander [28], was plotted using the red curved line. The thresholds set by the European standards [20] were also considered, although they were not specifically indicated by lines or curves in the figure since they fall well below the red line.
A comparison of the simulation results with the existing standards and rules concerning exposure to noise depending on the working time (Figure 5) identified two important aspects. The first one is that without adequate protection, haulers were exposed to intensive noise, irrespective of the operational scenario in question. The second aspect is that this exposure largely came from empty and loaded turns, which, for the simulated conditions, may have taken between approximately 1.7 and 4.0 h per day, while they also generated the highest levels of noise. For an exposure level of approximately 110 dB(A), the duration of exposure within a day should not exceed 0.5 h according to the US standards [28], a time frame that was surpassed by the empty and loaded turns alone. For an exposure level of 100 dB(A), the daily duration should not exceed 2 h, yet the simulations of the considered scenarios of exposure were well above this time threshold.

4. Discussion

The goal of this study was to simulate but not provide exact figures on the noise exposure in sledge-based cable yarding. Therefore, the use of the average values sampled for the main observed events provided indicative figures to characterize noise exposure in various work elements. Indeed, those forest operations that required transportation processes were sensitive to variations in the magnitude of the operational variables, in that the duration and share of specific work elements in a work cycle generally changed with the increment or decrement in operational variables. In skidding operations, for instance, changes in the magnitude of pre-skidding and skidding distances contribute to a change in the work elements’ share in a work cycle [21], which also applies to cable yarding, as demonstrated by this study. Accounting for such a variation to characterize noise exposure is challenging if conventional studies are used, as it would necessitate measurements carried out to cover all the potential variations in operational factors, in addition to the type of machine used for extraction [29,30]. For sledge-based cable yarding, this is virtually impossible since it would involve using many resources in collecting and processing data, and previous work has shown that it is difficult to develop meaningful models which relate noise exposure to distance when conducting a study using this approach [21].
Another aspect is the inference of the number of work cycles within a day, as well as the exact duration of a nominal day. The first largely depends on a variation in operating conditions, as well as the time assumed for eating and other breaks. Using these would better reflect noise exposure in operations, although they have not been used consistently in other studies. On the other hand, it is worth considering that in forestry work, the typical working day does not last exactly 8 h. Indeed, many examples from practice show that this amount of time is often exceeded, while at the same time, there is a significant amount of time during the year that is not actually used for operations due to machine breakdowns or adverse weather conditions [31]. These factors would need to be accounted for in corrections to the simulated figures provided by this study, as well as in the figures provided by others. Solving this, however, is challenging since the background data needed to correct the estimates on exposure is lacking in many cases. However, manufacturers who have oriented their businesses towards building intelligent machines might consider integrating sensors into their systems for collecting long-term data on noise exposure. This would be helpful, at least for those machines that are mainly operated from inside a cab.
The potential noise exposure in sledge-based cable yarding increases non-linearly with the extraction distance, a behavior which could be accounted for in setting the right amount of work per day. According to the figures provided in this study, the thresholds set by the existing standards were well exceeded, irrespective of the extraction distance. One may assume shorter yarding distances, but the results would not change much, as the exposure level would still account for approximately 100 dB(A) for distances of 100 m (calculations not shown explicitly herein). On the other hand, a workday typically covers extraction from different points along the corridor, meaning that the yarding distance characterizing each work cycle will vary. From this point of view, the results of this study are rather static, although one could infer the level of exposure by looking at the expected variations in operational factors specific to a working day.
The typical speed of the carriages during the empty and loaded turns varies widely depending on local conditions, but it may reach up to 5 m per second [11,32]. This positively affects the productivity since a load can be extracted much faster. However, increasing speed comes at the expense of higher levels of exposure to noise, as observed from the analysis of the media files used in this study. There is also quite a high degree of magnitude when comparing the efficiency of many work elements that are carried out manually, with some of those carried out mechanically. For instance, the models reported by Munteanu et al. [11] and used in this study to estimate the time of the empty and loaded turns have shown a close order of magnitude of time estimates. The model for pulling out the cable, on the other hand, had a much bigger slope, which applied to a lateral yarding distance range of approximately 120 m in the original study. These, as well as the findings of other studies which involved cable work [33], point out the same idea, namely, that the efficiency of manual work is lower in transportation processes compared to that of machine work. When one compares the potential noise exposure, however, the findings are not similar. As simulated in this study, smaller lateral yarding distances lead to higher noise exposure. This is because the fast-running work elements, such as the empty and loaded turns, gained a higher share in the structure of the work cycle when the manual work was limited. This led to a higher efficiency measured, being the number of work cycles that could be completed in a day (Figure A2), but also to a higher exposure to noise.
As stated, the goal of this study was not to exactly quantify the exposure to noise, but to benchmark the potential effects brought about by several important operational factors in exposure variation. By any means, future studies could look more closely at the problem and try to collect more detailed data, also including an analysis of noise frequency. Our experience with the media files indicates that this would need to be addressed in the future. Based on our findings, it can be stated that, in terms of the considered factors, noise exposure exceeded the permissible limits set by the existing standards. To what extent the use of protective equipment can help in mitigating this remains to be seen [34]. Perhaps advancements in protective equipment will provide better helmets that incorporate efficient communication devices, which then could be used to attenuate exposure. By their use [28], the noise exposure during the empty and loaded turns, as well as during the day, might reach acceptable limits. Meanwhile, company managers should take all necessary precautions to properly equip their workers and to make sure that they are wearing noise protectors.

5. Conclusions

The hauler’s level of exposure to noise in sledge-based cable yarding depends on a variability in operational factors such as the yarding and lateral yarding distances. The magnitude of exposure depends non-linearly on the yarding distance and is inversely proportional to the lateral yarding distance. In our assessment, noise exposure during the working day exceeds the limits set by the existing standards and workers should wear protective equipment in order to fulfill their daily duties. Future case studies should be organized to provide more realistic figures and to validate these findings. In addition, time consumption models should be developed for other operational conditions.

Author Contributions

Conceptualization, S.A.B., P.S.M. and M.B.; methods, S.A.B.; validation, S.A.B.; writing—original draft preparation, S.A.B.; writing—review and editing, S.A.B., P.S.M. and M.B.; visualization, S.A.B. All authors have read and agreed to the published version of the manuscript.

Funding

This research received no external funding.

Data Availability Statement

Data supporting this study may be provided by the first author based on a reasonable request.

Acknowledgments

The authors would like to thank the management of the company owning and operating the cable yarder for their willingness to support this study, as well as the worker who agreed to participate in this study. Also, the authors would like to thank Eng. Toma Andrei and Eng. Dumbravă Raul for their help with data collection. The equipment used in this study was provided by the Department of Forest Engineering, Forest Management Planning and Terrestrial Measurements, the Faculty of Silviculture and Forest Engineering, Transilvania University of Brasov. The authors are grateful for the support received.

Conflicts of Interest

The authors declare no conflicts of interest.

Appendix A

Figure A1. Frequency histograms of the parametric bootstrapping: (a) Engine off, (b) Engine off, cooling, (c) Engine on, no work, (d) Cable work, (e) Lifting the cable, (f) Lowering the cable, (g) Lifting the load, (h) Lowering the load, (i) Empty turn, (j) Loaded turn.
Forests 15 00360 g0a1
Figure A2. An example of the number of work cycles (NC) by considering a fixed skyline height (H) of 10 m, a variation in yarding distance (ED) from 500 to 1500 m, and a variation in lateral yarding distance (PSD) from 10 to 50 m. Note: for each yarding distance, from top to bottom, the number of work cycles that can be covered in 7 h of effective work, when increasing the lateral yarding distance from 10 (top) to 50 m (bottom), with a step of 10 m, is shown.
Forests 15 00360 g0a2

References

  1. Heinimann, H.R. Forest operations engineering and management—The ways behind and ahead of a scientific discipline. Croat. J. For. Eng. 2007, 28, 107–121. [Google Scholar]
  2. Marchi, E.; Chung, W.; Visser, R.; Abbas, D.; Nordfjell, T.; Mederski, P.S.; McEwan, A.; Brink, M.; Laschi, A. Sustainable Forest Operations (SFO): A new paradigm in a changing world and climate. Sci. Total Environ. 2018, 634, 1385–1397. [Google Scholar] [CrossRef] [PubMed]
  3. Lundbäck, M.; Häggström, C.; Nordfjell, T. Worldwide trends in methods for harvesting and extracting industrial roundwood. Int. J. For. Eng. 2021, 32, 202–215. [Google Scholar] [CrossRef]
  4. Moskalik, T.; Borz, S.A.; Dvořák, J.; Ferencik, M.; Glushkov, S.; Muiste, P.; Lazdiņš, A.; Styranivsky, O. Timber harvesting methods in Eastern European countries: A review. Croat. J. For. Eng. 2017, 38, 231–241. [Google Scholar]
  5. Potočnik, I.; Poje, A. Forestry ergonomics and occupational safety in high ranking scientific journals from 2005–2016. Croat. J. For. Eng. 2017, 38, 291–310. [Google Scholar]
  6. Bont, L.; Heinimann, H.R. Optimum geometric layout of a single cable road. Eur. J. For. Res. 2012, 131, 1439–1448. [Google Scholar] [CrossRef]
  7. Cavalli, R. Prospects of research on cable logging in forest engineering community. Croat. J. For. Eng. 2012, 33, 339–356. [Google Scholar]
  8. Spinelli, R.; Visser, R.; Thees, O.; Sauter, U.H.; Krajnc, N.; Riond, C.; Magagnotti, N. Cable logging contract rates in the Alps: The effect of regional variability and technical constraints. Croat. J. For. Eng. 2015, 36, 195–203. [Google Scholar]
  9. Heinimann, H.R.; Stampfer, K.; Loschek, J.; Caminada, L. Perspectives on Central European cable yarding systems. In Proceedings of the International Mountain Logging and the 11th Northwest Skyline Symposium, Seattle, WA, USA, 10–12 December 2001; pp. 268–279. [Google Scholar]
  10. Ghaffariyan, M.R.; Stampfer, K.; Sessions, J. Optimal road spacing of cable yarding using a tower yarder in Southern Austria. Eur. J. For. Res. 2010, 129, 409–416. [Google Scholar] [CrossRef]
  11. Munteanu, C.; Yoshida, M.; Iordache, E.; Borz, S.A.; Ignea, G. Performance and cost of downhill cable yarding operations in a group shelterwood system. J. For. Res. 2019, 24, 125–130. [Google Scholar] [CrossRef]
  12. Schweier, J.; Magagnotti, N.; Labelle, E.R.; Athanassiadis, D. Sustainability impact assessment of forest operations: A review. Curr. For. Rep. 2019, 5, 101–113. [Google Scholar] [CrossRef]
  13. DeArmond, D.; Rovai, A.; Suwa, R.; Higuchi, N. The challenges of sustainable forest operations in Amazonia. Curr. For. Rep. 2023. [Google Scholar] [CrossRef]
  14. Ottaviani, G.; Talbot, B.; Nitteberg, M.; Stampfer, K. Workload benefits of using a synthetic rope strawline in cable yarder Rigging in Norway. Croat. J. For. Eng. 2011, 32, 561–569. [Google Scholar]
  15. Stampfer, K.; Leitner, T.; Visser, R. Efficiency and ergonomic benefits of using radio controlled chokers in cable yarding. Croat. J. For. Eng. 2010, 31, 1–9. [Google Scholar]
  16. Kirk, P.M.; Sullman, M.J.M. Heart rate strain in cable hauler choker setters in New Zealand logging operations. Appl. Ergon. 2001, 32, 389–398. [Google Scholar] [CrossRef] [PubMed]
  17. Munteanu, C. Research on Cable Yarding in Mountainous Terrain. Ph.D. Thesis, Transilvania University of Brasov, Brasov, Romania, 2018. [Google Scholar]
  18. Poje, A.; Spinelli, R.; Magagnotti, N.; Mihelic, M. Exposure to noise in wood chipping operations under the conditions of agro-forestry. Int. J. Ind. Ergon. 2015, 50, 151–157. [Google Scholar] [CrossRef]
  19. Poje, A.; Grigolato, S.; Potočnik, I. Operator exposure to noise and whole-body vibration in a fully mechanised CTL forest harvesting system in karst terrain. Croat. J. For. Eng. 2019, 40, 139–150. [Google Scholar]
  20. ISO 9612:2009; Acoustics—Determination of Occupational Noise Exposure—Engineering Method, Second Edition. International Organization for Standardization: Geneva, Switzerland, 2009.
  21. Poje, A.; Potočnik, I.; Danilović, M.; Antonić, S. A case study of the impact of skidding distance on tractor operator exposure to noise. Balt. For. 2016, 22, 357–364. [Google Scholar]
  22. Cheţa, M.; Marcu, M.V.; Borz, S.A. Workload, exposure to noise, and risk of musculoskeletal disorders: A case study of motor-manual tree felling and processing in poplar clear cuts. Forests 2018, 9, 300. [Google Scholar] [CrossRef]
  23. Borz, S.A.; Cheţa, M.; Bîrda, M.; Proto, A.R. Classifying operational events in cable yarding by a machine learning application to GNSS-collected data: A case study on gravity-assisted downhill yarding. Bull. Transilv. Univ. Bras. Ser. II For. Wood Ind. Agric. Food Eng. 2022, 15, 13–32. [Google Scholar] [CrossRef]
  24. Zar, J.H. Biostatistical Analysis, 5th ed.; Pearson Prentice Hall: Upper Saddle River, NJ, USA, 2016; 944p. [Google Scholar]
  25. Nelson, W.A. Statistical Methods. In Encyclopedia of Ecology; Jørgensen, S.E., Fath, B.D., Eds.; Academic Press: Cambridge, MA, USA, 2008; pp. 3350–3362. ISBN 9780080454054. [Google Scholar] [CrossRef]
  26. Real Statistics Using Excel, Resampling Data Analysis Tool. Available online: https://real-statistics.com/non-parametric-tests/resampling-data-analysis-tool/ (accessed on 23 November 2023).
  27. Real Statistics Using Excel. Available online: https://real-statistics.com/ (accessed on 23 November 2023).
  28. Helander, M. A Guide to Human Factors and Ergonomics, 2nd ed.; CRC Press: Boca Raton, FL, USA, 2006; pp. 236–255. ISBN 0-203-68775-2. [Google Scholar]
  29. Camargo, D.A.; Munis, R.A.; Miyajima, R.H.; Lima, R.C.A.; Simões, D. Mechanized wood extraction: Impacts on Operators’ hearing health. Forests 2022, 13, 1553. [Google Scholar] [CrossRef]
  30. Camargo, D.A.; Munis, R.A.; Simões, D. Investigation of exposure to noise among forestry machine operators: A case study in Brasil. Forests 2021, 12, 299. [Google Scholar] [CrossRef]
  31. Spinelli, R.; Visser, R. Analyzing and estimating delays in harvester operations. Int. J. For. Eng. 2008, 19, 36–41. [Google Scholar] [CrossRef]
  32. Gallo, R.; Grigolato, S.; Cavalli, R.; Mazzetto, F. GNSS-based operational monitoring devices for forest logging operation chains. J. Agric. Eng. 2013, XLIV, e27. [Google Scholar] [CrossRef]
  33. Papandrea, S.F.; Stoilov, S.; Angelov, G.; Panicharova, T.; Mederski, P.S.; Proto, A.R. Modeling Productivity and Estimating Costs of Processor Tower Yarder in Shelterwood Cutting of Pine Stand. Forests 2023, 14, 195. [Google Scholar] [CrossRef]
  34. EU Directive 2003/10/EC. Available online: https://eur-lex.europa.eu/legal-content/EN/TXT/PDF/?uri=CELEX:02003L0010-20190726 (accessed on 22 January 2024).
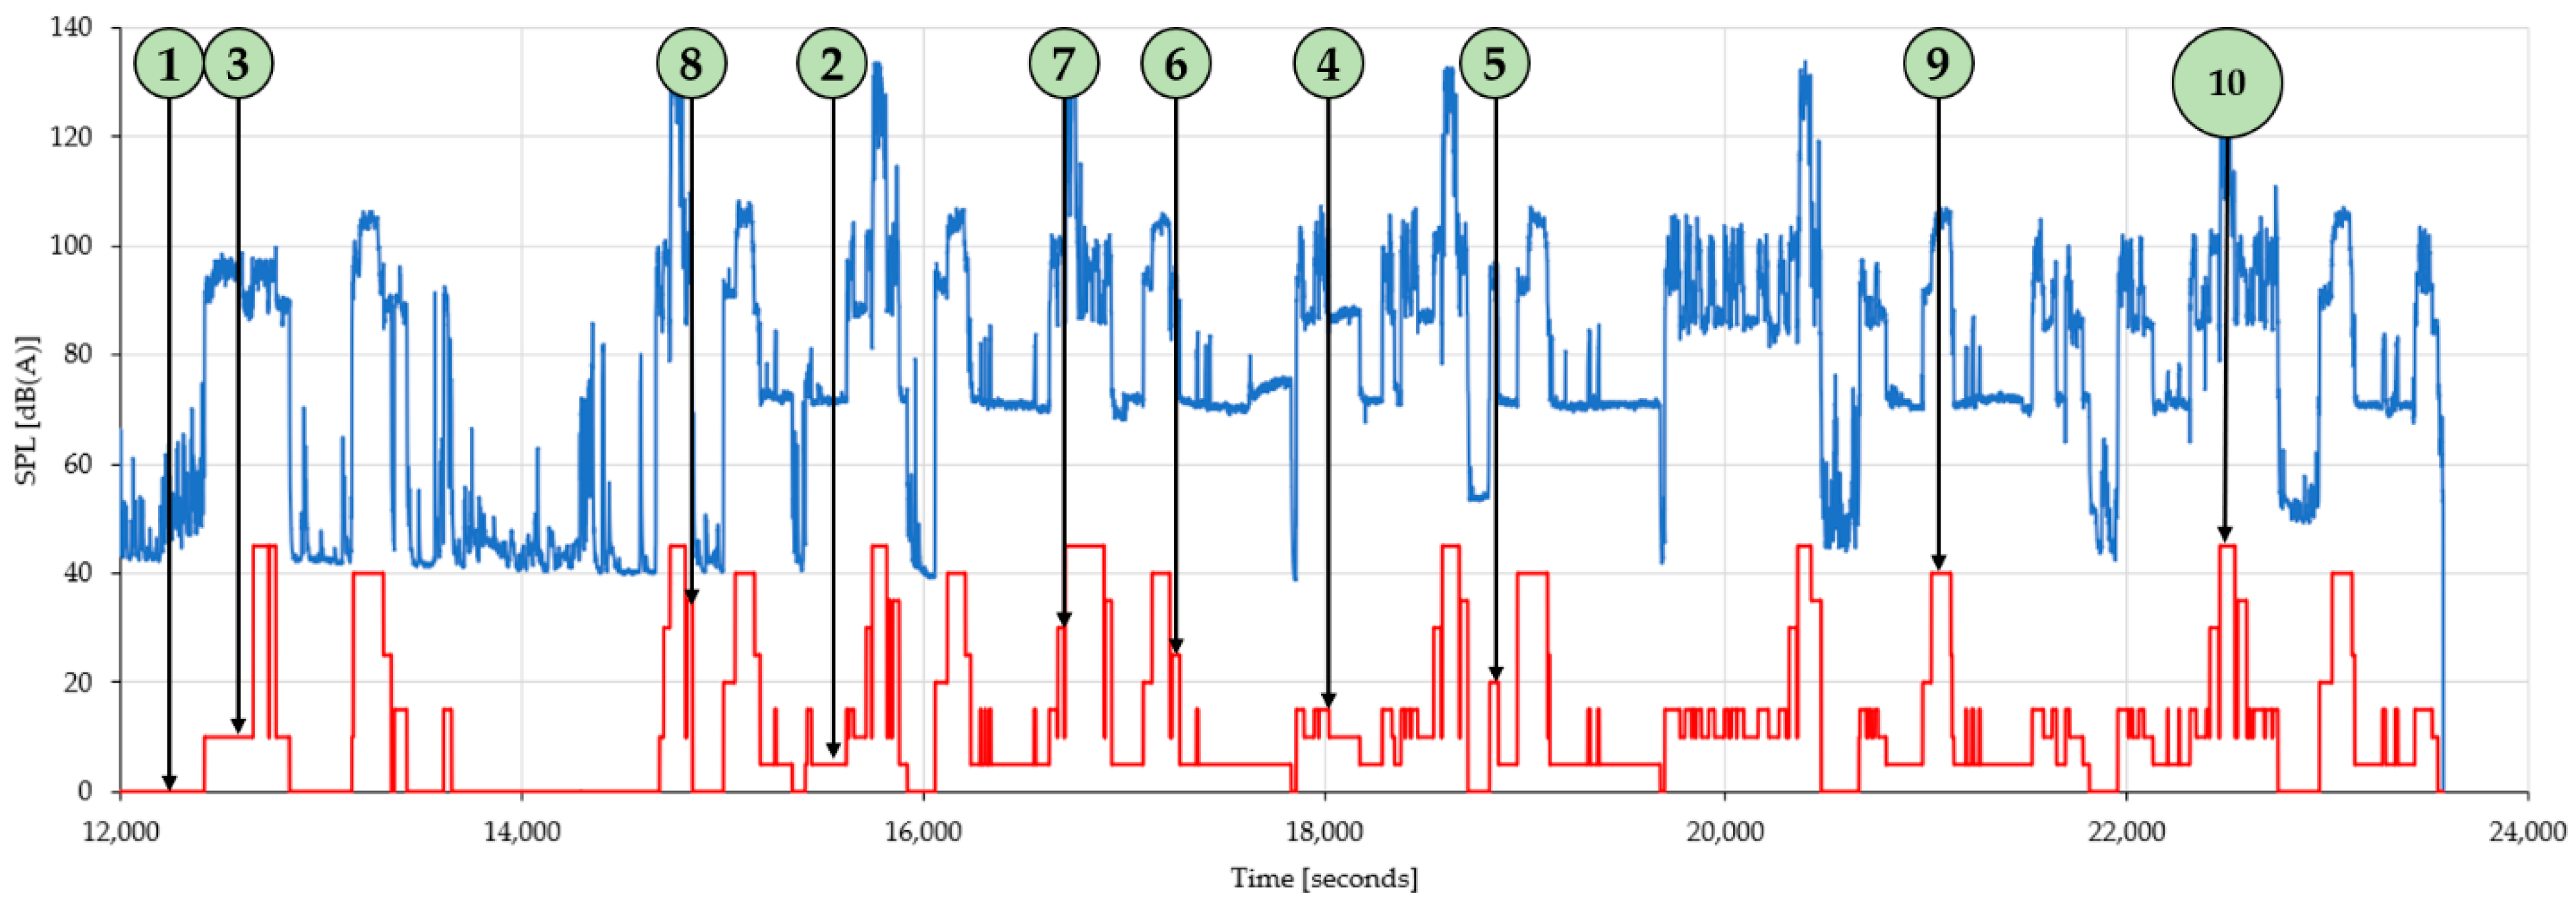
Figure 1. Example of event-based distribution in the time domain. Note: continuous blue line stands for instant readings of the sound pressure level (SPL) measured in dB(A); continuous red line stands for the occurrence of events described in Table 1: 1—engine off, 2—engine off, cooling, 3—engine on, no work, 4—cable work, 5—lifting the cable, 6—lowering the cable, 7—lifting the load, 8—lowering the load, 9—empty turn, 10—loaded turn.
Forests 15 00360 g001
Figure 2. Description of machine under study: 1—machine protection against adverse weather built on site, 2—location of air brake, 3—drum of mainline, 4—lever controls, 5—mainline, 6—placement of noise dosimeter on worker’s helmet.
Forests 15 00360 g002
Figure 3. Share of empty and loaded turn times in the average work cycle time, depending on yarding distance (ED), lateral yarding distance (PSD), and skyline height (H). Note: PSD10 to PSD50—lateral yarding distances of 10 to 50 m, H10 to H20—skyline heights of 10 to 20 m.
Forests 15 00360 g003
Figure 4. Exposure to noise depending on yarding distance (ED, m), lateral yarding distance (PSD, m), and skyline height (H): (a) simulated exposure to noise based on data considering a 1-h break during the day; (b) simulated exposure to noise based on data calculated for 7 h of work.
Forests 15 00360 g004
Figure 5. Comparison of simulation results with existing standards and rules concerning noise exposure depending on working time. Legend: continuous red line represents permissible durations in the US, as referenced in Helander [28] (i.e., to be acceptable, levels of exposure represented in brown, green, and orange colors should be below the continuous red line in the graph); brown dots stand for the combined exposure during the empty and loaded turns, as computed from each scenario; green dots stand for the exposure simulated from scenarios when considering a 1-h break; and orange dots stand for the exposure simulated from scenarios based on continuous work for 7 h. Note: the thresholds set by the European standards [20] would be placed well below the US standards and simulated data.
Forests 15 00360 g005
Table 1. Description of observed events.
Event 1AbbreviationDescription
Engine offEOFFLength of time the machine engine was found to be switched off as seen in the video files, with no other sources identified emitting noise. In this event, the only noise recorded was that of the surrounding environment, and it included the time spent to set up and position the data collectors.
Engine off, coolingECOOLLength of time the machine engine was found to be switched off as seen in the video files, but with an additional source of noise, in addition to that of the environment, due to the activation of the engine cooling mechanism.
Engine on, no workEONLength of time the machine engine was found to be switched on as seen in the video files, but no active operation of the machine was observed in the media files.
Cable workCWLength of time the drum of the mainline was observed to be engaged to support lateral yarding, with or without the support of the engine.
Lifting the cableLICLength of time the drum of the mainline was observed to be engaged, so as to lift the cable when the carriage was at the landing site with the support of the engine.
Lowering the cableLOCLength of time the drum of the mainline was observed to be engaged, so as to lower the cable when the carriage was at the lateral yarding place, mainly with the engine turned on.
Lifting the loadLILLength of time the drum of the mainline was observed to be engaged, so as to lift the load when the carriage was at the lateral yarding site with the support of the engine.
Lowering the loadLOLLength of time the drum of the mainline was observed to be engaged, so as to lower the load when the carriage was at the landing site, mainly with the engine turned on.
Empty turnETLength of time the drum of the mainline was observed to be engaged, so as to move the carriage from the landing to the lateral yarding site with the support of the engine.
Loaded turnLTLength of time the drum of the mainline was observed to be engaged, so as to move the carriage from the lateral yarding site to the landing site, mainly with the engine turned on.
Note: 1 Duration of events was measured in seconds.
Table 2. Descriptive statistics of data collected on sound pressure level.
EventAbbreviationNumber of ObservationsMinimum Value
dB(A)
Maximum Value
dB(A)
Median Value
dB(A)
Mean Value
dB(A)
Standard Deviation
dB(A)
Engine offEOFF15,03538.899.947.950.58.89
Engine off, coolingECOOL328860.883.471.371.51.47
Engine on, no workEON148869.198.787.087.83.43
Cable workCW139255.8110.993.993.36.87
Lifting the cableLIC31474.997.592.092.12.40
Lowering the cableLOC15774.698.988.588.65.16
Lifting the loadLIL20778.9103.599.799.13.42
Lowering the loadLOL23766.0119.297.396.96.20
Empty turnET77581.3108.3104.0102.54.25
Loaded turnLT68185.8134.5111.1111.315.60
Note: none of the variables passed the normality test (Shapiro–Wilk, α = 0.05, p > 0.05); the EOFF sample was too large to be handled by the normality test.
Table 3. Statistics for the resampling procedure.
EventAbbreviationHypothesized Mean
dB(A)
Sample Mean
dB(A)
p-ValuePopulation Mean
dB(A)
Lower
Confidence
dB(A)
Upper
Confidence
dB(A)
Engine offEOFF50.550.520.743650.5250.3850.67
Engine off, coolingECOOL71.571.540.149271.5471.4971.59
Engine on, no workEON87.887.850.585187.8587.6788.03
Cable workCW93.393.310.974393.3092.9493.66
Lifting the cableLIC92.192.080.903392.0891.8192.34
Lowering the cableLOC88.688.650.904288.6587.8289.45
Lifting the loadLIL99.199.140.882599.1498.6699.58
Lowering the loadLOL96.996.940.919396.9496.1297.73
Empty turnET102.5102.500.9983102.50102.20102.80
Loaded turnLT111.3111.330.9598111.34110.16112.52
Disclaimer/Publisher’s Note: The statements, opinions and data contained in all publications are solely those of the individual author(s) and contributor(s) and not of MDPI and/or the editor(s). MDPI and/or the editor(s) disclaim responsibility for any injury to people or property resulting from any ideas, methods, instructions or products referred to in the content.

