1. Introduction
In standing trees, the function of the bark is of great consequence throughout the tree’s lifespan. It serves to safeguard the stems against fire and other hazards, and to facilitate the repair of stem damage [
1,
2]. Conversely, in felled trees, the value of the bark is minimal [
3]. The prediction of bark thickness (BT) is a valuable tool for obtaining the ratio of diameter inside bark, which is often costly, time-consuming, and susceptible to measurement errors when applied to standing trees [
4]. Based on measurements and statistical models produced for bark thickness, bark factor, bark area, weight or volume, it is possible to estimate bark resources at the regional scale [
5,
6,
7,
8,
9,
10]. BT is associated with the survival of trees in habitats that experience fires [
2,
11,
12], which in turn explains the dominance of certain species [
13] based on the observation that tree mortality is low for individuals with thick bark that are exposed to frequent, low-intensity fires [
14], as well as to medium-intensity fires [
15]. The outer BT plays a fundamental role in preventing damage to the conducting phloem, the vascular cambium, and the sapwood from heat exposure [
14]. The possession of a high relative BT at an early age may be regarded as a tree adaptational feature to fires [
13,
16]. Consequently, at the global scale, BT has been identified as a reliable predictor of the local fire regime [
17,
18,
19,
20,
21]. Additionally, BT is a plant trait linked to frost ring probability on trees. This is due to the fact that the frequency of frost rings decreases as bark thickness increases with cambial age [
22]. In addition to its protective function, bark is also a useful indicator of pollution and has a variety of applications, including in medicine, energy, agriculture (for mulching), the production of boards, cork, water and gas purification, the manufacture of clothing, and pottery [
23]. In conjunction with the presence of gums and resins, BT is a valuable trait for the study of disturbed tree communities [
24]. In areas that have been subject to fire, BT is associated with the reproduction of beetles [
25]. Bark plays a role in noise reduction within tree belts, with sound being absorbed to a slightly greater extent by coniferous species than by broadleaved species [
26]. Furthermore, the carbon present in tree bark is linked to bark morphology [
27].
The thickness of bark is subject to genetic control [
7,
28,
29,
30], with environmental factors influencing the cambial activity of the phellogen [
30,
31] and, thus, the thickness of the resulting bark. In a given species or provenance, BT varies in accordance with the tree size, age, crown ratio, social position, height along the stem, and site [
7,
29,
32]. The bark thickness of major woody plant species exhibits significant variation with spatial location, including latitude and longitude [
29,
33], as well as altitude [
10]. Stem size is the primary driver of variation in bark thickness, with environmental factors playing a less significant role [
34]. A notable trend indicates an increase in BT with tree girth [
24]. The effect of seed source origin on BT was found to be significantly influenced by temperature, frost days, and precipitation [
35]. Bark thickness is observed to decrease with increasing height along the stem [
29,
30]. In some instances, a significant alteration in the structure of the bark is evident along the stem, manifesting as a transition area where the bark undergoes a notable change from thick and rough to thin and smooth [
36]. The outer bark thickness decreases more rapidly with increasing stem height on fire-resistant species than on fire-sensitive species [
14]. The variability in BT above and below breast height (BH) is dependent on the total tree height (H). Consequently, the lower the variability in BT above BH, the more precise the predictions on BT [
29]. For a given diameter at breast height (DBH), BT increases as tree height decreases. This trend is most pronounced in smaller trees [
6]. As trees age, their BT increases [
37], which may result in a potential effect of isolation and passive protection against the harmful effects of frosts [
22]. There is a notable discrepancy in the relative age BT among diverse plant categories, including gymnosperms and angiosperms, and life forms, such as evergreen and deciduous species [
33]. Gymnosperms exhibit a greater thickness of the outer bark than angiosperms, while the inner bark is likely to scale with plant metabolic demands [
38]. Trees exhibiting more rapid growth have been observed to have slightly thinner bark for a given DBH [
39]. BT traits have been found to be affected by spatial factors (20%), climatic factors (8%), and their interaction (8%) [
33]. However, species with different bark investment strategies have been documented to coexist in moist and dry tropical forests [
2].
The majority of BT measurements tend to disregard the fact that bark is composed of both the dead outer bark and the living inner bark [
40]. BT can be directly measured on both standing and felled trees using a bark gauge [
41,
42] or Pressler’s increment borer based on cores extracted with their bark [
32,
42]. BT can be determined more accurately by felling a tree and extracting disks for further measurements with a ruler [
7] and from cross-sectional area data based on a contour of the outside bark surface and of the inside bark boundary [
41]. Furthermore, accurate measurements on felled trees are those based on the diameter of the tree trunk, measured over the bark and under the bark before and after the bark was removed by peeling [
6]. The irregular and curved nature of bark boundaries introduces a potential for error when using bark gauges, which have been observed to overestimate thickness by 13.6% ± 28.4% [
29,
42,
43]. Accordingly, bark thickness should be measured once on smaller trees and twice in perpendicular directions, with the resulting values averaged for each tree with a DBH exceeding 20 cm [
29,
32]. Alternatively, multiple measurements can be taken at different points on a given cross-section, thereby enhancing the precision of the measurements [
8]. A bark fissure index may be employed to assess the extent of bark fissuring from BT, with measurements taken at several random points around the circumference of the tree or at 40 points per stem disk [
27]. Outer bark scales tend to be thicker in fire-prone species and very thin when bark photosynthesis is favoured, reflecting diverse adaptive factors [
34,
38]. Consequently, outer BT is less closely correlated with the stem diameter compared with inner BT, which is closely correlated with tree size [
34]. The contour method is founded upon trigonometric analysis and a computer program that estimates the boundaries and area of the bark [
41]. The use of disks results in reductions in the inner and outer BT during the process of drying, which vary depending on the cardinal direction. This suggests that the variability in BT observed around the circumference of a standing tree may be a reflection of differences in bark moisture content [
40]. Additionally, the relative outer BT is subject to a height-by-habitat interaction [
14].
Over time, a number of models have been developed with the aim of estimating bark thickness at breast height. These models are based on measurements taken on standing trees [
10,
32,
44,
45]. Other models estimate stem bark thickness based on measurements taken along the stem on felled trees [
6,
10,
46]. The required sample size for a BT model is dependent on the desired complexity. Typically, a total sample size of 50–250 trees is necessary [
43]. At least two measurements of BT at right angles around the stem are required, with their average used as a measure of BT [
47]. There is a paucity of studies that provide bark models based on large sample plots and trees [
9,
45,
46,
48]. In the case of local and regional models of stem bark thickness, Stängle et al. [
43] recommend a minimum of one measurement location every two metres along the stem, with a minimum of five BT measurements taken at each of these locations in order to achieve an allowable error of <15%. Additionally, bark volume is frequently overestimated by up to 40% due to the inclusion of diameter over bark measurements, which encompass vacant space within fissures [
27]. The most common method for estimating BT is through the use of regression solutions. These include the simple linear model [
48,
49,
50,
51], polynomial regression [
4], and other forms of non-linear regression. Such regressions encompass the power function [
42,
51], exponential functions [
51], logarithmic equations [
45], multiple non-linear regression and generalized linear models [
46]. In addition to regression analysis, other techniques have been employed, including taper functions [
4,
48,
52,
53], mixed-effects modelling [
4,
30], and artificial neural networks (ANNs) [
32,
37,
53], with a high degree of adjustment and accuracy. The highest correlation between bark thickness at breast height and other variables was found with DBH, H, social position, and crown base height [
32]. Meanwhile, stem bark thickness can be predicted using a function of over bark diameter, position up the stem, tree height, and over bark DBH [
6] or with age [
37]. The addition of tree height, stand age, site index, or stand density allows for a more comprehensive explanation of the variation in double bark thickness (DBT) at the stand level than is possible using DBH alone [
45]. The functions of the stem’s relative height and cross-sectional cork area increment demonstrated superior performance [
30].
As in other countries, for example, Germany [
54], in Romania, DBT estimation is currently conducted using stem diameter over bark (DOB) by a first or second-degree polynomial function, depending on the species [
55], or by direct measurement on logs. Nevertheless, it is essential to consider the variability of BT at different levels when developing BT equations [
54]. This aspect has been acknowledged since 1972, when tables for estimating bark thickness and volume for 24 species in Romania were published [
56]; however, it has been perceived as having a relatively minor influence. The development of new models for estimating BT along the stem based on existing large databases [
48,
57] may prove beneficial for commercial tree species in Romania, as the current wood tracking system of the forest supply chain requires accurate knowledge of bark thickness. The aim of this study was to develop new models for estimating the stem bark thickness of three economically valuable species: Norway spruce (
Picea abies (L.) Karst), European beech (
Fagus sylvatica L.), and pedunculate oak (
Quercus robur L.). These species occupy 22%, 31%, and 2% of the Romanian forest cover, respectively [
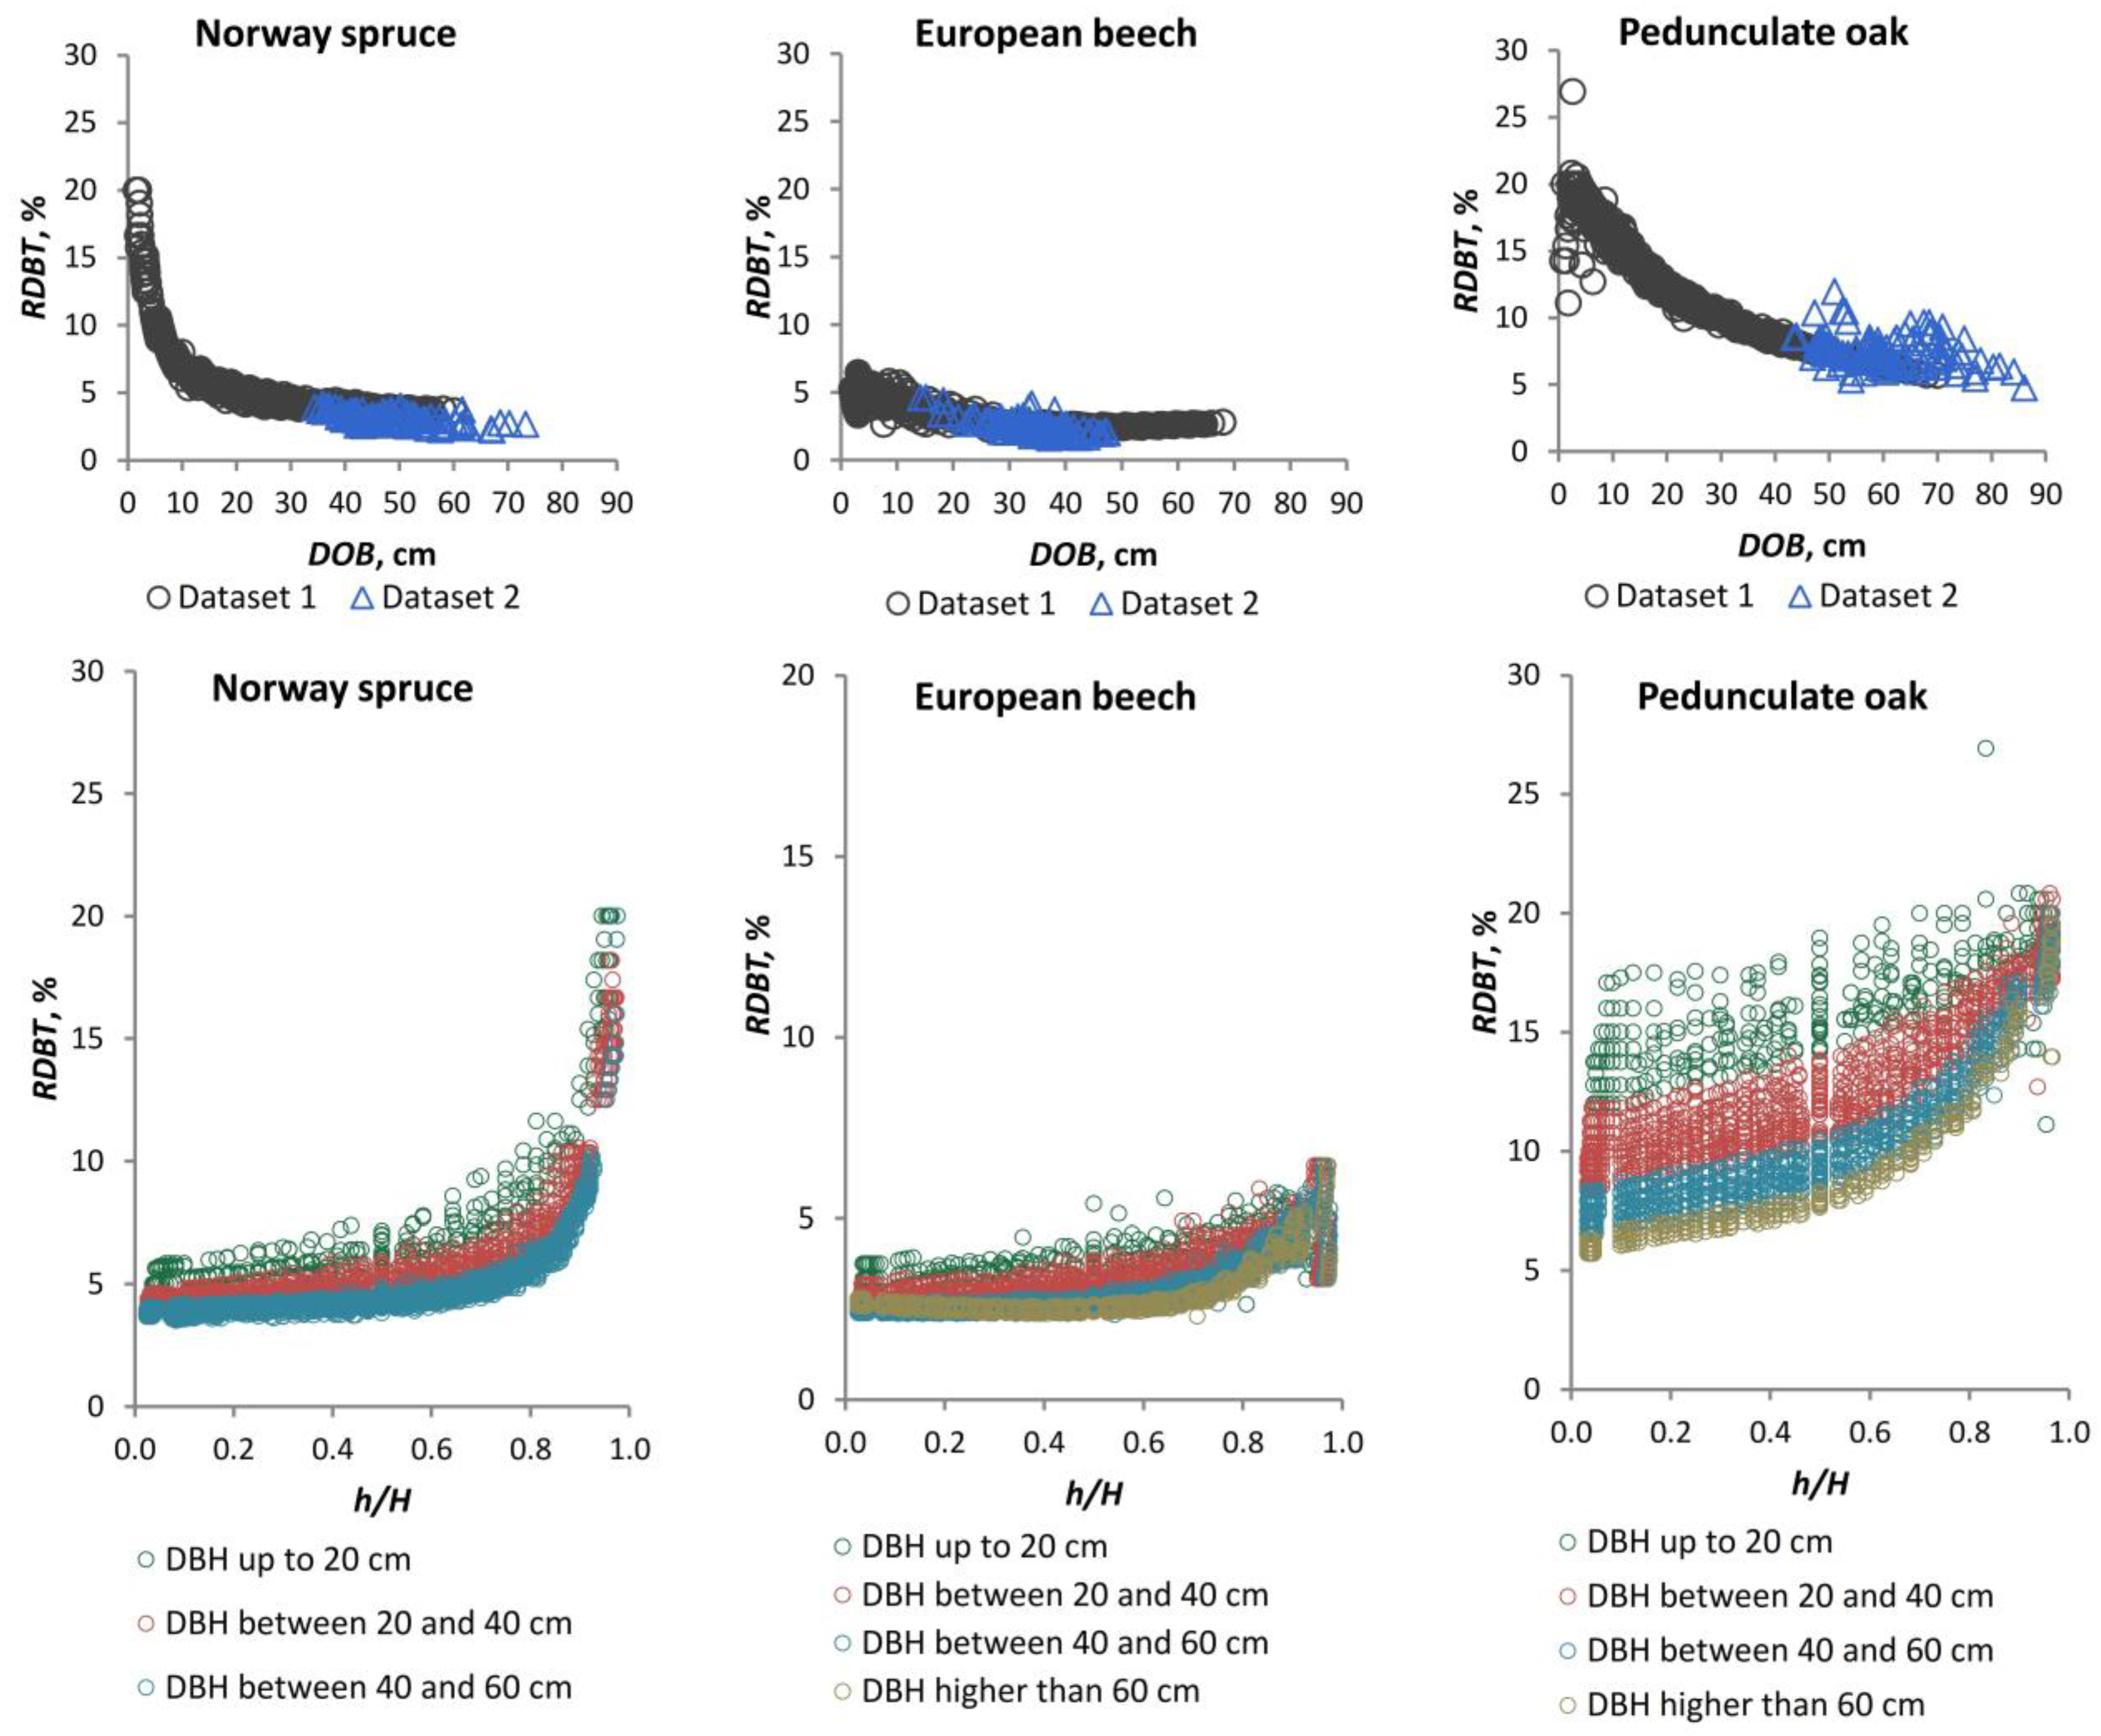
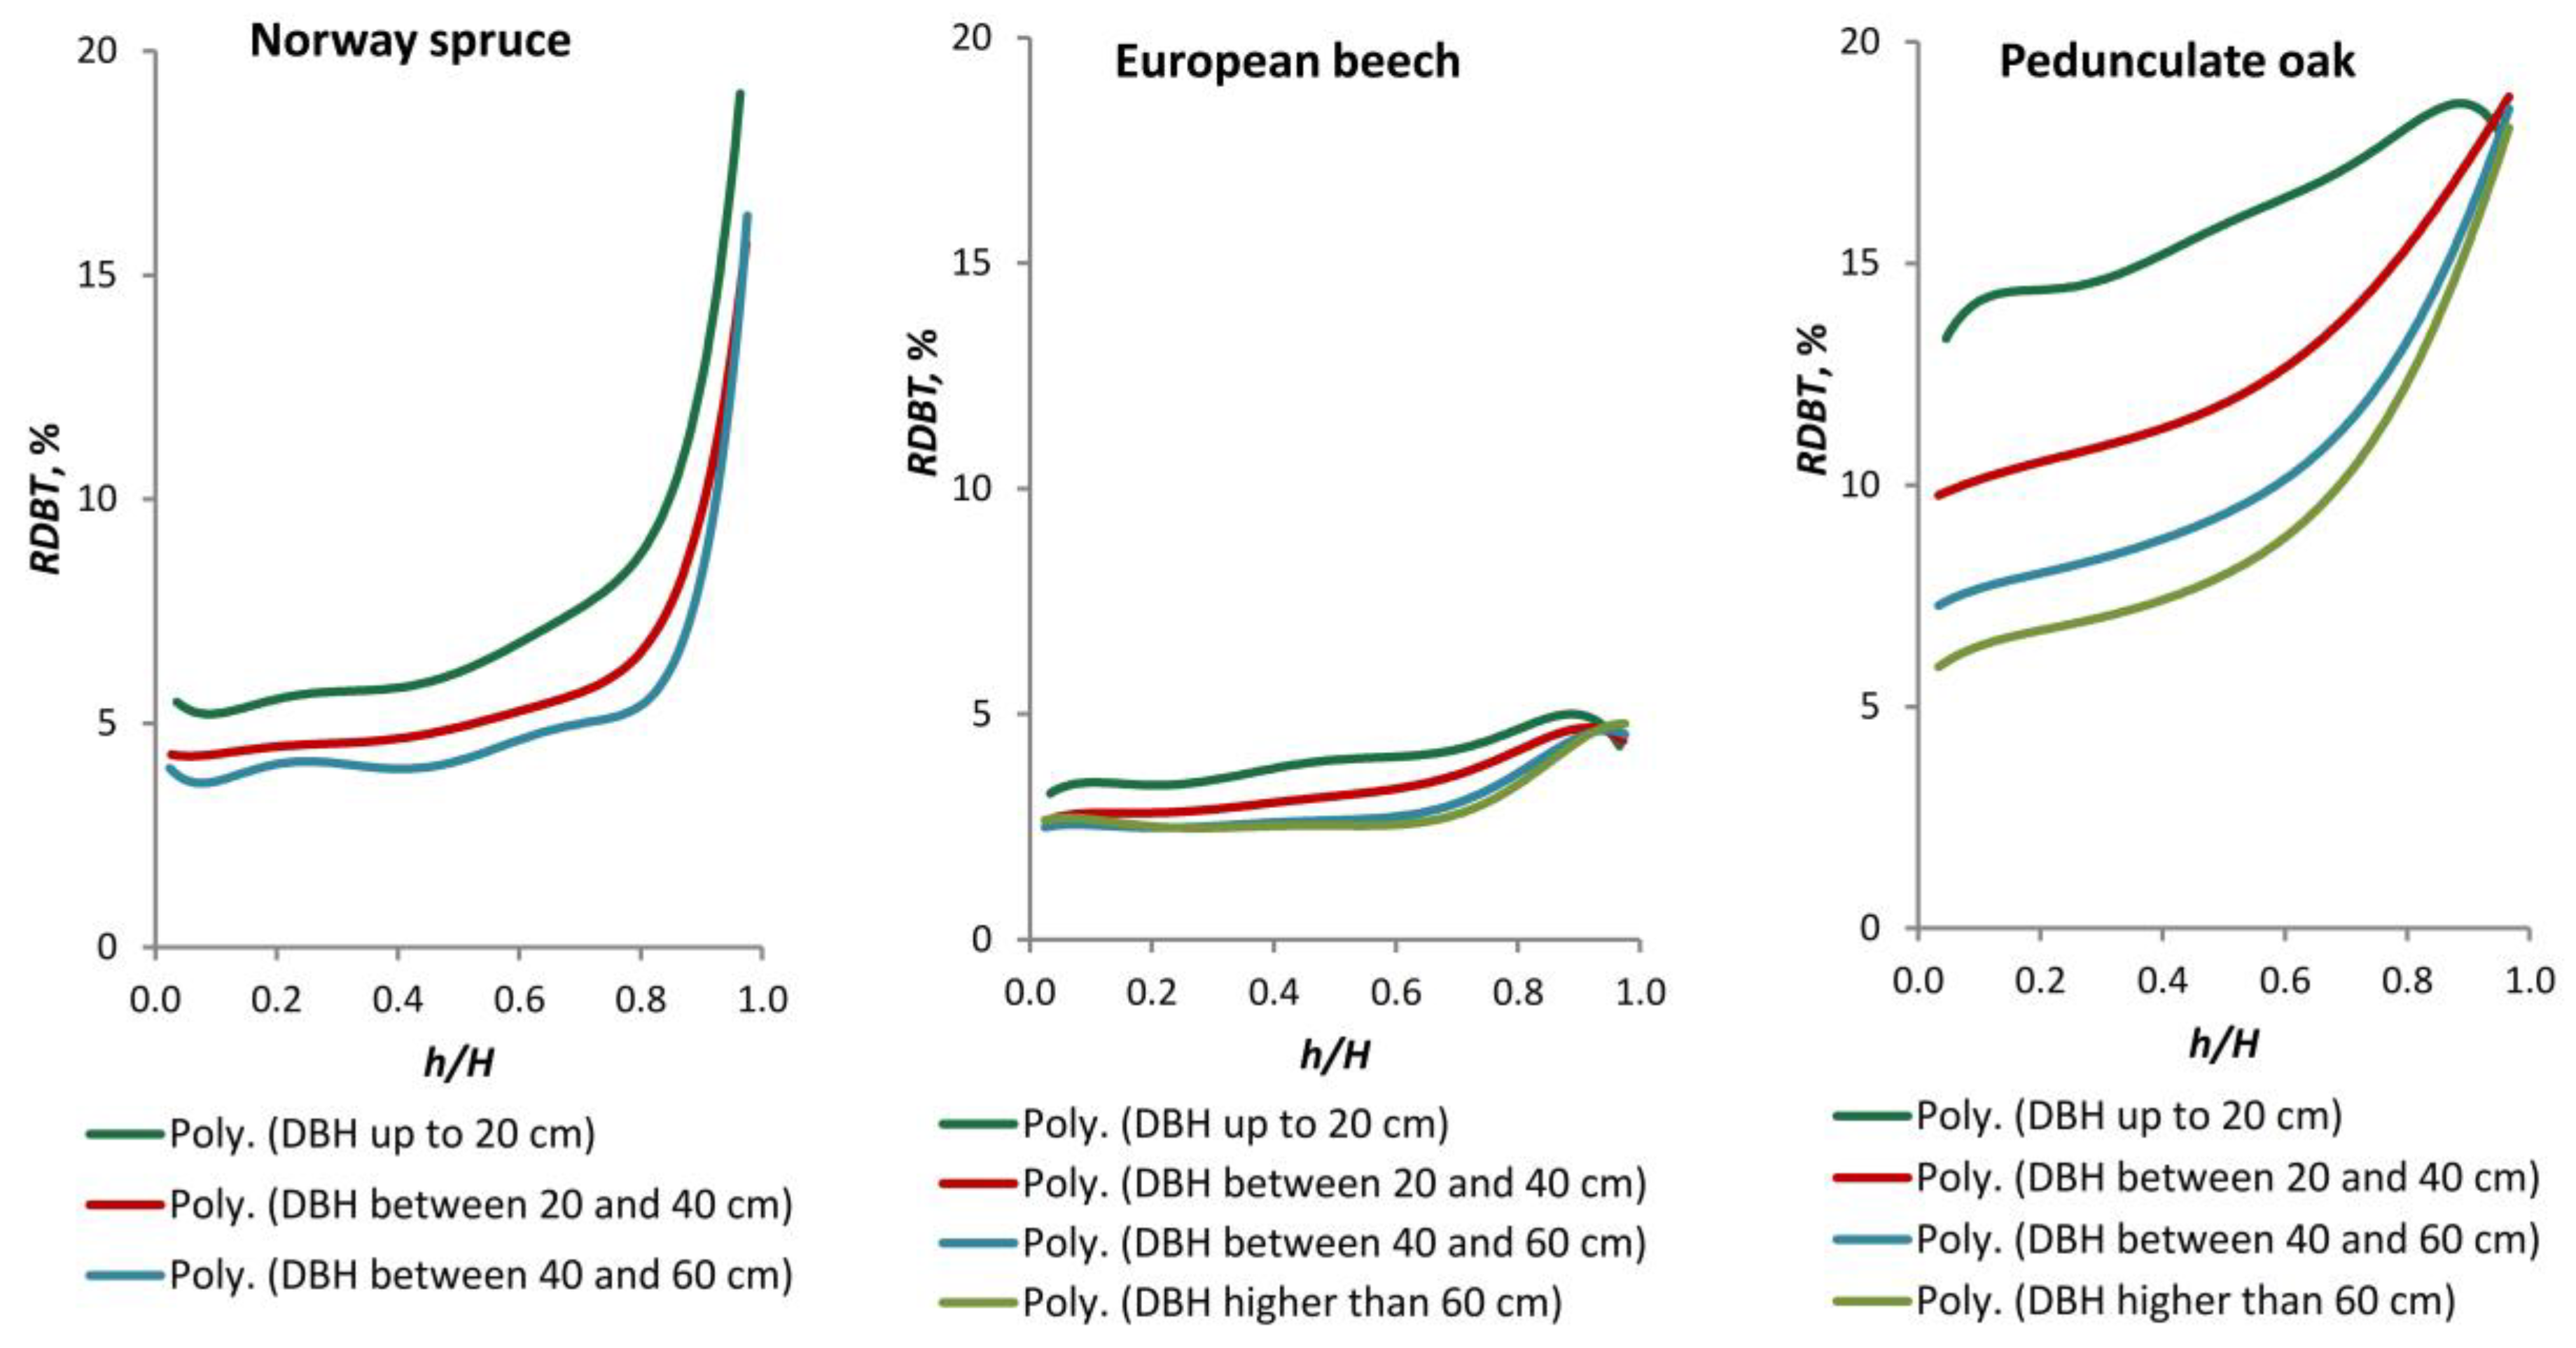
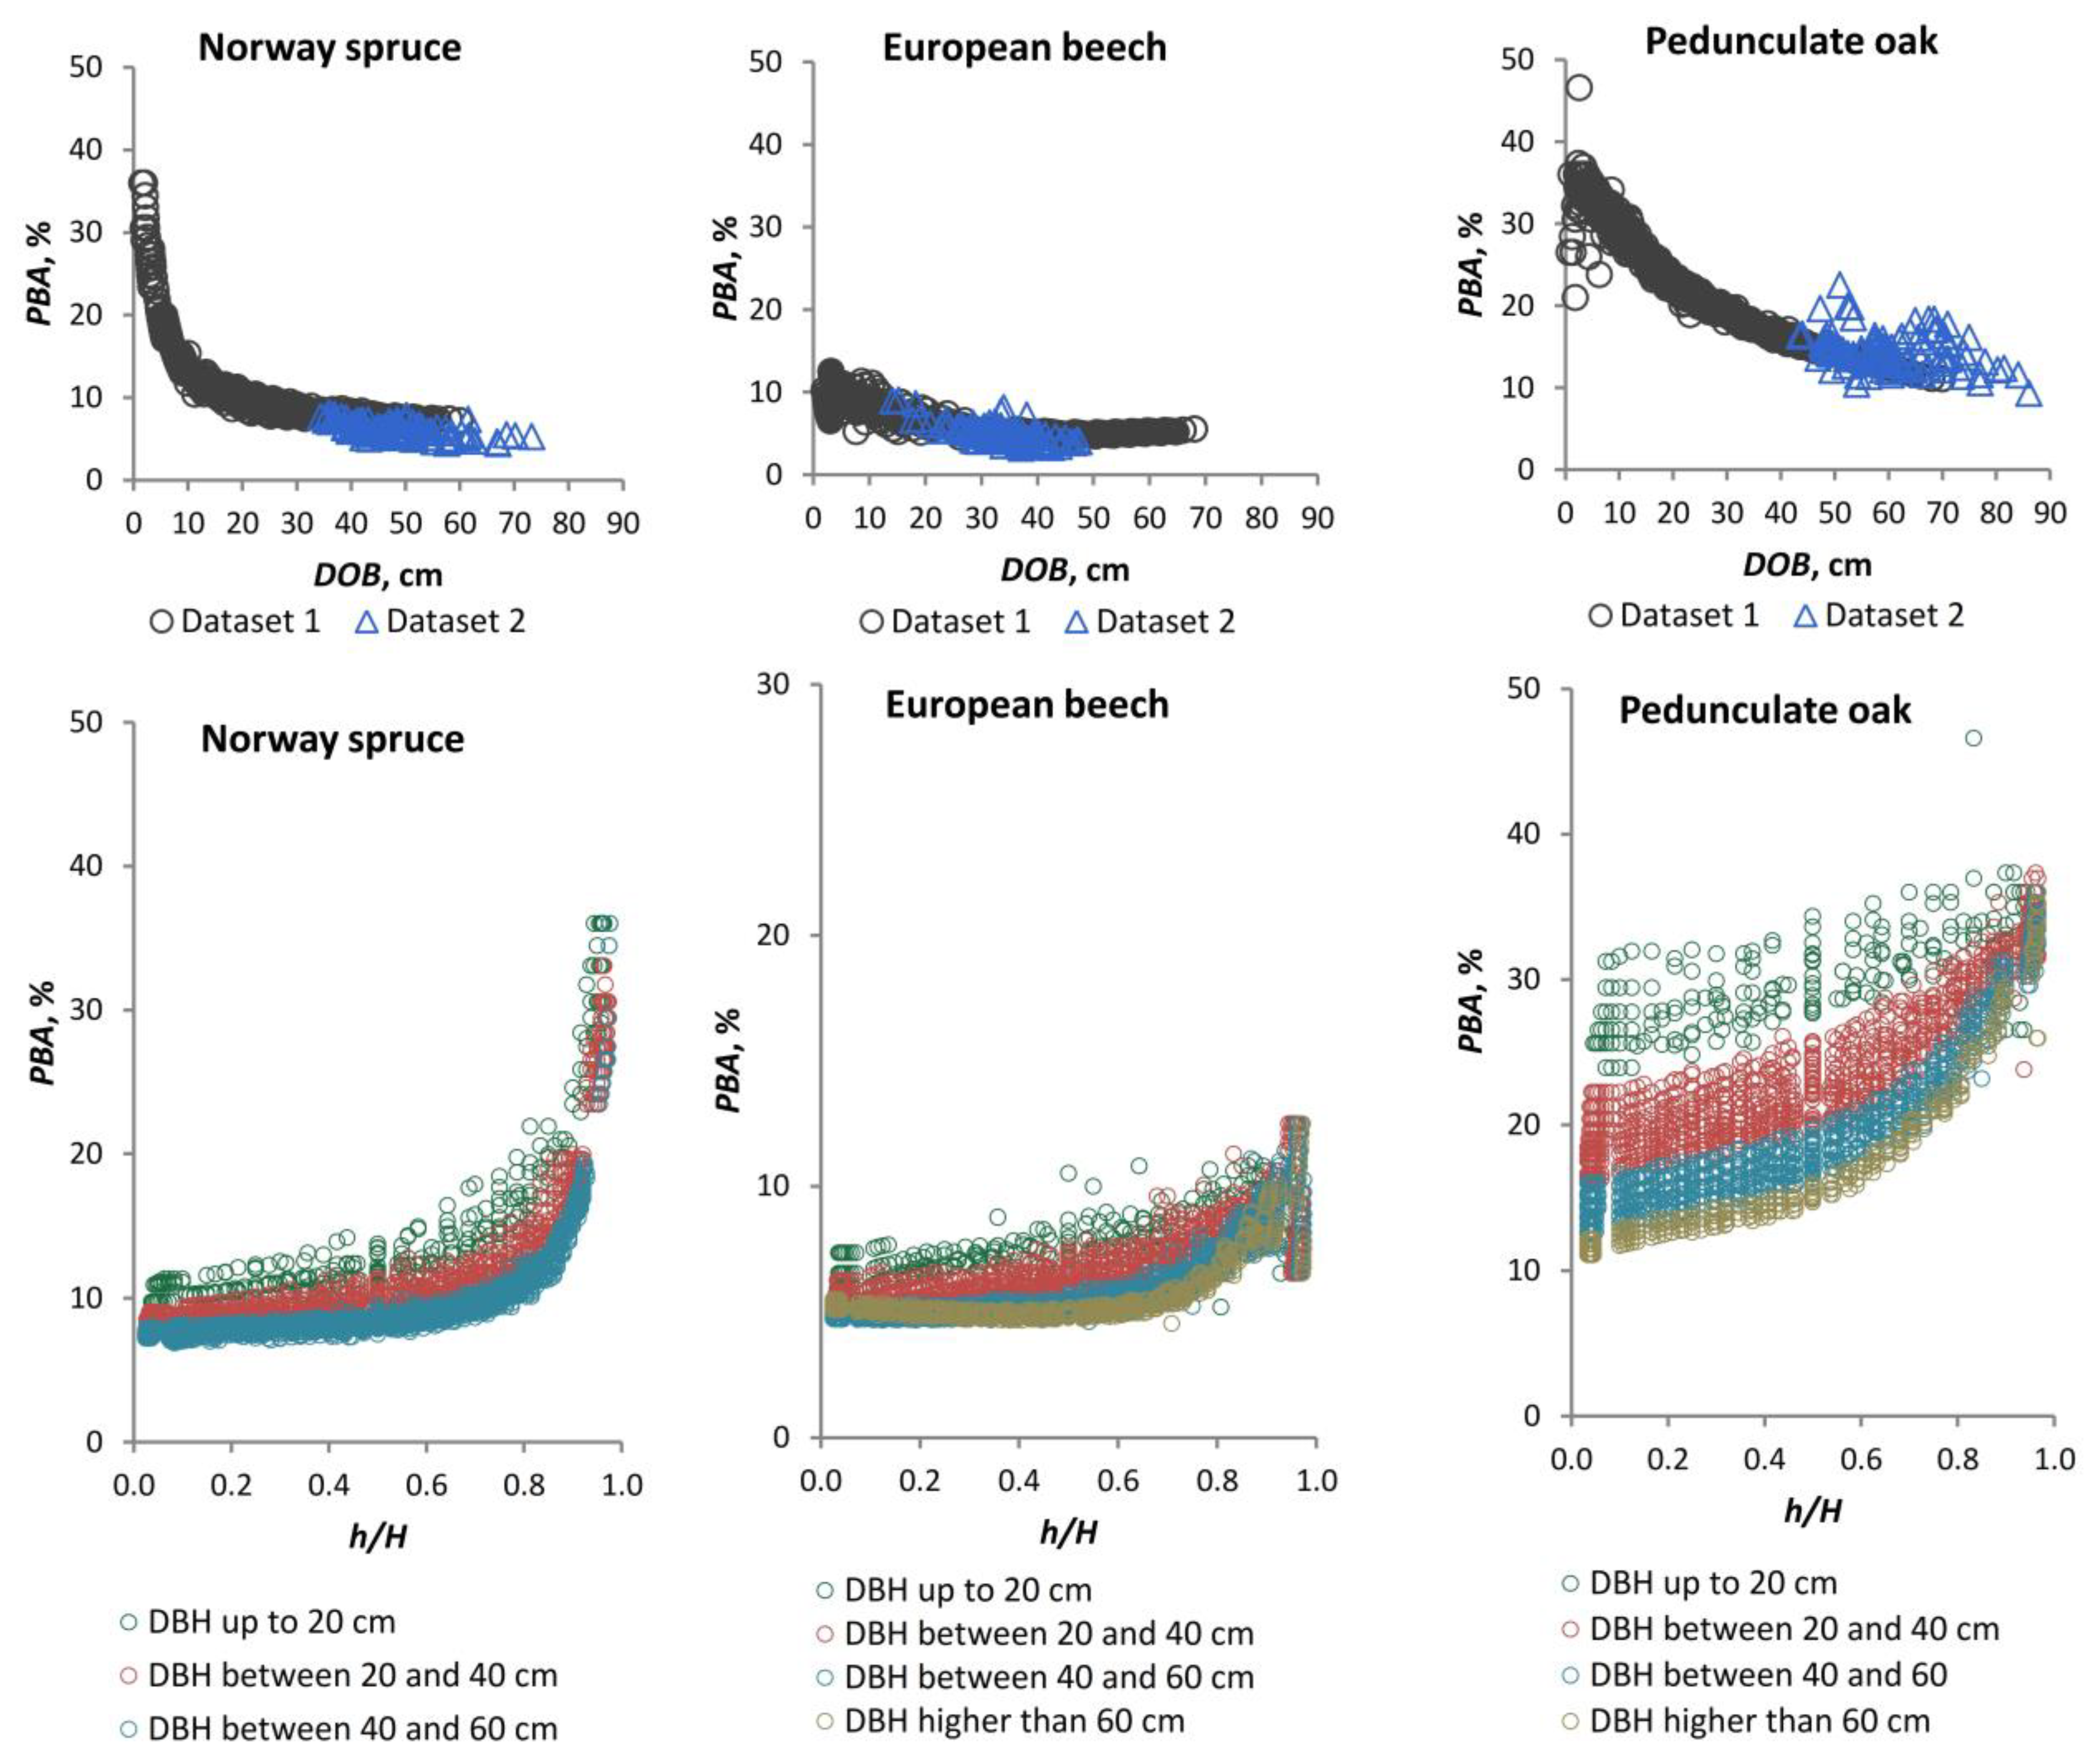
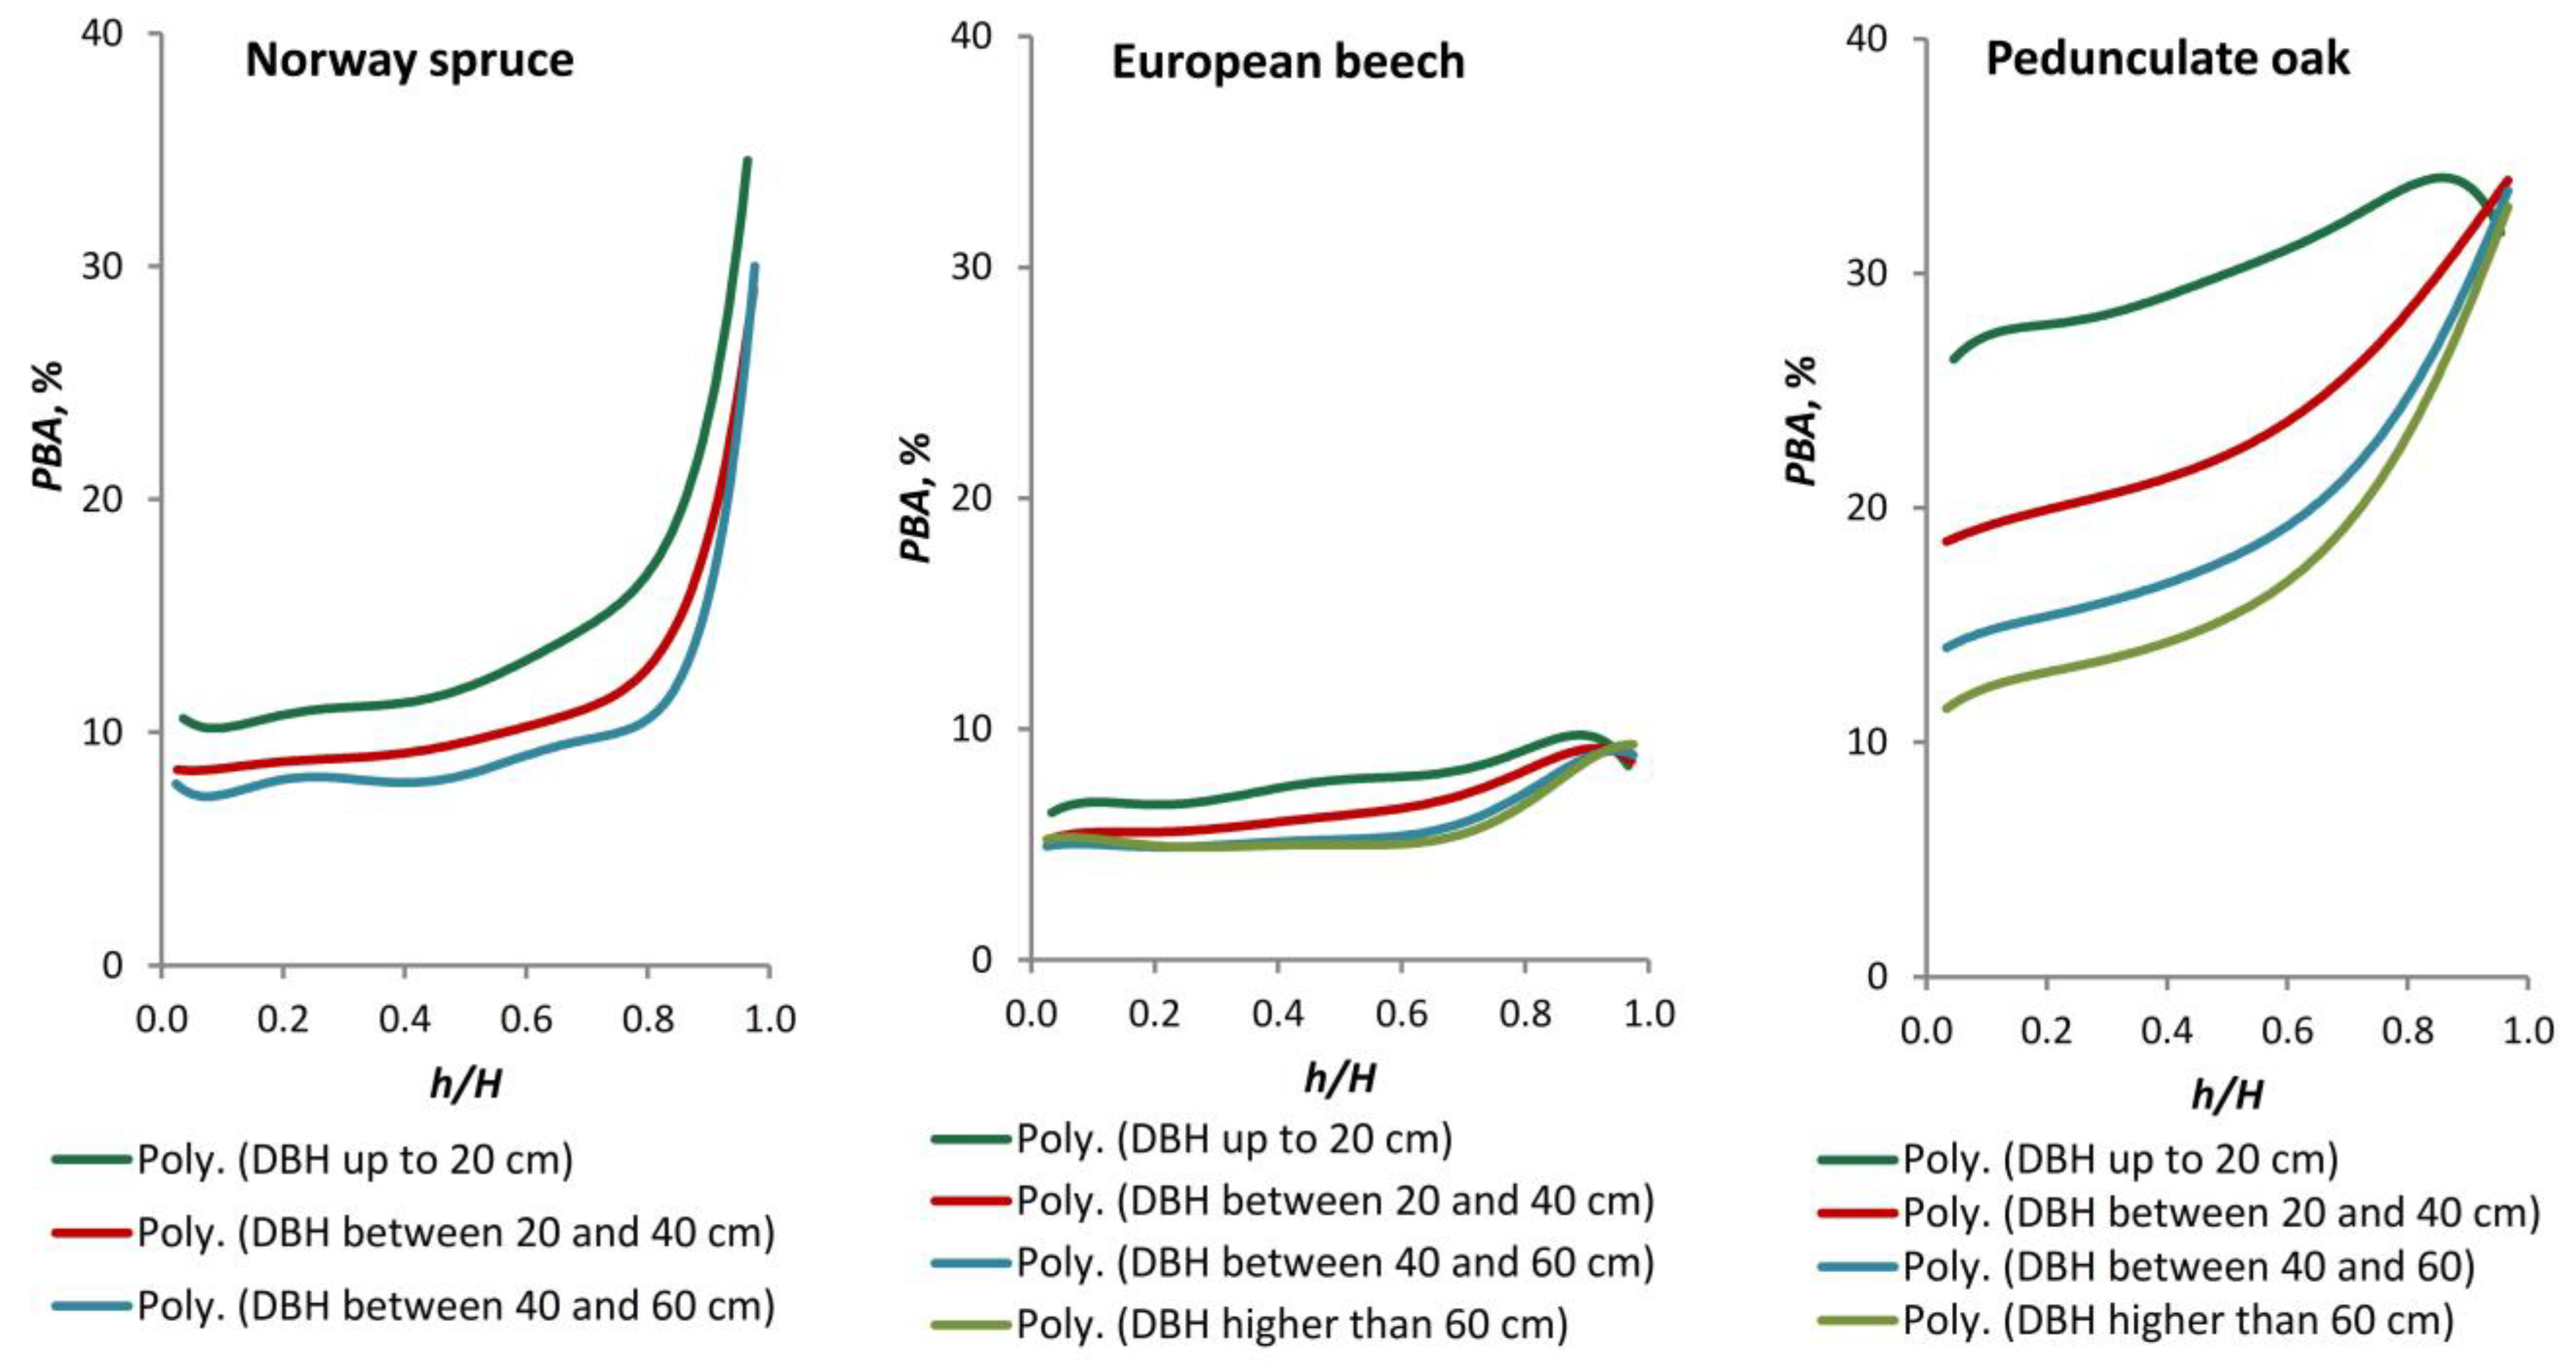
58]. In order to achieve the aim, the following objectives were set: (i) to create a database of stem bark thickness measurements for the three species, incorporating existing data from across the country and gathering new data to address the current needs for forest inventory; (ii) to develop models for estimating stem DBT, considering different types of equations and predictors, and to assess their accuracy; (iii) to analyse the variation in relative double bark thickness (RDBT) and the percentage of bark in the cross-sectional area (PBA) along the stem.


