Article

Bark Biometry Along the Stem for Three Commercial Tree Species in Romania

by
Maria Magdalena Vasilescu
Department of Forest Engineering, Forest Management Planning and Terrestrial Measurements, Transilvania University of Braşov, 500123 Braşov, Romania
Forests 2024, 15(12), 2264; https://doi.org/10.3390/f15122264
Submission received: 29 November 2024 / Revised: 16 December 2024 / Accepted: 21 December 2024 / Published: 23 December 2024
(This article belongs to the Special Issue Forest Biometrics, Inventory, and Modelling of Growth and Yield)

Abstract

:
In general, bark serves a protective role for trees and is genetically determined. The quantification of bark based on biometric characteristics is linked to studies on the distribution of forest species across the globe and vegetation fires. In Romania, on the other hand, the improvement of the wood traceability system requires an increase in the accuracy of the estimation of the biometric characteristics of bark and, implicitly, of the volume of wood under the bark. The aim of this study was to develop more precise models for predicting bark thickness along the stem of three key Romanian species, taking into account a comprehensive range of models and stem sections, including those with a diameter over bark smaller than 8 cm, which have been excluded in previous studies. The study is based on two datasets, one containing the national measurements of three commercially valuable forest species, i.e., Norway spruce (Picea abies (L.) Karst), European beech (Fagus sylvatica L.), and pedunculate oak (Quercus robur L.) from 12,186 trees, and a second dataset containing the measurements from 61 logs of the same species at a specific forest site. A set of seven double bark thickness (DBT) estimation models with stem diameter over bark (DOB), DOB and total tree height (H), DOB and relative height along the stem (h/H), and diameter over bark at breast height (DBH) and DOB as predictors were used. The DBT models were evaluated using the coefficient of determination (R2), mean absolute error (MAE), root mean squared error (RMSE), the Akaike information criterion (AIC), and the Bayesian information criterion (BIC). This led to the selection of two more accurate models, Model 2 (based on a third-degree polynomial) and Model 3 (based on a logarithmic function), with DOB as the predictor. Relative double bark thickness (RDBT) and proportion of bark area (PBA) were also estimated using a sixth-degree polynomial and relative height as a predictor variable after stratifying the data by DBH classes to reduce variability. The results of this study indicate that there is a need to complete the database, for all three forest species of commercial value in Romania especially for large trees with DBH greater than 60–70 cm. The models obtained for PBA are of great use to the industry and the economy, in particular in the context of the traceability of wood. This is due to the fact that PBA can be equated with the proportion of bark volume (PBV), which describes the variation in the proportion of bark in the volume of the wood assortments along the stem. For a given DBH, PBA and PBV demonstrate minimal variability in sections from the tree’s base to a relative height of 0.6; however, a pronounced increase is observed at crown level in sections above relative heights of 0.8.

1. Introduction

In standing trees, the function of the bark is of great consequence throughout the tree’s lifespan. It serves to safeguard the stems against fire and other hazards, and to facilitate the repair of stem damage [1,2]. Conversely, in felled trees, the value of the bark is minimal [3]. The prediction of bark thickness (BT) is a valuable tool for obtaining the ratio of diameter inside bark, which is often costly, time-consuming, and susceptible to measurement errors when applied to standing trees [4]. Based on measurements and statistical models produced for bark thickness, bark factor, bark area, weight or volume, it is possible to estimate bark resources at the regional scale [5,6,7,8,9,10]. BT is associated with the survival of trees in habitats that experience fires [2,11,12], which in turn explains the dominance of certain species [13] based on the observation that tree mortality is low for individuals with thick bark that are exposed to frequent, low-intensity fires [14], as well as to medium-intensity fires [15]. The outer BT plays a fundamental role in preventing damage to the conducting phloem, the vascular cambium, and the sapwood from heat exposure [14]. The possession of a high relative BT at an early age may be regarded as a tree adaptational feature to fires [13,16]. Consequently, at the global scale, BT has been identified as a reliable predictor of the local fire regime [17,18,19,20,21]. Additionally, BT is a plant trait linked to frost ring probability on trees. This is due to the fact that the frequency of frost rings decreases as bark thickness increases with cambial age [22]. In addition to its protective function, bark is also a useful indicator of pollution and has a variety of applications, including in medicine, energy, agriculture (for mulching), the production of boards, cork, water and gas purification, the manufacture of clothing, and pottery [23]. In conjunction with the presence of gums and resins, BT is a valuable trait for the study of disturbed tree communities [24]. In areas that have been subject to fire, BT is associated with the reproduction of beetles [25]. Bark plays a role in noise reduction within tree belts, with sound being absorbed to a slightly greater extent by coniferous species than by broadleaved species [26]. Furthermore, the carbon present in tree bark is linked to bark morphology [27].
The thickness of bark is subject to genetic control [7,28,29,30], with environmental factors influencing the cambial activity of the phellogen [30,31] and, thus, the thickness of the resulting bark. In a given species or provenance, BT varies in accordance with the tree size, age, crown ratio, social position, height along the stem, and site [7,29,32]. The bark thickness of major woody plant species exhibits significant variation with spatial location, including latitude and longitude [29,33], as well as altitude [10]. Stem size is the primary driver of variation in bark thickness, with environmental factors playing a less significant role [34]. A notable trend indicates an increase in BT with tree girth [24]. The effect of seed source origin on BT was found to be significantly influenced by temperature, frost days, and precipitation [35]. Bark thickness is observed to decrease with increasing height along the stem [29,30]. In some instances, a significant alteration in the structure of the bark is evident along the stem, manifesting as a transition area where the bark undergoes a notable change from thick and rough to thin and smooth [36]. The outer bark thickness decreases more rapidly with increasing stem height on fire-resistant species than on fire-sensitive species [14]. The variability in BT above and below breast height (BH) is dependent on the total tree height (H). Consequently, the lower the variability in BT above BH, the more precise the predictions on BT [29]. For a given diameter at breast height (DBH), BT increases as tree height decreases. This trend is most pronounced in smaller trees [6]. As trees age, their BT increases [37], which may result in a potential effect of isolation and passive protection against the harmful effects of frosts [22]. There is a notable discrepancy in the relative age BT among diverse plant categories, including gymnosperms and angiosperms, and life forms, such as evergreen and deciduous species [33]. Gymnosperms exhibit a greater thickness of the outer bark than angiosperms, while the inner bark is likely to scale with plant metabolic demands [38]. Trees exhibiting more rapid growth have been observed to have slightly thinner bark for a given DBH [39]. BT traits have been found to be affected by spatial factors (20%), climatic factors (8%), and their interaction (8%) [33]. However, species with different bark investment strategies have been documented to coexist in moist and dry tropical forests [2].
The majority of BT measurements tend to disregard the fact that bark is composed of both the dead outer bark and the living inner bark [40]. BT can be directly measured on both standing and felled trees using a bark gauge [41,42] or Pressler’s increment borer based on cores extracted with their bark [32,42]. BT can be determined more accurately by felling a tree and extracting disks for further measurements with a ruler [7] and from cross-sectional area data based on a contour of the outside bark surface and of the inside bark boundary [41]. Furthermore, accurate measurements on felled trees are those based on the diameter of the tree trunk, measured over the bark and under the bark before and after the bark was removed by peeling [6]. The irregular and curved nature of bark boundaries introduces a potential for error when using bark gauges, which have been observed to overestimate thickness by 13.6% ± 28.4% [29,42,43]. Accordingly, bark thickness should be measured once on smaller trees and twice in perpendicular directions, with the resulting values averaged for each tree with a DBH exceeding 20 cm [29,32]. Alternatively, multiple measurements can be taken at different points on a given cross-section, thereby enhancing the precision of the measurements [8]. A bark fissure index may be employed to assess the extent of bark fissuring from BT, with measurements taken at several random points around the circumference of the tree or at 40 points per stem disk [27]. Outer bark scales tend to be thicker in fire-prone species and very thin when bark photosynthesis is favoured, reflecting diverse adaptive factors [34,38]. Consequently, outer BT is less closely correlated with the stem diameter compared with inner BT, which is closely correlated with tree size [34]. The contour method is founded upon trigonometric analysis and a computer program that estimates the boundaries and area of the bark [41]. The use of disks results in reductions in the inner and outer BT during the process of drying, which vary depending on the cardinal direction. This suggests that the variability in BT observed around the circumference of a standing tree may be a reflection of differences in bark moisture content [40]. Additionally, the relative outer BT is subject to a height-by-habitat interaction [14].
Over time, a number of models have been developed with the aim of estimating bark thickness at breast height. These models are based on measurements taken on standing trees [10,32,44,45]. Other models estimate stem bark thickness based on measurements taken along the stem on felled trees [6,10,46]. The required sample size for a BT model is dependent on the desired complexity. Typically, a total sample size of 50–250 trees is necessary [43]. At least two measurements of BT at right angles around the stem are required, with their average used as a measure of BT [47]. There is a paucity of studies that provide bark models based on large sample plots and trees [9,45,46,48]. In the case of local and regional models of stem bark thickness, Stängle et al. [43] recommend a minimum of one measurement location every two metres along the stem, with a minimum of five BT measurements taken at each of these locations in order to achieve an allowable error of <15%. Additionally, bark volume is frequently overestimated by up to 40% due to the inclusion of diameter over bark measurements, which encompass vacant space within fissures [27]. The most common method for estimating BT is through the use of regression solutions. These include the simple linear model [48,49,50,51], polynomial regression [4], and other forms of non-linear regression. Such regressions encompass the power function [42,51], exponential functions [51], logarithmic equations [45], multiple non-linear regression and generalized linear models [46]. In addition to regression analysis, other techniques have been employed, including taper functions [4,48,52,53], mixed-effects modelling [4,30], and artificial neural networks (ANNs) [32,37,53], with a high degree of adjustment and accuracy. The highest correlation between bark thickness at breast height and other variables was found with DBH, H, social position, and crown base height [32]. Meanwhile, stem bark thickness can be predicted using a function of over bark diameter, position up the stem, tree height, and over bark DBH [6] or with age [37]. The addition of tree height, stand age, site index, or stand density allows for a more comprehensive explanation of the variation in double bark thickness (DBT) at the stand level than is possible using DBH alone [45]. The functions of the stem’s relative height and cross-sectional cork area increment demonstrated superior performance [30].
As in other countries, for example, Germany [54], in Romania, DBT estimation is currently conducted using stem diameter over bark (DOB) by a first or second-degree polynomial function, depending on the species [55], or by direct measurement on logs. Nevertheless, it is essential to consider the variability of BT at different levels when developing BT equations [54]. This aspect has been acknowledged since 1972, when tables for estimating bark thickness and volume for 24 species in Romania were published [56]; however, it has been perceived as having a relatively minor influence. The development of new models for estimating BT along the stem based on existing large databases [48,57] may prove beneficial for commercial tree species in Romania, as the current wood tracking system of the forest supply chain requires accurate knowledge of bark thickness. The aim of this study was to develop new models for estimating the stem bark thickness of three economically valuable species: Norway spruce (Picea abies (L.) Karst), European beech (Fagus sylvatica L.), and pedunculate oak (Quercus robur L.). These species occupy 22%, 31%, and 2% of the Romanian forest cover, respectively [58]. In order to achieve the aim, the following objectives were set: (i) to create a database of stem bark thickness measurements for the three species, incorporating existing data from across the country and gathering new data to address the current needs for forest inventory; (ii) to develop models for estimating stem DBT, considering different types of equations and predictors, and to assess their accuracy; (iii) to analyse the variation in relative double bark thickness (RDBT) and the percentage of bark in the cross-sectional area (PBA) along the stem.

2. Materials and Methods

2.1. Materials

The research region is situated within the territory of Romania, although there are notable differences between species (Figure 1). Norway spruce forests are predominantly distributed in the Romanian Carpathians (Figure 1a) at altitudes between 600 and 1800 m above sea level, within regions with mean annual precipitation levels between 700 and 1200 mm, and mean annual temperature ranges between 4 and 6 °C [58,59]. In contrast to the species’ natural range, the Norway spruce has been introduced at altitudes of approximately 200 m. The European beech is distributed across the Romanian Carpathian Mountains (Figure 1b), occurring from the lower hills with elevations of 300 m to the mountainous region at elevations of 1400 m and at times extending beyond this range [58,60]. The European beech region is characterised by annual precipitation levels between 600 and 1300 mm and a mean annual temperature between 5 and 9 °C [58]. The pedunculate oak species is found in Romania, occurring in the lowlands and low hills (Figure 1c) between altitudes of 100 and 700 m [58,61]. The mean annual precipitation levels are between 500 and 900 mm, while the mean annual temperature is between 7 and 11 °C [58].
In order to develop this study, a database was constructed comprising two datasets for each of the three temperate tree species. The first dataset encompasses data pertaining to the double bark thickness in relation to the over bark diameter of the tree along the stem, in addition to data on the diameter of the tree at breast height and the height of the tree. The double bark thickness was calculated as the difference between the mean values of the diameter over bark and the diameter inside bark, as presented for the 218, 239, and 206 tree size categories of Norway spruce, European beech, and pedunculate oak species [62]. The data on DBT are of particular value for a number of reasons. The first reason is that the data are the result of averaging several trees with identical dimensional characteristics (DBH and H), thereby reflecting the double bark thickness at 2-metre intervals from the basal area of the tree to the tip of the tree. The second reason is evidenced by the considerable number of plots, which totalled 345, 401, and 176, respectively, and encompassed the full range of Norway spruce, European beech, and pedunculate oak species in Romania (Figure 1). In these plots, measurements were conducted on 5403, 2389, and 4394 felled trees of the three species under analysis (Table 1). The first dataset thus characterises trees with large dimensional amplitude in terms of bark. Initial measurements were taken from felled trees as part of a series of campaigns organised by the National Institute for Research and Development in Forestry in the mid-twentieth century. Diameters were recorded over and inside bark using a calliper at breast height and subsequently at two-metre intervals along the stem.
The second dataset (Figure 1) was obtained from recent measurements conducted in 2023 in the Slănic Forest District, which is managed by the National Forest Administration Romsilva in Prahova County. These measurements focused on the roundwood of three distinct species. The measurements were conducted on 20–21 logs of varying dimensions (Table 2), resulting from clear-cutting in subcompartment 86B (Doftăneț management unit), thinning in subcompartment 133B (Plopeni management unit), and by group shelterwood system in compartment 98 (Doftăneț management unit). The age at which the cuttings were applied is 103 years for Norway spruce, 68 years for European beech, and 183 years for pedunculate oak. The Norway spruce specimens originate from an altitude of 285 m, which represents a limiting factor for the species. In contrast, the European beech specimens originate from an altitude of 300–460 m, which corresponds to the sub-optimal zone for the species. The pedunculate oak specimens, on the other hand, originate from an altitude of 240 m, which is optimal for the species.
It has been repeatedly emphasised by foresters that the existing models for estimating bark thickness are not applicable to pedunculate oak logs with a diameter exceeding 70 cm. In such cases, the legislation requires that the bark be directly measured for each log. This is a time-consuming process that necessitates partial bark removal to measure the diameter under bark. However, this is a crucial step when working with pedunculate oak, given the superior quality of this species and the necessity for precise estimation of wood volume. Additionally, the altitudinal variation observed in this forest district indicates the presence of other tree species, including Norway spruce and European beech. Dataset 2 was instrumental in illustrating the future needs for bark studies through direct measurements.
Taking into consideration the cross-sectional variation in bark thickness and the inherent inaccuracies associated with each measurement method, the bark thickness was assessed through two distinct approaches for the second dataset. Bark thickness was measured directly in the cross-sections at the lower end and upper end of each log. This was done by taking four measurements in two perpendicular directions using a measuring tape. Furthermore, at 1-metre intervals from the lower end of the log, the BT was gauged with a bark gauge (Haglöf, Långsele, Sweden). Two measurements were taken in perpendicular directions with the bark gauge in each section [29,30]. Furthermore, the diameters of each section were measured in two perpendicular directions, along with the bark thickness. The number of measurements taken and the number of bark data that resulted from averaging the double bark thickness in each section are presented in Table 3.
The utilisation of two datasets for bark thickness, one of which encompasses variability over time and space at the country level and another more recent one at the local level, enables the development of general models for bark thickness estimation based on a substantial dataset. Additionally, it allows for their evaluation under specific conditions for three species that are currently present and industrially processed in Romania. This approach is corroborated by the recent findings of Bauer et al. [10] in France, Stängle and Dormann [54] in Germany, as well as by the bark thickness data collection methods employed in other recent studies [13,29,30].

2.2. Methods

In order to estimate the double bark thickness for the three species, seven mathematical models presented in Table 4 were selected. These are various equations of polynomial, logarithmic, multiple linear regression, and multiple non-linear regression types, which have been demonstrated to be effective in such applications. The first four models estimate the double bark thickness for different stem sections as a function of the over bark diameter corresponding to the stem section, which has been identified as the strongest predictor of bark thickness in previous studies [4,10,45,54]. Model 5 is a more complex form of Model 4, incorporating tree height as a predictor variable [45]. Model 6, originally proposed by Cao and Pepper [63], has subsequently been used in numerous studies to estimate DBT as a function of three predictors, namely stem diameter over bark, section height along the stem for which the bark thickness is estimated (h), and total tree height [48,54,57]. The ratio h/H is defined as the relative height of the section under analysis. Model 7 has been demonstrated to be an efficacious method in multiple studies [54,64], thereby substantiating its application in estimating DBT as a function of over bark diameter at breast height and stem diameter over bark. The application of Models 2 through 7 for the Norway spruce, European beech, and pedunculate oak species to dataset 1, constructed after Popescu-Zeletin et al. [62], represents an endeavour that may yield novel insights, given that the estimation of species-specific double bark thickness is currently conducted using first or second-degree polynomial functions [55].
The statistical evaluation of the analysed models was conducted in accordance with the established indicators [4,10,30,48], specifically the coefficient of determination (R2), mean absolute error (MAE), and root mean squared error (RMSE). Additionally, the Akaike information criterion (AIC) [65] and the Bayesian information criterion (BIC) [66] were also employed for this purpose. Furthermore, residuals were calculated for all the species and models as the difference between the observed and estimated double bark thickness. Both the parameters of the mathematical models and their accuracy indicators were obtained with the Excel program, utilising the Add-In extension to extend the statistical capabilities.
In the final stage of the study, two additional biometric characteristics of the bark were examined: the relative double bark thickness and the proportion of bark area. The double bark thickness was transformed into RDBT, and its variation was analysed in relation to the stem diameter over bark as well as to the relative height along the stem of the section under analysis. The relative double bark thickness was calculated as the percentage of the double bark thickness of the stem diameter over bark. From a mathematical perspective, RDBT is a more valuable measure than DBT for analysing the variation along the stem when working with trees of different sizes and ages. Similarly, the proportion of bark in the cross-sectional area was analysed in relation to the variation in stem diameter over bark and height along the stem of the section under examination. In order to determine the proportion of bark in the cross-sectional area, it was first necessary to calculate the cross-sectional area of the bark. This was done by subtracting the cross-sectional areas over and inside bark on the assumption that the shape of each section was circular [10,13]. For a given section, the relative bark area was calculated as a percentage of the bark area within the cross-sectional area over bark [67]. This is a valuable approach, as it allows us to posit that the form factor is identical for the stem both over and inside the bark. Consequently, the proportion of bark in the cross-sectional area can be considered to have the same value as the proportion of bark in volume (PBV) along the stem. The mathematical modelling of these two biometric characteristics of the bark was conducted according to a sextic polynomial, with relative height serving as the predictor variable for a range of DBH classes (Table 5).
The most suitable model for estimating RDBT and PBA along the stem was selected through a process of testing and evaluation, with particular consideration given to the values of R2, MAE, and RMSE.

3. Results

3.1. Variation of Double Bark Thickness Along the Stem

The bark data from the two datasets were subjected to processing, and the values for DBT are presented for the Norway spruce, European beech, and pedunculate oak species in Figure 2 as a function of stem diameter over bark. The point cloud for dataset 1 indicates a nearly linear variation of DBT with DOB for Norway spruce trees. In contrast, the variation of DBT with DOB is slightly curvilinear for European beech trees or can be considered linear in some sections, where the slope evidently changes at least twice around the DOB values of approximately 26.0 cm and 46.0 cm. However, in these sections, the variation is also linear in steps. In the case of the pedunculate oak trees, there is a notable curvilinear trend in the variation of DBT with DOB. In contrast, the point cloud of dataset 2 reflects the DBT variation for shorter DOB intervals and under specific forest site conditions. In the case of the Norway spruce logs, the point cloud is markedly below the DBT values presented in dataset 1 for the DOB sizes between 34.4 cm and 60.0 cm. In the case of the logs of the other two species, the situation is different. The results of the European beech log measurements for the DOB between 14.2 cm and 47.5 cm are largely consistent with the national data. Conversely, recent measurements of pedunculate oak logs indicate that the DBT is higher than the mid-20th century national values, particularly for the DOB sizes above 58.0 cm. It is also noteworthy that the recent measurements of both Norway spruce and pedunculate oak exceed the respective DOB limits of 60.0 cm and 70.0 cm, for which DBT sizes are available in dataset 1.
The incorporation of additional dendrometric characteristics, including over bark diameter at breast height, total tree height, and relative height of the stem section, into the DBT variation analysis enabled the application of the mathematical models presented in the preceding section of the paper to the bark data included in dataset 1. The parameters of the seven equations are presented by species in Table 6.
The models under examination were evaluated in terms of their accuracy index, the values of which are presented in Table 7. In the case of Norway spruce, the best-performing models, as determined by R2, MAE, and RMSE, were Models 1–3 and Model 7. In contrast, Models 6 and 4 exhibited the lowest accuracies. Conversely, an analysis of the AIC and BIC values indicates that the optimal results are achieved with the application of Model 3, while the least favourable outcomes are observed with Model 7, followed by Models 1 and 2. Consequently, when all these criteria are considered, Model 3 is identified as the most accurate in estimating DBT in Norway spruce. With regard to the European beech species, the results of the analysis by R2, MAE, and RMSE indicate that the models with the highest predictive performance are Model 2, followed by Models 7 and 1. Conversely, Model 6 is observed to exhibit the poorest accuracy. However, Model 6 was identified as the optimal model based on the AIC and BIC values, while Models 1 and 7 were determined to be the least accurate based on the same two indicators. Thus, it can be assumed that Model 2 meets the majority of the established criteria and can be effectively utilised for DBT estimation in European beech. In the case of the pedunculate oak species, the best models in terms of R2, MAE, and RMSE are Models 2 and 3. In contrast, the models with the lowest accuracy are Models 6 and 7. Furthermore, an assessment of the models based on the AIC and BIC values indicates that the most optimal results are yielded by the application of Model 3, while the least favourable outcomes are observed with Model 7. Consequently, when all these criteria are taken into account, Model 3 emerges as the model with the most favourable performance in terms of accuracy for estimating DBT in pedunculate oak.
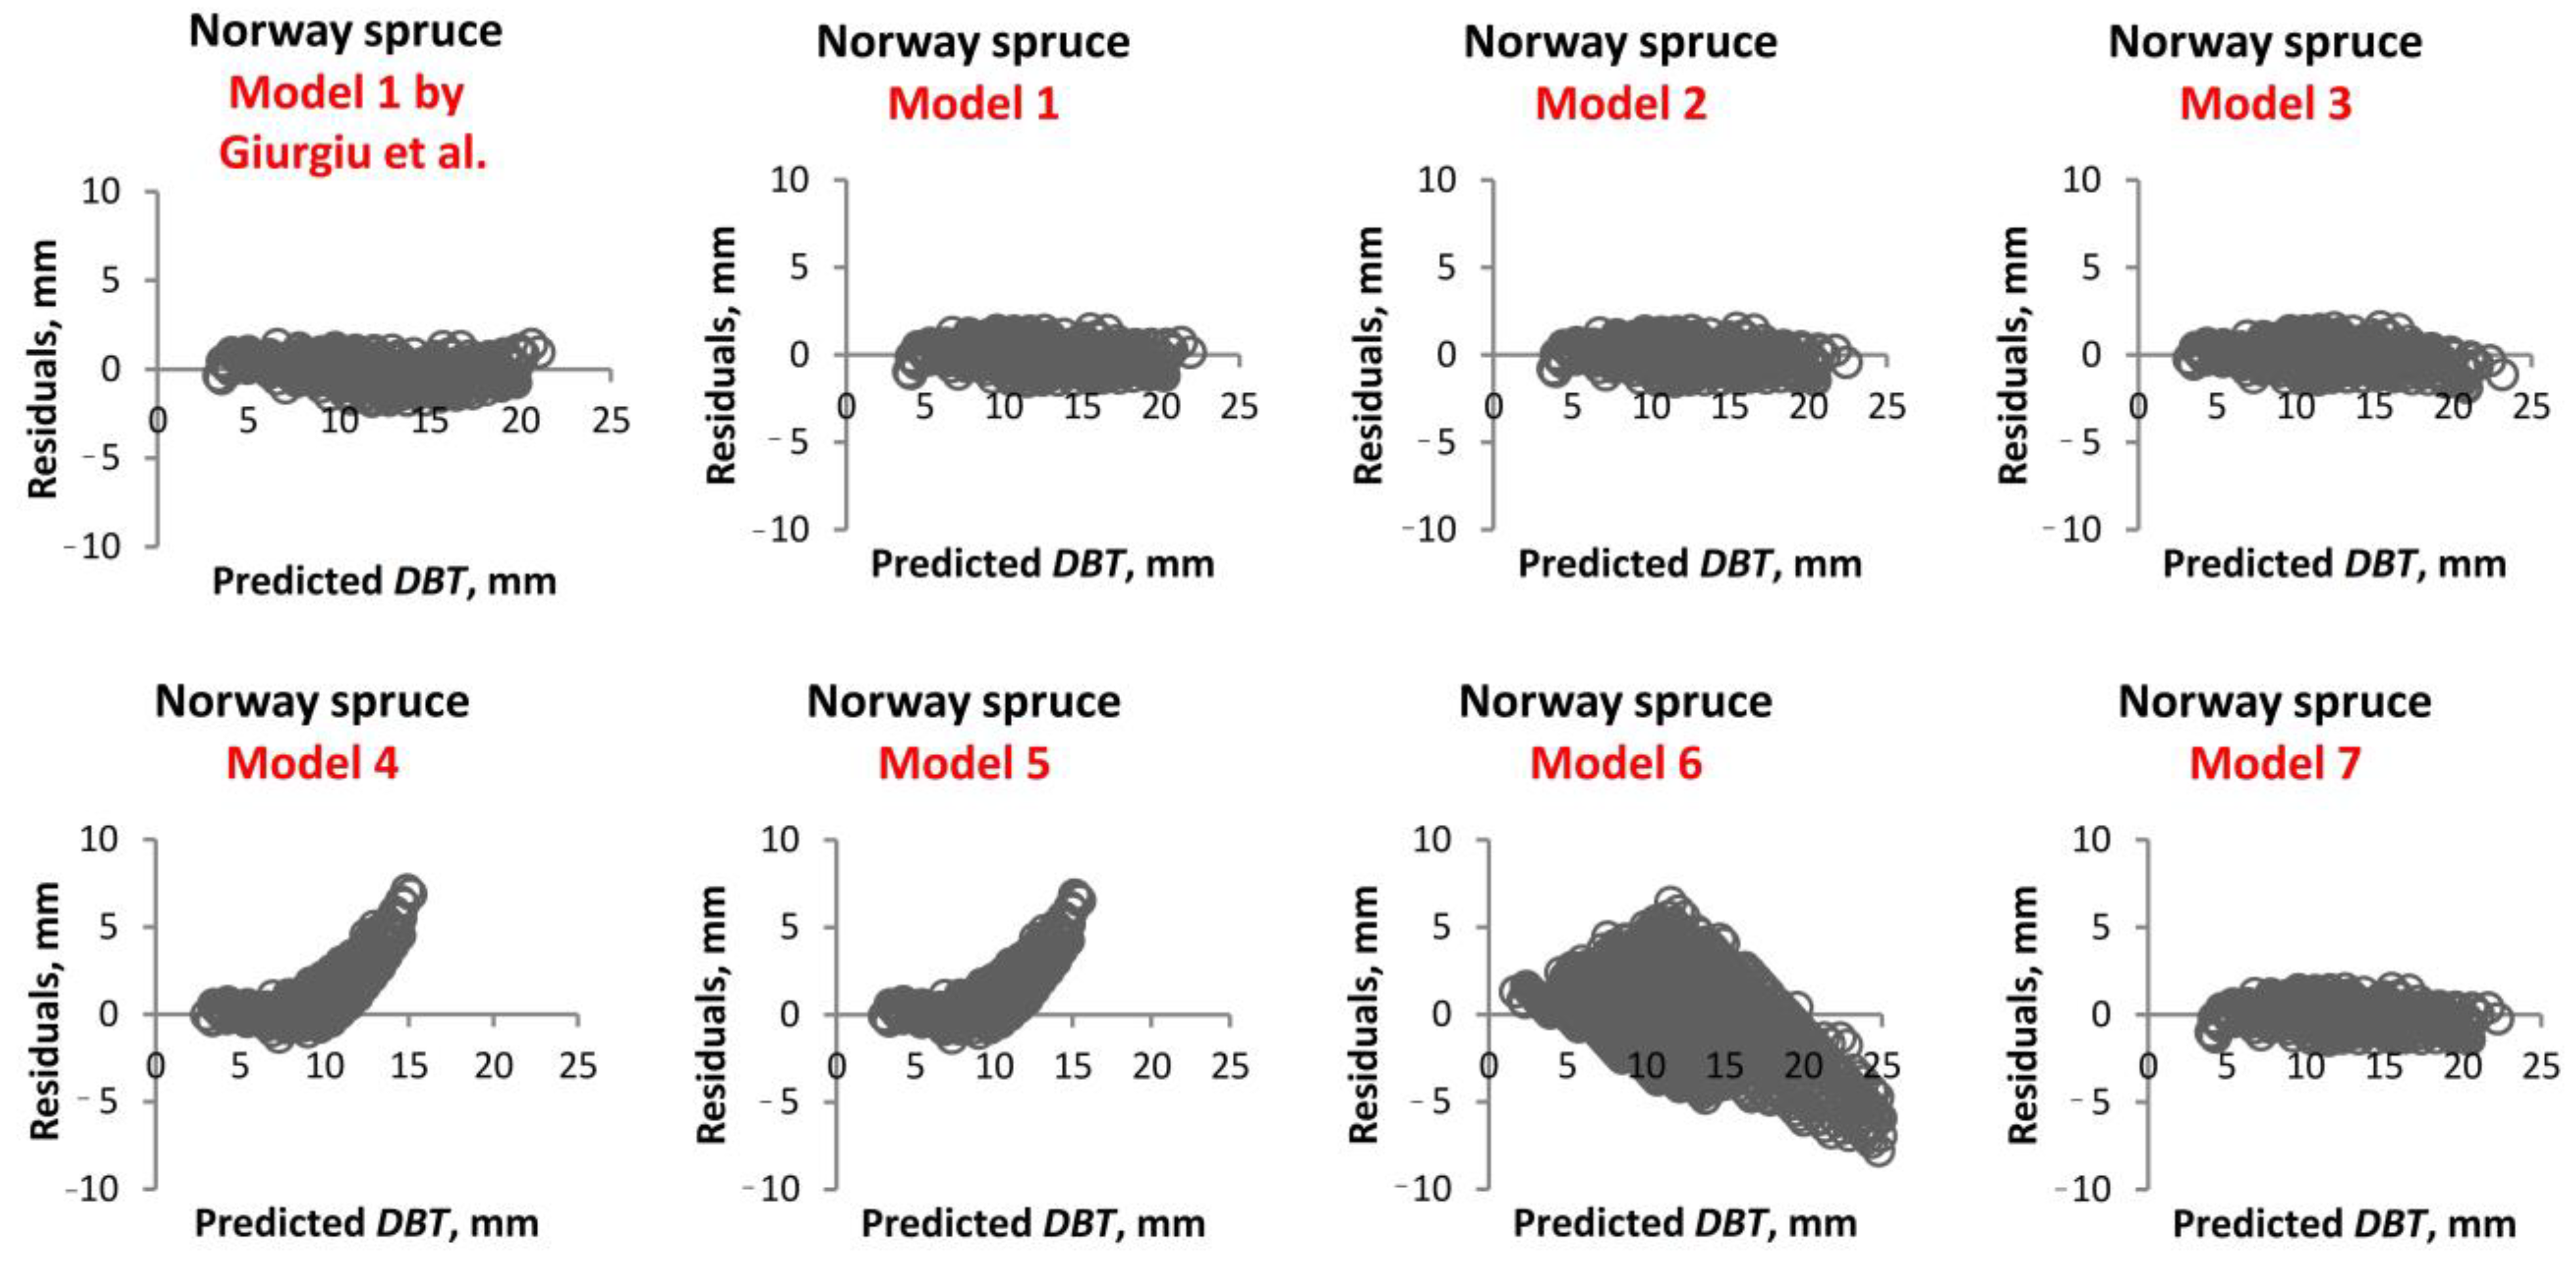
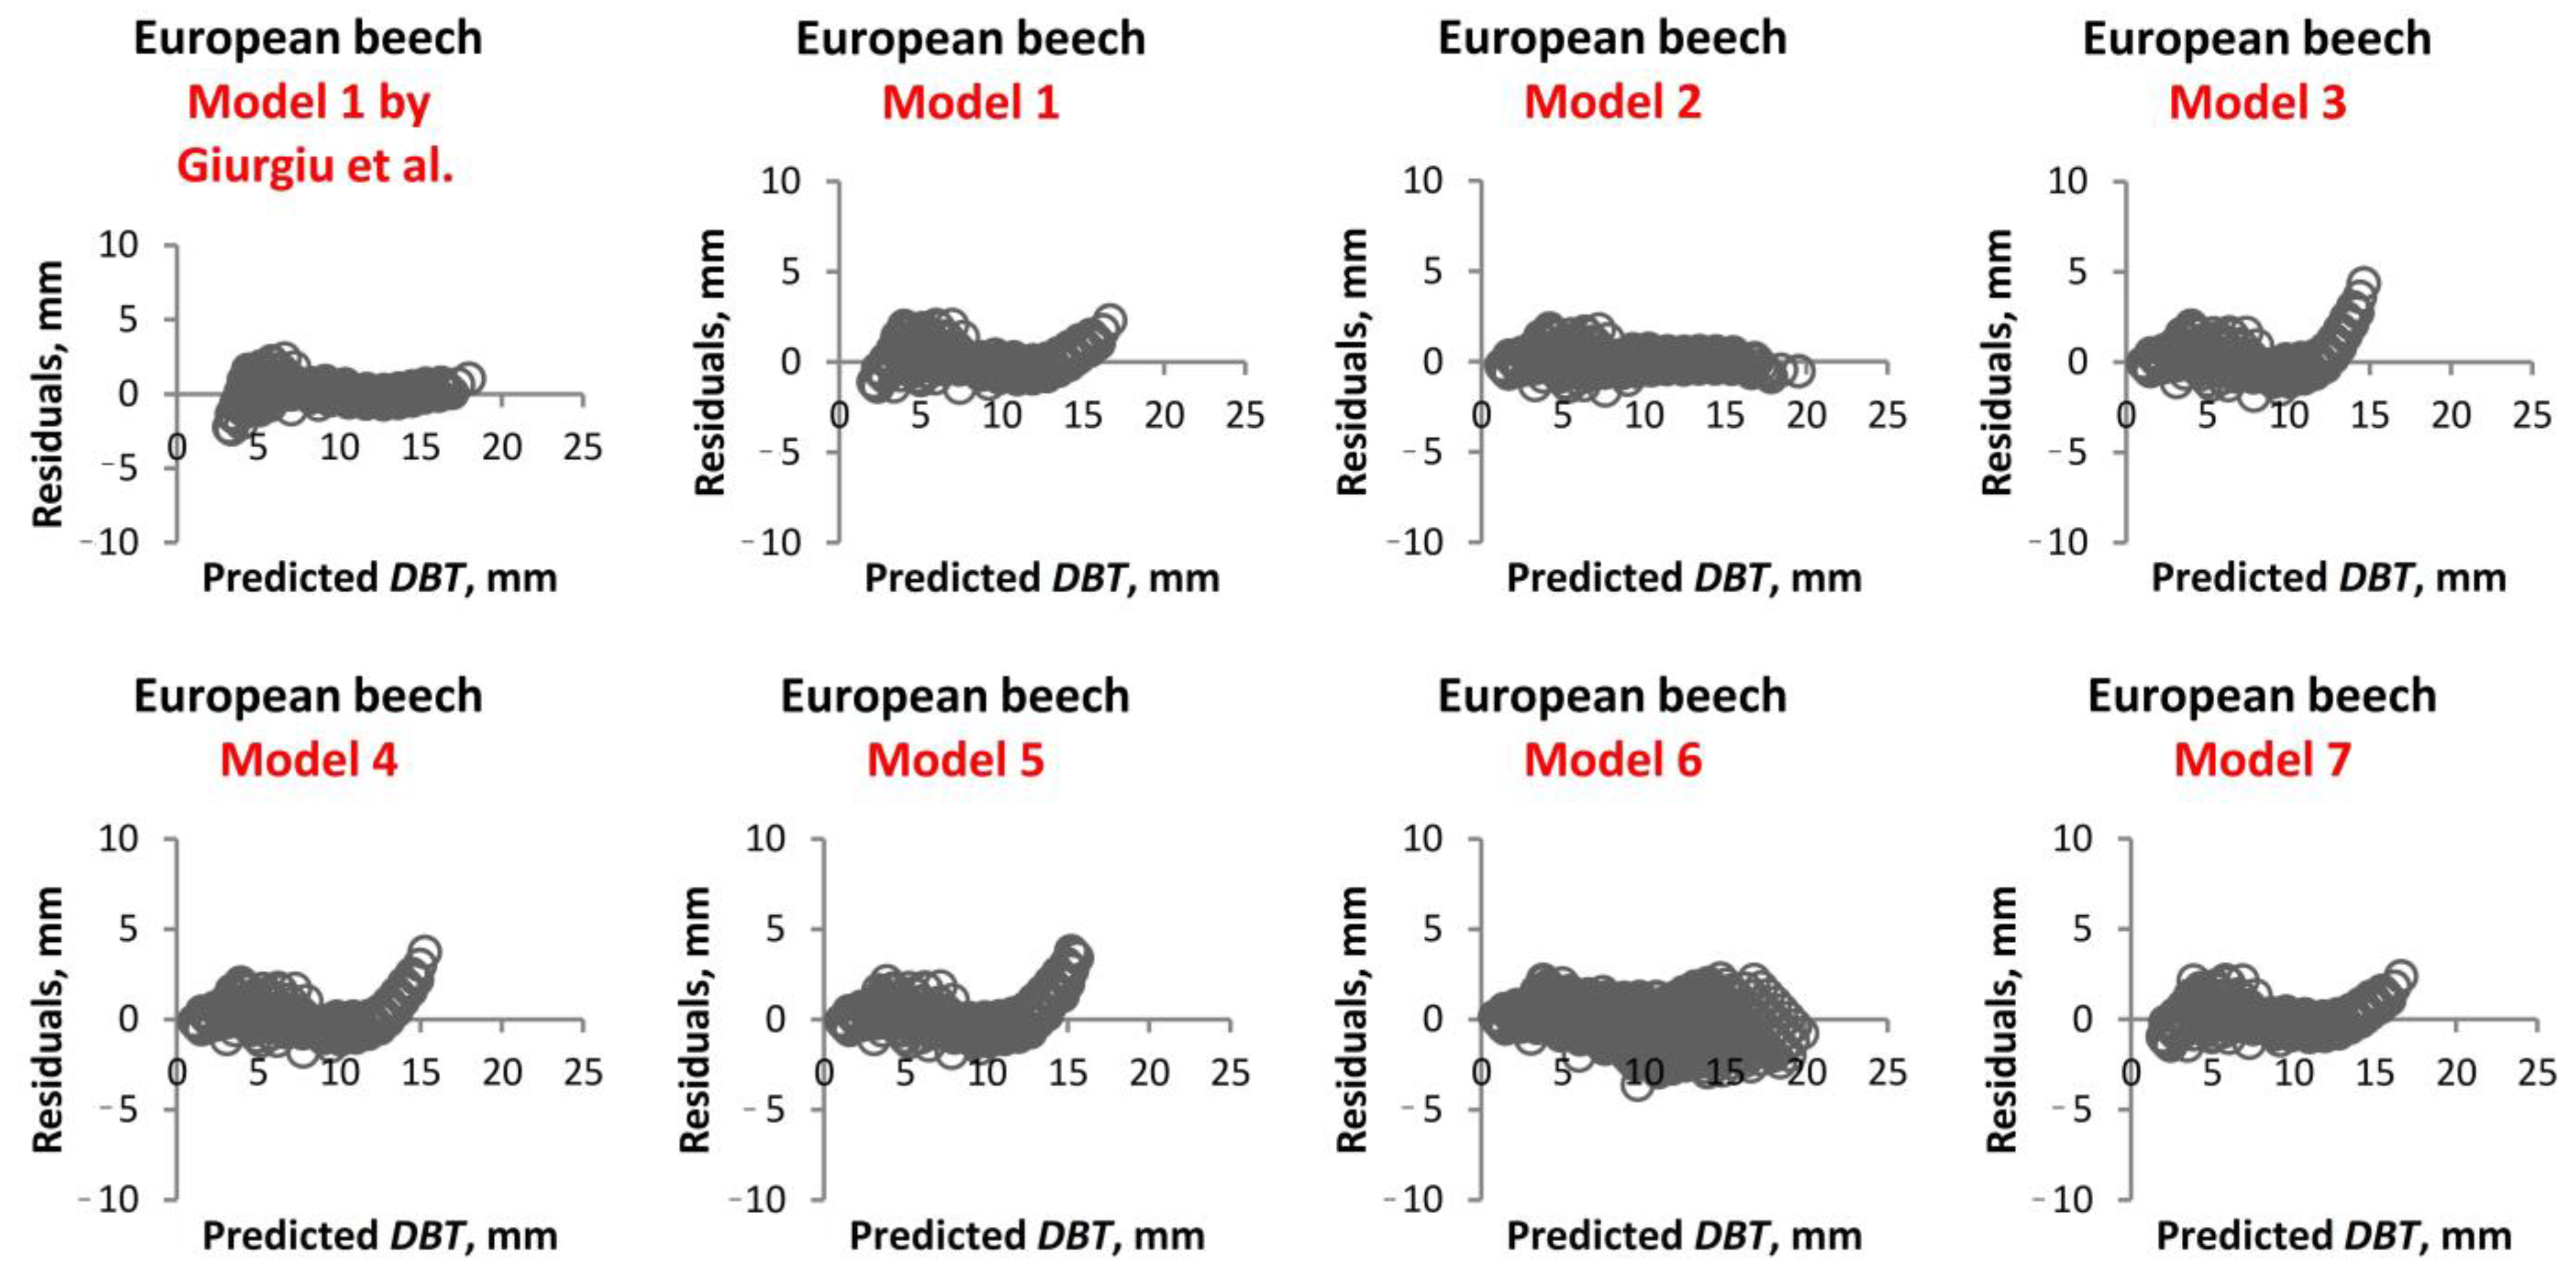
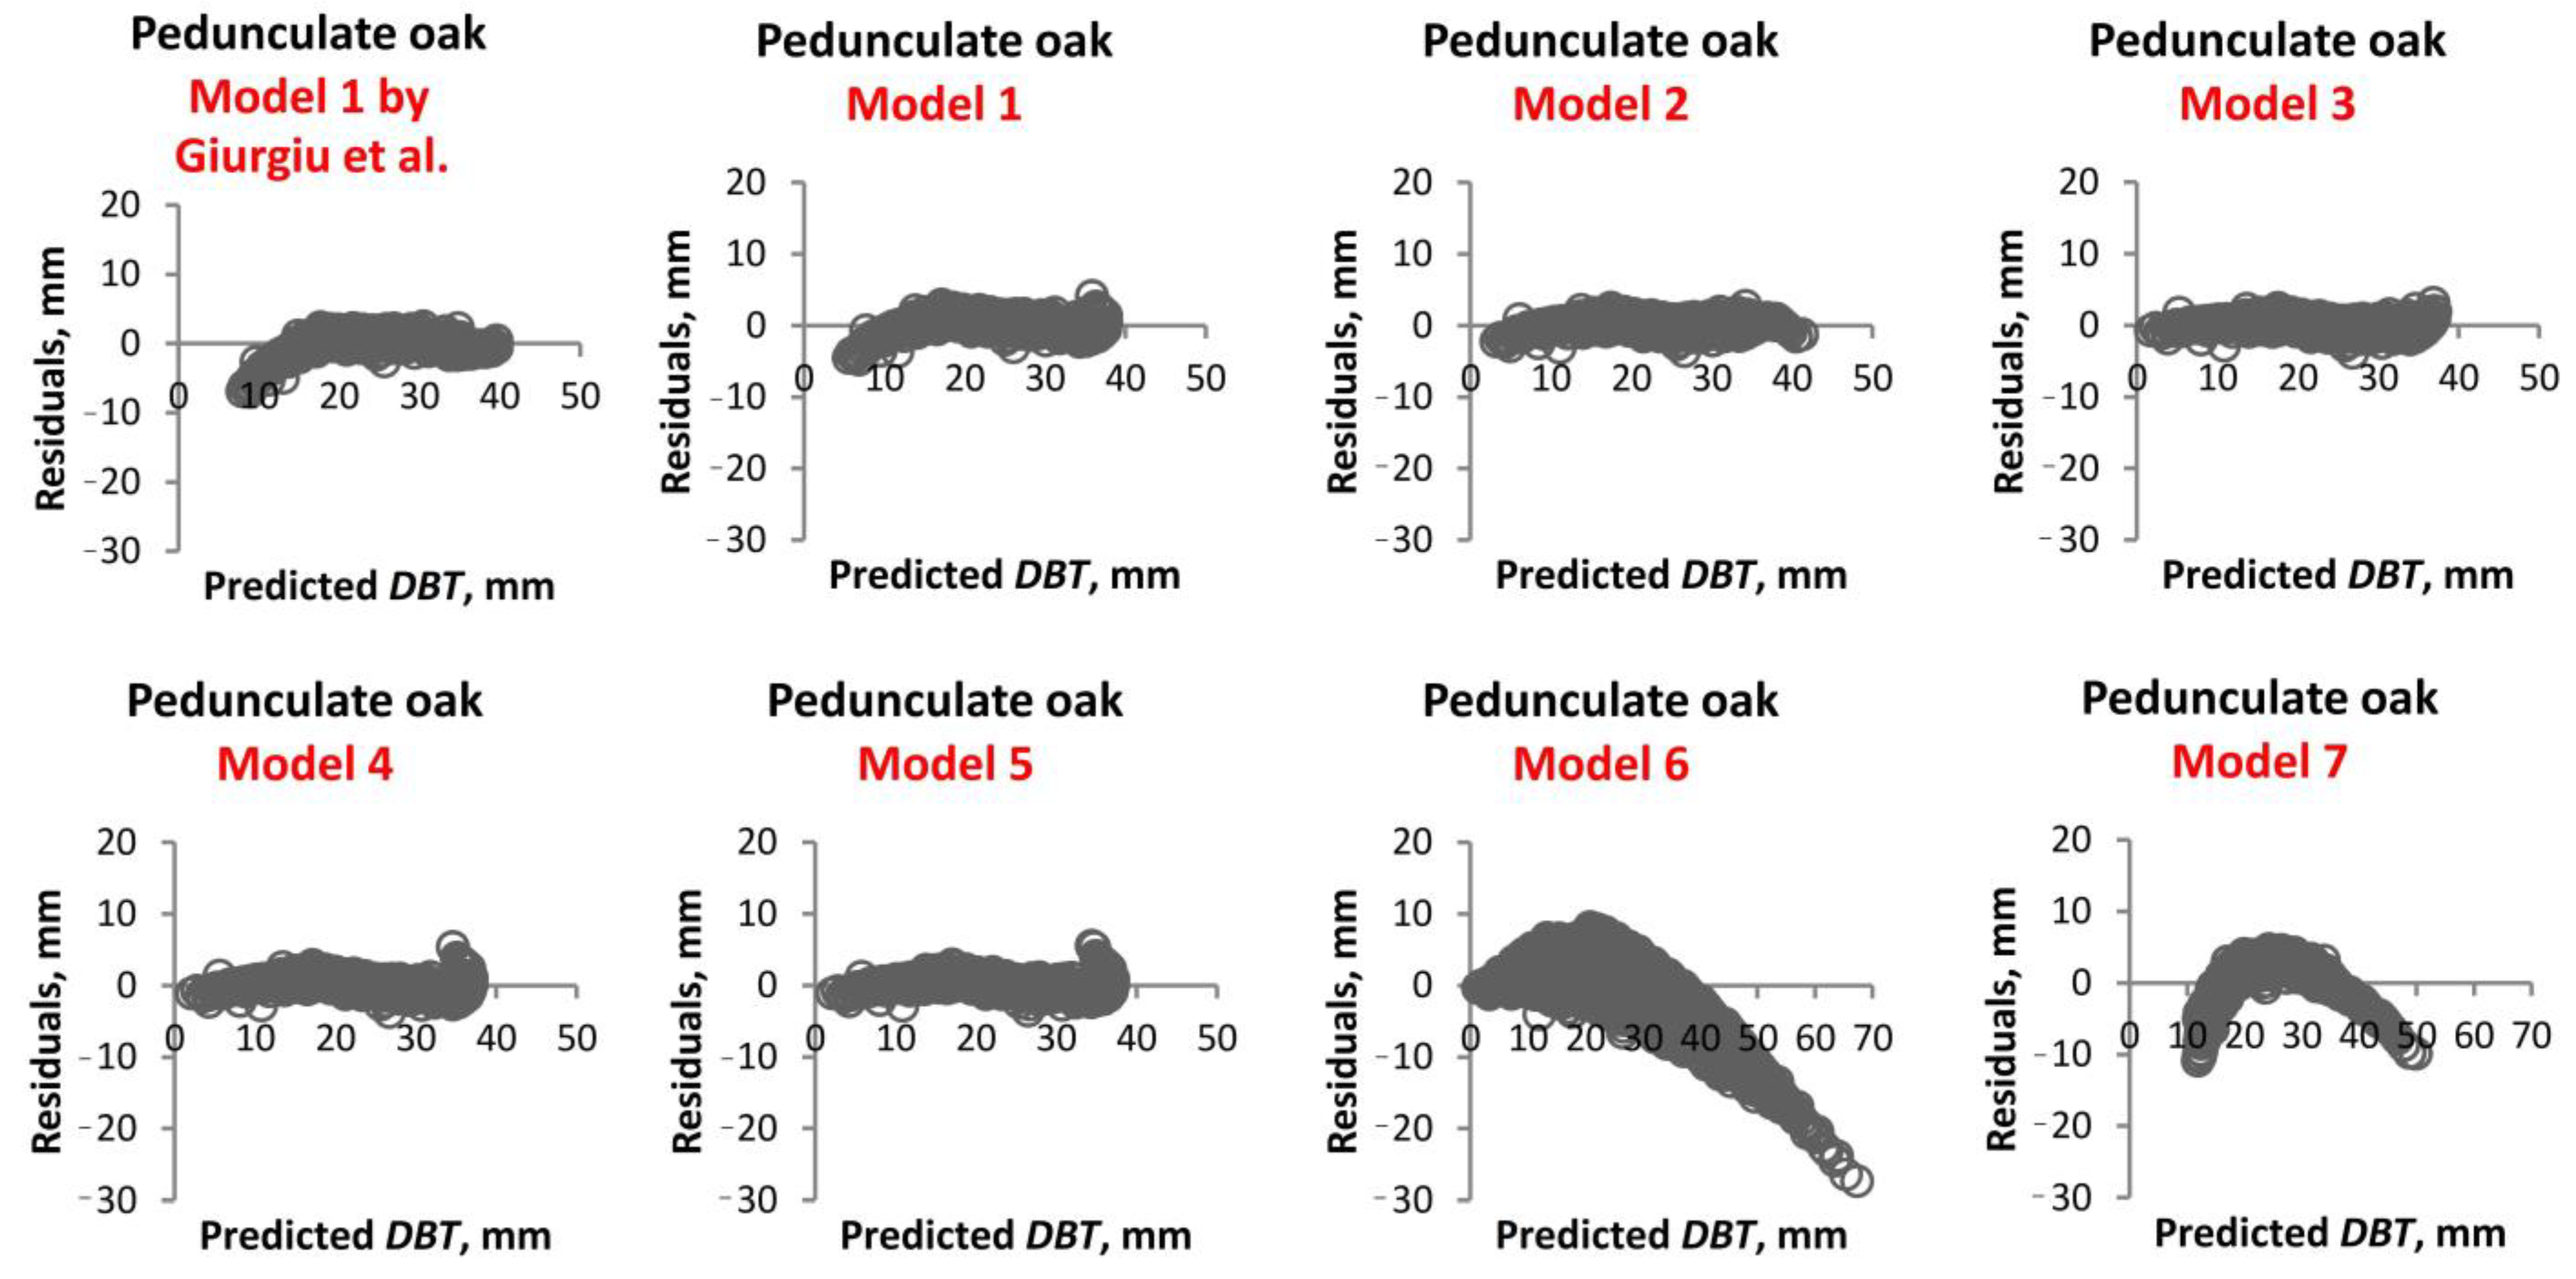
The results presented above are corroborated by the distribution of DBT residuals versus predicted DBT for the three species and for all the models studied (Figure 3, Figure 4 and Figure 5). For Model 1, the residuals obtained by applying the second-degree polynomial with both the parameters established in this study based on 1957 data and the coefficients proposed by Giurgiu et al. [55] are presented below.
An analysis of the point cloud layout for DBT residuals for Norway spruce (Figure 3) reveals that Models 1–3 and Model 7 yield comparable results. Consequently, the selection of Model 3, based on the evaluation of R2, MAE, RMSE, AIC, and BIC, is substantiated as a reliable decision in light of the observed variation in DBT residuals.
In the case of the European beech species, the optimal point cloud layout for DBT residuals is observed when Model 2 (Figure 4) is applied. This conclusion is corroborated by the analysis of the other accuracy indexes. Conversely, Models 3–5 and Model 7 yield predominantly positive residuals for predicted DBT values exceeding 13 mm, indicating that these predicted DBT values are less than the observed values.
The analysis of the charts included in Figure 5 indicates that for the pedunculate oak species, the optimal DBT residuals are obtained through the application of Model 3, with Model 2 demonstrating a comparable performance. Furthermore, Model 3 was identified as the optimal choice based on the analysis of the R2, MAE, RMSE, AIC, and BIC values. However, Models 6 and 7 were revealed to be unsuitable for estimating DBT values exceeding 45 mm, resulting in negative residuals. This indicates that the predicted DBT values for this range are higher than the observed DBT values.
In light of the aforementioned results, it becomes evident that Model 2 demonstrates superior performance compared to Model 1, which is currently employed for the estimation of DBT for the majority of species in Romania. Concurrently, Model 3 yielded the most accurate DBT estimates for both coniferous (e.g., Norway spruce) and deciduous trees (e.g., pedunculate oak). However, Model 3 exhibited suboptimal performance for European beech, a species characterised by its smooth and thin bark.

3.2. Variation of Relative Double Bark Thickness Along the Stem

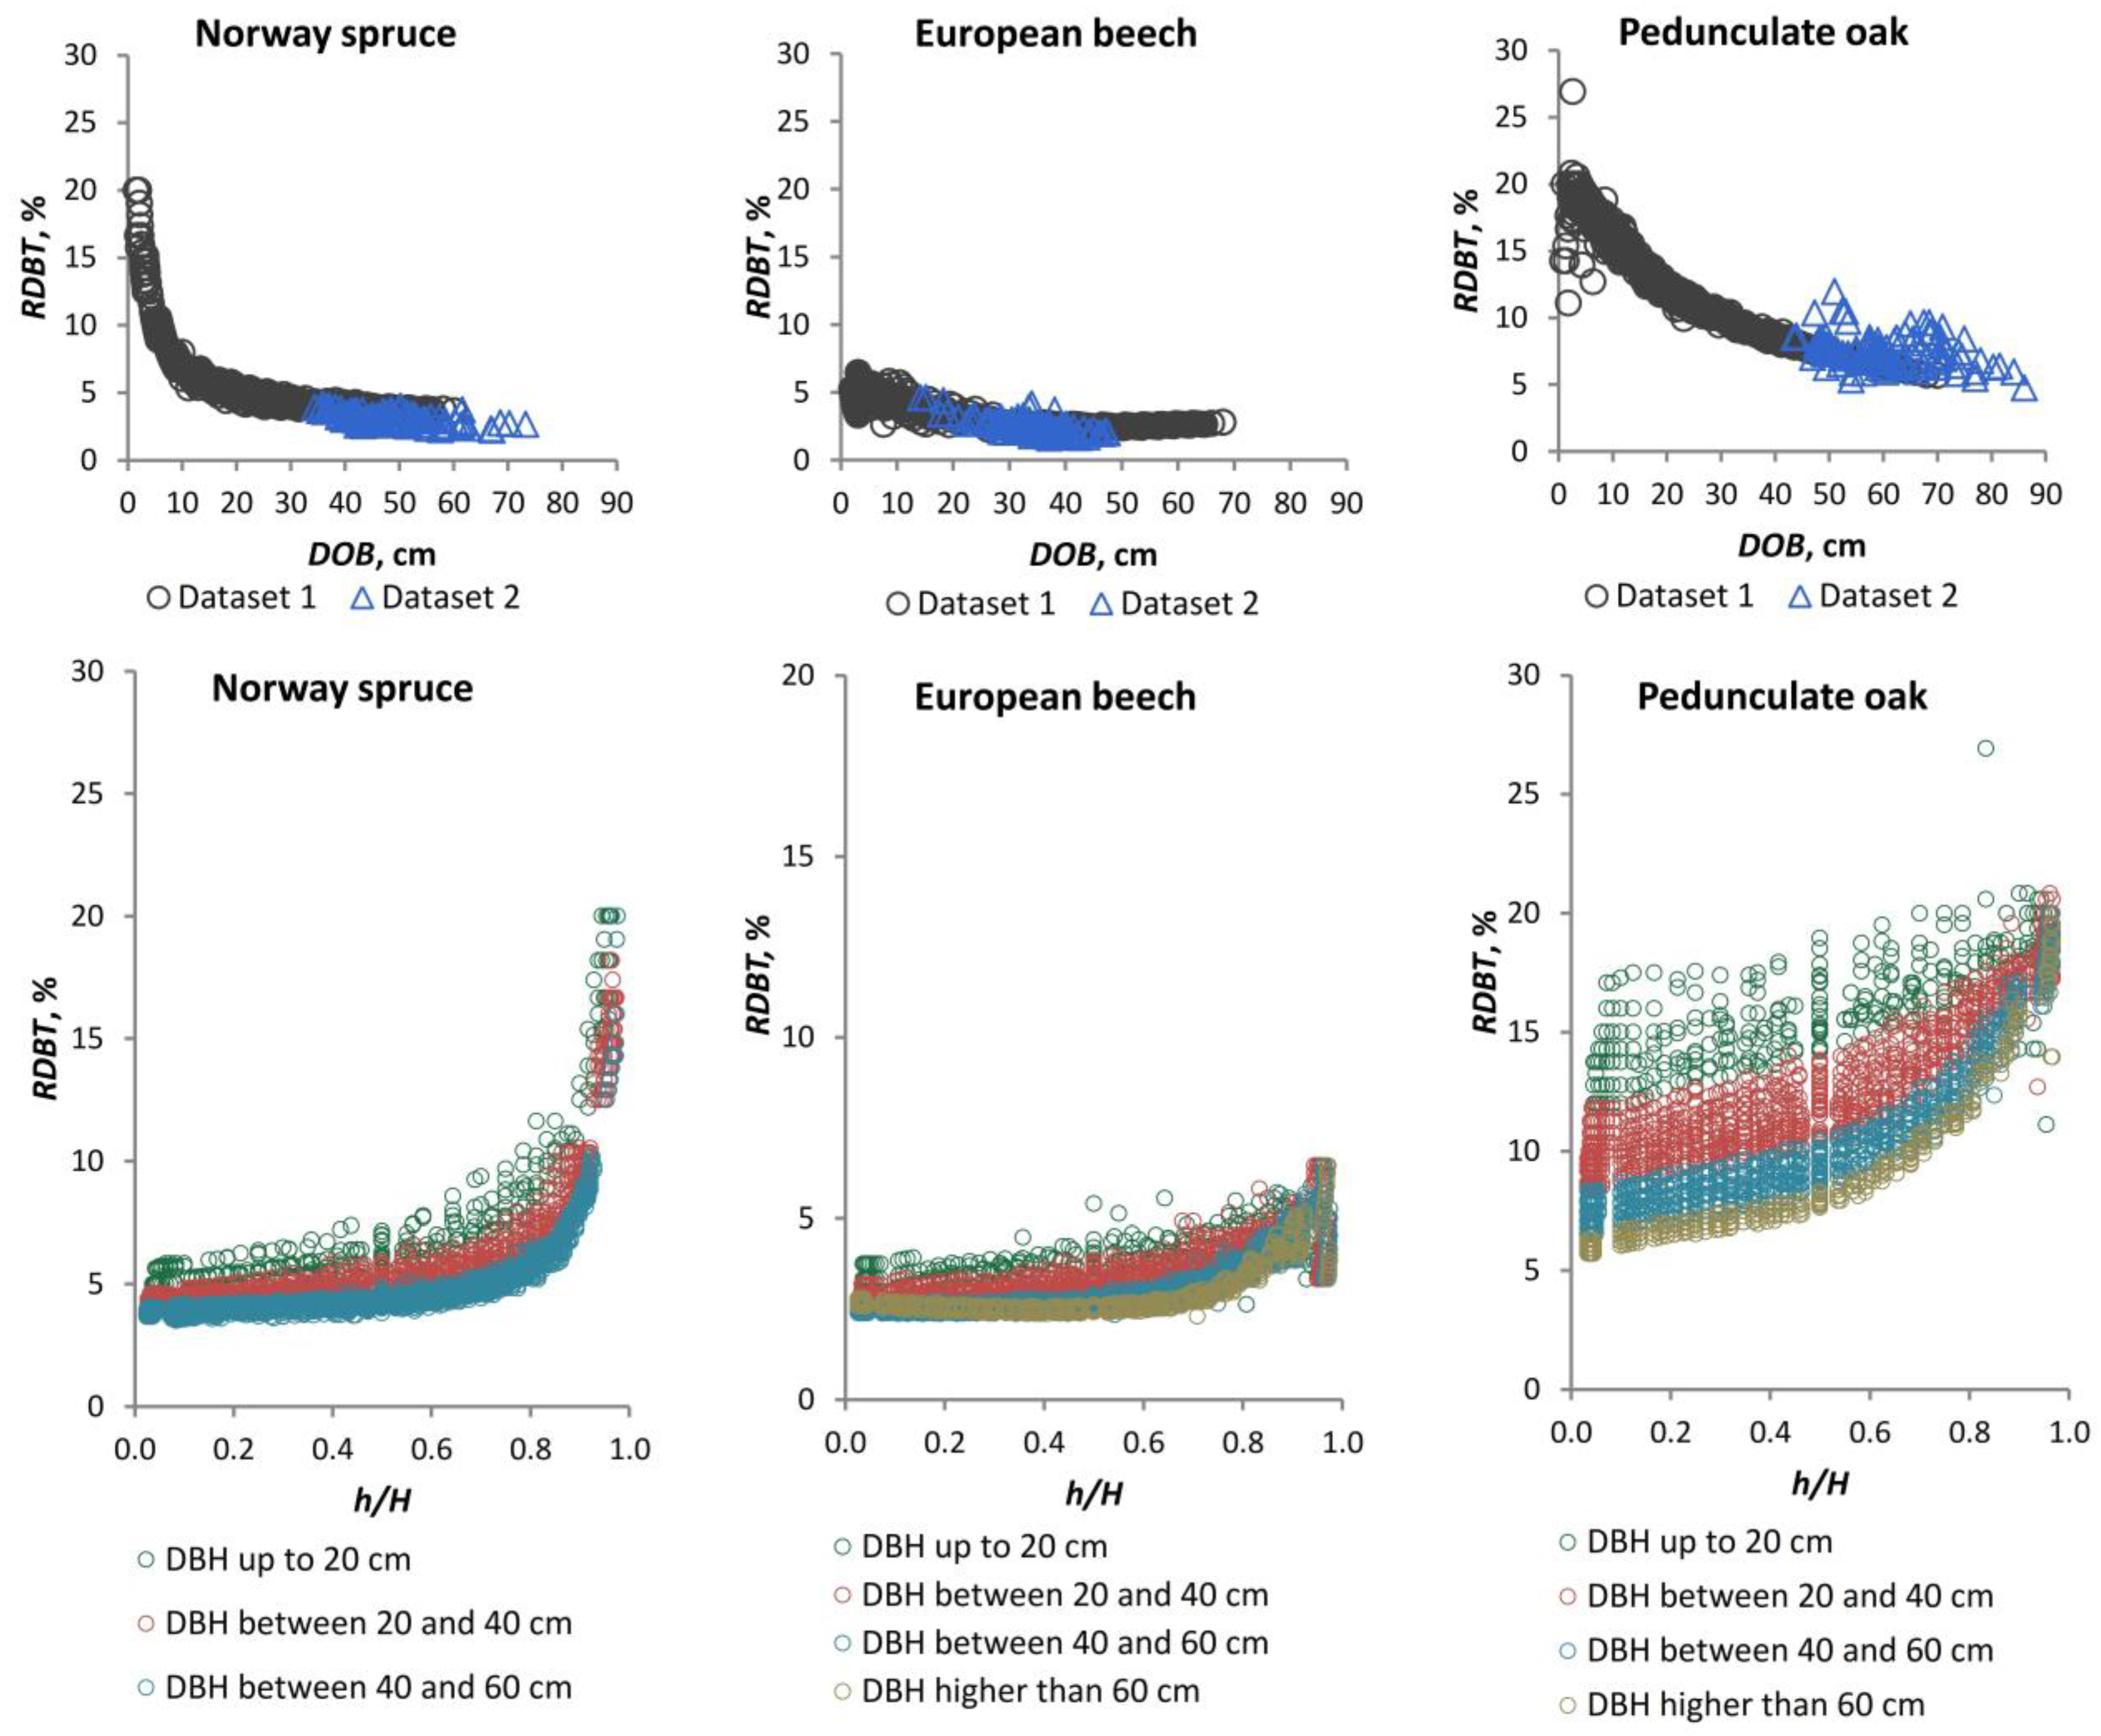
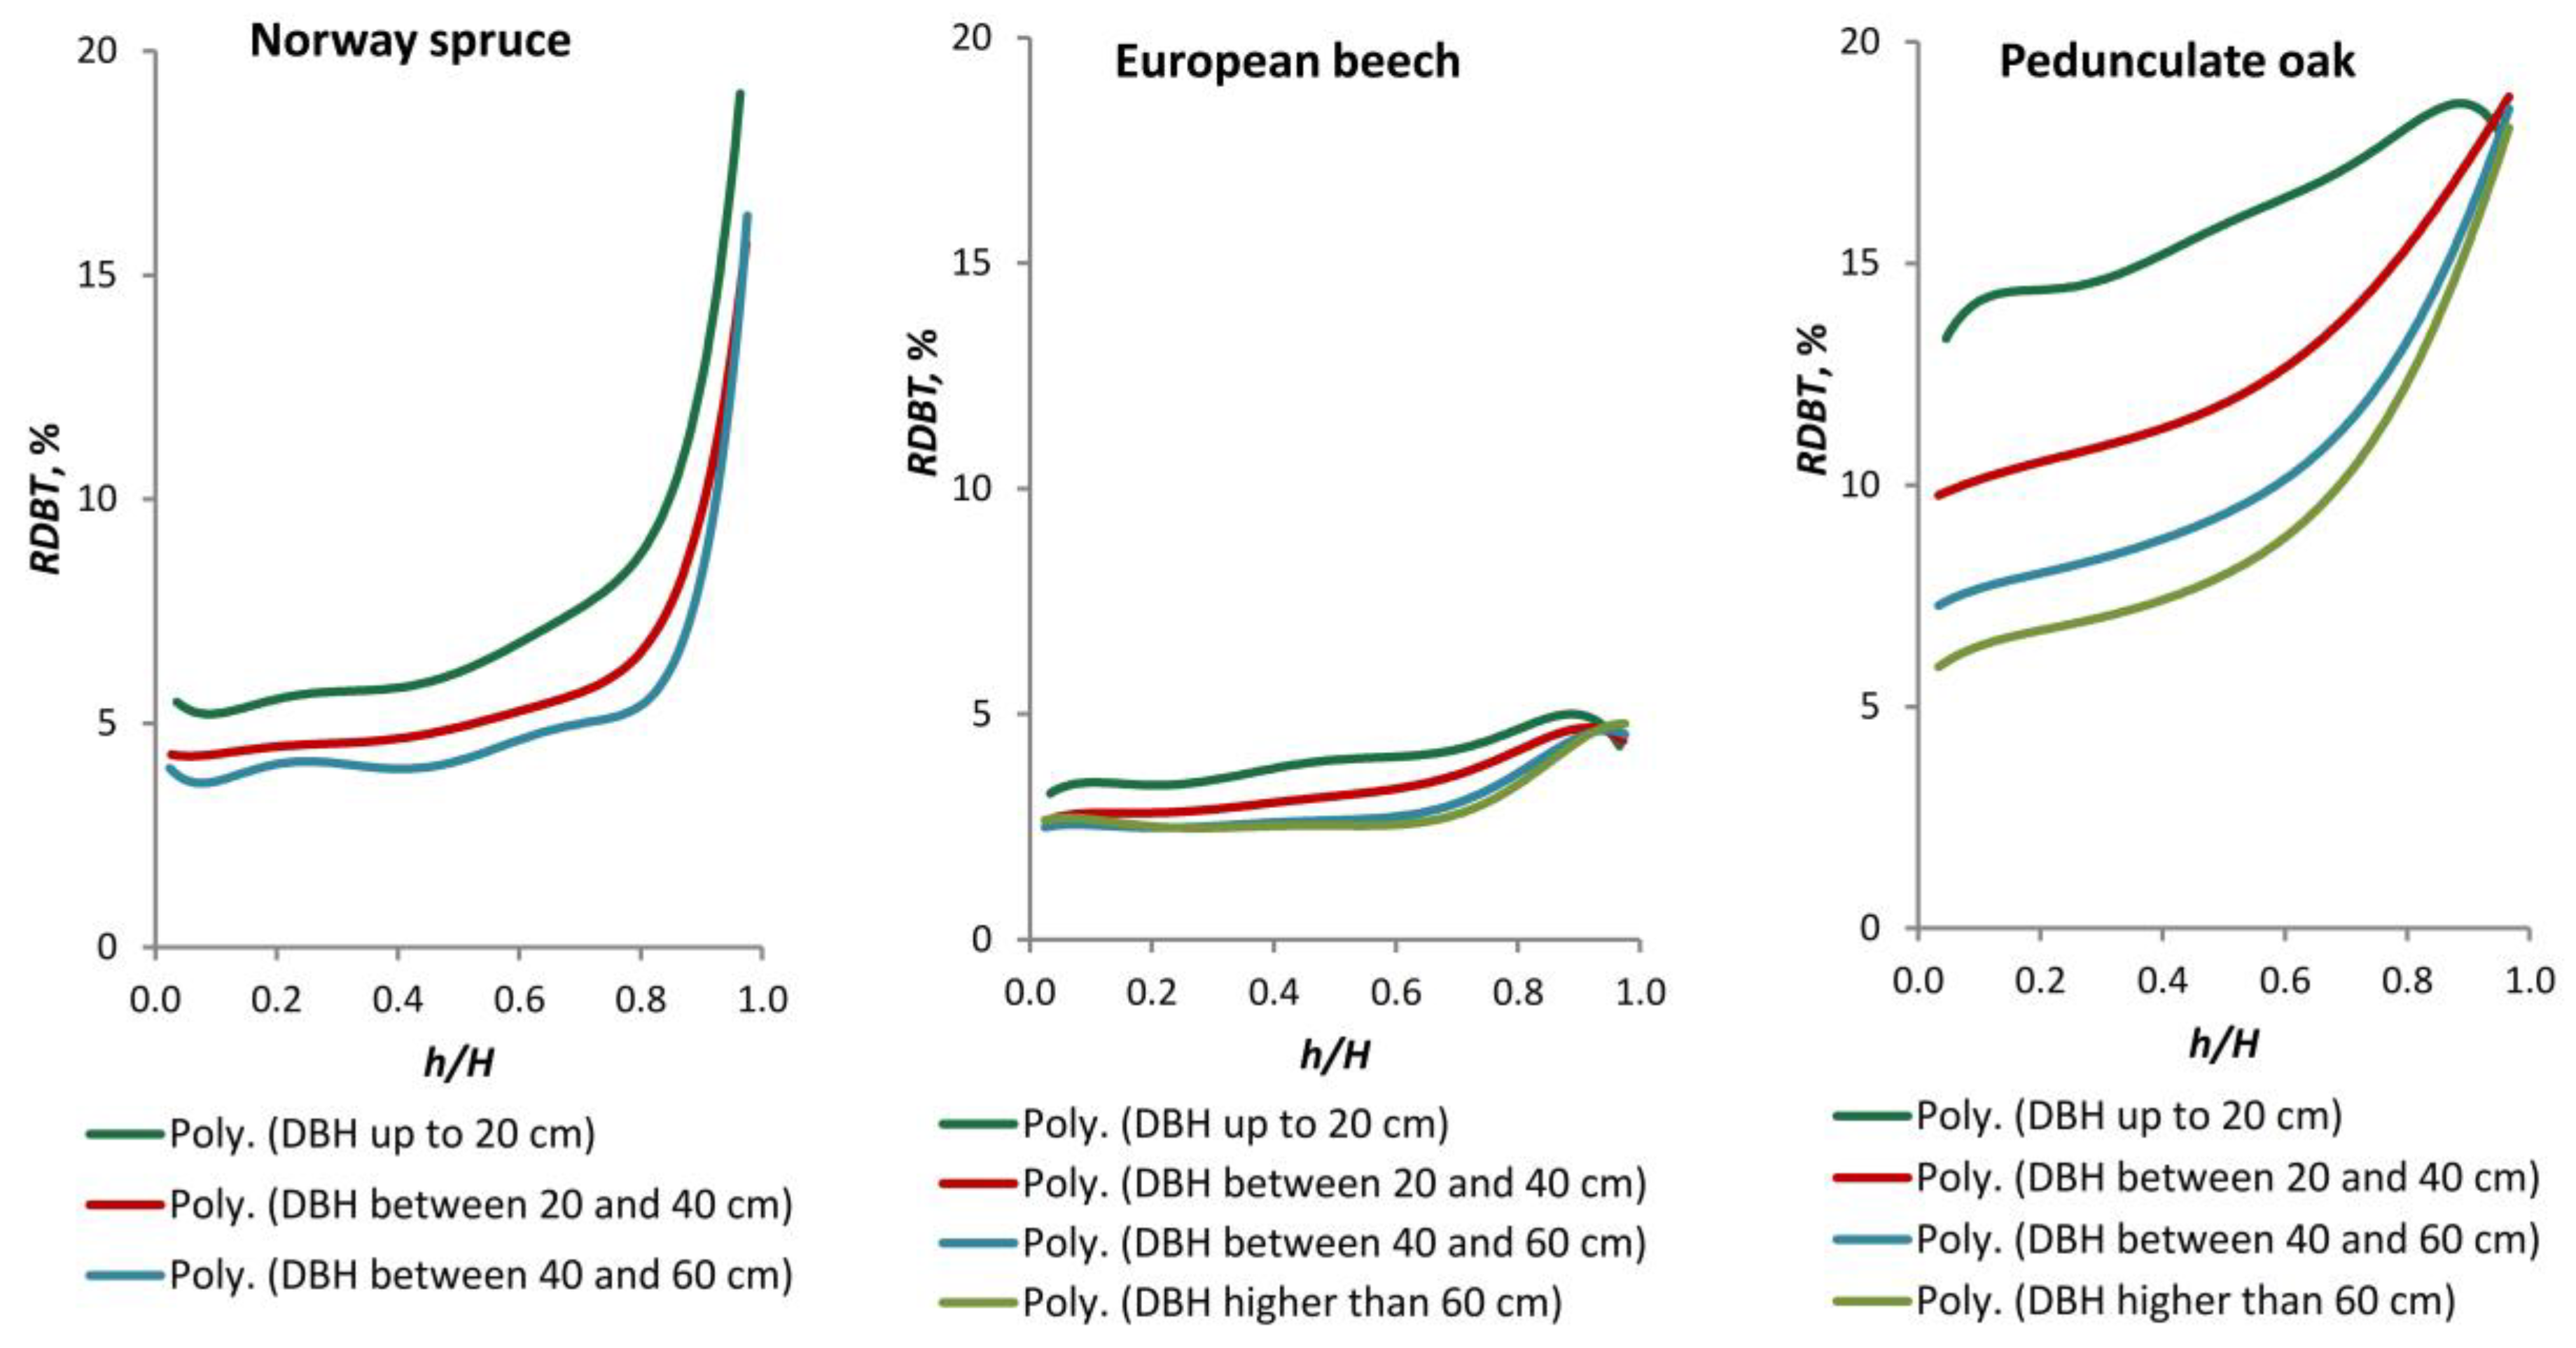
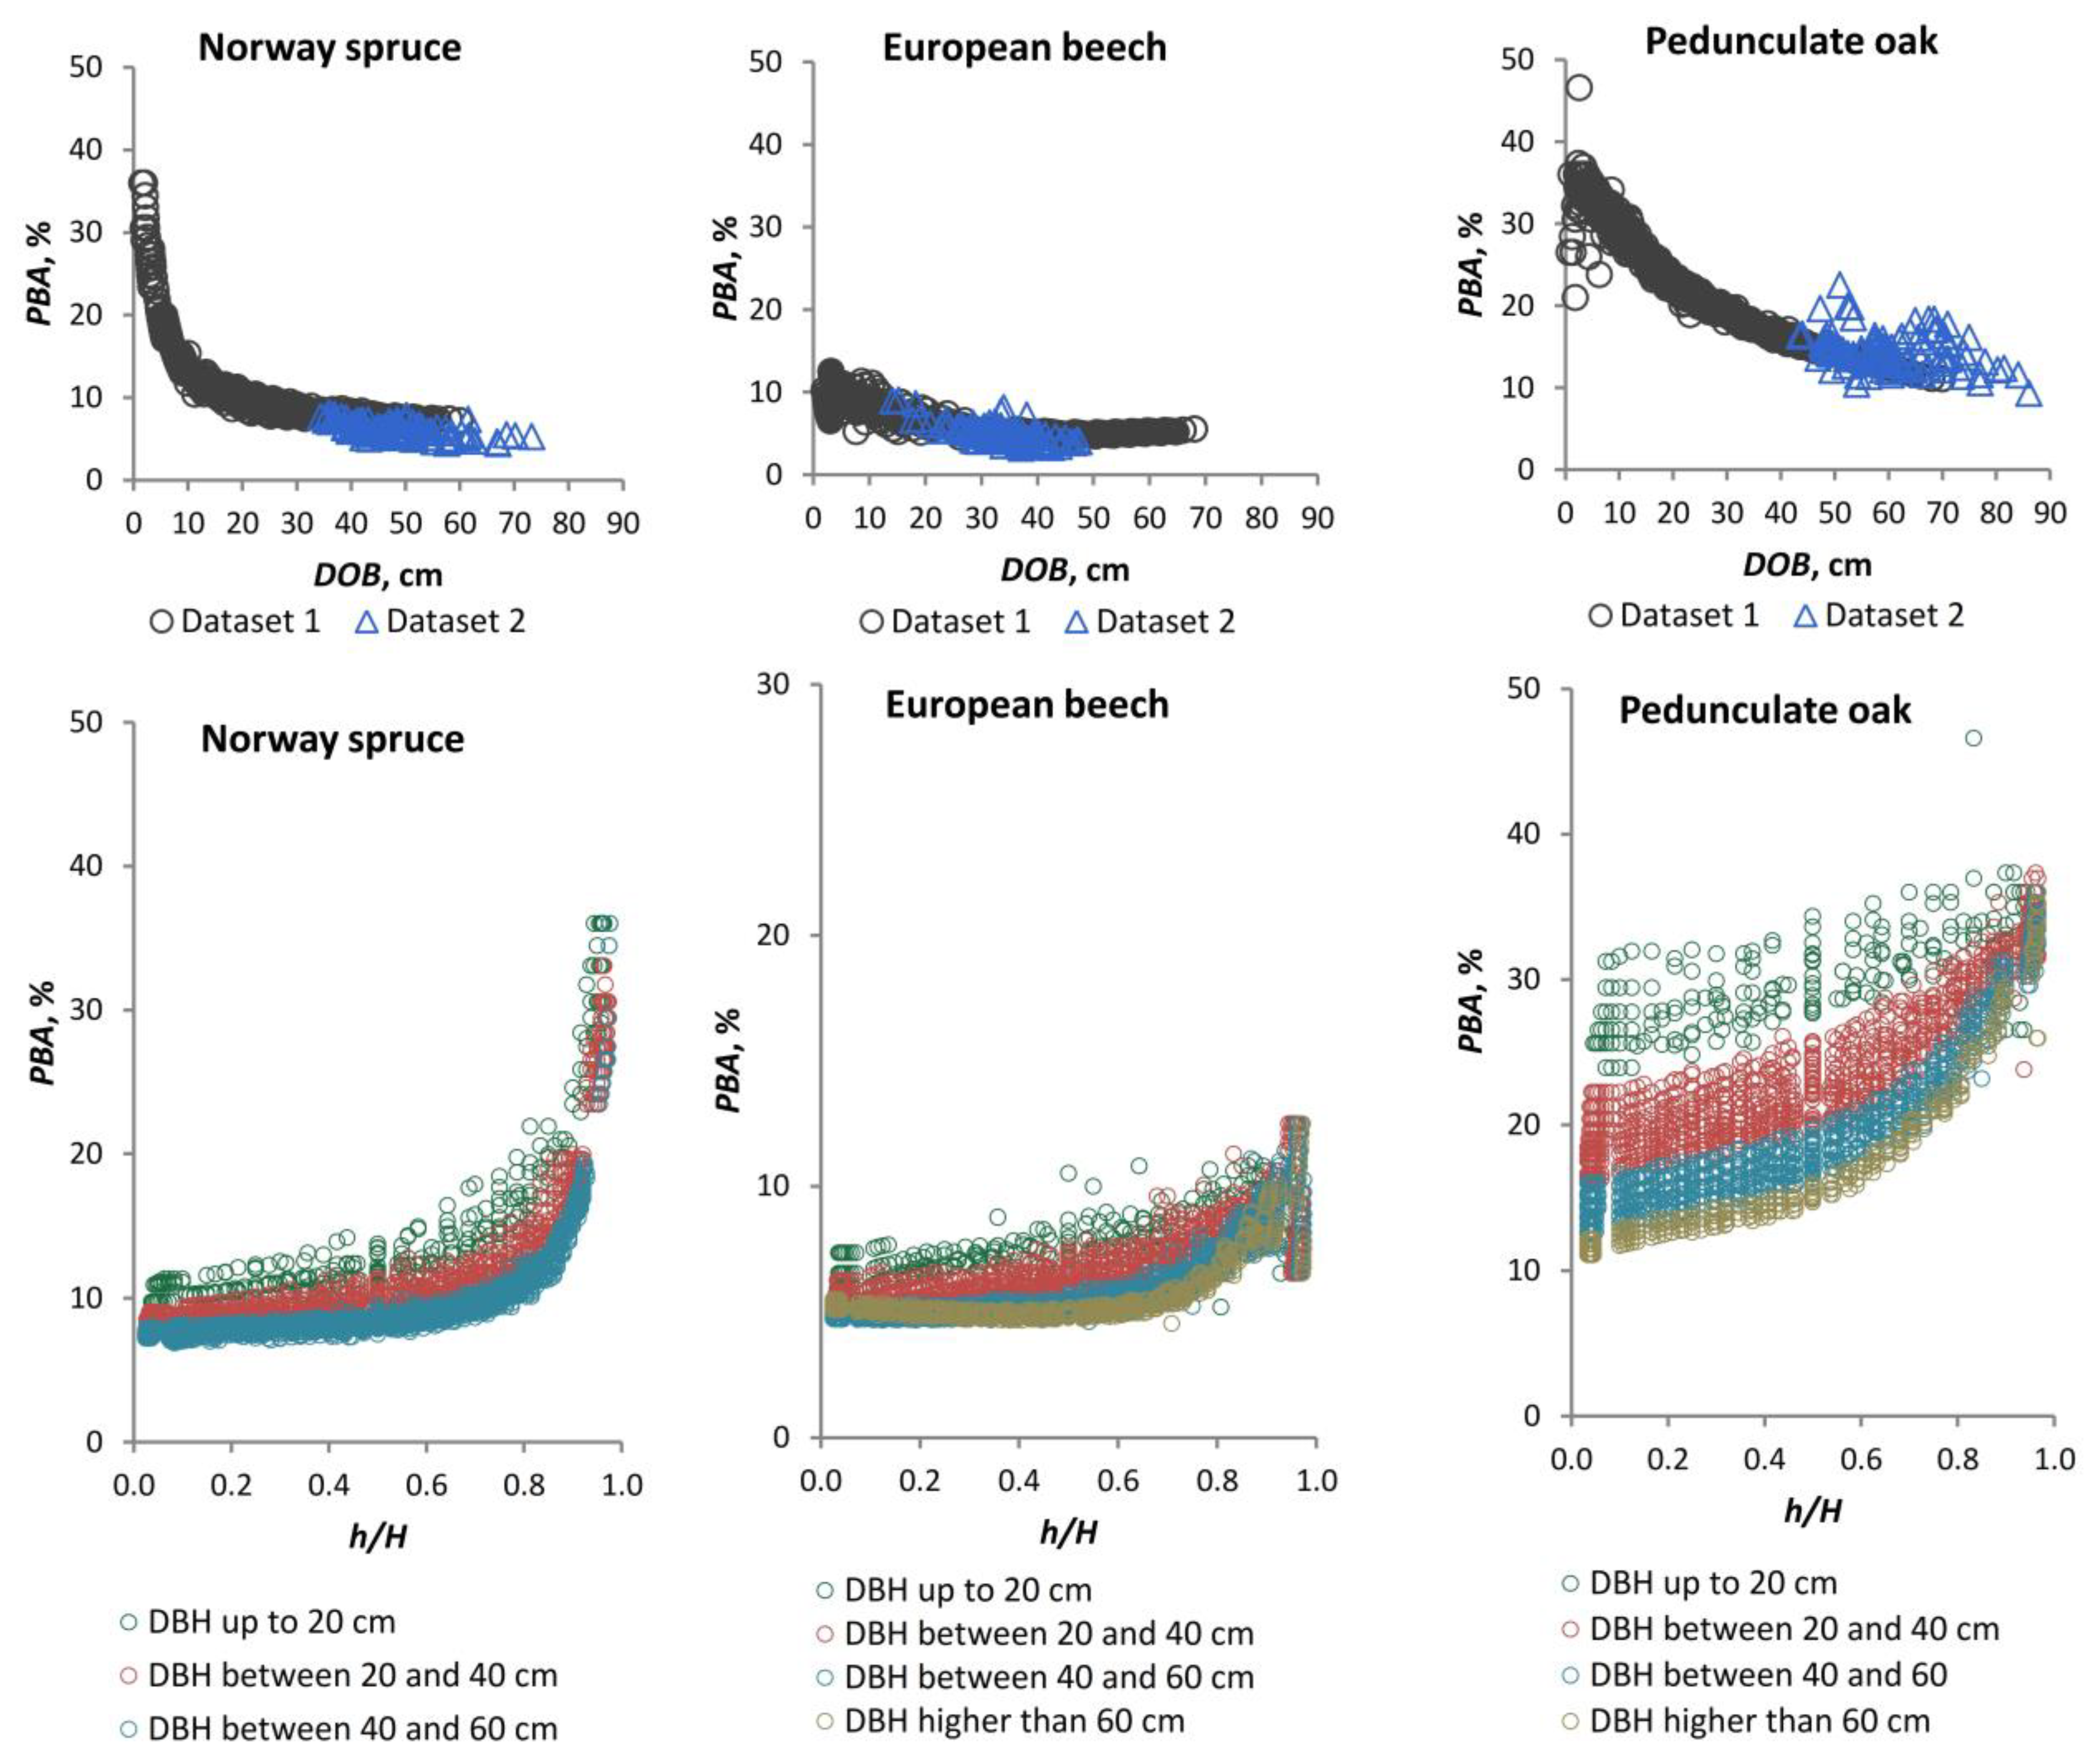
The values of RDBT for Norway spruce, European beech, and pedunculate oak are presented in Figure 6, both in relation to stem diameter variation over bark and relative height along the stem. It can be observed that the European beech species exhibits the lowest RDBT values within dataset 1, with a range of variation between 2.30 and 6.45%. In Norway spruce, RDBT ranges from 3.51 to 20.00%, whereas in pedunculate oak, it ranges from 5.71 to 26.92%. The results of the recent bark measurements included in dataset 2 demonstrate a relatively close distribution of the RDBT values in comparison to the national data included in dataset 1 for Norway spruce and European beech. In contrast, the values included in dataset 2 for pedunculate oak exhibit a more extensive range of variation than those observed in dataset 1. Furthermore, the data on bark included in dataset 2 are supplementary to the national data for Norway spruce for diameters exceeding 60 cm and for pedunculate oak for diameters exceeding 70 cm. In general, there is a decrease in RDBT values with increasing DOB values. However, the dynamics of this decrease and the range of variation of RDBT with DOB are particular to each species. It is evident that among the three species analysed, the lowest RDBT values are recorded for European beech and the highest for pedunculate oak. As the previous subsection presented models for estimating DBT as a function of DOB, a more detailed analysis of RDBT as a function of relative height along the stem was preferred. A comparative analysis of the RDBT values reveals a notable dispersion of the point cloud for all three species, with a particularly pronounced effect observed in the case of Norway spruce and pedunculate oak. This dispersion is a consequence of the disparate RDBT values for a given relative height along the stem, resulting from the aggregation of bark data for trees of varying dimensions. This is why stratifying the data by DBH size allows an optimal analysis of the variation of RDBT with h/H. It can be observed that for the three species analysed, the point cloud defining the RDBT variation as a function of h/H is positioned above for smaller DBH classes, while for thicker trees the relative values of double bark thickness are lower.
A variety of functional forms were investigated with the objective of modelling the variation of RDBT in relation to h/H. However, it was determined that high-degree polynomials were more accurate in representing the data. Figure 7 depicts the estimated values of RDBT along the stem as a function of h/H, employing a sixth-degree polynomial. Up to a relative height of 0.6, the curves of the mathematical models, constructed by grouping the data according to DBH classes, exhibit a near-parallel trajectory. From this point towards the top of the tree, the RDBT size typically increases, and the curves lose their parallelism.
The models displayed in Figure 7 also demonstrate the RDBT dynamics along the stem and the RDBT dynamics as a consequence of increasing diameter at breast height, which can effectively substitute for the time factor. The parameter values and accuracy indexes of these models are presented in Table A1, which can be found in Appendix A. For these models, the R2 value increases from low to high DBH classes for all species analysed. Consequently, the values quantifying the errors, MAE and RMSE, are lowest in the large DBH classes.

3.3. Variation in the Proportion of Bark in the Cross-Sectional Area Along the Stem

Similarly, the values of PBA for the three species under analysis are illustrated in Figure 8, which depicts the variation in PBA versus stem diameter over bark and relative height along the stem. As the size of PBA can be successfully substituted for the values related to the proportion of bark in the volume, the results from the two datasets are of great practical importance. The point cloud of the PBA values has a similar shape to the point cloud of the RDBT size, which is not surprising given that the area formula has diameter as a calculation element. However, there are also notable differences in size and range of variation. A comparison of the results from the two datasets reveals that the degree of overlap between the recent results reflected by dataset 2 and the data describing the national PBA included in dataset 1 is higher for Norway spruce and European beech. In the case of pedunculate oak, the PBA values in dataset 2 are more dispersed. For Norway spruce and pedunculate oak, dataset 2 shows PBA values for diameters greater than 60 cm and greater than 70 cm, respectively. In practice, the tables for estimating double bark thickness and the tables for estimating the proportion of bark in the volume [55], which are valid at the national level, are not applicable for diameters exceeding the aforementioned limits. Similarly, in the case of PBA, as in the case of RDBT, there is a decrease in the PBA values with increasing DOB values, with a specific variation and dynamics observed for each species analysed. The lowest PBA values in dataset 1 are observed in the European beech species, with a range of variation between 4.54 and 12.49%. In Norway spruce, PBA ranges from 6.89 to 36.00%, while in pedunculate oak, it ranges from 11.10 to 46.60%. A comparative analysis of the PBA values in relation to the relative height along the stem reveals a higher dispersion of the point cloud than in the DOB analysis for all species. The greatest dispersion of the point cloud is observed in the case of the pedunculate oak species. By classifying the data on PBA variation with relative height according to DBH size, it is possible to reduce the dispersion of subsets of values and to identify the variation in PBA along the stem relative to DBH. In all cases, the point cloud spread indicating PBA variation along the stem is superior for data subsets with lower DBH values.
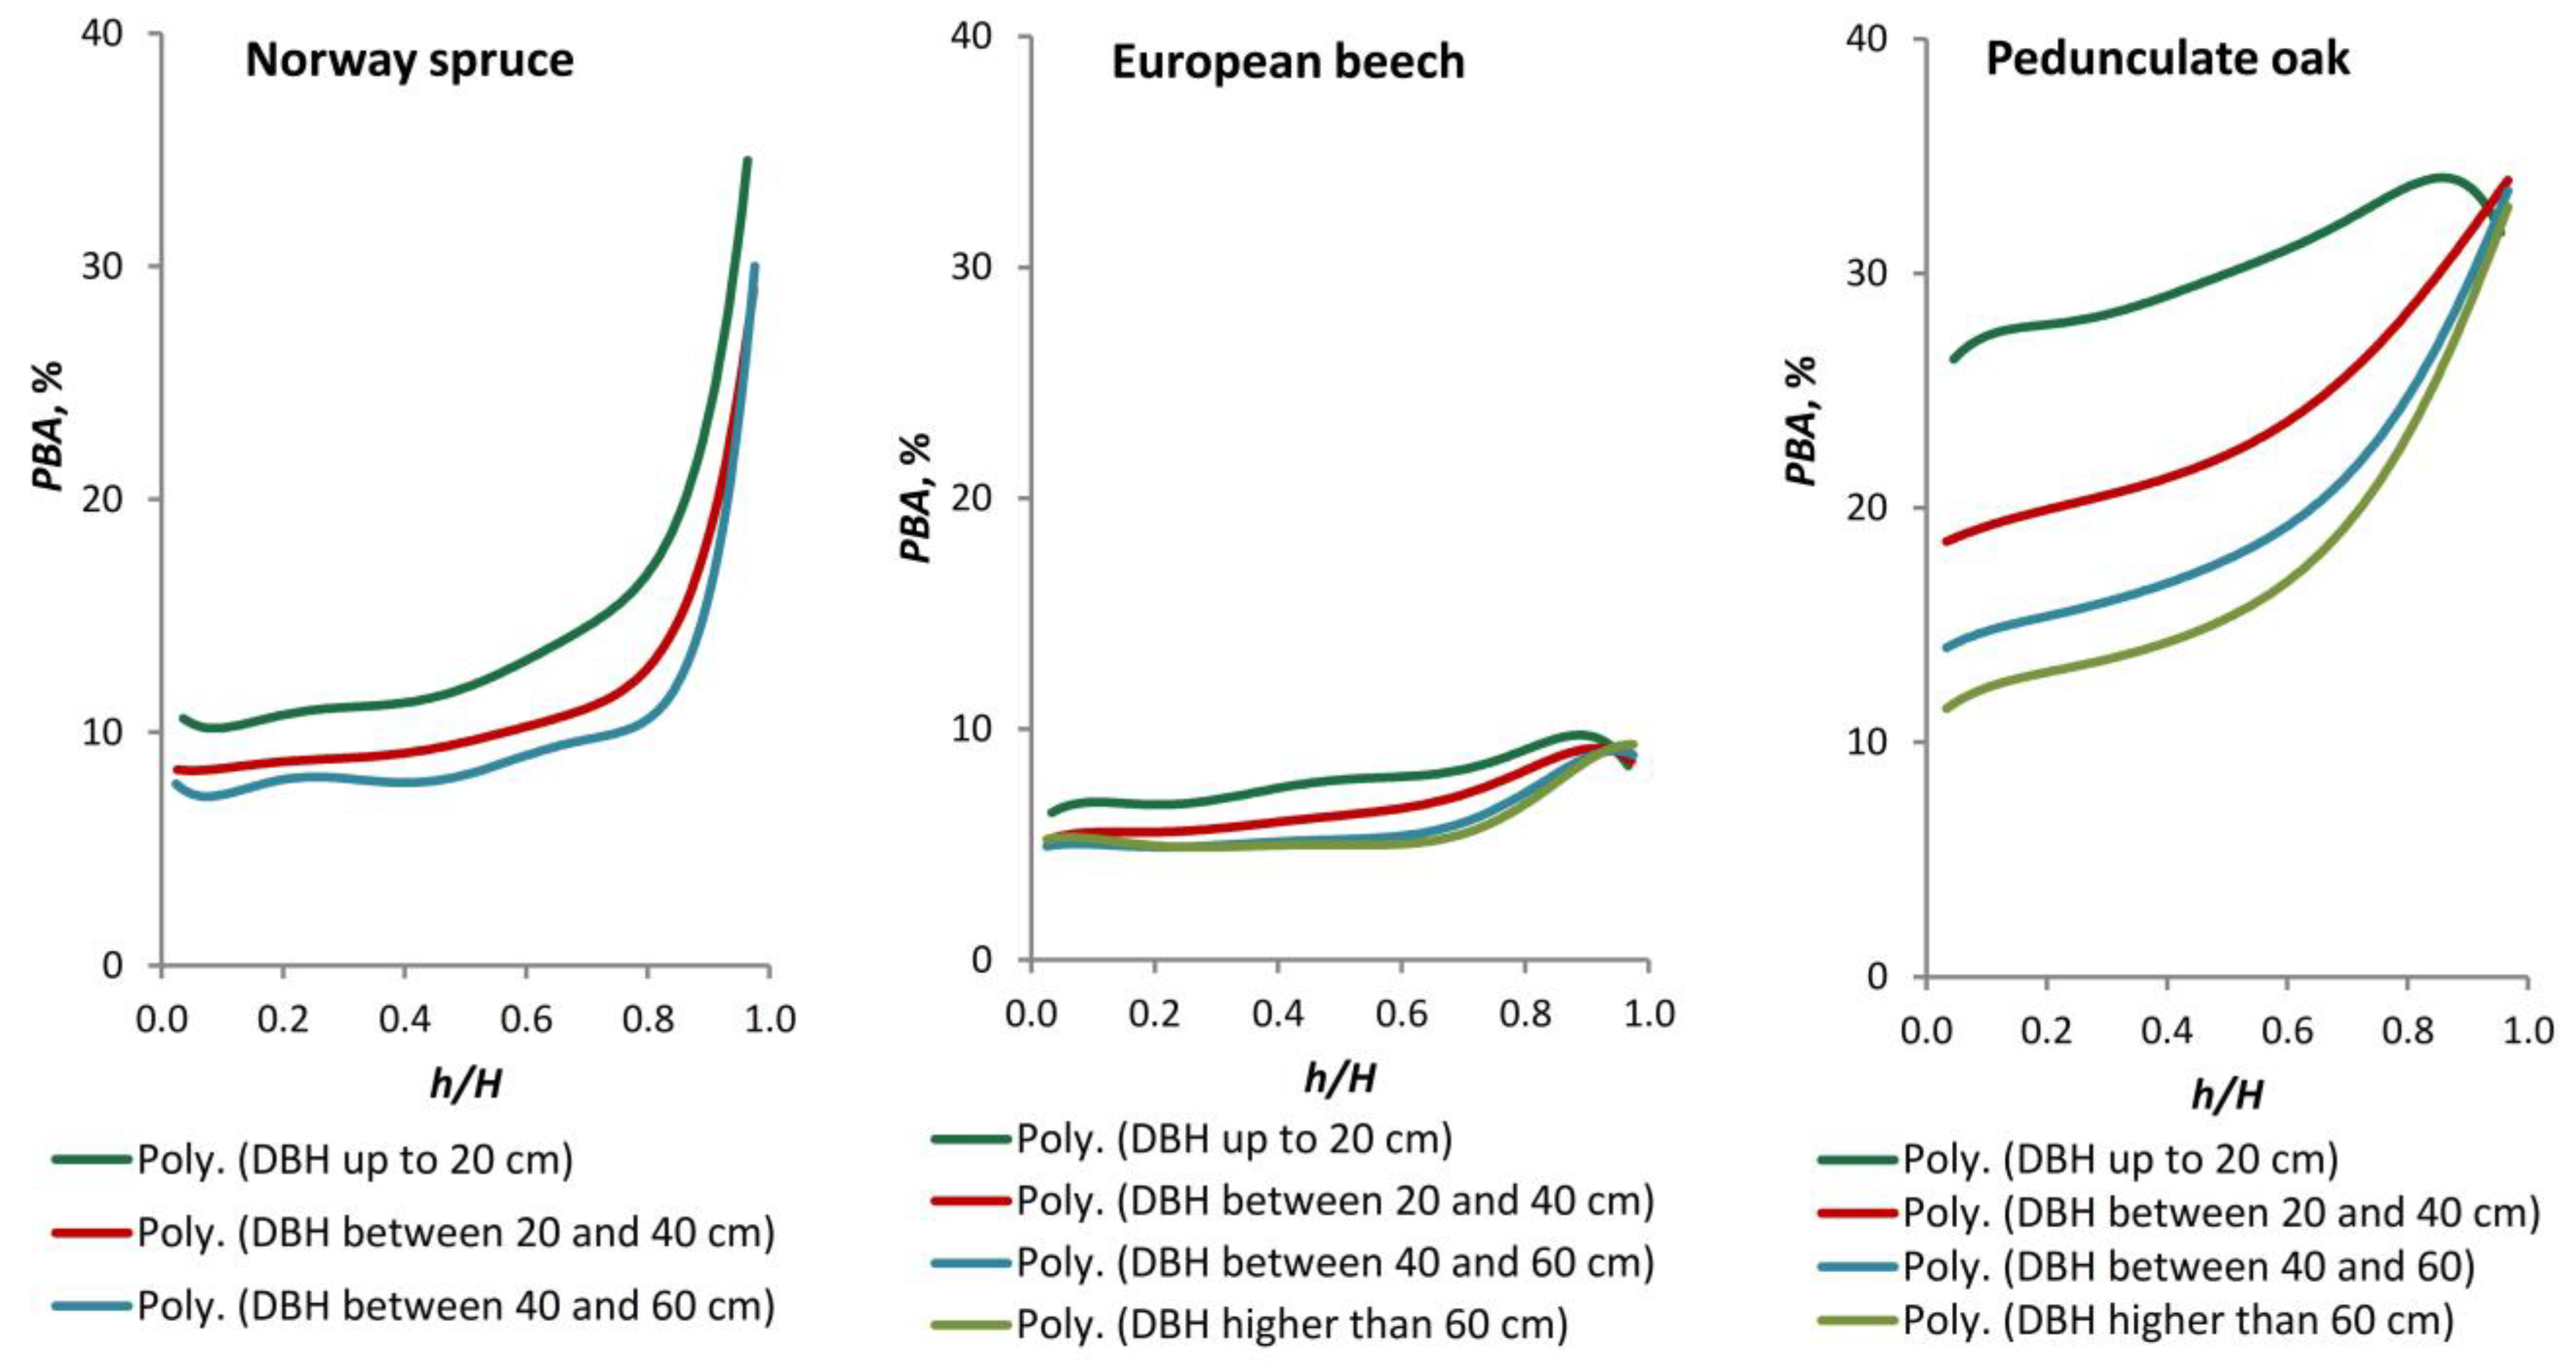
In order to model the variation in PBA in relation to h/H, it was found that the high-degree polynomial was a useful tool, just as it had been in the case of analysing the RDBT data. Figure 9 illustrates the estimation of PBA along the stem as a function of h/H by applying a sixth-degree polynomial function. The shapes of the curves are comparable to those observed in the evolution of RDBT along the stem, with a parallel trend remaining up to a relative height of 0.6. Subsequently, a notable increase in the PBA values towards the top of the stem is evident, with a more accentuated rise in the section with a relative height of between 0.8 and 1.0. The steepest increase is observed in the vicinity of the top of Norway spruce.
The grouping of the data on PBA variation along the stem according to DBH classes and the subsequent graphical presentation of the PBA estimates illustrate the significance of both tree size and the location of the analysed section along the stem. The PBA estimation models presented in Figure 9 are accompanied by the parameter values and accuracy indexes presented in Table A2, which can be found in Appendix A. It can be observed that these models exhibit greater accuracy for larger trees, with the DBH values exceeding 40 cm, as evidenced by the analysis of the R2 values and the examination of the MAE and RMSE errors.

4. Discussion

4.1. Discussion on Double Bark Thickness Along the Stem

It is widely acknowledged that the fire regime can account for a significant proportion of the variability in BT at the global scale [18,20,21,34]. Furthermore, the defensive function is identified as the primary driver [1]. The impact of fire on BT is not observed in moist forests [1]. In non-fire-prone temperate rainforest ecosystems, the investment in the formation of bark is determined by three primary factors: soil resources, cool minimum temperatures, and seasonal moisture stress [42,48,49,50,51]. The presence of thicker bark has been observed in communities situated on infertile soil or in cooler, drier climates [42], as well as in habitats that are more disturbed [24]. In this broad context, forest species have relatively thin bark and only develop thick bark as a consequence of reaching a very large size [17]. The results of the present study, based on data collected at the national level in a temperate continental climate, confirm this idea for three commercial forest species in Romania: Norway spruce, European beech, and pedunculate oak. For Norway spruce trees, dataset 1 showed a variation in DBT of between 3 mm and 22 mm at stem diameters over bark ranging from 1.5 cm to 60.0 cm. The national data for European beech trees demonstrated a variation in DBT between 1 mm and 19 mm at stem diameters over bark ranging from 1.9 cm to 68.0 cm. The highest DBT variation was observed in pedunculate oak trees, with the DBT values ranging from 1 mm to 40 mm at stem diameters over bark ranging from 0.7 cm to 70.0 cm. In a previous study, Stängle et al. [43] observed a range of 4.0 mm to 48 mm for DBT in Norway spruce trees in Southwest Germany, with diameter ranges from 7.9 cm to 84.6 cm. In a neighbouring geographical area, DBT was observed to vary from 9.26 mm for a DBH of 12.5 cm to 31.65 mm for a DBH of 92.5 cm for Norway spruce trees in Bosnia and Herzegovina [9].
In particular forest locations, dataset 2 revealed a range of DBT between 11 mm and 23 mm for sections with DOB spanning from 34.4 cm to 73.25 cm in Norway spruce logs. DBT exhibited a range of 6–14 mm for sections with DOB between 14.2 cm and 47.5 cm in European beech logs and a range of 29–66 mm for sections with DOB between 43.5 cm and 86.1 cm in pedunculate oak logs. In the case of European beech, recent data on bark measurements align with national data. In contrast, DBT was found to be lower than the values measured in the middle of the last century at the national level in Norway spruce. In the case of pedunculate oak, recent DBT values are notably higher. Similarly, Stängle et al. [64] found that the BT of Norway spruce in Southwest Germany was smaller in the new dataset compared to the measurements taken in the 1970s. Subsequently, Stängle and Dormann [54] demonstrated the necessity for the periodic assessment of existing bark equations to ensure their continued validity. The findings of the present study highlight the necessity for the integration of data on the DBT of thick trees into the existing national database of bark data. In a recent study, Cysneiros et al. [68] proposed that models of bark thickness should be integrated with models of cavity occurrence to enhance the accuracy of bark and wood volume estimates in large and old trees. They further concluded that the presence of trunk cavities and hollow trunks can lead to an overestimation of wood volume and, in some cases, may also impact tree stability. When accounting for measurement errors, the bark gauge method has been shown to significantly overestimate mean bark thickness, particularly in larger individuals [41]. Consequently, the contour method may offer a more suitable approach for studies of bark allometry [41]. Nevertheless, the analysis of the three species revealed no significant discrepancies between the gauge method and the direct measurement of bark thickness at the lower and upper ends.
The results of this study demonstrated that the relationship between DBT and DOB is nearly linear for Norway spruce, exhibiting linearity in steps or non-linearity for European beech, and displaying notable non-linearity for pedunculate oak. Musić et al. [9] investigated the DBT-DOB relationship for Norway spruce in Bosnia and Herzegovina, identifying a non-linear variation. Furthermore, Hempson et al. [51] established that DBT-DOB relationships are non-linear above a specified stem diameter threshold in a multitude of woody species. Consequently, RDBT measures are contingent upon the range of stem diameters that are sampled. The greatest impact of BT is observed in the diameter of the section, yet BT at the same diameter of the section (part of the trunk) at different relative heights of the trunk does not exhibit uniformity [9]. In general, BT decreases with increasing height along the tree stem [29,69]. A more detailed analysis by Eberhardt [40] revealed that inner bark thickness was relatively constant up the bole of each tree, whereas outer bark thickness rapidly declined from its thickest point at stump height. A variation in BT has been observed in codominant, intermediate, and suppressed trees [29]. The BT of these trees is approximately 8%, 14%, and 18% thicker, respectively, than that of dominant trees of the same size. Additionally, the bark properties of young trees are species-specific and exhibit variation along the stem profile [69]. The variation of site productivity and individual growth rate appears to exert a considerable influence on BT [64], as evidenced by the results obtained in the present study for dataset 2 in comparison with dataset 1. Furthermore, tree age has been demonstrated to exert a pronounced positive effect on BT [64].
In comparing models of BT estimation, the trees, the stand, and the environmental factors play an important role, as Stängle et al. [64] have noted. The specific type of bark thickness model used is of lesser importance than obtaining the correct model coefficients [3]. As indicated by Yang and Qiao [70], the accuracy of the models differs depending on the species under consideration. Their recent findings suggest that generalized additive models and variable–exponent models yield more reliable estimates than segmented polynomial regression models. Additionally, the construction of generalized additive models is more straightforward and time-efficient compared to the other models [70]. Of the seven mathematical models employed in this study, Models 2 and 3, which were developed for estimating DBT in European beech trees, Norway spruce trees, and pedunculate oak trees, respectively, were found to be more accurate in terms of R2, MAE, RMSE, AIC, and BIC. Stängle and Dormann [54] posited that Model 3 is the optimal representation of BT variability over time and space in two datasets of European silver fir trees, as evidenced by its superior performance in terms of MAE and RMSE. Conversely, Muhairwe [57] demonstrated that the equation developed by Cao and Pepper (Model 6) produces the most consistent estimates of bark thickness across five studied species. Additionally, employing the modified Model 6, which incorporates the ratio between DBH inside bark and DBH over bark, Li and Weiskittel [4] obtained more favourable outcomes for six conifer species in North America. The present study demonstrated that, contrary to expectations, Model 6 was identified as the least accurate model based on the R2, MAE, and RMSE values for European beech and pedunculate oak. However, the same model was found to be optimal based on the AIC and BIC values for European beech. In their 2023 study, Hansen et al. [71] employed Model 7 and reported an RMSE of 2.5 mm and an MAE of 0.0–0.02 mm for bark thickness estimates in spruce. They observed that utilising six equations with diverse predictors led to an improved MAE through the incorporation of DOB, whereas the most optimal results in terms of RMSE were attained through the use of DOB, DBH, h and H, or alternatively, through the inclusion of DOB and DBH as predictors. The present study indicates that Model 7 performs well in terms of the R2, MAE, and RMSE values for estimating DBT for Norway spruce. However, for all three analysed species, Model 7 was found to be inaccurate following the analysis of the AIC and BIC values. A state-wide model for estimating the bark thickness of white spruce was found to be accurate, simple, and robust, with no practical geographical variation over the six areas in Alaska, according to Malone and Liang [50]. Furthermore, Zeibig-Kichas et al. [39] suggested that variability in bark thickness may obscure differences between sample locations. The models tested by Bauer et al. [10] for estimating BT at breast height diameter exhibited relative RMSE values higher than 20%, suggesting that the natural variability of the bark, measurement error, and the absence of additional independent variables complementing the variables of DBH and altitude may have contributed to the observed results.

4.2. Discussion on Relative Double Bark Thickness Along the Stem

In regions with extensive geographical areas, the relative BT is correlated with the distribution of tree species along a fire frequency gradient [19]. Furthermore, it has been observed that the decline in bark thickness with tree size is more rapid in species that experience frequent fire exposure than in those that are less frequently exposed to fire [13]. In general, as tree diameter increases, BT tends to be greater, while RDBT is lower. This suggests that as trees grow larger, there is a reduction in allocation to bark, which makes them less susceptible to fire [13]. The findings of the present study align with this general principle, indicating that in a temperate continental climate characteristic of Romania, the variation in RDBT in relation to DOB follows a decreasing trend, with notable differences observed between each commercial forest species analysed.
In examining section position at a given height on the stem, it can be observed that the proportion of mean bark thickness to stem diameter does not remain constant throughout the lifespan of the plant, as documented by Adams and Jackson [41]. BT represents a relatively constant proportion of over bark diameter across a section of the stem, situated at a relative height of approximately 0.2 to 0.7 [6]. At the level of tree crowns, the rate of decrease in stem diameter under bark accelerates, while the bark itself reaches a constant value [6]. In the lower portion of the stem (from 0.1 m to 3.0 m), Graves et al. [14] observed a decline in both absolute and relative total BT with increasing height. They also noted that there were no discernible differences in height-related changes between the various habitat groups of six Quercus species. The present study demonstrated that in Norway spruce, European beech, and pedunculate oak species, RDBT exhibited almost constant values up to a relative height of 0.6, beyond which RDBT increased at varying rates for each species. Furthermore, it was shown that the dynamics of RDBT as a function of relative height is dependent on DBH classes, and that the variation in RDBT is larger for small trees. In a study conducted by Stängle et al. [43] on Norway spruce in Southwest Germany, RDBT was found to vary between 2.7% and 17.3% for the sections with diameter ranges from 7.9 cm to 84.6 cm. This was determined by studying the relative height from 0.03 to 0.91. In the present study, RDBT exhibited a range of 3.51% to 20.00% for the sections with stem diameters spanning from 1.5 cm to 60.0 cm, based on an examination of relative height from 0.02 to 0.98. With regard to the three species with commercial value in Romania, the study indicated that RDBT can be successfully estimated using a sixth-degree polynomial and relative height as a predictor after stratifying the data by DBH classes in order to reduce variability. In contrast, Li and Weiskittel [4], and later Liepins and Liepins [67], obtained greater precision when estimating RDBT by a power function of relative diameter over bark. Nevertheless, bark thickness curves are tree size-related, as demonstrated by Costa et al. [30], with larger trees exhibiting a more pronounced reduction in cork thickness upwards of the stem.

4.3. Discussion on the Proportion of Bark in Cross-Sectional Areas Along the Stem

The assumption that the form factor is identical for the over and under bark stems provides a basis for considering PBA to be equal to the proportion of bark in volume. PBV is a more practically applicable biometric characteristic of bark. Currently, the percentage bark volume can be estimated for most forest species in Romania based on diameter at breast height [55]. According to the findings of Giurgiu et al. [55], PBV for Norway spruce trees with a DBH of between 6 and 70 cm is estimated to range from 8 to 17%. For European beech trees with a DBH of between 6 and 70 cm, the estimated PBV ranges from 5 to 9%. In the case of pedunculate oak trees, the estimated PBV ranges from 13 to 42% for trees with a DBH of between 8 and 60 cm. The data obtained in the present study are of significant utility for the purposes of wood traceability, as they facilitate the estimation of the volume of bark, thereby enabling the calculation of the net volume of wood. The present study indicates that the proportion of PBA assimilated to PBV ranges from 6.89% to 36.00% for the Norway spruce sections with a stem diameter of between 1.5 cm and 60.0 cm. Similarly, the PBV ranges from 4.54% to 12.49% for the European beech sections with a stem diameter of 1.9 cm to 68.0 cm, and from 11.10% to 46.60% for the pedunculate oak sections with a stem diameter of 0.7 cm to 70.0 cm. It is evident that the highest values for PBA and PBV along the stem are associated with the lowest values of stem diameter over bark positioned at a relative height of 0.8–1.0. The inclusion of sections with a stem diameter over bark thinner than 6 cm in Norway spruce and European beech trees, and of sections with a stem diameter over bark thinner than 8 cm in pedunculate oak trees, respectively, contributes to the expansion of the knowledge base in bark biometrics for the three species for small section sizes. The study conducted by Musić et al. [9] demonstrated that the proportion of bark in section volume exhibited a range between 6.73% for a larger stem diameter of 92.5 cm and 14.26% for a stem diameter of 12.5 cm. PBA and, consequently, PBV demonstrate an almost constant trend for the three species, following parallel curves up to a relative height of 0.6, with a notable increase in the upper part of the stem at relative heights of 0.8–1.0. This observation was also made by Liepins and Liepins [67] in their study of Norway spruce trees, in which they found that PBA is almost constant along the stem up to a relative height of about 0.8. This result was based on a study that included conifers and broadleaved species. Additionally, Musić et al. [9] highlighted that a part of the trunk has a significant impact on BT and share of bark in section volume. The results of the present study provide support for this idea when considering Norway spruce, European beech, and pedunculate oak trees. Moreover, the results demonstrate that in the context of PBA or PBV variation in relation to relative height along the stem, DBH classes serve as a significant determinant in the positioning of the variation curve. In practical terms, the curves are situated in a superior position in the case of trees with lower DBH classes. As DBH increases, the variation curve of PBA or PBV versus relative height will be positioned below the previous one with lower DBH. The curves illustrated in Figure 9 are also indicative of the temporal dynamics of PBA and PBV along the stem. It should be noted that the dispersion of PBA and PBV with respect to relative height is lower for trees with a greater DBH, which increases the accuracy of the estimation models for thick trees. As with RDBT, it can be stated that PBA and PBV are dependent on both tree size and section position along the stem.

5. Conclusions

The findings of this study indicate that there is a necessity to complete the database for forest species with commercial value in Romania, such as Norway spruce, European beech, and pedunculate oak, particularly for large trees (DBH greater than 60–70 cm). In a specific forest location, DBT exhibited lower values for Norway spruce logs and higher values for pedunculate oak logs in comparison to the national database. On the other hand, the DBT for European beech logs aligned with the national database. Additionally, the completion of the database requires the updating of the mathematical models for estimating DBT and PBV. Of the seven mathematical models employed in this study, Models 2 (based on a third-degree polynomial) and 3 (based on the logarithmic function) were developed for estimating DBT by DOB in European beech trees, Norway spruce trees, and pedunculate oak trees, respectively. The results indicated that these models exhibited greater accuracy in terms of R2, MAE, RMSE, AIC, and BIC than other models based on multiple variables. The study demonstrated that the estimation of RDBT and PBA is feasible through the application of a sixth-degree polynomial and relative height as a predictor variable, based on stratifying the data by DBH classes to minimise variability. The models obtained for PBA are of significant utility in industry and the economy, particularly in the context of wood traceability. This is due to the fact that PBA, when assimilated with PBV, reflects the bark volume of wood assortments as a function of their position along the stem. For a given DBH, PBA and PBV exhibit minimal variation for sections from the base of the tree up to a relative height of 0.6, with a notable increase towards the top of the tree at relative heights above 0.8.

Funding

This research received no external funding.

Data Availability Statement

Data are contained within the article.

Acknowledgments

I would like to thank Alexandru Olaru, who helped with the data collection. I am also grateful to Alexandra Stan, for her contribution to English editing.

Conflicts of Interest

The author declares no conflict of interest.

Appendix A

Table A1. Parameter values and accuracy indexes of the relative double bark thickness models for Norway spruce, European beech and pedunculate oak.
SpeciesDBH ClassesParameter ValuesAccuracy Indexes
b0b1b2b3b4b5b6R2MAERMSE
Norway spruceup to 20 cm6.1682−28.017280.42−1176.32418.6−2380904.310.9480.57450.7906
between 20 cm and 40 cm4.4208−6.561688.719−433.81007.6−1097455.810.95930.39140.5575
between 40 cm and 60 cm4.5018−27.75309.98−13892948.1−294911240.97390.25840.4592
European beechup to 20 cm2.822117.32−163.14679.97−1344.31257−446.330.54570.32240.4595
between 20 cm and 40 cm2.45948.44−76.188319.16−642.62619.45−226.720.74940.26850.3773
between 40 cm and 60 cm2.39125.4058−62.539289.75−622.8624.96−232.870.86220.16480.2865
higher than 60 cm2.53266.3759−79.478356.18−739.27716.48−258.140.86020.14710.2911
Pedunculate oakup to 20 cm11.59852.606−385.651370−2421.92099−709.630.54121.13861.4978
between 20 cm and 40 cm9.54137.3926−20.00648.284−66.18668.559−28.0970.87780.82160.9923
between 40 cm and 60 cm6.979610.798−55.659194.48−344.11309.4−102.060.96210.53390.6360
higher than 60 cm5.498714.146−75.077243.09−410.5361.65−119.310.98140.27920.4808
Table A2. Parameter values and accuracy indexes of the proportion of bark area models for Norway spruce, European beech and pedunculate oak.
SpeciesDBH ClassesParameter ValuesAccuracy Indexes
b0b1b2b3b4b5b6R2MAERMSE
Norway spruceup to 20 cm11.71−45.045453.07−1897.93902.4−3841.514620.94881.03271.3952
between 20 cm and 40 cm8.5565−9.1648133.68−668.911583.8−1750.8737.930.95970.72221.0076
between 40 cm and 60 cm8.6311−46.293519.86−2332.94960.1−49711899.50.97720.45610.7759
European beechup to 20 cm5.579233.042−310.981296.1−2562.12395.4−850.520.54650.61840.8780
between 20 cm and 40 cm4.865916.154−145.52609.36−1226.71182.6−432.970.75110.51690.7230
between 40 cm and 60 cm4.731910.275−119.15552.91−1189.91195.4−445.910.86430.31680.5479
higher than 60 cm5.005112.257−153.12686.66−14261383−498.720.86250.28250.5554
Pedunculate oakup to 20 cm21.92489.416−653.92319.4−4093.83541.3−1195.10.54371.90852.4939
between 20 cm and 40 cm18.1414.066−42.745112.01−164.93163.08−64.5080.87521.43191.7282
between 40 cm and 60 cm13.4620.349−106.56374.33−666.93604.12−203.10.96130.95021.1259
higher than 60 cm10.70626.285−138.51447.25−756.68671.85−225.770.98260.49520.8203

References

  1. Paine, C.E.T.; Stahl, C.; Courtois, E.A.; Patiño, S.; Sarmiento, C.; Baraloto, C. Functional explanations for variation in bark thickness in tropical rain forest trees. Funct. Ecol. 2010, 24, 1202–1210. [Google Scholar] [CrossRef]
  2. Poorter, L.; McNeil, A.; Hurtado, V.H.; Prins, H.H.; Putz, F.E. Bark traits and life-history strategies of tropical dry-and moist forest trees. Funct. Ecol. 2014, 28, 232–242. [Google Scholar] [CrossRef]
  3. Marshall, H.D.; Murphy, G.E.; Lachenbruch, B. Effects of bark thickness estimates on optimal log merchandising. Forest Prod. J. 2006, 56, 87–92. [Google Scholar]
  4. Li, R.; Weiskittel, A.R. Estimating and predicting bark thickness for seven conifer species in the Acadian Region of North America using a mixed-effects modeling approach: Comparison of model forms and subsampling strategies. Eur. J. For. Res. 2011, 130, 219–233. [Google Scholar] [CrossRef]
  5. Meyer, H.A. Bark volume determination in trees. J. For. 1946, 44, 1067–1070. [Google Scholar]
  6. Gordon, A. Estimating bark thickness of Pinus radiata. N. Z. J. For. Sci. 1983, 13, 340–348. [Google Scholar]
  7. Van Laar, A.; Akça, A. Forest Mensuration; Springer: Dordrecht, The Netherlands, 2007; pp. 78–79. [Google Scholar]
  8. Kershaw, J.A., Jr.; Ducey, M.J.; Beers, T.W.; Husch, B. Forest Mensuration, 5th ed.; Wiley: Oxford, UK, 2016; pp. 148–151. [Google Scholar]
  9. Musić, J.; Lojo, A.; Balić, B.; Ibrahimspahić, A.; Avdagić, A.; Knežević, J.; Halilović, V. Modelling Bark Thickness of Norway Spruce (Picea abies Karst). South-East Eur. For. 2019, 10, 125–135. [Google Scholar] [CrossRef]
  10. Bauer, R.; Billard, A.; Mothe, F.; Longuetaud, F.; Houballah, M.; Bouvet, A.; Cuny, H.; Colin, A.; Colin, F. Modelling bark volume for six commercially important tree species in France: Assessment of models and application at regional scale. Ann. For. Sci. 2021, 78, 104. [Google Scholar] [CrossRef]
  11. Lawes, M.J.; Adie, H.; Russell-Smith, J.; Murphy, B.; Midgley, J.J. How do small savanna trees avoid stem mortality by fire? The roles of stem diameter, height and bark thickness. Ecosphere 2011, 2, 1–13. [Google Scholar] [CrossRef]
  12. Lawes, M.J.; Richards, A.; Dathe, J.; Midgley, J.J. Bark thickness determines fire resistance of selected tree species from fire-prone tropical savanna in north Australia. Plant Ecol. 2011, 212, 2057–2069. [Google Scholar] [CrossRef]
  13. Gumber, S.; Singh, R.D.; Ram, J.; Tewari, A.; Singh, S.P. Bark thickness analysis of four dominant tree species of Central Himalayan forests varying in exposure to surface fires. Trees 2022, 36, 685–695. [Google Scholar] [CrossRef]
  14. Graves, S.J.; Rifai, S.W.; Putz, F.E. Outer bark thickness decreases more with height on stems of fire-resistant than fire-sensitive Floridian oaks (Quercus spp.; Fagaceae). Am. J. Bot. 2014, 101, 2183–2188. [Google Scholar] [CrossRef] [PubMed]
  15. Brando, P.M.; Nepstad, D.C.; Balch, J.K.; Bolker, B.; Christman, M.C.; Coe, M.; Putz, F.E. Fire-induced tree mortality in a neotropical forest: The roles of bark traits, tree size, wood density and fire behavior. Glob. Change Biol. 2012, 18, 630–641. [Google Scholar] [CrossRef]
  16. Kurt, Y.; Calikoglu, M.; Isik, K. Relationships between bark thickness, tree age and tree diameter in Pinus brutia Ten. plantations. Fresenius Environ. Bull. 2021, 30, 3122–3129. [Google Scholar]
  17. Lawes, M.J.; Midgley, J.J.; Clarke, P.J. Costs and benefits of relative bark thickness in relation to fire damage: A savanna/forest contrast. J. Ecol. 2013, 101, 517–524. [Google Scholar] [CrossRef]
  18. Pausas, J.G. Bark thickness and fire regime. Funct. Ecol. 2015, 29, 315–327. [Google Scholar] [CrossRef]
  19. Schafer, J.L.; Breslow, B.P.; Hohmann, M.G.; Hoffmann, W.A. Relative bark thickness is correlated with tree species distributions along a fire frequency gradient. Fire Ecol. 2015, 11, 74–87. [Google Scholar] [CrossRef]
  20. Midgley, J.J.; Lawes, M.J. Relative bark thickness: Towards standardised measurement and analysis. Plant Ecol. 2016, 217, 677–681. [Google Scholar] [CrossRef]
  21. Pausas, J.G. Bark thickness and fire regime: Another twist. New Phytol. 2017, 213, 13–15. [Google Scholar] [CrossRef] [PubMed]
  22. Molina, J.G.A.; Hadad, M.A.; Domínguez, D.P.; Roig, F.A. Tree age and bark thickness as traits linked to frost ring probability on Araucaria araucana trees in northern Patagonia. Dendrochronologia 2016, 37, 116–125. [Google Scholar] [CrossRef]
  23. Pasztory, Z.; Mohacsine, I.R.; Gorbacheva, G.; Börcsök, Z. The utilization of tree bark. BioResources 2016, 11, 7859–7888. [Google Scholar] [CrossRef]
  24. Hedge, V.; Chandran, M.D.S.; Gadgil, M. Variation in bark thickness in a tropical forest community of Western Ghats in India. Funct. Ecol. 1998, 12, 313–318. [Google Scholar]
  25. Zhang, Q.H.; Byers, J.A.; Zhang, X.D. Influence of bark thickness, trunk diameter and height on reproduction of the longhorned beetle, Monochamus sutor (Col., Cerambycidae) in burned larch and pine. J. Appl. Entomol. 1993, 115, 145–154. [Google Scholar] [CrossRef]
  26. Li, M.; Van Renterghem, T.; Kang, J.; Verheyen, K.; Botteldooren, D. Sound absorption by tree bark. Appl. Acoust. 2020, 165, 107328. [Google Scholar] [CrossRef]
  27. Neumann, M.; Lawes, M.J. Quantifying carbon in tree bark: The importance of bark morphology and tree size. Methods Ecol. Evol. 2021, 12, 646–654. [Google Scholar] [CrossRef] [PubMed]
  28. McConnon, H.; Knowles, R.L.; Hansen, L.W. Provenance affects bark thickness in Douglas fir. N. Z. J. For. Sci. 2004, 34, 77–86. [Google Scholar]
  29. Berrill, J.P.; O’Hara, K.L.; Kichas, N.E. Bark thickness in coast Redwood (Sequoia sempervirens (D. Don) Endl.) varies according to tree-and crown size, stand structure, latitude and genotype. Forests 2020, 11, 637. [Google Scholar] [CrossRef]
  30. Costa, A.; Barbosa, I.; Pestana, M.; Miguel, C. Modelling bark thickness variation in stems of cork oak in south-western Portugal. Eur. J. For. Res. 2020, 139, 611–625. [Google Scholar] [CrossRef]
  31. Gall, R.; Landolt, W.; Schleppi, P.; Michellod, V.; Bucher, J.B. Water content and bark thickness of Norway spruce (Picea abies) stems: Phloem water capacitance and xylem sap flow. Tree Physiol. 2002, 22, 613–623. [Google Scholar] [CrossRef]
  32. Costa, E.A.; Liesenberg, V.; Finger, C.A.G.; Hess, A.F.; Schons, C.T. Understanding bark thickness variations for Araucaria angustifolia in southern Brazil. J. For. Res. 2021, 32, 1077–1087. [Google Scholar] [CrossRef]
  33. Nie, W.; Liu, Y.; Tan, C.; Wang, Y.; Liu, J.; Zhao, X.; Jiang, Z.; Jia, Z. Characteristics and factors driving the variations in bark thickness of major woody plants in China. Ecol. Indic. 2022, 144, 109447. [Google Scholar] [CrossRef]
  34. Rosell, J.A. Bark thickness across the angiosperms: More than just fire. New Phytol. 2016, 211, 90–102. [Google Scholar] [CrossRef]
  35. Kohnle, U.; Hein, S.; Sorensen, F.C.; Weiskittel, A.R. Effects of seed source origin on bark thickness of Douglas-fir (Pseudotsuga menziesii) growing in southwestern Germany. Can. J. For. Res. 2012, 42, 382–399. [Google Scholar] [CrossRef]
  36. Wilms, F.; Duppel, N.; Cremer, T.; Berendt, F. Bark thickness and heights of the bark transition area of Scots pine. Forests 2021, 12, 1386. [Google Scholar] [CrossRef]
  37. Vendruscolo, D.G.S.; Cerqueira, C.L.; de Pádua Chaves e Carvalho, S.; Medeiros, R.A.; da Silva, R.S. Thickness accuracy of teak bark by artificial intelligence. Floresta 2019, 49, 449–458. [Google Scholar] [CrossRef]
  38. Rosell, J.A.; Olson, M.E.; Anfodillo, T.; Martínez-Méndez, N. Exploring the bark thickness–stem diameter relationship: Clues from lianas, successive cambia, monocots and gymnosperms. New Phytol. 2017, 215, 569–581. [Google Scholar] [CrossRef] [PubMed]
  39. Zeibig-Kichas, N.E.; Ardis, C.W.; Berrill, J.P.; King, J.P. Bark thickness equations for mixed-conifer forest type in Klamath and Sierra Nevada mountains of California. Int. J. For. Res. 2016, 2016, 1864039. [Google Scholar] [CrossRef]
  40. Eberhardt, T.L. Longleaf pine inner bark and outer bark thicknesses: Measurement and relevance. South. J. Appl. For. 2013, 37, 177–180. [Google Scholar] [CrossRef]
  41. Adams, D.C.; Jackson, J.F. Estimating the allometry of tree bark. Am. Midl. Nat. 1995, 134, 99–106. [Google Scholar] [CrossRef]
  42. Richardson, S.J.; Laughlin, D.C.; Lawes, M.J.; Holdaway, R.J.; Wilmshurst, J.M.; Wright, M.; Curran, T.J.; Bellingham, P.J.; McGlone, M.S. Functional and environmental determinants of bark thickness in fire-free temperate rain forest communities. Am. J. Bot. 2015, 102, 1590–1598. [Google Scholar] [CrossRef]
  43. Stängle, S.M.; Weiskittel, A.R.; Dormann, C.F.; Brüchert, F. Measurement and prediction of bark thickness in Picea abies: Assessment of accuracy, precision, and sample size requirements. Can. J. For. Res. 2016, 46, 39–47. [Google Scholar] [CrossRef]
  44. Williams, V.L.; Witkowski, E.T.F.; Balkwill, K. Relationship between bark thickness and diameter at breast height for six tree species used medicinally in South Africa. S. Afr. J. Bot. 2007, 73, 449–465. [Google Scholar] [CrossRef]
  45. Kahriman, A.; Sönmez, T.; Şahin, A.; Yavuz, M. A bark thickness model for calabrian pine in Turkey. In Proceedings of the 2nd International Conference on Science, Ecology and Technology, Barcelona, Spain, 23–25 August 2016; pp. 661–670. [Google Scholar]
  46. Cellini, J.M.; Galarza, M.; Burns, S.L.; Martinez-Pastur, G.J.; Lencinas, M.V. Equations of bark thickness and volume profiles at different heights with easy-measurement variables. Forest Syst. 2012, 21, 23–30. [Google Scholar] [CrossRef]
  47. West, P.W. Tree and Forest Measurement; Springer: Berlin, Germany, 2009; pp. 11–15. [Google Scholar]
  48. Yang, S.I.; Radtke, P.J. Predicting bark thickness with one-and two-stage regression models for three hardwood species in the southeastern US. For. Ecol. Manag. 2022, 503, 119778. [Google Scholar] [CrossRef]
  49. Spalt, K.W.; Reifsnyder, W.E. Bark Characteristics and Fire Resistance: A Literature Survey; Southern Forest Experiment Station, Forest Service, U.S. Department of Agriculture: New Orleans, Louisiana, 1962; pp. 1–19. [Google Scholar]
  50. Malone, T.; Liang, J. A bark thickness model for white spruce in Alaska northern forests. Int. J. For. Res. 2009, 2009, 876965. [Google Scholar] [CrossRef]
  51. Hempson, G.P.; Midgley, J.J.; Lawes, M.J.; Vickers, K.J.; Kruger, L.M. Comparing bark thickness: Testing methods with bark–stem data from two South African fire-prone biomes. J. Veg. Sci. 2014, 25, 1247–1256. [Google Scholar] [CrossRef]
  52. Maguire, D.A.; Hann, D.W. Bark thickness and bark volume in southwestern Oregon Douglas-fir. West. J. Appl. For. 1990, 5, 5–8. [Google Scholar] [CrossRef]
  53. Cywicka, D.; Jakóbik, A.; Socha, J.; Pasichnyk, D.; Widlak, A. Modelling bark thickness for Scots pine (Pinus sylvestris L.) and common oak (Quercus robur L.) with recurrent neural networks. PLoS ONE 2022, 17, e0276798. [Google Scholar] [CrossRef] [PubMed]
  54. Stängle, S.M.; Dormann, C.F. Modelling the variation of bark thickness within and between European silver fir (Abies alba Mill.) trees in southwest Germany. Forestry 2018, 91, 283–294. [Google Scholar] [CrossRef]
  55. Giurgiu, V.; Decei, I.; Drăghiciu, D. Metode şi Tabele Dendrometrice; Ceres: Bucharest, Romania, 2004; pp. 58–370. [Google Scholar]
  56. Giurgiu, V.; Decei, I.; Armăşescu, S. Biometria Arborilor şi Arboretelor Din România; Ceres: Bucharest, Romania, 1972; pp. 47–538. [Google Scholar]
  57. Muhairwe, C.K. Bark thickness equations for five commercial tree species in regrowth forests of Northern New South Wales. Aust. For. 2000, 63, 34–43. [Google Scholar] [CrossRef]
  58. Stănescu, V.; Şofletea, N.; Popescu, O. Flora Forestieră Lemnoasă a României; Ceres: Bucharest, Romania, 1997; pp. 43–213. [Google Scholar]
  59. Caudullo, G.; Tinner, W.; de Rigo, D. Picea abies in Europe: Distribution, habitat, usage and threats. In European Atlas of Forest Tree Species; San-Miguel-Ayanz, J., de Rigo, D., Caudullo, G., Houston Durrant, T., Mauri, A., Eds.; Publ. Off. EU: Luxembourg, 2016; p. e012300+. [Google Scholar]
  60. Houston Durrant, T.; de Rigo, D.; Caudullo, G. Fagus sylvatica and other beeches in Europe: Distribution, habitat, usage and threats. In European Atlas of Forest Tree Species; San-Miguel-Ayanz, J., de Rigo, D., Caudullo, G., Houston Durrant, T., Mauri, A., Eds.; Publ. Off. EU: Luxembourg, 2016; p. e012b90+. [Google Scholar]
  61. Eaton, E.; Caudullo, G.; Oliveira, S.; de Rigo, D. Quercus robur and Quercus petraea in Europe: Distribution, habitat, usage and threats. In European Atlas of Forest Tree Species; San-Miguel-Ayanz, J., de Rigo, D., Caudullo, G., Houston Durrant, T., Mauri, A., Eds.; Publ. Off. EU: Luxembourg, 2016; p. e01c6df+. [Google Scholar]
  62. Popescu-Zeletin, I.; Toma, G.; Armăşescu, S.; Decei, I.; Dissescu, R.; Petrescu, L.; Dorin, T.; Stănescu, M.; Predescu, G. Tabele Dendrometrice; Agro-silvică de Stat: Bucharest, Romania, 1957; pp. 27–665. [Google Scholar]
  63. Cao, Q.V.; Pepper, W.D. Predicting inside bark diameter for shortleaf, loblolly, and longleaf pines. South. J. Appl. For. 1986, 10, 220–224. [Google Scholar] [CrossRef]
  64. Stängle, S.M.; Sauter, U.H.; Dormann, C.F. Comparison of models for estimating bark thickness of Picea abies in southwest Germany: The role of tree, stand, and environmental factors. Ann. For. Sci. 2017, 74, 1–10. [Google Scholar] [CrossRef]
  65. Akaike, H. Information theory and an extension of the maximum likelihood principle. In Selected Papers of Hirotugu Akaike; Parzen, E., Tanabe, K., Kitagawa, G., Eds.; Springer: New York, NY, USA, 1998; pp. 199–213. [Google Scholar] [CrossRef]
  66. Schwarz, G. Estimating the dimension of a model. Ann. Statist. 1978, 6, 461–464. [Google Scholar] [CrossRef]
  67. Liepiņš, J.; Liepiņš, K. Evaluation of bark volume of four tree species in Latvia. Res. For. Rural. Dev. 2015, 2, 22–28. [Google Scholar]
  68. Cysneiros, V.C.; Scipioni, M.C.; Allen, C.D. Modeling bark thickness and probability of trunk cavity occurrence relative to tree size in Araucaria angustifolia trees. Trees 2024, 38, 1013–1022. [Google Scholar] [CrossRef]
  69. Konôpka, B.; Pajtík, J.; Šebeň, V.; Merganičová, K. Modeling bark thickness and bark biomass on stems of four broadleaved tree species. Plants 2022, 11, 1148. [Google Scholar] [CrossRef] [PubMed]
  70. Yang, S.I.; Qiao, Y. Quantifying bark thickness and bark volume with alternative modeling procedures for eight species in the southeastern US. For. Ecol. Manag. 2024, 553, 121631. [Google Scholar] [CrossRef]
  71. Hansen, E.; Rahlf, J.; Astrup, R.; Gobakken, T. Taper, volume, and bark thickness models for spruce, pine, and birch in Norway. Scand. J. For. Res. 2023, 38, 413–428. [Google Scholar] [CrossRef]
Figure 1. The range of Norway spruce (a), European beech (b), and pedunculate oak (c) species in Romania. A higher intensity of green denotes a greater frequency of species presence [59,60,61]. The blue triangle indicates the location of plots included in dataset 2.
Forests 15 02264 g001
Figure 2. Double bark thickness variation with stem diameter over bark. DBT represents double bark thickness, DOB is stem diameter over bark.
Forests 15 02264 g002
Figure 3. Distribution of double bark thickness residuals versus predicted double bark thickness for Norway spruce [55].
Forests 15 02264 g003
Figure 4. Distribution of double bark thickness residuals versus predicted double bark thickness for European beech [55].
Forests 15 02264 g004
Figure 5. Distribution of double bark thickness residuals versus predicted double bark thickness for pedunculate oak [55].
Forests 15 02264 g005
Figure 6. Variation of relative double bark thickness with diameter over bark and relative height along the stem for Norway spruce, European beech, and pedunculate oak trees.
Forests 15 02264 g006
Figure 7. Models of relative double bark thickness as a function of relative height along the stem for Norway spruce, European beech, and pedunculate oak trees.
Forests 15 02264 g007
Figure 8. Variations in the proportions of bark area with diameter over bark and relative height along the stem for Norway spruce, European beech, and pedunculate oak trees.
Forests 15 02264 g008
Figure 9. Models of the proportion of bark area as a function of relative height along the stem for Norway spruce, European beech, and pedunculate oak trees.
Forests 15 02264 g009
Table 1. Dataset 1 description.
SpeciesNumber of PlotsNumber of TreesNumber of Tree Size CategoriesDiameter at Breast Height, cmTree Height, mNumber of Bark Data
Min.Max.Min.Max.
Norway spruce3455403218126010423044
European beech4012389239166814403384
Pedunculate oak17643942068706302262
Table 2. Dataset 2 description.
SpeciesPlot LocationNumber of LogsDiameter at the Lower End, cmDiameter at the Upper End, cmLog Length, m
Min.Max.Min.Max.Min.Max.
Norway spruceU.P. IV Doftăneț, u.a. 86B2037.073.2534.468.02.86.2
European beechU.P. IV Doftăneț, u.a. 133B2118.047.514.246.02.66.7
Pedunculate oakU.P. III Plopeni, u.a. 982048.586.143.585.32.17.0
Table 3. Bark measurements in dataset 2.
SpeciesNumber of Bark Measurements UsingTotal Bark MeasurementsNumber of Bark Data
Measuring TapeBark Gauge
Norway spruce160124284102
European beech168142310113
Pedunculate oak160126286103
Table 4. Description of models used to estimate double bark thickness.
ModelsEquations 1Variables and Units
DBTDOBDBHhH
Model 1 D B T = a 0 + a 1 × D O B + a 2 × D O B 2 mmcm---
Model 2 D B T = a 0 + a 1 × D O B + a 2 × D O B 2 + a 3 × D O B 3 mmcm---
Model 3 log D B T = a 0 + a 1 × D O B + a 2 × log D O B mmcm---
Model 4 ln D B T = a 0 + a 1 × D O B 2 + a 2 × ln D O B mmcm---
Model 5 ln D B T = a 0 + a 1 × D O B 2 + a 2 × ln D O B + a 3 × ln H mmcm--m
Model 6 D B T = D O B × a 0 + a 1 × h H + a 2 × h H 2 + a 3 × H mmcm-mm
Model 7 D B T = a 0 + a 1 × D B H + a 2 × D O B mmcmcm--
1 DBT represents double bark thickness, DOB is stem diameter over bark, DBH is over bark diameter at breast height, h is section height along the stem, and H is total tree height.
Table 5. Dividing bark data into DBH classes for relative value analysis.
DBH Classes 1Number of Bark Data by Species
Norway SpruceEuropean BeechPedunculate Oak
up to 20 cm294302267
between 20 and 40 cm12828501161
between 40 and 60 cm14687851404
higher than 60 cm-325552
1 DBH is over bark diameter at breast height.
Table 6. Parameters of bark models.
ModelsParameter Values
a0a1a2a3
Norway spruce
Model 13.4587590.328916−0.000370-
Model 23.2579200.367969−0.0021290.000021
Model 30.4387930.0050150.351056-
Model 40.9312960.0001320.437736-
Model 50.8796590.0001300.4375580.015915
Model 60.783071−1.3161202.021506−0.007020
Model 73.728335−0.0033160.311582
European beech
Model 11.6932220.2183810.000029-
Model 20.4084590.439401−0.008720.000093
Model 3−0.213520−0.0016200.812427-
Model 4−0.412260−0.0000130.757627-
Model 5−0.221560−0.0000090.757347−0.057580
Model 60.381604−0.1836400.388722−0.003260
Model 71.877831−0.0066600.223518-
Pedunculate oak
Model 14.7331181.157654−0.010190-
Model 22.1474151.580314−0.0265000.000171
Model 30.371382−0.0060700.878177-
Model 41.010788−0.0001300.746264-
Model 51.089985−0.0001300.749374−0.028970
Model 61.528431−0.3806701.298646−0.025100
Model 711.669110−0.0253300.570861-
Table 7. Bark models evaluated based on the accuracy index.
ModelsR2MAERMSEAICBIC
Norway spruce
Model 10.99110.31180.3893−5735.23−5717.16
Model 20.99130.30520.3843−5820.77−5796.68
Model 30.99100.30330.3924−24,742.45−24,724.38
Model 40.98901.39762.0407−19,053.23−19,035.17
Model 50.98911.31931.9344−19,068.11−19,044.02
Model 60.75541.83802.3538−11,705.88−11,681.80
Model 70.99080.31630.3942−5660.06−5642.00
European beech
Model 10.97550.42090.5465−4082.32−4063.94
Model 20.99030.28070.3431−7232.05−7207.54
Model 30.97140.46930.6743−21,082.84−21,064.46
Model 40.97000.44830.6095−15,279.80−15,261.42
Model 50.97040.44420.6020−15,323.29−15,298.79
Model 60.70890.64470.8342−21,140.37−21,115.87
Model 70.97610.41510.5400−4163.77−4145.39
Pedunculate oak
Model 10.98800.76170.9838−67.72−50.55
Model 20.99560.45060.5977−2356.19−2333.29
Model 30.99220.55400.7203−18,089.20−18,072.03
Model 40.98660.77670.9868−13,099.72−13,082.55
Model 50.98690.75460.9739−13,145.96−13,123.06
Model 60.73853.76585.3077−7606.36−7583.46
Model 70.90202.26462.81944695.304712.47
Disclaimer/Publisher’s Note: The statements, opinions and data contained in all publications are solely those of the individual author(s) and contributor(s) and not of MDPI and/or the editor(s). MDPI and/or the editor(s) disclaim responsibility for any injury to people or property resulting from any ideas, methods, instructions or products referred to in the content.