Article

Study on Novel Modified Phenolic Foams with Added Pine Wood Sawdust

1
College of Ecology and Environment (College of Wetlands), Southwest Forestry University, Kunming 650224, China
2
College of Materials and Chemical Engineering, Southwest Forestry University, Kunming 650224, China
3
College of Soil and Water Conservation, Southwest Forestry University, Kunming 650224, China
*
Author to whom correspondence should be addressed.
Forests 2024, 15(12), 2249; https://doi.org/10.3390/f15122249
Submission received: 26 November 2024 / Revised: 17 December 2024 / Accepted: 18 December 2024 / Published: 20 December 2024
(This article belongs to the Special Issue Advanced Research and Technology on Biomass Materials in Forestry)

Abstract

:
The use of low-cost agricultural and forestry waste for the preparation of modified phenolic foam (MPF) has attracted widespread attention and has shown promising prospects. This study proposes a novel method for producing MPF using pine sawdust. The full components of pine wood powder and its liquefied products were used as raw materials, and the resin was modified with a silane coupling agent (KH560), triethylene glycol (TEG), and nylon 66 (PA66). Subsequently, three novel MPFs were successfully fabricated using a transplanted core foaming technique, and their material properties were subsequently investigated. The results showed that all three MPFs exhibited excellent compressive strength and flame retardancy, with compressive strength ranging from 5.93 MPa to 12.22 MPa and oxygen index values between 36.2% and 41.5%. In terms of water resistance, the MPFs significantly outperformed traditional phenolic foam (PF); in particular, the addition of 4% KH560 and PA66 reduced the water absorption rate to as low as 2.5%. Furthermore, the powdering rate and thermal conductivity of all MPFs were significantly reduced, with chalking rates decreasing by 28.57% to 50%. This research presents a novel method for preparing MPF using agroforestry waste as a partial replacement for phenol. This approach achieves high-value utilization of pine sawdust while maintaining the performance of the MPF, thus broadening the avenues for MPF production.

1. Introduction

Agricultural and forestry waste refers to the byproducts generated during agricultural and forestry production and processing. This primarily includes sorghum straw, corn stover, wood chips, dead branches and leaves, sawdust from wood processing, and other waste materials [1]. According to incomplete statistics, in 2019 alone, approximately 2.03 × 10¹¹ tons of agricultural waste was generated worldwide, including 4.3 × 10¹⁰ tons of crop stalks [2]. Furthermore, China annually produces around 5 × 10⁸ tons of forestry waste, while the yearly output of crop stalks is even higher, reaching 8.7 × 10⁸ tons [3]. In Europe, agricultural and forestry waste can generate an energy value of 4.5 × 10¹² MJ annually, demonstrating its immense potential value [4]. However, in many countries, this waste is not properly managed, resulting in a substantial waste of resources.
Phenolic foam can be produced from biomass waste through multiple processes [5,6,7]. However, most of the raw materials for industrially synthesized phenolic resin (phenol) are derived from fossil fuels [8], which will limit the future production of PF. Therefore, utilizing agricultural and forestry residues as an alternative feedstock offers a significant advantage. PF exhibits several desirable properties, including low cost, excellent flame retardancy, low thermal conductivity [9,10,11], low toxicity, and low smoke emission [12]. Furthermore, PF maintains stability across a wide temperature range, from −196 °C to 200 °C, with an autoignition temperature of 480 °C and minimal release of toxic gasses during combustion [13]. As a thermostatic foam, PF’s unique properties enable specific applications [14]. However, despite its numerous advantages, PF suffers from brittleness, friability, and difficulty in shaping [15,16], limiting its widespread adoption given increasing demands for high-performance foams.
To unlock the potential of PF, researchers have begun employing various methods to modify them. Several studies have demonstrated that the addition of organic or inorganic modifiers can enhance the performance of PF [17,18,19,20]. Furthermore, some researchers have explored the use of biomass as a substitute for phenol in the preparation of PF to reduce costs. Del Saz-Orozco et al. [21] examined the effects of various modifiers on the overall foam properties and found that 8.5 wt.% lignin yielded the most substantial enhancement of PF. Zhao et al. [22] utilized a hydrothermal method with sodium thiosulfate and sodium hydroxide as auxiliaries to degrade lignin, resulting in PF with excellent flame retardancy, achieving oxygen indices exceeding 32%. Weng et al. [23] prepared foam using nitrogen and phosphorus-doped lignin, which exhibited a 33.3% increase in limiting oxygen index, a 43.7% improvement in compressive strength, and a 53.2% reduction in peak smoke release rate compared to pure PF. In addition to utilizing organic modifiers and biomass, some inorganic modifiers have also demonstrated significant performance-enhancing effects on PF. Hu et al. [16] developed shape memory phenolic foam with superior mechanical properties, expansion capabilities, and thermal stability by incorporating inorganic nanoparticles. Wei et al. [24] modified phenolic resin using montmorillonite, carbon fiber, and other additives, resulting in PF with enhanced mechanical properties, including a 35–40% increase in compressive strength, reduced friability, and improved thermal stability. These modified PFs show significant potential for applications in electromagnetic interference shielding, aerospace, and electronic products [25,26].
In the past twenty years, the introduction of biomass waste as an alternative resource to petroleum-based raw materials for the production of PF has garnered particular attention [12] and has demonstrated substantial potential. Among various biomass materials, lignin and cellulose have been widely employed as substitutes for phenol in the preparation of MPF resins due to their abundant reserves and low acquisition costs. However, the extraction and separation of lignin and cellulose from biomass require a series of complex processes [27,28], which substantially increase the production costs and complexity. Furthermore, lignin requires targeted pretreatment, such as fractionation, fragmentation, and functionalization, to produce specific lignin components [29]. Due to the high production costs associated with directly replacing phenol with lignin and cellulose for PF production, researchers have begun exploring the feasibility of using whole biomass to produce PF. However, unlike purified lignin, whole biomass contains numerous impurities, including heavy metals and various minerals accumulated within the plant [30], which can negatively impact the foam’s properties. Furthermore, other impurities can also compromise the properties of the foam materials. For example, Mahmoudi et al. [31] observed that organic impurities present in toluene could adversely affect the density of polyurethane foam. Consequently, producing high-performance MPF using whole-component biomass remains a substantial challenge.
The aim of this study is to develop a high-performance MPF by using pine sawdust as a partial substitute for phenol. To the best of our knowledge, no studies have reported the use of pine sawdust in its entirety as a raw material for synthesizing MPF using the method described in this paper. To evaluate the performance of the MPF produced via this method, XRF, FTIR, SEM, and TG-DTG analyses were employed to characterize the foam’s elemental composition, molecular structure, morphology, and thermal stability, respectively. Furthermore, the contact angle, open-cell content, thermal conductivity, compressive strength, friability, and water resistance of the foam were also investigated.

2. Materials and Methods

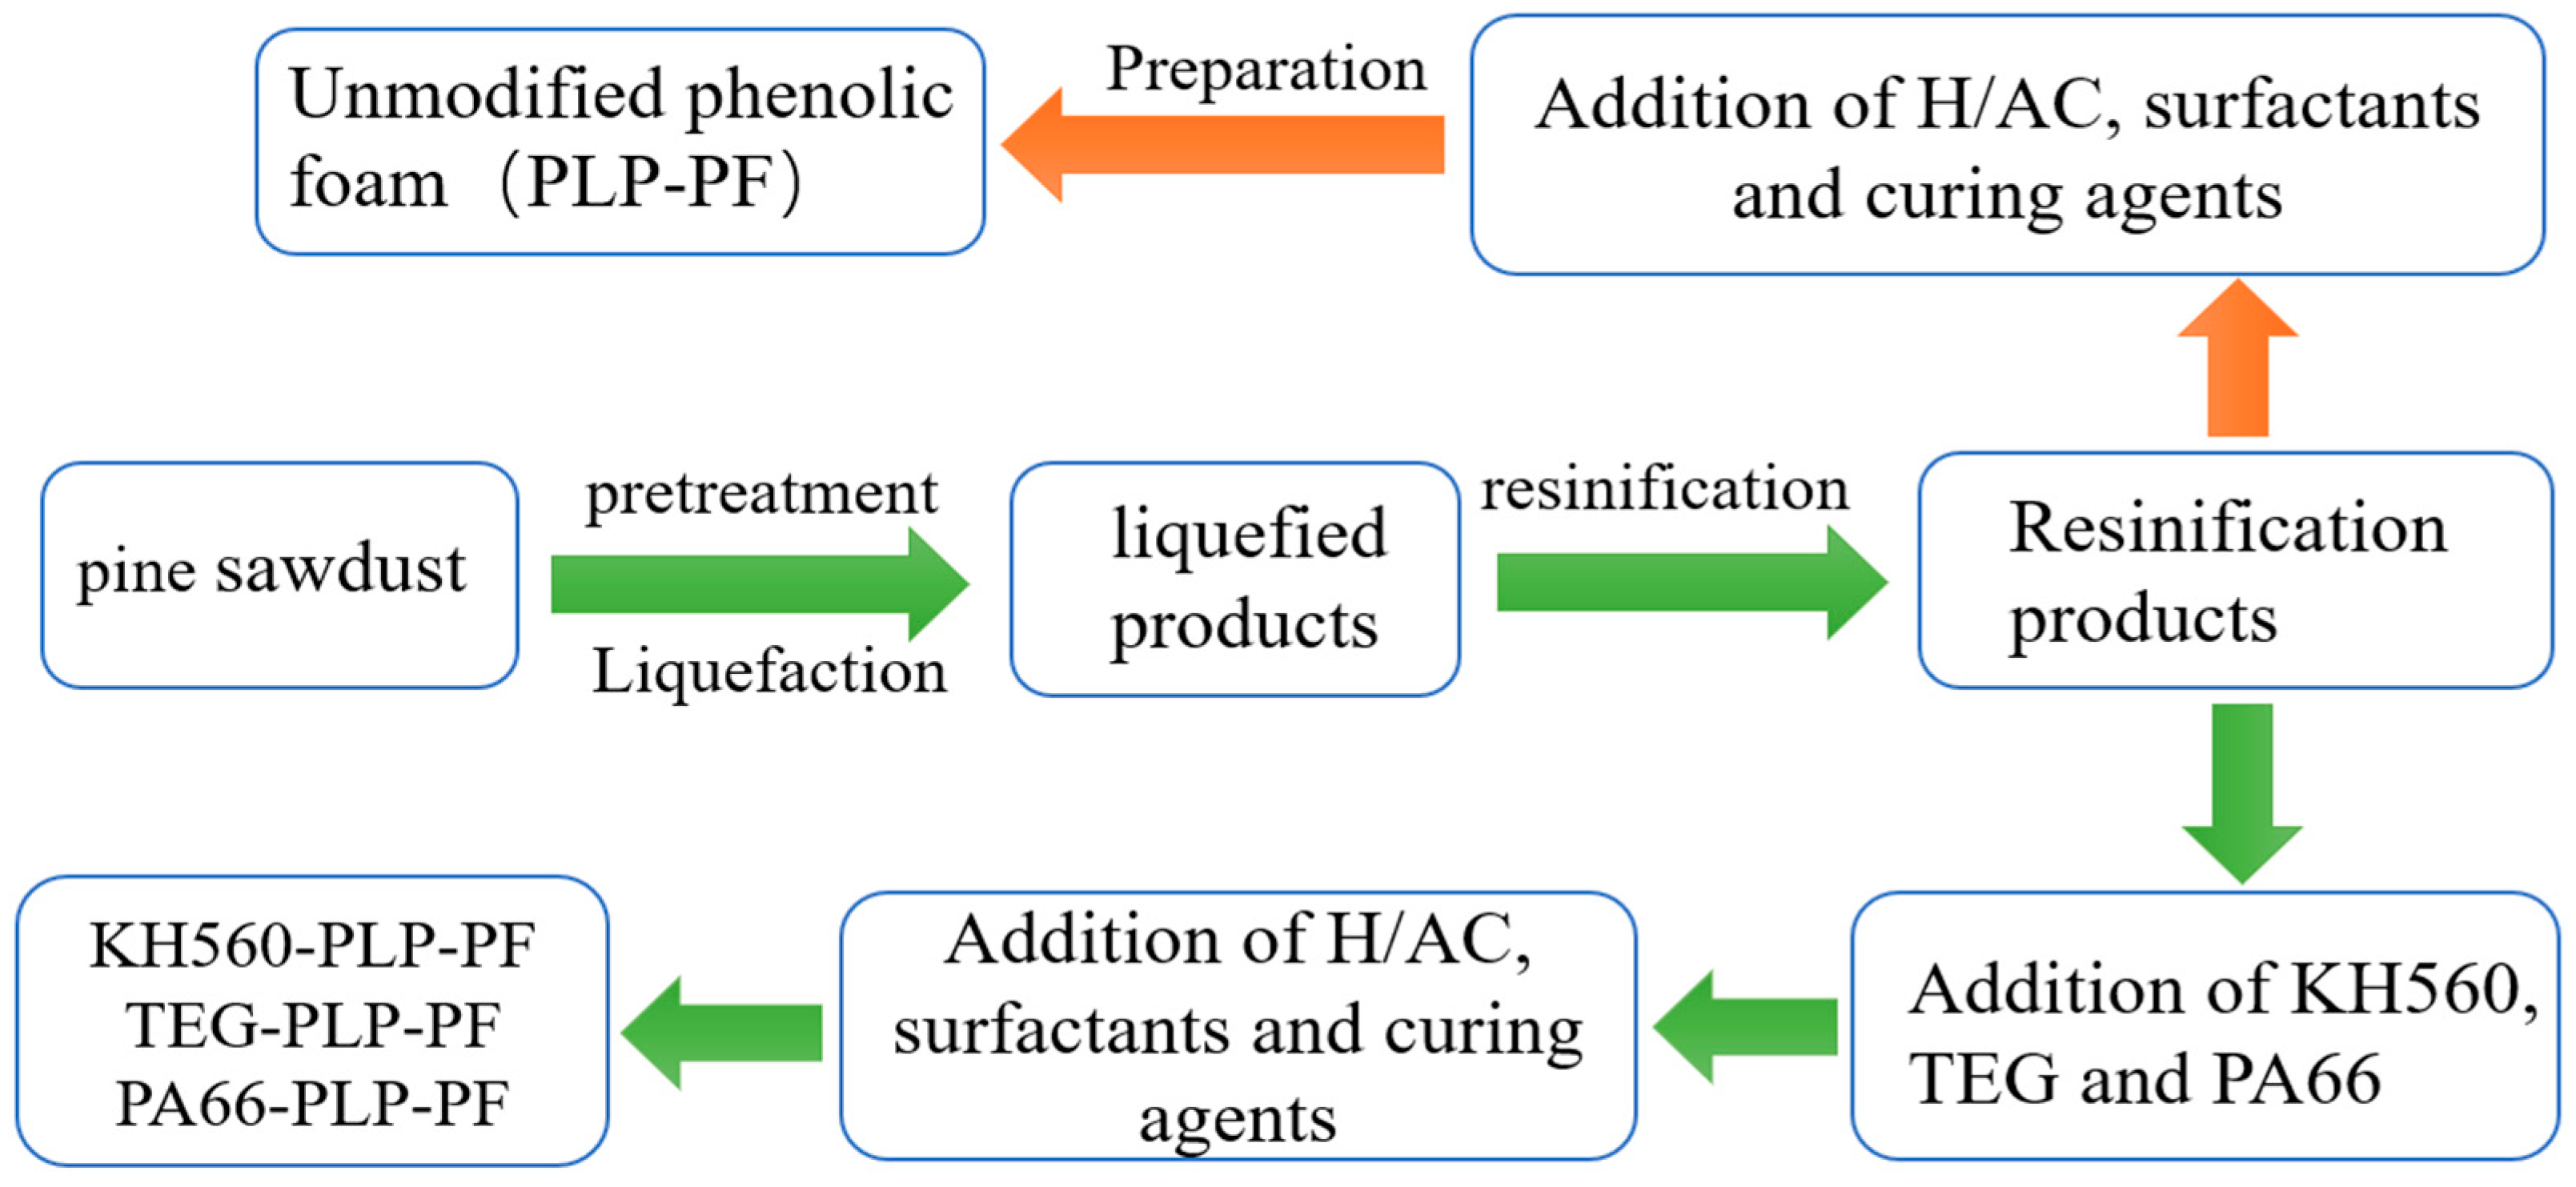
2.1. Preparation of MPFs

2.1.1. Materials

We have included the optimal process parameters for the preparation of the modified foam in the Supplementary Materials.
The pine sawdust was sourced from a local lumber mill. Phenol, formaldehyde, silane coupling agent and nylon66 were procured from Chengdu Kelong Chemical Co., Ltd., (Chengdu, China). Sodium hydroxide, concentrated sulfuric acid, and hydrochloric acid were procured from Yunnan Yanglin Industrial Shandian Pharmaceutical Co., Ltd., (Kunming, China). Activated carbon and n-hexane were obtained from Shanghai Macklin Biochemical Technology Co., Ltd., (Shanghai, China). Tween-80 was procured from Guangdong Guanghua Sci-Tech Co., Ltd., (Guangdong, China). TEG was obtained from Shanghai Aladdin Biochemical Technology Co., Ltd., (Shanghai, China). In Table 1, we list some common additives and their respective quantities used during the foam preparation process.

2.1.2. Pretreatment and Liquefaction of Pine Sawdust

The pine sawdust was dried (102 °C), ground, and sieved through an 80-mesh screen (pine wood powder particle size ≤ 0.18 mm). The obtained powder was then mixed with phenol in a 3:7 ratio. The mixture was heated in an oil bath to 140 °C, and a catalyst (concentrated sulfuric acid 5% by mass of phenol) was added dropwise. After the addition was complete, the reaction was allowed to proceed for 120 min. The mixture was then cooled to room temperature, yielding a liquidized pine wood product.

2.1.3. Resinification of Liquefaction Products

The liquefied product was heated to 60 °C, followed by the addition of a 7% sodium hydroxide (NaOH) solution by mass relative to phenol. A 37% aqueous formaldehyde solution was then added at a phenol-to-formaldehyde molar ratio of 1:1.8. After reacting for 30 min, the pH of the solution was adjusted to 7.0–8.0 using dilute hydrochloric acid. The reaction mixture was then subjected to rotary evaporation to control the resin viscosity to between 500 and 600 MPa·s. With reaction time and the phenol–formaldehyde ratio as independent variables, and free phenol, aldehyde content, solids content, and viscosity as dependent variables, the conditions for the resinification reaction of the liquefied product were determined.

2.1.4. Preparation of Resin Foam

A 2.5 g sample of activated carbon (half the capacity of the 10 mL glass bottle) was weighed in a glass container. A total of 40% of the mass of active carbon in terms of n-hexane was added to the kettle, and then the kettle was sealed. The kettle was placed in an oven at 140 °C and reacted for 2 h. Then, 30 g of resin was accurately measured into a plastic cup, 5% of the transplanted core was added based on the mass of the resin, and this was mixed uniformly. Then, 4% of Tween-80 and 5% of the solidifier were added then this was mixed thoroughly with a high-speed mixer until a uniform, silvery gray color was obtained. The mixture was poured into a foam mold, weighed, and placed in an oven at 140 °C for approximately 30 min for the foaming reaction. After cooling, the mold and foam were removed.

2.1.5. Synthesis of Modified Liquefaction Products Resin

In a 1000 mL three-neck flask equipped with a magnetic stirrer, thermometer, and condenser, 180 mL of phenol and 270 mL of formaldehyde solution were added sequentially, with a molar ratio of 1:1.8. Under stirring at 300 rpm, the oil bath was heated to 40 °C, and 20% (wt) NaOH solution was added to adjust the pH to around 7–8. The temperature was then raised to 60 °C at a rate of 2 °C/min, and the reaction was maintained for 30 min. Subsequently, a certain mass fraction (4.1%) of KH560 was added, and the temperature was raised to 95 °C at a rate of 3 °C/min, and the reaction was maintained for 50 min. The mixture was then rapidly cooled with cold water and then neutralized with 6 mol/L HCl solution to a pH of around 6–7. Finally, we used a rotary evaporator (model: RE-2000, Shanghai Yirong Life Science Instrument Factory, Shanghai, China) to reduce pressure distillation to a certain viscosity (500–700 MPa. s).
After the resinification was completed, the apparatus was transferred to a 60 °C water bath for stirring and reaction. A certain quantity of formaldehyde and sodium hydroxide (270 mL of formaldehyde solution and 20% (wt) NaOH) were added in sequence. The reaction mixture was maintained at 60 °C for 30 min, followed by an increase in temperature to 80 °C. Subsequently, 15% (based on the weight ratio of TEG to the liquefaction product) of the TEG modified agent was added, and the mixture was stirred and reacted for 120 min to undergo modification condensation reaction. Finally, the pH of the resin was adjusted to a range of 7.0–8.0 using a 1:1 diluted hydrochloric acid.
The liquefied material was placed in a three-necked flask equipped with a stirrer, condenser, and thermometer. The flask was then transferred to a water bath for heating. A solution containing 270 mL of formaldehyde and 20% (wt) NaOH was added to the flask, and the timing of the reaction began upon completing the addition of the reactants. After 60 min of reaction, a 6% PA66 modifier was introduced into the mixture. After the esterification reaction was complete, the reaction apparatus was lifted and cooled to room temperature, and the pH was adjusted to 7–8 using a solution of distilled water and concentrated hydrochloric acid with a volume ratio of 1:1. The mixture was then distilled under reduced pressure at 50 °C, 25 r/min, and 0.05–0.06 mPa using a rotary evaporator. The viscosity of the sample was measured using a digital viscometer (model: NDJ-5S, Shanghai Linghai Instrument Co., Ltd., Shanghai, China) in a water bath at a temperature of 25 °C. The No. 2 rotor of the digital viscosimeter was selected, and the rotation speed was set to 60 r/min. The final measured viscosity range was 500–700 MPa· s.

2.1.6. Preparation of Modified Resin Foam

Taking 30 g of KH560 modified resin and 30 g of PA66 modified resin, add 4% of Tween-80, 5% of 50% solidifier (sulfuric acid 1:1) and 6% of transplant core. Then, take 30 g of TEG modified resin and add 6% of Tween-80, 3% of 50% solidifier (sulfuric acid 1:1) and 4% of transplant core. Use a high-speed mixer to mix each of the three resins with solidifier, transplant core and surface-active agent until it is uniform and silver-gray. Pour the mixture into the foaming mold, put it in the oven at 80 °C to foam and cure for 30 min. After solidification, take out the mold and retrieve the foam of the three modified resins.
During the foam preparation process, pine sawdust was utilized as a raw material. Without separating or purifying the sawdust, the entire liquefied product was used for resin synthesis. Subsequently, the resin was modified by adding KH560, TEG, and PA66. Using activated carbon loaded with n-hexane (H/AC) as the foaming core, three types of MPF were successfully prepared via a transplanted core foaming method. Figure 1 illustrates the preparation process of the foam before and after modification, as outlined below:

2.2. Characterization Test

The morphology and particle size of the foam were examined using a Scanning Electron Microscope-Energy Dispersive Spectrometer (SEM-EDS; Model: VEGA3SBH, TESCAN Trading Co., Ltd., Shanghai, China). After gold-sputtering the samples, point and area analyses were conducted via EDS under an accelerating voltage of 10 kV to determine the composition and content of specific chemical elements. The oxygen index of the foam was measured according to the Chinese National Standard GB/T 2406.1-2008 [32], utilizing an im-YZ2000 oxygen index meter (Model: HC-2, Nanjing, China). Three biobased foam samples were prepared, each measuring 80 mm in length, 10 mm in width, and 10 mm in thickness. The samples were set alight in a nitrogen-oxygen gas mixture, and the minimum oxygen concentration required to sustain combustion for 3 min or until the flame reached 50 mm was measured. Functional group vibrational absorption peaks within the foam samples were analyzed using a Fourier Transform Infrared Spectrometer (FTIR; Model: TENSOR27, BRUKER, Karlsruhe, Germany). The samples were prepared via the KBr pressing method, with a resolution set to 4 cm−1, a scanning range of 400–4000 cm−1, and 32 scans were conducted. The data obtained were graphically represented using Origin2022 software.
The compressive strength was tested using an electronic universal testing machine (Model: FR100-C, Shenzhen Sansi Zongheng Technology Co., Ltd., Shenzhen, China). Prior to testing, the samples were processed into cubes with an approximate height of 20 mm. The loading speed was set at 2 mm/min. Three samples were tested for each data point, and the average was taken. The compressive strength (σ) of the specimens was calculated using Equation (1).
σ = P A
where σ represents the compressive strength, with the unit of measurement in MPa; P denotes the maximum failure load, with the unit of measurement in N; and A is the cross-sectional area, with the unit of measurement in mm2. When calculating the stress–strain curve for the specimen, the stress σ is computed using the same formula as Equation (1).
The thermal conductivity coefficient was determined according to the Chinese national standard GB/T 10297-2015 [33]. The samples were cut to dimensions of 20 mm × 30 mm × 30 mm and tested using the Hot Disk TPS2500 Foam Thermal Conductivity Tester, employing the transient plane heat source method. Each sample was tested in three groups. A physical adsorption instrument (Model: ASAP-2000, Micromeritics, GA, USA) was used to perform N2 adsorption–desorption, and the corresponding BET model was used to calculate the specific surface area, average pore size, and other relevant parameters of the bio-based foam. The testing conditions included a degassing temperature of −195.85 °C and a degassing time of 360 min. Following the Chinese national standard GB/T 10799-2008 [34], a helium expansion pycnometer was used to directly measure the standard sample block, allowing for the simple calculation of open and closed cell percentages.
Comprehensive thermal analysis of four foam samples was conducted using a thermogravimetric analyzer (STA449F, Netzsch, Germany) with a temperature range of 0 to 500 °C, a nitrogen flow rate of 20 mL/min, and a heating rate of 10 °C/min. The true density was determined using an automated true density analyzer (3H-2000 TD1, Best Instrument Technology Co., Ltd., Beijing, China) employing the gas expansion method at a measurement temperature of 25 °C, with helium as the test gas. The contact angle of the foams was measured using a contact angle measuring instrument (C2000C1, Shanghai Zhongchen Digital Technology Equipment Co., Ltd., Shanghai, China). Water droplets, with a volume of approximately 5 μL and a diameter of 1 to 2 mm, were applied to the solid surface using a microsyringe. Each sample was measured 10 times, with each droplet being measured continuously for 10 times at intervals of less than 2 s, ensuring the total measurement time did not exceed 1 min. The water absorption rate of the foams was determined in accordance with the Chinese National Standard GB/T 8810-2005 [35].

3. Results and Discussion

3.1. X-Ray Fluorescence Spectroscopy Analysis (XRF)

The partial elemental content of four foams was detected using XRF. From the data in Table 2, it can be observed that among the detected elements, S, Cl, and Na had the highest content. In the foam modified with KH560 (KH560-PLP-PF), the silicon (Si) content increased by nearly 10%, whereas the Si content decreased in the foams modified with TEG (TEG-PLP-PF) and PA66 (PA66-PLP-PF). The increase in Si content imparts characteristics of silicon to KH560-PLP-PF compared to unmodified phenolic foam (PLP-PF). Xu et al. [36] found that incorporating molten silicon reactively into silicon carbide-based foams prepared from phenolic resin results in foams with higher compressive strength. Furthermore, silicon-containing compounds can transform into stable inorganic structures [37], potentially enhancing the foam’s stability. Therefore, the significant increase in the compressive strength of KH560-PLP-PF might be related to the rise in Si content.

3.2. Infrared Analysis of Modified Resin Foam

Fourier Transform Infrared Spectroscopy (FTIR) was conducted over the range of 4000 cm−1 to 400 cm−1 to obtain the infrared spectra of the modified resin foam (Figure 2). The spectra indicate that the peak distributions of the foam before and after modification are similar; however, the addition of the modifier results in differences in the intensities of the characteristic functional group peaks. The modified foam exhibits characteristic absorption peaks at 1601 cm−1, corresponding to carbon–carbon double bond functional groups on the benzene ring [38]. The absorption peak at 1121 cm−1 corresponds to the phenolic hydroxyl group [39], while 3337 cm−1 corresponds to the hydroxyl group [40]. The peak at 2881 cm−1 is due to methylene groups formed by dehydration condensation between hydroxymethyl units [41]. A characteristic peak at 1055 cm−1 corresponds to the polycondensed hydroxymethyl groups formed during the resinification reaction of phenol and formaldehyde. In addition, 1475 cm−1 is the vibration peak value of the methylene group in the benzene ring, and 860 cm−1 corresponds to the vibration region of the para-substituted bending of the benzene ring [39]. After modification with KH560, a silicon–oxygen bond appears at 1055 cm−1 [38], which is a characteristic absorption peak of KH560. The presence of this bond strongly confirms the interaction between the liquefied product resin and KH560, verifying that the flexible chains generated by the hydrolysis of the coupling agent successfully connected to the resin macromolecules. This results in a relative decrease in methylene groups within the resin molecules and an increase in flexible groups. Compared to PLP-PF, the modified PLP-PF exhibits higher toughness.

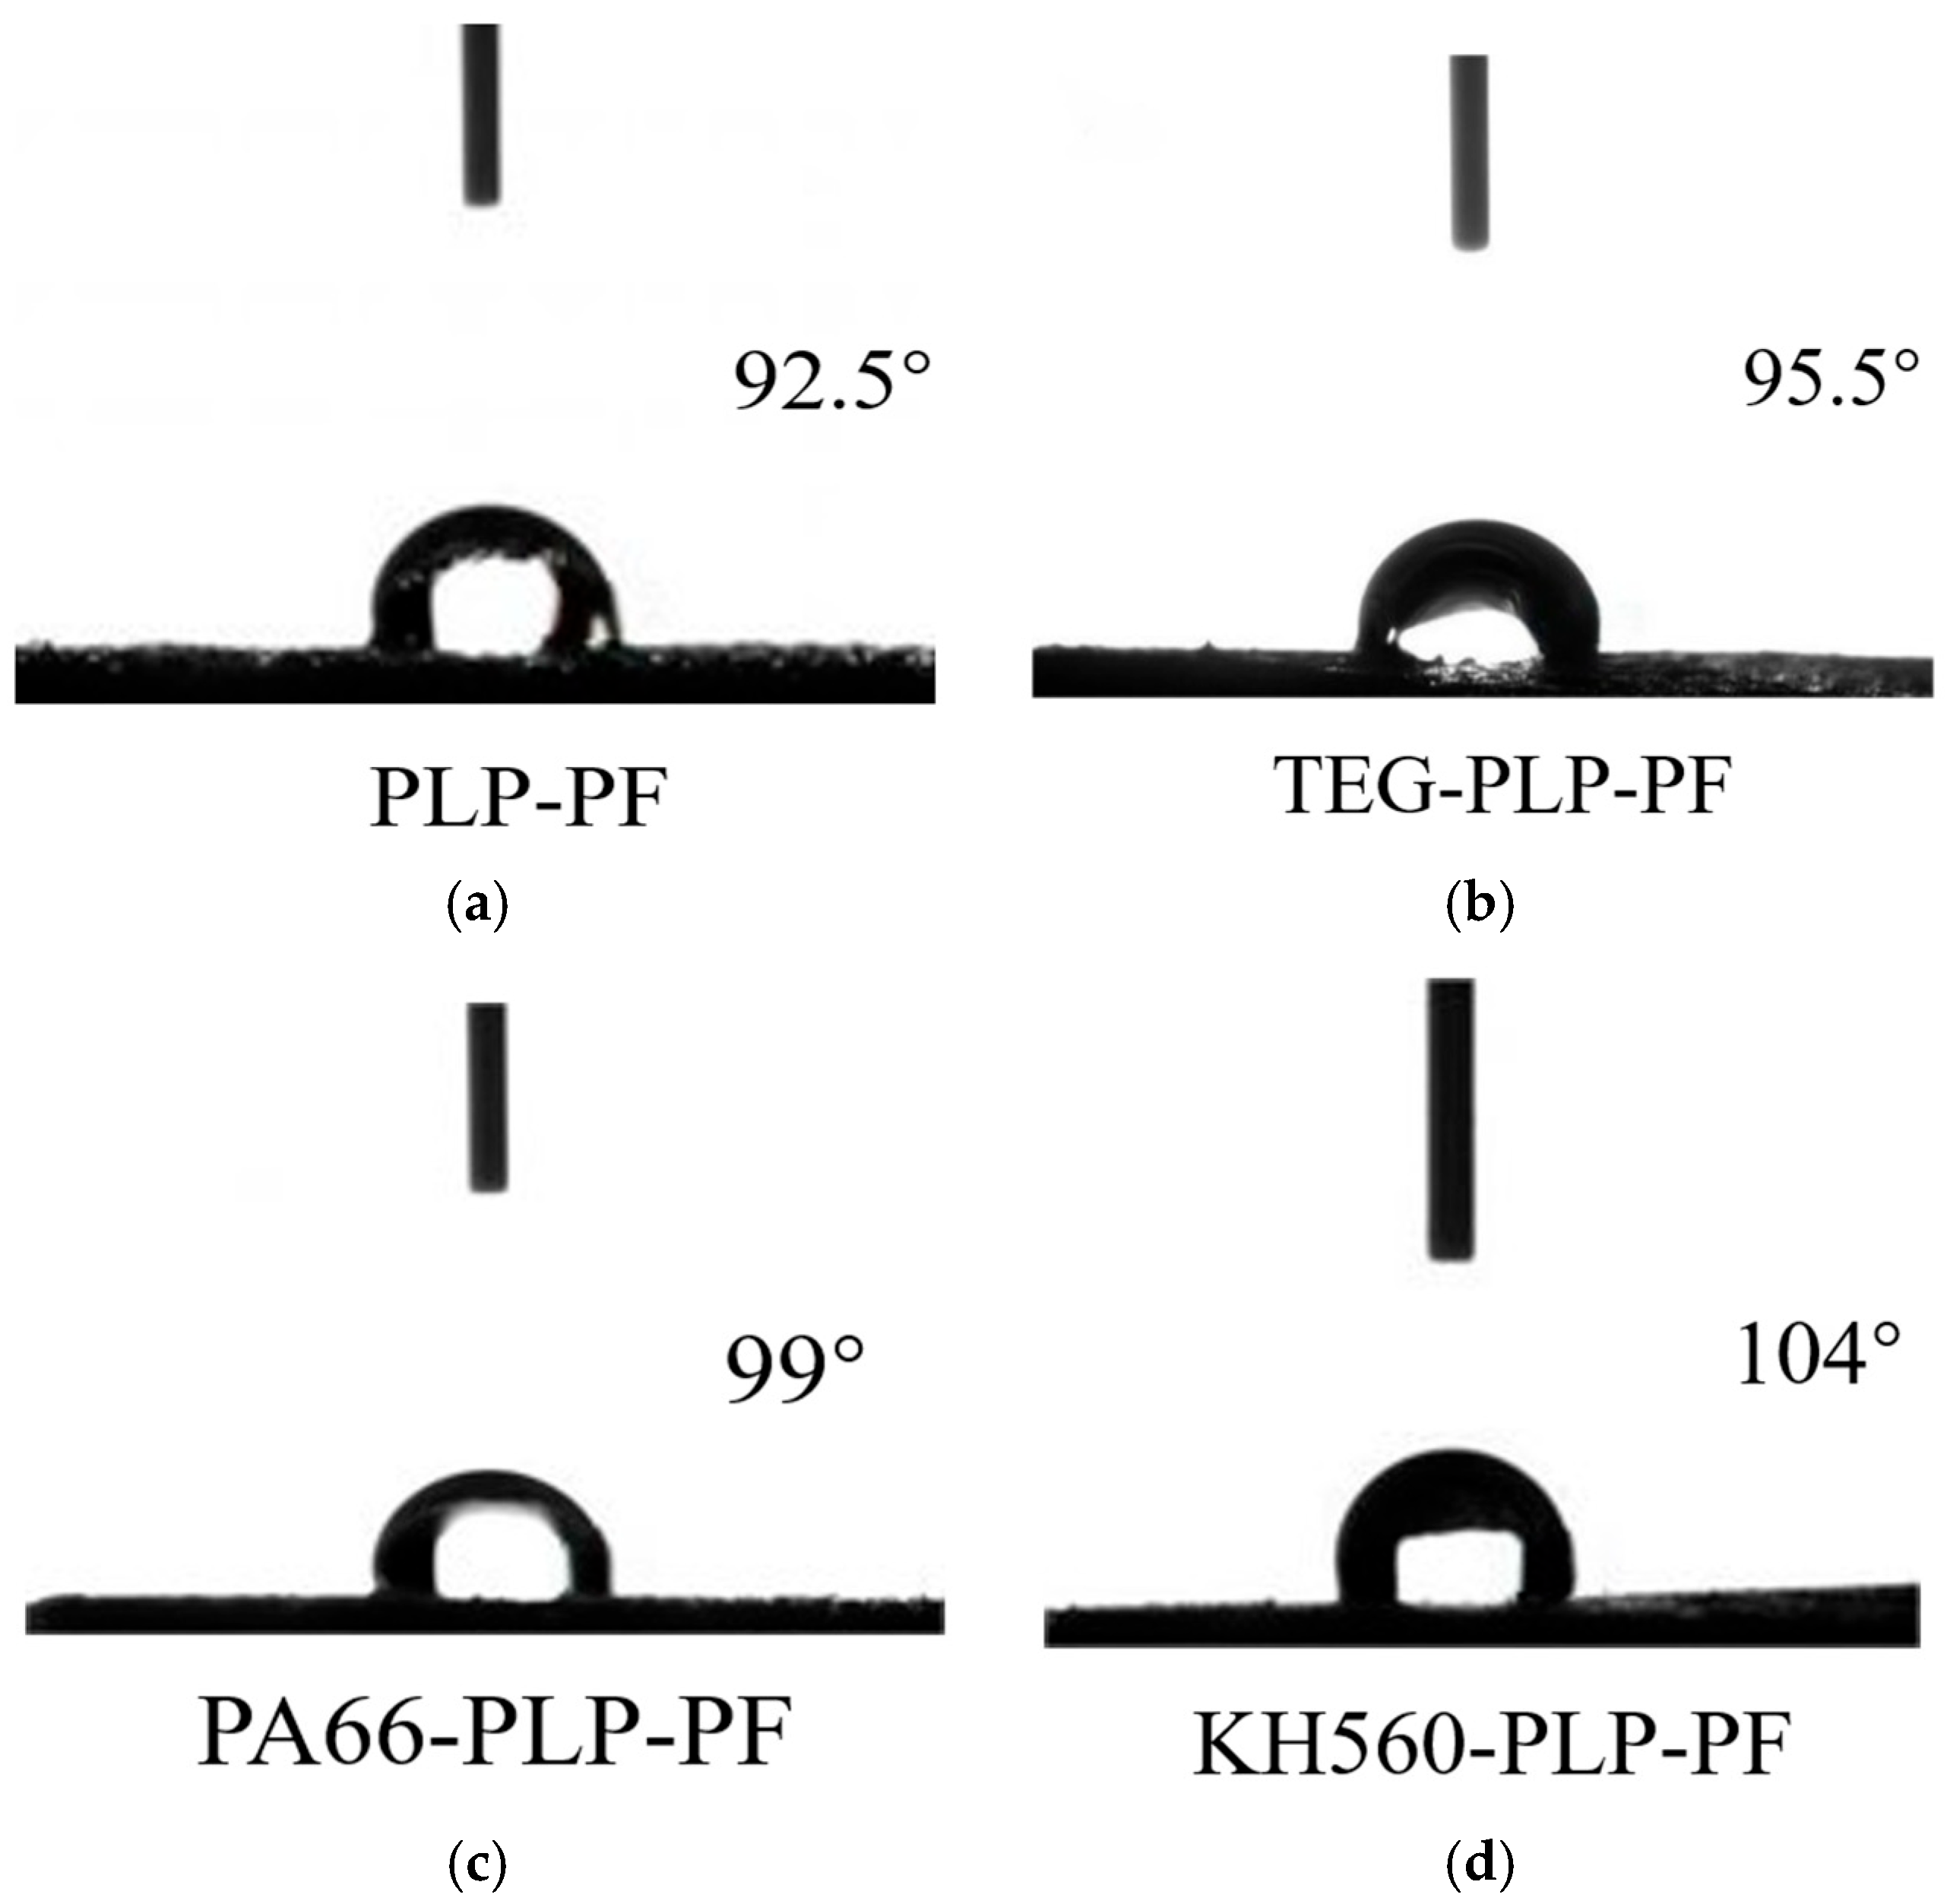
3.3. Contact Angle Analysis

Figure 3 illustrates the contact angles of four types of foam before and after modification. It is evident from the figure that the contact angles of the foam both before and after modification are greater than 90°, indicating that their surfaces are hydrophobic and suitable for waterproof materials. Compared to PLP-PF, the contact angles (θ) of the three modified foams all increased, with KH560-PLP-PF exhibiting the highest contact angle of 104°, indicating the best hydrophobicity. The increase in contact angle can be attributed to the filling of pores on the surface of the modified foam, where long-chain alkanes appear at one end of the resin, which impart hydrophobic characteristics to the material’s surface [42].

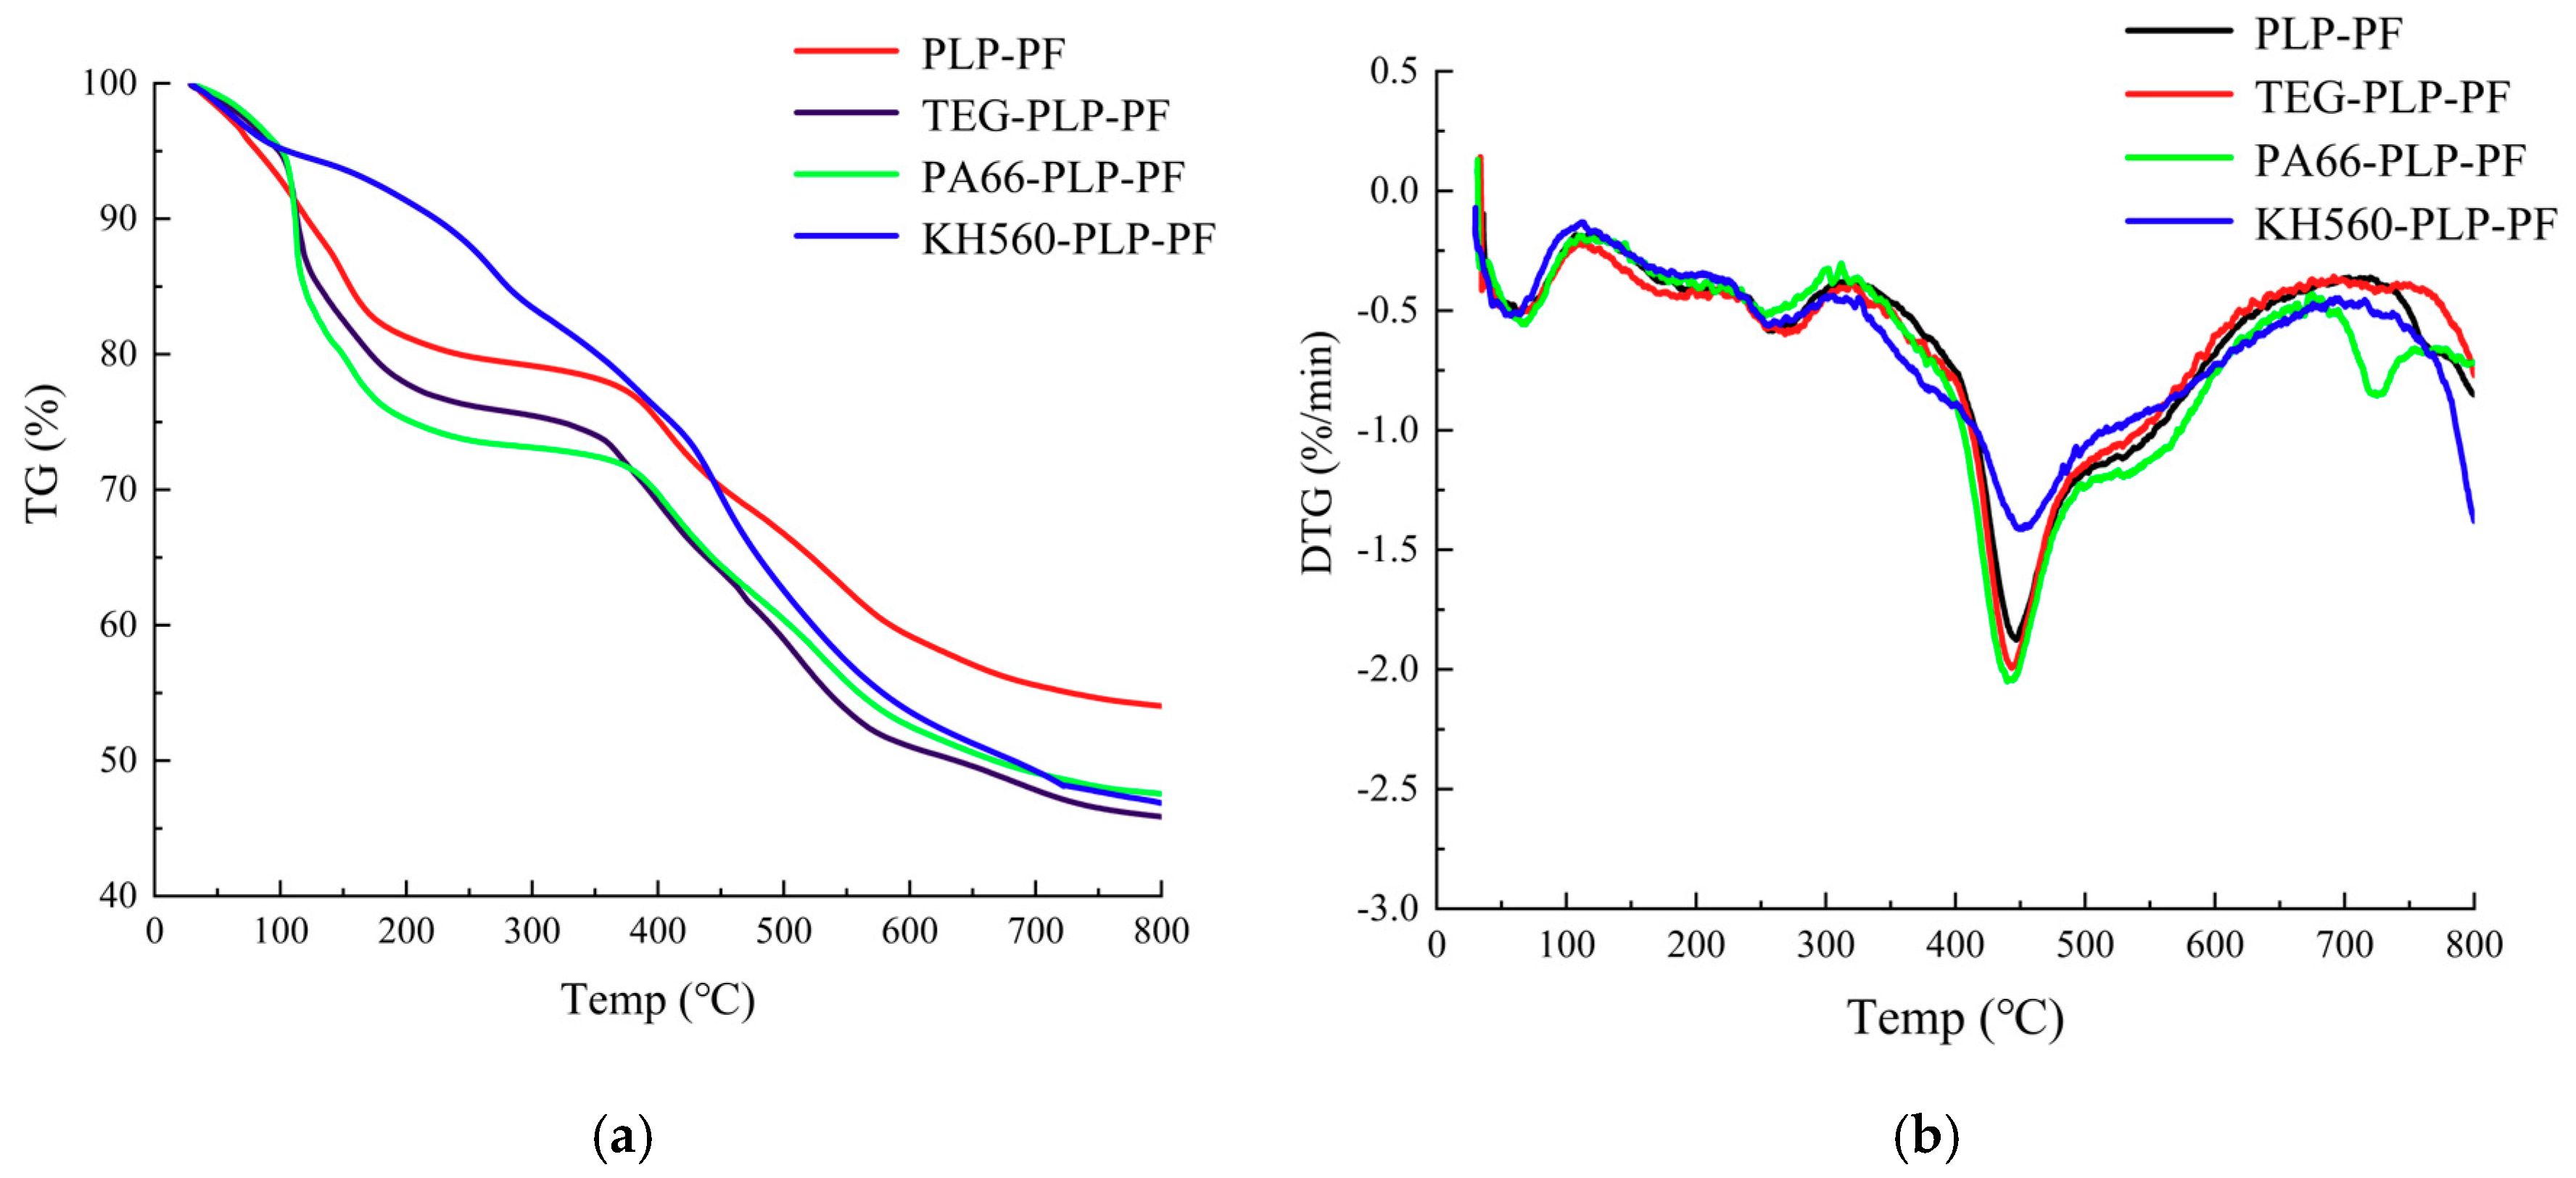
3.4. Thermogravimetric Analysis (TG-DTG)

Figure 4a presents the thermogravimetric (TG) curves of different foams. The thermal degradation of the four foams primarily consists of three weight loss stages. The first stage occurs at approximately 150 °C, during which the degradation is rapid, primarily due to the decomposition of free formaldehyde, free phenolic compounds, and water evaporation from the foam [11]. The second stage occurs between 150 °C and 400 °C, characterized by a lower weight loss rate, indicating a slower degradation process. This stage is primarily attributed to the ring scission of the phenolic resin, releasing H2O, CO2, CO, and CH4 volatile gasses, as well as the thermal degradation of organic oligomers. As the degradation temperature increases to 400–700 °C, the weight loss rate increases, and the degradation accelerates. Beyond 700 °C, the TG curve approaches a plateau, indicating that the degradation is largely complete. The residual carbon content of the unmodified resin foam is 54%, whereas that of the modified foam is approximately 45%, which is similar to the carbon residue rate of phenolic foam studied by Song et al. [43]. In the third stage, the foams exhibit similar degradation behavior, indicating that they follow a similar kinetic mechanism. This stage is associated with the relatively weak thermal cleavage of the material system, resulting in a stable weight loss value. The primary process occurring during this stage is the breaking of chemical bonds, releasing gaseous phenols and methyl derivatives, and other products.
Figure 4b presents the DTG curves of four types of foam. The curves demonstrate a similar trend for all four resin foams, indicating that the pyrolysis characteristics remain largely unchanged before and after modification. However, there are noticeable differences in the overall weight loss among the four foams. At 450 °C, all four foams exhibit a sharp negative peak, signifying the highest decomposition rate at this temperature. This may indicate that, at 450 °C, the reactant molecules acquire sufficient energy to overcome the activation energy, thereby accelerating the reaction rate and causing noticeable mass changes and the appearance of sharp negative peaks. According to the Arrhenius equation, when the activation energy decreases while the temperature remains constant, the rate constant of the reaction increases. Notably, the KH560-PLP-PF exhibits a thermal weight loss of 1.26% at this point, significantly lower than the other three foams (approximately 2.0%). This indicates that KH560 is able to significantly improve the heat resistance of the foam under silanization modification. This improvement can be attributed to the polymerization of KH560 with phenol after silanization, forming silicon–oxygen bonds with higher bond energy compared to carbon–carbon single bonds. Breaking these silicon–oxygen bonds requires higher energy [44]. Moreover, the presence of silicon–oxygen bonds during combustion can generate inorganic silicates, acting as a thermal barrier to protect the internal structure from damage.

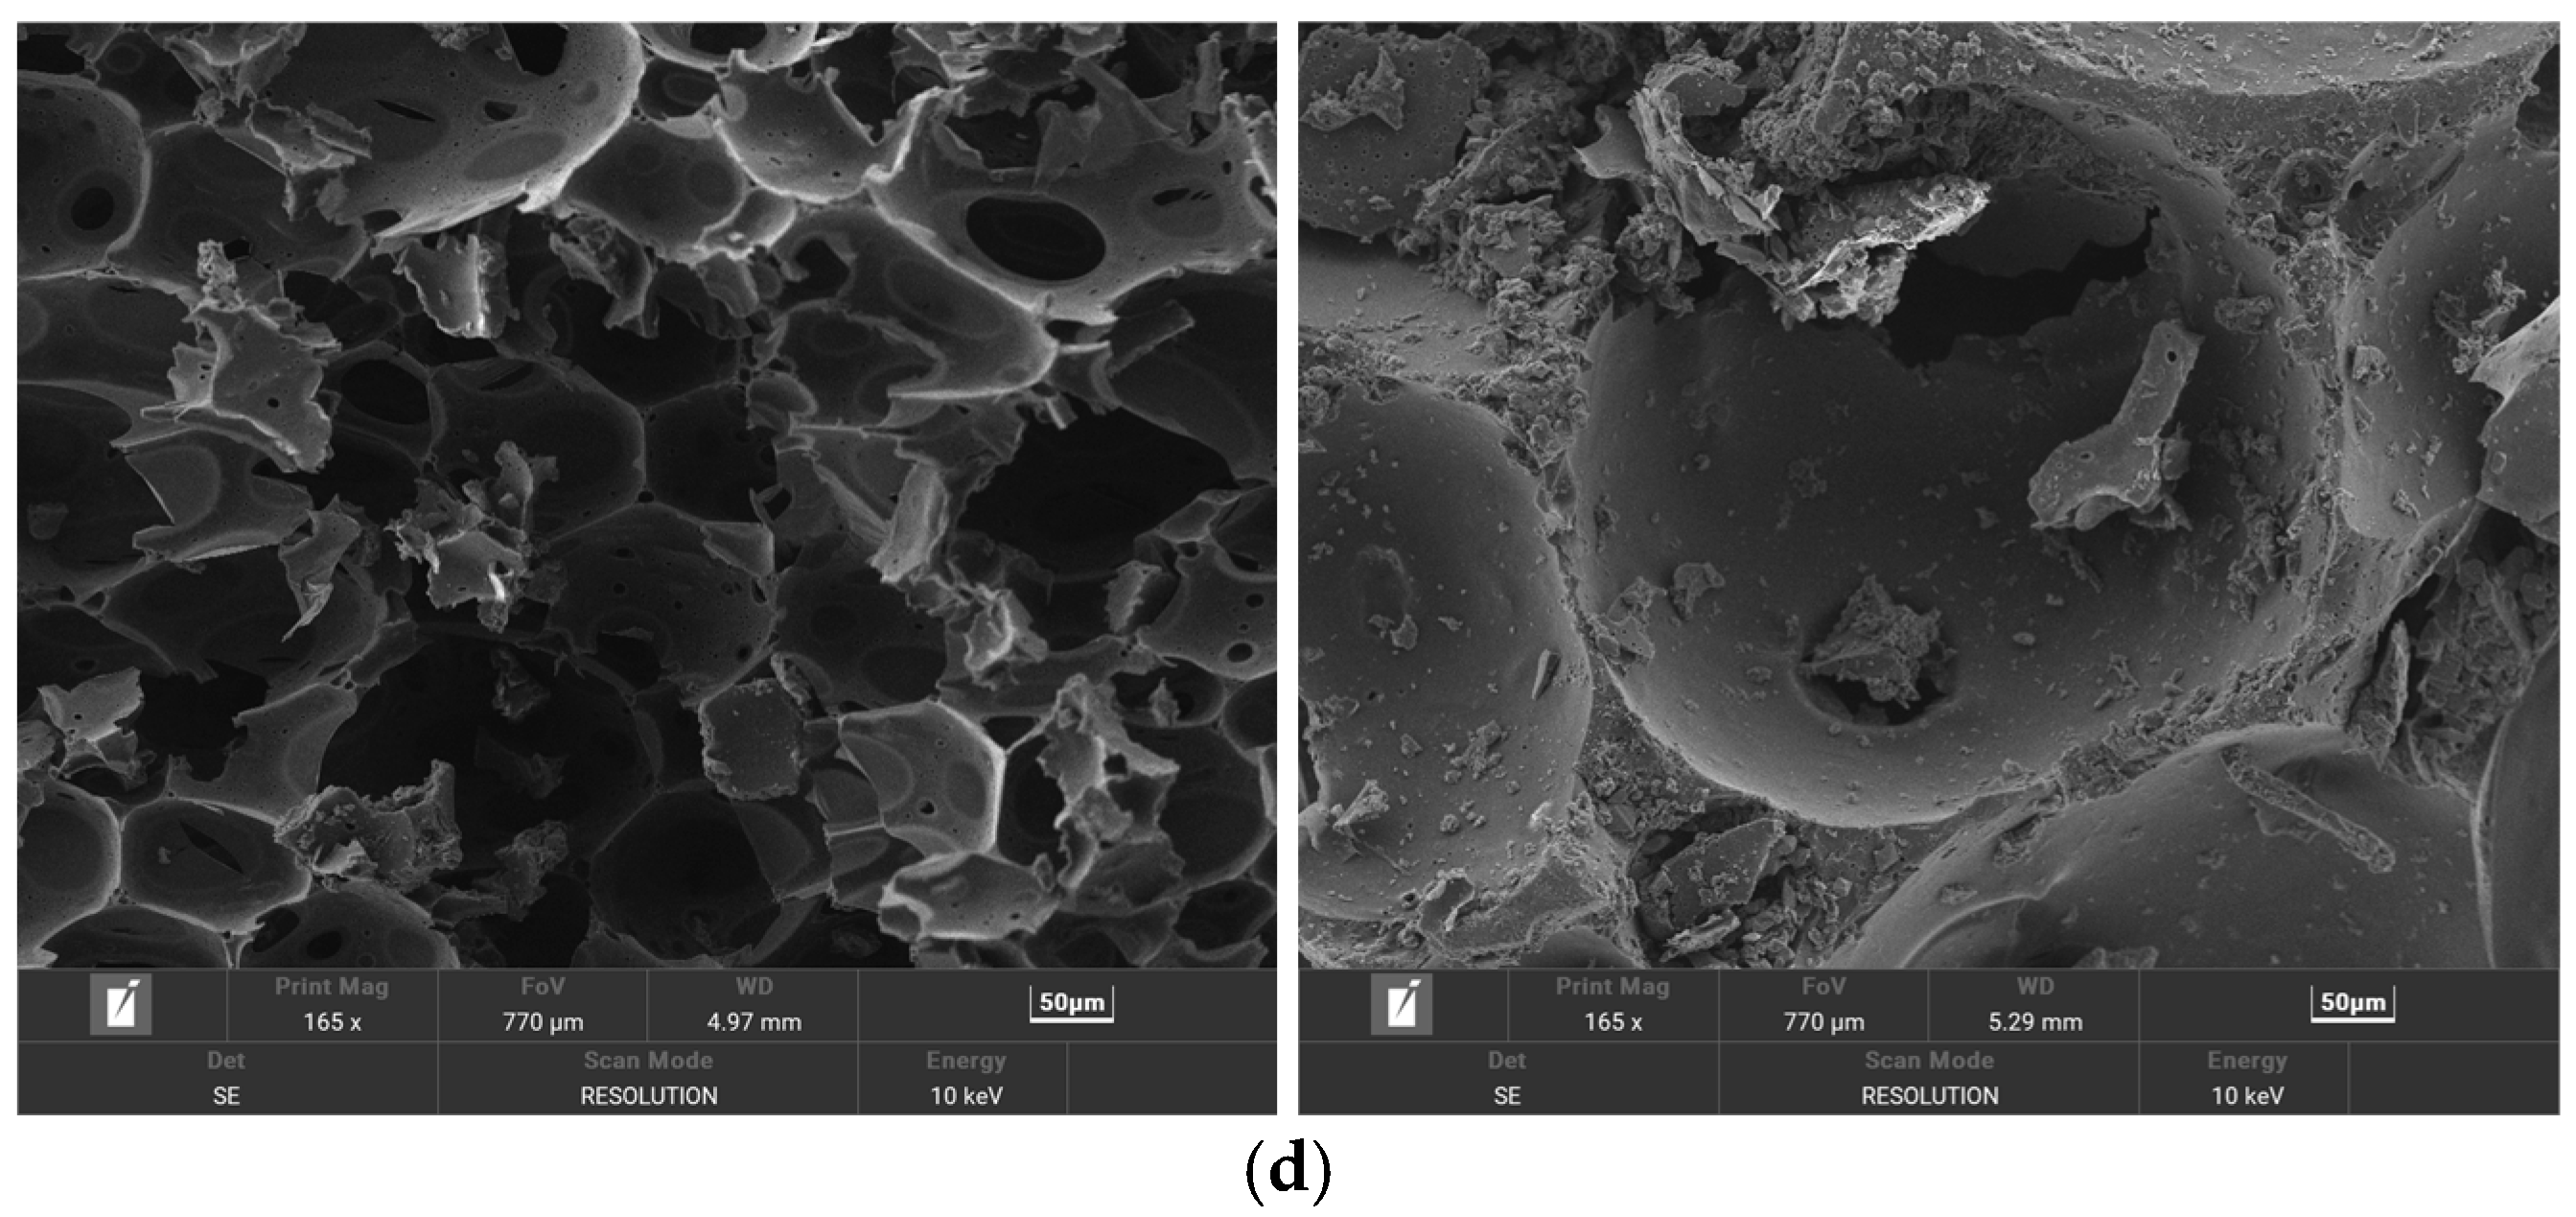
3.5. Scanning Electron Microscopy (SEM) Analysis

The SEM images (Figure 5) reveal that the PLP-PF exhibits non-uniform pore shapes and significant variations in pore sizes. The pores display perforation and collapse, with a high rate of wall damage. After modification with TEG, the PLP-PF shows increased pore sizes and more uniform pore distribution, with fewer fragments. This may be attributed to the enhanced toughness imparted by TEG, enabling the resin to withstand greater stresses generated by gas expansion during the foaming process, thus reducing the likelihood of cell rupture. Compared to PLP-PF, the pore shape of KH560-PLP-PF becomes more regular, resembling a honeycomb-like hexagonal structure, which exhibits higher compressive strength than the elliptical structure of pure phenolic foam [43]. Furthermore, the pore diameters in KH560-PLP-PF are more consistent, with variations reduced to around 10 µm. Within the foam, the flexible chains of the modifier effectively bond with the liquefied product resin, thereby increasing the toughness and reducing the brittleness of PLP-PF. The pore shape of PA66-modified foam becomes more uniform, with larger pore diameters compared to conventional PF, and most pores are closed. Typically, foams with a higher proportion of closed cells exhibit better mechanical and thermal insulation properties [45], while open-cell foams are more suitable for sound absorption [46]. The reduced cell wall damage in PA66-PLP-PF can be primarily attributed to the incorporation of flexible nylon amide-containing chain segments into the molecular structure of the Yunnan pine liquefied product resin, which improves the toughness of the resin matrix, allowing it to withstand the expansion force of the foaming gas and resulting in more uniform pores.

3.6. Open-Cell Ratio Analysis

The open-cell rate is a key parameter for evaluating the structure and performance of foams. Xu et al. [47] found that the modified epoxy foam’s porosity rate reached 90.959%, which to a certain extent improved the mechanical properties and thermal conductivity of the foam. As shown in Table 3, the open-cell rate of the unmodified resin foam was 85.19%. After treatment with the three modifiers TEG, PA66, and KH560, the open-cell rates of the foams increased to 87.05%, 94.16%, and 95.68% respectively, all higher than the unmodified foam. Among them, the effects of PA66 and KH560 were the best, with an increase in open-cell rate of around 10%.

3.7. Comparative Analysis of Foam Performance Indicators with Three Modifiers

3.7.1. Apparent Density and Thermal Conductivity

Based on the data presented in Table 4, the apparent density of the foam material increased to varying degrees after modification. This increase is primarily attributed to the enhanced resin toughness resulting from the addition of the modifier. The strengthened cell walls are better able to withstand the expanding gas during foaming, preventing rupture within a certain range. This leads to increased foam volume expansion and a subsequent decrease in density. However, with increasing modifier content, the resin’s crosslinking degree and viscosity gradually decrease. This reduction directly contributes to the occurrence of foam rupture and collapse during the foaming process, ultimately resulting in a higher apparent density of MPF compared to PLP-PF.
The thermal conductivity of MPF is lower than that of PLP-PF (Table 4), with the greatest reduction observed in KH560-PLP-PF, reaching 50% of its original value. According to Chinese national standards, all three materials are classified as thermal insulation materials. The decrease in thermal conductivity is attributed to the filling of KH560 particles within the pores of PLP-PF. This filling reduces the radiative and convective heat transfer properties of the pores, consequently weakening solid-state heat conduction and lowering thermal conductivity. In the case of PA66 modification, the addition of nylon, known for its excellent flame retardancy [48], significantly influences the oxygen index of the resin. At the microscopic level, as the content of nylon 66 increases, some nylon particles are embedded within the pores of PLP-PF, further diminishing the radiative and convective heat transfer properties of the pores. The weakening of solid-state heat conduction is attributed to the partial filling of long carbon chains of nylon within the resin matrix, which manifests as a reduction in thermal conductivity at the macroscopic level. The primary reason for the reduced thermal conductivity of TEG-PLP-PF is the presence of ether bonds in triethylene glycol [49]. These bonds facilitate molecular rotation, and the terminal hydroxyl groups can undergo etherification with phenol and react with paraformaldehyde, resulting in decreased thermal conductivity.

3.7.2. Compressive Strength Analysis

The compressive strength of the foams was enhanced by all three modifiers (Table 4), with KH560-PLP-PF exhibiting the most significant improvement (2.68 times that of PLP-PF). Compressive strength decreased in the following order: KH560-PLP-PF > PA66-PLP-PF > TEG-PLP-PF > PLP-PF. The addition of these three modifiers significantly improved the foam’s toughness and compressive strength. Experimental results indicate that although increasing the concentration of TEG initially enhances compressive strength, further addition leads to a decrease. This may be because TEG reacts with phenolic hydroxyl groups, altering the number of bridging bonds without disrupting the normal cross-linking of the resin, resulting in TEG-PLP-PF having higher compressive strength than PLP-PF. However, when the amount of modifier added exceeds the requirement for the reaction, the degree of resin polymerization decreases. This change may cause excessive occupation of active sites on phenol, reducing methylene linkages, lowering resin viscosity, increasing the foam’s open-cell ratio, and increasing the number of cracks, ultimately leading to a decrease in foam compressive strength.
The addition of PA66 incorporates polyhexamethylene adipamide long-chain structures into the liquefied resin, forming bridging bonds between phenolic molecules and reducing crosslinking density. This enhances PLP-PF toughness, improving both the compressive and tensile strength of the foam cells. After introducing KH560 into the foam, its decomposition can produce long flexible chain silanols [50], this organosilicon compound contains terminal hydroxyl active groups, ether bonds, and alkyl chains. The active groups facilitate further bonding with the resin prepolymer, creating larger molecules with increased internal flexibility, thereby enhancing both compressive and tensile strength.

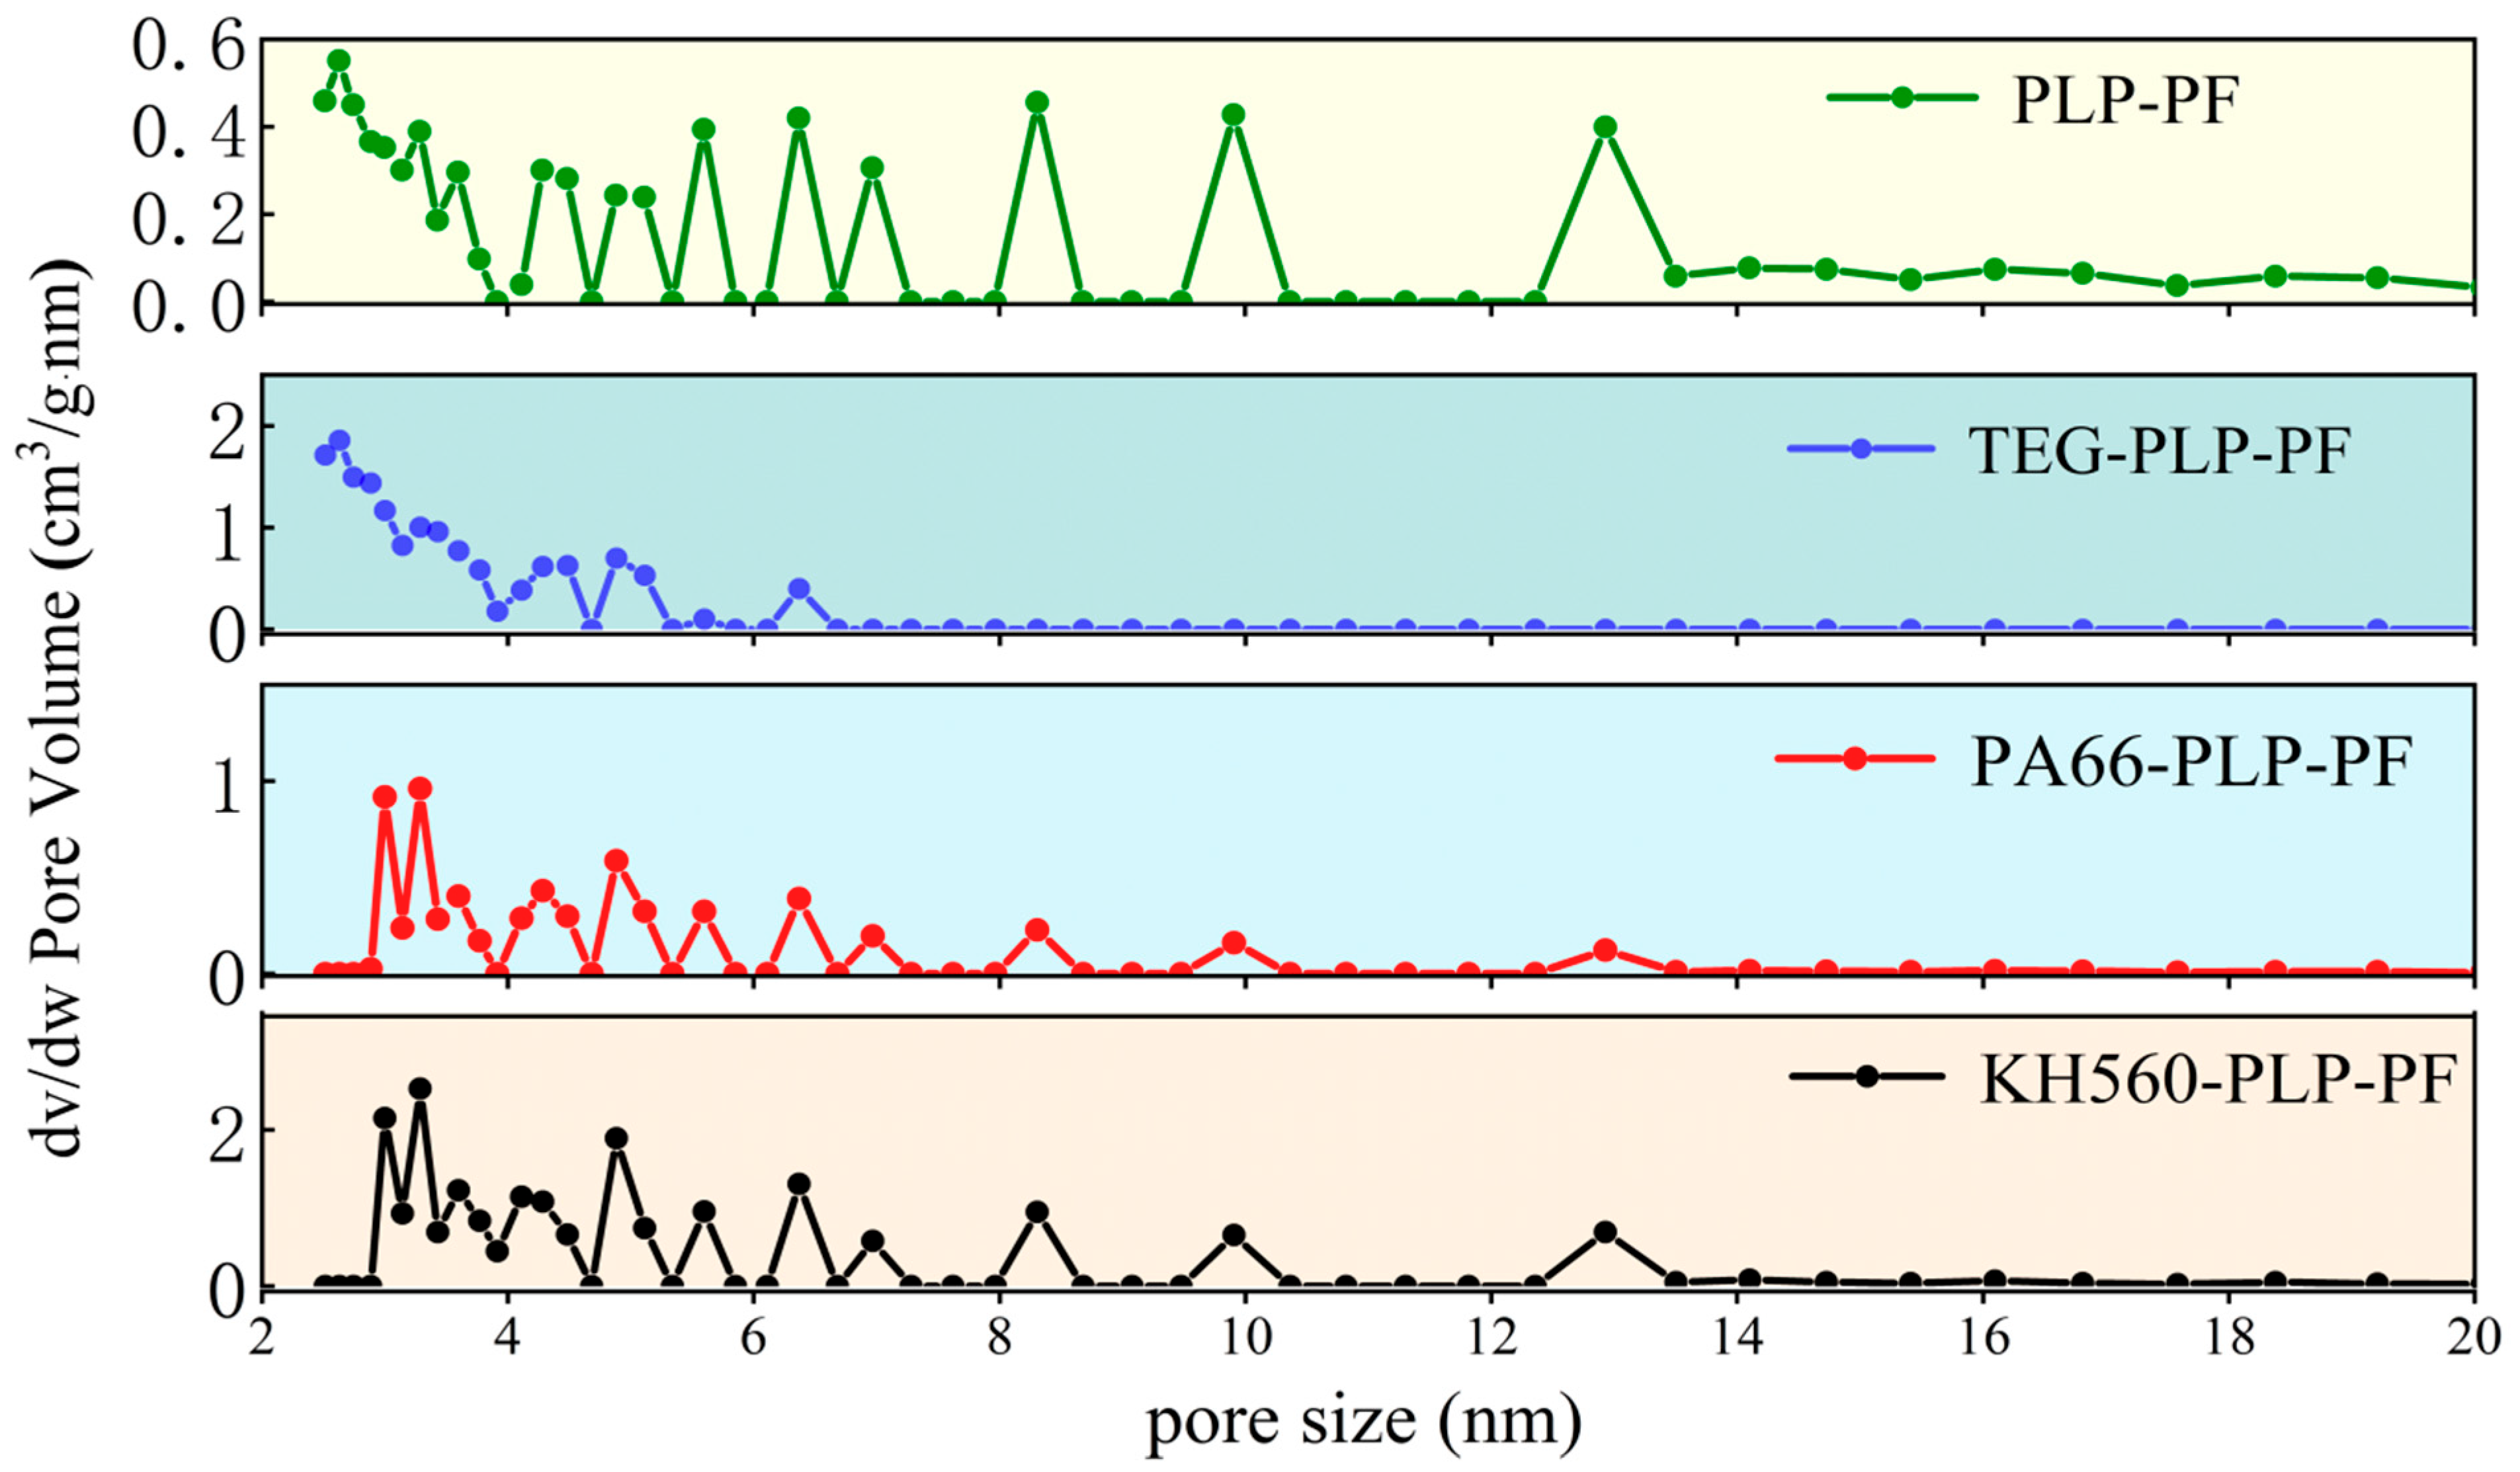
3.7.3. Microporous Structure Analysis

From Table 4 and Figure 6, it can be seen that the pore structures of the four types of foam are mainly composed of micropores and mesopores. When micropores and mesopores coexist, mesopores dominate, and the size of the foam pores has a certain impact on their thermal conductivity [51]. Using the BET method and BJH equation, the specific surface area of PLP-PF was calculated to be 1.921 m2/g, and its pore volume reached 0.175 cm3/g. The pore size distribution was primarily concentrated between 110 and 120 μm, with a relatively loose distribution and an average pore diameter of 115 μm. TEG-PLP-PF possesses a specific surface area of 2.164 m2/g and a pore volume of 0.098 cm3/g. Its pore size distribution is more concentrated, predominantly ranging from 105 to 110 μm, with an average pore diameter of 104 μm. PA66-PLP-PF displays a specific surface area of 1.882 m2/g and a pore volume of 0.045 cm3/g. Its pore size distribution is also concentrated, primarily between 105 and 115 μm, with an average pore diameter of 111 μm. The specific surface area of KH560-PLP-PF is 2.252 m2/g, and its pore volume reaches 0.088 cm3/g. The pore size distribution is primarily concentrated between 105 and 120 μm, with an average pore diameter of 117 μm. Furthermore, as shown in Figure 6, the pore size distribution of the modified foam is relatively concentrated, whereas that of the unmodified foam is more dispersed. This indicates that the modified resin has a better degree of cohesion, indirectly demonstrating that the toughness of the modified resin foam is higher than that of the unmodified foam.

3.7.4. Analysis of Chalking Rate and Oxygen Index Results

The powdering rate is the degree or proportion of a substance that undergoes powdering under specific conditions. It is an important indicator of the quality and performance of a material. However, for an extended period, the drawback of high powdering rates has limited the application of PF [52]. In Figure 7, the powdering rates of the three foams, TEG-PLP-PF, KH560-PLP-PF, and PA66-PLP-PF, are 20%, 14%, and 16%, respectively, with reductions of 28.57%, 50%, and 42.86%, respectively. Among these, KH560-PLP-PF exhibited the most significant reduction in pulverization rate. This reduction can be attributed to the introduction of long carbon chains or new functional groups into the molecular structure upon modification. This increased the curing crosslinking degree of the resin, resulting in stronger chemical bonds between molecules. Consequently, the tensile strength and compressive strength of PLP-PF were enhanced, leading to a lower powdering rate.
The limiting oxygen index (LOI) is a crucial parameter for evaluating the flame-retardant performance of insulating materials. Generally, LOI refers to the minimum oxygen concentration required to sustain material combustion in a mixed O2 and N2 environment [53]. A higher LOI value indicates better flame-retardant properties [54]. According to the data presented in Table 3, the LOI of PLP-PF is 32.5%. After modification with TEG, KH560, and PA66, the LOI values increase to 36.2%, 39.4%, and 41.5%, respectively. As per the Chinese national standard GB/T 2406.1-2008, materials with an LOI greater than 27% are considered flame-retardant. Thus, both unmodified and modified foams exhibit excellent flame-retardant properties. The addition of the TEG modifier results in a relatively small increase in LOI (3.7%), possibly because TEG interferes with the polycondensation of Hydroxymethylolphenol, increasing steric hindrance and reducing the crosslinking degree. However, the presence of triethylene glycol bridges enhances both the toughness and flame retardancy of foams based on TEG-modified resins.
By investigating the effect of different contents of KH560 on the oxygen index of phenolic foam, we found that the addition of KH560 coupling agent increased the flame retardancy of the foam by 6.9%. This is due to the formation of a cross-linked honeycomb structure in PLP-PF during the foaming and curing process, and the presence of SiO2 can also further enhance the stability of the foam [55]. However, the KH560 structure still contains a certain number of easily combustible methylene carbon groups, resulting in a relatively small overall improvement in the flame retardancy of PLP-PF. Meanwhile, since the oxygen index is greater than the Chinese national standard of 27%, it indicates that the KH560-modified PLP-PF can maintain high-efficiency fire-resistant and flame-retardant properties.
According to the results of the PA66-modified foam oxygen index, we found that the oxygen index increased with the addition of PA66. When the addition amount reached 6%, the oxygen index reached its maximum value of 41.5%, an increase of 9%. Among the three modifiers, PA66 showed the strongest enhancement ability. This is due to the introduction of long carbon chains into the molecular structure of the liquid product resin, which has relatively low heat resistance and oxidation resistance. Nevertheless, the modified PA66 foam exhibits an oxygen index of greater than 27%, does not produce smoke, and shows minimal residue formation, thereby demonstrating excellent flame retardancy.

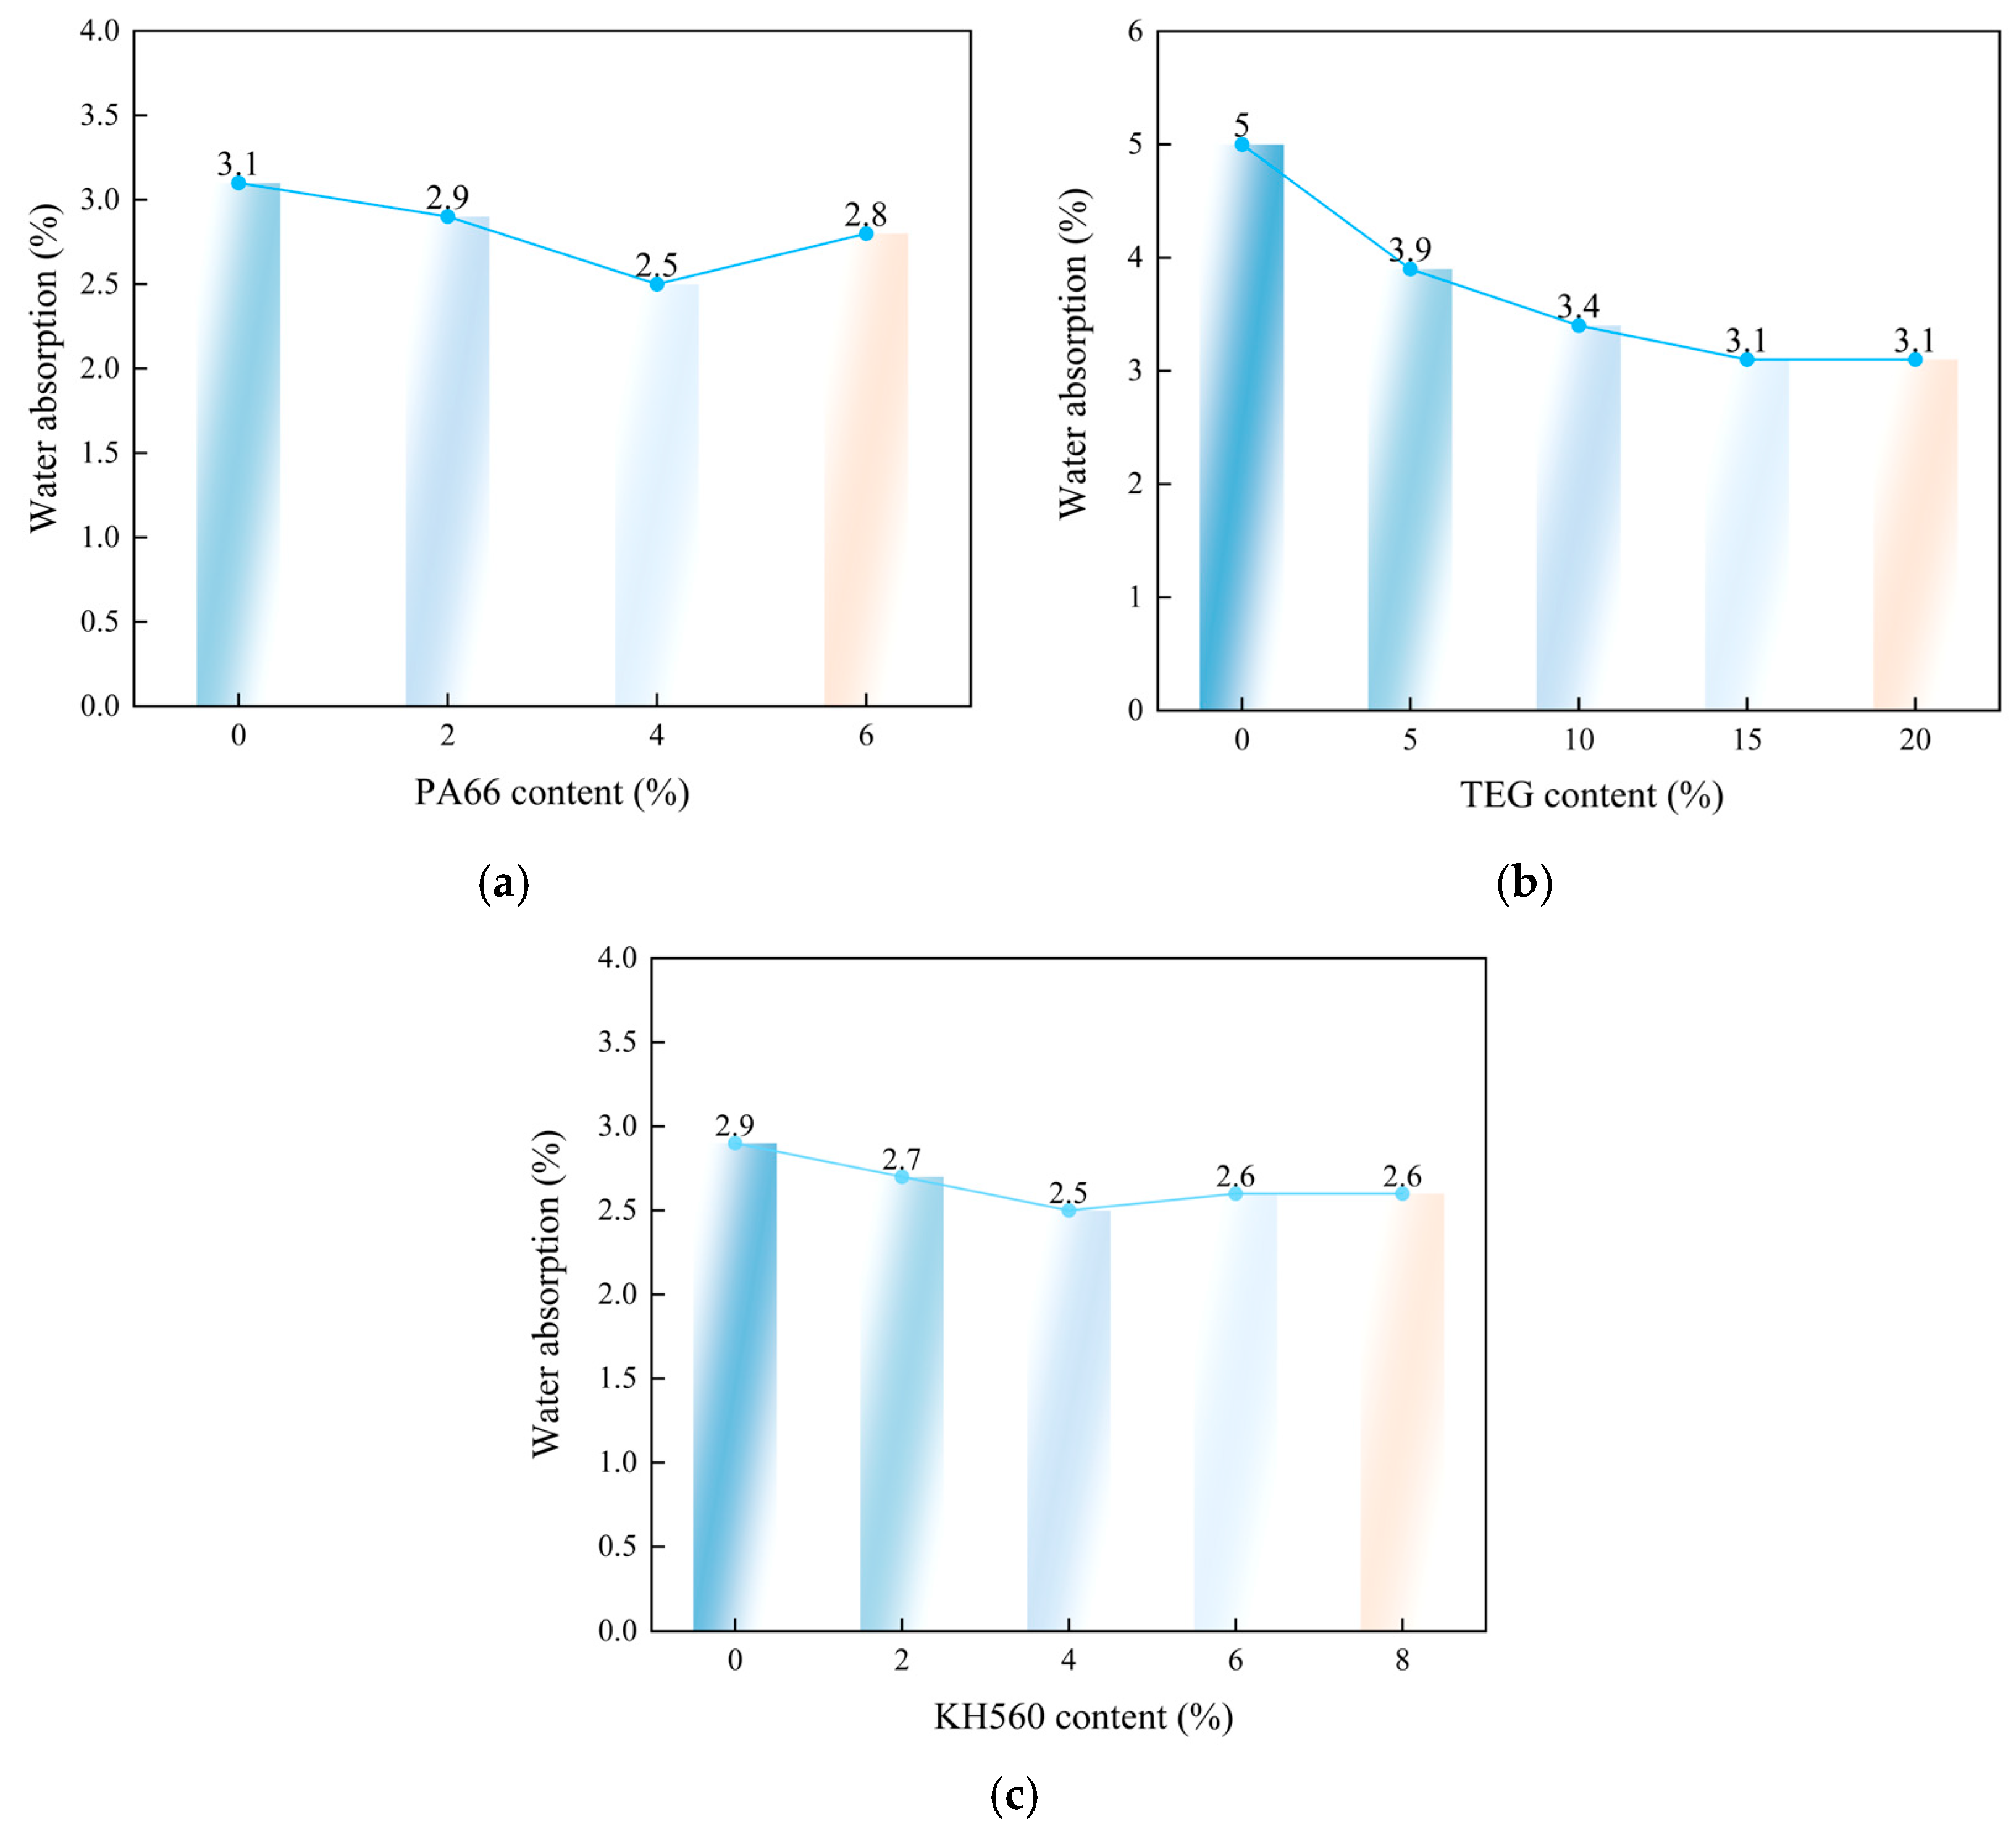
3.7.5. Water Absorption Analysis

The water absorption performance of foam materials is closely related to their pore structure. Conventional phenolic resin foams have a water absorption rate of approximately 11%. However, after modification, the water absorption rate of the three types of foams can be reduced to as low as 2.5%, significantly enhancing their waterproof properties. As shown in Figure 8, the water absorption rate of PLP-PF decreases gradually with the addition of TEG modifier. When the TEG content reaches 15%, the water absorption rate of PLP-PF stabilizes at around 3.1%. Scanning electron microscopy (SEM) images reveal that PLP-PF contains numerous needle-like and crack-like pore defects, resulting in a low closed-cell ratio. In contrast, the pore structure of MPF is more intact, leading to a lower water absorption rate compared to PLP-PF and superior waterproof performance.
The water absorption rate of KH560-PLP-PF is related to the addition of KH560, although the overall impact is not substantial. When the added amount of KH560 is 4%, the foam’s water absorption rate reaches its lowest value of 2.5%. Overall, as the PA66 content increases, the water absorption performance of PLP-PF exhibits a trend of initial decrease followed by an increase. This is attributed to the delayed completion of the pore wall structure by the long-chain macromolecules in nylon after PA66 is added. The modified resin foam exhibits smooth, pore-free cavities, while the unmodified resin foam’s pore walls contain numerous micro-pores. However, as the PA66 content further increases, despite enhancing the foam’s toughness, the resin’s curing reactivity worsens, leading to more open cells during foaming. As the closed-cell rate decreases, the water absorption rate of the resulting foamed material also decreases. When the PA66 content is 6%, the water absorption rate reaches its lowest point, at only 2.8%.
Furthermore, to further investigate the properties of the four phenolic foams, we compared the main findings of this study with the results of other research. In the table, the modifiers used for various modified phenolic foams are, from top to bottom: poplar fiber and isocyanate-terminated polyurethane prepolymer, bio-oil, tung oil, acetylated poplar fiber, hydroquinone, date palm bio-oil, and acetoacetic ester-terminated polyether. From Table 5, it can be observed that all MPFs have relatively low compressive strength (less than 0.3 MPa), which is significantly lower than the compressive strength of the three modified foams in this study (5.93–12.22 MPa). In terms of oxygen index, the highest value in Table 5 is 41.7%, which is close to the 41.5% reported in this study. Additionally, the water absorption and thermal conductivity of the three modified foams are lower than the results reported by other researchers, indicating that the three modified foams prepared in this study have better waterproofing and insulation properties. It is worth noting that Table 5 shows lower pulverization rates compared to the three modified phenolic foams in this study, with the highest being only 8.9%, which is lower than the 14% of KH560-PLP-PF.

4. Conclusions

In this study, we demonstrated that high-performance MPF can be successfully prepared by adding KH560, PA66, and TEG, without purifying or separating pine sawdust and its liquefied products. Compared to PLP-PF, all MPFs exhibited superior compressive strength and flame retardancy. The compressive strengths of KH560-PLP-PF, PA66-PLP-PF, and TEG-PLP-PF were 12.22 MPa, 7.02 MPa, and 5.93 MPa, respectively, while their oxygen indices were 39.4%, 41.5%, and 36.2%. Additionally, the water resistance of the modified foams was also improved, with the contact angles of all three MPFs exceeding 95°. Among them, KH560-PLP-PF had the largest contact angle, reaching 104°, and the lowest water absorption rate remained between 2.5% and 3.1%. The thermal conductivity of the modified foams also decreased, meeting national standards for insulation materials. Notably, the powdering rates of all three MPFs were reduced, with a maximum reduction of 50% observed in KH560-PLP-PF. This research provides a novel pathway for producing high-performance MPF from pine sawdust.

Supplementary Materials

The following supporting information can be downloaded at: https://www.mdpi.com/article/10.3390/f15122249/s1, Table S1: Main chemical composition of pine flour raw material; Table S2: Optimal liquefaction process parameters of pine flour; Table S3: Optimal foaming conditions for unmodified pine foam (PLP-PF); Table S4: Optimal conditions for synthesis of expandable resin from pine flour; Table S5: optimal dosage of modifiers; Table S6: Preparation conditions for optimal modified foam.

Author Contributions

Conceptualization, J.L. (Jianwei Ling) and S.L. (Shiyu Lu); methodology, J.L. (Jianwei Ling), S.L. (Shiyu Lu) and S.L. (Shouqing Liu); data curation, J.L. (Jianwei Ling), S.L. (Shiyu Lu) and X.L.; writing—original draft preparation, J.L. (Jianwei Ling) and J.L. (Jianxiang Liu); writing—review and editing, J.L. (Jianwei Ling) and J.L. (Jianxiang Liu). All authors have read and agreed to the published version of the manuscript.

Funding

This research was supported by the National Natural Science Foundation of China (32460370).

Data Availability Statement

The data in this study can be obtained from the corresponding author.

Conflicts of Interest

The authors declare no conflicts of interest.

References

  1. Guo, J.; Zhang, Y.; Fang, J.; Ma, Z.; Li, C.; Yan, M.; Qiao, N.; Liu, Y.; Bian, M. Reduction and Reuse of Forestry and Agricultural Bio-Waste through Innovative Green Utilization Approaches: A Review. Forests 2024, 15, 1372. [Google Scholar] [CrossRef]
  2. Yu, S.; Zhang, W.; Dong, X.; Wang, F.; Yang, W.; Liu, C.; Chen, D. A review on recent advances of biochar from agricultural and forestry wastes: Preparation, modification and applications in wastewater treatment. J. Environ. Chem. Eng. 2023, 12, 111638. [Google Scholar] [CrossRef]
  3. Zou, J.; Liu, X.; Xu, S.; Chen, M.; Yu, Q.; Xie, J. Combined hydrothermal pretreatment of agricultural and forestry wastes to enhance anaerobic digestion for methane production. Chem. Eng. J. 2024, 486, 150313. [Google Scholar] [CrossRef]
  4. Bilgen, S.; Sarıkaya, İ. Utilization of forestry and agricultural wastes. Energy Sources Part A Recovery Util. Environ. Eff. 2016, 38, 3484–3490. [Google Scholar] [CrossRef]
  5. Melro, E.; Duarte, H.; Antunes, F.E.; Valente, A.J.; Romano, A.; Norgren, M.; Medronho, B. Engineering novel phenolic foams with lignin extracted from pine wood residues via a new levulinic-acid assisted process. Int. J. Biol. Macromol. 2023, 248, 125947. [Google Scholar] [CrossRef]
  6. DSouza, G.C.; Chio, C.; Ray, M.B.; Prakash, A.; Qin, W.; Xu, C. Synthesis and characterization of biodegradable Kraft lignin-based hydrophilic phenol formaldehyde foams. Sustain. Mater. Technol. 2024, 41, e01064. [Google Scholar] [CrossRef]
  7. Chen, G.; Liu, J.; Zhang, W.; Han, Y.; Zhang, D.; Li, J.; Zhang, S. Lignin-based phenolic foam reinforced by poplar fiber and isocyanate-terminated polyurethane prepolymer. Polymers 2021, 13, 1068. [Google Scholar] [CrossRef]
  8. Zhou, Y.; Liu, M.; Lv, Y.; Guo, H.; Liu, Y.; Ye, X.; Shi, Y. Research on fire retardant lignin phenolic carbon foam with preferable smoke suppression performance. Chem. Eng. Sci. 2023, 282, 119305. [Google Scholar] [CrossRef]
  9. Mougel, C.; Garnier, T.; Cassagnau, P.; Sintes-Zydowicz, N. Phenolic foams: A review of mechanical properties, fire resistance and new trends in phenol substitution. Polymer 2019, 164, 86–117. [Google Scholar] [CrossRef]
  10. Del Saz-Orozco, B.; Alonso, M.V.; Oliet, M.; Domínguez, J.C.; Rodriguez, F. Effects of formulation variables on density, compressive mechanical properties and morphology of wood flour-reinforced phenolic foams. Compos. Part B Eng. 2014, 56, 546–552. [Google Scholar] [CrossRef]
  11. Cheng, J.-Y.; Li, Z.-K.; Yan, H.-L.; Lei, Z.-P.; Yan, J.-C.; Ren, S.-B.; Wang, Z.-C.; Kang, S.-G.; Shui, H.-F. Preparation and characterization of low-temperature coal tar toughened phenolic foams. J. Fuel Chem. Technol. 2023, 51, 748–756. [Google Scholar] [CrossRef]
  12. Sarika, P.; Nancarrow, P.; Khansaheb, A.; Ibrahim, T. Progress in Bio-Based Phenolic Foams: Synthesis, Properties, and Applications. ChemBioEng Rev. 2021, 8, 612–632. [Google Scholar] [CrossRef]
  13. Song, S.A.; Chung, Y.S.; Kim, S.S. The mechanical and thermal characteristics of phenolic foams reinforced with carbon nanoparticles. Compos. Sci. Technol. 2014, 103, 85–93. [Google Scholar] [CrossRef]
  14. Ziarati, H.B.; Fasihi, M. Phenolic foams: Foaming processes and applications. In Handbook of Thermosetting Foams, Aerogels, and Hydrogels; Elsevier: Amsterdam, The Netherlands, 2024; pp. 421–441. [Google Scholar]
  15. Gao, M.; Wu, W.; Wang, Y.; Wang, Y.; Wang, H. Phenolic foam modified with dicyandiamide as toughening agent. J. Therm. Anal. Calorim. 2016, 124, 189–195. [Google Scholar] [CrossRef]
  16. Hu, L.; Zhang, F.; Luo, L.; Wang, L.; Liu, Y.; Leng, J. Design and preparation of shape memory phenol–formaldehyde foam composites with excellent thermal stability and mechanical properties. Compos. Part A Appl. Sci. Manuf. 2023, 174, 107738. [Google Scholar] [CrossRef]
  17. Yang, H.; Wang, X.; Yuan, H.; Song, L.; Hu, Y.; Yuen, R.K. Fire performance and mechanical properties of phenolic foams modified by phosphorus-containing polyethers. J. Polym. Res. 2012, 19, 1–10. [Google Scholar] [CrossRef]
  18. Liu, J.; Li, X.; Zhou, C. Mechanical and thermal properties of modified red mud-reinforced phenolic foams. Polym. Int. 2018, 67, 528–534. [Google Scholar] [CrossRef]
  19. Song, S.A.; Lee, Y.; Kim, Y.S.; Kim, S.S. Mechanical and thermal properties of carbon foam derived from phenolic foam reinforced with composite particles. Compos. Struct. 2017, 173, 1–8. [Google Scholar] [CrossRef]
  20. Yu, Y.; Wang, Y.; Xu, P.; Chang, J. Preparation and characterization of phenolic foam modified with bio-oil. Materials 2018, 11, 2228. [Google Scholar] [CrossRef]
  21. Del Saz-Orozco, B.; Alonso, M.V.; Oliet, M.; Domínguez, J.C.; Rojo, E.; Rodriguez, F. Lignin particle-and wood flour-reinforced phenolic foams: Friability, thermal stability and effect of hygrothermal aging on mechanical properties and morphology. Compos. Part B Eng. 2015, 80, 154–161. [Google Scholar] [CrossRef]
  22. Zhao, S.; Chen, X.; Fan, Z.; Ni, R.; Liu, X.; Tian, Y.; Zhou, B. Using lignin degraded to synthesize phenolic foams with excellent flame retardant property. Eng. Asp. 2023, 666, 131373. [Google Scholar] [CrossRef]
  23. Weng, S.; Li, Z.; Bo, C.; Song, F.; Xu, Y.; Hu, L.; Zhou, Y.; Jia, P. Design lignin doped with nitrogen and phosphorus for flame retardant phenolic foam materials. React. Funct. Polym. 2023, 185, 105535. [Google Scholar] [CrossRef]
  24. Wei, D.; Li, D.; Zhang, L.; Zhao, Z.; Ao, Y. Study on phenolic resin foam modified by montmorillonite and carbon fibers. Procedia Eng. 2012, 27, 374–383. [Google Scholar] [CrossRef]
  25. Patle, V.K.; Mehta, Y.; Kumar, R. Nickel and iron nanoparticles decorated carbon fibers reinforced phenolic resin-based carbon composites foam for excellent electromagnetic interference shielding. Diam. Relat. Mater. 2024, 145, 111069. [Google Scholar] [CrossRef]
  26. Sharma, A.; Kumar, R.; Patle, V.K.; Dhawan, R.; Abhash, A.; Dwivedi, N.; Mondal, D.; Srivastava, A. Phenol formaldehyde resin derived carbon-MCMB composite foams for electromagnetic interference shielding and thermal management applications. Compos. Commun. 2020, 22, 100433. [Google Scholar] [CrossRef]
  27. Radotić, K.; Mićić, M. Methods for extraction and purification of lignin and cellulose from plant tissues. In Sample Preparation Techniques for Soil, Plant, and Animal Samples; Univerzitet u Beogradu: Belgrade, Serbia, 2016; pp. 365–376. [Google Scholar]
  28. Lan, W.; Liu, C.-F.; Sun, R.-C. Fractionation of bagasse into cellulose, hemicelluloses, and lignin with ionic liquid treatment followed by alkaline extraction. J. Agric. Food Chem. 2011, 59, 8691–8701. [Google Scholar] [CrossRef]
  29. Wang, X.; Jang, J.; Su, Y.; Liu, J.; Zhang, H.; He, Z.; Ni, Y. Starting materials, processes and characteristics of bio-based foams: A review. J. Bioresour. Bioprod. 2024, 9, 160–173. [Google Scholar] [CrossRef]
  30. Kashyap, P.; Brzezińska, M.; Keller, N.; Ruppert, A.M. Influence of Impurities in the Chemical Processing Chain of Biomass on the Catalytic Valorisation of Cellulose towards γ-Valerolactone. Catalysts 2024, 14, 141. [Google Scholar] [CrossRef]
  31. Mahmoudi, M.; Behin, J. Detrimental effect of industrial toluene organic impurities on the density of rigid polyurethane foam and their removal. Korean J. Chem. Eng. 2021, 38, 204–214. [Google Scholar] [CrossRef]
  32. GB/T 2406.1-2008; Plastics—Determination of Burning Behaviour by Oxygen Index. Standardization Administration of China: Beijing, China, 2008.
  33. GB/T 10297-2015; Test Method for Thermal Conductivity of Nonmetal Solid Materials—Hot - Wire Method. State General Administration of the People’s Republic of China for Quality Supervision, Inspection and Quarantine. Standardization Administration of the People’s Republic of China: Beijing, China, 2015.
  34. GB/T 10799-2008; Rigid Cellular Plastics—Determination of the Volume Percentage of Open Cells and of Closed Cells. State General Administration of the People’s Republic of China for Quality Supervision, Inspection and Quarantine. Standardization Administration of the People’s Republic of China: Beijing, China, 2008.
  35. GB/T 8810-2005; Determination of Water Absorption of Rigid Cellular Plastics. State General Administration of the People’s Republic of China for Quality Supervision, Inspection and Quarantine. Standardization Administration of the People’s Republic of China: Beijing, China, 2005.
  36. Xu, S.-C.; Zhang, N.-L.; Yang, J.-F.; Wang, B.; Kim, C.-Y. Silicon carbide-based foams derived from foamed SiC-filled phenolic resin by reactive infiltration of silicon. Ceram. Int. 2016, 42, 14760–14764. [Google Scholar] [CrossRef]
  37. Yang, S.; Zhang, Q.; Hu, Y. Synthesis of a novel flame retardant containing phosphorus, nitrogen and boron and its application in flame-retardant epoxy resin. Polym. Degrad. Stab. 2016, 133, 358–366. [Google Scholar] [CrossRef]
  38. Zhang, N.; Li, Z.; Xiao, Y.; Pan, Z.; Jia, P.; Feng, G.; Bao, C.; Zhou, Y.; Hua, L. Lignin-based phenolic resin modified with whisker silicon and its application. J. Bioresour. Bioprod. 2020, 5, 67–77. [Google Scholar] [CrossRef]
  39. Tang, K.; He, X.; Xu, G.; Tang, X.; Ge, T.; Zhang, A. Effect of formaldehyde to phenol molar ratio on combustion behavior of phenolic foam. Polym. Test. 2022, 111, 107626. [Google Scholar] [CrossRef]
  40. Suttaphakdee, P.; Neramittagapong, S.; Theerakulpisut, S.; Neramittagapong, A.; Kumsaen, T.; Jina, P.; Saengkhamsuk, N. Comparison of dehydration methods for untreated lignin resole by hot air oven and vacuum rotary evaporator to synthesize lignin-based phenolic foam. Heliyon 2022, 8, e08769. [Google Scholar] [CrossRef]
  41. Chen, X.; Ma, Y.; Liu, S.; Zhang, A.; Liu, W.; Huang, S. A tannic acid-based intumescent flame retardant for improving flame retardancy of epoxy composites. Adv. Ind. Eng. Polym. Res. 2024, in press. [Google Scholar] [CrossRef]
  42. Saifaldeen, Z.S.; Khedir, K.R.; Camci, M.T.; Ucar, A.; Suzer, S.; Karabacak, T. The effect of polar end of long-chain fluorocarbon oligomers in promoting the superamphiphobic property over multi-scale rough Al alloy surfaces. Appl. Surf. Sci. 2016, 379, 55–65. [Google Scholar] [CrossRef]
  43. Song, F.; Li, Z.; Jia, P.; Bo, C.; Zhang, M.; Hu, L.; Zhou, Y. Phosphorus-containing tung oil-based siloxane toughened phenolic foam with good mechanical properties, fire performance and low thermal conductivity. Mater. Des. 2020, 192, 108668. [Google Scholar] [CrossRef]
  44. Song, F.; Jia, P. Flame Retardant Modification of Phenolic Foam. In Phenolic Based Foams: Preparation, Characterization, and Applications; Springer: Berlin/Heidelberg, Germany, 2022; pp. 195–207. [Google Scholar]
  45. Wang, L.; Hu, A.; Fan, L.; Yang, S. Structures and properties of closed-cell polyimide rigid foams. J. Appl. Polym. Sci. 2013, 130, 3282–3291. [Google Scholar] [CrossRef]
  46. Xiong, W.; Wu, J.; Tian, H.; Xiang, A.; Wang, C.; Wu, Q. Enhanced mechanical and thermal properties of polyurethane-imide foams with the addition of expended vermiculite. Polym. Compos. 2020, 41, 886–892. [Google Scholar] [CrossRef]
  47. Xu, Q.; Gong, R.; Cui, M.-Y.; Liu, C.; Li, R.-H. Preparation of high-strength microporous phenolic open-cell foams with physical foaming method. High Perform. Polym. 2015, 27, 852–867. [Google Scholar] [CrossRef]
  48. Gao, J.; Wu, Y.; Li, J.; Peng, X.; Yin, D.; Jin, H.; Wang, S.; Wang, J.; Wang, X.; Jin, M. A review of the recent developments in flame-retardant nylon composites. Compos. Part C Open Access 2022, 9, 100297. [Google Scholar] [CrossRef]
  49. Tang, K.; Tang, X.; Liu, X.; Zhang, A.; Ge, T.; Li, Y. Phenolic Foams Toughened with Triethylene Glycol by In Situ Polymerization and Prepolymerization Processes. ACS Appl. Polym. Mater. 2022, 4, 8303–8314. [Google Scholar] [CrossRef]
  50. Feng, Y.; Wang, W.; Wang, S. PVA fiber/cement-based interface in silane coupler KH560 reinforced high performance concrete–Experimental and molecular dynamics study. Constr. Build. Mater. 2023, 395, 132184. [Google Scholar] [CrossRef]
  51. Simonini, L.; Sorze, A.; Maddalena, L.; Carosio, F.; Dorigato, A. Mechanical reprocessing of polyurethane and phenolic foams to increase the sustainability of thermal insulation materials. Polym. Test. 2024, 138, 108539. [Google Scholar] [CrossRef]
  52. Liu, J.; Wang, L.; Zhang, W.; Han, Y. Phenolic resin foam composites reinforced by acetylated poplar fiber with high mechanical properties, low pulverization ratio, and good thermal insulation and flame retardant performance. Materials 2019, 13, 148. [Google Scholar] [CrossRef]
  53. Schinazi, G.; Price, E.J.; Schiraldi, D.A. Fire testing methods of bio-based flame-retardant polymeric materials. In Bio-Based Flame-Retardant Technology for Polymeric Materials; Elsevier: Amsterdam, The Netherlands, 2022; pp. 61–95. [Google Scholar]
  54. Bo, C.; Shi, Z.; Hu, L.; Pan, Z.; Hu, Y.; Yang, X.; Jia, P.; Ren, X.; Zhang, M.; Zhou, Y. Cardanol derived P, Si and N based precursors to develop flame retardant phenolic foam. Sci. Rep. 2020, 10, 12082. [Google Scholar] [CrossRef]
  55. Zhi, M.; Liu, Q.; Chen, H.; Chen, X.; Feng, S.; He, Y. Thermal stability and flame retardancy properties of epoxy resin modified with functionalized graphene oxide containing phosphorus and silicon elements. ACS Omega 2019, 4, 10975–10984. [Google Scholar] [CrossRef]
  56. Ge, T.; Hu, X.; Tang, K.; Wang, D. The preparation and properties of terephthalyl-alcohol-modified phenolic foam with high heat aging resistance. Polymers 2019, 11, 1267. [Google Scholar] [CrossRef]
  57. Sarika, P.R.; Nancarrow, P.; Makkawi, Y.; Ibrahim, T.H. Preparation and Characterization of Date Palm Bio-Oil Modified Phenolic Foam. Polymers 2024, 16, 955. [Google Scholar] [CrossRef]
  58. Ge, T.; Tang, K.; Tang, X. Preparation and properties of acetoacetic ester-terminated polyether pre-synthesis modified phenolic foam. Materials 2019, 12, 334. [Google Scholar] [CrossRef]
Figure 1. Flowchart of the preparation of the four foams.
Forests 15 02249 g001
Figure 2. Infrared spectra of foams: (a) PLP-PF and KH560-PLP-PF, (b) PLP-PF and PA66-PLP-PF, (c) PLP-PF and TEG-PLP-PF, (d) three modified foams.
Forests 15 02249 g002
Figure 3. Contact angle size of the four foams. (a) PLP-PF, (b) TEG-PLP-PF, (c) PA66-PLP-PF, (d) KH560-PLP-PF.
Forests 15 02249 g003
Figure 4. (a) TG curves for the four foams; (b) DTG curves for the four foams.
Forests 15 02249 g004
Figure 5. SEM images of four foams: (a) PLP-PF, (b) TEG-PLP-PF, (c) PA66-PLP-PF, (d) KH560-PLP-PF.
Forests 15 02249 g005aForests 15 02249 g005b
Figure 6. The pore size distribution of resin foam.
Forests 15 02249 g006
Figure 7. Comparison of chalking rate and oxygen index for different foams.
Forests 15 02249 g007
Figure 8. Relationship between foam water absorption and modifier dosage; (a) PA66, (b) TEG, (c) KH560.
Forests 15 02249 g008
Table 1. Proportions of the additive chemicals used for the preparation of the MPFs.
MaterialsKH560PA66TEGActivated Carbonn-HexaneAqueous Formaldehyde
Dosage4.1%6%15%2.5 g1 g37%
Table 2. Comparison of the content of specific elements in modified and unmodified phenolic foams.
Mass (%)NaMgSiPSClKCaFeZnAlCrMn
PLP-PF19.40.391.92.849.815.32.453.982.11.020.430.100.19
TEG-PLP-PF14.60.271.652.7346.222.92.984.652.10.570.470.150.25
KH560-PLP-PF10.70.15112.9949.714.24.02.851.80.89/0.120.22
PA66-PLP-PF15.80.221.462.3738.733.42.362.91.30.490.39/0.12
Table 3. Comparison of the open cell ratio of the four foams.
Skeleton Volume (cm3)True Density
(g/cm3)
Sampling Volume (cm3)Open Porosity
(%)
PLP-PF0.35491.55222.396985.19
TEG-PLP-PF0.30801.48892.378087.05
PA66-PLP-PF0.12641.30542.163194.16
KH560-PLP-PF0.12092.15412.798295.68
Table 4. Selected performance parameters of PLP-PF and the three MPFs.
Foam TypeApparent Density
(kg/m3)
Pore Volume
(cm3/g)
Compressive Strength
(MPa)
Specific Surface Area (m2/g)Thermal Conductivity (W/m·K)Average Pore Diameter
(μm)
PLP-PF0.38 ± 0.0370.175 ± 0.0144.56 ± 0.211.921 ± 0.120.023 ± 0.002115
TEG-PLP-PF0.42 ± 0.0550.098 ± 0.0195.93 ± 0.352.164 ± 0.180.018 ± 0.001104
KH560-PLP-PF0. 52 ± 0.0450.088 ± 0.01812.22 ± 0.562.252 ± 0.180.011 ± 0.001111
PA66-PLP-PF0.46 ± 0.0620.045 ± 0.017.02 ± 0.341.882 ± 0.20.017 ± 0.001117
Table 5. Key outcome indicators of selected other studies.
Compressive Strength
(MPa)
Oxygen Index (%)Chalking Rate (%)Water Absorption
(%)
Thermal Conductivity (W/m·K)Literatures
0.12531.55.2/0.048[7]
0.28 /8.9 ± 0.2//[20]
0.24541.7//0.0366[43]
0.1833.96.5/0.056[52]
≈0.25/≈3.5≈4.3/[56]
0.294///0.038[57]
0.203/1.3≈6.5/[58]
Note: in Table 5, the data indicators of the modified phenolic foam with excellent performance in other studies are selected.
Disclaimer/Publisher’s Note: The statements, opinions and data contained in all publications are solely those of the individual author(s) and contributor(s) and not of MDPI and/or the editor(s). MDPI and/or the editor(s) disclaim responsibility for any injury to people or property resulting from any ideas, methods, instructions or products referred to in the content.

