Article

Intelligent Detection Method for Surface Defects of Particleboard Based on Super-Resolution Reconstruction

by
Haiyan Zhou
,
Haifei Xia
,
Chenlong Fan
,
Tianxiang Lan
,
Ying Liu
*,
Yutu Yang
,
Yinxi Shen
and
Wei Yu
College of Mechanical and Electronic Engineering, Nanjing Forestry University, Nanjing 210037, China
*
Author to whom correspondence should be addressed.
Forests 2024, 15(12), 2196; https://doi.org/10.3390/f15122196
Submission received: 5 November 2024 / Revised: 5 December 2024 / Accepted: 11 December 2024 / Published: 13 December 2024
(This article belongs to the Section Wood Science and Forest Products)

Abstract

:
To improve the intelligence level of particleboard inspection lines, machine vision and artificial intelligence technologies are combined to replace manual inspection with automatic detection. Aiming at the problem of missed detection and false detection on small defects due to the large surface width, complex texture and different surface defect shapes of particleboard, this paper introduces image super-resolution technology and proposes a super-resolution reconstruction model for particleboard images. Based on the Transformer network, this model incorporates an improved SRResNet (Super-Resolution Residual Network) backbone network in the deep feature extraction module to extract deep texture information. The shallow features extracted by conv 3 × 3 are then fused with features extracted by the Transformer, considering both local texture features and global feature information. This enhances image quality and makes defect details clearer. Through comparison with the traditional bicubic B-spline interpolation method, ESRGAN (Enhanced Super-Resolution Generative Adversarial Network), and SwinIR (Image Restoration Using Swin Transformer), the effectiveness of the particleboard super-resolution reconstruction model is verified using objective evaluation metrics including PSNR, SSIM, and LPIPS, demonstrating its ability to produce higher-quality images with more details and better visual characteristics. Finally, using the YOLOv8 model to compare defect detection rates between super-resolution images and low-resolution images, the mAP can reach 96.5%, which is 25.6% higher than the low-resolution image recognition rate.

1. Introduction

Particleboard is an engineered wood product manufactured by processing natural wood, branch materials, or other cellulose-containing substances through chipping, drying, adhesive bonding, and hot pressing [1,2,3]. Due to its high resource utilization, structural strength, sound insulation properties, and impact resistance, particleboard is extensively used in furniture manufacturing, packaging, and architectural decoration industries [4]. During production, surface defects can compromise board quality and hinder subsequent lamination processes. Quality control oversights can lead to economic losses and, more seriously, damage to corporate reputation. Currently, surface quality inspection of domestic and international particleboard production lines primarily relies on manual visual inspection, where workers visually identify defects and grade their severity. However, prolonged inspection work causes visual fatigue among workers, resulting in high miss and false detection rates while also affecting production efficiency. Therefore, developing intelligent surface defect detection and classification systems is crucial for improving particleboard product quality and production efficiency in China.
Machine vision technology, which replaces human visual inspection with automated detection and measurement, offers advantages such as high efficiency and speed. Many researchers have successfully applied this technology in agriculture, aerospace, and other fields, and it is gradually being adopted in artificial board manufacturing [5,6]. Guo Hui et al. [7] developed a particleboard defect detection algorithm using a gray-level co-occurrence matrix and hierarchical clustering. They tested 600 images (512 × 512 pixels) containing five defect types: debris, oil stains, glue spots, big shavings, and soft spots. The algorithm achieved 92.2% precision and 91.8% recall, with a 5% false detection rate for normal boards. While the miss rates for glue spots, oil stains, and soft spots were 1.6%, 4.0%, and 6.6%, respectively, with an average processing time of 0.867 s per image.
With neural network advancement, particleboard surface inspection has evolved from traditional machine learning to deep learning. Zhang et al. [8] proposed an innovative dual attention mechanism with dense connection (DC-DACB), combining Ganomaly and ResNet networks to detect five defect types (shavings, scratches, chalk marks, soft spots, and adhesive spots) achieving 93.1% accuracy. For real-time detection improvement, Zhao et al. [9] modified YOLOv5 by incorporating gamma-ray transformation and image differentiation methods to correct uneven illumination. They added Ghost Bottleneck lightweight deep convolution modules in the backbone block and replaced Conv with depth-wise convolution (DWConv) in the Neck module to compress network parameters. Testing on five defect types (big shavings, sand leakages, glue spots, soft spots, and oil pollution) achieved a 91.22% recall and 94.5% F1-score, with oil pollution accuracy at 81.7% and a single image detection time of 0.031 s. These results indicate that detection accuracy for specific defects like big shaving and glue spot still needs improvement in existing methods.
Due to particleboard’s large surface area and defects varying in size and shape with similar characteristics, smaller defects are prone to miss detection or false detection. Small defects typically feature low pixel resolution and poor visual quality. Traditional CNN methods struggle to process details and textures in large-scale images. Image super-resolution reconstruction technology can overcome existing hardware limitations by enhancing the small defect feature information in particleboard images, improving surface image quality and defect clarity, thereby increasing detection accuracy.
Image super-resolution technology is an image processing method, which aims to restore low-resolution images to high-resolution images [10,11]. Liang et al. [12] designed a model called SwinIR, which is based on the Transformer architecture and utilizes an innovative self-attention reconstruction mechanism to extract shallow features, mine deep features, and ultimately reconstruct images. Extensive experimental comparisons showed that the restored image quality surpassed that of CNN models by 0.14~0.45 dB in PSNR metrics, with over 60% reduction in model parameters, showing significant research potential, though model stability still needs improvement. Deeba et al. [13] developed a modified wide residual network by increasing network width and reducing depth, which was effectively validated on public remote sensing datasets. Compared to EDSR and SRResnet networks, it reduced memory usage by 21% and 34%, respectively, improving training loss efficiency. Huang et al. [14] introduced the 2 structure incorporating directional operators and multi-scale fusion to enhance medical radiographic image reconstruction, achieving excellent performance in PSNR, SSIM, NIQE, and PI metrics. Our team member Yu Wei [15] proposed the SRDAGAN model for particleboard surface image super-resolution reconstruction, comprehensively evaluated using PSNR, SSIM, and LPIPS metrics, demonstrating clearer textures and more authentic feature expression in reconstructed images. However, this technology has not yet been applied in defect detection models.
This paper employs machine vision technology and artificial intelligence algorithms for particleboard surface defect detection. For defects with small areas and unclear contours, super-resolution technology is introduced to obtain higher-quality particleboard surface images with enhanced details before defect detection. The system implements intelligent particleboard surface defect recognition based on super-resolution reconstruction, effectively reducing hardware costs while improving detection accuracy and efficiency, which has significant implications for promoting transformation and upgrading of the particleboard industry and enhancing equipment intelligence. The main contribution of this paper is the establishment of a large-scale veneer image acquisition system based on machine vision. The acquired images were processed using an improved Transformer algorithm for image super-resolution, and, finally, the processed images were verified for defect recognition accuracy using the YOLOv8 algorithm.

2. Materials and Methods

2.1. Imaging

The samples used in this experiment were 1500 standard boards with a length, width, and thickness of 1220 mm × 2440 mm × 18 mm provided by China Daya Wood Industry (Jiangsu) Co., Ltd. (Zhenjiang, Jiangsu, China) The experimental specimens were three-layer homogeneous environmental protection particleboard, and the defects were checked and identified by professional inspection board masters. The surface image data acquisition equipment, as shown in Figure 1, primarily consisted of conveying equipment, control and sensing devices, image acquisition equipment, and fixing devices. The camera provided by Haikang Robot Co., Ltd. (Hangzhou, Zhejiang, China), whose model was HIKROBOT MV-CL086-91GC with a resolution of 8192 × 6 pixels and a line frequency of 4.7 kHz. The lens provided by Phoenix Optical Co., Ltd. (Shangrao, Jiangxi, China), whose model was LD21S01 with a focal length of 35 mm and aperture range of F2.8-F16. Through calculation and testing, the camera lens was installed 1.1 m above the particleboard surface to ensure full-width coverage. Image acquisition was triggered by an encoder and, to maintain similar sampling frequencies in both length and width directions while minimizing equipment modifications, the encoder output signal was frequency-divided to ensure consistent pixel representation per unit distance in both directions. During the image data acquisition process, as the particleboard moved along the conveyor belt, it triggered a photoelectric switch, activating the line light source and line scan camera. The camera then captured the particleboard surface image line by line, transmitting data through the GigE interface to obtain a complete RGB image of the particleboard, as shown in Figure 2.

2.2. Data Set

The original particleboard images were captured at 8192 × 16,800 pixels. We used threshold segmentation to remove the background and convert the image from BGR to HSV, then used a mask to remove green and leave non-green colors, remove black shadows, and binarize the image. After morphological processing, such as corrosion, open operation, finding the largest connected domain, hole filling, closed operation, etc., the optimization prospect was obtained. Finally, the processing results were used as masks, and the original image was bitwise and calculated, leaving only the foreground to the background. Then, the image was clipped by window sliding, and the defective image was selected for defect labeling as the required data.
The preprocessed images were randomly cropped into 1024 × 1024 pixels blocks. Six common defect types were selected from factory production (big shavings, dust spots, glue spots, indentations, scratches, and sand leakages (as shown in Figure 3)) to create the original detection model data set, totaling 1500 images. Corresponding 256 × 256-pixel images were made using the resize method with a scale factor of ×4. This produced 1500 pairs of high-resolution and low-resolution image sets. The low-resolution images were randomly divided into training and testing sets at a 7:3 ratio for particleboard image super-resolution reconstruction, with high-resolution images used for validation. To enhance model robustness, the data set was expanded by applying data augmentation techniques including mirror symmetry, 90° rotation, and Mosaic cropping–splicing to both training and testing sets, increasing the data volume tenfold. Detailed data set parameters are shown in Table 1.

2.3. Super-Resolution Reconstruction of Particleboard Image Based on Transformer Model

As a novel deep learning model [16], Transformer features excellent self-attention mechanisms and global modeling capabilities, making it widely used in super-resolution reconstruction tasks. In super-resolution reconstruction, Transformer is primarily used for feature extraction and feature processing, achieving high-resolution image reconstruction through encoding and decoding low-resolution images [17,18]. The attention mechanism in Transformer-based image super-resolution networks better captures image details and textures, generating more realistic and clearer images, thus providing higher-quality high-resolution images [19,20].

2.3.1. Particleboard Image Super-Resolution Network Model Structure

To address the issue of low-identification of tiny defects and similar background and defect textures in particleboard images, this paper improves the Transformer network in the deep feature extraction stage, and the specific structure is shown in Figure 4. The optimization model consists of three modules: a shallow feature extraction module, a deep feature extraction module, and an image reconstruction module. In the shallow feature extraction stage, the convolution layer is used to capture the low-frequency information of the image. In the stage of depth feature extraction, the SAB (SRResNet Attention Block) module, based on the CNN and MTB (Multi-head Attention Transformer Block) modules and Transformer, are combined to effectively extract high-frequency image information. Finally, deep and shallow features are fused for image reconstruction to achieve high-quality results. As shown in Figure 4a, the deep feature extraction section consists of SAB and MTB components. As illustrated in Figure 4b, a channel attention mechanism (CAM) structure is incorporated into the SAB, maintaining high efficiency and accuracy when processing large-scale images. When the input data F 0 are a feature image of size C × H × W, they undergo both average pooling and max pooling. The channel number C is then compressed to 1/R (R = 16) through convolutional layers with the ReLU activation function, and the two data streams are combined through addition to form feature mapping. After a convolution layer and sigmoid layer processing, the value range of feature mapping can be limited between 0 and 1. This process aims to strengthen the expression of high-frequency information and weaken the expression of useless information. See Equation (1) [21] for the specific calculation formula. The output is then multiplied with the original image F 0 to obtain F 1 , restoring the feature map to C × H × W size.
F 1 = σ W 1 W 0 A v g p o o l ( F 0 ) + W 1 W 0 M a x p o o l ( F 0 )
where W 0 , W 1 —weight; σ—the Sigmoid function.
As shown in Figure 4c, the MTB module is a Transformer module embedded with Multi-head Attention (MHA) and Multi-layer Perceptron (MLP). Layer normalization is applied to the front end of each block, and the residual connection is followed by the end of each block. This module effectively captures positional information and extracts useful feature information while maintaining fast computation speed and efficiency.
Therefore, the particleboard image super-resolution reconstruction model (ours) incorporates the SAB module in the deep feature extraction module, which consists of an improved SRResNet backbone and channel attention mechanism. The convolutional neural network uses translated convolution kernels to extract image features, with closely related image pixels participating in calculations, thus effectively extracting texture features. The features extracted by CNN are then fused through Transformer, balancing local texture features with global shape information. This adaptation accommodates the large-scale variations in particleboard surface defects, facilitating feature extraction and image reconstruction.

2.3.2. Loss Function

Common loss functions include minimum absolute error ( L 1 ), mean square error loss ( L 2 ), and perceptual loss. L 1 and L 2 loss functions judge based on single indicators like noise or pixels, lacking consideration of how human visual systems perceive noise under the influence of local illumination, contrast, and structure. This can result in over-smoothed reconstructed images lacking high-frequency information, leading to blurry visual effects. However, the perceptual loss function compares feature maps obtained from convolving real images with those from generated images, capturing more image details and typically providing finer visual details and textures. In image super-resolution reconstruction, when directly comparing pixel differences, L 1 loss generally achieves higher pixel resolution and faster convergence than L 2 loss. Therefore, this paper aims for both high pixel resolution and high visual perception by using a comprehensive loss function [22], as shown in Equation (2).
L = L p e r c e p + η L 1
where η is the balance coefficient between different loss functions.
L 1 is the Mean Absolute Error (MAE), as shown in Equation (3) [23]:
L 1 = L M A E S R = 1 r 2 W H x = 1 r W y = 1 r H I x , y H R I x , y S R
where I H R —the original high-resolution image; I S R —the super-resolution reconstructed image; W —the width of the image; and H —the height of the image.
Lpercep is the perceptual loss, which aims to minimize the distance between input and target images in feature space, as shown in Equation (4) [24]:
L p e r c e p = 1 W i , j H i , j Σ x = 1 W i , j Σ y = 1 H i , j ( ϕ i , j ( I H R ) x , y ϕ i , j ( I S R ) x , y ) 2
where ϕi,j represents the feature mapping obtained after passing through the j th convolution before the i th max pooling layer in the convolutional network.

2.3.3. Evaluation Metrics

In the field of image super-resolution reconstruction, the selection of evaluation indexes is very important to comprehensively and objectively evaluate the performance of the model. In this study, we used three metrics based on reference images: peak signal-to-noise ratio (PSNR), structural similarity index (SSIM), and learned perceptual image patch similarity (LPIPS). The calculation results of these three indexes can accurately reflect the quality of the image, so as to provide a strong basis for the analysis of the model performance. PSNR is the most commonly used image quality assessment metric, expressed in decibels (dB), and is calculated by comparing pixel differences between original and processed images through the ratio of maximum pixel value to mean square error. A higher PSNR indicates better pixel quality. The SSIM is a measure used to measure the similarity of two images in brightness, contrast, and structure, with values ranging from 0 to 1. Higher SSIM values indicate less image distortion and greater similarity. LPIPS evaluates image similarity by comparing the local perceptual features between two images. It operates by using deep learning models to simulate human visual system perception of image content, assessing visual similarity between super-resolution and original high-resolution images in super-resolution reconstruction technology, thereby evaluating the algorithm’s effectiveness in enhancing image details and structure.

3. Results

In this study, all super-resolution reconstruction model training, validation, and testing were conducted under identical hardware and software conditions. This experimental programming language uses python3.10, deep learning framework torch2.2 + cuda11.8, image super-resolution reconstruction framework BasicSR1.4, and target detection library ultralytics8.3, and code modification uses vscode.
During the training process, we used the Adam optimizer and set the initial learning rate of 1 × 10⁻⁴ for the network. The entire training process covers a total of 500,000 epochs. The learning rate was halved at epochs 250,000, 400,000, 450,000, and 475,000. The feature weight parameter was set to 1, with 180 feature maps and a batch size of 4.
Upon inputting low-resolution image data of the particleboard into the trained model for reconstruction, an ultra-resolution reconstructed image of the particleboard, along with the corresponding evaluation index results, was obtained. The detailed evaluation index is presented in Table 2. The results demonstrate that our algorithm achieved notable improvements across all metrics. Compared to the traditional BICUBIC method, ESRGAN improved the PSNR by 4.88 dB, the SSIM by 0.1629, and reduced the LPIPS by 0.2548, indicating that deep learning-based super-resolution shows significant effectiveness in particleboard image reconstruction.
SwinIR, compared to ESRGAN, improved the PSNR by 7.32 dB and the SSIM by 0.0833, but increased the LPIPS by 0.1249. This indicates that the Transformer-based SwinIR method performs better than CNN-based ESRGAN in particleboard image reconstruction. SwinIR’s fusion of shallow and deep features shows excellent performance in metrics related to image noise, brightness, contrast, and structural similarity, with super-resolution image pixel values closely matching high-resolution ones. However, the increase in LPIPS by 0.1249 indicates poor visual presentation, manifesting as high pixel resolution but over-smoothed, unclear defect edges and textures.
To achieve high-quality images with clear details and edge information, our Transformer-based improved network showed slight improvements over SwinIR in the PSNR and SSIM metrics, while reducing LPIPS by 0.1317. This significant improvement in visual perception metrics is attributed to the comprehensive loss function incorporating perceptual loss, providing clearer defect edge information and refined texture details visually.
Figure 5 shows the comparison of reconstructed image results from different algorithms. As observed, deep learning-based methods produce better-quality images compared to traditional methods. Both our network and the ESRGAN network reconstruct high-resolution images with visually clear edge information. However, ESRGAN produces artifacts that appear as a film over the image, resulting in poor visual perception. While the SwinIR network produces images with high resolution, the texture is overly smoothed, which is disadvantageous for defect detection in particleboard images with high noise levels.
Our network effectively captures both deep and shallow information through the combined use of Transformer and residual network structures. By fusing this information, it obtains rich detail and texture features. Additionally, the use of a comprehensive loss function aimed at achieving both high pixel resolution and high visual perception results in high-resolution images with distinct defect edges and clear texture details, which is beneficial for improving particleboard surface defect recognition rates.

4. Discussion

The research on the super-resolution reconstruction of particleboard images is to improve surface defect recognition rates. The YOLO network demonstrates high detection accuracy, fast detection speed, and effectively avoids background misidentification, showing good performance in particleboard surface defect detection. Therefore, this paper uses the YOLO network to validate defect recognition on super-resolution images.
The low-resolution particleboard images from the test set and their corresponding super-resolution reconstructed particleboard images were, respectively, input into the pre-trained YOLOv8s model, and the P-R curves of the low-resolution and super-resolution particleboard images were obtained, as shown in Figure 6. Using low-resolution particleboard images, defect detection achieved a mAP of 70.9%, with Average Precision values of 0.592, 0.596, 0.739, 0.554, 0.918, and 0.856 for big shaving, dust spot, glue spot, scratch, sand leakage, and indentation, respectively. The average detection speed of each picture is 3.6 ms.
In comparison, defect detection using super-resolution particleboard images achieved a mAP of 96.5%, a 25.6% improvement. The Average Precision values for big shaving, dust spot, indentation, scratch, glue spot, and sand leakage were 0.936, 0.982, 0.954, 0.927, 0.995, and 0.993, respectively. The average detection speed of each picture is 11.5 ms.
Comparative analysis shows that defects such as big shaving, dust spot, and scratch, due to their color and texture features being extremely similar to the particleboard background, were poorly detected in low-resolution images due to unclear texture contours, leading to missed detections by the YOLOv8s detection model. After introducing our model, the improved image resolution, more authentic detail feature expression, and more distinct texture contours resulted in effective improvements in recognition accuracy across all defect categories when using YOLOv8s for detection.
The detection confusion matrices for low-resolution and super-resolution particleboard images are shown in Figure 7. For low-resolution images in Figure 7a, the model’s recall rates for the six defect types (big shaving, dust spot, indentation, scratch, glue spot, and sand leakage) were 0.61, 0.57, 0.83, 0.54, 0.72, and 0.90, respectively. The confusion matrix shows that defects are most easily confused with the particleboard background. Among defect types, dust spots are often confused with glue spots, and glue spots with indentations, due to unclear defect textures in low-resolution images.
For super-resolution images in Figure 7b, the recall rates improved to 0.77, 0.93, 0.95, 0.92, 1.00, and 0.99, respectively. Comparative analysis shows that confusion between different defect types almost disappeared after super-resolution reconstruction, with remaining confusion mainly between defects and the base board. Significant improvements were observed across all defect types, particularly for indentation, which showed the highest improvement. Indentations, with their subtle color differences, were previously often misidentified as scratches in low-resolution images due to only their outer contours being detected while ignoring the compressed inner area. After image reconstruction, the elongated compressed regions became clearer, with texture details distinctly different from qualified particleboard areas, improving detection accuracy.
For thin, elongated defects like scratches, which have small areas and minimal color variation, low-resolution images failed to express the corresponding defect information, leading to scratch information being eliminated and misclassified as background. Therefore, image super-resolution reconstruction was necessary to avoid such misdetections.
Our method significantly improved particleboard defect detection performance. Images processed through our super-resolution model expressed richer texture details and contour shapes, producing clearer, higher-quality images that enhanced feature differentiation among defect types, facilitating subsequent detection and recognition and improving overall particleboard defect identification effectiveness.
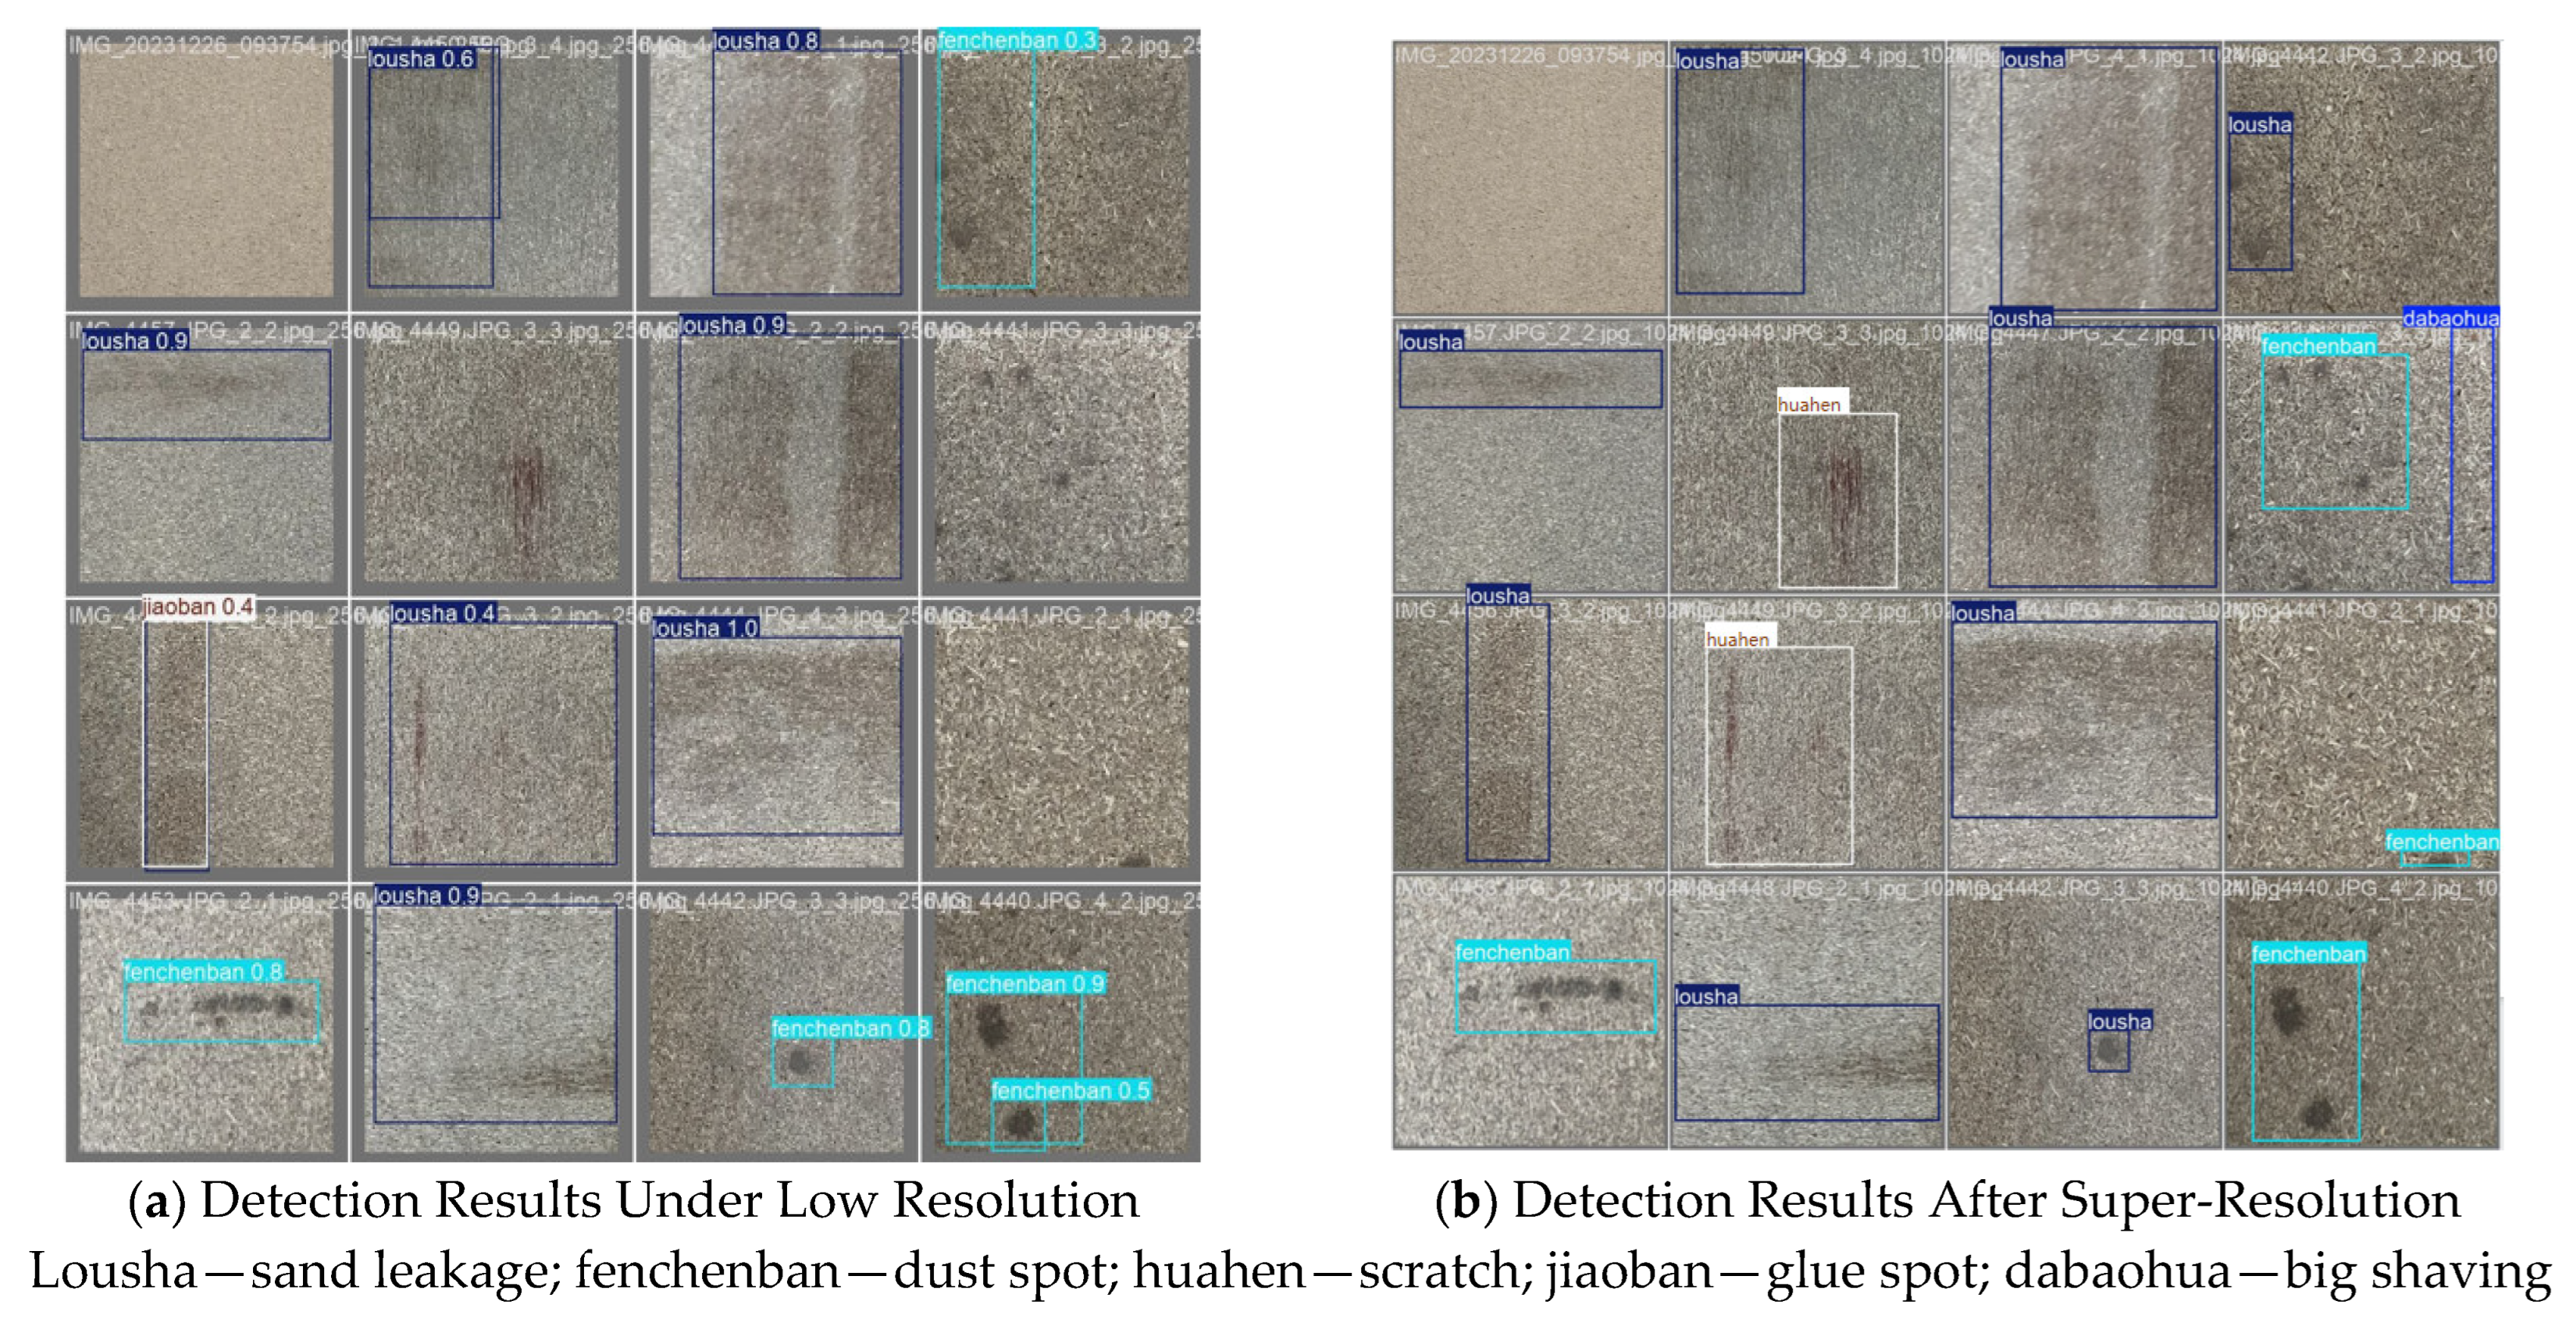
The detection results of particleboard defect images are shown in Figure 8. Figure 8a shows the results of the YOLOv8s model in the recognition of low-resolution images, while Figure 8b shows the recognition of particleboard images after super-resolution processing under the same model. By comparing the recognition results of the same image, it can be seen that in the low-resolution image, the dust spot and large particles in the second row of the fourth image were not successfully identified, and the scratch in the second row of the second image was not detected. In addition, the glue spot in the third row of the fourth image was also not identified. It is worth noting that in addition to missed detection, there are also recognition errors. The scratch in the second picture of the third line was mistaken for sand leakage in the low-resolution image.
In contrast, all these defects are correctly identified in Figure 8b. This demonstrates that under the same model, particleboard images processed through our super-resolution algorithm show clearer defects, particularly for big shaving, scratch, dust spot, and glue spot, contributing to improved overall recognition performance of the YOLOv8s model.
At the same time, this paper uses the classical Faster R-CNN, YOLOv5, and YOLOv7 algorithms to compare the defect detection experiments. Keeping the same experimental conditions, the corresponding low-resolution data set and super-resolution data set are input into the network to complete the training and testing of the model. The experimental results are shown in Table 3.
Through comparison, it is found that in the algorithm models of Faster R-CNN, YOLOv5, YOLOv7, and YOLOv8, the super-resolution data sets show excellent performance in detection. Compared with the original low-resolution data sets, the mAP index values have been improved to varying degrees, and YOLOv8 maintains the best detection performance. The above experiments prove that the image super-resolution is helpful to improve the recognition rate of the detection model.

5. Conclusions

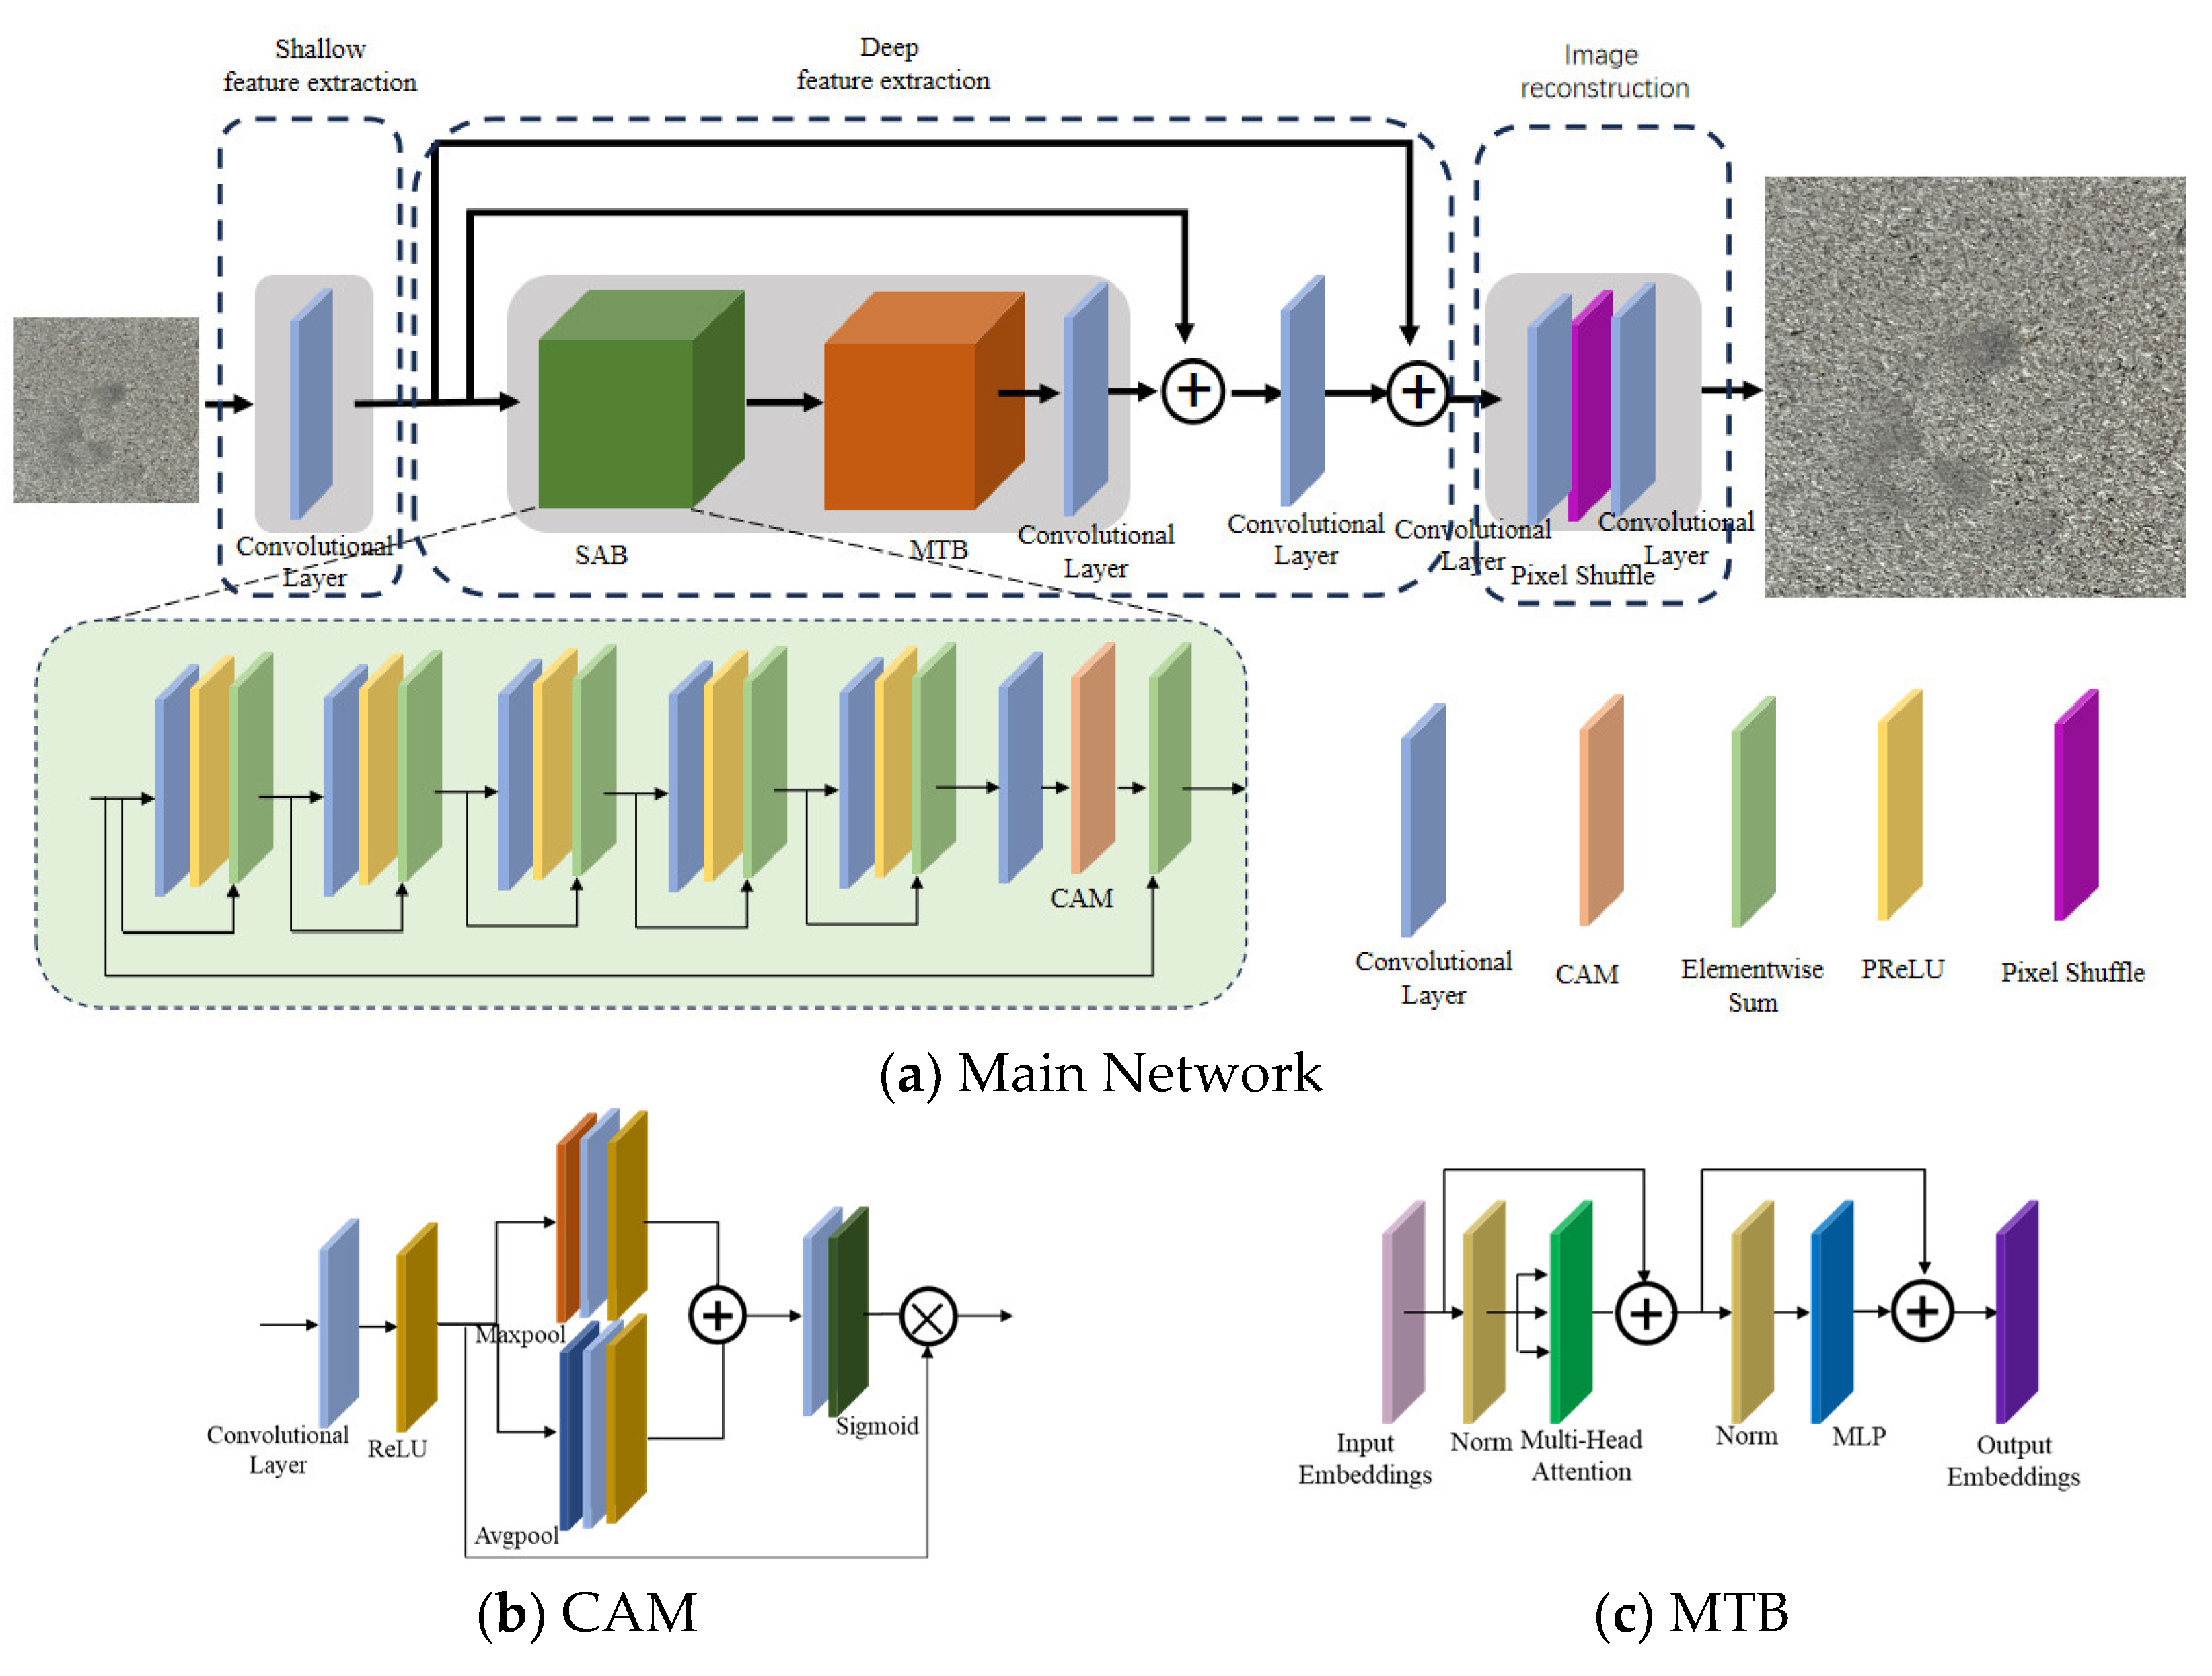
In order to improve the recognition rate of particleboard surface defects, this paper proposes an improved super-resolution reconstruction method of particleboard surface images based on a Transformer network (ours). The model introduces a deep information extraction structure combining a channel attention mechanism and residual module in the deep feature extraction module, and integrates the shallow information extracted by the translation convolution kernel through the convolutional neural network. This design can effectively take into account both local texture features and global shape information, which is helpful to deal with the surface defects of particleboard with large scale changes, so as to promote the extraction of particleboard defect features and image reconstruction.
Our network achieved a PSNR of 39.27 dB, an SSIM of 0.9169, and an LPIPS of 0.2213. When validated through the YOLOv8 recognition model, the reconstructed images achieved a defect recognition accuracy of 96.5%, which is a 25.6% improvement over non-super-resolution images. Particularly significant improvements were observed in recognizing big shaving, glue spot, and dust spot, thus verifying the effectiveness of image super-resolution reconstruction technology in improving defect recognition rates.
In future work, we will focus on improving the speed of particleboard defect recognition and detection, preparing for implementation in factory online inspection systems.

Author Contributions

Conceptualization, H.Z. and Y.L.; methodology, H.Z. and Y.L.; software, H.Z. and H.X.; validation, C.F.; formal analysis, H.Z. and H.X.; investigation, T.L.; resources, Y.Y.; data curation, H.Z. and H.X.; writing—original draft preparation, H.Z.; writing—review and editing, Y.L.; visualization, H.Z., Y.S. and W.Y.; supervision, Y.L.; project administration, Y.L.; funding acquisition, Y.L. All authors have read and agreed to the published version of the manuscript.

Funding

This work received support from the Central Financial Forestry Science and Technology Application Project (Su[2023]TG06) focusing on ‘Key Technology Application of Particleboard Appearance Quality Inspection’, and from the Postgraduate Innovation Program of Jiangsu Province (KYCX24_1293) for the study ‘Research on on-line detection system of particleboard surface defects based on deep learning’.

Data Availability Statement

The datasets presented in this article are not readily available because our research is ongoing, and data is the core of our identification technology. We are temporarily unable to make the data public.

Acknowledgments

The authors would like to express their sincere appreciation for the support they received from China Dare Wood Industrial (Jiangsu) Co., Ltd., particularly regarding experimental materials and valuable expert advice.

Conflicts of Interest

The authors declare no conflicts of interest.

References

  1. Gonçalves, F.G.; Alves, S.D.; Segundinho, P.G.d.A.; de Oliveira, R.G.E.; Paes, J.B.; Suuchi, M.A.; Chaves, I.L.S.; Quevedo, R.C.; Batista, D.C.; Lopez, Y.M.; et al. Feasibility of incorporating thermally treated lignocellulosic waste in particleboard composites. Eur. J. Wood Wood Prod. 2022, 80, 647–656. [Google Scholar] [CrossRef]
  2. Nguyen, D.L.; Luedtke, J.; Nopens, M.; Krause, A. Production of wood-based panel from recycled wood resource: A literature review. Eur. J. Wood Wood Prod. 2023, 81, 557–570. [Google Scholar] [CrossRef]
  3. Orji, B.O.; McDonald, A.G. Flow, curing and mechanical properties of thermoset resins—Wood-fiber blends for potential additive-manufacturing applications. Wood Mater. Sci. Eng. 2023, 18, 1487–1504. [Google Scholar] [CrossRef]
  4. Yang, C.; Lai, W.; Su, J.; He, W.; Gao, Z. Applied Research on Prediction Methods of Properties of Particleboard Based on Data-Driven Methods. J. Biobased Mater. Bioenergy 2021, 15, 1–9. [Google Scholar] [CrossRef]
  5. Hwang, S.-W.; Sugiyama, J. Computer vision-based wood identification and its expansion and contribution potentials in wood science: A review. Plant Methods 2021, 17, 47. [Google Scholar] [CrossRef]
  6. Wen, X.; Wang, J.; Zhang, G.; Niu, L. Three-Dimensional Morphology and Size Measurement of High-Temperature Metal Components Based on Machine Vision Technology: A Review. Sensors 2021, 21, 4680. [Google Scholar] [CrossRef]
  7. Guo, H.; Wang, X.; Liu, C.; Zhou, Y. Defect extraction method of particleboard surface image based on gray level co-occurrence matrix and hierarchical clustering. For. Sci. 2018, 54, 111–120. [Google Scholar]
  8. Zhang, C.; Wang, C.; Zhao, L.; Qu, X.; Gao, X. A method of particleboard surface defect detection and recognition based on deep learning. Wood Mater. Sci. Eng. 2018, 54, 111–120. [Google Scholar] [CrossRef]
  9. Zhao, Z.; Yang, X.; Zhou, Y.; Sun, Q.; Ge, Z.; Liu, D. Real-time detection of particleboard surface defects based on improved YOLOV5 target detection. Sci. Rep. 2021, 11, 21777. [Google Scholar] [CrossRef]
  10. Xie, C.; Zeng, W.; Lu, X. Fast Single Image Super-Resolution via Deep Network with Component Learning. IEEE Trans. Circuits Syst. Video Technol. 2018, 29, 3473–3486. [Google Scholar] [CrossRef]
  11. Xie, C.; Zhu, H.; Fei, Y. Deep coordinate attention network for single image super-resolution. IET Image Process. 2021, 16, 273–284. [Google Scholar] [CrossRef]
  12. Liang, J.; Cao, J.; Sun, G.; Zhang, K.; Van Gool, L.; Timofte, R.; Soc, I.C. SwinIR: Image Restoration Using Swin Transformer. In Proceedings of the 18th IEEE/CVF International Conference on Computer Vision (ICCV), Electr Network, Paris, France, 11–17 October 2021; pp. 1833–1844. [Google Scholar] [CrossRef]
  13. Deeba, F.; Zhou, Y.; Dharejo, F.A.; Du, Y.; Wang, X.; Kun, S. Multi-scale Single Image Super-Resolution with Remote-Sensing Application Using Transferred Wide Residual Network. Wirel. Personal. Commun. 2021, 120, 323–342. [Google Scholar] [CrossRef]
  14. Huang, Y.; Miyazaki, T.; Liu, X.; Jiang, K.; Tang, Z.; Omachi, S. Learn from orientation prior for radiograph super-resolution: Orientation operator transformer. Comput. Methods Programs Biomed. 2024, 245, 100800. [Google Scholar] [CrossRef] [PubMed]
  15. Yu, W.; Zhou, H.; Liu, Y.; Yang, Y.; Shen, Y. Super-Resolution Reconstruction of Particleboard Images Based on Improved SRGAN. Forests 2023, 14, 1842. [Google Scholar] [CrossRef]
  16. Xie, W.; Zhao, M.; Liu, Y.; Yang, D.; Huang, K.; Fan, C.; Wang, Z. Recent advances in Transformer technology for agriculture: A comprehensive survey. Eng. Appl. Artif. Intell. 2024, 138, 109412. [Google Scholar] [CrossRef]
  17. Du, W.; Tian, S. Transformer and GAN-Based Super-Resolution Reconstruction Network for Medical Images. Tsinghua Sci. Technol. 2024, 29, 197–206. [Google Scholar] [CrossRef]
  18. Ariav, I.; Cohen, I. Fully Cross-Attention Transformer for Guided Depth Super-Resolution. Sensors 2023, 23, 2723. [Google Scholar] [CrossRef]
  19. Guo, Y.; Gong, C.; Yan, J. Activated Sparsely Sub-Pixel Transformer for Remote Sensing Image Super-Resolution. Remote Sens. 2024, 16, 1895. [Google Scholar] [CrossRef]
  20. Liu, C.; Li, H.; Liang, Z.; Zhang, Y.; Yan, Y.; Zhong, R.Y.; Peng, S. A Novel Deep-Learning-Based Enhanced Texture Transformer Network for Reference Image Super-Resolution. Electronics 2022, 11, 3038. [Google Scholar] [CrossRef]
  21. Wang, Y.; Shao, Z.; Lu, T.; Liu, L.; Huang, X.; Wang, J.; Jiang, K.; Zeng, K. A lightweight distillation CNN-transformer architecture for remote sensing image super-resolution. Int. J. Digit. Earth 2023, 16, 3560–3579. [Google Scholar] [CrossRef]
  22. Zhou, H.; Liu, Y.; Liu, Z.; Zhuang, Z.; Wang, X.; Gou, B. Crack Detection Method for Engineered Bamboo Based on Super-Resolution Reconstruction and Generative Adversarial Network. Forests 2022, 13, 1896. [Google Scholar] [CrossRef]
  23. Feng, X.; Li, J.; Hua, Z. Guided filter-based multi-scale super-resolution reconstruction. Caai Trans. Intell. Technol. 2020, 5, 128–140. [Google Scholar] [CrossRef]
  24. Qin, Y.; Wang, J.; Cao, S.; Zhu, M.; Sun, J.; Hao, Z.; Jiang, X. SRBPSwin: Single-Image Super-Resolution for Remote Sensing Images Using a Global Residual Multi-Attention Hybrid Back-Projection Network Based on the Swin Transformer. Remote Sens. 2024, 16, 2252. [Google Scholar] [CrossRef]
Figure 1. Particleboard image acquisition system.
Forests 15 02196 g001
Figure 2. Full-size particleboard image (the circles in the figure are defects).
Forests 15 02196 g002
Figure 3. Defect images.
Forests 15 02196 g003
Figure 4. Particleboard image super-resolution model based on Transformer network.
Forests 15 02196 g004
Figure 5. Particleboard reconstruction image comparison.
Forests 15 02196 g005
Figure 6. P-R curves in test set.
Forests 15 02196 g006
Figure 7. Confusion matrix in test set.
Forests 15 02196 g007
Figure 8. Detection results.
Forests 15 02196 g008
Table 1. Particleboard defect detection data division.
Defect CategoriesData SetTrain Data SetTest Data Set
Big shaving31002170930
Scratch960672288
Glue spot20901463627
Dust spot348024361044
Sand leakage408028561224
Indentation1380966414
Table 2. Evaluation results of different algorithms ( indicates that the larger the value, the better; indicates that the smaller the value, the better.
AlgorithmPSNR (dB) ↑SSIM ↑LPIPS ↓
BICUBIC25.830.65170.4829
ESRGAN30.710.81460.2281
SwinIR38.030.89790.3530
Ours39.270.91690.2213
Table 3. The comparison results of defect detection algorithms.
AlgorithmData SetmAP
Faster R-CNNLow-resolution data set0.704
Super-resolution data set0.904
YOLOv5Low-resolution data set0.701
Super-resolution data set0.928
YOLOv7Low-resolution data set0.705
Super-resolution data set0.918
YOLOv8Low-resolution data set0.709
Super-resolution data set0.965
Disclaimer/Publisher’s Note: The statements, opinions and data contained in all publications are solely those of the individual author(s) and contributor(s) and not of MDPI and/or the editor(s). MDPI and/or the editor(s) disclaim responsibility for any injury to people or property resulting from any ideas, methods, instructions or products referred to in the content.

