Article

Impact of Depopulation on Forest Fires in Spain: Primary School Distribution as a Potential Socioeconomic Indicator

by
Carlos Iglesias-Merchan
1,2,*,
Jesús López-Santiago
3,
Rubén Silván-Rico
1,
Roberto San Millán-Castillo
4 and
María Teresa Gómez-Villarino
3
1
Department of Forest and Environmental Engineering and Management, Universidad Politécnica de Madrid, Calle José Antonio Nováis, 10, 28040 Madrid, Spain
2
Centro de I+D+i para la Conservación de la Biodiversidad y el Desarrollo Sostenible (CBDS), ETSI Montes, Forestal y del Medio Natural, Universidad Politécnica de Madrid, Calle José Antonio Nováis, 10, 28040 Madrid, Spain
3
Agroforestry Engineering Department, School of Agricultural, Food and Biosystems Engineering, Universidad Politécnica de Madrid, 28040 Madrid, Spain
4
Department of Signal Theory and Communications, Universidad Rey Juan Carlos (URJC), Camino del Molino, s/n, 28943 Fuenlabrada, Spain
*
Author to whom correspondence should be addressed.
Forests 2024, 15(11), 1938; https://doi.org/10.3390/f15111938
Submission received: 8 September 2024 / Revised: 16 October 2024 / Accepted: 27 October 2024 / Published: 4 November 2024

Abstract

:
Socioeconomic factors are increasingly considered in the study of forest fires. However, there is a gap in the literature on the possible relationship between basic services and infrastructures such as small rural schools and forest fires. Population decline in rural areas is leading to an increase in forest fire risk and social vulnerability to forest fires due to the abandonment of traditional agroforestry practices and the expansion of unmanaged forest canopy. In addition, rural schools are supposed to make rural municipalities livable and promote the people’s sense of community. In parallel, there is controversy over the closure of small local schools in sparsely populated rural areas worldwide. Our study identified that the forest area burned in the province of Avila (Central Spain), during the period 1996 to 2023, was higher in municipalities without rural primary schools. The presence of rural schools was as statistically significant as the influence of orographic variations of the territory, the number of incipient fires, and the reduction of population density during the same period. Our work contributes to highlighting the potential links between the decline of essential services in rural areas and the increase in forest fire risk, to urge policymakers to take a collaborative and holistic view.

Graphical Abstract

1. Introduction

Thousands of wildfires are registered every year worldwide [1,2], and the extreme behavior of fires has exceeded firefighting services capacities on many occasions in recent years [3]. Wildfires are complex phenomena linked to land management, local culture, and global warming, driven by the growing climate crisis, which triggers a set of consequences affecting the environment and everything from human health to biodiversity [4,5], with rural communities being especially vulnerable (Graus et al., 2024). Recent research on catastrophic wildland fires in the last decades in different regions of the world coincide in linking the frequency and exacerbation of fires with rural depopulation and abandonment of agricultural and forestry uses of the territory [6,7]. Among wildland fires, forest fires are considered one of the most dangerous hazards to the environment around the world [8]. In this sense, the European Union (EU) rural policies are considered a major driver of landscape change over time in Europe, in particular in rural landscapes in Southern Europe, which have become increasingly exposed to forest fires in recent decades [9].
The European Mediterranean region is considered a highly populated and a high fire risk area with nearly 200 million people living in just five countries (France, Italy, Greece, Portugal, and Spain) [10]. Forest fires in the Mediterranean region have historically had a human cause [11,12], which reduced the number of fires caused by lightning or other factors of natural origin to a smaller number. However, there is currently a growing concern about the evolution of their regime and characteristics. Among other factors, the progressive abandonment of traditional rural activities and the depopulation of rural areas are becoming increasingly important [13,14,15,16], since their effects on land use can influence both the prevention and suppression of forest fires [9]. Thus, the increase in the number of fires, concentrated in southern European countries, is associated with the socioeconomic changes of recent decades: depopulation of rural areas and concentration of population in urban areas [17,18,19]. For a long time, the demographic evolution in Europe has faced important differences by countries and inside them [20]: large congested cities and depopulated rural areas, with strong internal imbalances and in serious population decline [21,22].
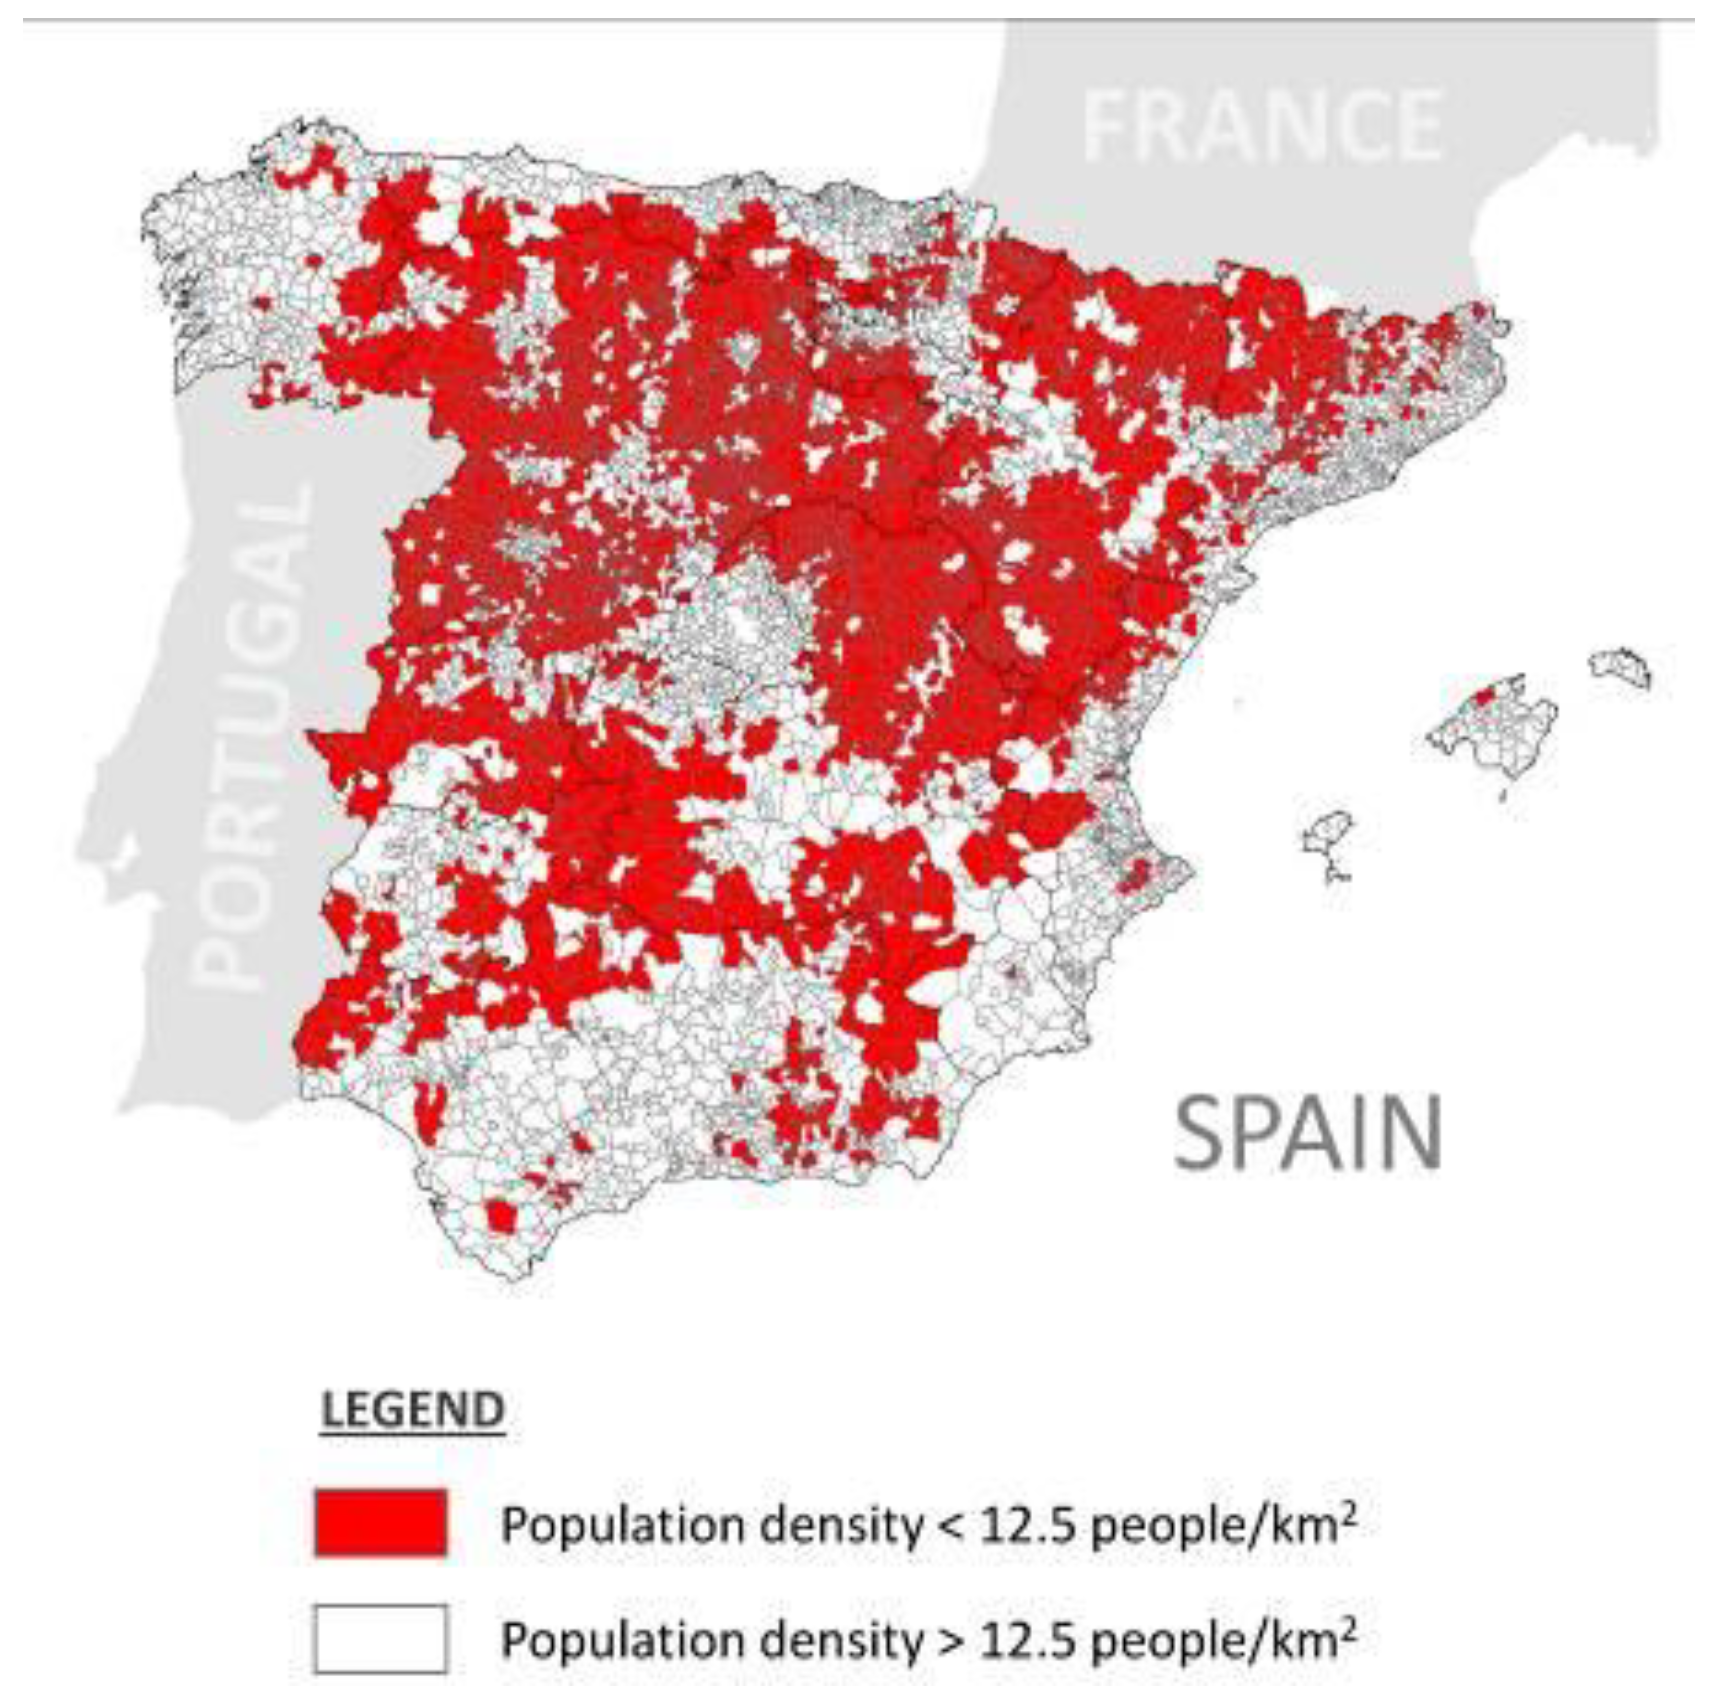
Widespread depopulation of rural areas over the past decades in Spain has led to the encroachment of shrubs and trees on former farmland. In addition, the expanding forests are now denser than before because fewer trees are logged and livestock no longer roam freely [23]. Gallardo et al. [24] found a relationship with the expansion of forests where, additionally, overlapping processes of afforestation and reforestation programs have occurred. Currently, sparsely populated areas, i.e., with less than 12.5 inhabitants per square kilometer, occupy approximately 49% of the territory (Figure 1), where only 2.7% of the population lives, while 80% of the population is concentrated in urban areas, which account for only 20% of the territory [25]. This fact has coined the expression ‘The emptied Spain’ which includes rural municipalities, mainly in the Autonomous Communities of Extremadura, Castilla la Mancha, Castilla y León, Aragón, Galicia, Asturias, and, to a lesser extent, others, where the population is very low and has decreased in recent years. The seriousness of this situation, which will continue to intensify, has become an environmental problem [26]. Indeed, changes in forest management due to other policies’ influence and rural depopulation may be more relevant for fire activity than changes in climate change [27]. Better coordination between the different administrations is needed, reorienting their actions toward more integrated and sustainable territorial and social development strategies [28].
For some years now, several researchers have been stressing the need to include socioecological approaches to deal with forest fire management, including social vulnerability to fires [13,29,30,31]. Because prevention and firefighting may require a multisector vision and implementation of novel solutions, decisionmakers may be required to shift towards a collaborative and holistic vision [32,33]. In this sense, the literature points out the influence of some social factors influencing forest fires such as the age of population groups, housing typology, roads, and other infrastructure density, or economic and educational level [34,35,36]. Surprisingly, to our knowledge, the possible relationship with the existence of some basic services in rural areas such as primary schools has not been yet studied, despite its presence in the territory is given or influences other socioeconomic variables [37,38] potentially linked to forest fire risk increase and social vulnerability to forest fires [29,31,35,36]. The closure of small rural schools is becoming a matter of concern throughout Europe and many other regions worldwide [38,39,40,41,42,43,44]. Schools are considered necessary for a municipality, as their closure may lead to the loss of function and stability of the community [38,44], and entails the use of daily transport for children, which leads to children and young people leaving their localities and going to more populated localities.
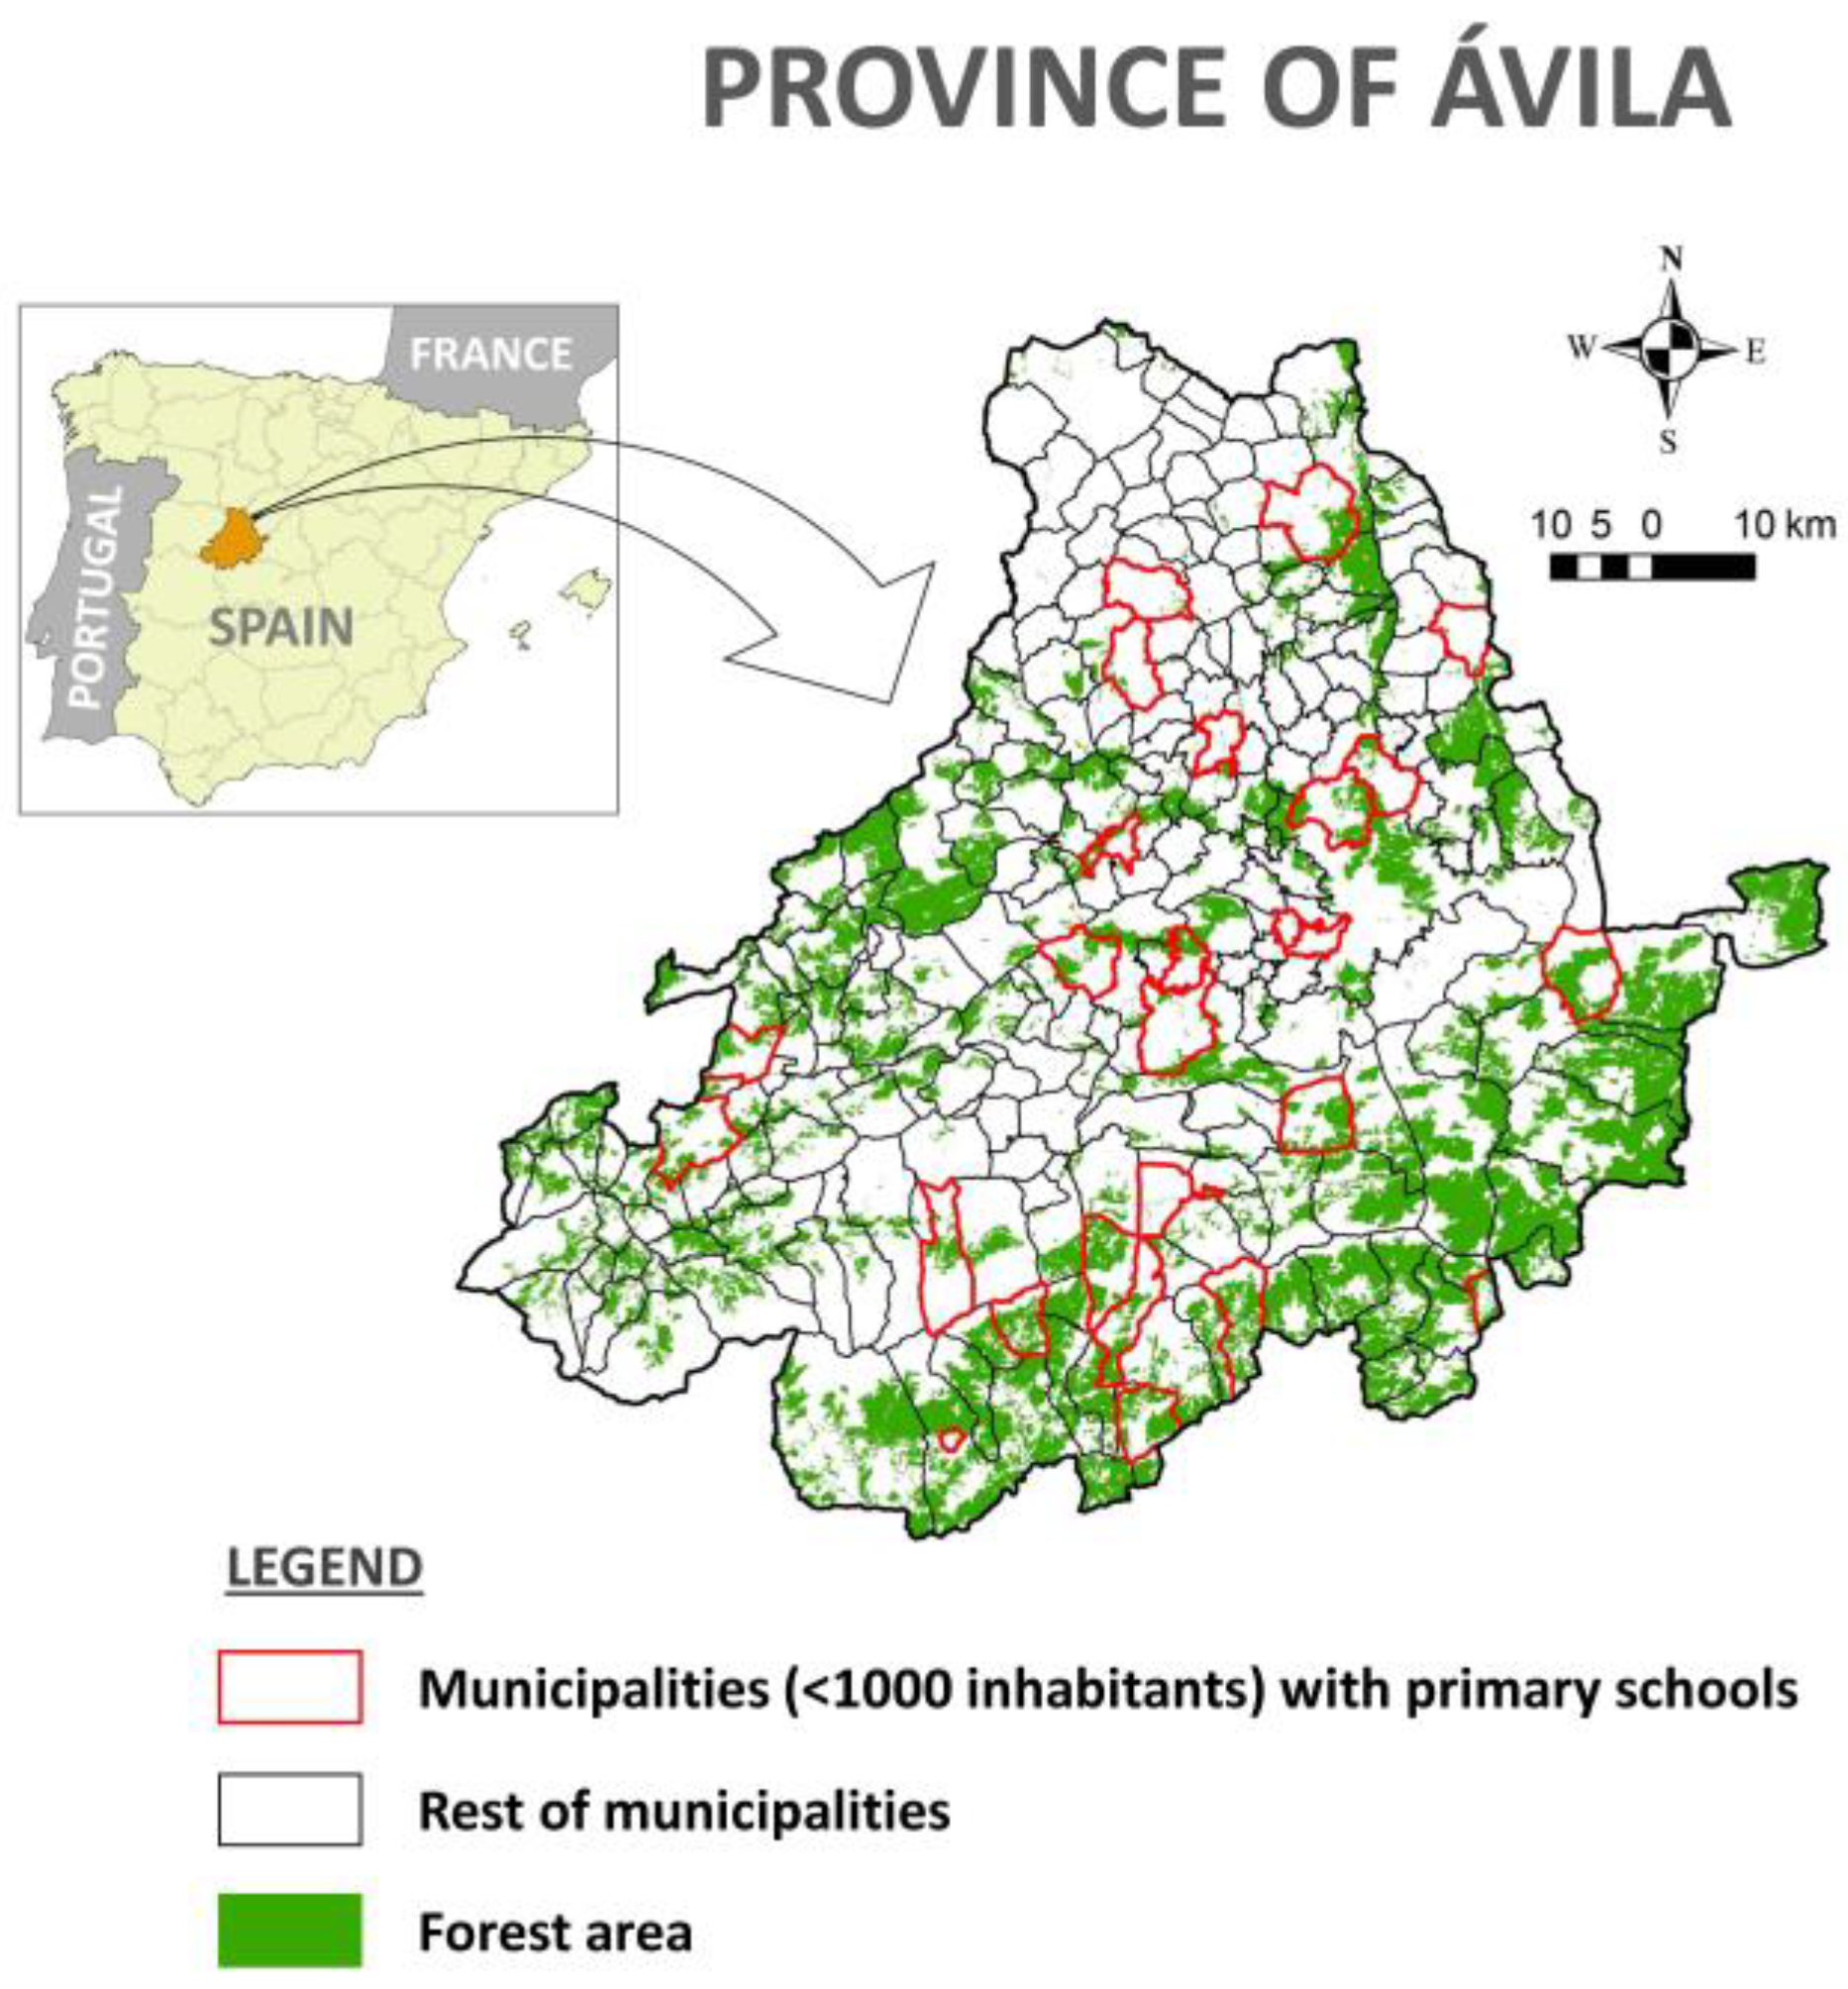
This paper aims to explore a potential relationship between the distribution of primary schools and forest fires in rural areas. Our main hypothesis is that the presence of rural schools could be an indirect indicator of non-measurable symbolic aspects of the social dynamism of a municipality [45,46,47] that, perhaps, are not reflected in other socioeconomic factors more frequently considered (e.g., mean age, unemployment rate, economic activities) in forest fires research. Our research focuses on the province of Ávila (autonomous community of Castilla y León), as it is one of the inland provinces of Spain affected by depopulation processes and where more forest fires are recorded year after year. A large portion of the large fires in the Central System are registered in this province, which constitute one of the worst environmental and economic threats to rural communities [48,49].

2. Materials and Methods

2.1. Study Area and Context

This study evaluates the possible relationship between the historical distribution of forest fires and the territorial distribution of educational centers in the province of Ávila (Autonomous Community of Castilla y León, in Central Spain) amongst other indicators of demography and traditional economic, social, etc., dynamics of the rural population. Ávila is the province with the highest average altitude in Spain (1131 m on average). Its topography is defined by a fundamentally flat orography in the northern half of the province and by the mountains of the Central System in the southern half. Slightly more than 80% of the province’s surface is classified as high-risk for forest fires by the Regional Forest Administration [50]. Ávila is affected by forest fires year after year and, although fires are mainly concentrated in summer, they also occur in winter. In this sense, the dynamics of forest progression representative of the second and third generations of forest fires imply a homogenization of the landscape and an increase in susceptibility to fire risk, related to the extent and severity of forest fires [49]. Ávila is neighboring to the Autonomous Community of Madrid, and mountainous areas surrounding the cities of Madrid and Ávila offer the development of second homes which form urban–forest interface areas with a noticeably low level of forest management [49]. The so-called wildland–urban interface areas are sometimes defined as landscapes where anthropogenic land use and uncontrolled growth of forest fuel mass come into contact and increase the probability of fire hazard [51].
The province has an area of 8050 km2 and 158,000 inhabitants in total. The average density is 19.6 people/km2, but is reduced to 12.4 people/km2 if we do not consider the population of Ávila city (58,000 inhabitants). The province has 248 municipalities. However, there are only 5 municipalities with more than 5000 inhabitants, including the capital city of Ávila (58,000 inhabitants) and 13 others with more than 1000 inhabitants. In the entire province, there are only 26 municipalities with less than 1000 inhabitants that have, at least, a primary school (Figure 2), of which 23 correspond to grouped rural elementary schools (GRESs). GRESs may sometimes adopt smaller class sizes organized in mixed-age groups as a strategy to keep schools open, and the least populated of these municipalities has about 70 inhabitants.

2.2. Fire Data and Driving Factors

2.2.1. Fire Data (Period 1996–2023)

To characterize the number of fires and burned area for each municipality throughout the province, official statistics published by the regional government of Castilla y León for the period 2019 to 2023 [52] and the Spanish government for the period 1996 to 2015 [53] were used. It was not possible to obtain official data for three years (2016 to 2018). The following variables were used as indicators of the fires that occurred during the period 1996–2015.
  • CONATUS: indicates the number of incipient fires started in each municipality during the studied period. CONATUS is defined as a fire with a total area of less than 1 ha.
  • FIREA: indicates the forested area affected by fires (in hectares) within each Municipality for the period between 1996 and 2023, regardless of whether the fire started in fields, pastures, scrubland, or in the forest itself.

2.2.2. Demographic Data (Period 1996–2023)

Official population data (Excel files) referring to revision of municipal register on 1 January for each year were downloaded from the Spanish Statistical Office (SSO) website (www.ine.es/en/ last accessed on 08/10/2024). We initially used the data corresponding to the first and last year of the period and considered the following variables:
(A)
Population
  • POP23: number of people (men and women) registered in the municipal census as of 1 January 2023, according to the SSO.
  • POP96: number of people (men and women) registered in the municipal census as of 1 January 1996, according to the SSO.
  • DIFPOP: difference in the number of people (men and women) recorded in the municipal census between 1 January 2023, and 1 January 1996, according to the SSO.
  • DENS23: population density (people/km2) of each municipality for the year 2023.
  • DENS96: population density (people/km2) of each municipality for the year 1996.
  • DIFDENS: difference in population density (people/km2) recorded in the municipal census between 1 January 2023, and 1 January 1996, according to the SSO.
(B)
Age structure (according to the municipal census as of 1 January 2023. Source: SSO)
  • AGE00–09: number of people (men and women) registered in the age group 0 to 9 years old.
  • AGE10–19: number of people (men and women) registered in the age group 10 to 19 years old.
  • AGE20–29: number of people (men and women) registered in the age group 20 to 29 years old.
  • AGE30–39: number of people (men and women) registered in the age group 30 to 39 years old.
  • AGE40–49: number of people (men and women) registered in the age group 40 to 49 years old.
  • AGE50–59: number of people (men and women) registered in the age group 50 to 59 years old.
  • AGE60–69: number of people (men and women) registered in the age group 60 to 69 years old.
  • AGE70–79: number of people (men and women) registered in the age group 70 to 79 years old.
  • AGE80–89: number of people (men and women) registered in the age group 80 to 89 years old.
  • AGE90+: number of people (men and women) of 90 years old and above.
  • MEAGE: the average age (mean age) of the population registered in each municipality.
A preliminary analysis of correlation was carried out to find out the multi-collinearity between demographic variables (Table 1 and Table 2). As data were not normally distributed (Kolmogorov–Smirnov test) (Appendix A), the nonparametric Kendall’s tau-b (Tb) correlation coefficient was used, which is considered a nonparametric alternative to the Pearson’s correlation test when data fail one or more of the assumptions of this test [54]. Therefore, POP96, DIFDENS, AGE50–59, and MEAGE were selected as demographic variables for the following analysis on population structure and aging. It can be seen that DIFDENS allowed us to consider population changes in a variable relativized to the area of each municipality.

2.2.3. Socioeconomic and Infrastructures Data

To characterize municipal economic activity, official data from the Spanish Statistical Office (SSO) website (www.ine.es/en/ last accessed on 08/10/2024) were downloaded. Additionally, the official 1:25,000 scale digital topography maps from the National Cartography Service (https://centrodedescargas.cnig.es/ last accessed on 06/09/2024) were used to obtain the length of the road network (highways, motorways, national roads, regional roads, and other minor roads) within each municipality. In this way, the road density (ROADENS) was calculated for each municipality.
In relation to other infrastructures of interest, the means for fighting forest fires were also taken into account. Using ArcGIS Desktop 10.8.1 [55] and an official map of the regional government [56], the position of the terrestrial resources for fighting forest fires (TERRES) was georeferenced. Finally, rural primary schools (SCHOOL) were also georeferenced using ArcGIS Desktop 10.8.1 [55] and the official data available at the Regional Department of Education website [57].
  • AGRICU: number of agricultural holdings per municipality by 2020.
  • LIVESTO: number of livestock holdings per municipality by 2020.
  • UNEMPL: unemployment rate by municipality according to data from the National Employment Office as of December 2022.
  • ROADENS: road density (km of road network length/km2) for each municipality.
  • TERRES: included firefighter squads, heavy machinery holders, and wildland fire vehicles of both the regional government and the national government in the province.
  • SCHOOL: primary schools located within each municipality.

2.2.4. Orographic, Forest Cover, and Fuel Load Data

A digital elevation model (DEM) was built using ArcGIS Desktop 10.8.1 [55] to calculate the variation in altitude, ALTITU (in meters), and slopes, SLOPE (in percentage), for characterizing each municipality orography as potential influencing factors in forest fires and mobility. The DEM was based on the same 1:25,000 scale digital topography maps with 5 m contour lines.
Given that the study focused on the forested area affected by fires, the National Spanish Forest Map [58] was used to calculate the area of forest trees (FOREST) in each municipality using ArcGIS Desktop 10.8.1 [55]. The National Spanish Forest Map is the basic forestry cartography at the national level (scale 1:25,000), which shows the distribution of Spanish forest ecosystems. It is a project led by the Ministry for Ecological Transition and the Demographic Challenge (Government of Spain).
  • ALTITU: amplitude or range of altitudes (m) represents the difference between the maximum and the minimum values of altitude (m) for each municipality.
  • SLOPE: amplitude or range of slopes (%) represents the difference between the maximum and the minimum values of slopes (%) for each municipality.
  • FOREST: tree forest canopy (ha) within each municipality.
We also considered the types of fuel model (vegetation) from the National Spanish Forest Map as another key factor in fire behavior [59], which is based on the classification proposed by Rothermel [60]. Each fuel model was assigned a hazard coefficient based on Copete et al. [61], Vélez [62], and Duane et al. [63], which depends on the flame length and propagation speed characteristic of each fuel type. Thus, we estimated a percentage of the surface area of each municipality based on the following hazard coefficients:
  • RISK5: percentage of the municipality surface area cataloged with a hazard coefficient of 5. It corresponds to a very low risk.
  • RISK6: percentage of the municipality surface area cataloged with a hazard coefficient of 6. It corresponds to a low risk.
  • RISK7: percentage of the municipality surface area cataloged with a hazard coefficient of 7. It corresponds to a moderate risk.
  • RISK8: percentage of the municipality surface area cataloged with a hazard coefficient of 8. It corresponds to a high risk.
  • RISK9: percentage of the municipality surface area cataloged with a hazard coefficient of 9. It corresponds to a severe risk.
  • RISK10: percentage of the municipality surface area cataloged with a hazard coefficient of 10. It corresponds to an extreme risk.

2.3. Data Analysis

Initially, a descriptive analysis was carried out. Since this study is approached from the point of view of a major environmental hazard related to the depopulation of rural areas, municipalities with more than 1000 inhabitants were not included in this analysis. The municipalities in the province of Ávila that do not have forest tree cover were also excluded from the analysis. Given that this study deals with the possible relationship between rural depopulation and forest fires analyzed through the distribution of primary schools, secondly, data were grouped into two categories: GROUP 1, municipalities with primary schools (SCHOOL), and GROUP 2, municipalities without SCHOOL. As data were not normally distributed (Kolmogorov–Smirnov test) (Appendix B), we used the nonparametric Mann–Whitney U test to evaluate the possible differences between the variables analyzed between the two groups. A significance level of 0.05 was considered a statistically significant difference between the compared groups, and SPSS version 29.0 [64] was used to carry out the statistical analysis.
Finally, a generalized linear model (GLM) was performed to analyze the importance of different factors on forested area affected by fires (FIREA) within each municipality. Because of the distribution of the data (high number of zero values), we used Tweedie-distribution with a log-link function for modelling [65]. Tweedie distributions are particularly useful when zeros (no observation) and positively skewed continuous FIREA data make up the dataset [66]. FIREA was used as dependent variable. We included CONATUS, POP96, DIFDENS, AGE50–59, MEAGE, AGRICU, LIVESTO, UNEMPL, ROADENS, TERRES, SLOPE, ALTITU, FOREST, RISK5, RISK6, RISK7, RISK8, RISK9, and RISK10 as potential covariates and SCHOOL as fixed factor.

3. Results

In total, 30 municipalities were excluded from the statistical analysis because they had more than 1000 inhabitants (n = 13) and/or lacked tree forest area (n = 27). The remaining 218 municipalities of the province are characterized by average values of 198 inhabitants in each municipality (SD = 198.95) and population density decreased a mean value of 4.31 people (SD = 6.84). About orography, the mean altitude of the municipalities of Ávila is 1126.8 m (SD = 249.03) and they have a range of slopes of 15.95% (SD = 13.54). On average, each municipality has a density of 0.49 km of road infrastructure per square kilometer of territory, 6.5 hectares of forest area (SD = 8.16), and 0.11 terrestrial resources for fighting forest fires (SD = 0.44). Finally, during the analyzed period, each municipality accumulated an average of 4.35 forest fires (SD = 10.29) and 31.39 hectares (SD = 190.84) of forest area were burned (Table 3). This makes an average of approximately 1.30 hectares burned per year.
However, when the average values of these variables are analyzed considering the separation into two groups of municipalities, GROUP 1, which refers to the municipalities that have SCHOOL (n = 26), and GROUP 2, which represents the municipalities that do not have SCHOOL (n = 192), some noticeable differences can be seen. On average, the villages where a SCHOOL is located have 3.3 times more inhabitants (M = 519.12, SD = 219.03) than the villages in Group 2 (M = 154.74, SD = 150.90, Table 3), and the population density decrease is almost twice as much in GROUP 1 (M = −6.85, SD = 16.21) as in GROUP 2 (M = −3.97, SD = 4.22). The average age is 5 years lower in GROUP 1 (M = 52.97, SD = 3.87), which also has a higher unemployment rate (M = 8.11, SD = 4.30) than in GROUP 2 (M = 5.75, SD = 4.30), but twice the number of agricultural holdings (M = 50.08, SD = 36.90) than in GROUP 2 (M = 25.70, SD = 19.95).
The Mann–Whitney U test showed a statistically significant difference in POP96 values (U = 477.5, p < 0.001) between both groups (Table 4), but not in DIFDENS (U = 1942.0, p = 0.066) between the years 2023 and 1996. Other statistically significant differences between GROUP 1 and GROUP 2 were found in AGE50–59 (U = 455.0, p < 0.001) and MEAGE (U = 1216.5, p < 0.001).
Road density was 24% lower in GROUP 2 municipalities, and terrestrial resources for fighting forest fires seem to be mostly located in GROUP 1 municipalities. In both cases, the difference in the distribution of these infrastructures and services was statistically significant between groups: ROADENS (U = 1541.0, p = 0.002) and TERRES (U = 2044.0, p < 0.001). Other statistically significant differences between GROUP 1 and GROUP 2 were found in AGRICU (U = 1300.5, p < 0.001) and TERRES (U = 2044.0, p < 0.001). On the other hand, the orographic variables did not show statistically significant differences between the municipalities included in GROUP 1 and those belonging to GROUP 2: ALTITU (U = 2080.0, p = 0.169) and SLOPE (U = 2010.0, p = 0.107).
In relation to forest tree cover, the average value per municipality is 41% higher in GROUP 1 (M = 8.71, SD = 7.25 vs. M = 6.18, SD = 8.26), and this difference was statistically significant as shown by the Mann–Whitney U test (U = 1854.0, p = 0.033). Differences in the number of CONATUS (U = 1832.5, p = 0.005) and the mean value of forest area burned between groups, FIREA (U = 1975.5, 
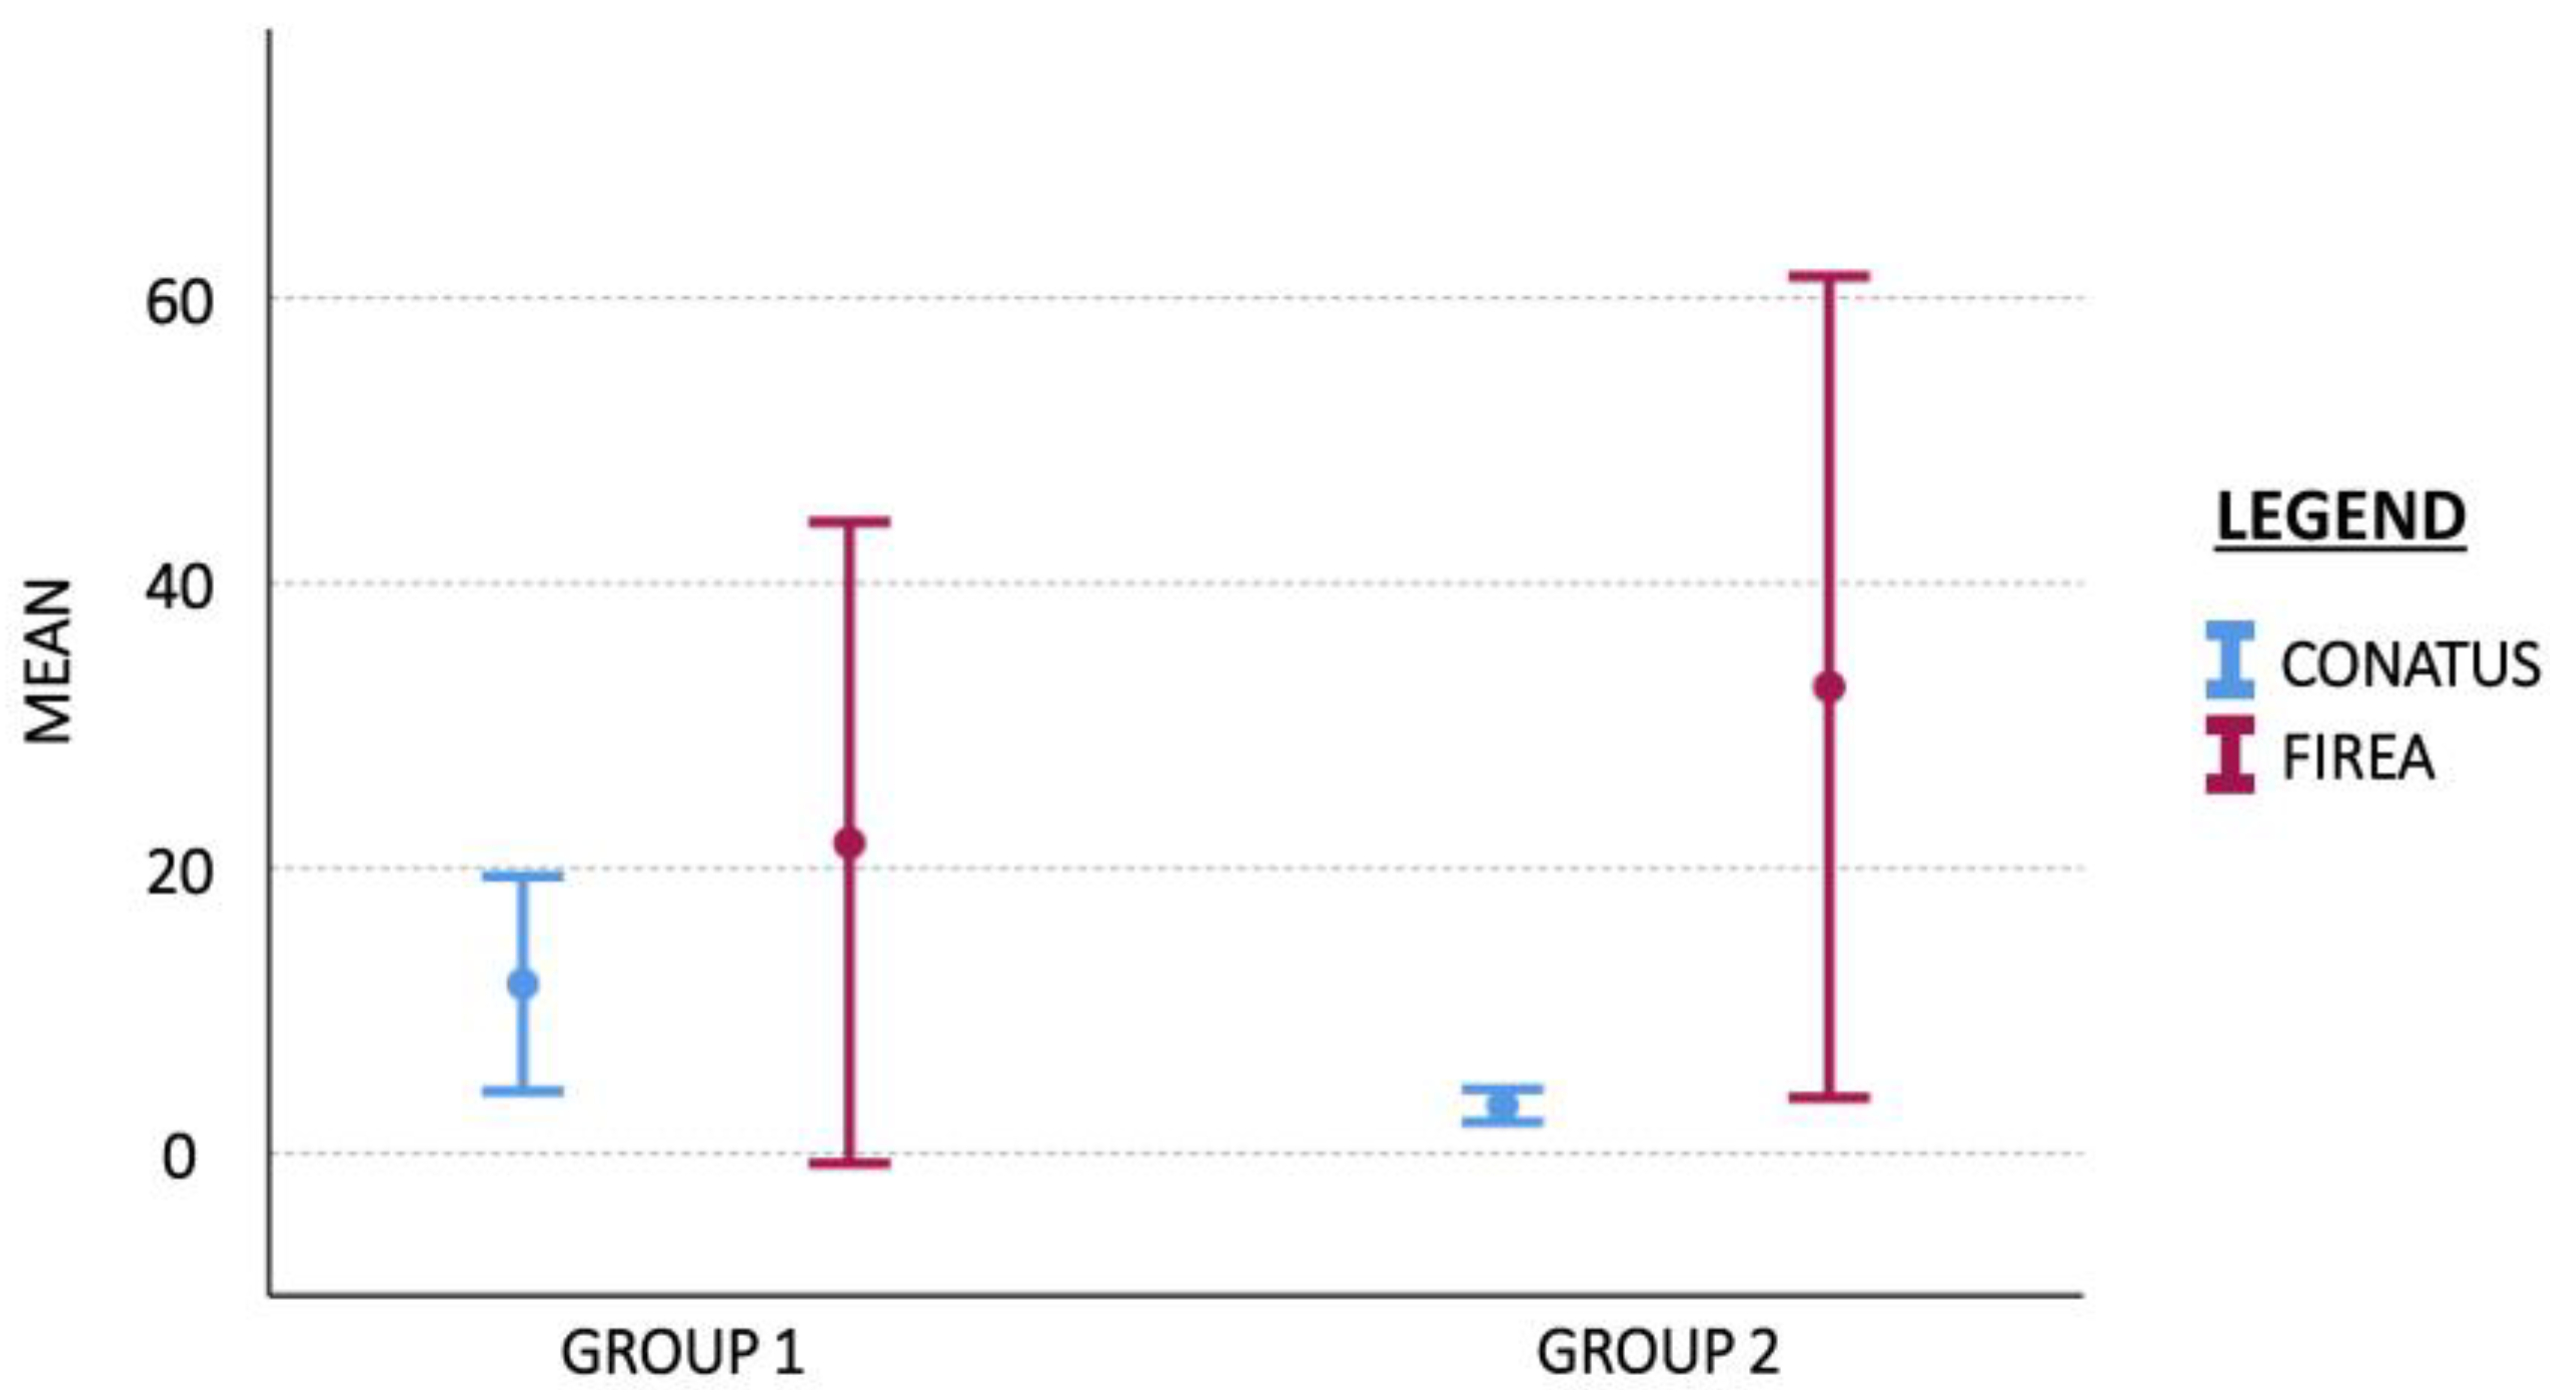
p = 0.035), were also statistically significant. The average number of CONATUS was much higher in GROUP 1 (M = 11.88, SD = 18.70) compared to GROUP 2 (M = 3.35, SD = 8.12), although the mean value of forest area burned is higher in GROUP 2 municipalities (M = 32.70, SD = 202.38) compared to municipalities in GROUP 1 (M = 21.77, SD = 55.70). In fact, the largest forest fires during the study period took place in municipalities that do not have SCHOOL (Figure 3). However, no statistically significant differences were found between the two groups and the variables that estimate fire risk (RISK5, RISK6, RISK7, RISK8, RISK9, and RISK10).
Finally, the GLM as a whole was found to be significant in explaining variations of FIREA between groups. In particular, the model showed statistically significant main effects for SCHOOL (χ2 = 13.307, p-value < 0.001), CONATUS (χ2 = 48.283, p-value < 0.001), DIFDENS (χ2 = 12.474, p-value < 0.001), and SLOPE (χ2 = 17.512, p-value < 0.001) (Table 5). In this sense, it is worth noting that FIREA was 50% higher in GROUP 2 (M = 32.70, SD = 202.38) than in GROUP 1 (M = 21.77, SD = 55.70). GROUP 1 comprises the municipalities in which there are rural schools (SCHOOL), despite the mean number of CONATUS (M = 11.88, SD = 18.70 vs. M = 3.35, SD = 8.12) being approximately 250% higher than in GROUP 2, and SLOPE also being higher than in GROUP 2 (M = 20.25, SD = 16.02 vs. M = 15.38, SD = 13.11). Depopulation speed (DIFDENS) was approximately 100% higher in GROUP 1 (M = −6.86, SD = 16.21 vs. M = −3.97, SD = 4.22). At a lower level, the model also showed statistically significant main effects for the influence of the number of inhabitants in the age group 50 to 59, AGE50–59 (χ2 = 8.822, p-value = 0.003), and terrestrial resources for fighting forest fires, TERRES (χ2 = 7.542, p-value = 0.006). The mean values of these last two variables were higher in GROUP 1 than in GROUP 2.

4. Discussion and Conclusions

Forest fires are becoming more dangerous worldwide in a combined context of climate and land use changes, which require a new approach to fire risk management [9,67,68]. This study has identified a fairly strong difference between the groups of municipalities that have SCHOOL and those that do not have SCHOOL in relation to the number of forest fires and their distribution over the province of Avila during the period between 1996 and 2023. This result seems logical considering that forest tree coverage is 50% higher in municipalities belonging to GROUP 1 (with SCHOOL), and also the number of inhabitants and their population density. It is also consistent with previous studies that suggest that fire risk increases with the presence of people, rather than their density [69]. On average, the villages with a SCHOOL have 3.3 times more inhabitants than those without rural elementary schools. As they are larger villages, they also have a better infrastructure network. It has been accepted that the presence of a road may degrade ecosystems [54,70] and increases fire ignition risk, particularly in the Mediterranean region [71,72]. Nothing new so far. However, our main finding is that the mean value of forest area burned (FIREA) was higher in municipalities without a SCHOOL, despite them showing a statistically significant lower average number of CONATUS.
This is a very interesting finding because Colonico et al. [9] suggested a relevant role of managed rural areas in mitigating fires in Italy. However, they also found a spatial mismatch between direct prevention expenditures and high-fire activity contexts. This was unlike our case, because terrestrial resources for fighting forest fires (TERRES) are mostly located in municipalities with SCHOOL, which also proved to have, on average, a larger forest area. Even though there are more CONATUS in these municipalities, it is also logical to think that a faster response and the mobilization of TERRES make it possible to fight forest fires more effectively [17], resulting in less burned area on average. This is despite the greater orographic variations in SLOPE and ALTITU that resulted in the municipalities with SCHOOL and its statistically significant effect according to the GLM analysis.
The importance of infrastructure in maintaining rural populations has been demonstrated [73], but the role of schools in determining their contribution as a cause or consequence of rural depopulation does not seem entirely clear. Previous research has not found the school to be a key factor in maintaining population, although it places an important symbolic value on its permanence or closure [47,74,75]. Some authors point out that a solid labour base and affordable housing are more important factors in maintaining rural activities than the presence or absence of an elementary school [43]. However, it seems multifactorial and probably the lack of services, together with poor transportation connections and limited employment and leisure options, are causing young people to leave these areas. In our case study, the mean age (MEAGE) of the municipalities with SCHOOL is 5 years lower, and the GLM showed a statistically significant effect of AGE50–59. Although there are more inhabitants in this age group in municipalities with SCHOOL, we observed a faster increase in depopulation processes (DIFDENS) in these municipalities. This is a reflection of the fact that the population is not fixed, even when they almost double the number of agricultural and livestock holdings. Therefore, the lack of generational replacement leads to the current transformation of landscapes and increased forest fire risk [24].
There is a positive correlation between the number of inhabitants and the existence of primary schools, as well as other public services and infrastructures (e.g., TERRES and ROADENS). It is also evidence that rural depopulation means school closures [38]. One direct consequence of the decline in rural populations is the cessation of agricultural, livestock, and forestry practices and activities associated with traditional land management. From a forestry perspective, an assessment of their potential environmental impact is essential [26], with particular consideration given to the potential for increased risk of forest fires [4]. Regarding these matters, in many countries there exists a growing controversy about the criteria for closing rural schools [45,76]. A local school is not the only thing that makes communities livable [38], but small rural schools have been found to promote social cohesion and social capital, and to contribute to the general “health of a community” [45]. Even more, Oncescu and Giles [46] demonstrated the profound effects that the closure of a rural school can have, not only in diminishing the population’s sense of community, but also in fear for the community’s future, even among residents without school-age children.
The inability to maintain economic activities in sparsely populated areas also causes higher aging rates whose environmental impact has been remarkable through the increasing number of fires in the North-Western region of Spain [30]. Many authorities in Southern Europe have turned rural areas into consumption spaces, seeking to correspond to a demand for leisure and tourism from urban populations trying to fight depopulation [77]. Nevertheless, this is not enough to keep the type of land management required to mitigate forest fire risk at a landscape scale [9]. Integrating indirect prevention measures within fire management plans could be a cost-effective approach to leverage the impact of public policies on forest fire risk management [9]. One critical need for fire management is the co-management of forest fires to “scale up” fire mitigation efforts to the landscape level by bringing and engaging together diverse stakeholders (i.e., administrations, landowners, and interest groups) to promote coordinated actions that help change current risk trends and unwanted outcomes [78].
In a context of population decline of rural areas, retaining small schools may contribute to maintaining rural community vibrancy [41,76]. It is crucial that policymakers consider the potential link between the decline of essential services in rural areas and the rising risk of forest fires, which could threaten nature conservation [71], from a holistic point of view [32,36]. In this sense, our work has highlighted the potential role of rural primary schools among the set of socioeconomic factors that higher-level policies should take into account when managing the territory to try to reduce the negative effects of natural disasters such as forest fires. Maintaining and promoting primary schools is beyond the scope of forest managers and environmental policymakers, but together with other basic services and infrastructure, can contribute to counteracting rural depopulation and safeguarding the environment. Moreover, it should not be overlooked that rurality can also be considered, in the context of human rights and social justice, as a type of diversity to be supported [41].
In relation to further research possibilities, it is worth mentioning that, for example, Ager et al. [79] found a variable influence of roads on the risk of fires in France throughout the summer season. One aspect of interest is trying to understand how the existence of SCHOOL can reflect the way in which dwellers of a municipality behave in terms of activities and land uses associated with their demographic profile [37]. New insights on this matter would require accessible data sources that include information on the exact dates of occurrence of each fire and additional details on the rest of the socioeconomic variables adjusted to the seasonal scale. Another aspect to be taken into account in future research is the potential effect of climate change. Climate change is a challenge because it may influence risk factors for forest fires [80], but also it can affect educational [81], agricultural and livestock policies [82], and rural depopulation processes [83].
This research offers a new outlook into the study of relationships between socioeconomic factors and forest fire science. Previous research relating forest fires and rural schools did so from approaches far removed from our work. For example, some researchers evaluated the importance given by elementary school teachers to forest fires or to educating the community about natural disasters and their perception of risk [84,85]. Otherwise, Espinoza et al. [86] highlighted the importance of the school as a focus of attraction for the return of many families in areas affected by natural disasters such as earthquakes, tsunamis, floods, forest fires, and volcanic eruptions that regularly affect a territory. Likewise, O’Donnell [87] noted that firefighters have home and school facilities for their families in small settlements established in the forest in Western Australia. Finally, a third line of work had to do with the effects of fires as a major source of air pollution in human health and its impact on educational development among different social groups or expenditures on school supplies [88,89].
In conclusion, our results, referring to Ávila, a province in central Spain affected by rural depopulation and a remarkable forest fire activity year after year, show statistically significant linkages between indicators of socioeconomic, environmental (i.e., fighting forest fires), and educational policies in rural territories. Therefore, decisions on the presence and distribution of rural primary schools can have an impact on the potential negative effects of forest fires in a territory and, ultimately, with consequences on our environment. Our work is not about specificities such as fire regime or ignition density analysis of forest fires in the terrain, but, from a land governance and planning point of view, it reinforces the need for greater coordination between different policies with a holistic vision and integration of criteria and resources.

Author Contributions

Conceptualization, C.I.-M. and M.T.G.-V.; methodology, C.I.-M., J.L.-S., R.S.-R., R.S.M.-C. and M.T.G.-V.; software, C.I.-M., R.S.-R., R.S.M.-C. and M.T.G.-V.; validation, C.I.-M., J.L.-S., R.S.M.-C. and M.T.G.-V.; formal analysis, C.I.-M., J.L.-S. and R.S.M.-C.; investigation, C.I.-M., R.S.-R. and M.T.G.-V.; resources, C.I.-M., J.L.-S., R.S.-R. and M.T.G.-V.; data curation, C.I.-M., J.L.-S., R.S.-R. and R.S.M.-C.; writing—original draft preparation, C.I.-M. and M.T.G.-V.; writing—review and editing, C.I.-M., J.L.-S., R.S.-R., R.S.M.-C. and M.T.G.-V.; visualization, C.I.-M. and M.T.G.-V.; supervision, C.I.-M., J.L.-S., R.S.M.-C. and M.T.G.-V.; project administration, C.I.-M.; funding acquisition, C.I.-M. All authors have read and agreed to the published version of the manuscript.

Funding

This research was carried out as part of the activities financed by the Universidad Politécnica de Madrid with funds from the Ministerio de Ciencia, Innovación y Universidades (RD 1059/2021), through the EELISA Challenges Call to introduce real challenges with a social component in the UPM’s Bachelor’s and Master’s courses (Proyecto Retos EELISA + ID28): Proyecto REDMER.

Institutional Review Board Statement

Not applicable.

Informed Consent Statement

Not applicable.

Data Availability Statement

The data that support the findings will be available in ZENODO (https://doi.org/10.5281/zenodo.13254980) following a 1-year embargo from the date of publication, as the data also forms part of an ongoing study and an ongoing Bachelor’s thesis. In the meantime, the data are available upon request to the corresponding author.

Acknowledgments

RSR acknowledges an internship grant provided by Universidad Politécnica de Madrid, carried out at the Department of Forest and Environmental Engineering and Management (UPM), and with funds from the Ministerio de Ciencia, Innovación y Universidades, through the EELISA Challenges Call (Proyecto Retos EELISA + ID28): Proyecto REDMER. Thanks are given to Rubén Laina and Javier González-Romero (Universidad Politécnica de Madrid) for their valuable help, and to Carlos de la Higuera, Ana Fernández de Casadevante, and J. Vidal García Alonso (FECOMA) for their continuous support during the REDMER project. We also thank Pablo Montoliu Zunzunegui and Rebeca López Gosling who kindly improved the English of the manuscript, and the anonymous reviewers for their valuable contribution.

Conflicts of Interest

The authors declare no conflicts of interest. The funders had no role in the design of the study; in the collection, analyses, or interpretation of data; in the writing of the manuscript; or in the decision to publish the results.

Correction Statement

This article has been republished with a minor correction to the readability of table/figure/appendix (x). This change does not affect the scientific content of the article.

Appendix A

Table A1. Preliminary tests of normality.
VariableKolmogorov–Smirnov a
StatisticdfSig.
POP230.434248<0.001
POP960.416248<0.001
DIFPOP0.395248<0.001
DENS230.329248<0.001
DENS960.287248<0.001
DIFDENS0.237248<0.001
AGE00–090.447248<0.001
AGE10–190.444248<0.001
AGE20–290.440248<0.001
AGE30–390.436248<0.001
AGE40–490.438248<0.001
AGE50–590.430248<0.001
AGE60–690.428248<0.001
AGE70–790.421248<0.001
AGE80–890.406248<0.001
AGE90+0.402248<0.001
MEAGE0.0382480.200 *
POP23, inhabitants in the municipal census as of 1 January 2023; POP96, inhabitants in the municipal census as of 1 January 1996; DIFPOP, population difference (number) recorded in the municipal census between 2023 and 1996; DENS23, population density (people/km2) of each municipality for the year 2023; DENS96, population density (people/km2) of each municipality for the year 1996; DIFDENS, difference in population density (people/km2) recorded in the municipal census between 2023 and 1996; AGE00–09, inhabitants in the age group 0 to 9; AGE10–19, inhabitants in the age group 10 to 19; AGE20–29, inhabitants in the age group 20 to 29; AGE30–39, inhabitants in the age group 30 to 39; AGE40–49, inhabitants in the age group 40 to 49; AGE50–59, inhabitants in the age group 50 to 59; AGE60–69, inhabitants in the age group 60 to 69; AGE70–79, inhabitants in the age group 70 to 79; AGE80–89, inhabitants in the age group 80 to 89; AGE90+, inhabitants of 90 years old and above; MEAGE, average age of population; statistic, the Kolmogorov–Smirnov statistic value; df, degrees of freedom; sig., significance; a, Lilliefors significance correction; *, this is a lower bound of the true significance.

Appendix B

Table A2. Tests of normality of the selected variables.
GroupKolmogorov–Smirnov a
StatisticdfSig.
FIREA00.436192<0.001
10.38426<0.001
CONATUS00.409192<0.001
10.27626<0.001
POP9600.163192<0.001
10.137260.200 *
DIFDENS00.128192<0.001
10.37526<0.001
AGE50–5900.207192<0.001
10.091260.200 *
MEAGE00.0451920.200 *
10.097260.200 *
AGRICU00.136192<0.001
10.213260.004
LIVESTO00.176192<0.001
10.130260.200 *
UNEMPL00.102192<0.001
10.137260.200 *
ROADENS00.0711920.018
10.169260.055
TERRES00.531192<0.001
10.45326<0.001
SLOPE00.152192<0.001
10.184260.024
ALTITU00.165192<0.001
10.183260.025
FOREST00.227192<0.001
10.141260.043
P_Ri500.313192<0.001
10.226260.001
P_Ri600.129192<0.001
10.129260.200 *
P_Ri700.117192<0.001
10.139260.200 *
P_Ri800.352192<0.001
10.36226<0.001
P_Ri900.255192<0.001
10.24626<0.001
P_Ri1000.355192<0.001
10.38026<0.001
FIREA, forested area burned (ha); CONATUS, number of fires started in each municipality; POP96, inhabitants in the municipal census as of 1 January 1996; DIFDENS, difference in population density (people/km2) recorded in the municipal census between 2023 and 1996; AGE50–59, number of people (men and women) registered in the age group 50 to 59 according to the municipal census as of 1 January 2023; MEAGE, average age of population according to the municipal census as of 1 January 2023; AGRICU, number of agricultural holdings per municipality by 2020; LIVESTO, number of livestock holdings per municipality by 2020; UNEMPL, unemployment rate per municipality by 2022; ROADENS, road density (km of road network length/km2) for each municipality; TERRES, terrestrial resources for fighting forest fires; SLOPE, range of slopes (%) for each municipality; ALTITU, amplitude or range of altitude (m) for each municipality; FOREST, tree forest canopy (ha) within each municipality; RISK5, percentage of the municipality surface area cataloged with a very low fire hazard; RISK6, percentage of the municipality surface area cataloged with a low fire hazard; RISK7, percentage of the municipality sur-face area cataloged with a moderate fire hazard; RISK8, percentage of the municipality surface area cataloged with a high fire hazard; RISK9, percentage of the municipality surface area cataloged with a severe fire hazard; RISK10 percentage of the municipality surface area cataloged with a extreme fire hazard; statistic, the Kolmogorov–Smirnov statistic value; df, degrees of freedom; sig., significance; a, Lilliefors significance correction; *, this is a lower bound of the true significance.

References

  1. Gill, A.M.; Stephens, S.L.; Cary, G.J. The worldwide “wildfire” problem. Ecol. Appl. 2013, 23, 438–454. [Google Scholar] [CrossRef] [PubMed]
  2. Tedim, F.; Leone, V.; Amraoui, M.; Bouillon, C.; Coughlan, M.R.; Delogu, G.M.; Fernandes, P.M.; Ferreira, C.; McCaffrey, S.; McGee, T.K.; et al. Defining Extreme Wildfire Events: Difficulties, Challenges, and Impacts. Fire 2018, 1, 9. [Google Scholar] [CrossRef]
  3. Castellnou, M.; Prat-Guitart, N.; Arilla, E.; Larrañaga, A.; Nebot, E.; Castellarnau, X.; Vendrell, J.; Pallàs, J.; Herrera, J.; Monturiol, M.; et al. Empowering strategic decision-making for wildfire management: Avoiding the fear trap and creating a resilient landscape. Fire Ecol. 2019, 15, s42408-019-0048-6. [Google Scholar] [CrossRef]
  4. Harper, A.R.; Doerr, S.H.; Santin, C.; Froyd, C.A.; Sinnadurai, P. Prescribed fire and its impacts on ecosystem services in the UK. Sci. Total Environ. 2018, 624, 691–703. [Google Scholar] [CrossRef] [PubMed]
  5. San-Miguel-Ayanz, J.; Durrant, T.; Boca, R.; Libertà, G.; Branco, A.; de Rigo, D.; Ferrari, D.; Maianti, P.; Artés Vivancos, T.; Costa, H.; et al. Forest Fires in Europe, Middle East and North Africa 2017; European Commission. Publications Office. Joint Research Centre: Luxembourg, 2018; Available online: https://data.europa.eu/doi/10.2760/663443 (accessed on 4 August 2024).
  6. Nefedova, T. The 2010 Catastrophic Forest Fires in Russia: Consequence of Rural Depopulation? In The Demography of Disasters: Impacts for Population and Place; Karácsonyi, D., Taylor, A., Bird, D., Eds.; Springer International Publishing: Cham, Switzerland, 2021; pp. 71–80. ISBN 978-3-030-49919-8. Available online: https://link.springer.com/10.1007/978-3-030-49920-4 (accessed on 4 August 2024).
  7. Uriarte, M.; Pinedo-Vasquez, M.; DeFries, R.S.; Fernandes, K.; Gutierrez-Velez, V.; Baethgen, W.E.; Padoch, C. Depopulation of rural landscapes exacerbates fire activity in the western Amazon. Proc. Natl. Acad. Sci. USA 2012, 109, 21546–21550. [Google Scholar] [CrossRef]
  8. Mandallaz, D.; Ye, R. Prediction of forest fires with Poisson models. Can. J. For. Res. 1997, 27, 1685–1694. [Google Scholar] [CrossRef]
  9. Colonico, M.; Tomao, A.; Ascoli, D.; Corona, P.; Giannino, F.; Moris, J.V.; Romano, R.; Salvati, L.; Barbati, A. Rural development funding and wildfire prevention: Evidences of spatial mismatches with fire activity. Land Use Policy 2022, 117, 106079. [Google Scholar] [CrossRef]
  10. San-Miguel-Ayanz, J.; Moreno, J.M.; Camia, A. Analysis of large fires in European Mediterranean landscapes: Lessons learned and perspectives. For. Ecol. Manag. 2013, 294, 11–22. [Google Scholar] [CrossRef]
  11. Hammed, R.A.; Alawode, G.L.; Montoya, L.E.; Krasovskiy, A.; Kraxner, F. Exploring Drivers of Wildfires in Spain. Land 2024, 13, 762. [Google Scholar] [CrossRef]
  12. Vilar, L.; Camia, A.; San-Miguel-Ayanz, J. Modelling socio-economic drivers of forest fires in the Mediterranean Europe. In Proceedings of the VII International Conference on Forest Fire Research, Coimbra, Portugal, 17–20 November 2014; ISBN 978-989-26-0884-6. [Google Scholar]
  13. de Diego, J.; Fernández, M.; Rúa, A.; Kline, J.D. Examining socioeconomic factors associated with wildfire occurrence and burned area in Galicia (Spain) using spatial and temporal data. Fire Ecol. 2023, 19, 18. [Google Scholar] [CrossRef]
  14. Graus, S.; Ferreira, T.M.; Vasconcelos, G.; Ortega, J. Changing Conditions: Global Warming-Related Hazards and Vulnerable Rural Populations in Mediterranean Europe. Urban Sci. 2024, 8, 42. [Google Scholar] [CrossRef]
  15. Molinero Hernando, F.; Guerra Velasco, J.C.; de Cascos Maraña, C.S. La dinámica de los incendios forestales en Castilla y León como resultado del abandono y la despoblación durante el último cuarto de siglo. In Proceedings of the Investigando en Rural, XVI Coloquio de Geografía Rural, Sevilla, Spain, 10–12 May 2012; pp. 473–482. Available online: https://dialnet.unirioja.es/servlet/articulo?codigo=6121457 (accessed on 29 July 2024).
  16. Ubeda, X.; Mataix-Solera, J.; Francos, M.; Farguell, J. Grandes incendios forestales en España y alteraciones de su régimen en las últimas décadas. In Geografia, Riscos e Proteção Civil. Homenagem ao Professor doutor Luciano Lourenço; RISCOS—Associação Portuguesa de Riscos, Prevenção e Segurança: Vilarinho, Portugal, 2021; pp. 147–161. ISBN 978-989-9053-05-2. [Google Scholar]
  17. Mancini, L.D.; Elia, M.; Barbati, A.; Salvati, L.; Corona, P.; Lafortezza, R.; Sanesi, G. Are Wildfires Knocking on the Built-Up Areas Door? Forests 2018, 9, 234. [Google Scholar] [CrossRef]
  18. Muñoz, R.V. Cambio global e incendios forestales: Perspectivas en la Europa Meridional. Recur. Rurais 2009, 5, 49–54. [Google Scholar] [CrossRef]
  19. Pausas, J.G.; Fernández-Muñoz, S. Fire regime changes in the Western Mediterranean Basin: From fuel-limited to drought-driven fire regime. Clim. Chang. 2012, 110, 215–226. [Google Scholar] [CrossRef]
  20. Cuadrado-Roura, J.R. Population imbalances in Europe. Urban concentration versus rural depopulation. Reg. Sci. Policy Pract. 2023, 15, 713–716. [Google Scholar] [CrossRef]
  21. Alonso-Carrillo, I.; Perez-Morote, R.; Nunez-Chicharro, M.; Pontones-Rosa, C. Do citizens in Spanish municipalities have the same perception of the solution to depopulation? Influence of population size. Cities 2023, 135, 104210. [Google Scholar] [CrossRef]
  22. Gómez-Villarino, T.; Gómez-Orea, D. Despoblación rural extrema en España: Enfoque territorial del problema y de la forma de afrontarlo. Ciudad Territ. Estud. Territ. 2021, 53, 905–922. [Google Scholar] [CrossRef]
  23. Martínez-Abraín, A.; Jiménez, J.; Jiménez, I.; Ferrer, X.; Llaneza, L.; Ferrer, M.; Palomero, G.; Ballesteros, F.; Galán, P.; Oro, D. Ecological consequences of human depopulation of rural areas on wildlife: A unifying perspective. Biol. Conserv. 2020, 252, 108860. [Google Scholar] [CrossRef]
  24. Gallardo, M.; Fernández-Portela, J.; Cocero, D.; Vilar, L. Land Use and Land Cover Changes in Depopulated Areas of Mediterranean Europe: A Case Study in Two Inland Provinces of Spain. Land 2023, 12, 1967. [Google Scholar] [CrossRef]
  25. INE. INEbase/Demografía y Población /Padrón /Cifras Oficiales de Población de Los Municipios Españoles: Revisión del Padrón Municipal/Resultados [Internet]. INE. 2024. Available online: https://www.ine.es/dyngs/INEbase/es/operacion.htm?c=Estadistica_C&cid=1254736177011&menu=resultados&idp=1254734710990 (accessed on 29 July 2024).
  26. Bruno, D.; Sorando, R.; Álvarez-Farizo, B.; Castellano, C.; Céspedes, V.; Gallardo, B.; Jiménez, J.J.; López, M.V.; López-Flores, R.; Moret-Fernández, D.; et al. Depopulation impacts on ecosystem services in Mediterranean rural areas. Ecosyst. Serv. 2021, 52, 101369. [Google Scholar] [CrossRef]
  27. Pausas, J.G.; Keeley, J.E. Wildfires and global change. Front. Ecol. Environ. 2021, 19, 387–395. [Google Scholar] [CrossRef]
  28. Martínez-Carrasco Pleite, F.; Colino Sueiras, J. Rural Depopulation in Spain: A Delphi Analysis on the Need for the Reorientation of Public Policies. Agriculture 2024, 14, 295. [Google Scholar] [CrossRef]
  29. De Diego, J.; Rúa, A.; Fernández, M. Designing a Model to Display the Relation between Social Vulnerability and Anthropogenic Risk of Wildfires in Galicia, Spain. Urban Sci. 2019, 3, 32. [Google Scholar] [CrossRef]
  30. Ghorbanzadeh, O.; Blaschke, T.; Gholamnia, K.; Aryal, J. Forest Fire Susceptibility and Risk Mapping Using Social/Infrastructural Vulnerability and Environmental Variables. Fire 2019, 2, 50. [Google Scholar] [CrossRef]
  31. Zhang, T.; Wang, D.; Lu, Y. A Dynamic Spatiotemporal Understanding of Changes in Social Vulnerability to Wildfires at Local Scale. Fire 2024, 7, 251. [Google Scholar] [CrossRef]
  32. Abreu, S.J.D. Toward a Holistic Approach: Considerations for Improved Collaboration in Wildfire Management. Open J. For. 2021, 12, 107–121. [Google Scholar] [CrossRef]
  33. Moreira, F.; Ascoli, D.; Safford, H.; Adams, M.A.; Moreno, J.M.; Pereira, J.M.C.; Catry, F.X.; Armesto, J.; Bond, W.; González, M.E.; et al. Wildfire management in Mediterranean-type regions: Paradigm change needed. Environ. Res. Lett. 2020, 15, 011001. [Google Scholar] [CrossRef]
  34. Wang, X.; Zhao, H.; Zhang, Z.; Yin, Y.; Zhen, S. The Relationship between Socioeconomic Factors at Different Administrative Levels and Forest Fire Occurrence Density Using a Multilevel Model. Forests 2023, 14, 391. [Google Scholar] [CrossRef]
  35. Cardille, J.A.; Ventura, S.J.; Turner, M.G. Environmental and Social Factors Influencing Wildfires in the Upper Midwest, United States. Ecol. Appl. 2001, 11, 111–127. [Google Scholar] [CrossRef]
  36. Oliveira, S.; Zêzere, J.L.; Queirós, M.; Pereira, J.M. Assessing the social context of wildfire-affected areas. The case of mainland Portugal. Appl. Geogr. 2017, 88, 104–117. [Google Scholar] [CrossRef]
  37. Kroismayr, S. Small School Closures in Rural Areas—The Beginning or the End of a Downward Spiral? Some Evidence from Austria. In Studies in the Sociology of Population; Anson, J., Bartl, W., Kulczycki, A., Eds.; Springer International Publishing: Cham, Switzerland, 2019; pp. 275–300. ISBN 978-3-319-94868-3. Available online: http://link.springer.com/10.1007/978-3-319-94869-0_11 (accessed on 31 July 2024).
  38. Lehtonen, O. Primary school closures and population development—Is school vitality an investment in the attractiveness of the (rural) communities or not? J. Rural Stud. 2021, 82, 138–147. [Google Scholar] [CrossRef]
  39. Kearns, R.A.; Lewis, N.; McCreanor, T.; Witten, K. ‘The status quo is not an option’: Community impacts of school closure in South Taranaki, New Zealand. J. Rural Stud. 2009, 25, 131–140. [Google Scholar] [CrossRef]
  40. McSwan, D. The Rural Population Transformation and Education in Australia. Aust. Int. J. Rural Educ. 2003, 13, 3–26. [Google Scholar] [CrossRef]
  41. Haynes, M. The impacts of school closure on rural communities in Canada: A review. Rural Educ. 2022, 43, 60–74. [Google Scholar] [CrossRef]
  42. Meek, D.; Daquin, J.; Paulon Girardi, E.; Fernandes, B.M.; Sobreiro Do Filho, J.; Tarlau, R.; Vuelta, R. Race and the political ecology of education in Brazil: A spatial analysis of rural school closures. J. Polit. Ecol. 2023, 31, 2. [Google Scholar] [CrossRef]
  43. Slee, B.; Miller, D. School Closures as a Driver of Rural Decline in Scotland: A Problem in Pursuit of Some Evidence? Scott. Geogr. J. 2015, 131, 78–97. [Google Scholar] [CrossRef]
  44. Zhao, D.; Parolin, B. School mapping restructure in rural China: Achievements, problems and implications. Asia Pac. Educ. Rev. 2012, 13, 713–726. [Google Scholar] [CrossRef]
  45. Lykke Sørensen, J.F.; Haase Svendsen, G.L.; Jensen, P.S.; Schmidt, T.D. Do rural school closures lead to local population decline? J. Rural Stud. 2021, 87, 226–235. [Google Scholar] [CrossRef]
  46. Oncescu, J.M.; Giles, A. Rebuilding a Sense of Community through Reconnection: The Impact of a Rural School’s Closure on Individuals without School-Aged Children. J. Rural Community Dev. 2014, 9, 295–318. [Google Scholar]
  47. Morales-Romo, N. Cierre de las escuelas en entornos rurales ¿por o para el despoblamiento? Rev. PH 2019, 98, 20–23. [Google Scholar] [CrossRef]
  48. Kalogiannidis, S.; Chatzitheodoridis, F.; Kalfas, D.; Patitsa, C.; Papagrigoriou, A. Socio-Psychological, Economic and Environmental Effects of Forest Fires. Fire 2023, 6, 280. [Google Scholar] [CrossRef]
  49. Palacios Estremera, M.T. Fuentes documentales para el estudio de los incendios forestales en Ávila. In Proceedings of the Presencia Histórica Del Fuego en el Territorio; Ministerio de Agricultura, Alimentacin y Medio Ambiente, Centro de Publicaciones: Madrid, Spain, 2013; pp. 155–176. ISBN 978-84-491-1289-8. [Google Scholar]
  50. Mapa de Zonas de Alto Riesgo de Incendios Forestales de Castilla y León [Internet]. Junta de Castilla y León. Consejería de Medio Ambiente, Vivienda y Ordenación del Territorio. 2011. Available online: https://datosabiertos.jcyl.es/web/jcyl/set/es/medio-ambiente/zonas-alto-riesgo-incendios-forestales-cyl/1284687309640 (accessed on 3 October 2024).
  51. Modugno, S.; Balzter, H.; Cole, B.; Borrelli, P. Mapping regional patterns of large forest fires in Wildland–Urban Interface areas in Europe. J. Environ. Manage. 2016, 172, 112–126. [Google Scholar] [CrossRef] [PubMed]
  52. JCYL Incendios Forestales [Internet]. 2024. Available online: https://analisis.datosabiertos.jcyl.es/explore/dataset/incendios-forestales/information/?flg=es-es&disjunctive.provincia&disjunctive.situacion_actual (accessed on 29 July 2024).
  53. Miteco. Incendios Forestales [Internet]. Ministerio Para la Transición Ecológica y el Reto Demográfico. 2015. Available online: https://www.miteco.gob.es/es/biodiversidad/servicios/banco-datos-naturaleza/informacion-disponible/incendios-forestales.html (accessed on 29 July 2024).
  54. Ortiz-Urbina, E.; Diaz-Balteiro, L.; Iglesias-Merchan, C. Influence of Anthropogenic Noise for Predicting Cinereous Vulture Nest Distribution. Sustainability 2020, 12, 503. [Google Scholar] [CrossRef]
  55. ESRI. ArcGIS Desktop 10.8.1; Environmental Systems Research Institute (ESRI): Redlands, CA, USA, 2020. [Google Scholar]
  56. JCYL. Medios de Lucha Contra Los Incendios Forestales. Junta de Castilla y León. 2018. Available online: https://medioambiente.jcyl.es/web/es/medio-natural/incendios-forestales-medios-lucha.html (accessed on 29 July 2024).
  57. JCYL Centros Rurales Agrupados [Internet]. Junta de Castilla y León. 2024. Available online: https://www.jcyl.es/web/jcyl/Portada/es/Plantilla100DirectorioPortada/1248366924958/1279887997704/1284288974739/DirectorioPadre (accessed on 29 July 2024).
  58. MITERD. MFE de Máxima Actualidad. Castilla y León [Internet]. 2021. Available online: https://www.miteco.gob.es/es/cartografia-y-sig/ide/descargas/biodiversidad/mfe_castilla_y_leon.html (accessed on 29 July 2024).
  59. Vallejo-Villalta, I.; Rodríguez-Navas, E.; Márquez-Pérez, J. Mapping Forest Fire Risk at a Local Scale—A Case Study in Andalusia (Spain). Environments 2019, 6, 30. [Google Scholar] [CrossRef]
  60. Rothermel, R.C. A Mathematical Model for Predicting Fire Spread in Wildland Fuels; Report No.: Research paper INT-115; USDA Forest Service: Ogden, UT, USA, 1972; p. 41. [Google Scholar]
  61. Copete Carreño, M.A.; Monreal Montoya, J.A.; Selva Denia, M.; Fernández Cernuda-Migoya, L.; Jordán González, E. Incendios forestales: Mapa de riesgo potencial de incendios forestales de Castilla-La Mancha. Foresta 2011, 47, 164–167. [Google Scholar]
  62. Vélez Muñoz, R. (Ed.) La Defensa contra Incendios Forestales: Fundamentos y experiencias; McGraw Hill: Madrid, Spain, 2002; ISBN 978-84-481-2742-8. [Google Scholar]
  63. Duane, A.; Brotons, L.; Lerner, M.; Fernández, M.; Vila, B.; Chacón-Labella, J.; Pescador, D.S.; Lloret, F. Análisis de Escenarios, a Corto y Medio Plazo, Del Riesgo de Afección Por Incendios Forestales Para al Menos Veinticinco Tipos de Hábitat de Bosque y Matorral; Metodologías para el seguimiento del estado de conservación de los tipos de habitat; Ministerio para la Transición Ecológica: Madrid, Spain, 2019; 47p. [Google Scholar]
  64. IBM. IBM SPSS Statistics for Windows, Version 29.0; IBM Corp: Armonk, NY, USA, 2022. [Google Scholar]
  65. Bobrowski, M.; Gillich, B.; Stolter, C. Modelling browsing of deer on beech and birch in northern Germany. For. Ecol. Manag. 2015, 358, 212–221. [Google Scholar] [CrossRef]
  66. Shulse, C.D.; Semlitsch, R.D.; Trauth, K.M.; Williams, A.D. Influences of Design and Landscape Placement Parameters on Amphibian Abundance in Constructed Wetlands. Wetlands 2010, 30, 915–928. [Google Scholar] [CrossRef]
  67. Fonseca, M.G.; Alves, L.M.; Aguiar, A.P.D.; Arai, E.; Anderson, L.O.; Rosan, T.M.; Shimabukuro, Y.E.; De Aragão, L.E.O.E.C. Effects of climate and land-use change scenarios on fire probability during the 21st century in the Brazilian Amazon. Glob. Chang. Biol. 2019, 25, 2931–2946. [Google Scholar] [CrossRef]
  68. Wunder, S.; Calkin, D.E.; Charlton, V.; Feder, S.; Martínez De Arano, I.; Moore, P.; Rodríguez Y Silva, F.; Tacconi, L.; Vega-García, C. Resilient landscapes to prevent catastrophic forest fires: Socioeconomic insights towards a new paradigm. For. Policy Econ. 2021, 128, 102458. [Google Scholar] [CrossRef]
  69. Vukomanovic, J.; Doumas, S.; Osterkamp, W.; Orr, B. Housing Density and Ecosystem Function: Comparing the Impacts of Rural, Exurban, and Suburban Densities on Fire Hazard, Water Availability, and House and Road Distance Effects. Land 2013, 2, 656–677. [Google Scholar] [CrossRef]
  70. Iglesias-Merchan, C.; Horcajada-Sánchez, F.; Diaz-Balteiro, L.; Escribano-Ávila, G.; Lara-Romero, C.; Virgós, E.; Planillo, A.; Barja, I. A new large-scale index (AcED) for assessing traffic noise disturbance on wildlife: Stress response in a roe deer (Capreolus capreolus) population. Environ. Monit. Assess. 2018, 190, 185. [Google Scholar] [CrossRef] [PubMed]
  71. Zambon, I.; Cerdà, A.; Cudlin, P.; Serra, P.; Pili, S.; Salvati, L. Road Network and the Spatial Distribution of Wildfires in the Valencian Community (1993–2015). Agriculture 2019, 9, 100. [Google Scholar] [CrossRef]
  72. Ganteaume, A.; Camia, A.; Jappiot, M.; San-Miguel-Ayanz, J.; Long-Fournel, M.; Lampin, C. A Review of the Main Driving Factors of Forest Fire Ignition Over Europe. Environ. Manage. 2013, 51, 651–662. [Google Scholar] [CrossRef] [PubMed]
  73. Cañal-Fernández, V.; Álvarez, A. The role of infrastructures in rural depopulation. An econometric analysis. Econ. Agrar. Recur. Nat.—Agric. Resour. Econ. 2022, 22, 31–52. [Google Scholar] [CrossRef]
  74. Cabello, S.A.; Bochaca, J.G. Rural Schools in Spain: Strengths and Weakness. AGER Rev. Estud. Sobre Despoblación Desarro. Rural. 2023, 38, 113–142. [Google Scholar]
  75. Rodríguez-Soler, R.; Uribe-Toril, J.; De Pablo Valenciano, J. Worldwide trends in the scientific production on rural depopulation, a bibliometric analysis using bibliometrix R-tool. Land Use Policy 2020, 97, 104787. [Google Scholar] [CrossRef]
  76. Kłoczko-Gajewska, A. Long-Term Impact of Closing Rural Schools on Local Social Capital: A Multiple-Case Study from Poland. Eur. Countrys. 2020, 12, 598–617. [Google Scholar] [CrossRef]
  77. Álvarez Lorente, T.; Sousa Soares De Oliveira Braga, J.L.; Barros Cardoso, A. The social problem of rural depopulation in Spain and Portugal. In Social Problems in Southern Europe; Entrena-Durán, F., Soriano-Miras, R.M., Duque-Calvache, R., Eds.; Edward Elgar Publishing: Cheltenham, UK, 2020; ISBN 978-1-78990-143-6. [Google Scholar]
  78. Paveglio, T.B.; Carroll, M.S.; Stasiewicz, A.M.; Williams, D.R.; Becker, D.R. Incorporating Social Diversity into Wildfire Management: Proposing “Pathways” for Fire Adaptation. For. Sci. 2018, 64, 515–532. [Google Scholar] [CrossRef]
  79. Ager, A.A.; Preisler, H.K.; Arca, B.; Spano, D.; Salis, M. Wildfire risk estimation in the Mediterranean area. Environmetrics 2014, 25, 384–396. [Google Scholar] [CrossRef]
  80. Abram, N.J.; Henley, B.J.; Sen Gupta, A.; Lippmann, T.J.R.; Clarke, H.; Dowdy, A.J.; Sharples, J.J.; Nolan, R.H.; Zhang, T.; Wooster, M.J.; et al. Connections of climate change and variability to large and extreme forest fires in southeast Australia. Commun. Earth Environ. 2021, 2, 8. [Google Scholar] [CrossRef]
  81. Heracleous, C.; Michael, A.; Savvides, A.; Hayles, C. Climate change resilience of school premises in Cyprus: An examination of retrofit approaches and their implications on thermal and energy performance. J. Build. Eng. 2021, 44, 103358. [Google Scholar] [CrossRef]
  82. Escarcha, J.F.; Lassa, J.A.; Zander, K.K. Livestock Under Climate Change: A Systematic Review of Impacts and Adaptation. Climate 2018, 6, 54. [Google Scholar] [CrossRef]
  83. Paniagua, A. Climate Change and Depopulated Rural Areas in the Global North: Geographical Socio-political Processes and Resistances. In Handbook of Climate Change Management; Leal Filho, W., Luetz, J., Ayal, D., Eds.; Springer International Publishing: Cham, Switzerland, 2021; pp. 1–17. ISBN 978-3-030-22759-3. Available online: http://link.springer.com/10.1007/978-3-030-22759-3_4-1 (accessed on 7 October 2024).
  84. Galindo, A.A.G.; Sanmartí, N.; Pujol, R.M. Explaining events in the environment to primary school students. J. Biol. Educ. 2006, 40, 149–154. [Google Scholar] [CrossRef]
  85. Mereli, A.; Niki, E.; Psycharis, S.; Drinia, H.; Antonarakou, A.; Mereli, M.; Maria, T. Education of students from Greek schools regarding natural disasters through STEAM. Eurasia J. Math. Sci. Technol. Educ. 2023, 19, em2314. [Google Scholar] [CrossRef] [PubMed]
  86. Espinoza, A.E.; Espinoza, C.E.; Fuentes, A.A. Retornando a Chaitén: Diagnóstico participativo de una comunidad educativa desplazada por un desastre socionatural. Magallania Punta Arenas 2015, 43, 65–76. [Google Scholar] [CrossRef]
  87. O’Donnell, J. Forest fire control in Western Australia. Aust. For. 1939, 4, 15–21. [Google Scholar] [CrossRef]
  88. Paudel, J. Natural Hazards and Religion-Based Disparities in Human Capital: Lessons from Forest Fires. J. Econ. Race Policy 2024. [Google Scholar] [CrossRef]
  89. Paudel, J. Do environmental disasters affect human capital? The threat of forest fires. Econ. Educ. Rev. 2023, 97, 102463. [Google Scholar] [CrossRef]
Figure 1. Population density by municipalities in Spain.
Forests 15 01938 g001
Figure 2. Distribution of forest areas and educational centers in the province of Avila.
Forests 15 01938 g002
Figure 3. Drop-line mean of CONATUS and mean of FIREA by GRES in the province of Avila.
Forests 15 01938 g003
Table 1. Statistical correlation between population data in the municipal census.
123456
1. POP23-
2. POP960.788 **-
3. DIFPOP−0.255 **−0.474 **-
4. DENS230.565 **0.468 **−0.079-
5. DENS960.455 **0.485 **−0.258 **0.737 **-
6. DIFDENS0.010−0.149 **0.567 **−0.144 **−0.407 **-
M640.65683.91−43.2612.4916.31−3.82
SD3771.133104.63700.8125.8926.277.89
POP23, inhabitants in the municipal census as of 1 January 2023; POP96, inhabitants in the municipal census as of 1 January 1996; DIFPOP, population difference (number) recorded in the municipal census between 2023 and 1996; DENS23, population density (people/km2) of each municipality for the year 2023; DENS96, population density (people/km2) of each municipality for the year 1996; DIFDENS, difference in population density (people/km2) recorded in the municipal census between 2023 and 1996; M, mean; SD, standard deviation; * correlation is significant at the 0.05 level; ** correlation is significant at the 0.01 level (two-tailed).
Table 2. Statistical correlation between age groups data.
1234567891011
1. AGE00–09-
2. AGE10–190.669 **-
3. AGE20–290.637 **0.713 **-
4. AGE30–390.660 **0.694 **0.733 **-
5. AGE40–490.681 **0.744 **0.721 **0.740 **-
6. AGE50–590.640 **0.716 **0.772 **0.710 **0.759 **-
7. AGE60–690.615 **0.646 **0.740 **0.771 **0.718 **0.739 **-
8. AGE70–790.593 **0.626 **0.666 **0.680 **0.740 **0.712 **0.721 **-
9. AGE80–890.593 **0.581 **0.645 **0.631 **0.668 **0.729 **0.677 **0.700 **-
10. AGE90+0.497 **0.525 **0.582 **0.569 **0.569 **0.608 **0.619 **0.596 **0.637 **-
11. MEAGE−0.515 **−0.565 **−0.487 **−0.485 **−0.467 **−0.418 **−0.370 **−0.307 **−0.248 **−0.210 **-
M44.3257.0957.6565.9891.62102.2190.7266.2845.7316.0656.23
SD334.89402.63380.26410.46585.97571.32492.48330.63193.0164.465.34
AGE00–09, inhabitants in the age group 0 to 9; AGE10–19, inhabitants in the age group 10 to 19; AGE20–29, inhabitants in the age group 20 to 29; AGE30–39, inhabitants in the age group 30 to 39; AGE40–49, inhabitants in the age group 40 to 49; AGE50–59, inhabitants in the age group 50 to 59; AGE60–69, inhabitants in the age group 60 to 69; AGE70–79, inhabitants in the age group 70 to 79; AGE80–89, inhabitants in the age group 80 to 89; AGE90+, inhabitants of 90 years old and above; MEAGE, average age of population; M, mean; SD, standard deviation. Source: municipal census as of 1 January 2023. * Correlation is significant at the 0.05 level. ** Correlation is significant at the 0.01 level (two-tailed).
Table 3. Descriptive statistics considering: (A) all the municipalities in the province with less than 1000 inhabitants and forest tree cover; (B) municipalities with less than 1000 inhabitants, forest tree cover and SCHOOL (GROUP 1); (C) municipalities with less than 1000 inhabitants, no forest tree cover, and no SCHOOL (GROUP 2).
GroupVariableMean ± SD95% CIRangeSkewness ± SE
(A) All municipalities (n = 218)FIREA31.39 ± 190.835.919–56.870.00–2001.008.48 ± 0.17
CONATUS4.35 ±10.292.98–5.730.00–79.003.55 ± 0.17
POP96298.91 ± 256.02264.73–333.0827.00–1387.001.76 ± 0.17
DIFDENS−4.31 ± 6.84−5.22–−3.40−81.69–15.74−6.62 ± 0.17
AGE50–5933.99 ± 33.8229.48 ± 38.511.00 ± 160.001.61 ± 0.17
MEAGE56.84 ± 5.1456.16 ± 57.5342.23 ± 69.520.04 ± 0.17
AGRICU28.61 ± 23.8725.42 ± 31.800.00 ± 154.002.20 ± 0.17
LIVESTO11.60 ± 10.9810.13 ± 13.060.00 ± 65.001.72 ± 0.17
UNEMPL6.03 ± 4.363.45 ± 6.610.00 ± 24.070.91 ± 0.17
ROADENS0.49 ± 0.240.46–0.520.04–1.410.83 ± 0.17
TERRES0.11 ± 0.440.05–0.170.00–3.004.59 ± 0.17
SLOPE15.96 ± 13.5414.15–17.770.75–55.150.78 ± 0.17
ALTITU397.75 ± 388.981093.54–1160.03345.82–449.671.35 ± 0.17
FOREST6.49 ± 8.165.40–7.580.00–57.092.45 ± 0.17
RISK53.90 ± 7.522.89 ± 4.900.00 ± 61.613.77 ± 0.17
RISK617.97 ± 15.5715.89 ± 20.050.00 ± 70.600.83 ± 0.17
RISK725.99 ± 20.6823.23 ± 28.750.15 ± 83.920.64 ± 0.17
RISK81.09 ± 2.760.72 ± 1.450.00 ± 19.373.70 ± 0.17
RISK97.36 ± 10.955.90 ± 8.820.00 ± 62.302.26 ± 0.17
RISK101.28 ± 3.500.82 ± 1.750.00 ± 30.884.97 ± 0.17
(B) Group 1 (n = 26)FIREA21.77 ± 55.70−0.73–44.270.00–247.003.35 ± 0.46
CONATUS11.88 ± 18.704.33–19.440.00–79.002.16 ± 0.46
POP96686.08 ± 284.96570.98–801.17148.00–1109.00−0.88 ± 0.46
DIFDENS−6.86 ± 16.21−13.40–−0.31−81.69–12.94−4.11 ± 0.46
AGE50–5985.87 ± 34.7871.84 ± 99.9418.00 ± 160.00−0.76 ± 0.46
MEAGE52.97 ± 3.8751.41 ± 54.5346.24 ± 62.970.30 ± 0.46
AGRICU50.08 ± 36.9035.17 ± 64.989.00 ± 154.001.33 ± 0.46
LIVESTO17.54 ± 12.9612.31 ± 22.770.00 ± 42.000.56 ± 0.46
UNEMPL8.11 ± 4.306.38 ± 9.851.66 ± 17.210.42 ± 0.46
ROADENS0.62 ± 0.290.54–0.770.27–1.410.93 ± 0.46
TERRES0.38 ± 0.800.06–0.710.00–3.002.16 ± 0.46
SLOPE20.25 ± 16.0213.78–16.021.63–55.150.73 ± 0.46
ALTITU476.96 ± 423.16309.04 ± 650.8856.00 ± 1578.001.18 ± 0.18
FOREST8.71 ± 7.255.81–11.600.00–22.230.43 ± 0.46
RISK55.39 ± 7.122.51 ± 8.270.00 ± 25.221.37 ± 0.46
RISK620.47 ± 15.6214.16 ± 26.770.27 ± 56.270.51 ± 0.46
RISK722.83 ± 16.4716.18 ± 29.482.14 ± 62.890.59 ± 0.46
RISK81.81 ± 3.760.29 ± 3.330.00 ± 13.512.42 ± 0.46
RISK96.60 ± 7.863.42 ± 9.770.00 ± 25.691.27 ± 0.46
RISK100.63 ± 1.890.15 ± 1.100.00 ± 4.281.98 ± 0.46
(C) Group 2 (n = 192)FIREA32.70 ± 202.383.89–61.510.00–2001.008.06 ± 0.18
CONATUS3.35 ± 8.122.18–4.490.00–54.003.33 ± 0.18
POP96154.74 ± 150.90133.26–176.2315.00–917.002.35 ± 0.18
DIFDENS−3.97 ± 4.22−4.57–−3.66−23.86–15.74−0.40 ± 0.18
AGE50–5926.96 ± 26.9323.13 ± 30.801.00 ± 159.002.20 ± 0.18
MEAGE57.37 ± 5.0756.64 ± 58.0942.23 ± 69.52−0.05 ± 0.18
AGRICU25.70 ± 19.9522.86 ± 28.540.00 ± 145.002.07 ± 0.18
LIVESTO10.79 ± 10.479.30 ± 12.280.00 ± 65.002.00 ± 0.18
UNEMPL5.75 ± 4.305.14 ± 6.360.00 ± 24.071.02 ± 0.18
ROADENS0.47 ± 0.220.44–0.500.04–1.300.68 ± 0.18
TERRES0.07 ± 0.350.02–0.120.00–3.005.69 ± 0.18
SLOPE15.38 ± 13.1113.51–17.240.75–49.250.74 ± 0.18
ALTITU386.61 ± 383.95331.96 ± 441.2713.00 ± 1860.001.38 ± 0.18
FOREST6.18 ± 8.265.01–7.360.00–57.092.69 ± 0.18
RISK53.70 ± 7.602.62 ± 4.770.00 ± 61.614.07 ± 0.18
RISK617.63 ± 15.5815.41 ± 19.850.00 ± 70.600.89 ± 0.18
RISK726.41 ± 21.1923.40 ± 29.430.15 ± 83.920.62 ± 0.18
RISK80.99 ± 2.590.62 ± 1.360.00 ± 19.374.06 ± 0.18
RISK97.46 ± 11.325.85 ± 9.070.00 ± 62.32.26 ± 0.18
RISK101.37 ± 3.690.85 ± 1.900.00 ± 30.884.73 ± 0.18
SD, standard deviation for the population mean; 95% CI, confidence interval for the population mean at a 95% confidence level; SE, standard error of skewness.
Table 4. Mann–Whitney U test for the selected variables between GROUP 1 and GROUP 2.
VariableGroupnMean RankSum of RanksMann–Whitney Up-Value
FIREA126129.523367.501975.50.035 *
2192106.7920,503.50
CONATUS126135.023510.501832.50.005 **
2192106.0420,360.50
POP96126187.134865.50477.5<0.001 **
219298.9919005.50
DIFDENS12688.192293.001942.00.066
2192112.3921,578.00
AGE50–59126188.004888.00455.0<0.001 **
219298.8718,983
MEAGE12660.291567.501216.5<0.001 **
2192116.1622,303.50
AGRICU126155.484042.501300.5<0.001 **
2192103.2719,828.50
LIVESTO126140.313648.001695.00.008 **
2192105.3320,223.00
UNEMPL126141.213671.501671.50.006 **
2192105.2120,199.50
ROADENS126146.233802.001541.00.002 **
2192104.5320,069.00
TERRES126126.883299.002044.0<0.001 **
2192107.1520,572.00
SLOPE126128.193333.002010.00.107
2192106.9720,538.00
ALTITU126125.483262.502080.00.169
2192107.3420,608.50
FOREST126134.193489.001854.00.033 *
2192106.1620,382.00
RISK5126126.733295.002048.00.135
2192107.1720,576.00
RISK6126121.383156.002187.00.306
2192107.8920,715.00
RISK7126104.232710.002359.00.650
2192110.2121,161.00
RISK8126124.273231.002112.00.154
2192107.5020,640.00
RISK9126115.983015.502327.50.574
2192108.6220,855.50
RISK10126105.002730.002379.00.664
2192110.1121,141.00
FIREA, forested area burned (ha); CONATUS, number of fires started in each municipality; POP96, inhabitants in the municipal census as of 1 January 1996; DIFDENS, difference in population density (people/km2) recorded in the municipal census between 2023 and 1996; AGE50–59, number of people (men and women) registered in the age group 50 to 59 according to the municipal census as of 1 January 2023; MEAGE, average age of population according to the municipal census as of 1 January 2023; AGRICU, number of agricultural holdings per municipality by 2020; LIVESTO, number of livestock holdings per municipality by 2020; UNEMPL, unemployment rate per municipality by 2022; ROADENS, road density (km of road network length/km2) for each municipality; TERRES, terrestrial resources for fighting forest fires; SLOPE, range of slopes (%) for each municipality; ALTITU, amplitude or range of altitude (m) for each municipality; FOREST, tree forest canopy (ha) within each municipality; RISK5, percentage of the municipality surface area cataloged with a very low fire hazard; RISK6, percentage of the municipality surface area cataloged with a low fire hazard; RISK7, percentage of the municipality surface area cataloged with a moderate fire hazard; RISK8, percentage of the municipality surface area cataloged with a high fire hazard; RISK9, percentage of the municipality surface area cataloged with a severe fire hazard; RISK10, percentage of the municipality surface area cataloged with an extreme fire hazard. Bold means significant differences (p-value < 0.05). * Significant correlation at p-value < 0.05. ** p-value < 0.01.
Table 5. Results of GLM analysis.
95% Wald C.I.
StatisticParameterCoef. βLowerUpperWald χ2 Testdfp-Value
Ominibus test 239.249 ^20<0.001 **
Test of model effects(Intercept)2.5402−4.4885.470.03710.847
SCHOOL0.51490.8692.88713.3071<0.001 **
CONATUS0.01950.0970.17448.2831<0.001 **
POP960.001500.0063.43910.064
DIFDENS0.02810.0440.15512.4741<0.001 **
AGE50–590.0106−0.052−0.0118.82210.003 **
MEAGE0.041−0.1380.0231.9910.158
AGRICU0.0487−0.1390.0520.80210.371
LIVESTO0.00870.0040.0385.86610.015 *
UNEMPL0.0173−0.0470.020.60110.438
ROADENS0.9245−1.1932.4310.44810.503
TERRES0.3311−1.558−0.267.54210.006 **
SLOPE0.02560.0570.15717.5121<0.001 **
ALTITU0.0007−0.00201.91710.166
FOREST0.0238−0.0260.0670.75910.384
RISK50.0214−0.0040.083.18910.074
RISK60.0141−0.0190.0360.34810.555
RISK70.0118−0.0180.0290.21910.64
RISK80.0621−0.1160.1280.00810.927
RISK90.0208−0.0730.0082.43510.119
RISK100.0395−0.0530.1020.38810.533
Dependent variable: FIREA; C.I., confidence interval; df, degree of freedom; bold means significant differences (p-value < 0.05). * Significant correlation at p-value < 0.05. ** p-value < 0.01. ^ Likelihood ratio Chi-squared.
Disclaimer/Publisher’s Note: The statements, opinions and data contained in all publications are solely those of the individual author(s) and contributor(s) and not of MDPI and/or the editor(s). MDPI and/or the editor(s) disclaim responsibility for any injury to people or property resulting from any ideas, methods, instructions or products referred to in the content.

