Article

Impact of the Project of Returning Farmland to Forest on Promoting Forest Coverage Rates in Mountainous Areas: An Empirical Analysis Based on Remote Sensing in Yunnan

1
School of Economics, Yunnan University of Finance and Economics, Kunming 650221, China
2
Yunnan Provincial Key Laboratory of Digital Economy and Sustainable Rural Development, Kunming 650221, China
3
Institute of Land & Resources and Sustainable Development, Yunnan University of Finance and Economics, Kunming 650221, China
4
College of Public Administration, Nanjing Agricultural University, Nanjing 210095, China
*
Author to whom correspondence should be addressed.
Forests 2024, 15(11), 1956; https://doi.org/10.3390/f15111956
Submission received: 3 October 2024 / Revised: 31 October 2024 / Accepted: 1 November 2024 / Published: 7 November 2024

Abstract

:
The large–scale Project of Returning Farmland to Forest (PRFF) is a major strategic measure taken against the background of the catastrophic floods in 1998, and its policy effect urgently requires an accurate evaluation. Yunnan Province is an ecologically fragile province that integrates border areas, mountainous areas, ethnic groups, and underdeveloped areas. It is of great significance to study the effect of PRFF in Yunnan, which began in 2000, on promoting forest coverage rates (FCRs) in mountainous areas. In response to the shortcomings in the existing research, such as the lack of direct exploration and the limited policy evaluation tools of the effect of PRFF on improving FCRs in mountainous regions, this study takes Yunnan as an example based on land use/land cover (LULC) data interpreted from seven periods of RS images, aiming to study the effect of PRFF on promoting FCRs. After dividing 129 counties into 3 types (flatland county, semi-mountainous and semi-flatland (SMSF) county, and mountainous county), the Difference-In-Differences (DID) model and spatial DID models are used to measure the specific effect of PRFF on promoting FCRs based on county-level administrative units. The results indicate that PRFF has increased FCRs in non-flatland counties by 1.8082%, and the impact of PRFF on increasing FCRs in mountainous counties slightly exceeds that in SMSF counties. Although PRFF has converted some steep slope farmland into forest land, there is no evidence to suggest that the implementation of PRFF has significantly reduced the proportion of farmland and total grain production in non-flatland counties. Therefore, PRFF is an excellent project that promotes the increase in FCRs and benefits in the country and the people. The results can provide a reference for China to achieve the modernization of harmonious coexistence between humans and nature and also offer a reference for other countries to improve FCRs and the local ecology.

1. Introduction

For a long time, the combined impact of human activities and climate change has led to the severe degradation of ecosystems worldwide, posing a serious threat to the achievement of the Sustainable Development Goals (SDGs). In order to protect and restore ecosystems, countries around the world have implemented a series of unprecedented forestry ecological restoration projects (FERPs) [1]. Examples include the Green Dam Project in North Africa, the Green Plan in Canada, the National Greening Project in South Korea, the Prairie States Forestry Project in the United States, the National Afforestation Project in Vietnam, the Natural Resources Management Project in Indonesia, etc. In China, Project of Returning Farmland to Forest (PRFF) is the strongest policy with the highest degree of public participation and the widest coverage, and it represents the largest investment to have been fully launched nationwide. It was first piloted in Shaanxi, Gansu, and Sichuan in 1999, and it was approved by the State Council and expanded to 17 provinces and cities in central and western China in March 2000 [2]. The implementation of PRFF was not only an important way to achieve the 15th Sustainable Development Goal (SDG) of the United Nations but is also closely related to many other SDGs. Specifically, PRFF can prevent land degradation and restore the ecology by stopping the cultivation and tree planting on steep slopes. On the other hand, although PRFF leads to a reduction in farmland, it encourages farmers to shift from extensive agricultural production methods to intensive management. This not only increases food production and ensures food security but also promotes a potential increase in income for farmers and helps in achieving sustainable economic growth and meeting the requirements of the SDGs [3,4].
Since the implementation of PRFF, more and more researchers have focused on its background and significance [5], conceptual connotation [6], implementation progress [7], policy effect [8,9], and other aspects, and research results continue to emerge. Specifically, the study of the effect on the FCR promoted by PRFF has become a key direction in terms of the Sustainable Development Goals (SDGs) [10,11,12]. Due to technological limitations in the early stages, there was limited analysis of the policy effects related to PRFF, and the monitoring methods for the FCR were also relatively backward [13,14]. With the development and maturity of technologies such as remote sensing (RS), Geographic Information System (GIS), and Global Navigation Satellite System (GNSS), research on the policy effect of PRFF by using “3S” technology has gradually increased [15,16]. The existing research progress and literature on the policy effect of PRFF includes the following types: Firstly, by collecting and interpreting land use/land cover (LULC) data by using RS technology to monitor or analyze the temporal changes and spatial patterns of FCRs and indirectly exploring the policy effect of PRFF on promoting the FCRs [17,18,19,20,21]. The second is indirectly exploring the policy effect of PRFF on promoting FCRs through the influence and driving factors of the FCR [22,23,24,25,26]. Overall, this type of research mainly adopts regression analysis models and other methods, but it lacks rigorous policy evaluation tools such as Difference–in–Differences (DID) models to systematically measure its policy effect. The third is to use RS and GIS to study LULC changes before and after PRFF, to indirectly or directly explore the policy effect. Several studies indirectly explored policy effects by utilizing LULC data to calculate the changes in farmland and forest land areas before and after the PRFF policy implementation. They estimated the increase in the closed forest land (CFL) after the implementation of the policy [27,28,29,30]. Research directly exploring the policy effect typically involves technologies such as RS and GIS, along with grid data such as LULC, slope, and altitude. These methods calculate the conversion of steep slope farmland into CFL after the PRFF implementation, directly assessing the project’s impact on improving FCRs in mountainous areas [31,32,33]. Notably, Yang Zisheng et al.’s work (2011) [32] is a representative study that focused on typical counties in Yunnan Province. It used RS and GIS technology to calculate the changes in FCRs before and after returning farmland to forest (RFF) in detail, revealing an average of 1.19% annually from 2000 to 2009. Overall, this research adopts RS and GIS technologies and can accurately locate the land plots implemented in PRFF by overlaying grid data maps such as LULC, slope, and altitude, thereby obtaining accurate calculation results.
Overall, the existing literature has made significant progress in the fundamental theories and research methods of PRFF, and the “3S” technology has also been widely applied. However, through literature review and analysis, it can be found that there are still some shortcomings and areas that need improvement in the research on promoting FCRs by PRFF. Regarding research forms, there are more indirect and fewer direct studies. In terms of research content, many direct studies have not noticed that before the policy implementation of the PRFF, there may also have been external factors that caused a small portion of steep slope farmland to be converted to forest land. Therefore, when calculating the policy effect, other ignored factors may interfere with and affect the policy implementation, resulting in a certain deviation in the calculation results of the policy effect. In addition, existing research has also conducted relatively few horizontal comparisons between mountainous and flat areas to explore the policy effect of PRFF. Therefore, this study intends to organically combine policy evaluation tools, RS and GIS technologies, and other interdisciplinary methods. By obtaining LULC data and using suitable policy evaluation tools such as spatial DID models, the effect of PRFF on improving FCRs in mountainous areas in Yunnan will be calculated.
China is a mountainous country, and the mountainous areas account for over two-thirds [34]. As a southwestern border mountainous province, Yunnan has many mountainous areas, an extremely fragile ecology, and a relatively backward economic level [35]. Yunnan is a province that integrates “mountainous areas, ethnic groups, border areas, and poverty”. Selecting Yunnan as the research area is of great significance and representativeness. Yunnan’s mountainous area accounts for about 94%, and the proportion of steep slope farmland is very high, which belongs to ecologically fragile areas. In theory, the implementation of PRFF has significant benefits for improving the eco-environment and socio-economic conditions of Yunnan. This paper focuses on Yunnan as the research subject, chosen not only due to its significant mountainous area but also because of its geographical location as the source or upstream area of the six major river systems: the Yangtze, Pearl, Lancang, Red, Nu, and Irrawaddy rivers. Yunnan is known as a crucial ecological security barrier [36]. It is urgent to accurately evaluate and calculate whether implementing PRFF in Yunnan has increased the FCRs and the specific effect. Therefore, this study is based on seven periods of RS image interpretation data (i.e., 1990, 1995, 2000, 2005, 2010, 2015, and 2020) to explore the effect of PRFF on improving regional FCRs. This study aims to provide references for China’s modernization of achieving harmonious coexistence between humans and nature, as well as valuable inspirations for other countries to improve FCRs and the ecological environment. From the theoretical perspective, this study not only enriches and expands the application of interdisciplinary integration methods to explore the ecological effect of PRFF but also benefits further innovation and the development of the basic theoretical research of PRFF. In terms of practical significance, this study provides references and inspiration for local governments to formulate reasonable ecological protection policies according to local conditions.

2. Materials and Methods

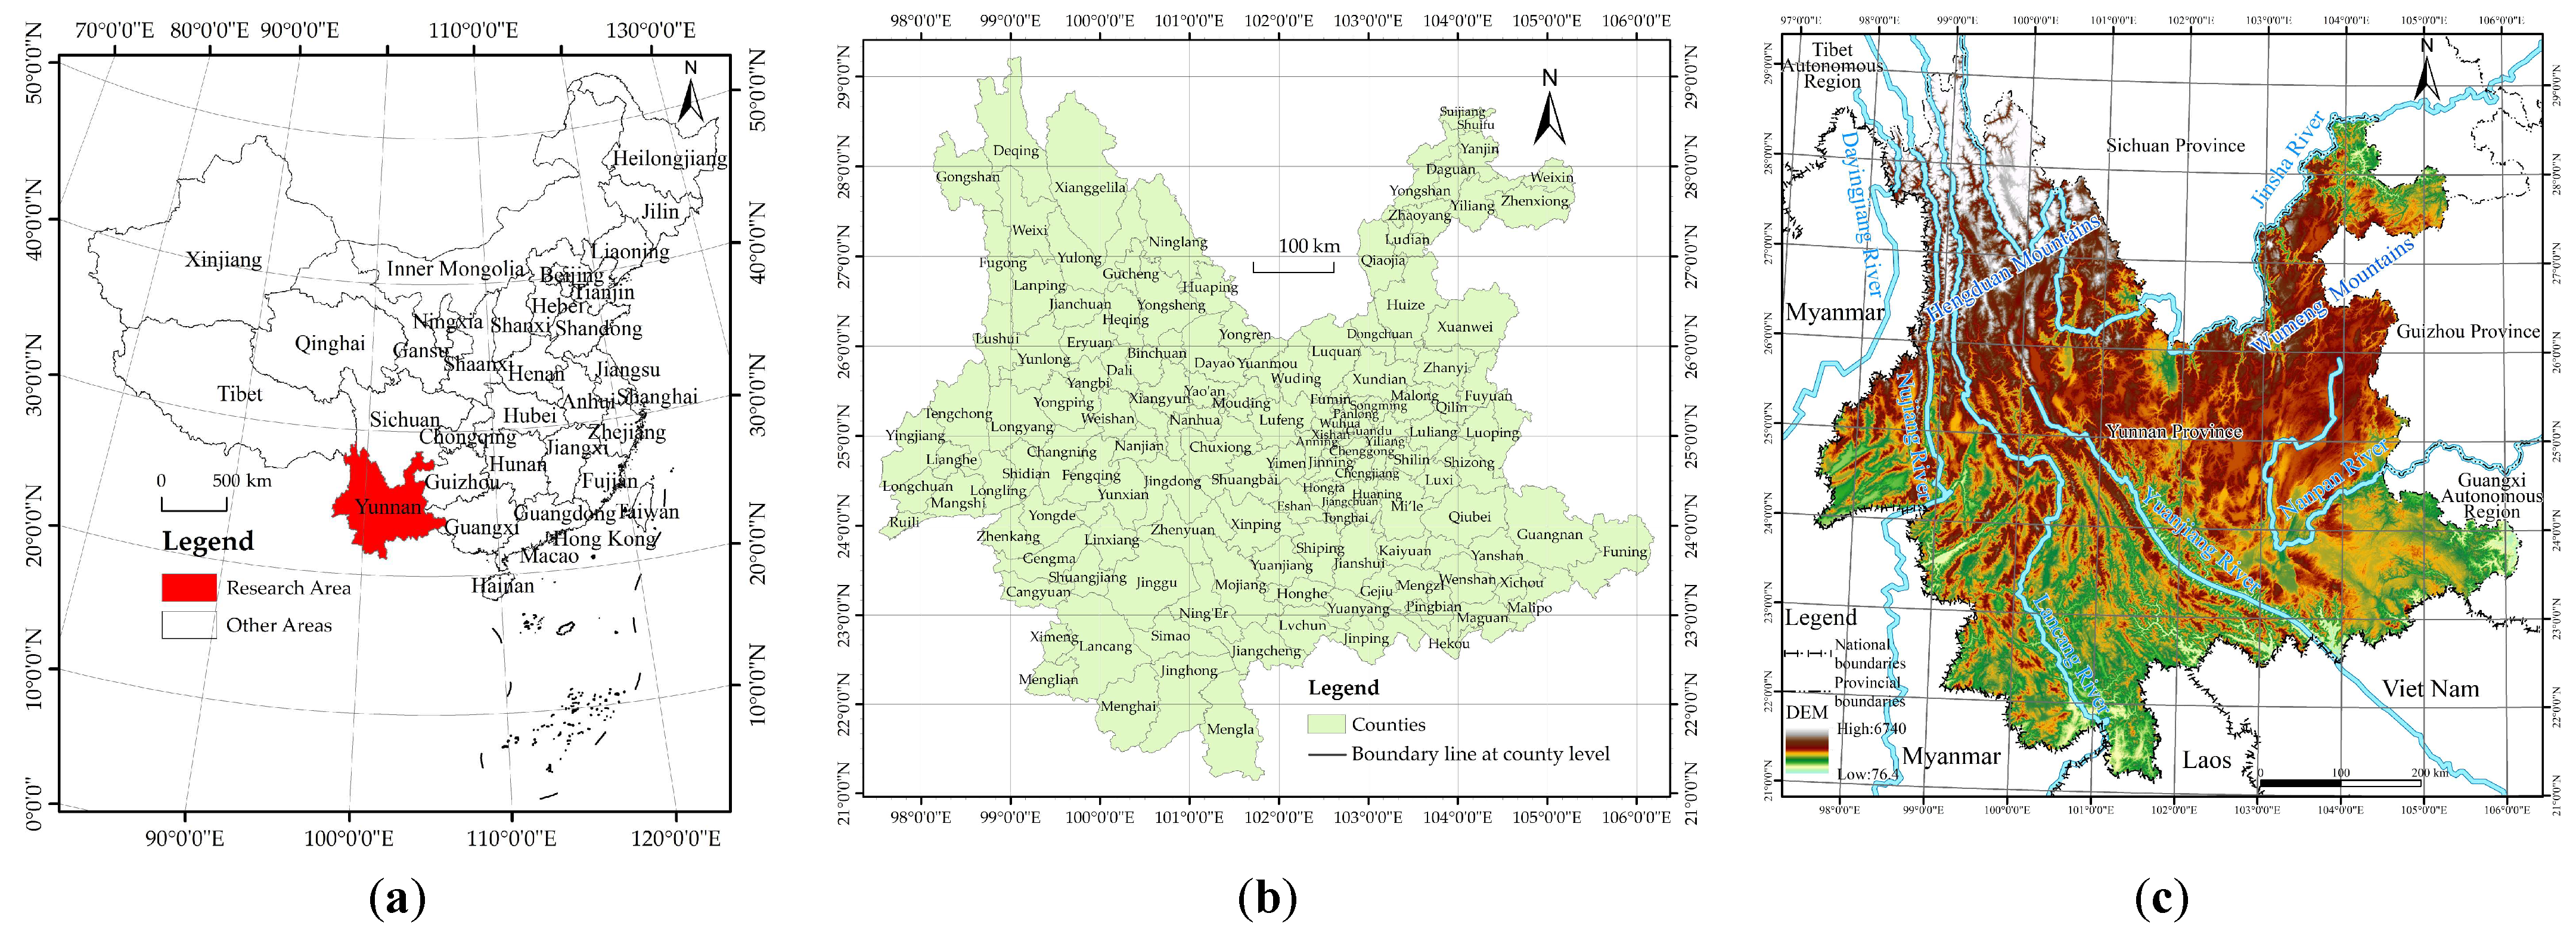
2.1. Overview of the Research Area

Yunnan Province is located in the southwestern border area of China, situated between longitude 97°31′39″ E–106°11′47″ E and latitude 21°8′32″ N–29°15′8″ N (Figure 1). At the end of 2020, there were 16 prefectures and 129 counties, and the total population was 47.22 million, of which 15.64 million (33.12%) were ethnic minorities [37]. In 2020, the GDP of Yunnan was CNY 2.45 trillion, of which the output values of the primary, secondary, and tertiary industries were CNY 359.89 billion (14.68%), CNY 828.75 billion (33.80%), and CNY 1.26 trillion (51.53%), respectively. In 2020, the per capita disposable income (PCDI) of all residents was CNY 23,295, and the PCDI of rural residents was CNY 12,842, both ranking 28th in China (i.e., fourth from the bottom) [38].
Yunnan is a typical mountainous province. It is mainly characterized by mountainous terrain, with the mountain area accounting for approximately 94% [39]. According to the results of a land use change survey in 2000, the farmland area (FLA) with a ≥15° slope reached 3.0724 Mha (30,724 km2), accounting for 48.46% of the total FLA; the FLA with a ≥25° slope reached 0.86 Mha (8600 km2), accounting for 13.52%; and the FLA with a ≥35° slope reached 0.13 Mha (1300 km2), accounting for 1.98% [40]. There is a certain amount of steep slope farmland in various regions. The total FLA with a ≥15° slope in Yunnan accounts for more than one-fifth of the 12 provinces in western China, ranking first among them. The area where the total FLA has a ≥25° slope ranks third in western China [41].
As an ecological security barrier in southwestern China, Yunnan undertakes the essential task of ensuring China’s ecological security. Through nationwide deployment, PRFF was implemented in 2000. According to statistics [42], between 2000 and 2008, Yunnan completed the national task, covering a total area of 1.06 Mha (10,600 km2). This included 0.36 Mha (3600 km2) of farmland returning to forest and grassland, 0.62 Mha (6200 km2) of afforestation in suitable barren mountains and wastelands, and 0.08 Mha (800 km2) of close hillsides to facilitate afforestation. This project covers 16 prefectures and 129 counties in the province, benefiting 1.3 million households (5.446 million people). According to reports [43], of the 0.3576 Mha (3576 km2) of farmland returning to forest, classified by slope, there were 49,800 ha (498 km2, accounting for 14.01%) with slopes less than 15°; 87,800 ha (878 km2, accounting for 24.70%) with slopes between 15° and 25° slope; and 0.22 Mha (2200 km2, accounting for 61.28%) with slopes of ≥25° or more.

2.2. Data Collection

To explore the effect of PRFF on FCRs, this study intends to collect seven periods of RS images in Yunnan over the past 30 years. By comparing the changes in the FCRs in counties with different slope grades before and after implementing PRFF, this study will better measure the policy effect. The source of the RS image data is from the website “https://www.resdc.cn/” (accessed on 2 February 2023), and Table 1 provides detailed information.
The RS image data collected in this study are based on the national environmental database of the Chinese Academy of Sciences (CAS), which uses Landsat remote sensing images of the United States as the main information source. The places that cannot be covered due to poor temporal phase are supplemented by the China Brazil Earth Resources Satellite (CBERS) data or environmental small satellite data, and the China multi-period land use/land cover remote sensing image database has been established. It is feasible to use RS data with a spatial resolution of 30 m × 30 m.
Due to the fact that the land use changes caused by the PRFF in mountainous areas are often concentrated and contiguous, the spatial scale of the plots of returning farmland to forest (RFF) is mostly large, while small-scale plots of RFF not only have a small number, but also have a small plot area. Therefore, they have less significant impact on the final measurement results of land use changes in mountainous areas, and can even be almost ignored. In terms of seasonality, this study selected images with winter cloud cover of less than 10% for interpretation. This study selected RS image data in winter for interpretation to take into account weather conditions such as cloud cover and precipitation. Generally speaking, Yunnan experiences less precipitation in winter, and RS images have lower cloud cover, which facilitates the interpretation of various types of land. Additionally, it considers the impact of vegetation growth stages and seasonal changes on the spectral characteristics and appearance of land features. At the same time, consistency is also required in the time selection of RS image data from each period in order to analyze LUCC more accurately. The seven periods of the land use vector database of Yunnan were obtained by using the LULC type of the 7 periods of RS image interpretation through human–machine interaction.
As shown in Figure 2, the main steps include the following: downloading the RS image data, performing image preprocessing operations such as false color synthesis, precise geometric rectification, image mosaic, image clipping, and overlaying the administrative division vector maps of 129 counties in Yunnan in 2021 to obtain RS image maps of each county. Based on constructing the RS image interpretation markers, the interpretation is carried out by combining auxiliary materials such as DEM maps, vegetation maps, and national land use status survey maps of different periods. Then, the steps are to generate interpretation results for each county as a unit, perform graphic editing, check and correct errors, and organize and summarize them. After the interpretation was completed, this study referred to the research of Xu Xinliang et al. (2018) [44], Liu Jiyuan et al. (2002, 2003, 2014) [45,46,47], and Kuang Wenhui et al. (2022) [48], combined with the actual conditions, and divided the interpretation results into 6 primary and 12 secondary land use types (LUTs). Figure 2 shows the 7 periods’ distribution of 6 primary LUTs, and Table 2 shows the seven periods’ area of the 6 primary and 12 secondary LUTs.
In addition, it is necessary to note that the results are relatively accurate. Taking the LULC classification area in 2020 as an example, the RS interpretation results showed that the total FLA in the province in 2020 was 5.3956 Mha (53,956 km2), while the Third National Land Survey of Yunnan Province (TNLS) [49] showed that the total FLA in 2019 was 5.3955 Mha (53,955 km2) (relative error was 0.0019%). In addition, the RS interpretation results showed that the total forest area in 2020 was 24.1867 Mha (241,867 km2), while the TNLS showed that the total forest area in 2019 was 24.97 Mha (249,700 km2) (relative error was 3.14%). Finally, the RS interpretation results showed that the total construction land area (CLA) in 2020 was 1.2969 Mha (12,969 km2), while the TNLS showed that the total CLA in 2019 was 1.302 Mha (13,020 km2) (relative error was 0.25%).

2.3. Methodology

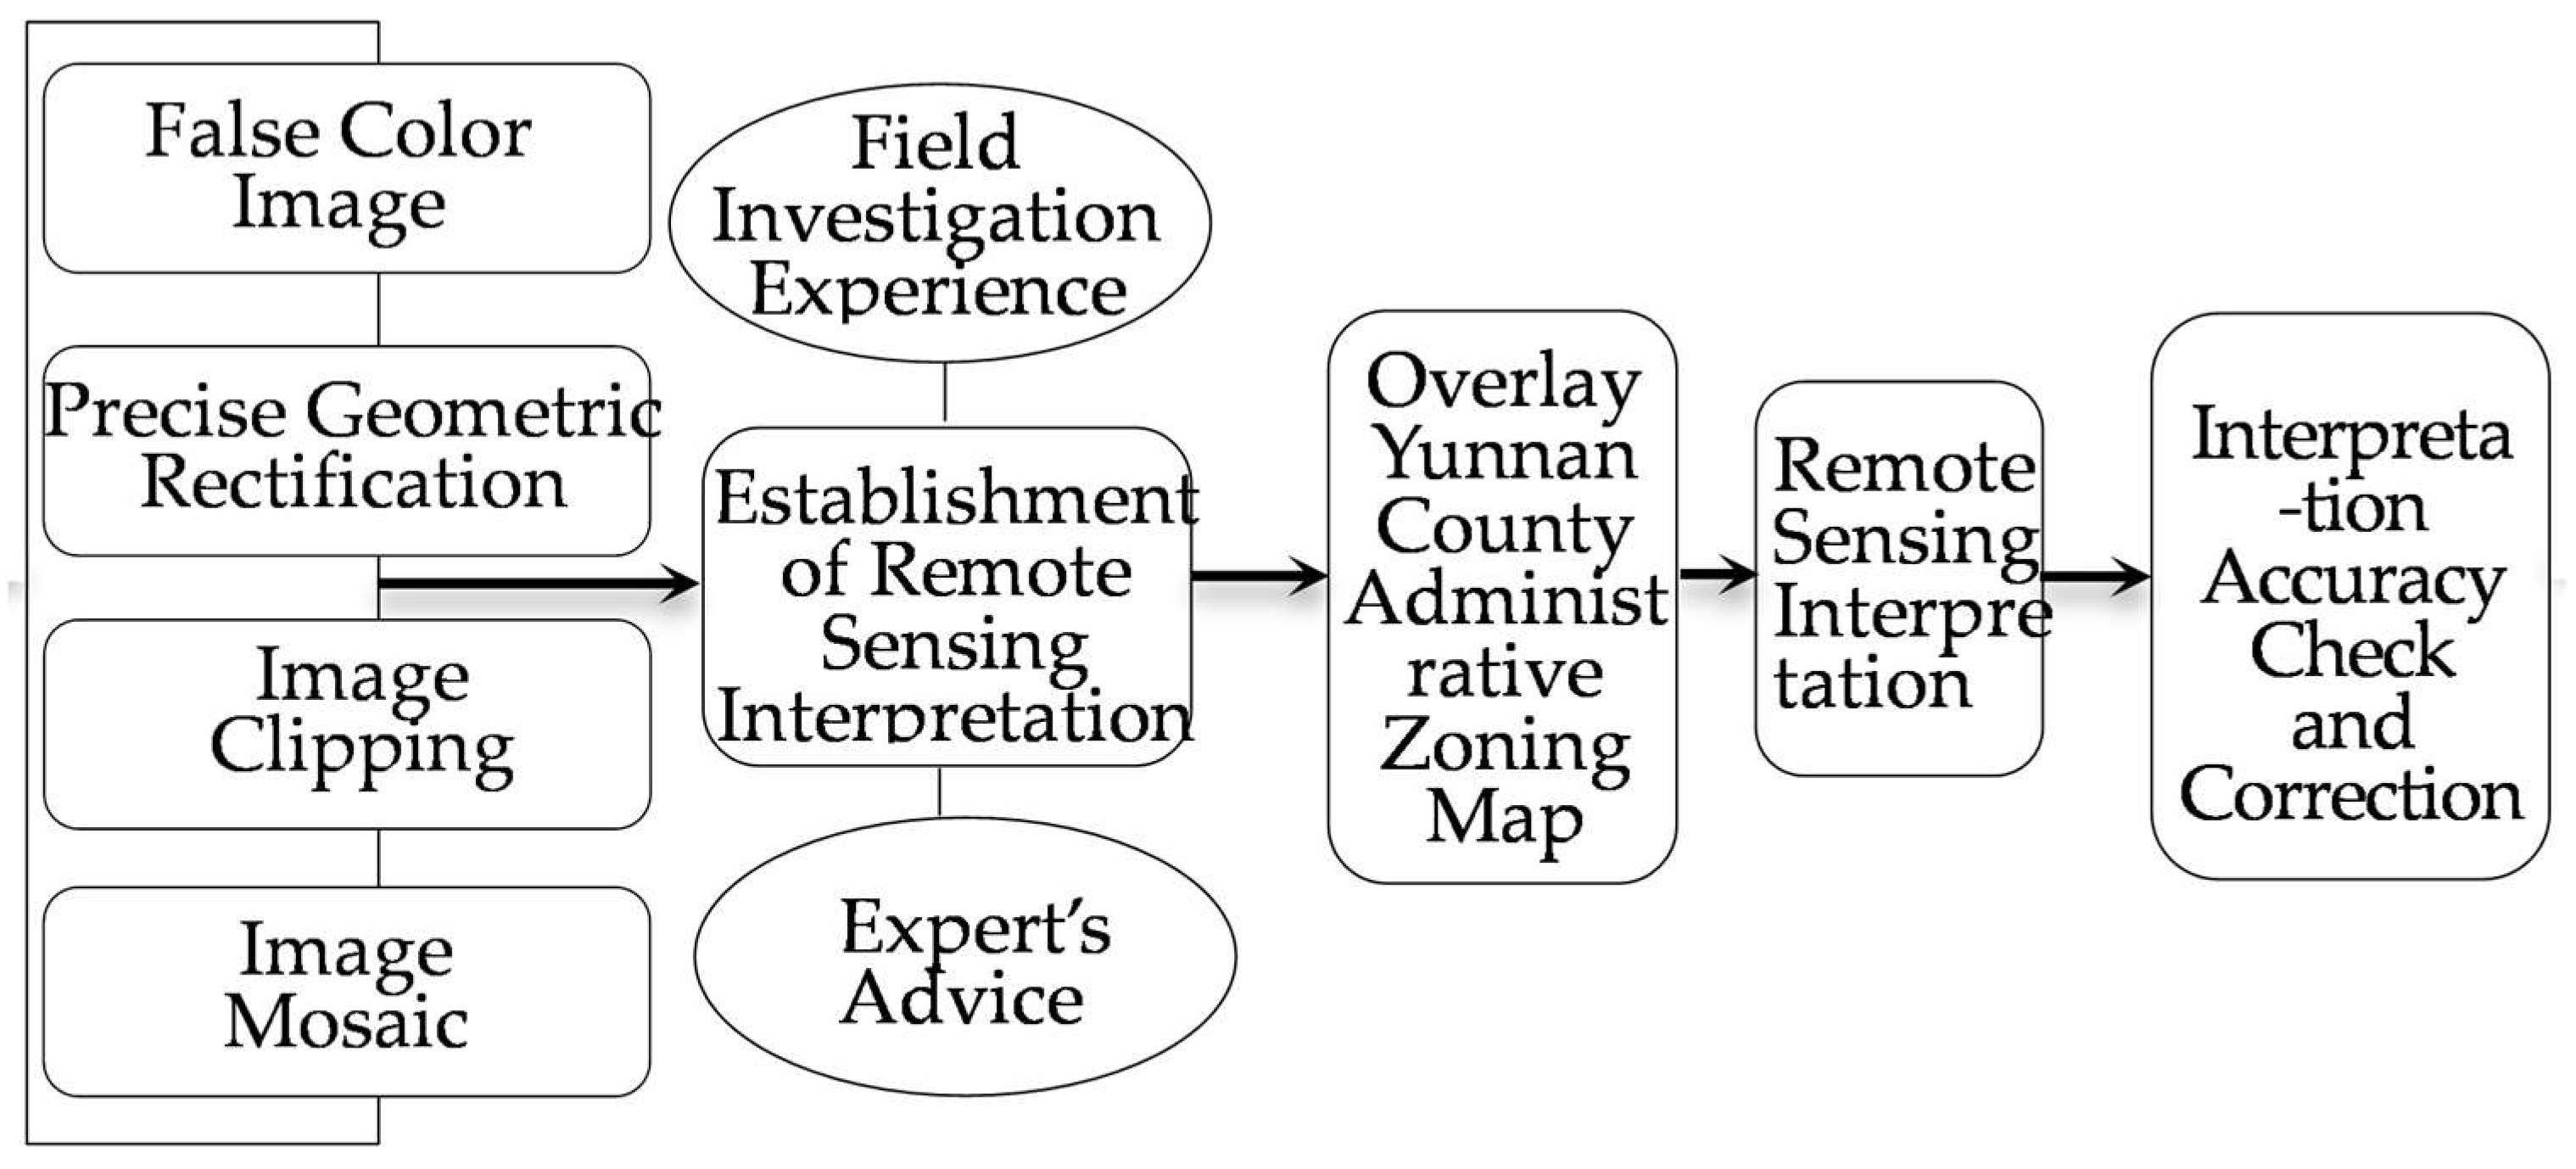
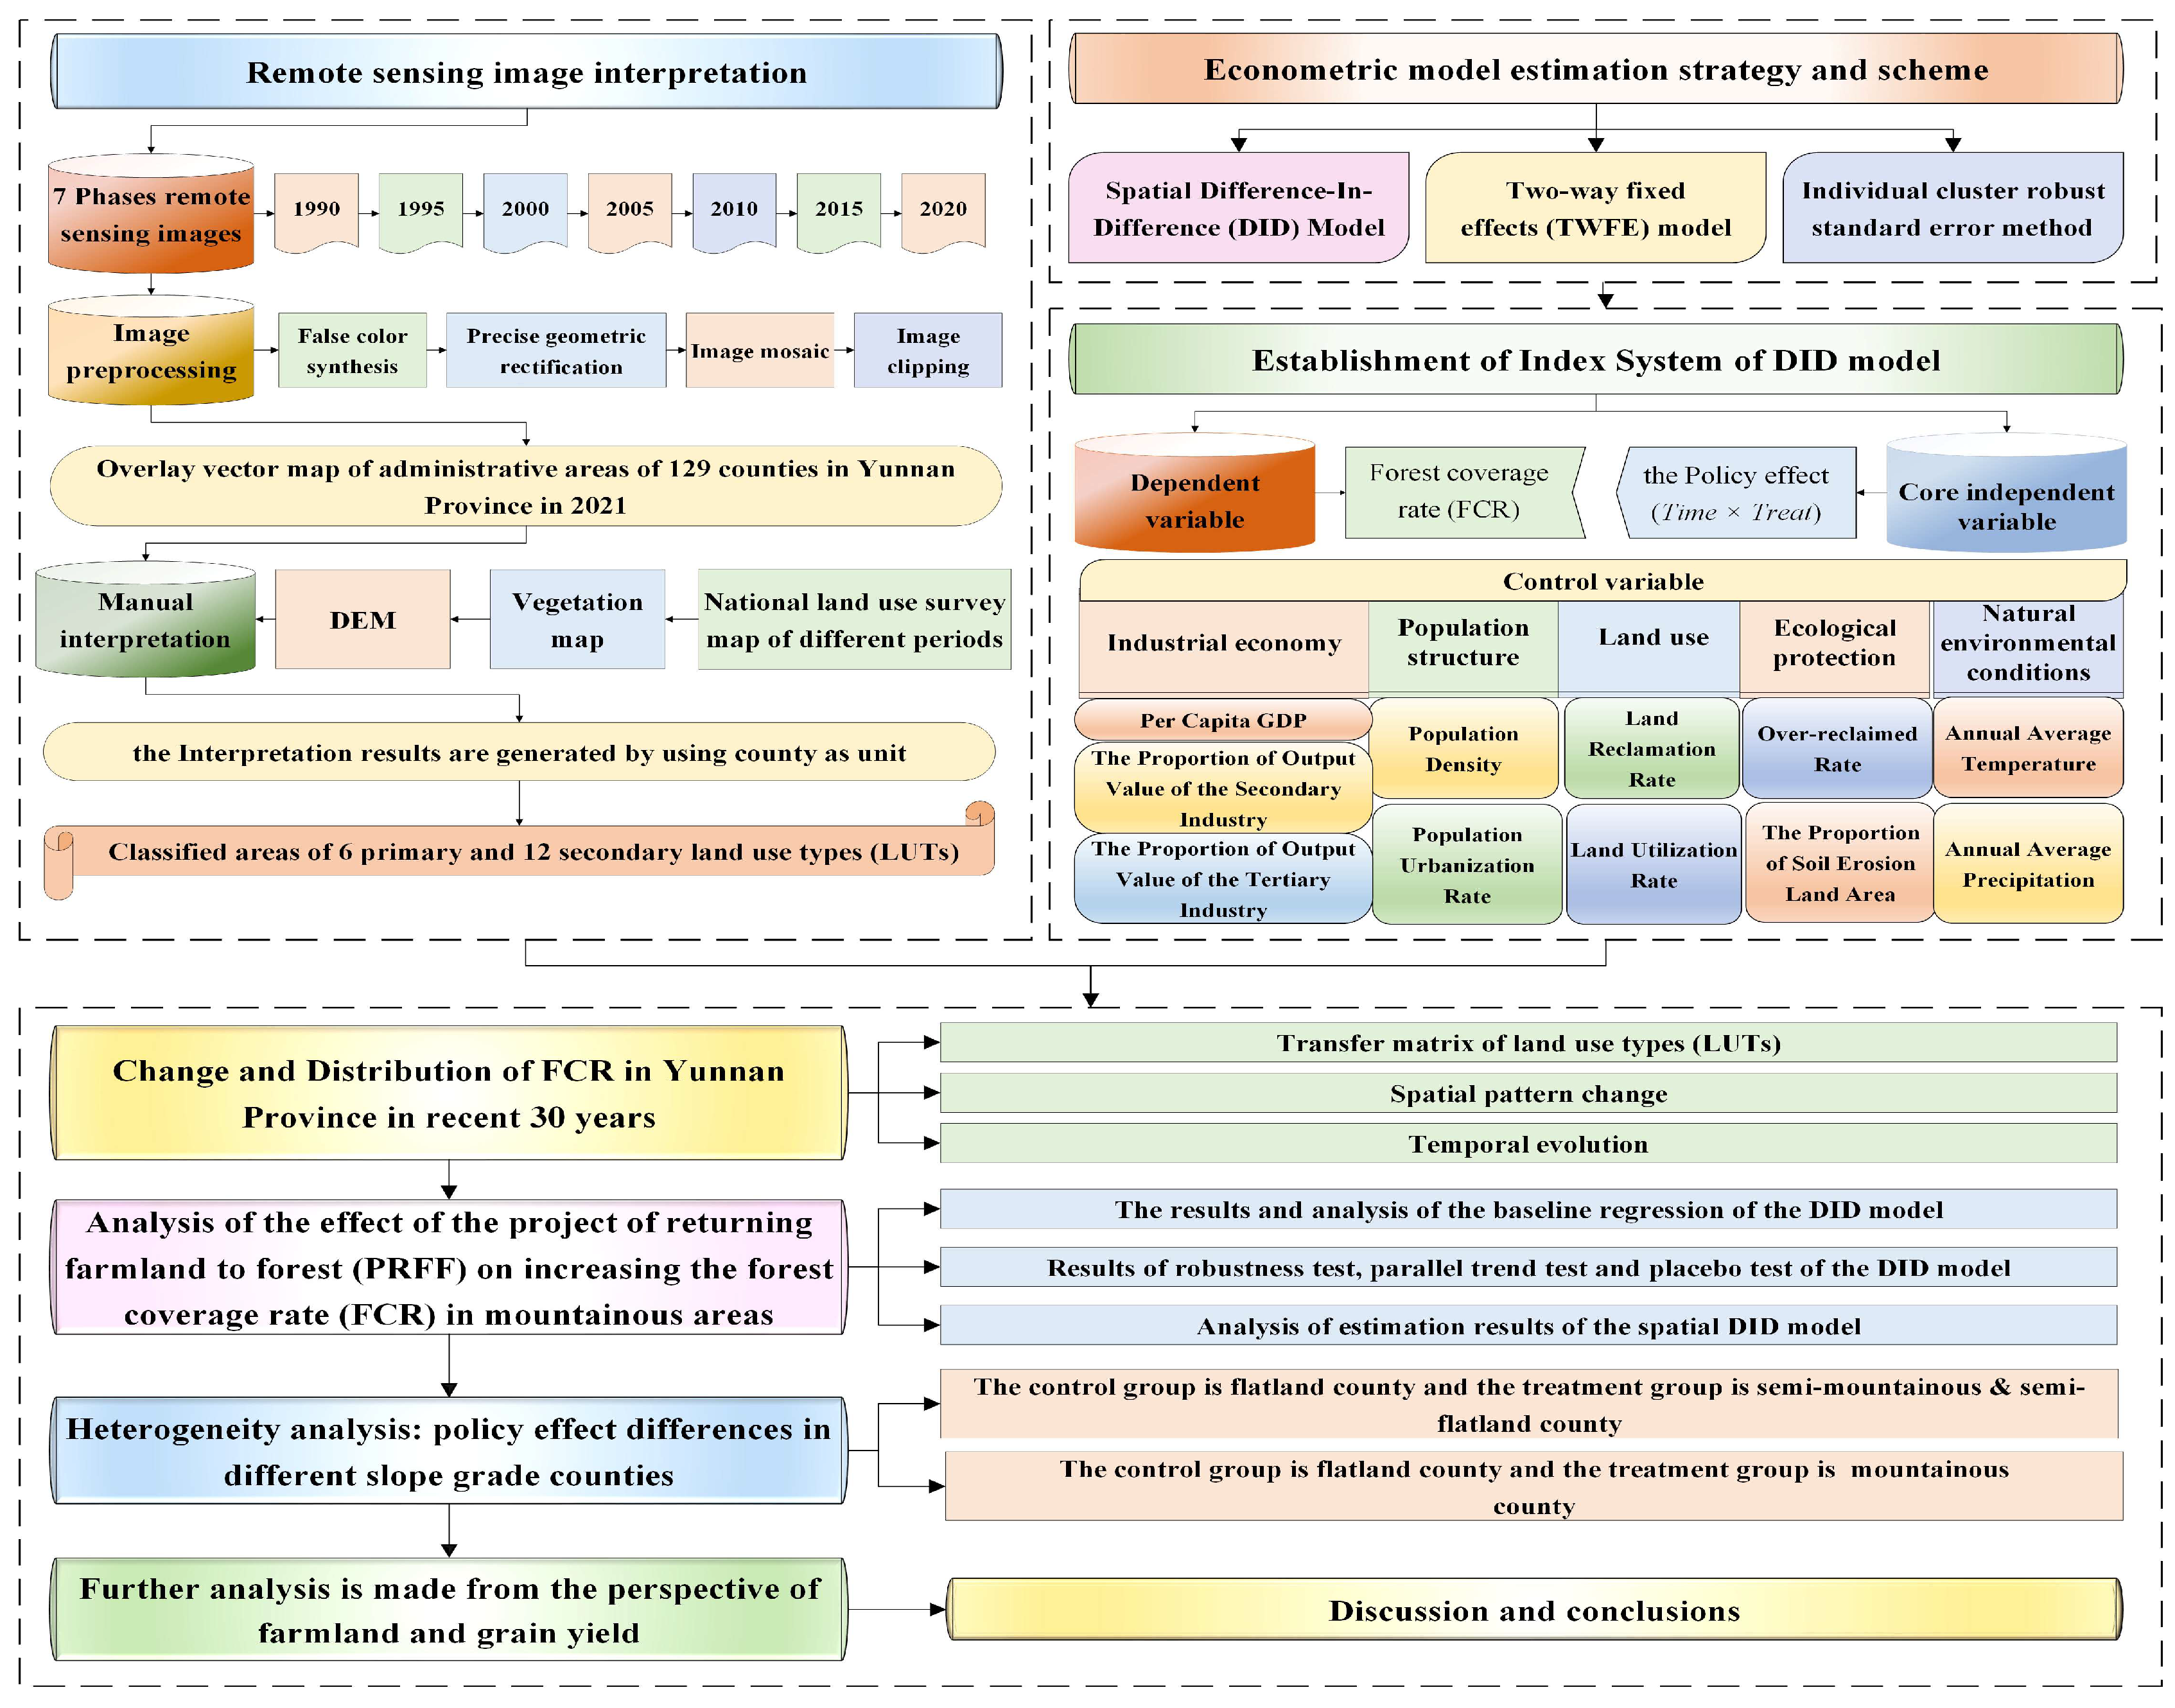
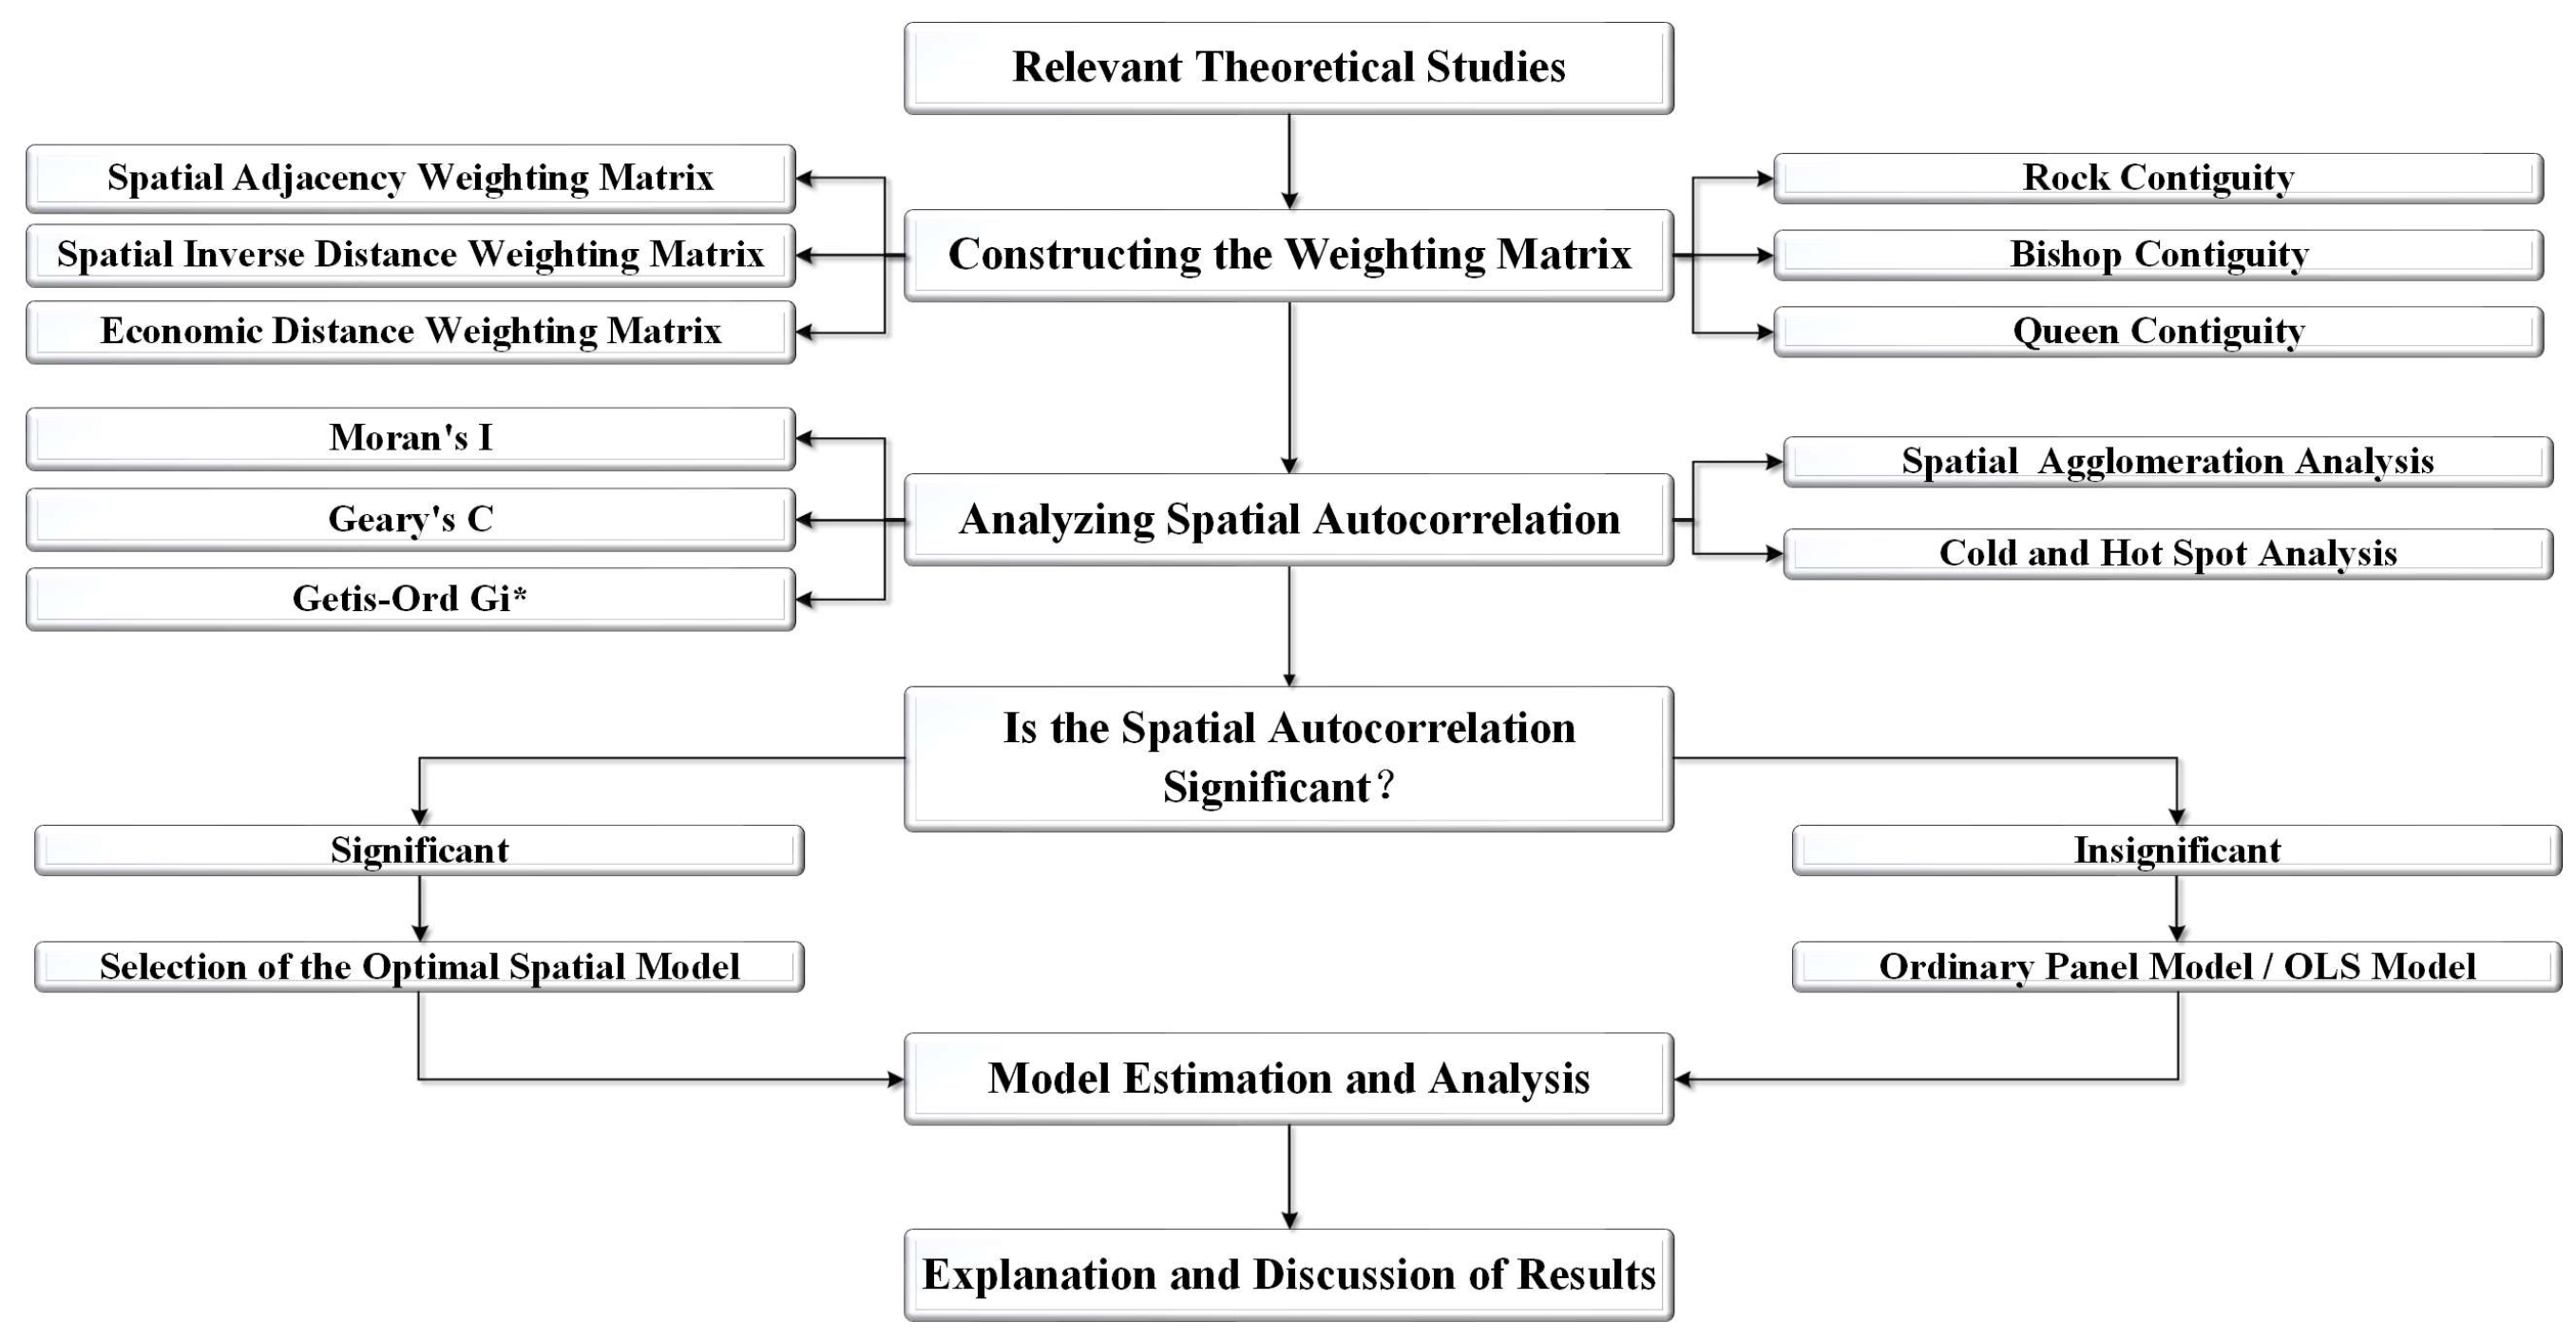
2.3.1. Analysis Process and Steps

The research steps of this study are shown in Figure 3.
Overall, the research steps of this study mainly include the following: interpreting 7 periods of RS images and obtaining LULC data by ENVI 5.3 software and ArcMap 10.5 software; constructing the indicator system; selecting suitable policy evaluation tools, such as the DID model and the spatial DID model, to estimate the policy effect of PRFF on improving the FCRs in non-flatland counties by Stata 15.1 software; carrying out routine tests of econometrics by Stata 15.1 software; and discussing the results and drawing conclusions.

2.3.2. Introduction to the Difference–in–Differences Model

The Difference–In–Differences (DID) model is a relatively comprehensive policy evaluation tool that can better answer whether PRFF can improve the FCRs in mountainous areas and the specific effect. For the multi-period panel, it can be set as [50,51]:
F C R i j = β 0 + β 1 T i m e × T r e a t + k = 1 n λ k X k , i j + γ j + μ i + ε i j
where FCRij is the dependent variable; Time is a dummy variable (set to 0 before policy implementation and set to 1 during and after policy implementation); Treat is also a dummy variable (set to 1 in the treatment group and set to 0 in the control group); Xk,ij represents the kth control variable; β0, β1, and λk represent the estimated coefficient; εij is the random error term. Furthermore, β1 represents the effect of PRFF.
In addition, compared to the method of simply controlling for two-way fixed effects (TWFE) in Equation (1), the approach of replacing time–fixed effects with interactive fixed effects of time and different prefecture-level cities has stricter requirements for the model, more rigorous estimation requirements, and more accurate estimation results [52,53]. This is because, over time, significant differences in FCR changes among counties within different prefecture-level cities may emerge due to the influence and interference of other local factors. By controlling the interaction term as the fixed effect, the interference of other factors can be effectively eliminated. The model can be set as follows:
F C R i j = β 0 + β 1 T i m e × T r e a t + k = 1 n λ k X k , i j + γ j × C i t y i + μ i + ε i j
where Cityi represents the ith prefecture-level city, and the meanings of the other variables are the same as in Equation (1).

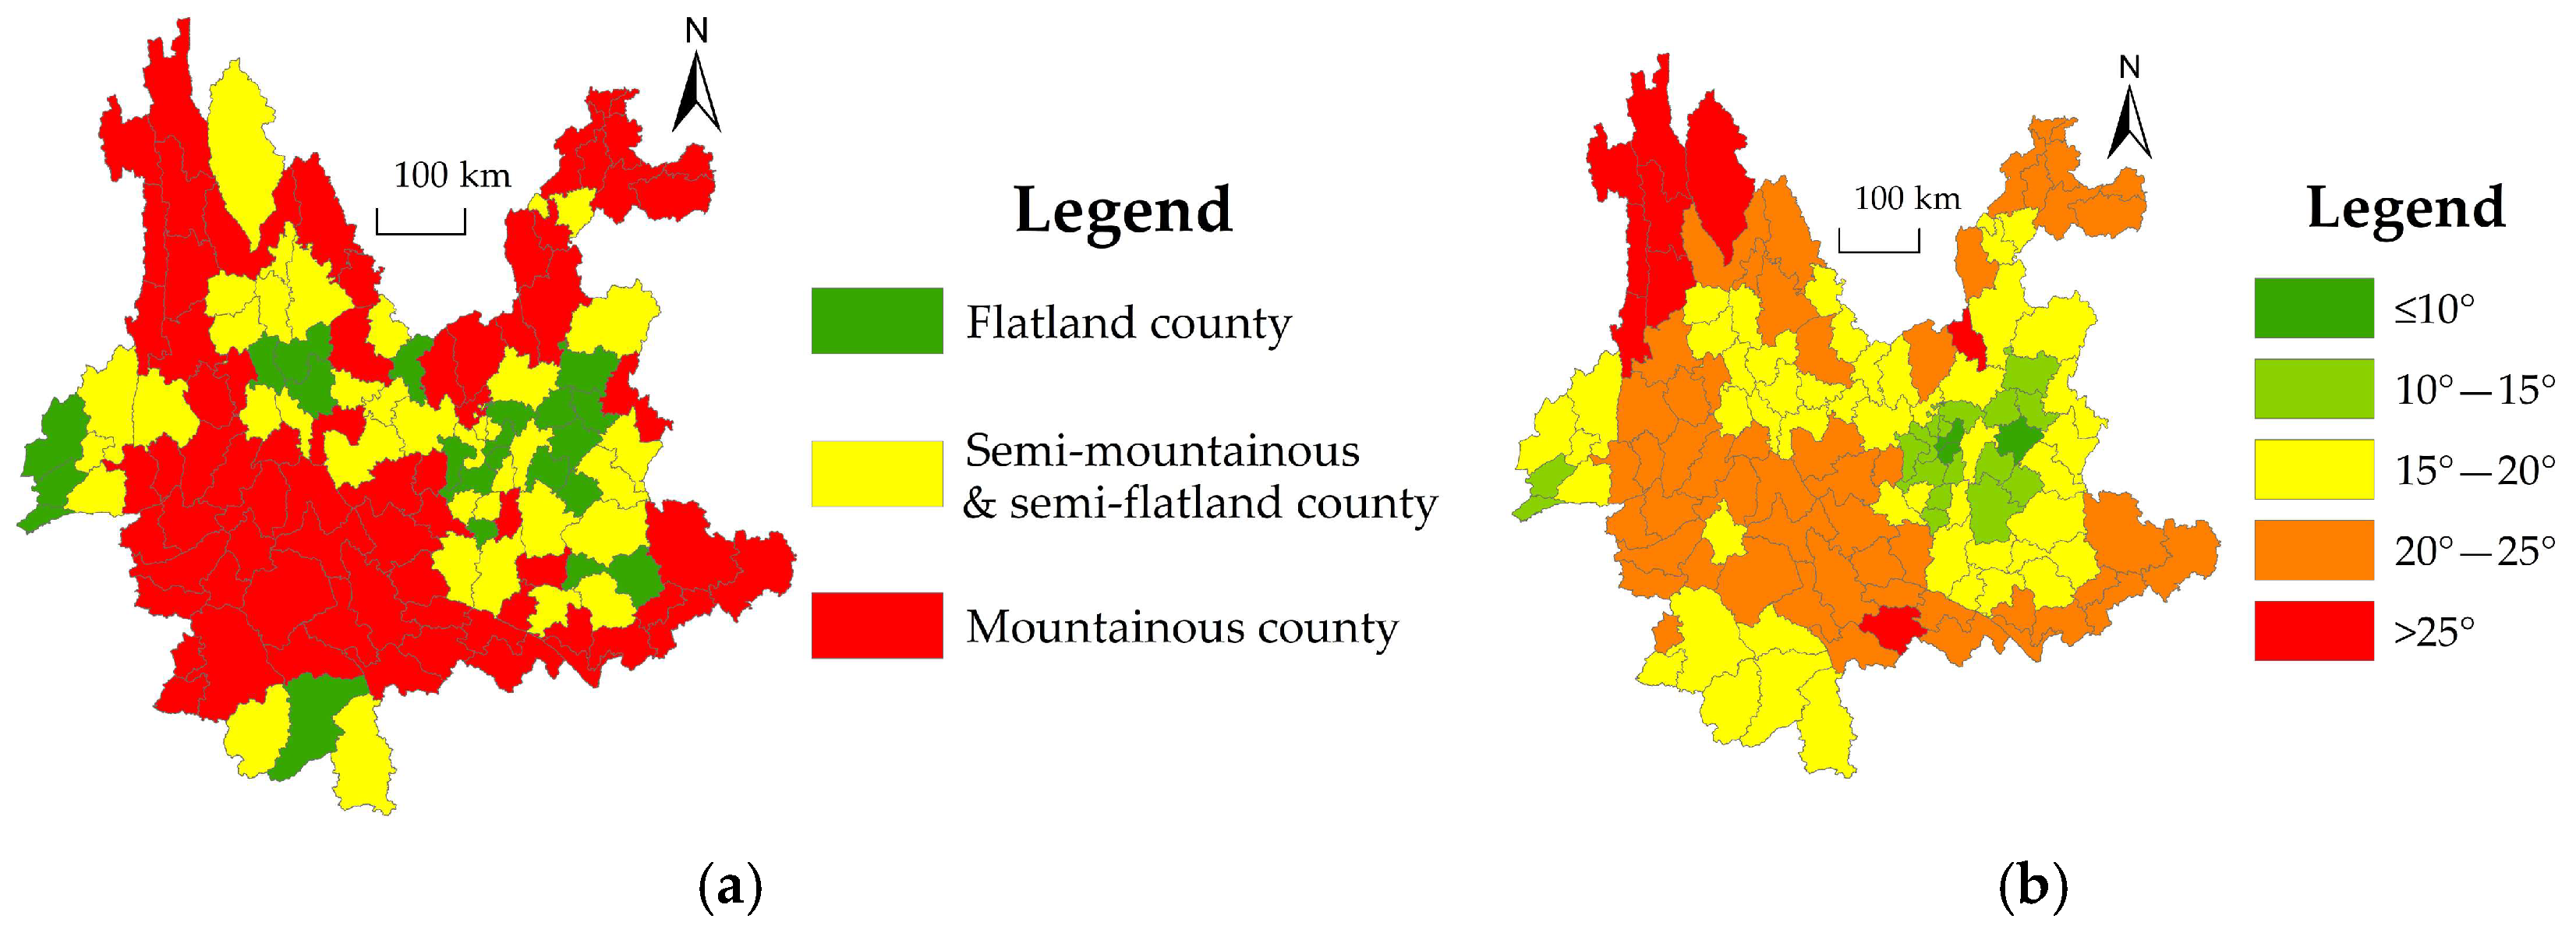
2.3.3. Classification Methods for Counties with Different Slopes and Selection of Control Group and Treatment Group

The primary purpose of PRFF is to convert steep slope farmland (≥25° slope) to forest land for ecological restoration. This is because many experiments and studies have shown that soil erosion is most severe in slope farmland with a ≥25° slope among all LUTs [41,54], and 25° is also a prohibited slope for cultivation [54]. In addition, in some ecologically fragile mountainous areas, there is still a tiny area of 15°–25° slope farmland with thin soil layers and low yield due to long-term soil erosion, resulting in a low degree of suitability for cultivation. According to the overall land use plan, it can be included in the scope of PRFF.
It can be seen that in the process of PRFF, the target is mainly steep slope farmland. In other words, if there is more steep slope land/farmland in a region, the degree of policy implementation (the area of RFF) will be greater (more significant); on the contrary, if the vast majority of land in a region is flatland, the FCR in that area is unlikely to be significantly affected by PRFF. Therefore, when studying the actual effect of the PRFF, it is essential to select the control and treatment groups scientifically and reasonably. The analysis of the above indicates that counties with overall steep slope, high proportion of steep slope, and a small proportion of flat farmland should be treated as the treatment group. In contrast, counties with an overall flat slope, a high proportion of flatland, and a large proportion of flat farmland should be treated as a control group. By constructing a suitable policy evaluation model and comparing the changes in the FCRs between these groups before and after the PRFF, the actual policy effect of the project on promoting the FCRs in mountainous areas can be accurately estimated. Fortunately, research on the classification of counties with different slopes in Yunnan has become more mature. Therefore, this study refers to the research results of Yang Zisheng et al. (2014) [55] and the Compilation Group of Agricultural Geography of Yunnan [56]. Additionally, this study also combines relevant survey data from the Planning Commission of Yunnan Province [57], Yunnan Land Administration Bureau [58], Office of Yunnan Agricultural Regionalization Committee [59], RS image interpretation results, DEM results, and the actual situation to construct the CIFA:
C I F A = P F F max P F F w 1 + P F A max P F A w 2 + N 1 max N 1 w 3 + N 2 max N 2 w 4
where PFF represents the proportion of FLA in the flatland area; PFA represents the proportion of land area in the flatland area; N1 is the number of flatlands with an area ranging from 100 to 200 km2; N2 is the number of flatlands with an area of ≥200 km2; max(·) represents the maximum value of the index in 129 counties; w1, w2, w3, and w4 represent weights, which are 0.4, 0.3, 0.1, and 0.2, respectively. Based on the above literature, this study developed basic standards for dividing the 129 counties (Table 3).
The results of this study divided the counties into three types (Figure 4a). Furthermore, Figure 4b demonstrates the rationality of using this method to divide counties based on slope grades. Counties with steep average slopes are classified as mountainous counties; those with relatively flat average slopes are predominantly considered flatland, and counties with average slope in the middle position are classified as semi-mountainous and semi-flatland (SMSF) counties.
Finally, it is still necessary to explore the potential bias issues in dividing the control group and the treatment group. The reason why this study divides various types based on various reference indicators is to regard the county as the research area. When selecting the control group and treatment groups for PRFF, factors such as farmland area and land flatness within the county are important reference indicators. The larger the proportion of the PFF is, the higher the PFA, and the more flatlands there are, the less affected the county will be by PRFF. Conversely, the larger the proportion of PFA is, the more affected the county will be by PRFF. Secondly, this study sets the critical value of the ratio of dam areas to flat farmland area at 50%, which is in line with the actual situation in Yunnan. If the ratio is higher than 50%, it indicates that the county is mostly flat land and that there is little steep slope farmland that needs to be converted to forests. Therefore, it is necessary to be included in the control group; on the contrary, if most of them area is steep slope farmland, and there is potential farmland that needs to be converted to forest, so it is necessary to include them it in the treatment group. Thirdly, the results are in line with the actual situation in Yunnan (Figure 4); the average slope is an important reference for dividing different types of counties, but it is not decisive because the implementation of PRFF needs to consider the actual proportion of steep slope farmland, and the number of flatlands should also be taken into account. Therefore, when dividing different types of counties, this study comprehensively considers key indicators such as the PFF, the PFA, and the main number of flatlands.

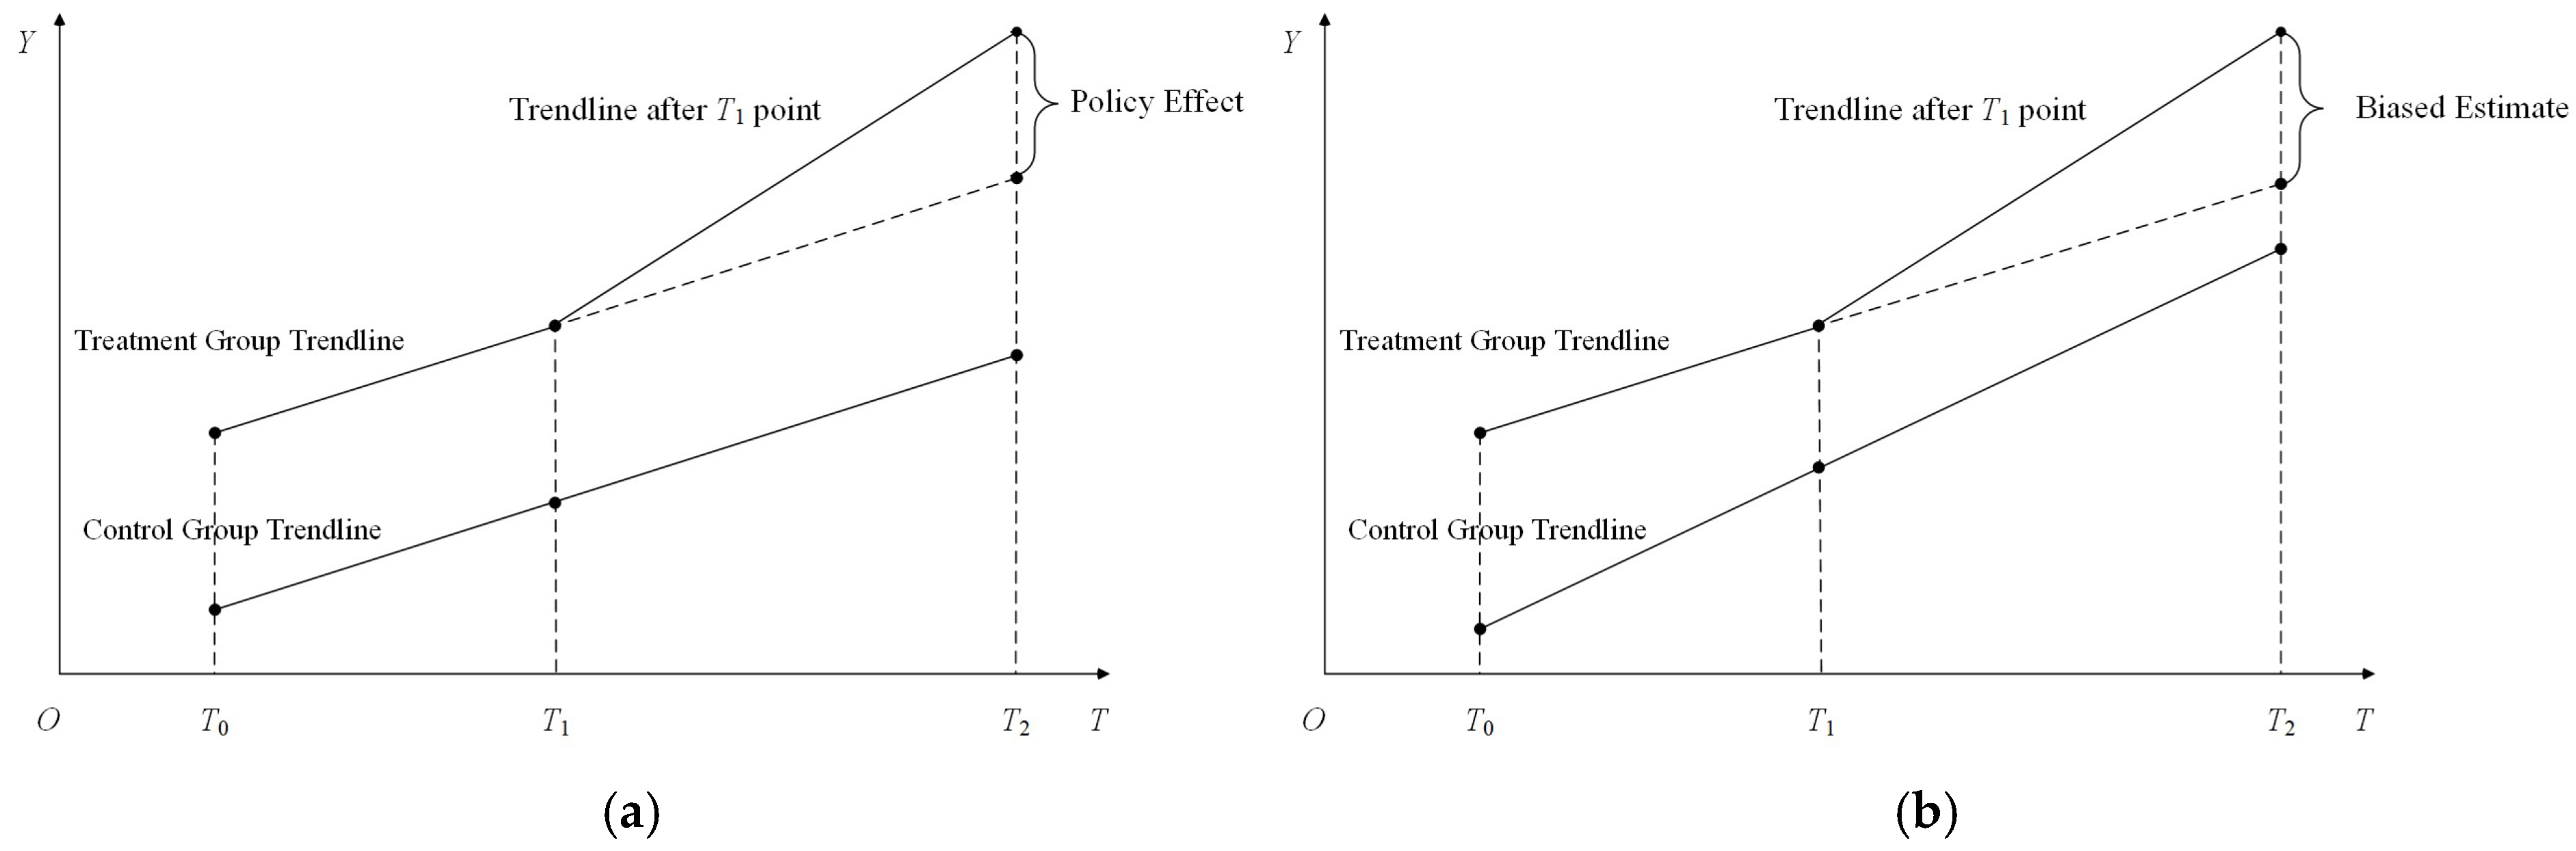
2.3.4. Introduction to the Methods of Parallel Trend Test and Placebo Test

When using the DID model to analyze the net effect of policies, it is necessary to test the parallel trend. Assuming that the policy starts to be implemented at T1 and that the target object is the treatment group, while the control group is not affected by this policy, and assuming that two sets of data can be collected from the two groups before policy implementation (T0) and after policy implementation (T2), if the trend of change between the two is the same before the policy implementation, a comparison can be made between the two to obtain the policy effect (Figure 5a).
If the two groups do not have the same change trend before the event, using this estimation idea will lead to biased results (Figure 5b). Therefore, when using the DID model, it is necessary to ensure that the two groups have the same change trend before policy implementation to obtain accurate estimation results, which requires a parallel trend test. The parallel trend test generally uses the event study approach (ESA), whose model can be set as follows [60]:
F C R i j = β 0 + β j y e a r j × t r e a t + k = 1 n λ k X k , i j + γ j + μ i + ε i j
where yearj represents the year dummy variable, which is set to 1 in the current year and 0 in all other years (for example, year2010 represents the dummy variable set to 1 in 2010 and 0 in all other years). Due to complete multicollinearity, it is necessary to exclude samples from one year before policy implementation (this study excluded samples from 1990).
The DID model passing the parallel trend test does not necessarily mean its estimation results are unbiased. This is because if other policies are issued or there are other non-random factors affecting the policy experiment in the current period, other policies or non-random factors will interfere with the estimation results (i.e., biases occur). Placebo testing can help estimate the DID model’s results in a more believable way. The commonly used placebo test is to set the policy time in advance (excluding samples after policy implementation) or randomly set the control group and the treatment group. This study intends to use both methods for the placebo test.

2.3.5. Introduction to the Spatial DID Model

As the data in this study involve 129 counties in Yunnan, there may be significant spatial autocorrelation issues in data analysis, so it may be necessary to use spatial econometric models [25]. The reason why spatial autocorrelation data is suitable for estimation by using spatial econometric model is that these sample observations will change with spatial changes (generally higher in high–value areas and lower in low–value areas, and the dependent variable is significantly affected by spatial location). Traditional estimation methods cannot effectively control the interference of spatial clustering characteristics on the estimation results. Therefore, in Formulas (1) and (2), these spatial effects can only be explained by random disturbance terms, which will may cause deviation from the estimation results of the DID model, although the DID model has already considered fixed effects of individuals and times. The main steps in establishing spatial econometric methods are clearly illustrated in Figure 6.
There are various forms of the spatial weight matrix, and this study will use the conventional spatial adjacency weight matrix to construct the spatial DID model. There are certain differences in the model settings for different types of data. Generally speaking, spatial econometric models for panel data mainly include the Spatial Autoregressive Model with Spatial Autoregressive Disturbances (SARAR), Spatial Error Model (SEM), Spatial Autoregressive Model (SAR), Spatial Durbin Model (SDM), etc. The generalized nested spatial DID model can be represented as follows [61]:
F C R i j = ρ W i Y j + θ T i m e × T r e a t + X i j β i + D i X δ + γ j × C i t y i + μ i + ε i j ε i j = λ M i ε j + v i j
where Wi, Di, and Mi are the ith row of the W, D, and M, respectively; X is the control variable matrix; β and δ are the parameter vectors; εj is the residual vector; ρ and λ are spatial parameters; θ is the policy effect of PRFF that is focused on the most in this study; and the meanings of the other variables are the same as Equation (1). Compared with Formula (1), Formula (5) has an additional term of ρWiFCRj and an additional term of λMiεj in the disturbance term, which can better control the influence and interference of spatial position on FCRs in different regions in residuals and estimation coefficients, thus can obtain more accurate estimation results. Additionally, traditional DID model do not have spatially related parameter settings, so there may be deviations. In specific analyses, it is necessary to select the optimal model based on the statistics of error and lag terms [61].

2.3.6. The Construction of the Model Index System and the Selection of Control Variables

As mentioned above, there is an urgent need to use appropriate econometric model analysis tools for accurate estimation when studying the policy effect of PRFF. Before constructing an econometric model for estimation, it is necessary to clarify different variables and build a reasonable indicator system.
In terms of selecting essential variables, the dependent variable used in this study is the panel data of the FCRs of 129 counties in 7 periods obtained through RS image interpretation, and the core independent variable is the interaction term (Time × Treat). However, selecting appropriate control variables and constructing a reasonable indicator system for the control variables is still an essential step. It should be noted that the TWFE model can better control all other disturbances that do not change with time (such as terrain and slope) and the same impact of disturbances in each year (such as COVID–19, unified price changes and government policies promoting afforestation). Therefore, when selecting control variables, only the influencing factors closely related to the FCR and change with time and individuals need to be considered.
Based on this, this study intends to select other important influencing factors and construct a control variable indicator system. When selecting control variables, this study referred to the relevant indicator system and driving factors constructed in existing studies on influencing factors of the FCR [25,62,63,64,65,66,67,68]. Drawing on previous research and trends in the study of factors influencing the FCR, this study integrates the insights of scholars [35,69,70]. These scholars have proposed reasonable indicators for assessing land use and ecological protection, urbanization level, geographical conditions, and other relevant factors. When using RS images to interpret or study related issues, this study constructed a control variable indicator system for the FCR from five dimensions (Table 4). As some indices have exponential growth, constructing a linear model may not adequately control their impact and interference during analysis. Following the approach suggested by Yang Renyi et al. (2024) [69], this study introduces the natural logarithmic form of the two indicators (i.e., per capita GDP and population density) into the model (Table 4).

2.4. Research Hypothesis

Most existing research indicates that PRFF has played an important role in improving FCRs and the ecological environment in mountainous areas. To investigate the effect of PRFF on the FCR, this study divided 129 counties in Yunnan into three groups: flatland county, SMSF county, and mountainous county. Flatland county was used as the control group, while SMSF county and mountainous county were used as the treatment groups. Therefore, theoretically speaking, the overall area of flatland county is relatively flat, with a small proportion of steep slope land (steep slope farmland) and a small area that needs to be converted from farmland to forest. Therefore, the impact of PRFF can be almost ignored, making it suitable as a control group. For SMSF county and mountainous county, the overall slope is steep, with more steep slope land (steep slope farmland) and a larger area that needs to be converted from farmland to forest. Therefore, the implementation of PRFF will theoretically effectively improve the FCR in these areas. Based on this, this study proposes the following hypotheses:
Hypothesis 1 (H1):
PRFF has a positive impact on the FCR in SMSF counties.
Hypothesis 2 (H2):
PRFF has a positive impact on the FCR in mountainous counties.
In addition, considering that mountainous counties have a larger overall slope and more steep slope land (steep slope farmland) compared to SMSF counties, the implementation of PRFF in mountainous counties may have a greater effect. Based on this, this study proposes the following hypothesis:
Hypothesis 3 (H3):
The positive impacts of PRFF on the FCR in mountainous counties are higher than those in SMSF counties.
If the above hypotheses are true, it is necessary to further explore the impact of PRFF on food security. Lin et al. (2014) [3] found that although the implementation of PRFF has converted steep slope farmland into forest, which has led to a reduction in farmers’ farmland area to some extent, the implementation of PRFF has also prompted farmers to shift from extensive agricultural production methods to intensive management. This can not only increase food production and ensure food security but also promote a potential increase in income for farmers. Based on this, this study proposes the following hypothesis:
Hypothesis 4 (H4):
Although the implementation of PRFF will convert steep slope farmland into forest, it has no significant negative impact on grain yield and farmland; on the contrary, it may have a potential beneficial impact on food security.
Although theoretically, the implementation of PRFF has a series of benefits, it is still necessary to scientifically evaluate and test its effects. Therefore, this study will use research tools such as the DID model and spatial DID model to conduct empirical tests.

3. Results

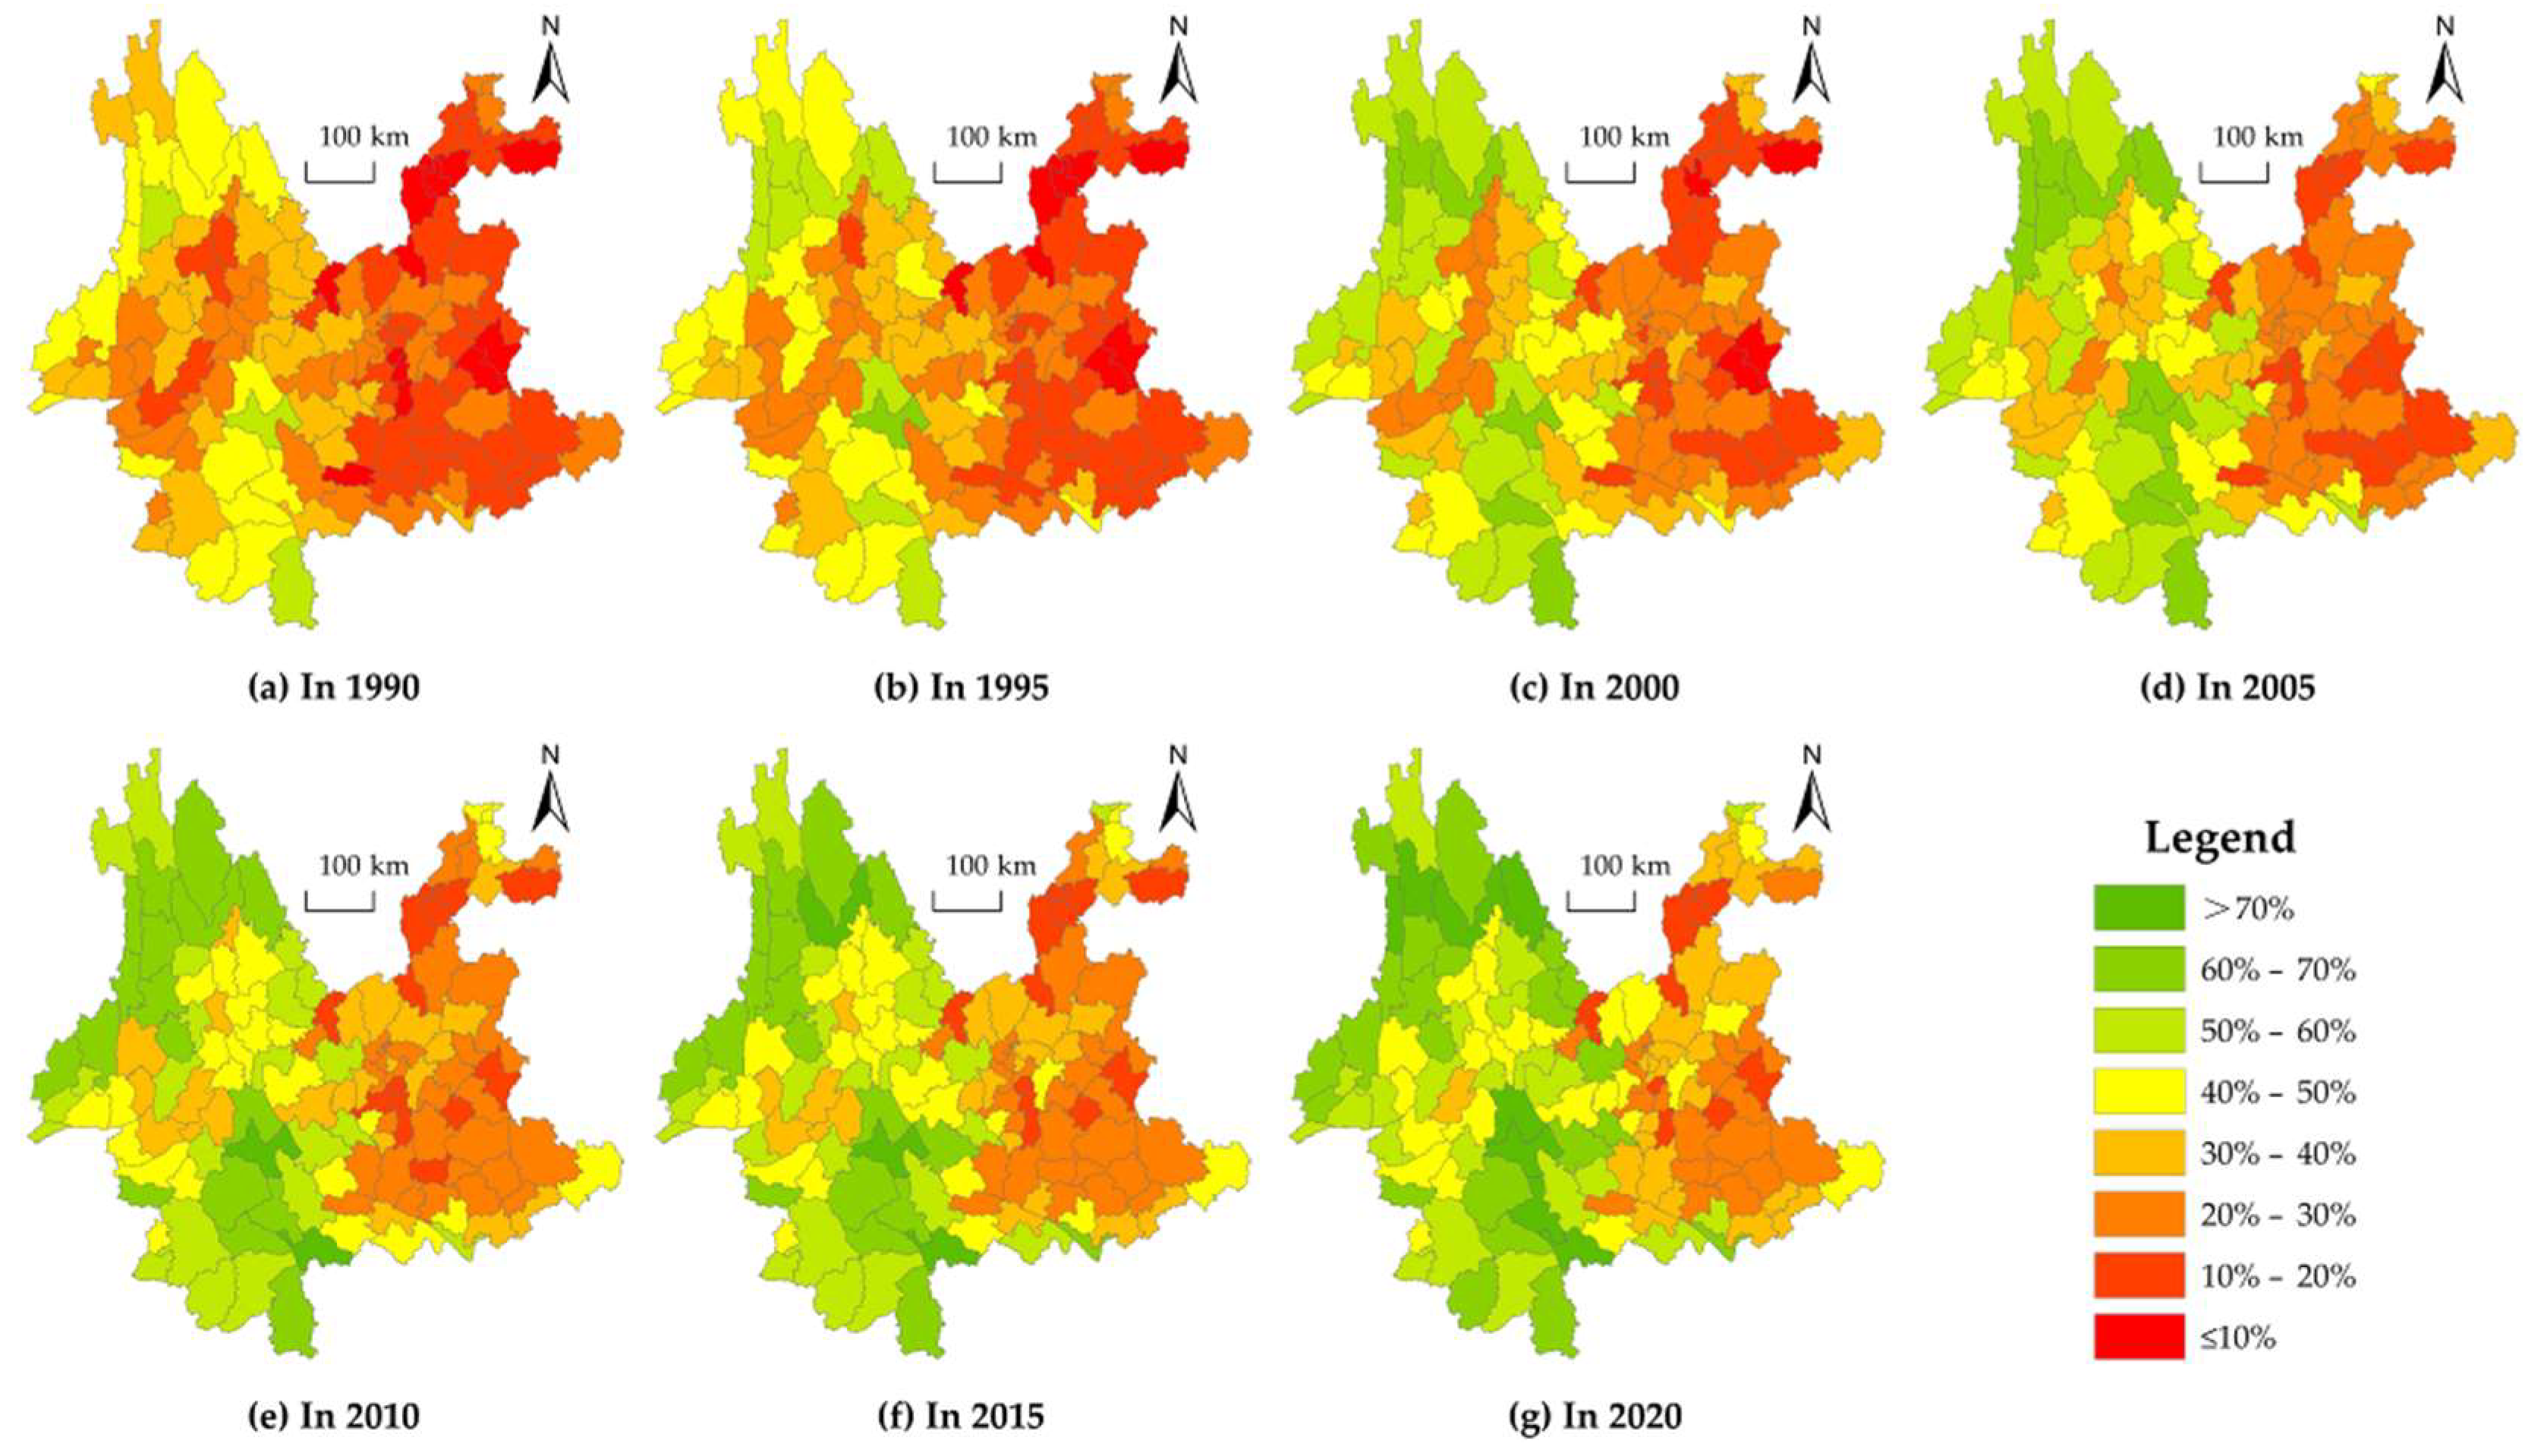
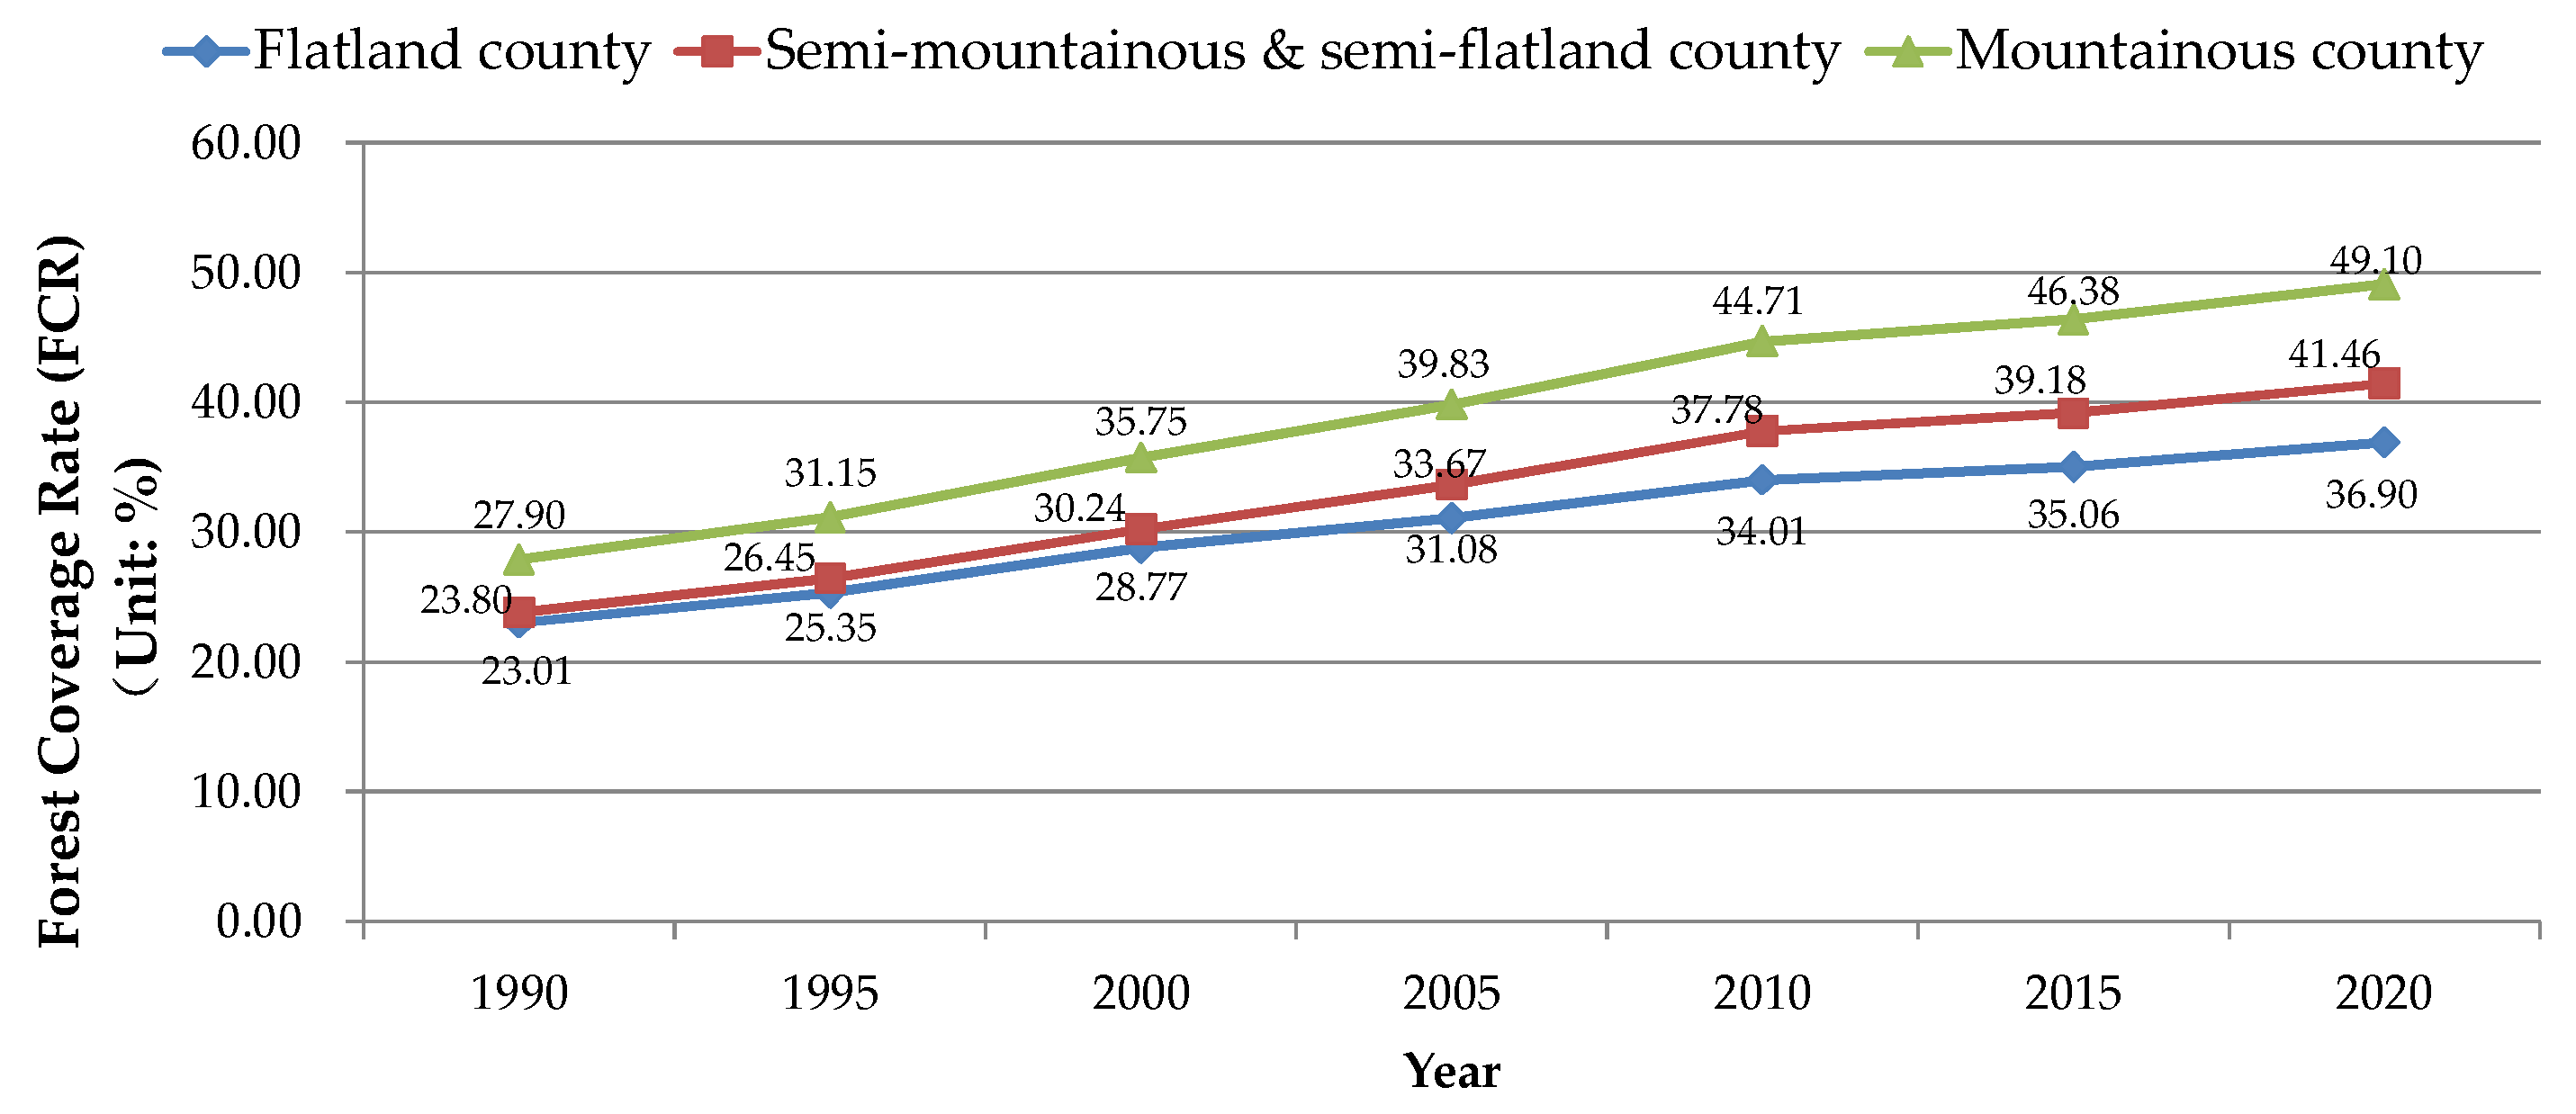
3.1. Changes and Distribution of FCRs in Yunnan over the Past 30 Years

This study calculated the FCRs of 129 counties over seven periods based on RS interpretation results and GIS technology (Figure 7).
It can be seen that the FCRs of various counties have significantly improved in the past 30 years, especially for the eastern part of Yunnan, which has a relatively fragile ecological environment. The achievement is also due to Yunnan’s emphasis on ecological protection and the efforts of extensive-scale afforestation. In addition, this study, by combining and comparing the classification results in Figure 4, finds that the FCRs in Yunnan generally show a pattern of higher in mountainous areas and lower in flat counties, as well as a trend of lower in the east and higher in the west. Therefore, it is reasonable to classify the 129 counties into three types.
In addition, it is necessary to understand the changes in LUTs in Yunnan from 2000 to 2020 (Table 5).
As shown in Table 5, the area of CFL in Yunnan was 14.1458 Mha (141,458 km2) in 2000 but increased to 18.8472 Mha (188,472 km2) in 2020, with a net increase of 4.7014 Mha (47,014 km2) within 20 years and a net average annual growth rate of 1.45%. In addition, the transfer matrix of LUTs clearly reports the conversion of FLA and CFL area. In the past 20 years, although 56,200 ha (562 km2) of CFL had been converted to farmland, 71,000 ha (710 km2) of farmland had been converted to CFL. Therefore, a portion of farmland has been transformed into CFL, resulting in a net increase of 14,800 ha (148 km2) in terms of CFL.
The results in Figure 7 show that the FCRs in Yunnan roughly show the characteristics of low in the east and high in the west. Therefore, it is necessary to further explore the spatial pattern and distribution of FCRs in different counties before and after implementing PRFF (Figure 8).
As shown in Figure 8a,c, the FCR in each county has significantly increased after the implementation of PRFF. However, this result is caused by various reasons, and PRFF may only be one of the more critical factors. Figure 8b,d shows that the FCRs in Yunnan generally indicate a trend of low in the east and high in the west, with more obvious spatial agglomeration. This further suggests that using spatial econometric models may be more appropriate when studying the effect of PRFF. Additionally, there have been minor changes in the distribution of cold and hot spots following the implementation of PRFF. Many counties in eastern Yunnan have transitioned from insignificant to cold spot areas, with several exhibiting more pronounced cold spot characteristics. Moreover, certain counties in southern Yunnan, previously identified as hot spots, have seen a heightened prominence of their hot spot characteristics since the PRFF implementation.
In addition, this study further drew the trend of the temporal changes in FCRs in different levels of counties (Figure 9) to more intuitively explore their change rules.
From Figure 9, it is evident that the overall FCRs of Yunnan exhibit a pattern of “mountainous county > SMSF county > flatland county”. Two main characteristics can be observed: (1) before the implementation of PRFF in 1990 and 1995, the FCRs of the three types of counties followed a roughly parallel trend, providing a strong basis for the subsequent use of the DID model; and (2) post-2000, the growth of the FCRs in non-flatland counties appears to have slightly exceeded that in flatland counties, and the mountainous counties show the most notable increase. To better analyze the changes in the FCRs of different types of counties, this study further calculated some representative indicators (Table 6).
Table 6 shows that the overall difference in the FCR changes among different types of counties between 1990 and 2000 (before the implementation of PRFF) is relatively small. Taking the flatland county and the non-flatland county as examples, the non-flatland county only increased its FCR by 1.5976% higher than the flatland county during this period, with an average annual growth rate of 0.2208% higher than the flatland county. However, after implementing PRFF, the differences in FCR changes among different types of counties have become more apparent. The FCR of the non-flatland county increased by 4.4904% higher than that of the flatland county during this period, with an average annual growth rate of 0.3446% higher than that of the flatland county.

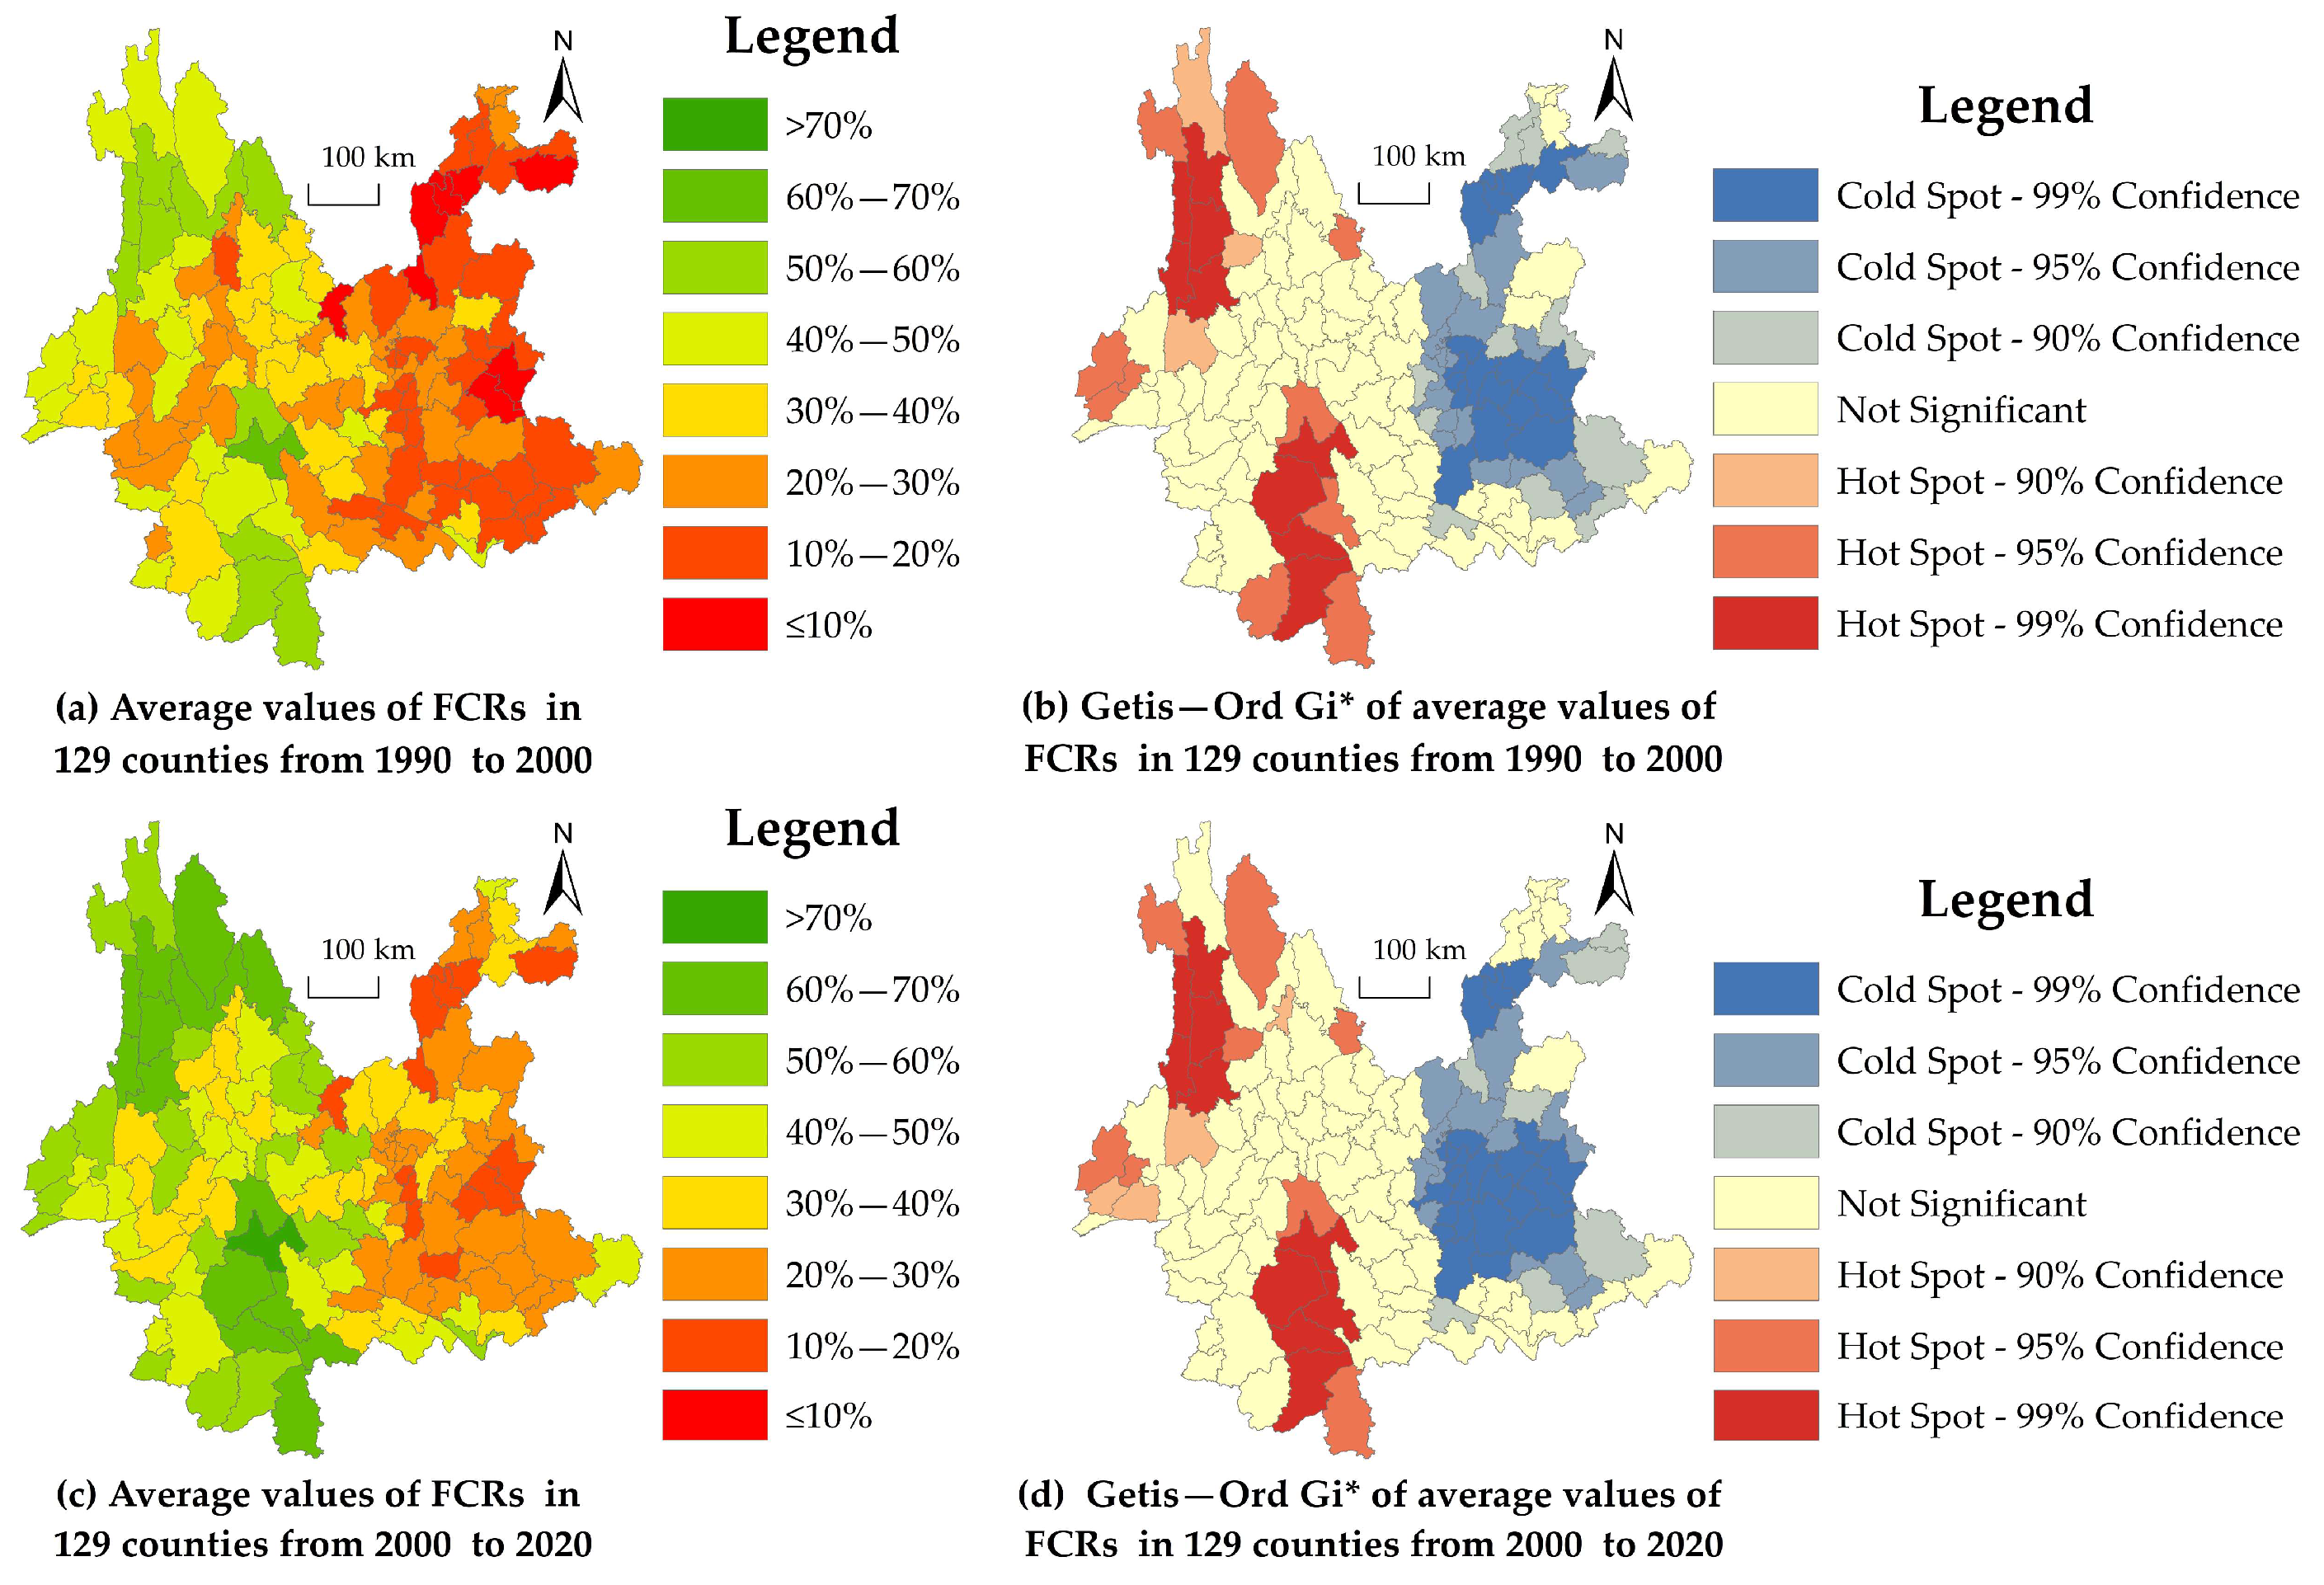
3.2. Analysis of the Effect of PRFF on Increasing FCRs in Mountainous Areas

3.2.1. Baseline Regression Results and Analysis of the DID Model

To better verify the robustness of the model, this study constructed baseline regression results without considering control variables and considering control variables simultaneously (Table 7).
As shown in Table 7, after using the TWFE estimation method to consider the interference of individual and time effects and using the individual cluster robust standard error method, all estimation results are significantly positive, and the significance levels of model (1) and (2) are 1% and 5%, respectively, indicating that the model is robust. The estimated value of model (2) is 2.3880, slightly lower than 3.8536 in model (1), indicating that the other control variables are also affecting the FCR, and the results, without considering control variables, slightly overestimate the policy effect of PRFF. Based on model (2), its estimated coefficients indicate that compared to flatland counties, PRFF has increased the FCRs in mountainous areas of Yunnan (including SMSF counties and mountainous counties) by approximately 2.3880%.

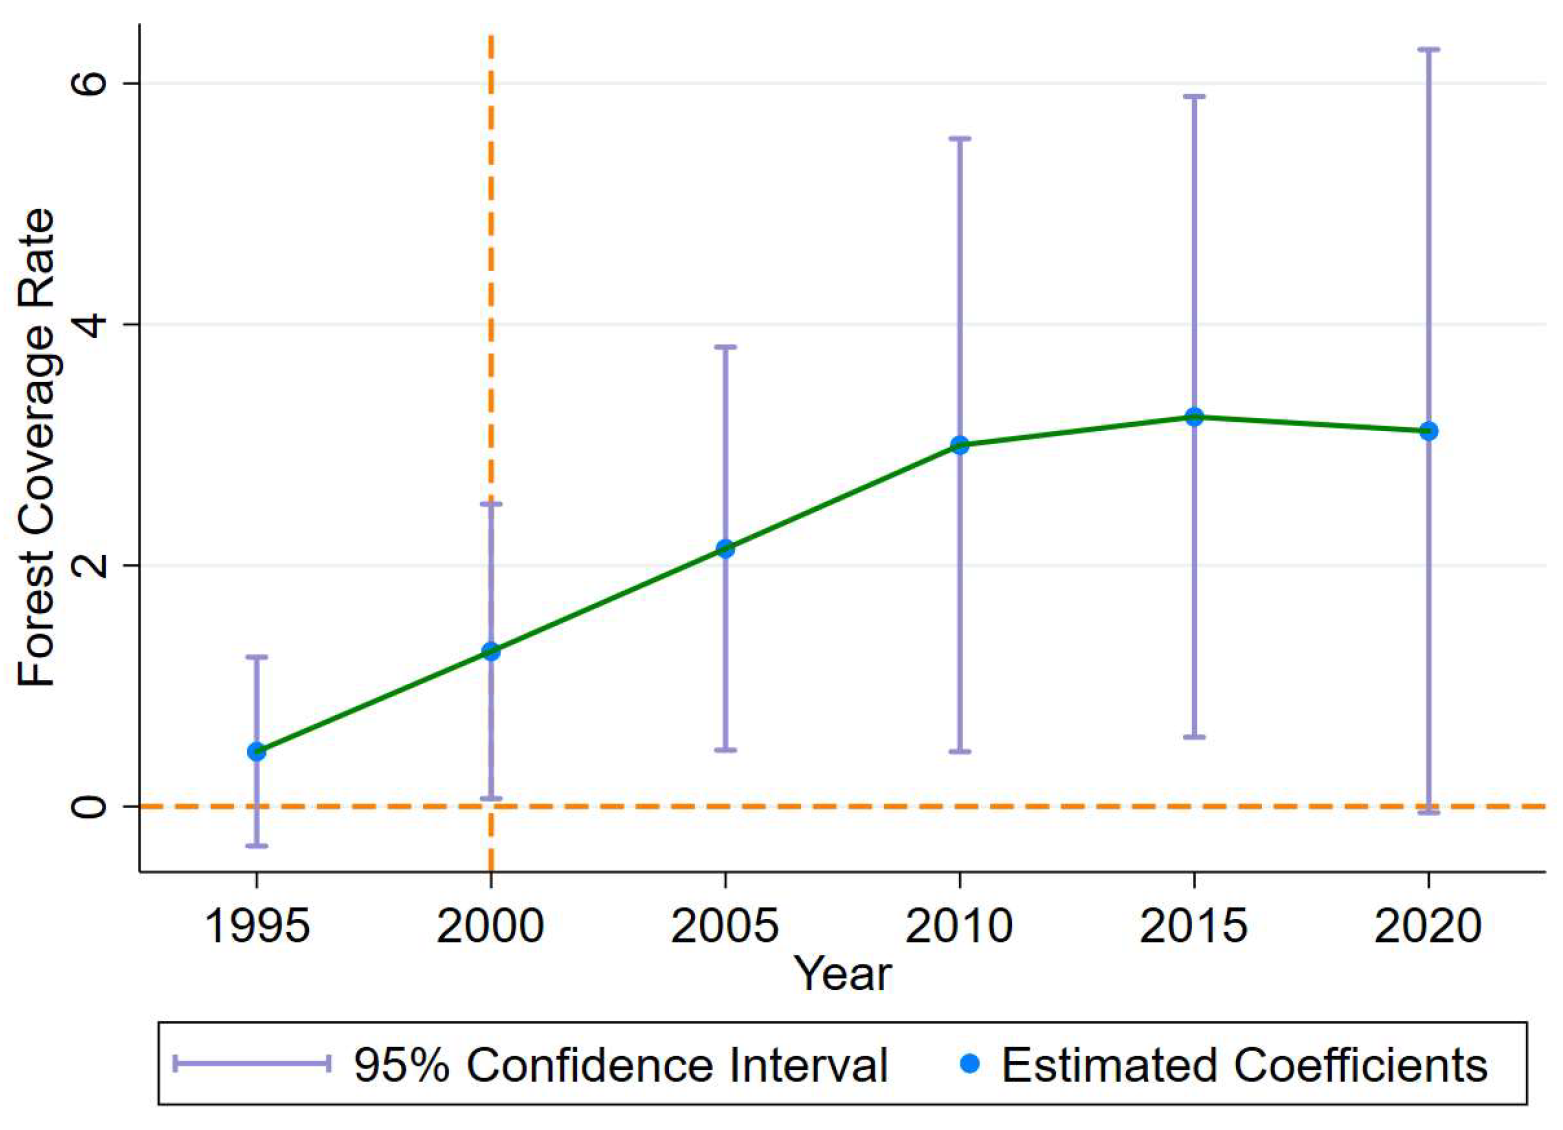
3.2.2. Robustness Test, Parallel Trend Test, and Placebo Test Results

Although the baseline regression results were significantly positive, there is concern that other factors may interfere with the results. Accordingly, this study adopts two methods to test the robustness of the model: (1) Considering that the spread of COVID-19 may have a greater impact on the economy and society, this study plans to remove the data in 2020 and reconstruct the model to verify further whether the COVID-19 epidemic will interfere with the results (Table 8). (2) Although time–fixed effects can effectively control all other interferences that simply change over time, these interferences may vary in different prefecture-level cities. Therefore, this study uses the interaction term of time dummy variables and prefecture-level city dummy variables instead of time fixed effects for estimation (Table 8).
The estimation results in Table 8 are all significantly positive, and the significance levels of models (1) to (4) are 1%, 5%, 1%, and 1%, respectively. Comparing the results of Table 7 and Table 8 reveals relatively minor differences in the estimated results: without considering the control variables, the estimated coefficients of model (1) in Table 7 and model (1) and model (3) in Table 8 are 3.8536, 3.3835, and 2.9458, respectively; when considering the control variables, the estimated coefficients for model (2) in Table 7 and model (2) and model (4) in Table 8 are 2.3880, 2.0189, and 2.1045, respectively. The above estimation results indicate that the model is robust.
Next, this study will examine the parallel trend (Figure 10). The implementation of PRFF in Yunnan was roughly in 2000. As shown in Figure 10, the estimated coefficient of the model in 1995 before policy implementation was very close to 0. Its 95% confidence interval (CI) contained the 0 value (the 0 value horizontal line crossed the 95% CI), meeting the assumption of the parallel trend.
Although the DID model meets a parallel trend, it is not ruled out that other factors may interfere with the results completely. For example, during the implementation of PRFF, other unrelated policies may be implemented at this time, which also significantly impact the treatment group. Therefore, the purpose of the placebo test results is to eliminate interference from other factors on the results. Based on this, this study used two methods for placebo testing: (1) assuming that PRFF had been implemented since 1995, and (2) assuming that this study mistakenly selected the two groups, PRFF mainly affects the northern region/southern region of Yunnan. If the model constructed according to these assumptions is not significant, it indicates that the model is unlikely to be affected by other non-random factors.
As shown in Table 9, all estimated results are not significant, and the placebo test is passed. Therefore, the DID model can relatively accurately reveal the policy effect of PRFF, and no obvious deviation needs to be corrected.

3.2.3. Analysis of Estimation Results of Spatial DID Model

Although the estimation results are unbiased, there is concern that other factors may interfere with the model. As mentioned earlier, there is a significant spatial clustering in the FCRs of Yunnan, which roughly shows the characteristics of low in the east and high in the west. Therefore, the DID model may have spatial autocorrelation issues that affect the estimation results. Specifically, as shown in Figure 8, the FCRs of various counties in Yunnan exhibit a clear spatial correlation, with lower FCR values in eastern counties and higher FCR values in western counties. Therefore, based on the results in Table 10, it is evident that the FCRs in various counties of Yunnan have been significantly affected by geographical location. Therefore, although the above DID model controls various possible interferences as much as possible, it still ignores the influence of spatial position on FCR. Therefore, it is necessary to use spatial econometric models for more accurate estimation. Based on this, this study conducted spatial autocorrelation tests (Table 10).
As shown in Table 10, the p-values of the spatial error and spatial lag terms are very significant. Except for the statistical significance level of 5% for the Robust LM–lag term, all other statistical measures passed the 1% significance level test. It can be seen that the model has obvious spatial autocorrelation issues, and it is necessary to use a spatial econometric model. Therefore, this study will use the SARAR model for estimation. Meanwhile, this study also presents the estimation results of other spatial DID models to better analyze their robustness (Table 11).
As shown in Table 11, model (2) is the optimal model for this study, with an estimated coefficient of 1.8082 that is significant, indicating that compared to flatland counties, PRFF has increased the FCRs in mountainous areas of Yunnan (including SMSF counties and mountainous counties) by about 1.8082%. In addition, comparing other models that did not consider the control variables and that considered the control variables, it can be found that all of the estimation results are positive and have passed the 1% significance level test with slight differences, indicating that the spatial DID model is robust.

3.3. Heterogeneity Analysis: Differences in Policy Effects of the Counties with Different Slope Grades

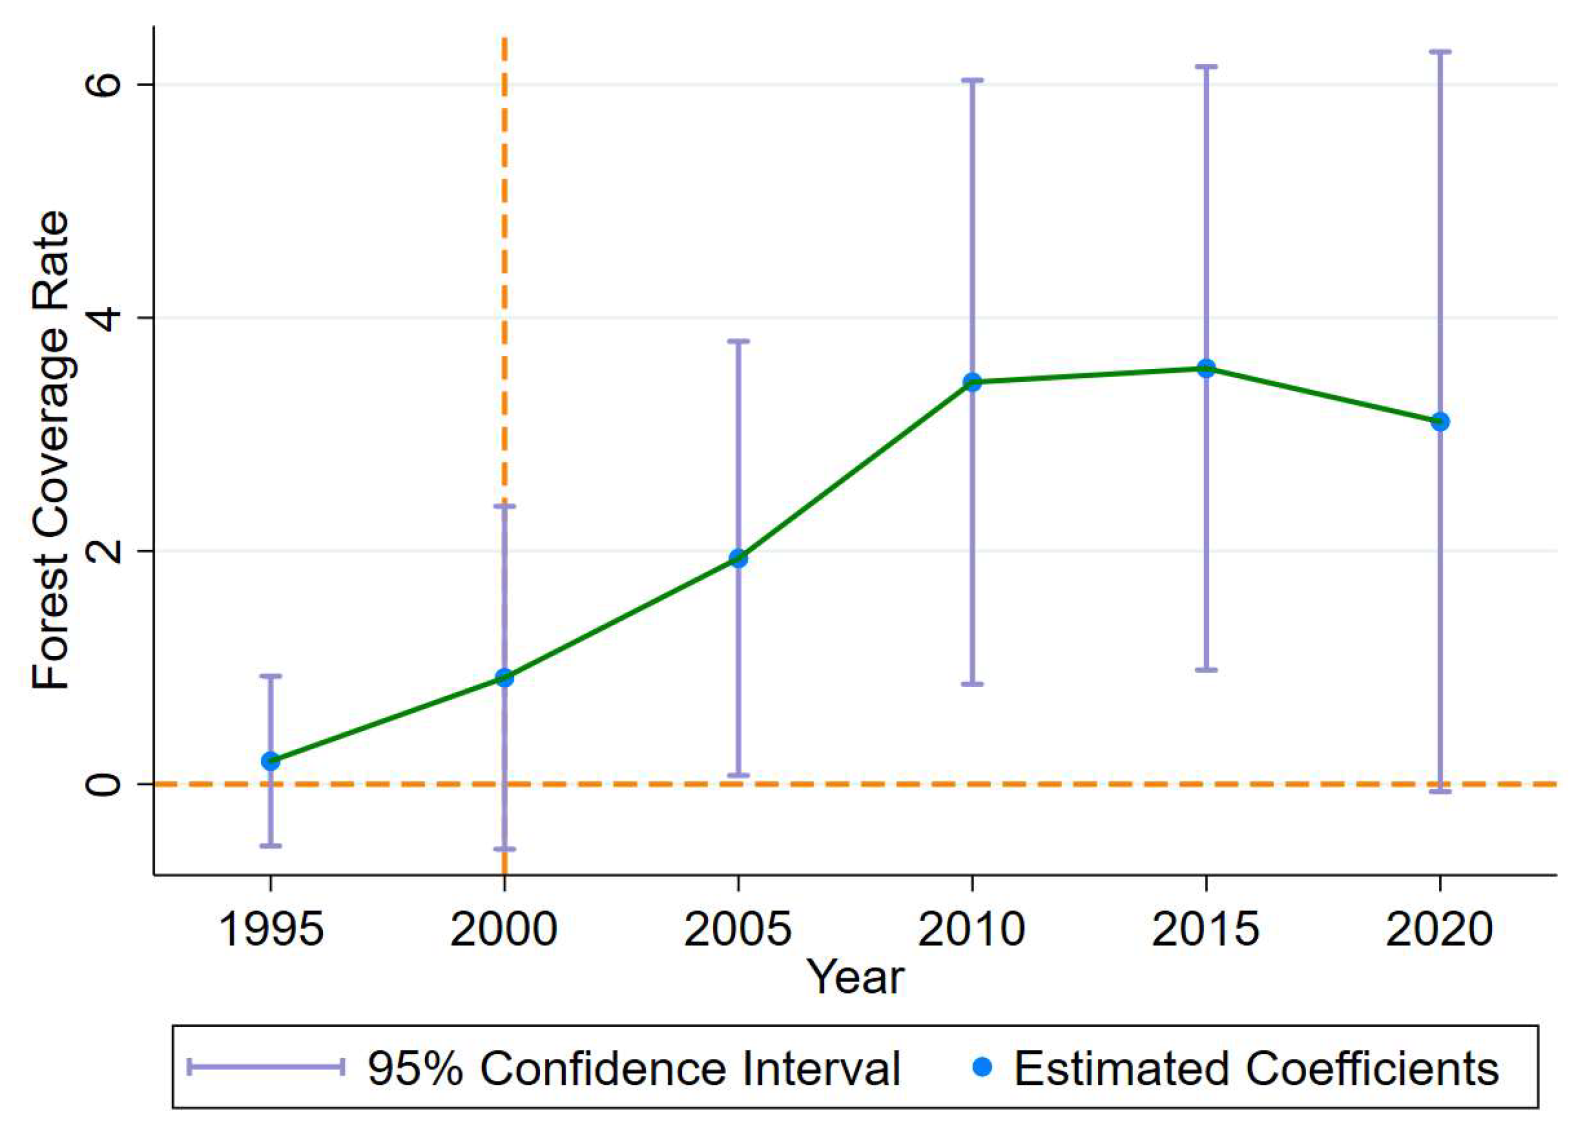
3.3.1. Estimation and Test Results Using Flatland County as the Control Group and SMSF County as the Treatment Group

The use of the DID model and spatial DID model has effectively revealed the overall effect of PRFF on improving FCRs in mountainous areas. However, it cannot be denied that there are significant differences in slope, altitude, and other conditions between the SMSF counties and the mountainous counties. Therefore, the implementation effect of PRFF may also differ between the two. Thus, this study will change the control group and treatment group to explore the differences in policy implementation among different groups. Firstly, this study will construct the spatial DID model when using flatland counties as the control group and SMSF counties as the treatment group (Table 12).
As shown in Table 12, the estimation results of each model are significantly positive. Similarly, the absolute value of the estimated coefficient after considering the control variable has decreased, indicating that the control variable has effectively controlled for the interference of other factors. The estimated coefficient of model (2) in Table 12 is 1.7131, slightly lower than the estimated coefficient of model (2) in Table 11, which is 1.8082. That is to say, the effect of PRFF on SMSF counties is smaller than that on the entire mountainous areas, indicating that the effect of PRFF on SMSF counties may be slightly smaller than that on mountainous counties.
Figure 11 reports the parallel trend test results estimated by using the spatial DID model. As shown in Figure 11, in 1995 before the implementation of the policy, there was no significant difference in the FCRs between the two groups, and the 95% CI contained the 0 value. After the implementation of the policy, the difference between the two gradually began to widen, indicating that PRFF had gradually taken effect. In addition, this study conducts robustness tests by removing the year of COVID-19 or conducting a 5% bilateral tail reduction. The estimated results are still significantly positive and close to the estimated coefficients in Table 12, indicating that the model is robust. Then, after conducting a placebo test using the method in Table 9, it is found that the estimated coefficient does not pass the 10% significance level test, and the placebo test is passed.

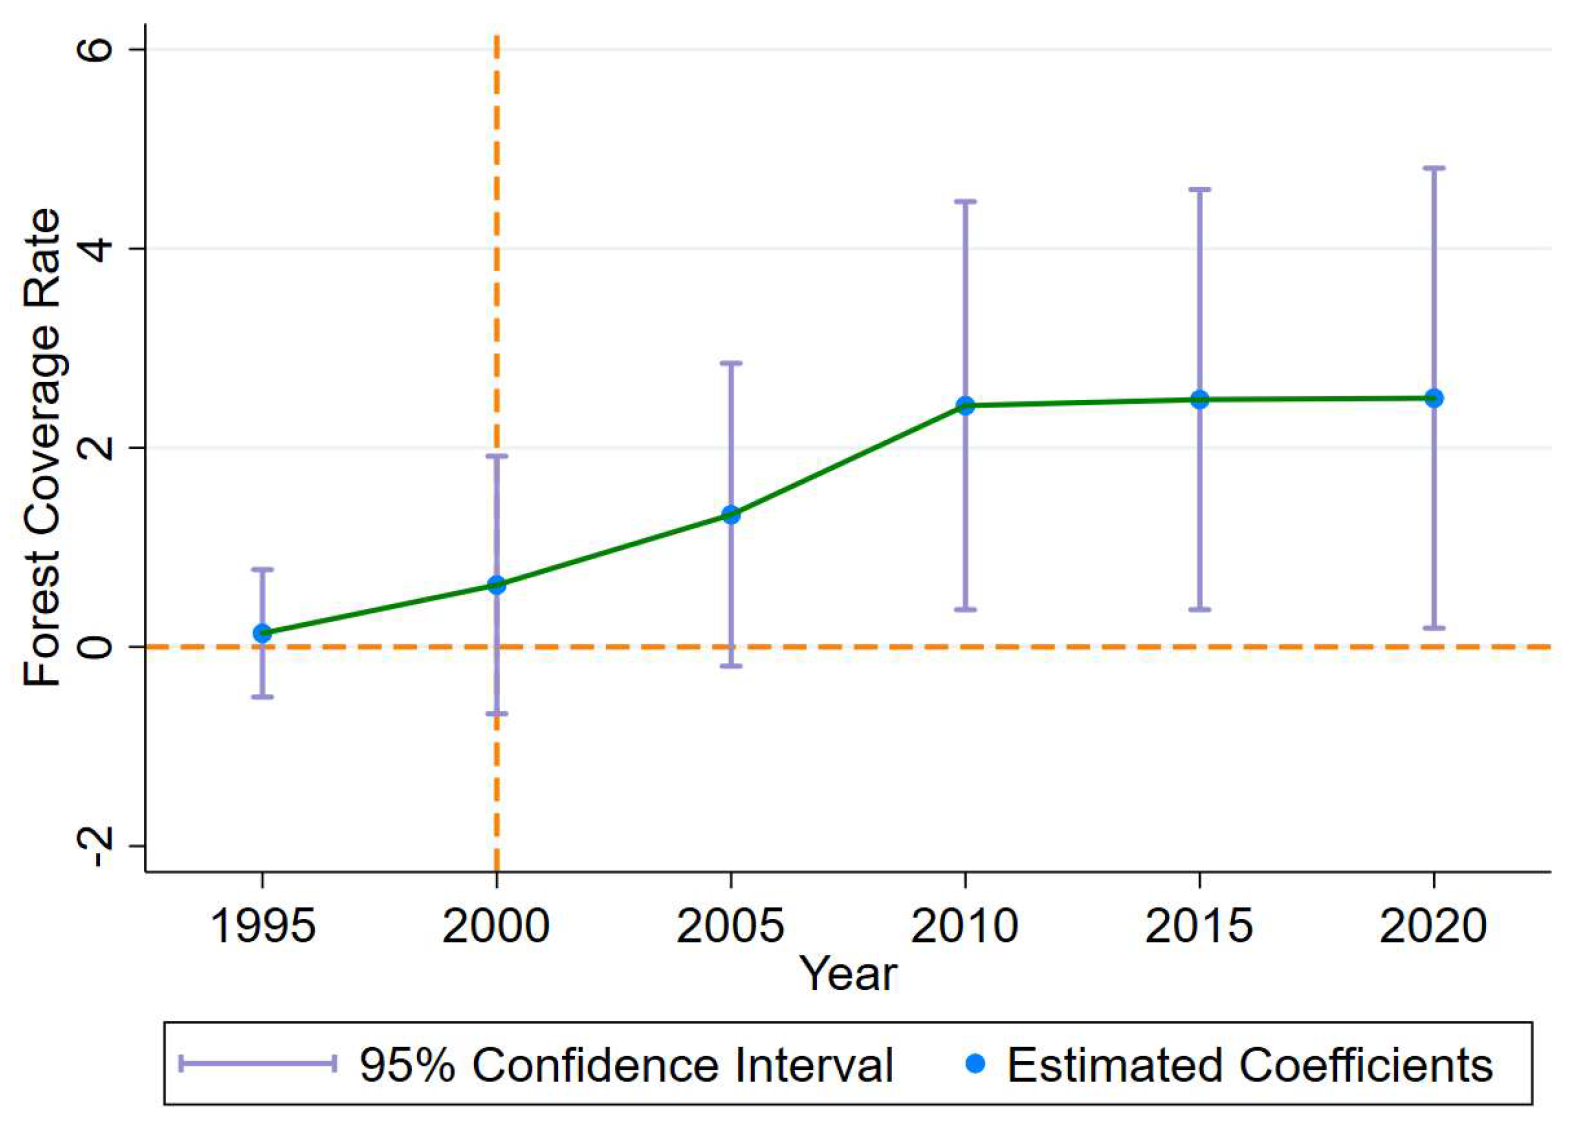
3.3.2. Estimation and Test Results Using Flatland County as the Control Group and Mountainous County as the Treatment Group

Secondly, this study will construct the spatial DID model when using flatland counties as the control group and mountainous counties as the treatment group (Table 13).
As shown in Table 13, the estimation results of each model are significantly positive. Similarly, the absolute value of the estimated coefficient after considering the control variable has decreased, indicating that the control variable has effectively controlled for the interference of other factors. The estimated coefficient of model (2) in Table 13 is 2.0058, slightly higher than the estimated coefficient of model (2) in Table 11, which is 1.8082. That is to say, the effect of PRFF on impacting the mountainous counties is greater than on the entire mountainous areas, and the effect of PRFF on mountainous counties may be slightly greater than that on SMSF counties.
Figure 12 reports the parallel trend test results estimated by using the spatial DID model, which suggests that the control group and treatment group meet the assumption of the prior parallel trend. In addition, this study conducts robustness tests by removing the year of COVID-19 or conducting a 5% bilateral tail reduction. The estimated results are still significantly positive and close to the estimated coefficients in Table 13, indicating that the model is robust. Then, after conducting a placebo test using the method in Table 9, it is found that the estimated coefficient does not pass the 10% significance level test, and the placebo test is passed.

3.4. Further Analysis: The Impact of PRFF on Food Security

The above analysis indicates that PRFF has significantly promoted FCRs in mountainous areas. Despite being unsuitable for cultivating crops on steep farmland, there is concern regarding whether the RFF will lead to a significant reduction in FLA and pose a negative impact and threat to food security. Based on the ideas and methods of the above research, the flatland counties are used as the control group, and the SMSF counties and mountainous counties are used as the treatment group. Therefore, the spatial DID model was constructed by using the land reclamation rate (LRR) as the dependent variable to explore this question (Table 14).
The estimated results in Table 14 are all positive, and the estimated results after considering the control variables are slightly significant (significance level of 10%). It indicates that PRFF has not substantially significantly reduced the FLA in mountainous areas compared to flatland counties.
The above analysis indicates that the implementation of PRFF did not lead to a significant difference in the LRR between the two. Therefore, will implementing PRFF affect the total grain production (TGP) and have adverse effects and threats to food security? This study constructs the spatial DID model by using the natural logarithmic form of the TGP as the independent variable (Table 15).
As shown in Table 15, all estimated results are significantly positive, with significance levels of 5% and 10% for models (1) and (2), respectively. The regression results of the model indicate that implementing PRFF has also led to a slightly faster increase in TGP levels in mountainous areas.
In general, PRFF has not had any adverse effect on food security, and there is no evidence to suggest that PRFF has decreased the LRR and TGP in non-flatland counties. This study offers some explanations for and discussion of such results.
Firstly, there are two main reasons why the estimation results using the LRR as the dependent variable did not show a significant negative trend:
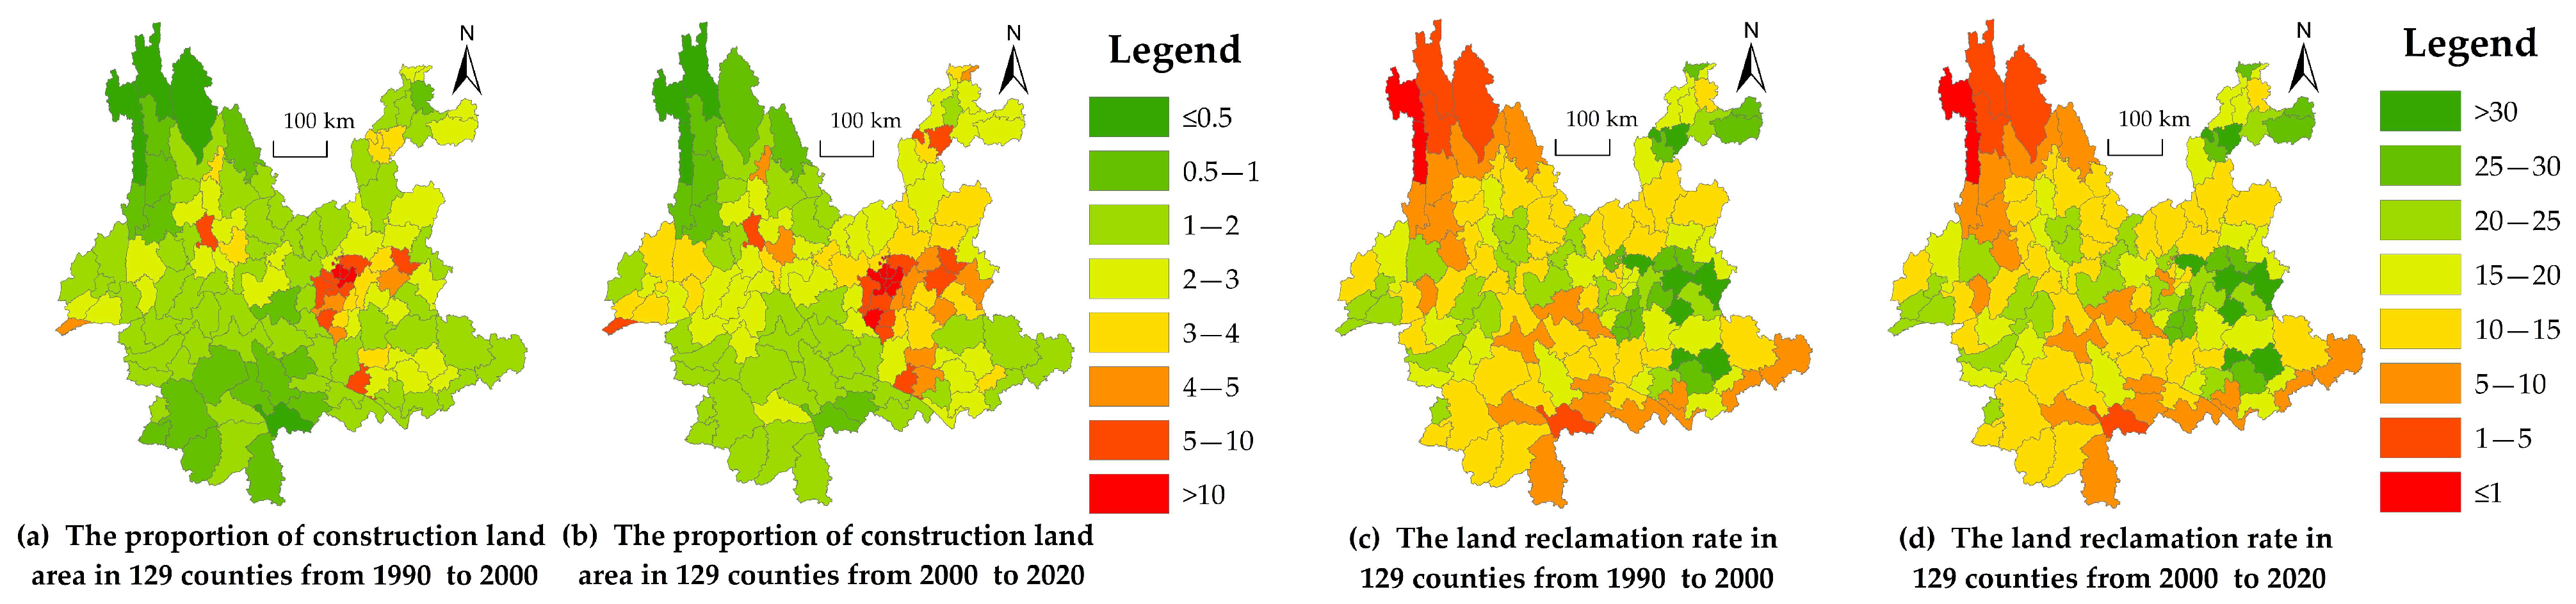
  • Although the implementation of the PRFF will lead to a decrease in steep slope farmland in mountainous areas, because most of the land in flatland counties is relatively flat, it is not uncommon for the expansion of construction land to occupy farmland with the process of urbanization, especially in the economically developed and rapidly urbanized city and center areas. Figure 13 can intuitively reveal the problems of increasing CLA and reducing FLA.
As shown in Figure 13a,b, the proportion of CLA has risen obviously after PRFF, especially in many flatland counties in eastern Yunnan. The results of Figure 13c,d indicate that the LRR has changed relatively little in the past 30 years, mainly due to China’s emphasis on protecting 120 Mha (1,200,000 km2) of farmland and ensuring food security. Based on the data statistics, the LRR in 129 counties has decreased. Specifically, the average LRR in flatland counties decreased from 23.84% (from 1990 to 2000) to 23.33% (from 2000 to 2020), marking a net decrease of 0.51%. In SMSF counties, the average LRR decreased from 17.90% (from 1990 to 2000) to 17.58% (from 2000 to 2020), marking a net decrease of 0.32%. Similarly, in the mountainous counties, the average LRR decreased from 13.48% (from 1990 to 2000) to 13.39% (from 2000 to 2020), marking a net decrease of 0.09%. Overall, the decrease in the proportion of average FLA follows the pattern of “flatland counties > SMSF counties > mountainous counties” in terms of both degree and rate. It shows that due to the possibility of a larger LRR being converted into construction land in flatland counties, the reduction in the LRR in flatland counties may exceed that of mountainous areas. This discovery is similar to the study by Cai et al. (2023) [71], which also found that there is a significant phenomenon of construction land occupying cultivated land in many flat areas of Yunnan.
2.
Due to the existence of many construction areas, regarding the land occupying farmland in the flatland counties, there may be a phenomenon of “occupying the superior and supplementing the inferior” when implementing the balance of farmland occupation and compensation, and the supplemented farmland usually also has cross-county phenomena. Namely, the farmland occupied in the flatland counties may also be complemented by the land in the mountainous areas, which will lead to some unused land, grassland, and other land in the mountainous areas being converted into farmland to make up for the FLA occupied in the flatland counties [72]. This approach will indirectly lead to a more significant reduction in the FLA in the flatland counties, resulting in no significant difference in farmland between the two groups after PRFF.
Secondly, the reason why the estimation results using the proportion of TGP as the dependent variable are positive and have a certain degree of significance is explained in this study as follows:
The results in Table 14 further indicate no significant difference in the FLA between the two groups after PRFF. It suggests that some other land in the mountainous areas has been converted into farmland, achieving an essential balance in the total amount. Then, although implementing the PRFF involves converting a portion of steep slope farmland into (closed) forest land, the per unit area grain production (PGP) level of steep slope farmland is very low [32,73]. Therefore, under the assumption that the total FLA is balanced, other non-steep slopes of land have been converted into farmland. Due to the relatively smooth slope of the farmland, their PGP is higher than the steep slope of farmland previously converted from farmland to forest. Therefore, theoretically speaking, under the condition of a basic balance of FLA, there has been a phenomenon of a decrease in steep slope FLA and an increase in flat slope FLA in mountainous areas, which will promote an increase in the TGP in mountainous areas.

4. Discussion

The large-scale PRFF, which China piloted since 1999 and implemented in 2000, was a main strategic measure taken against the backdrop of the catastrophic floods in the Yangtze River Basin and other areas in 1998. It is known as the “Green Long March”. Yunnan Province is an ecologically fragile province that integrates “border areas, mountainous areas, ethnic groups, and poverty”. It is of great significance to conduct in-depth research on the effect of the PRFF piloted in Yunnan since 2000 on improving the FCR in mountainous areas. In response to the shortcomings of the existing literature, this study combines various interdisciplinary methods such as “RS&GIS, LULC, and econometric policy effect evaluation models” and scientifically calculates the specific effects of PRFF on improving the FCR in mountainous areas using econometric policy evaluation tools such as the DID model and spatial DID model. By constructing a rigorous policy evaluation model, this study found that although the FCR in Yunnan shows a clear spatial clustering characteristic of low in the east and high in the west, the FCR in Yunnan has significantly improved in the past 30 years, and the implementation of PRFF has effectively promoted the increase in the FCR in mountainous areas. The estimation results of the spatial DID model show that PRFF has increased the FCR in mountainous areas by 1.8082%.
This result is in line with the actual situation in Yunnan. The existing relevant literature also directly or indirectly confirms from different perspectives that China’s implementation of PRFF is indeed beneficial for increasing the FCR. Gong Zhiwen et al. (2017) [31] and Yang Zisheng et al. (2011) [32] studied the area of steep slope farmland converted into forest land after the implementation of PRFF. They found that from 2000 to 2009, the average annual increase in the FCR in Yunnan was 1.19%, directly confirming the promoting effect of PRFF on the FCR. Ma Jingjing et al. (2023) [26] studied the impact and driving factors of the FCR to indirectly explore the policy effect of PRFF on promoting the FCR. They found that the FCR area in the Yellow River Basin increased by 20,000 km2 from 1980 to 2020, indirectly confirming the promoting effect of PRFF implementation on the FCR. Li Xiaoying et al. (2017) [74] analyzed the comprehensive benefits of PRFF in the arid desert areas of northwest China, using Turpan City as an example. They found that the implementation of PRFF in Turpan City from 2004 to 2019 significantly increased the FCR from 2.67% to 3.31%. This indicates that even in arid desert areas with poor natural conditions, PRFF still plays an important role in improving the FCR. From the perspective of China as a whole, according to The National Forestry and Grassland Administration of China (2022), since 1999, two rounds of the PRFF have been implemented nationwide, with a total of 14.2 million ha of land allocated for this purpose, accounting for approximately 1.5% of the country’s total land area [75]. This supports the research conclusion of this article very well. Due to Yunnan being a typical mountainous province in southwestern China, with approximately 94% of its land being mountainous, the proportion of steep slope farmland is significantly higher than in other provinces [39]. Therefore, the area of PRFF is relatively large, making the contribution rate of PRFF implementation to improving the FCR in Yunnan slightly higher than the national average.
Liu Mengzhu et al. (2021) [76] found from the perspective of land use type transformation that 6420 km2 of farmland was converted to forest land in northern China after the implementation of the PRFF from 2000 to 2018. In addition, Yang Zisheng (2011) [32] analyzed from the perspective of the ecological environment and found that the ecological benefits of PRFF implementation have improved. Due to the crucial role that forests play in the ecological environment, it indirectly confirms the results of this study. Moreover, Duan Xumeng et al. (2024) [77] also found that PRFF effectively promotes the improvement in the local ecological environment, especially with a significant enhancement effect on carbon storage, which further supports the conclusions of this study.
Secondly, this study also found that the implementation of PRFF did not have a significant negative impact on food security and total farmland area. This conclusion may seem confusing, but it is actually true, and more and more literature has also found that the implementation of PRFF does not threaten food security. Lin Ying et al. (2014) [3] found that PRFF did not suppress the impact on rural residents’ income, as PRFF prompted farmers to shift from extensive agricultural production methods to intensive management, which not only increased food production and ensured food security but also promoted an increase in farmers’ income. The studies by Dong Mei et al. (2005) [78] and Wang Bing et al. (2013) [79] also confirmed that PRFF does not pose a threat to food security. The analysis by The National Forestry and Grassland Administration of China (2022) suggests that 97.6% of the poverty-stricken counties in China have implemented PRFF. The related industries developed after the PRFF, such as woody oil and grain, and fresh and dried fruits, have become an important way for farmers to increase their income [75]. It can be seen that the implementation of PRFF does have significant economic benefits and does not pose a threat to food security.
Yunnan Province is a border mountainous province in China with an extremely fragile ecology. However, this study found that PRFF only promoted a 1.8082% increase in the FCR in mountainous areas, which is still a long way from the responsibility of Yunnan to become a leader in ecological construction. Moreover, the overall FCR in Yunnan is not high, and there are large areas of karst rocky desertification in many counties in the southeast, which poses a huge threat to ecological security. Forests are known as the “lungs of the earth” and play an extremely important role in ecological protection. What actions should Yunnan take in the future to better consolidate the benefits brought by PRFF, promote the increase in the FCR, and protect the ecological environment? This study proposes the following policy recommendations:
(1) Appropriately increase the PRFF subsidy standards. One reason is that areas with large amounts of farmland conversion are usually located in remote and impoverished mountainous areas, where local finances are often difficult and farmers have low incomes. Therefore, it is necessary to increase subsidies to local governments and farmers. Additionally, the second round of PRFF subsidies is significantly low, resulting in a low willingness of farmers to participate. Therefore, it is necessary to increase the cash subsidy standards for farmers.
(2) Promote the organic connection between the PRFF project and the rural revitalization strategy. The PRFF project is also an important means of ecological revitalization, so it should be included in the rural revitalization strategy.
(3) Strengthen the promotion and implementation of the related laws and regulations of PRFF. Local governments should continuously increase their publicity and implementation efforts to better promote the implementation of the Forest Law and the Regulations on Returning Farmland to Forests.
China’s PRFF was implemented against the backdrop of major floods in the Yangtze River Basin and other areas in 1998. Since the implementation of PRFF, the ecological environment in the Yangtze River Basin and Yellow River Basin has significantly improved. According to statistics, the ecological benefits generated by the PRFF project in the upper and middle reaches of the Yellow River Basin reached CNY 267.4 billion in 2014, and the comprehensive ecological, social, and economic benefits in the upper and middle reaches of the Yellow River Basin reached CNY 617.1 billion in 2020 [80]. Xi Jinping also emphasized during his inspection of the Yellow River Basin that solidly promoting the protection of the Yellow River and ensuring its stability is a major task in governing the country. It can be seen that the implementation of PRFF is crucial for China to increase the FCR and improve the ecological environment. Although it has been 20 years since the PRFF pilot, it is still necessary to continue consolidating the achievements and benefits brought by PRFF. China still needs to further increase its efforts in ecological environment protection. In terms of consolidating and expanding the achievements and benefits of PRFF in China’s future, this study proposes the following insights and prospects:
(1) Achieve high-quality development of PRFF, strive to achieve high-quality construction, high efficiency, and high-level management;
(2) Promote the healthy development of the ecological system of mountains, bodies of water, forests, and fields, and giving full play to the fundamental role of forestry in maintaining national security and coordinating the comprehensive management of mountains, bodies of water, forests, fields, lakes, and grasslands;
(3) Implement PRFF to support the rural revitalization strategy and achieve common prosperity.
From an international perspective, PRFF is an action taken by China in a specific context, and many countries in the world may not necessarily develop PRFFs. However, due to the combined effects of human activities and climate change, ecosystems around the world are severely degraded, and countries around the world have implemented a series of unprecedented forest ecological restoration projects (FERPs). Compared to PRFFs, FERPs in other countries around the world cover a wider range, not only converting steep slope farmland into forest land but also converting wasteland and other land into forest land, which greatly improves the ecological environment. For example, developed countries such as the United States, Germany, the United Kingdom, and France have implemented the policy of returning farmland to forests. From its independence in 1776 to the early 1930s, the United States experienced rapid growth in farmland over a period of 150 years, increasing from 54.77 million ha to 156 million ha. Agricultural products went from being sufficient to surplus, while forests were destroyed and the ecology was imbalanced. In this context, the United States gradually implemented the policy of fallowing and returning farmland to forests [81]. Some developed countries in Europe have experienced accelerated urbanization during the industrialization process, resulting in low agricultural efficiency and severe abandonment of farmland by farmers. The conversion of farmland to forests in Europe began in an unplanned and spontaneous manner. In 2000, there were 12–16 million ha of farmland converted to forest land in European countries. From 1956 to 1983, agricultural land in the European Community decreased by 11 million ha, accounting for 8% of the total farmland area, while the FCR increased by 15% [82]. Therefore, PRFF and other countries’ FERPs lead to the same goal: their implementation can effectively promote an increase in the FCR.
It should be pointed out that although this study combines the research methods of RS image interpretation and econometrics, it still has certain limitations, mainly manifested as follows:
(1) The current accuracy of RS images is usually 30 m × 30 m. Although it is relatively accurate for studying the policy effects of PRFF, it cannot be denied that objectively, each small plot (900 m2) still may contain multiple land types of smaller plots [83]. Therefore, even more accurate interpretation accuracy may have slight deviations from reality.
(2) In addition, in RS image interpretation, this study used manual interpretation and machine interpretation as assistance. Although the total area of different land types interpreted is relatively consistent with the national land survey data, the identification of various land parcels may be affected by factors such as temperature, precipitation, cloud cover, shadow, snow cover, and image clarity, resulting in bias [44]. Although this study has also made corresponding adjustments, it cannot be denied that the interpretation results may deviate from reality to some extent. Therefore, scientifically speaking, the results of any RS image interpretation cannot be absolutely consistent with reality.
(3) Although this study used DID and spatial DID models, and existing research has shown that spatial DID models can effectively control the interference of data with significant spatial autocorrelation on the results, spatial DID models still have certain limitations, mainly subjectivity manifested in the weight matrix settings [61]. For different weight matrix settings, the estimation results may vary, but no study can consider the impact of all possible factors on the results and thus set an “absolutely perfect” weight matrix.
(4) Although econometric research can obtain relatively accurate estimation results based on the mathematical and statistical indicators of the sample, it cannot be denied that this method cannot consider all possible interferences, so its estimation results can only be close to the real situation to a certain extent. Moreover, in model setting, most existing studies usually set the model as linear, but in reality, it is impossible for everything to be absolutely linear [84], which may also affect the estimation of the model.
(5) Finally, it should be pointed out that using econometric models for empirical analysis can only obtain the correlation between variables but cannot prove the causal relationship between the two, because the estimation of econometric models is based on statistical calculations of relevant indicators. Therefore, when exploring causal relationships, it is necessary to use a combination of theoretical and empirical methods for explanation. In addition, it should be pointed out that the research methods and ideas of this study still have certain limitations and need further improvement in future research. One reason is that due to limitations in obtaining RS image data, this study has not yet collected LULC data for each year. Secondly, the accuracy of model estimation may be affected by the interpretation accuracy. Thirdly, due to limitations in data acquisition, this study has not yet explored the policy effects of PRFF in other typical provinces or even the entirety of China. Therefore, in exploring the policy effects of PRFF in the future, existing research methods and ideas can be further expanded.
(1) In terms of data acquisition, the traditional method of simply obtaining grid image data of LULC for analysis needs to be broken through. Firstly, traditional terrain, slope, and other image data should be organically combined to distinguish the unit plots of PRFF. Secondly, grid image data such as temperature, precipitation, and evapotranspiration should be combined to explore the ecological and environmental benefits brought by PRFF. At the same time, grid image data such as GDP should be combined to explore the socio-economic benefits brought by PRFF. Thirdly, breaking free from the constraints of administrative divisions, PRFF should be analyzed in an organic combination of grid scale and administrative division scale.
(2) Additionally, in terms of policy effect evaluation, it is necessary to organically combine the research paradigms and methods of geography and economics, explore the policy effects of PRFF through the organic combination of RS image interpretation and econometric model, and conduct more detailed evaluation and exploration of its policy effects through the organic combination of other raster image data.
(3) Finally, in terms of research methods, an organic combination of policy evaluation and future prediction can be adopted. Not only can existing policy effects be evaluated using models, but also prediction models such as cellular automata (CA) and Markov can be combined to predict LUCC in various scenarios such as ecological protection, farmland protection, and urban development in the future. The overall differences and spatial heterogeneity of the policy effects of PRFF in different scenarios in the future can be explored.

5. Conclusions

The implementation of PRFF is of great significance for ecological protection and green development in Yunnan. In response to the lack of accurate measurement of the effects of PRFF on improving the FCR in mountainous areas in existing research, this study takes Yunnan as an example and divides 129 counties into 21 flatland counties, 37 SMSF counties, and 71 mountainous counties. Based on the LULC data interpreted from seven periods of RS images, policy evaluation tools such as the DID model and spatial DID model are used to analyze their policy effects. The goal of this study is to more accurately and intuitively evaluate the policy effects and heterogeneity of PRFF on promoting the FCR in counties, which is of great significance for the future scientific formulation of policy measures to promote forest ecological restoration and achieve harmonious coexistence between humans and nature in Yunnan. The main conclusions are as follows:
Firstly, PRFF effectively promotes the increase in the FCR in mountainous areas, which is consistent with expectations and assumptions. This effect roughly increased the FCR in mountainous areas by 1.8082%.
Secondly, although PRFF can effectively promote the increase in the FCR in mountainous areas, its effects on different types of counties have certain heterogeneity. The implementation of PRFF has increased the FCR in SMSF counties by 1.7131% and in mountainous counties by 2.0058%, which is 0.2927% higher than SMSF counties, consistent with expectations and assumptions.
Thirdly, although the implementation of PRFF has transformed steep slope farmland into forest land, it has not had a significant negative impact on farmland and food security, which is consistent with expectations and assumptions. The main reason is that there are still many other flatlands converted into farmland in mountainous areas, and the intensification of production helps to increase grain production.
Fourthly, by comparing with existing research and data, it can be found that the results obtained in this study are consistent with the expected assumptions and reality and that the implementation of the PRFF in Yunnan has a slightly higher effect on improving the FCR than the overall effect in China. In order to better consolidate the policy effects of PRFF, Yunnan should further increase the funding subsidies for PRFF.
Finally, this study still has limitations in obtaining RS data, and the existing research methods have certain limitations. In future research, it is necessary to further expand existing research methods and paradigms and explore the policy effects of PRFF implementation through the organic combination of grid scale and county-level data.
This study can provide a reference for achieving the harmonious coexistence between humans and nature and can also provide a reference for developing reasonable FERPs.

Author Contributions

Conceptualization, Y.Z. and Z.Y.; methodology, Y.Z. and Z.Y.; software, Y.Z. and Z.Y.; validation, Y.Z., Z.Y., F.L., M.X. and J.Z.; formal analysis, Y.Z., Z.Y., F.L., M.X. and J.Z.; investigation, Y.Z., Z.Y., F.L., M.X. and J.Z.; resources, Y.Z., Z.Y., F.L., M.X. and J.Z.; data curation, Y.Z. and Z.Y.; writing—original draft preparation, Y.Z., Z.Y., F.L., M.X. and J.Z.; writing—review and editing, Y.Z., Z.Y., F.L., M.X. and J.Z.; visualization, Y.Z. and Z.Y.; supervision, Y.Z. and Z.Y.; project administration, Z.Y. and F.L.; funding acquisition, Z.Y. and F.L. All authors have read and agreed to the published version of the manuscript.

Funding

This study was funded by the National Natural Science Foundation of China (41261018).

Data Availability Statement

The RS image data in this research were collected from “https://www.resdc.cn/” (accessed on 2 February 2023). The DEM data were collected from “http://www.gscloud.cn” (accessed on 4 March 2023). The county boundaries of Yunnan province were collected from “https://yunnan.tianditu.gov.cn/MapResource” (accessed on 2 April 2023). The economic and social statistical data were collected from “http://stats.yn.gov.cn/list19.aspx” (accessed on 13 November 2023) and the EPS platform (website: “https://www.epsnet.com.cn/index.html#/Index”) (accessed on 17 November 2023).

Conflicts of Interest

The authors declare no conflicts of interest.

References

  1. Xu, X.; Zhang, D.J.; Zhang, Y.; Yao, S.B.; Zhang, J.T. Evaluating the vegetation restoration potential achievement of ecological projects: A case study of Yan’an, China. Land Use Policy 2020, 90, 104293. [Google Scholar] [CrossRef]
  2. Yang, X.D. The Benefits Evaluation and Impact Research on the Land Conversion Program in Chinese Western Region, 1st ed.; Beijing Forestry University: Beijing, China, 2005. [Google Scholar]
  3. Lin, Y.; Yao, S.B. Impact of the Sloping Land Conversion Program on rural household income: An integrated estimation. Land Use Policy 2014, 40, 50–63. [Google Scholar] [CrossRef]
  4. Liu, D.F.; Li, F.X.; Qiu, M.L.; Zhang, Y.; Zhao, X.; He, J.H. An integrated framework for measuring sustainable rural development towards the SDGs. Land Use Policy 2024, 147, 107339. [Google Scholar] [CrossRef]
  5. Zhu, H.Y.; Lv, C.H. Farmland Change in Yan’An: The Impact and Acting Mechanism of Policies. Geogr. Res. 2010, 29, 1510–1518. [Google Scholar]
  6. Luo, J.R. On the Ecology Theoretical Basis about Gansu’s Project of Grassland Restoration from Cropland. J. Northwest A F Univ. (Nat. Sci. Ed.) 2004, 69, 71–76. [Google Scholar]
  7. Sun, X.; Yin, L.K.; Meng, L.; Bai, G.G.; Wang, L.T. Study Progress of Reverting Farmland to Forest and Grassland. Arid Land Geogr. 2004, 27, 221–224. [Google Scholar]
  8. Lv, W.G. Evaluation of the Benefits of Ecological Compensation Policies in the Construction of Ecological Security Barriers: A Case Study of Returning Farmland to Forests and Grasslands in Gansu Province. J. Gansu Adm. Inst. 2017, 26, 105–116. [Google Scholar]
  9. Yao, Q.L.; Lu, G.Q.; Du, J.; Tan, X.Q. Evaluation of Ecological Benefits from Returning Land for Farming to Forestry in Chengde City. J. Hebei Agric. Univ. 2009, 32, 57–61. [Google Scholar]
  10. Li, S.D.; Liu, M.C. The Development Process, Current Situation and Prospects of the Conversion of Farmland to Forests and Grasses Project in China. J. Resour. Ecol. 2022, 13, 120–128. [Google Scholar]
  11. Gao, L.; Yang, X.K.; Hu, H.Z.; Lv, X.X.; Hou, G.L.; Claudio, D.; Wang, X.Y.; Chen, F.X. Ecological and Economic Benefit Analysis of the Implementation of the Chongqing Grain for Green Project. Res. Soil Water Conserv. 2019, 26, 353–358. [Google Scholar]
  12. Liu, Y.T.; Wang, L.; Li, X.H.; Guo, L. Analysis on Spatio–temporal Variability of Fractional Vegetation Cover and Influencing Factors from 2000 to 2020 in Southwestern China. Plateau Meteorol. 2024, 43, 264–276. [Google Scholar]
  13. Rong, P.Z. Calculation Problem of Forest Cover. Issues For. Econ. 1984, 4, 13–15. [Google Scholar]
  14. Xu, D.S. Method of Field Data Collection for Computer–Aided Mapping of Forested Mountainous Areas. Geotech. Eng. Tech. 1995, 9, 51–52. [Google Scholar]
  15. Wu, J.; Peng, D.L. Tree Species Information Extraction of Farmland Returned to Forests Based on Improved Support Vector Machine Algorithm. Spectrosc. Spectr. Anal. 2011, 31, 1038–1041. [Google Scholar]
  16. Gao, F.J.; Zhang, B.; Wang, Z.M.; Lei, G.P.; Song, G. Study on the Effect of Returning Farmland to Forest Project on Regional Ecological Risk in Mudanjiang City. Energy Procedia 2011, 11, 4110–4117. [Google Scholar]
  17. Kennedy, R.E.; Yang, Z.; Cohen, W.B.; Pfaff, E.; Braaten, J.; Nelson, P. Spatial and Temporal Patterns of Forest Disturbance and Regrowth within the Area of the Northwest Forest Plan. Remote Sens. Environ. 2012, 122, 117–133. [Google Scholar] [CrossRef]
  18. Cohen, W.B.; Yang, Z.; Kennedy, R. Detecting Trends in Forest Disturbance and Recovery Using Yearly Landsat Time Series: 2. TimeSync—Tools for Calibration and Validation. Remote Sens. Environ. 2010, 114, 2911–2924. [Google Scholar] [CrossRef]
  19. Gao, Y.; Yuan, J.H.; Gong, X.W.; Li, Y.P.; Xiao, W.; Ren, G.P. A Cost–Effective Approach to Estimating Forest Coverage over Mountainous Regions Based on Google Earth: A Case Study in Yunnan. J. Dali Univ. 2019, 4, 62–68. [Google Scholar]
  20. Shi, R.Y.; Wang, H.F. Study on Change of Forest Coverage Based on TM Image. Mine Surv. 2019, 47, 69–72, 112. [Google Scholar]
  21. Zhang, W.B.; Gao, F.; Jiang, N.; Zhang, C.; Zhang, Y.C. High–Temporal–Resolution Forest Growth Monitoring Based on Segmented 3D Canopy Surface from UAV Aerial Photogrammetry. Drones 2022, 6, 158. [Google Scholar] [CrossRef]
  22. Wang, K. Analysis of the Changes of Forest Resources and the Related Driving Force in Shandong Province, 1st ed.; Shandong Agricultural University: Tai’an, China, 2016. [Google Scholar]
  23. Zhao, X.D.; Li, L.C.; Yang, W.T.; Cheng, B.D.; Liu, J.L. Analysis of Socio–Economic Influencing Factors of Forest Transition in Counties of Fujian Province. Sci. Silvae Sin. 2019, 55, 147–156. [Google Scholar]
  24. He, Z.Q.; Shang, X.; Zhang, T.H. Spatiotemporal Evaluation and Driving Mechanism of Land Ecological Security in Yan’an, a Typical Hill–Gully Region of China’s Loess Plateau, from 2000 to 2018. Forests 2021, 12, 1754. [Google Scholar] [CrossRef]
  25. Yang, R.Y.; He, Y.M.; Zhong, C.B.; Yang, Z.S.; Wang, X.; Xu, M.J.; Cao, L.L. Study on the Spatiotemporal Evolution and Influencing Factors of Forest Coverage Rate (FCR): A Case Study on Yunnan Province Based on Remote Sensing Image Interpretation. Forests 2024, 15, 238. [Google Scholar] [CrossRef]
  26. Ma, J.J.; Gao, M.L.; Li, Z.H.; Xu, H.H.; Peng, J.B. Spatial and Temporal Changes of Forest Cover and Its Driving Factors over the Yellow River Basin. Bull. Surv. Mapp. 2023, 69, 51–57. [Google Scholar]
  27. Zhou, D.C.; Zhao, S.Q.; Zhu, C. Impacts of the Sloping Land Conversion Program on the Land Use/Cover Change in the Loess Plateau: A Case Study in Ansai County of Shaanxi Province, China. J. Nat. Resour. 2011, 26, 1866–1878. [Google Scholar]
  28. Li, Y.Z.; Liu, C.M.; Liu, X.M.; Liang, K.; Bai, P.; Feng, Y.X. Impact of the Grain for Green Project on the Land Use/Cover Change in the Middle Yellow River. J. Nat. Resour. 2016, 31, 2005–2020. [Google Scholar]
  29. Hou, D.W.; Liu, Y.; Sun, H. Analysis on Dynamic Change of Ecological Security Pattern of Land in Cold Mountainous Region under Background of Grain for Green Project. Trans. Chin. Soc. Agric. Eng. 2017, 33, 267–276. [Google Scholar]
  30. Huang, L.; Cao, W.; Zhu, P. The regional Variation Characters of Ecological Effects of the Grain for Green Proiect. Acta Ecol. Sin. 2020, 40, 4041–4052. [Google Scholar]
  31. Gong, Z.W.; Yao, S.B.; Dang, J.J. Analysis on Land Use/Land Coverage Changes and Driving Forces in Loess Plateau before and after the Conversion of Cropland to Woodland. For. Econ. 2017, 39, 54–58, 66. [Google Scholar]
  32. Yang, Z.S. Study on Land Use Changes and Its Ecological Effects in Different Landform Areas in Yunnan Province Driven by China’s Project of Converting Farmland to Forest, 1st ed.; China Science and Technology Press: Beijing, China, 2011. [Google Scholar]
  33. Mo, H.W.; Ren, Z.Y. Temporal–spatial Changes of the Vegetation Coverage in Guanzhong Area, Shaanxi Province in Recent 22 Years. J. Arid Land Resour. Environ. 2012, 26, 122–126. [Google Scholar]
  34. Liu, Y.S.; Yang, Z.S.; Zhao, Q.G. Study on Land Resources Exploitation and Man–Land Harmonious Development in Mountainous Areas of China, 1st ed.; China Science and Technology Press: Beijing, China, 2010. [Google Scholar]
  35. Fan, J.M.; Zhang, C.; Qian, H.; Zhu, X.L.; Deng, Z.C.; Li, C.R.; Ai, W.Z. Analysis on the Evolution Process of Ecological Environment Quality and Driving Force of Yunnan, China. J. Southwest For. Univ. (Nat. Sci.) 2024, 44, 1–8. [Google Scholar] [CrossRef]
  36. Yang, Z.S.; Yang, S.Q.; Yang, R.Y.; Wu, Q.J. A Study on Spatiotemporal Changes of Ecological Vulnerability in Yunnan Province Based on Interpretation of Remote Sensing Images. Diversity 2023, 15, 963. [Google Scholar] [CrossRef]
  37. Yunnan Provincial Bureau of Statistics. Yunnan Statistical Yearbook 2021, 1st ed.; China Statistics Press: Beijing, China, 2021. [Google Scholar]
  38. National Bureau of Statistics. China Statistical Yearbook 2021, 1st ed.; China Statistics Press: Beijing, China, 2021.
  39. Yang, Z.S.; Zhao, Q.G.; Xin, L. Yunnan Land Resources, 1st ed.; China Science and Technology Press: Beijing, China, 2014. [Google Scholar]
  40. Office of Yunnan Provincial Agricultural Zoning Commission. Land Area of Different Climatic Zones and Slopes in Yunnan Province, 1st ed.; Yunnan Science and Technology Press: Kunming, China, 1987. [Google Scholar]
  41. Yang, Z.S.; Li, Y.H.; Zou, Z.; He, Y.M.; Li, L. Study on Land Resources Development and Utilization Planning of Yunnan Province in the Great Development of Western China, 1st ed.; Yunnan Science and Technology Press: Kunming, China, 2003. [Google Scholar]
  42. Yunnan Provincial Office of Returning Farmland to Forest. The Ten–year Project of Returning Farmland to Forest in Yunnan Has Achieved Remarkable Results. Yunnan For. 2009, 30, 50–51. [Google Scholar]
  43. Yunnan Provincial Office of Returning Farmland to Forest. The Project of Returning Farmland to Forest Has Yielded Fruitful Results, and Ecological Industry Has Developed Altogether: On–the–spot Record of 10 Years’ Construction of Returning Farmland to Forest Project in Yunnan Province. China Green Times, 18 December 2009. [Google Scholar]
  44. Xu, X.L.; Liu, J.Y.; Zhang, S.W.; Li, R.D.; Yan, C.Z.; Wu, S.X. Multi–period Land Use and Land Cover Monitoring Data Set in China (CNLUCC). In Resource and Environment Science Registration and Publication System; Institute of Geographic Sciences and Natural Resources Research, Chinese Academy of Sciences: Beijing, China, 2018; Available online: http://www.resdc.cn/DOI (accessed on 8 February 2022).
  45. Liu, J.Y.; Liu, M.L.; Deng, X.Z.; Zhuang, D.F.; Zhang, Z.X.; Luo, D. The Land Use and Land Cover Change Database and Its Relative Studies in China. J. Geograph. Sci. 2002, 12, 275–282. [Google Scholar]
  46. Liu, J.Y.; Liu, M.L.; Zhuang, D.F.; Zhang, Z.X.; Deng, X.Z. Study on Spatial Pattern of Land–use Change in China during 1995–2000. Sci. China (Ser. D) 2003, 46, 373–384. [Google Scholar] [CrossRef]
  47. Liu, J.Y.; Kuang, W.H.; Zhuang, Z.X.; Xu, X.L.; Qin, Y.W.; Ning, J.; Zhou, W.C.; Zhang, S.W.; Li, R.D.; Yan, C.Z.; et al. Spatiaotemporal Characteristics, Patterns and Causes of Land–use Changes in China since the late 1980s. J. Geograph. Sci. 2014, 24, 195–210. [Google Scholar] [CrossRef]
  48. Kuang, W.H.; Zhang, S.W.; Du, G.M.; Yan, C.Z.; Wu, S.X.; Li, R.D.; Lu, D.S.; Pan, T.; Ning, J.; Guo, C.Q.; et al. Remotely Sensed Mapping and Analysis of Spatio–temporal Patterns of Land Use Change across China in 2015–2020. Acta Geograph. Sin. 2022, 77, 1056–1071. [Google Scholar]
  49. Office of the Leading Group of the Third National Land Survey of Yunnan Province, Department of Natural Resources of Yunnan Province, Statistics Bureau of Yunnan Province. Main Data Bulletin of the Third National Land Survey of Yunnan Province. Yunnan Daily, 22 December 2021. [Google Scholar]
  50. Ye, F.; Wang, Y. Introduction and Application of Difference–in–Difference Model. Chin. J. Health Stat. 2013, 30, 131–134. [Google Scholar]
  51. Lv, Y.; Lu, Y.; Wu, S.B.; Wang, Y. The Effect of the Belt and Road Initiative on Firms’ OFDI: Evidence from China’s Greenfield Investment. Econ. Res. J. 2019, 65, 187–202. [Google Scholar]
  52. Chen, Y.; Fan, Z.Y.; Gu, X.M.; Zhou, L.A. Arrival of Young Talent: The Send–Down Movement and Rural Education in China. Am. Econ. Rev. 2020, 110, 3393–3430. [Google Scholar] [CrossRef]
  53. Wang, G.J.; Lu, X.X. The Belt and Road Initiative and the Upgrading of China’s Enterprises. China Ind. Econ. 2019, 37, 43–61. [Google Scholar]
  54. Standing Committee of the National People’s Congress. Law of the People’s Republic of China on Soil and Water Conservation, 1st ed.; China Legal Publishing House: Beijing, China, 2011. [Google Scholar]
  55. Yang, Z.S.; Zhao, Q.G. Study on Dividing Flatland County, Semi–mountainous & Semi–flatland County and Mountainous County in Yunnan Province Based on the Second National Land Survey. J. Natural Resources 2014, 29, 564–574. [Google Scholar]
  56. Compilation Group of Agricultural Geography of Yunnan. Agricultural Geography of Yunnan, 1st ed.; Yunnan People’s Publishing House: Yunnan, China, 1981. [Google Scholar]
  57. Planning Commission of Yunnan Province. Yunnan’s Land & Resources, 1st ed.; Yunnan Science and Technology Press: Yunnan, China, 1990; pp. 121–125. [Google Scholar]
  58. Yunnan Land Administration Bureau, Office of Leading Group for Investigation of Land Use Status in Yunnan Province. Land Resources in Yunnan, 1st ed.; Yunnan Science and Technology Press: Yunnan, China, 2000; pp. 1–396. [Google Scholar]
  59. Office of Yunnan Agricultural Regionalization Committee. Compendium of Comprehensive Agricultural Regionalization of Yunnan Province, 1st ed.; Yunnan People’s Publishing House: Yunnan, China, 1999; pp. 8–13. [Google Scholar]
  60. Ren, S.G.; Zheng, J.J.; Liu, D.H.; Chen, X.H. Does Emissions Trading System Improve Firm’s Total Factor Productivity—Evidence from Chinese Listed Companies. China Ind. Econ. 2019, 37, 5–23. [Google Scholar]
  61. Chen, Q. Advanced Econometrics and Stata Applications, 2nd ed.; Higher Education Press: Beijing, China, 2014. [Google Scholar]
  62. Kirton, J.; Kokotsis, E.; Warren, B. Reconfiguring the Global Governance of Climate Change. Taylor Fr. 2021, 47, 121–123. [Google Scholar]
  63. Brown, S.; Lugo, A.E. Biomass of Tropical Forests: A New Estimate Based on Forest Volumes. Science 1984, 223, 1290–1293. [Google Scholar] [CrossRef]
  64. Zhang, X.D. Ways to Increase Forest Coverage. Friends Farmers Becom. Rich 2016, 23, 322. [Google Scholar]
  65. Deng, H.P.; Wang, Q.; Dan, L. Impacts of Climate on Forest–Runoff Relationship. J. Water Resour. Water Eng. 2018, 29, 18–24. [Google Scholar]
  66. Wang, K.; Chen, T.; Luo, J.W.; Biao, J.L.; Wang, D.; Lu, F.D. Analysis on the Relationship between the Change of Forest Resources and Per Capita GDP in Shandong Province Based EKC Model. Issues For. Econ. 2016, 36, 222–226. [Google Scholar]
  67. Zhang, Q. Research on Forest Resources Abundance and Economic Development in the Yangtze River Delta, 1st ed.; Nanjing Forestry University: Nanjing, China, 2016. [Google Scholar]
  68. Jiang, Y.Y.; Du, W.T.; Chen, J.Z.; Wang, C.Y.; Wang, J.N.; Sun, W.X.; Chai, X.; Ma, L.J.; Xu, Z.L. Climatic and Topographical Effects on the Spatiotemporal Variations of Vegetation in Hexi Corridor, Northwestern China. Diversity 2022, 14, 370. [Google Scholar] [CrossRef]
  69. Yang, R.Y.; Zhong, C.B.; Yang, Z.S.; Yang, S.Q.; Ji, G.Q.; Yu, J.K.; Cao, L.L.; Yang, J.R.; Luo, L.; Shen, Y.C.; et al. Study on China’s Farmland–Grain resource curse: Empirical testing based on 31 Provinces and 2843 Counties. Land Use Policy 2024, 144, 107241. [Google Scholar] [CrossRef]
  70. He, B.W.; Li, D.; Liu, X.J. Regional Differentiation Characteristics and the Influencing Factors of Spatial Poverty in Rural Areas of Gansu Province. Res. Agric. Mod. 2019, 40, 819–829. [Google Scholar]
  71. Cai, X.L.; Yang, R.Y. Study on Spatiotemporal Evolution and Influencing Factors in Cultivated Land and Construction Land in Yunnan Province in the Past 20 Years Based on Remote Sensing Interpretation. Agriculture 2023, 13, 981. [Google Scholar] [CrossRef]
  72. Yang, Z.S.; Liang, L.H. Soil erosion under different land use types and zones of Jinsha River Basin in Yunnan Province, China. J. Mountain Science 2004, 1, 46–56. [Google Scholar]
  73. Xu, D.; Yang, F.; Yu, L.; Zhou, Y.Y.; Li, H.X.; Ma, J.J.; Huang, J.C.; Wei, J.; Xu, Y.; Zhang, C.; et al. Quantization of the coupling mechanism between eco-environmental quality and urbanization from multisource remote sensing data. J. Clean. Prod. 2021, 321, 128948. [Google Scholar] [CrossRef]
  74. Li, X.Y.; Yu, X.; Wang, F.; Liang, T. Comprehensive Benefit Evaluation on the Project of Converting Farmland to Forestland and Grassland in arid desert area of northwest China. Res. Soil Water Conserv. 2023, 30, 216–223. [Google Scholar]
  75. Geng, G. Continue to promote high-quality development by returning farmland to forest and grassland: An interview with the person in charge of the National Forestry and Grassland Administration’s Ecological Center. Green China 2022, 19, 8–11. [Google Scholar]
  76. Liu, M.Z.; Wang, Y.F.; Pei, H.W. The changes of land use and carbon storage in the northern farming-pastoral ecotone under the background of returning farmland to forest(grass). J. Desert Res. 2021, 41, 174–182. [Google Scholar]
  77. Duan, X.M.; Han, M.; Kong, X.L.; Sun, J.X.; Zhang, H.X. Spatiotemporal Evolution and Simulation Prediction of Ecosystem Carbon Storage in the Yellow River Basin Before and After the Grain for Green Project. Environ. Sci. 2024, 45, 5943–5956. [Google Scholar]
  78. Dong, M.; Zhong, F.N.; Wang, G.J. An Empical Study on Grain For Grass And Food Security in Less—Developed Regions—A Case Study of Ningxia Hui Autonomous Region. China Popul. Resour. Environ. 2005, 17, 107–111. [Google Scholar]
  79. Wang, B.; Liu, G.B.; Zhang, G.H.; Yang, Y.F. Effects of Grain for Green Project on Food Security on Loess Plateau. Bull. Soil Water Conserv. 2013, 33, 241–245. [Google Scholar]
  80. Zhang, C.S. Strengthening the concept of ecological civilization and promoting green development. Social. Forum 2020, 8, 11–12. [Google Scholar]
  81. Li, S.D. Comparison and Implications of Returning Farmland to Forests and Grasslands between China and Foreign Countries. World For. Res. 2002, 15, 22–27. [Google Scholar]
  82. Gao, G.X.; Zhang, G.L.; Liu, M.X.; Li, W.Z.; Liu, G.Q.; Hu, W.Z. Review of Research and Practice on Returning Farmland to Forests at Home and Abroad. J. Northwest For. Univ. 2007, 20, 203–208. [Google Scholar]
  83. Zhang, Y.W.; Yu, Y.X.; Zhao, Q.G. Implementary Detailed Rules of the Second Land Survey of Yunnan Province (Rural Section), 1st ed.; Yunnan People’s Publishing House: Kunming, China, 2007. [Google Scholar]
  84. Hong, Y.M. The Status, Roles and Limitations of Econometrics. Econ. Res. J. 2007, 53, 139–153. [Google Scholar]
Figure 1. Geographical location and digital elevation model (DEM) map of the research area. (a) Geographical location; (b) distribution of the 129 counties; (c) DEM map.
Forests 15 01956 g001
Figure 2. RS image interpretation process.
Forests 15 01956 g002
Figure 3. Research flowchart.
Forests 15 01956 g003
Figure 4. The 129 counties in Yunnan Province. (a) The county-level classification results with different slopes; (b) the average slope of the 129 counties in Yunnan Province.
Forests 15 01956 g004
Figure 5. Principle diagram for evaluating policy effect. (a) The situation where the parallel trend assumption before policy implementation is met; (b) the situation where the parallel trend assumption before policy implementation is not met.
Forests 15 01956 g005
Figure 6. Modeling steps for spatial econometric models.
Forests 15 01956 g006
Figure 7. RS interpretation results of FCRs of 129 counties in Yunnan from 1990 to 2020.
Forests 15 01956 g007
Figure 8. RS interpretation results and Getis–Ord Gi* analysis of annual average values of FCRs in 129 counties in Yunnan.
Forests 15 01956 g008
Figure 9. The trend of temporal changes in FCRs in different levels of counties.
Forests 15 01956 g009
Figure 10. Parallel trend test.
Forests 15 01956 g010
Figure 11. Parallel trend test.
Forests 15 01956 g011
Figure 12. Parallel trend test.
Forests 15 01956 g012
Figure 13. Annual average values of the proportion of CLA and the LRR of 129 counties (Unit: %).
Forests 15 01956 g013
Table 1. Detailed information on the RS images from 1990 to 2020.
YearRS Image Data DetailsTimeSpatial Resolution
1990Landsat TMDecember 1989 to February 199230 m × 30 m
1995Landsat TMDecember 1995 to February 1996
2000Landsat TM/ETM+December 1999 to February 2000
2005Landsat TM/ETM+December 2004 to February 2005
2010Landsat TMDecember 2009 to February 2010
2015Landsat OLIJanuary 2015 to February 2015
2020Landsat OLIJanuary 2020 to February 2020
Table 2. The classified areas of LULC in Yunnan.
Land Use TypesLand Use Classification Area (Unit: 10,000 ha)
NumberNameIn 1990In 1995In 2000In 2005In 2010In 2015In 2020
1Farmland552.45551.27551.08548.89545.96542.28539.56
11Paddy Field136.77136.24135.91135.37134.53132.68131.39
12Dryland415.68415.03415.17413.52411.43409.60408.17
2Forest Land1868.921930.961998.192119.852224.102321.672418.67
21Closed Forest Land (CFL)1112.911237.201414.581553.961724.811784.481884.72
22Other Forest Land756.02693.75583.61565.89499.29537.19533.95
3Grassland532.64501.25481.25403.85325.65253.64181.12
31Pasture with High Coverage340.02323.92307.02248.01195.20150.60105.36
32Pasture with Medium and Low Coverage192.62177.33174.23155.84130.46103.0475.76
4Water48.1448.5249.3451.1453.2854.7556.09
41Rivers and Lakes31.9631.8631.7831.6331.4731.3231.18
42Reservoirs and Ponds16.1816.6617.5619.5121.8123.4324.91
5Construction Land61.7864.1066.7276.7786.77108.00129.69
51Urban Construction Land, Rural Settlement Area, and Land for Mining and Industry50.8252.7254.8461.9471.8690.40109.17
52Other Building Land10.9611.3811.8814.8214.9117.5920.52
6Unused Land778.48746.33695.85641.93606.67562.09517.30
61Bare Land105.56100.6196.1383.4470.7367.6464.83
62Other Land Types672.92645.72599.72558.49535.93494.46452.47
Table 3. The basic standards for dividing the 129 counties in Yunnan.
Dividing IndicatorsClassification Criteria
Flatland CountySemi-Mountainous and Semi-Flatland (SMSF) CountyMountainous County
Leading indicatorCIFA≥0.50.2~0.5<0.2
Reference indicatorsPFF≥50%30%~50%<30%
PFA≥20%10%~20%<10%
N11~210
N2≥10~10
Note: In this study, the 129 counties in Yunnan are classified into 21 flatland counties, 37 semi-mountainous and semi-flatland (SMSF) counties, and 71 mountainous counties; the non-flatland counties (the mountainous areas) include 37 SMSF counties and 71 mountainous counties in this study.
Table 4. The index system of the effect analysis on PRFF.
AttributionsDimensionsVariablesCalculation MethodsData SourcesUnits
Dependent VariableFCRForest Coverage Rate (FCR)Area of CFL/Total Land Area (TLA) × 100%RS Image Interpretation%
Core Independent VariablePolicy EffectTime of the Project (Time)Taking 1 in 2000 and later, and taking 0 in other yearsNoneNone
Dummy Variable of the Project (Treat)Taking 1 for the treatment group, and taking 0 for the control groupNoneNone
Control VariableIndustrial EconomyPer Capita GDPln(GDP/Total Population)Yunnan Statistical YearbookCNY/Person
The Proportion of Output Value of the Secondary IndustryOutput Value of the Secondary Industry/GDP × 100%Yunnan Statistical Yearbook%
The Proportion of Output Value of the Tertiary IndustryOutput Value of the Tertiary Industry/GDP × 100%Yunnan Statistical Yearbook%
Population StructurePopulation Densityln(Total Population/TLA)Yunnan Statistical YearbookPerson/km2
Population Urbanization Rate(1 − Total Rural Population)/Total Population × 100%Yunnan Statistical Yearbook%
Land UseLand Reclamation Rate (LRR) (i.e., the Proportion of Farmland)FLA/TLA × 100%RS Image Interpretation%
Land Utilization Rate(1 − Unused Land Area/TLA) × 100%RS Image Interpretation%
Ecological ProtectionOver-reclaimed Rate(LRR − Suitable LRR)/Suitable LRR × 100%RS Image Interpretation, Land Suitability Evaluation%
The Proportion of Soil Erosion Land AreaSoil Erosion Area/TLA × 100%Existing Thematic Surveys%
Natural Environmental ConditionsAnnual Average TemperatureConvert to grid data with a resolution of 0.1° × 0.1° using the IDW interpolation methodData from Various Meteorological Stations in China°C
Annual Average Precipitationmm
Table 5. Transfer matrix of LUTs (Unit: 10,000 ha).
Number of TypesIn 2000The Area of Mutual Transformation of Various Land Use TypesDecreaseIn 2020
→1→21→22→3→4→5→6
1551.08522.397.104.114.662.298.751.7828.69539.56
211414.585.621385.469.353.390.889.300.5729.121884.72
22583.613.89152.33408.195.291.3912.490.03175.42533.95
3481.254.66231.8988.45130.971.2223.860.20350.27181.12
449.340.380.050.020.2448.310.290.051.0356.09
566.720.300.140.050.071.0465.030.091.69129.69
6695.852.32107.7523.7936.490.969.96514.58181.27517.30
Total3842.42539.561884.72533.95181.1256.09129.69517.303842.42
Increase17.17499.25125.7650.157.7864.652.71
Net Increase or Decrease−11.52470.14−49.66−300.126.7562.97−178.56
Note: In the number of LUTs, 1, 3, 4, 5, and 6 represent farmland, grassland, water, construction land, and unused land, respectively. Moreover, 21 and 22 respectively represent CFL and other forest land.
Table 6. Comparison of changes in FCRs in different categories of counties (Unit: %).
County-Level ClassificationChanges from 1990 to 2000Changes from 2000 to 2020Annual Average Change Rate from 1990 to 2000Annual Average Change Rate from 2000 to 2020
Flatland county5.76818.13002.26251.2520
SMSF county6.437611.22242.42271.5907
Mountainous county7.849313.34892.51011.5992
Non-flatland county7.365712.62042.48331.5966
Note: The non-flatland county includes the SMSF counties and the mountainous counties.
Table 7. Baseline regression results of the DID model.
Types(1)(2)
Time × Treat3.8536(0.9520) ***2.3880(0.9274) **
Control variablesNoYes
Individual fixed effectsYesYes
Time fixed effectsYesYes
Sample size903903
R20.97280.9961
Note: **, and *** indicate the significance level of 10%, 5%, and 1%, respectively. All results were estimated using the estimation method of individual cluster robust standard error, and all relative DID models in the following text are estimated by using this robust standard error method.
Table 8. Robustness test results of the DID model.
TypesExcluding Samples from 2020Considering the Fixed Effects of Time and Prefecture-Level City
(1)(2)(3)(4)
Time × Treat3.3835 (0.8694) ***2.0189 (0.8683) **2.9458 (0.7809) ***2.1045 (0.7590) ***
Control variablesNoYesNoYes
Individual fixed effectsYesYesYesYes
Time fixed effectsYesYesNoNo
Time and prefecture-level city effectsNoNoYesYes
Sample size774774903903
R20.97430.97680.98090.9825
Note: **, and *** indicate the significance level of 10%, 5%, and 1%, respectively.
Table 9. Placebo test results of the DID model.
TypesAssuming the Implementation Time of PRFF is 1995 and Considering Samples from 1990 to 2000Assuming Eight Prefecture-Level Cities in Southern Yunnan as the Control Group and 8 Prefecture-Level Cities in Northern Yunnan as the Disposal Group
(1) Considering Samples from 1990 to 1995(2) Considering Samples from 1990 to 2000(3) Considering Samples from 1990 to 2000(4) Considering Samples from 1990 to 2020
Time × Treat0.4658 (0.3419)0.4345 (0.4955)–0.3954 (0.5227)–0.4907 (0.7900)
Control variablesYesYesYesYes
Individual fixed effectsYesYesYesYes
Time fixed effectsYesYesYesYes
Sample size258387387903
R20.99810.99250.99250.9751
Note: All placebo test results must not be significant (i.e., all placebo test results must not pass the 10% significance level test). Otherwise, they will indicate that the DID model has estimation bias. The 8 prefecture-level cities in southern Yunnan include Zhaotong, Qujing, Kunming, Chuxiong, Dali, Lijiang, Diqing, and Nujiang; the 8 prefecture-level cities in northern Yunnan include Wenshan, Honghe, Yuxi, Pu’er, Xishuangbanna, Lincang, Dehong, and Baoshan.
Table 10. Spatial autocorrelation test results of OLS estimation.
ItemsIndicatorsStatisticp-Values
Spatial ErrorMoran’s I2.782 ***0.005
LM157.708 ***0.000
Robust LM114.996 ***0.000
Spatial LagLM48.962 ***0.000
Robust LM6.249 **0.012
Note: **, and *** indicate the significance level of 10%, 5%, and 1%, respectively.
Table 11. Regression results of the spatial DID model.
Types(1) SARAR(2) SARAR(3) SAR(4) SAR(5) SEM(6) SEM(7) SDM(8) SDM
Time × Treat2.3266 ***
(0.7387)
1.8082 ***
(0.6889)
2.9099 ***
(0.7308)
1.8966 ***
(0.7269)
2.7713 ***
(0.7755)
2.0246 ***
(0.7307)
2.6511 ***
(0.7946)
1.8074 ***
(0.6749)
Parameter ρ–0.4831 ***
(0.1596)
–0.4508 **
(0.1765)
0.4850 ***
(0.0599)
0.4517 ***
(0.0621)
0.4691 ***
(0.0608)
0.4069 ***
(0.0607)
Parameter λ0.7510 ***
(0.0652)
0.7498 ***
(0.0740)
0.4899 ***
(0.0614)
0.4912 ***
(0.0655)
Control variablesNoYesNoYesNoYesNoYes
Individual fixed effectsYesYesYesYesYesYesYesYes
Time fixed effectsYesYesYesYesYesYesYesYes
Sample size903903903903903903903903
Within R20.85820.86740.86380.87740.86020.87140.86560.8881
Between R20.01770.50740.05390.28630.02790.44250.07050.0409
Overall R20.17530.50510.19040.39150.17970.47550.19840.0094
Note: **, and *** indicate the significance level of 10%, 5%, and 1%, respectively.
Table 12. Regression results of the spatial DID model when flatland county is the control group and SMSF county is the treatment group.
Types(1) SARAR(2) SARAR
Time × Treat2.4804 (0.8943) ***1.7131 (0.7043) **
Control variablesNoYes
Individual fixed effectsYesYes
Time fixed effectsYesYes
Sample size406406
Within R20.83340.8600
Between R20.00840.1576
Overall R20.15860.2860
Note: **, and *** indicate the significance level of 10%, 5%, and 1%, respectively.
Table 13. Regression results of the spatial DID model when flatland county is the control group and mountainous county is the treatment group.
Types(1) SARAR(2) SARAR
Time × Treat3.3603 (0.9139) ***2.0058 (0.7957) **
Control variablesNoYes
Individual fixed effectsYesYes
Time fixed effectsYesYes
Sample size644644
Within R20.87620.8926
Between R20.06850.1705
Overall R20.20320.2905
Note: **, and *** indicate the significance level of 10%, 5%, and 1%, respectively.
Table 14. Regression results of the spatial DID model with the LRR as the dependent variable.
Types(1) SARAR(2) SARAR
Time × Treat0.1513 (0.1464)0.1615 (0.0834) *
Control variablesNoYes
Individual fixed effectsYesYes
Time fixed effectsYesYes
Sample size903903
Within R20.21290.7083
Between R20.14440.1228
Overall R20.00270.0904
Note: * indicates the significance level of 10%.
Table 15. Regression results of the spatial DID model with the natural logarithmic form of the TGP as the dependent variable.
Types(1) SARAR(2) SARAR
Time × Treat1.8455 (0.8850) **1.4467 (0.8707) *
Control variablesNoYes
Individual fixed effectsYesYes
Time fixed effectsYesYes
Sample size903903
Within R20.39790.4389
Between R20.00000.0622
Overall R20.07630.1012
Note: *, and ** indicate the significance level of 10% and 5%, respectively.
Disclaimer/Publisher’s Note: The statements, opinions and data contained in all publications are solely those of the individual author(s) and contributor(s) and not of MDPI and/or the editor(s). MDPI and/or the editor(s) disclaim responsibility for any injury to people or property resulting from any ideas, methods, instructions or products referred to in the content.

