Abstract
Camellia oleifera is an oilseed crop that holds significant economic, ecological, and social value. In the realm of Camellia oleifera cultivation, utilizing hyperspectral analysis techniques to estimate chlorophyll content can enhance our understanding of its physiological parameters and response characteristics. However, hyperspectral datasets contain information from many wavelengths, resulting in high-dimensional data. Therefore, selecting effective wavelengths is crucial for processing hyperspectral data and modeling in retrieval studies. In this study, by using hyperspectral data and chlorophyll content from Camellia oleifera samples, three different dimensionality reduction methods (Taylor-CC, NCC, and PCC) are used in the first round of dimensionality reduction. Combined with these methods, various thresholds and dimensionality reduction methods (with/without further dimensionality reduction) are used in the second round of dimensionality reduction; different sets of core wavelengths with equal size are identified respectively. Using hyperspectral reflectance data at different sets of core wavelengths, multiple machine learning models (Lasso, ANN, and RF) are constructed to predict the chlorophyll content of Camellia oleifera. The purpose of this study is to compare the performance of various dimensionality reduction methods in conjunction with machine learning models for predicting the chlorophyll content of Camellia oleifera. Results show that (1) the Taylor-CC method can effectively select core wavelengths with high sensitivity to chlorophyll variation; (2) the two-stage hybrid dimensionality reduction methods demonstrate superiority in three models; (3) the Taylor-CC + NCC method combined with an ANN achieves the best predictive performance of chlorophyll content. The new two-stage dimensionality reduction method proposed in this study not only improves both the efficiency of hyperspectral data processing and the predictive accuracy of models, but can serve as a complement to the study of Camellia oleifera properties using the Taylor-CC method.
1. Introduction
Photosynthesis is the biochemical process through which most vegetation utilizes light energy to convert carbon dioxide and water into organic matter (i.e., glucose), while releasing oxygen as a byproduct [1]. In photosynthesis, chlorophyll serves as a key pigment responsible for absorbing light energy [2]. By measuring the chlorophyll content in the leaves of vegetation, it is possible to estimate the photosynthetic capacity and rate of this vegetation [3,4]. However, the chlorophyll content of vegetation may be influenced by environmental factors, such as climate change, light variations, and temperature fluctuations, making it difficult to assess chlorophyll content accurately [5,6]. In practice, decreased chlorophyll levels are often a sign of pests, diseases, nutritional deficiencies, or environmental stress [7]. Therefore, by measuring and monitoring changes in the chlorophyll content of vegetation, early interventions can be implemented to help maintain its health. Conventional methods for measuring chlorophyll content primarily involve acetone–ethanol extraction methods [8], spectrophotometry, and high-performance liquid chromatography [9]. These destructive methods, based on laboratory procedures, are time-consuming and costly. By overcoming the limitations of these methods, hyperspectral analysis technology can rapidly and non-destructively acquire spectral data from leaves/canopies of large areas of vegetation, facilitating real-time analysis [10,11]. Most chlorophyll a and chlorophyll b molecules exhibit absorption wavelengths/bands between 645 nm and 670 nm, while some special types of chlorophyll absorb at wavelengths longer than 700 nm [12]. Hyperspectral imaging technology can capture these absorption and reflection characteristic of chlorophyll across various spectral wavelengths, generating hyperspectral reflectance data [13].
At the same time, hyperspectral analysis technology not only provides significant spectral information but includes a large number of wavelengths. Feature extraction can help reduce dimensionality and redundant information in hyperspectral data, thus compressing datasets and improving the efficiency of data processing. However, when processing large-scale hyperspectral images and reflectance data, traditional dimensionality reduction methods, such as principal component analysis (PCA) and linear discriminant analysis (LDA), may encounter challenges associated with high computational complexity [14,15]. This leads to extensive consumption of computational time and resources, hindering the efficiency of the analysis process. With advancement of computational science, machine learning methods have been widely used for hyperspectral feature extraction, including support vector machines [16], random forests [17], and k-nearest neighbor [18]. These models are prone to overfitting during training, particularly when the number of training samples is limited, and the feature dimension is high. The emergence of deep learning has advanced the research in hyperspectral feature extraction. Artificial neural network (ANN) [19], convolutional neural network (CNN) [20], and recurrent neural network (RNN) [21] have been applied to extracting features from hyperspectral data processing. However, deep learning models are often regarded as ‘black box’ models, making it difficult to intuitively understand the importance of the features and wavelengths upon which the models are based. What is more, when identifying the core wavelengths of hyperspectral reflectance data, only relying on one method/model could result in the loss of some advantages that other methods/models could preserve. Moreover, arbitrarily combining multiple methods/models to reduce the dimensionality of hyperspectral reflectance data may result in conflicts regarding the selection of dimensions and parameters, ultimately hindering achieving optimal dimensionality reduction results.
Like other green leafy vegetation, Camellia oleifera contains a large amount of chlorophyll in its leaves, allowing it to carry out photosynthesis. In practice, Camellia oleifera aids in preventing soil erosion and the reversion of farmland to nature land [22], thus holding considerable economic, ecological, and social value [23]. In the cultivation of Camellia oleifera, analyzing its hyperspectral reflectance data can help understand its physiological parameters and response characteristics, thereby advancing the growth of the Camellia oleifera industry. In a recent study on the hyperspectral data of Camellia oleifera [24], based on the spectral characteristics of its leaves at the same growth period, Sun et al. developed a new algorithm using Taylor expansion to identify core wavelengths. However, their study focused solely on the correlation among wavelengths, ignoring the relationship between wavelengths and target variables.
On the other hand, predicting chlorophyll content in leaves remains a challenge. In recent years, many scholars have conducted in-depth research on estimating/retrieving the chlorophyll content of vegetation using hyperspectral analysis. For example, using a hybrid strategy of variable combination population analysis (VCPA) and genetic algorithm (GA) [25], Hasan et al. studied the performance of five machine learning algorithms to estimate the chlorophyll content of litchi based on the hyperspectral fractional-derivative reflections from 298 litchi leaves. By extracting color features, spectral indices, and chlorophyll fluorescence intensities from these various types of images [26], Zhang et al. developed a multivariate linear regression model and a partial least squares regression model to predict chlorophyll content. However, the methods (VCPA and GA) lack mathematical representations of their regression function, which makes it difficult to ensure the stability and reliability of the prediction models in practical applications, particularly when addressing complex problems. Meanwhile, empirical or semi-empirical models based on statistical methods (i.e., multivariate regression and linear regression) often fail to address the universality problem related to the physical mechanism. More importantly, there are very limited studies focusing on the chlorophyll content of Camellia oleifera using hyperspectral analysis.
Based on these above-mentioned problems, the aim of this study is to compare the performance of various dimensionality reduction methods in combination with machine learning models to achieve the most accurate prediction of chlorophyll content in Camellia oleifera. By comprehensively considering the correlations between wavelengths and target variables (i.e., chlorophyll content), three dimensionality reduction methods (Taylor-CC, NCC, and PCC) were used in the first round of dimensionality reduction. Then, various thresholds and dimensionality reduction methods (with/without further dimensionality reduction) were applied in the second round of dimensionality reduction to identify different sets of core wavelengths. Thus, a series of chlorophyll content estimation models for Camellia oleifera were developed and compared by using three machine learning models based on these proposed methods. The specific objectives of this study are as follows:
- (1)
- to screen core wavelengths through the utilization of various single/two-stage dimensionality reduction methods;
- (2)
- to identify the optimal dimensionality reduction method and the best model to serve as a final chlorophyll content retrieval model;
- (3)
- to act as a supplement to monitoring the growth of Camellia oleifera by hyperspectral analysis technology.
2. Data and Methods
2.1. Data and Collecting
2.1.1. Overview of the Study Area and Design of Site Experiments
The data for this experimental study were collected in Hepeng Town, Shucheng County, Lu’an City, Anhui Province, China. It borders Wanfohu Town to the north, Gaofeng Township to the west and south, and Tangchi Town to the east. Hepeng Town has a typical subtropical monsoon climate, which is characterized by a cold winter, a hot summer, four distinct seasons, abundant rainfall, and sufficient sunlight. Additionally, Hepeng Town has frequent fog and minimal frost, creating favorable conditions for the growth of agricultural crops.
The survey sites are situated in the Camellia oleifera plantation of Anhui Dechang Seedling Co., Ltd., located in Zhanchong Village at Hepeng Town (see Figure 1). From 14 December 2022 to 17 December 2022, a total of 48 square plots, each measuring 20 m × 20 m, were divided into four parts (A, B, C, and D) in the study area. Since the growth conditions of the sample trees in each plot, such as planting year, variety, and cultivation measures (i.e., fertilization, watering, pruning), were consistent, the sample size was ample. Thus, five trees were selected from each plot, and a total of 240 Camellia oleifera trees were numbered and surveyed. All selected trees belonged to the Changlin series of Camellia oleifera, which were in a stable full blooming phase, ensuring consistent and reliable data for the study.
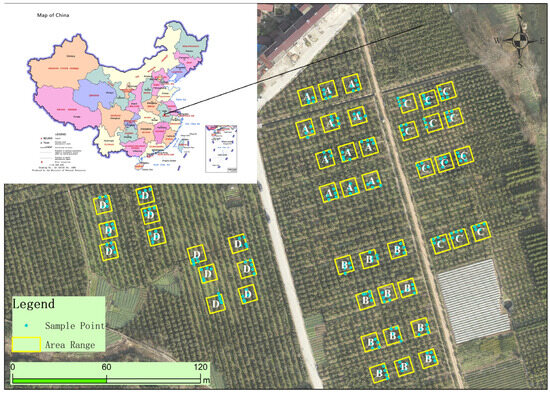
Figure 1.
Overview of the study area and its geographic location in China. Boxes represent the locations of square plots, and points represent the location of the selected tree in each plot. The entire study area is divided into four parts (A, B, C, and D).
2.1.2. Hyperspectral Data Acquisition
In this study, surveyors employed an advanced all-band terrain spectrometer (Fieldspec4 Wide-Res, Analytical Spectrum Devices Inc., Boulder, CO, USA) to capture the canopy spectra of the 240 trees (see Figure 2). This instrument operates across a broad wavelength range from 350 to 2500 nm, and at a distance of four meters or more from the ground. The fiber optic cable of the spectrometer is raised above the center of the plant canopy using a fiber jumper, a fiber adapter, a carbon fiber telescopic rod, and a pipeline clamp. The fiber optic probe was positioned perpendicular to the top of the canopy, creating a circular observation area with a diameter , where represents the vertical distance between the fiber optic probe and the center of the canopy. This setup allows for precise spectral measurements and data collection within the defined observation area. Moreover, measurements were typically conducted between 10 a.m. and 2 p.m. local time, ensuring that data collection was conducted during peak sunlight hours. To minimize the impact of shadows and human interference on the collection of canopy spectra, the surveyors dressed in dark clothing, positioned themselves facing the sun during measurements, and maintained a specific distance from the edge of the plant canopy. The instrument was preheated for a minimum of 20 min prior to taking measurements. Furthermore, each sample was measured continuously 10 times, whose average value was used as the original canopy spectra for the sample.
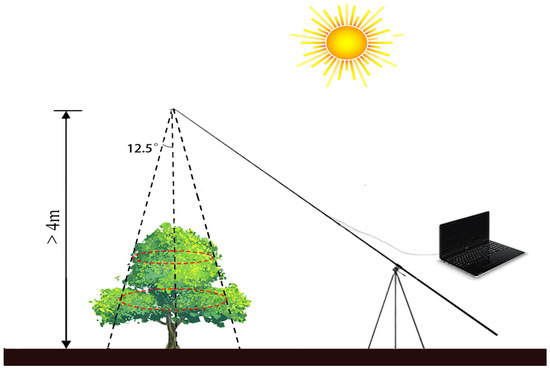
Figure 2.
Instrument erection schematic diagram. The red dashed circle represents the circular observation region that is perpendicular to the top of canopy.
2.1.3. Soil and Plant Analyzer Development (SPAD) Data Acquisition
An SPAD-502 Plus chlorophyll meter (SPAD-502 Plus, Konica Minolta, Inc., Osaka, Japan) was utilized to measure the relative chlorophyll content of plant leaves in this study. By comparing the reflectance of leaves at red (680 nm) and near-infrared (940 nm) wavelengths, the ratio was used to calculate the SPAD measurement, which indicates chlorophyll content index. Therefore, SPAD measurements were directly used in place of chlorophyll content in this study. To ensure alignment with the hyperspectral observation scale, the spatial position of measured leaves must be located within a circular area with a diameter of 0.9 m, centered on the upper surface of the canopy. When collecting leaves, it is important to select those with their upper surfaces facing the sky. This is because those leaves usually receive more sunlight and have higher chlorophyll content, more accurately reflecting the growth state of the plant. During collecting, the number of leaves should be at least 16 from a plant, with three SPAD measurements taken from each leaf, resulting in at least 48 measurements per plant. Then, the 48 values were averaged to calculate the SPAD measurement for the leaves on the upper surface of a single plant’s canopy, after eliminating any outliers.
2.1.4. Measurements
In this study, 240 hyperspectral reflectance measurement samples were preprocessed to remove invalid data outside the range of [0, 1]. Their cleaned dataset is shown in Figure 3a, which comprises 2020 wavelengths. Blank/gap areas in the figure indicate wavelengths that were removed due to their susceptibility to the interference from water vapor during measurement. On the other hand, the histogram of the SPAD data corresponding to the 240 measurements samples is shown in Figure 3b.
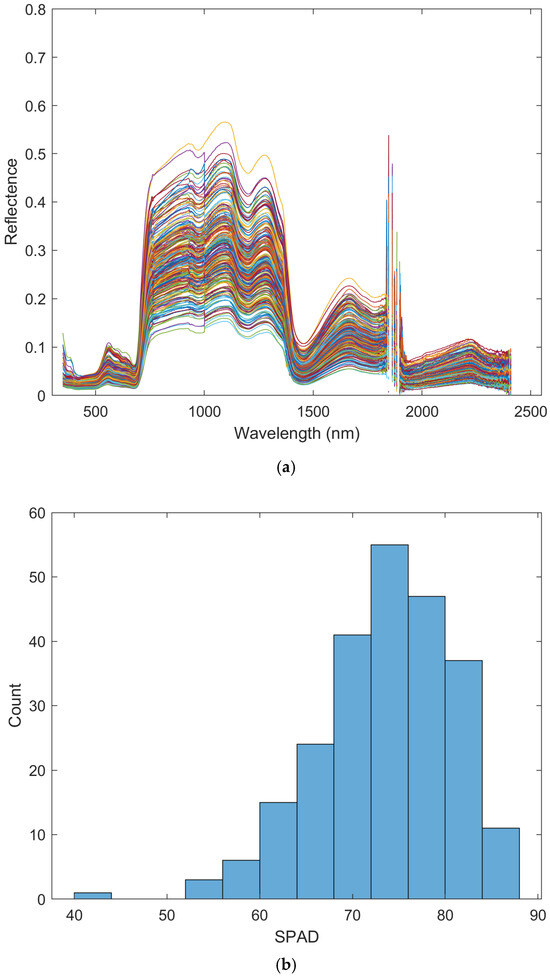
Figure 3.
(a) 240 hyperspectral measurement samples after removing invalid reflectance (Note: color is only for distinguishing different lines and has no specific meaning), and (b) the distribution of their SPAD measurements.
2.2. Methods
In order to reduce the redundant information in hyperspectral reflectance data and utilize models to predict the chlorophyll content in the leaves of Camellia oleifera, the following feature extraction methods and machine learning models were employed.
2.2.1. Feature Extraction
Given that the hyperspectral reflectance data in this study exhibited characteristics of multi-band information and high resolution, they inherently involved a substantial volume of data. Therefore, it is crucial to perform correlation analysis among wavelengths and target variables, followed by the elimination of redundant wavelengths to optimize the utilization of computing resources effectively. Based on the methods introduced below, several two-stage hybrid dimensionality reduction methods were developed.
- (1)
- Nonlinear Correlation Coefficient (NCC)
Mutual information entropy is a fundamental concept used to quantify the correlation between two random variables [27]. Wang et al. proposed a modified nonlinear correlation information entropy for multivariate analysis [28]. Their experimental findings demonstrated that this entropy can effectively analyze not only linear variables but nonlinear ones. Their proposed nonlinear correlation coefficient is defined as
Specific definitions of and are provided in Appendix B. Based on , , the relationship between variables can be analyzed. Calculated via Equation (1), represents the nonlinear correlation coefficient between the i-th random variable and the j-th one. Since a random variable is identical to itself, . For the other elements of , . When the nonlinear correlation between two random variables is stronger, the value of their corresponding is closer to 1. Conversely, the value of tends to be closer to 0.
- (2)
- Pearson Correlation Coefficient (PCC)
The Pearson correlation coefficient, also known as the product–moment correlation coefficient, is a statistical measure that quantifies the degree of linear correlation between two random variables (or also real-valued vectors). It is the first formal measure of correlation and remains one of the most commonly utilized measures of correlation [29]. The Pearson correlation coefficient for two random variables x and y is defined in Appendix B.
The Pearson correlation coefficient ranges from −1 to 1, and it is invariant to the linear transformation of either variable. If is close to −1 or 1, there is a strong linear relationship between the two random variables; If is close to 0, then there is almost no linear relationship between the two variables [30].
- (3)
- Taylor Correlation Coefficient (Taylor-CC)
In a study related to hyperspectral signals, utilizing the Taylor expansion of smooth functions, Sun et al. [24] introduced a novel method to estimate the correlation between hyperspectral signals at two wavelengths. Assuming that a continuous (reflection) function with at least the second-order derivative at two nearby wavelengths ( and ), the corresponding reflectance measurements at can be described as
Thus, the estimated reflectance at , using the derived information up to the second-order derivative at , becomes
Similarly, and can be obtained using the local information at .
Therefore, the following can be defined as a correlation measure between and .
Based on Equation (4), a correlation matrix on wavelengths can be achieved. It should be noted that is a symmetric matrix. Since a wavelength variable is identical to itself, , . The other elements of , represent the linear/nonlinear relationship between the i-th wavelength variable and the j-th one. In this hyperspectral analysis, shows blocks of high values along its diagonal belt, because if is closer to , then the correlation is stronger.
- (4)
- Setting Threshold
In a correlation analysis of feature extraction, a common practice is to establish a criterion by setting a threshold to screen features that exhibit no obvious correlation [31]. If the correlation coefficient between two features exceeds a specified threshold, it indicates a strong correlation between them, and only one of the features needs to be kept; if the correlation falls below this threshold, it is deemed weak, and neither of the two features can be filtered out.
2.2.2. Machine Learning Models
Based on the above-described methods and threshold setting, this study focused on selecting the core/key wavelengths that meet the desired criteria. Then, three machine learning models were introduced to develop the inversion model of SPAD based on selected core wavelengths.
- (1)
- Least Absolute Shrinkage and Selection Operator
In 1996, Tibshirani [32] introduced the least absolute shrinkage and selection operator (Lasso) for parameter estimation and variable selection in regression analysis. Lasso regression is a specific case of penalized least squares regression using the L1-penalty function (see Figure A1). In contrast to ridge regression that minimizes the sum of squared errors, Lasso regression seeks to balance model complexity and predictive accuracy by penalizing the absolute values of its coefficients. By transforming each coefficient into a constant component and truncating at zero, Lasso regression minimizes the residual sum of squares while constraining the sum of the absolute values of the coefficients.
In this study, Lasso regression was used to model SPAD, since it is effective for high-dimensional datasets and problems with a large number of features [33]. The objective function of Lasso regression is
where is the response variable, is the predictive variable, and is the coefficient variable. is the regularization parameter that controls the strength of the penalty on the coefficient. By manually setting a range of possible values (e.g., = 0.01, 0.1, 0.2, etc.), cross-validation is used for each value to evaluate the performance of the model, thus selecting the value that makes the model perform the best. Notably, to ensure that results are comparable, a specific value of = 0.1 was utilized in this study, as most experiments showed improved performance with this setting.
- (2)
- Artificial Neural Network
An artificial neural network (ANN) is modeled based on biological neural networks [34]. Every neural network consists of three essential components: node features, network topology, and learning rules. Figure A2 illustrates how the ANN works. Initially, the input data () is transmitted from the input layer to the hidden layer in an adaptive network through forward propagation. Subsequently, the weights are adjusted in reverse based on the gradient of error measure produced by the loss function during the process of backpropagation. This adjustment is performed using a gradient descent algorithm, which iteratively optimizes network parameters to minimize the error measure. By continuously updating the weights based on the above rules, the network fine-tunes its parameters to learn and adapt to the input data, improving its predictive capabilities and overall performance. This iterative process of adjusting weights through both backpropagation and gradient descent enables the network to efficiently learn and optimize its internal representations for better accuracy and effectiveness [35].
In this study, given that the dataset consisted of only 240 samples, 15 hidden nodes were used to identify an ANN structure with the best performance. The hidden layer structures include all possible one to three hidden layers with pyramid style, i.e., {[15], [13,2], [12,3], [11,4], [10,5], [9,6], [8,7], [7,6,2], [6,5,4], [7,5,3], [8,5,2], [8,4,3], [9,4,2], [10,3,2], [14,1]}. Since the structure of [13,2] and the methods used in subsequent experiments achieved the best performance, [13,2] was chosen as the optimal structure for predicting chlorophyll content (see Table A1).
- (3)
- Random Forest
A random forest (RF) is a versatile machine learning method that was proposed and developed by Breiman in 2001 [36]. RF is known for its proficiency in both classification and regression tasks, showcasing exceptional performance in minimizing prediction errors across various benchmark datasets. When constructing an RF, two key aspects are important to eliminate overfitting: the random selection of data and the random selection of features.
The modeling process of RF mainly includes the following steps, as shown in Figure A3. First, the input data are drawn from the original datasets using a self-service sampling method (i.e., bootstrap sampling) to form multiple sub-datasets. Subsequently, for each sub-dataset, a decision tree is created. Decision trees use features to split nodes, and each node represents a specific feature. Finally, the integrator makes a decision (majority voting/averaging according to different tasks, i.e., classification/regression) [37]. In this study, 200 trees were established, each allowed to have a maximum of five leaves.
3. Experimental Design and Data Processing
3.1. Data Preprocessing and Core Wavelengths Selection Schemes
In practice, most initial datasets may contain missing values, duplicate values, and other discrepancies that need to be addressed during the data preprocessing stage. Hence, data preprocessing is necessary before utilizing the data in models to ensure their quality and reliability in the subsequent analysis. There is no unique method for data preprocessing, and it varies based on specific tasks and dataset properties. In this study, to eliminate scale differences among different features, all input/output data (i.e., reflectance and SPAD) were scaled linearly to the range of [−1, 1]. Moreover, due to the impact of water vapor [34], some measured reflectance values at certain wavelengths may be considered outliers. Therefore, it is also important to deal with the outliers in the reflectance data.
More importantly, to streamline the training complexity of prediction models and optimize computational resources, it is necessary to reduce the dimensionality of input data by selecting core wavelengths from the entire spectrum of reflectance data. On the other hand, the order of combining different dimensionality reduction methods also needs to be further investigated to evaluate their performance. These dimensionality reduction methods were divided into three types of schemes based on the three methods (Taylor-CC, NCC, and PCC) selected for the first round of dimensionality reduction. Then, in each of these three schemes, a decision was made on whether to proceed with the second round of dimensionality reduction. On this basis, different dimensionality reduction methods, single dimensionality reduction methods, and two-stage hybrid dimensionality reduction methods, were set up to identify which method achieved the best performance. Therefore, these specific schemes, listed in Table 1, were developed to compare the performance of different core wavelength selection schemes.

Table 1.
Different specific dimensionality reduction methods in different schemes.
The following were specific explanations of different dimensionality reduction methods utilized in different schemes.
Scheme I: Method (1): Taylor-CC: Dimensionality of input data is reduced using the Taylor-CC method based on a threshold and the information among different wavelengths. Method (2): Taylor-CC + PCC: Firstly, the dimensionality of input data is reduced based on the information among different wavelengths and a threshold using the Taylor-CC method. Subsequently, the reduced input data resulting from the first step are integrated with SPAD measurement information and a threshold for further dimensionality reduction through the PCC method. Method (3): Taylor-CC + PCC: Firstly, the dimensionality of the input data is reduced according to the information among different wavelengths by the Taylor-CC method. Subsequently, the reduced input data resulting from the first step are integrated with SPAD measurements for further dimensionality reduction through the NCC method.
Scheme II: Method (1): NCC; Method (2): NCC + PCC; Method (3): NCC + NCC.
Scheme III: Method (1): PCC; Method (2): PCC + PCC; Method (3): PCC + NCC.
Based on the results of the three schemes, it is also important to identify the most effective machine learning model for predicting chlorophyll content. To achieve this goal, using different sets of core wavelengths identified by various methods in different schemes, Lasso and RF models were trained and tested with a ratio of 70% and 30%, respectively; while an ANN model went through training, validation, and testing with a ratio of 70%, 15%, and 15%, respectively. Given that the data used in this study is relatively abundant and outliers have been removed in advance, a random division of training, validation, and testing samples would sufficiently meet the requirements for model training. Therefore, no cross-validation experiments were conducted to further verify the experimental results.
It should be noted that in the three schemes and different methods, different numbers of core wavelengths may be obtained by adjusting different thresholds. To ensure the validity of comparisons, the final number of core wavelengths used in experiments must be consistent in different dimensionality reduction schemes. Moreover, note that, for comparing results among different schemes, training samples in the three models should also be consistent, and testing samples in RF and Lasso must be consistent as well. Thus, the validation samples and testing samples in the ANN were the same as the testing samples in RF and Lasso.
In addition, it is important to perform uncertainty analysis to evaluate the potential impact of changes in core wavelengths on the prediction of chlorophyll content. Based on the best-performing methods and models identified from the previous experiments, each core wavelength was removed in turn to assess its impact on the prediction of chlorophyll content. Furthermore, a random forest importance ranking [38] was employed to assess the significance of each core wavelength by determining its contribution to the improvement of the model’s accuracy.
3.2. Evaluation Metrics
In this study, the root mean square error (RMSE), relative mean absolute error (RMAE), relative absolute error (RAE), determination coefficient (R2), mean square error (MSE), mean bias error (MBE), and mean absolute error (MAE) were utilized to assess the performance of the above schemes and models. They are defined as
where represents the i-th observed value, represents the i-th model predicted value, refers to the same size of observed values and model predicted values, is the mean of observed values, and is the mean of model predicted values. The performance of these schemes and models is better with lower RMSE, lower RMAE, lower RAE, higher R2, lower MSE, MBE close to zero, and lower MAE.
4. Results
4.1. Correlation Matrices from Taylor-CC, NCC, and PCC Method
Using the hyperspectral reflectance measurements with 2151 wavelengths obtained from 240 samples, a correlation analysis of all the wavelengths was calculated by using the Taylor-CC, NCC, and PCC methods, respectively. Therefore, the correlation matrices of the three methods were obtained (see Figure 4, Figure 5 and Figure 6). Those correlation matrices presented a clear diagonal pattern. At the locations away from the diagonal of the matrices, the correlation values based on the Taylor-CC and NCC methods approached to zero, except that the values based on the NCC method approached to one at a few specific locations. On the other hand, the correlation matrix of the PCC method still exhibited numerous high values at locations far from the matrix’s diagonal, which clearly indicated an inconsistency with the general characteristics of the reflectivity data in practice.
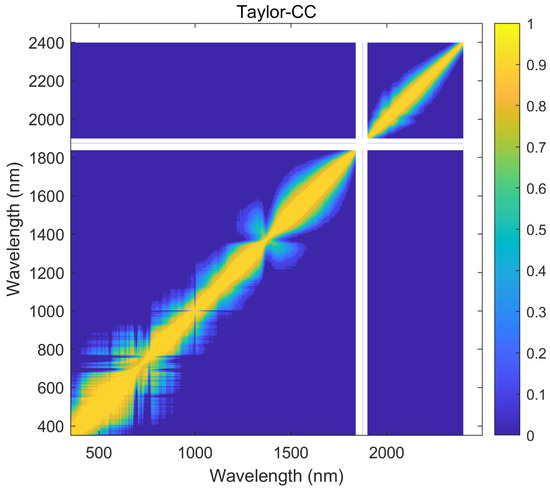
Figure 4.
The correlation matrix generated by the Taylor-CC method.
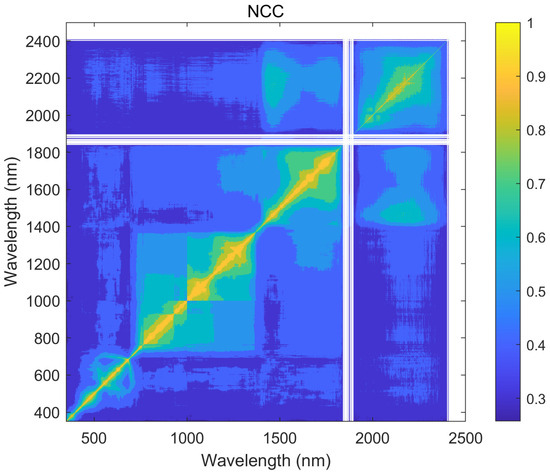
Figure 5.
The correlation matrix generated by the NCC method.
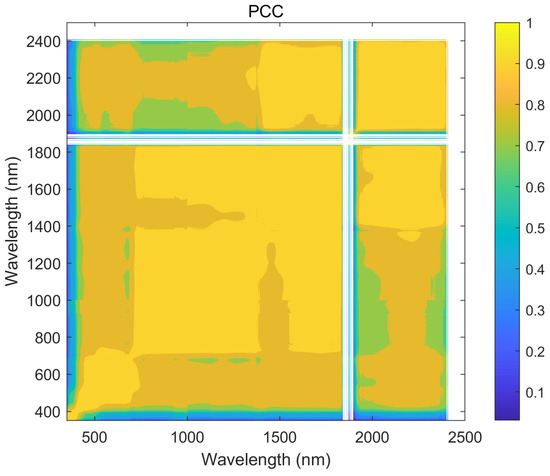
Figure 6.
The correlation matrix generated by the PCC method.
4.2. Core Wavelengths Selection Using Different Schemes and Methods
As an example of this study, the final number of core wavelengths selected in different experimental schemes was set to 50, 70, and 69. Because their final conclusions based on 50, 70, and 69 core wavelength numbers were identical. Only the results from one experiment (i.e., 70) are shown below.
When single dimensionality reduction methods were utilized, their corresponding thresholds of 0.926, 0.396, and 0.94608 were set in the Taylor-CC method, NCC method, and PCC method, respectively, so that their final numbers of core wavelength were all 70. When two-stage hybrid dimensionality reduction methods were utilized, multiple sets of core wavelengths with different numbers were used to illustrate the universality of the experimental conclusions during the first round of dimensionality reduction. Therefore, in the Taylor-CC, NCC, and PCC methods, different specific thresholds were established during the first round of dimensionality reduction to ensure the number of identified core wavelengths for each method were 90, 94, 97, 122, 123, and 125. In the second round of dimensionality reduction, either the NCC method or PCC method set specific thresholds to ensure that the final number of core wavelengths can be reduced to 70. The specific thresholds from three schemes are presented in Table 2, Table A2 and Table A3. Taking the example of ‘90 + 70’ and its corresponding thresholds ‘0.9540 + 0.0580’ in Table 2, the explanation is as follows. In the first round of dimensionality reduction, a threshold was set to 0.9540, so that the number of identified core wavelengths was 90. Based on this, the threshold for the second round of dimensionality reduction was then adjusted to 0.0580, so that the final number of core wavelengths was reduced to 70.

Table 2.
Thresholds of different methods in Scheme I.
By comparing Figure 7, Figure 8 and Figure 9, it is evident that the core wavelengths obtained from Scheme I were more evenly distributed than those obtained from Scheme II and III. In addition, the core wavelength sets obtained by the different dimensionality reduction methods were different in each scheme. This indicated that different dimensionality reduction methods/schemes analyzed the correlations among the dataset variables in different ways.
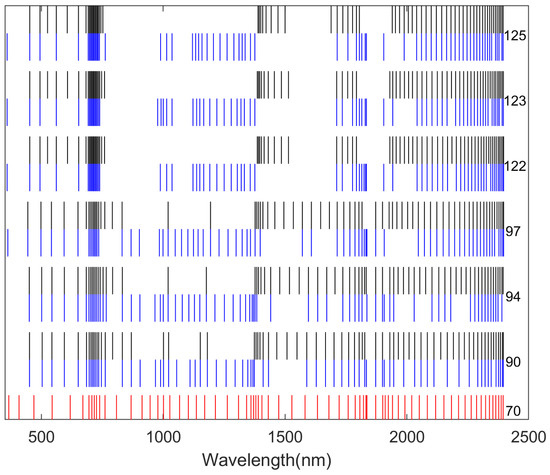
Figure 7.
A total of 70 core wavelengths were selected in Scheme I. The core wavelengths selected using Method (1) are marked in red, those using Method (2) are marked in black, and those using Method (3) are marked in blue. The specific numbers of wavelengths obtained after the first round of dimensionality reduction are provided on the right.
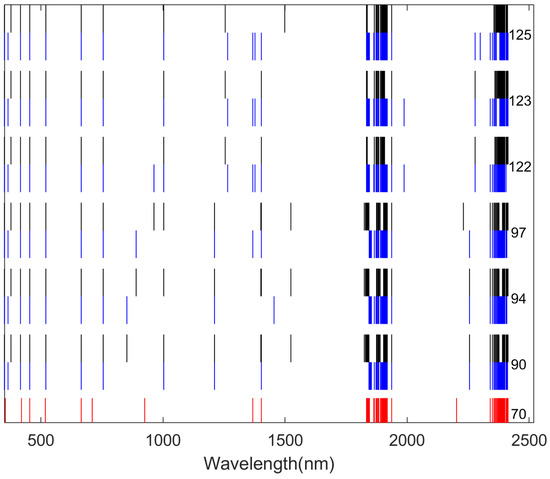
Figure 8.
A total of 70 core wavelengths were selected in Scheme II. The core wavelengths selected using Method (1) are marked in red, those using Method (2) are marked in black, and those using Method (3) are marked in blue. The specific numbers of wavelengths obtained after the first round of dimensionality reduction are provided on the right.
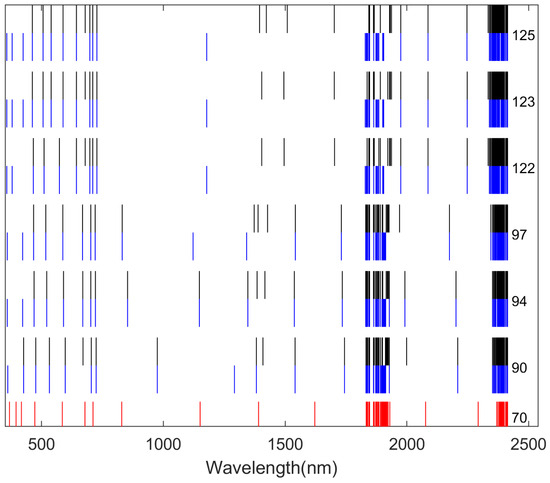
Figure 9.
A total of 70 core wavelengths were selected in Scheme III. The core wavelengths selected using Method (1) are marked in red, those using Method (2) are marked in black, and those using Method (3) are marked in blue. The specific numbers of wavelengths obtained after the first round of dimensionality reduction are provided on the right.
On the other hand, for Scheme II and III, most core wavelengths concentrated in the ranges of 1800 nm to 2000 nm and 2300 nm to 2400 nm, while Scheme I selected many core wavelengths in the range of 650 nm to 750 nm. Furthermore, Scheme I showed that two-stage hybrid dimensionality reduction methods can more effectively highlight even distribution of wavelengths.
It is worth noting that, to facilitate the comparisons among different dimensionality reduction methods, the average level of performance of the six groups of experiments (i.e., the six rows in Table 2, Table A2 and Table A3) in a two-stage hybrid dimensionality reduction method was used as a representative measure of the overall performance. Those average performance metrics were used in the following comparisons. Moreover, the detailed results of six groups of experiments in the different two-stage methods are shown in Appendix A.
4.3. Comparing the Performance of Different Methods in Scheme I
The results obtained from Methods (1), (2), and (3) using different models are listed in Table 3, Table 4 and Table 5, respectively. In both Lasso and ANN, it is evident that all seven metrics in Method (2) and Method (3) were superior to those in Method (1), with low MAE, MBE close to zero, low MSE, low RAE, low RMAE, high R2, and low RMSE. In RF, except for the MBE of both Method (2) and Method (3), which were inferior to that of Method (1), the other metrics in Method (2) and Method (3) showed better performance. Therefore, a conclusion can be drawn that the performance of Method (2) and Method (3) was better than that of Method (1) in all three models.


Table 4.
Performance assessments of Method (2) using Lasso, ANN, and RF in Scheme I.

Table 5.
Performance assessments of Method (3) using Lasso, ANN, and RF in Scheme I.
With the conclusion that hybrid dimensionality reduction methods (Methods (2) and (3)) outperformed the single dimensionality reduction method (Method (1)) in different models, focus was shifted to identifying the best hybrid dimensionality reduction method between Method (2) and Method (3). By comparing the performance of Methods (2) and (3), it is clear that all metrics in Method (3) performed better than those in Method (2) in all three models. Moreover, by comparing seven metrics of the three models in Method (3), it is obvious that the ANN performed better than both Lasso and RF in all aspects except for MBE. Therefore, the above discussion indicated that Method (3) combined with an ANN achieved the best performance in Scheme I.
4.4. Comparing the Performance of Different Methods in Scheme II
The results of Method (1) using different models are listed in Table 6, and the results of Method (2) are listed in Table 7. Using Lasso, ANN, and RF, it is clear that the performance of the seven metrics in Method (2) was superior to that in Method (1) when using the same model, which indicated that Method (2) was superior to Method (1) in all three models.

Table 6.
Performance assessments of Method (1) using Lasso, ANN, and RF in Scheme II.

Table 7.
Performance assessments of Method (2) using Lasso, ANN, and RF in Scheme II.
The results of Method (3) using Lasso, ANN, and RF are listed in Table 8. From the seven metrics obtained in these three models, it is verified that all metrics in Method (3) were better than those in Method (1), indicating that Method (3) worked better than Method (1).

Table 8.
Performance assessments of Method (3) using Lasso, ANN, and RF in Scheme II.
From the above discussions, it revealed that the performance of both Method (2) and Method (3) was better than that of Method (1). That is to say, two-stage hybrid dimensionality reduction outperformed single dimension reduction in Scheme II. The next comparison focused on identifying which hybrid dimensionality reduction method achieved the best performance. When used models were consistent, MBE in Method (3) was slightly inferior to that in Method (2), while the other metrics in Method (3) outperformed those in Method (2), with low MAE, low MSE, low RAE, low RMAE, high R2, and low RMSE. Therefore, a conclusion can be drawn that the performance of Method (3) was superior to Method (2) in all three models. Consequently, Lasso, ANN, and RF in Method (3) can each achieve optimal predictive performance among all three methods, and Lasso in Method (3) demonstrated the best results in all seven metrics when compared with the other two models.
4.5. Comparing the Performance of Different Methods in Scheme III
The performance of Methods (1), (2), and (3) using different models is displayed in Table 9, Table 10 and Table 11, respectively. To assess the performance of single dimensionality reduction methods (Method (1)) and two-stage hybrid dimensionality reduction methods (Methods (2) and (3)), this study compared all three methods. It can be seen that both Method (2) and Method (3) performed better than Method (1), with low MAE, MBE close to zero, low MSE, low RAE, low RMAE, high R2, and low RMSE.

Table 9.
Performance assessments of Method (1) using Lasso, ANN, and RF in Scheme III.

Table 10.
Performance assessments of Method (2) using Lasso, ANN, and RF in Scheme III.

Table 11.
Performance assessments of Method (3) using Lasso, ANN, and RF in Scheme III.
To sum up, the performance of two-stage hybrid dimensionality reduction outperformed that of single dimensionality reduction. Next, a further comparison was carried out between the performances of different two-stage hybrid dimensionality reduction methods (Methods (2) and (3)). The comparison indicated that Method (3) outperformed Method (2) in terms of MAE, MSE, RAE, RMAE, R2, and RMSE in all three models. On the other hand, when comparing the performance of all three models in Method (3), it can be concluded that Lasso worked the best. It implied that in Scheme III, Method (3) combined with Lasso was with the best prediction performance.
4.6. Comparing the Performance of Scheme I, II, and III
In Scheme I, the dimensionality reduction method used in the first round was the Taylor-CC method, with its results displayed in Table 3, Table 4 and Table 5. In Scheme II, the dimensionality reduction method used in the first round was the NCC method, with its results displayed in Table 6, Table 7 and Table 8. In Scheme III, the dimensionality reduction method used in the first round was the PCC method, with its results displayed in Table 9, Table 10 and Table 11. The performance of the single dimensionality reduction method in these three schemes was compared based on the seven metrics calculated from each model. For all three models (Lasso, ANN, and RF), comparisons showed that the performance of the single dimensionality reduction method in Scheme I was superior to that in both Scheme II and Scheme III. Subsequently, the performance of two-stage hybrid dimensionality reduction methods in these three schemes was also compared. By comparing the performance of Method (2) in Scheme I with that in Scheme II and III, it is evident that Method (2) in Scheme I exhibited the best performance among those methods, except that its MEB was poorer in Lasso and RF. Similarly, Method (3) in different schemes can also reach the same conclusion. Therefore, Scheme I generally performed better than both Scheme II and III when using the same model and the same method (PCC/NCC) for the second round of dimensionality reduction. It can be concluded that, in the first round of dimensionality reduction, the core wavelengths obtained by the Taylor-CC method can well preserve the information of the original reflectance data.
4.7. Comparing the Performance of the Method (3) in Scheme I Under Different Models
In Scheme I, II, and III, based on the above discussions in Section 4.3, Section 4.4 and Section 4.5, it was apparent that the two-stage hybrid dimensionality reduction method, i.e., Method (3), performed the best in each scheme. Furthermore, it can be observed that the Taylor-CC + NCC method in Scheme I performed better than other dimensionality reduction methods in Schemes I, II, and III for the model of ANN, RF, and Lasso. Finally, attention was paid to evaluating the performance of the three models using the Taylor-CC + NCC method. By comparison, we can conclude that the ANN performed the best among the three models. Moreover, in different experiments using an ANN, selecting 94 core wavelengths in the first round of dimensionality reduction achieved the best performance.
4.8. Uncertainty Analysis of Input Variables
Based on the best-performing methods and models mentioned above, an uncertainty analysis was used to assess the potential impact of changes from the 70 identified core wavelengths on chlorophyll content prediction. Analysis results are presented in Figure 10. By comparing the results with 71 groups of different experiments, it can be observed that retaining the original core wavelengths are beneficial for the model to achieve higher precision prediction in chlorophyll content, with low RMSE, low MAE, high R2, low MSE, MBE close to zero, low RMAE, and low RAE. By comparing the results and sequentially eliminating each of 70 core wavelengths, it is evident that almost every core wavelength has an impact on the prediction of chlorophyll content after it was removed. Although the removal of a few core wavelengths significantly affects the prediction of chlorophyll content (e.g., #9, #32, #35, and #37 wavelength removal in Figure 10), most core wavelengths had a small impact after they were removed, which implied that the ANN is robust in predicting chlorophyll content.
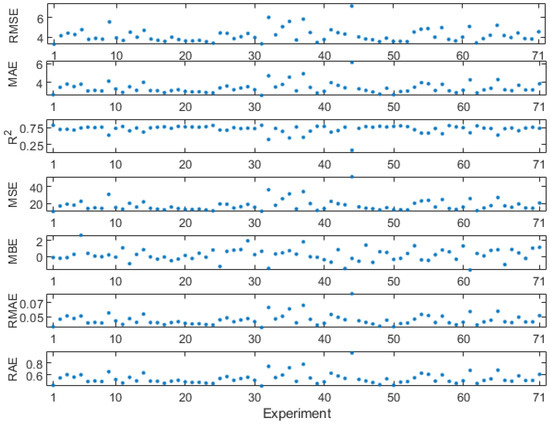
Figure 10.
Uncertainty analysis diagram, which consists of changes in seven metrics (RMSE, MAE, R2, MSE, MBE, RMAE, and RAE). X-axis represents 71 groups of experiments, where #1 indicates that no core wavelengths have been eliminated, while #2 to #71 correspond to the sequential elimination of each of the 70 core wavelengths. Their corresponding 70 core wavelengths are listed in Table A22.
In addition, based on the hyperspectral reflectance data used in this study, random forest importance was used to evaluate the importance of each wavelength (see Figure 11). It was observed that the wavelength region of [650 nm, 700 nm] exhibited relatively high importance. Considering the spectral characteristics of vegetation, the importance analysis was deemed reasonable, indicating that more attention should be paid to the wavelengths within this region in this study.
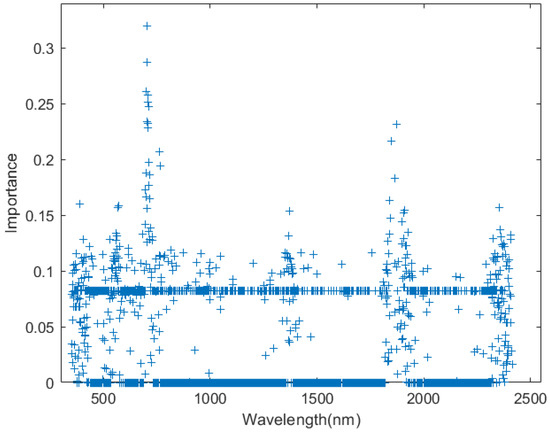
Figure 11.
Importance analysis diagram of 350 nm–2500 nm wavelength. A higher importance value indicates a greater influence of this wavelength on the model’s prediction accuracy.
5. Discussion
Hyperspectral imaging technology can capture the chemical and physiological state of vegetation across various spectral wavelengths, typically ranging from hundreds to thousands of wavelengths [39,40]. In this study, a two-stage hybrid dimensionality reduction method was innovatively used to select core wavelengths in hyperspectral reflectance data. Compared with empirical inference, machine learning models, and deep learning models, this method provided a clear mathematical foundation, making it easier for researchers to understand and explain its underlying principles. Moreover, unlike other studies that typically use a single dimensionality reduction method or arbitrarily combine different dimensionality reduction, this study focused on sequentially identifying core wavelengths through two-stage hybrid dimensionality reduction methods, thereby preserving the advantages of various approaches.
This study found that both two-stage hybrid dimensionality reduction methods outperformed single dimensionality reduction methods in all schemes. This demonstrated that using two-stage hybrid dimensionality reduction methods can provide improved insights into correlation analysis and capture important patterns in hyperspectral data, thereby enhancing the comprehensiveness and accuracy of feature selection processes.
Further analysis indicated that using the Taylor-CC method for core wavelengths selection achieved higher predictive accuracy for chlorophyll content in Camellia oleifera leaves. Compared with the PCC and NCC methods, the Taylor-CC method was developed based on the property of hyperspectral reflectance data resembling continuous functions. It approached the problem from a mathematical perspective, fully taking into full account the correlation between different wavelengths and representing it through specific numerical values. Furthermore, the spectral characteristics of vegetation showed that most chlorophyll a and chlorophyll b molecules absorb wavelengths between 645 nm and 670 nm, while some special types of chlorophyll absorb wavelengths longer than 700 nm [10]. Therefore, it is evident that the wavelength range of 645 nm to 700 nm is highly sensitive to the variations in chlorophyll. Compared with the PCC and NCC methods, the core wavelengths selected based on the Taylor-CC method were evidently more concentrated in this range (see Figure 11). This strongly indicated that the Taylor-CC method was more effective for analyzing the spectral characteristics of Camellia oleifera and for identifying core wavelengths relative to the spectral properties of vegetation.
Additionally, using the Taylor-CC method to predict chlorophyll content with an ANN achieved the best performance. An ANN can effectively handle high-dimensional data and complex nonlinear relationships [41]. Through multiple layers of neurons and nonlinear activation functions, an ANN can approximate many complex functions, making it suitable for most real-world problems.
When the final number of core wavelengths selected was 70, it can be shown that the Taylor-CC + NCC method combined with an ANN achieved the best performance on chlorophyll content prediction (see Table 12). To demonstrate the generalizability and applicability of the conclusions in this study, additional similar experiments were conducted to compare the performance of different dimensionality reduction methods by using 50 or 69 core wavelengths in the final selection. As expected, the same conclusions as the above 70 core wavelengths were also reached when the final number of selected core wavelengths was 50 or 69.

Table 12.
The best-performance of different dimensionality reduction methods with 70 core wavelengths under three machine learning models.
Although the research object of this study focused on a specific plant sample (Camellia oleifera), the adopted methods and models have significant universality for many applications with hyperspectral signal/data. In the analysis of hyperspectral reflectance data, both the PCC and Taylor-CC methods can be used to extract core wavelengths [24,42,43]. The NCC method was also applied to the selection of core remote sensing factors in similar ecological environments [44]. Moreover, the three machine learning models used in this study have been successfully applied to various prediction scenarios many times, demonstrating their wide applicability. In fact, many machine or non-machine learning models can use identified core wavelengths to study user-interested physical quantities in different applications (e.g., concentrations in chemical solutions), and they might achieve better performance than the three models used in this study. Future research will further validate the generalizability of these conclusions in predicting plant physiological states using remote sensing data, so as to expand their applicability.
6. Conclusions
In this study, a two-stage hybrid dimensionality reduction method was innovatively used to identify core wavelengths by analyzing the correlations among wavelengths and SPAD measurements. By using hyperspectral reflectance data and SPAD measurements from 240 Camellia oleifera samples, different dimensionality reduction methods/schemes were proposed and compared. Combined with the methods/schemes, three different machine learning models were used to predict chlorophyll content, and it led to the following four conclusions.
- (1)
- In Schemes I, II, and III, the performance of the two-stage hybrid dimensionality reduction methods was superior to that of the single dimensionality reduction method. This showed that the two-stage approach made better use of the advantages of different dimensionality reduction methods, thereby effectively improving the overall reduction effect and obtaining a more comprehensive feature representation.
- (2)
- Compared with the PCC and NCC methods, the core wavelengths identified by the dimensionality reduction method based on Taylor-CC were more concentrated in the range associated with chlorophyll variation, while still preserving a significant amount of the original information from the wavelengths.
- (3)
- The Taylor-CC + NCC method performed the best among different two-stage hybrid dimensionality reduction methods in different schemes. Meanwhile, in the Taylor-CC + NCC method, using 94 core wavelengths selected in the first round of dimensionality reduction, the ANN exhibited superior predictive performance against the other two models (MAE = 2.6583, MBE = 0.1371, MSE = 10.6127, RAE = 0.4221, RMAE = 0.0358, R2 = 0.8210, RMSE = 3.2517).
- (4)
- In the original Taylor-CC study from [24], which utilized hyperspectral analysis techniques to predict chlorophyll content in Camellia oleifera, using only the Taylor-CC method for identifying core wavelengths overlooked the relationship between wavelengths and target variables. This study addressed this deficiency and made improvements based on the Taylor-CC method.
The main imperfections of this study are the limited geographic scope, the short time scale, and the constraints on sample size and spatial coverage in the Camellia oleifera survey data. All these factors together could hinder the applicability and extensibility of the proposed method. In particular, the study area has more uniform vegetation types and environmental conditions, which could enhance the accuracy of the prediction model within this region. However, as the size of the region increases, the diversity of vegetation types and environmental conditions also grows, potentially diminishing the model’s applicability in various sub-regions unless more environmental factors can be introduced in models. Additionally, the data is limited to a single growth cycle of Camellia oleifera, and the model’s applicability will need to be re-verified and adjusted when applied to different ecological environments and climatic conditions. Nevertheless, the proposed methods in this study should have the potential to be applied into other research related to hyperspectral retrieval modeling, whose mathematical description is to find an inverse function of reflectance vector to predict/recover a physical quantity d based on the undiscovered relationship of . Here ’s redundant information should be excluded as much as possible to achieve the best prediction, and d could represent different quantities in different fields, e.g., pollution concentration in lakes, water vapor levels in the atmosphere, and protein content in meat.
Meanwhile, this study also achieved the following innovations and improvements:
- (1)
- In feature selection, a method based on a classical mathematical formula (Taylor expansion) was used for correlation analysis. Compared with empirical inference and machine learning models, this method provided a clear theoretical foundation in Mathematics, making it easier for researchers to understand and explain its underlying principles.
- (2)
- This study focused on sequentially identifying core wavelengths using two-stage hybrid dimensionality reduction methods rather than combining them arbitrarily.
- (3)
- This study enhanced and extended the latest Taylor-CC method for hyperspectral analysis in studying the chlorophyll content of Camellia oleifera.
Furthermore, there are still many challenges in selecting suitable wavelengths and models for chlorophyll content prediction when using hyperspectral analysis techniques. Based on the findings of this study, we expect to further explore hyperspectral analysis techniques for predicting the chlorophyll content of Camellia oleifera in future research. Some potential ideas are presented below:
- (1)
- Future research directions may focus on exploring integration methods for multi-source remote sensing data in complex natural environments (i.e., forests, urban areas, and mountainous regions) to overcome different challenges faced by existing hyperspectral reflectance data, providing comprehensive spectral/temporal/spatial information.
- (2)
- Subsequent research may focus on predicting chlorophyll content in vegetation by integrating the nutrient elements of vegetation (e.g., nitrogen, phosphorus, and potassium) and the properties of soil to explore their effects in chlorophyll modeling.
- (3)
- Based on the findings of this study, future research may continue to explore the environmental factors that affect the growth of Camellia oleifera. Specifically, we plan to collect long-term growth data of this plant under different growing conditions, which aims to construct a comprehensive model by combining spectral measurements, environmental factors, climate factors, and growth variables of Camellia oleifera.
Author Contributions
Conceptualization, Z.S.; Formal analysis, X.J. and Z.S.; Funding acquisition, Z.S., X.J. and X.T.; Investigation, X.T. and F.K.; Methodology, Z.S. and X.J.; Project administration, Z.S.; Resources, X.T. and F.K.; Software, X.J.; Supervision, Z.S. and Y.S.; Validation, X.J.; Visualization, X.J. and F.K.; Writing—original draft, X.J. and Z.S.; Writing—review and editing, Z.S., Y.S. and X.T. All authors have read and agreed to the published version of the manuscript.
Funding
This research was funded by the Nanjing Normal University (Grant No. 184080H202B371), Postgraduate Research and Practice Innovation Program of Jiangsu Province (Grant No. 181200003024158), and the National Natural Science Foundation of China (Grant No. 32171783).
Data Availability Statement
The data that support the findings of this study are available upon reasonable request from the authors.
Acknowledgments
The authors are thankful to Genshen Fu, Lipeng Yan, and Weijing Song for surveying and data processing in this study. The authors would like to thank the anonymous reviewers for their valuable comments to this article.
Conflicts of Interest
The authors declare no conflicts of interest.
Appendix A

Table A1.
Performance of 14 hidden layer structures based on the Taylor-CC + NCC method. (94 core wavelengths are selected in the first round of dimensionality reduction.). The best performing metric is highlighted in bold. It is the same in Table A1, Table A4, Table A5, Table A6, Table A7, Table A8, Table A9, Table A10, Table A11, Table A12, Table A13, Table A14, Table A15, Table A16, Table A17, Table A18, Table A19, Table A20 and Table A21.
| MAE | MBE | MSE | RAE | RMAE | R2 | RMSE | |
|---|---|---|---|---|---|---|---|
| [15] | 3.7708 | −0.2526 | 19.9566 | 0.5988 | 0.0507 | 0.6874 | 4.4673 |
| [13,2] | 2.6583 | −0.1371 | 10.6127 | 0.4221 | 0.0358 | 0.8210 | 3.2577 |
| [12,3] | 3.2246 | 0.3208 | 15.2419 | 0.5210 | 0.0434 | 0.7424 | 3.9041 |
| [11,4] | 3.6778 | 0.9790 | 21.8276 | 0.5840 | 0.0495 | 0.6794 | 4.6720 |
| [10,5] | 3.6527 | −1.4034 | 20.2538 | 0.5800 | 0.0492 | 0.6792 | 4.5004 |
| [9,6] | 2.9543 | −0.3106 | 12.1366 | 0.4691 | 0.0398 | 0.8105 | 3.4838 |
| [8,7] | 3.1627 | 0.8284 | 16.7866 | 0.5022 | 0.0426 | 0.7178 | 4.0972 |
| [7,6,2] | 3.4661 | −1.7263 | 17.1493 | 0.5504 | 0.0466 | 0.7607 | 4.1412 |
| [6,5,4] | 3.4521 | −0.9052 | 17.0028 | 0.5482 | 0.0465 | 0.7246 | 4.1234 |
| [7,5,3] | 3.3024 | 0.7774 | 17.6491 | 0.5244 | 0.0444 | 0.7201 | 4.2011 |
| [8,5,2] | 3.0139 | −0.1584 | 14.2534 | 0.4786 | 0.0406 | 0.7458 | 3.7754 |
| [8,4,3] | 3.0821 | −0.4558 | 16.0011 | 0.4894 | 0.0415 | 0.7177 | 4.0001 |
| [9,4,2] | 3.0596 | −0.1076 | 13.1356 | 0.4858 | 0.0412 | 0.7680 | 3.6243 |
| [10,3,2] | 3.5769 | −1.0661 | 19.6833 | 0.5680 | 0.0481 | 0.6681 | 4.4366 |
| [14,1] | 2.8233 | 0.4945 | 12.4522 | 0.4483 | 0.0380 | 0.7824 | 3.5288 |

Table A2.
Thresholds of different methods in Scheme II.
Table A2.
Thresholds of different methods in Scheme II.
| Method (1) | Method (2) | Method (3) | |||
|---|---|---|---|---|---|
| NCC | Threshold | NCC + PCC | Threshold | NCC + NCC | Threshold |
| 70 | 0.3960 | 90 + 70 | 0.4258 + 0.0595 | 90 + 70 | 0.4258 + 0.2730 |
| / | / | 94 + 70 | 0.4300 + 0.0620 | 94 + 70 | 0.4300 + 0.2725 |
| / | / | 97 + 70 | 0.4400 + 0.0660 | 97 + 70 | 0.4400 + 0.2755 |
| / | / | 122 + 70 | 0.4710 + 0.0850 | 122 + 70 | 0.4710 + 0.2812 |
| / | / | 123 + 70 | 0.4720 + 0.0850 | 123 + 70 | 0.4720 + 0.2815 |
| / | / | 125 + 70 | 0.4730 + 0.0870 | 125 + 70 | 0.4730 + 0.2817 |

Table A3.
Thresholds of different methods in Scheme III.
Table A3.
Thresholds of different methods in Scheme III.
| Method (1) | Method (2) | Method (3) | |||
|---|---|---|---|---|---|
| PCC | Threshold | PCC + PCC | Threshold | PCC + NCC | Threshold |
| 70 | 0.94608 | 90 + 70 | 0.96485 + 0.0425 | 90 + 70 | 0.96485 + 0.074 |
| / | / | 94 + 70 | 0.9675 + 0.0472 | 94 + 70 | 0.9675 + 0.077 |
| / | / | 97 + 70 | 0.9687 + 0.052 | 97 + 70 | 0.9687 + 0.077 |
| / | / | 122 + 70 | 0.979 + 0.08308 | 122 + 70 | 0.979 + 0.0835 |
| / | / | 123 + 70 | 0.9791 + 0.0831 | 123 + 70 | 0.9791 + 0.0843 |
| / | / | 125 + 70 | 0.9793 + 0.087 | 125 + 70 | 0.9793 + 0.0841 |

Table A4.
Performance assessments of Method (2) using ANN in Scheme I.
Table A4.
Performance assessments of Method (2) using ANN in Scheme I.
| 90 | 94 | 97 | 122 | 123 | 125 | |
|---|---|---|---|---|---|---|
| MAE | 2.8304 | 2.9575 | 2.8861 | 3.0331 | 3.0585 | 2.9941 |
| MBE | 0.4859 | 0.0946 | 0.0633 | 0.7990 | 0.6612 | 0.1360 |
| MSE | 12.0694 | 12.7972 | 12.8480 | 14.6065 | 14.0664 | 13.6245 |
| RAE | 0.4494 | 0.4696 | 0.4583 | 0.4816 | 0.4857 | 0.4754 |
| RMAE | 0.0381 | 0.0398 | 0.0388 | 0.0408 | 0.0412 | 0.0403 |
| R2 | 0.7884 | 0.7720 | 0.7735 | 0.7500 | 0.7586 | 0.7568 |
| RMSE | 3.4741 | 3.5773 | 3.5844 | 3.8218 | 3.7505 | 3.6911 |

Table A5.
Performance assessments of Method (3) using ANN in Scheme I.
Table A5.
Performance assessments of Method (3) using ANN in Scheme I.
| 90 | 94 | 97 | 122 | 123 | 125 | |
|---|---|---|---|---|---|---|
| MAE | 2.7411 | 2.6583 | 2.8749 | 2.9786 | 2.8934 | 2.9842 |
| MBE | 0.1464 | −0.1371 | 0.5895 | 0.9668 | 0.6379 | −0.1286 |
| MSE | 12.1395 | 10.6127 | 12.2958 | 16.5260 | 13.8749 | 13.3374 |
| RAE | 0.4353 | 0.4221 | 0.4565 | 0.4730 | 0.4594 | 0.4739 |
| RMAE | 0.0369 | 0.0358 | 0.0387 | 0.0401 | 0.0389 | 0.0402 |
| R2 | 0.7837 | 0.8210 | 0.7869 | 0.7212 | 0.7668 | 0.7693 |
| RMSE | 3.4842 | 3.2577 | 3.5065 | 4.0652 | 3.7249 | 3.6520 |

Table A6.
Performance assessments of Method (2) using RF in Scheme I.
Table A6.
Performance assessments of Method (2) using RF in Scheme I.
| 90 | 94 | 97 | 122 | 123 | 125 | |
|---|---|---|---|---|---|---|
| MAE | 4.5043 | 4.6132 | 4.5684 | 4.6757 | 4.7602 | 4.7558 |
| MBE | 0.2622 | 0.4540 | 6.4140 | 0.5535 | 0.5488 | 0.3747 |
| MSE | 29.0830 | 30.3222 | 29.5027 | 31.2288 | 31.6060 | 31.4554 |
| RAE | 0.7388 | 0.7566 | 0.7493 | 0.7669 | 0.7807 | 0.7800 |
| RMAE | 0.0605 | 0.0620 | 0.0614 | 0.0628 | 0.0640 | 0.0639 |
| R2 | 0.5393 | 0.4765 | 0.5408 | 0.4713 | 0.4761 | 0.4644 |
| RMSE | 5.3929 | 5.5066 | 5.4316 | 5.5883 | 5.6219 | 5.6085 |

Table A7.
Performance assessments of Method (3) using RF in Scheme I.
Table A7.
Performance assessments of Method (3) using RF in Scheme I.
| 90 | 94 | 97 | 122 | 123 | 125 | |
|---|---|---|---|---|---|---|
| MAE | 4.4853 | 4.5775 | 4.5452 | 4.6084 | 4.6075 | 4.6600 |
| MBE | 0.2644 | 0.2582 | 0.3658 | 0.4246 | 0.4151 | 0.4043 |
| MSE | 27.9287 | 29.5275 | 28.7763 | 30.2533 | 30.1835 | 30.5749 |
| RAE | 0.7356 | 0.7508 | 0.7455 | 0.7558 | 0.7557 | 0.7643 |
| RMAE | 0.0603 | 0.0615 | 0.0611 | 0.0619 | 0.0619 | 0.0626 |
| R2 | 0.5491 | 0.5044 | 0.5090 | 0.4835 | 0.4680 | 0.4680 |
| RMSE | 5.2848 | 5.4339 | 5.3644 | 5.5003 | 5.4939 | 5.5295 |

Table A8.
Performance assessments of Method (2) using Lasso in Scheme I.
Table A8.
Performance assessments of Method (2) using Lasso in Scheme I.
| 90 | 94 | 97 | 122 | 123 | 125 | |
|---|---|---|---|---|---|---|
| MAE | 4.1370 | 4.1572 | 4.1231 | 4.0452 | 3.9607 | 3.8469 |
| MBE | 0.0947 | 0.1566 | 0.0852 | 0.3300 | 0.3386 | 0.0702 |
| MSE | 23.7400 | 23.7950 | 23.1769 | 23.1418 | 22.3023 | 20.9090 |
| RAE | 0.6785 | 0.6818 | 0.6762 | 0.6635 | 0.6496 | 0.6309 |
| RMAE | 0.0556 | 0.0559 | 0.0554 | 0.0554 | 0.0532 | 0.0517 |
| R2 | 0.6466 | 0.6479 | 0.6617 | 0.6156 | 0.6272 | 0.6357 |
| RMSE | 4.8724 | 4.8780 | 4.8142 | 4.8106 | 4.7225 | 4.5726 |

Table A9.
Performance assessments of Method (3) using Lasso in Scheme I.
Table A9.
Performance assessments of Method (3) using Lasso in Scheme I.
| 90 | 94 | 97 | 122 | 123 | 125 | |
|---|---|---|---|---|---|---|
| MAE | 3.4974 | 3.5622 | 3.7377 | 4.0243 | 3.7576 | 3.6432 |
| MBE | −0.2291 | −0.1748 | 0.0598 | 0.2129 | 0.1176 | 0.0410 |
| MSE | 17.4854 | 17.3740 | 19.0103 | 21.9084 | 19.5814 | 19.1927 |
| RAE | 0.5736 | 0.5842 | 0.6130 | 0.6600 | 0.6163 | 0.5975 |
| RMAE | 0.0470 | 0.0479 | 0.0502 | 0.0541 | 0.0505 | 0.0490 |
| R2 | 0.6787 | 0.6773 | 0.6403 | 0.5872 | 0.6308 | 0.6378 |
| RMSE | 4.1816 | 4.1682 | 4.3601 | 4.6806 | 4.4251 | 4.3810 |

Table A10.
Performance assessments of Method (2) using ANN in Scheme II.
Table A10.
Performance assessments of Method (2) using ANN in Scheme II.
| 90 | 94 | 97 | 122 | 123 | 125 | |
|---|---|---|---|---|---|---|
| MAE | 6.5007 | 6.3981 | 5.7167 | 6.1842 | 5.7642 | 6.2352 |
| MBE | −2.4224 | 0.3667 | 1.2222 | 0.1568 | −0.9968 | −1.2088 |
| MSE | 60.1897 | 56.2463 | 54.5279 | 54.3345 | 48.0286 | 58.3583 |
| RAE | 1.0323 | 1.0160 | 0.9078 | 0.9820 | 0.9153 | 0.9901 |
| RMAE | 0.0875 | 0.0861 | 0.0769 | 0.0832 | 0.0776 | 0.0839 |
| R2 | 0.0907 | 0.0095 | 0.2051 | 0.0386 | 0.1584 | 0.0137 |
| RMSE | 7.7582 | 7.4998 | 7.3843 | 7.3712 | 6.9303 | 7.6393 |

Table A11.
Performance assessments of Method (3) using ANN in Scheme II.
Table A11.
Performance assessments of Method (3) using ANN in Scheme II.
| 90 | 94 | 97 | 122 | 123 | 125 | |
|---|---|---|---|---|---|---|
| MAE | 6.2490 | 5.3059 | 4.9227 | 4.7905 | 5.3558 | 5.4055 |
| MBE | 0.1389 | −2.1216 | 0.7123 | −2.2126 | −0.9207 | −2.1351 |
| MSE | 55.7386 | 41.4520 | 33.7940 | 39.1563 | 36.9707 | 41.7702 |
| RAE | 0.9923 | 0.8425 | 0.7817 | 0.7607 | 0.8505 | 0.8583 |
| RMAE | 0.0841 | 0.0714 | 0.0663 | 0.0645 | 0.0721 | 0.0727 |
| R2 | 0.0197 | 0.3761 | 0.4097 | 0.3887 | 0.3742 | 0.3408 |
| RMSE | 7.4658 | 6.4383 | 5.8133 | 6.2575 | 6.0804 | 6.4630 |

Table A12.
Performance assessments of Method (2) using RF in Scheme II.
Table A12.
Performance assessments of Method (2) using RF in Scheme II.
| 90 | 94 | 97 | 122 | 123 | 125 | |
|---|---|---|---|---|---|---|
| MAE | 5.8091 | 5.6850 | 5.6266 | 5.6106 | 5.7176 | 5.6085 |
| MBE | 0.6431 | 0.6438 | 0.6545 | 0.5101 | 0.6029 | 0.6378 |
| MSE | 48.9689 | 46.6168 | 45.7112 | 45.7996 | 47.5164 | 45.6624 |
| RAE | 0.9528 | 0.9324 | 0.9228 | 0.9202 | 0.9378 | 0.9199 |
| RMAE | 0.0781 | 0.0764 | 0.0756 | 0.0754 | 0.0768 | 0.0754 |
| R2 | 0.0782 | 0.1285 | 0.1513 | 0.1501 | 0.1098 | 0.1545 |
| RMSE | 6.9978 | 6.8277 | 6.7610 | 6.7675 | 6.8932 | 6.7574 |

Table A13.
Performance assessments of Method (3) using RF in Scheme II.
Table A13.
Performance assessments of Method (3) using RF in Scheme II.
| 90 | 94 | 97 | 122 | 123 | 125 | |
|---|---|---|---|---|---|---|
| MAE | 5.7611 | 5.6769 | 5.5507 | 5.5807 | 5.6096 | 5.5703 |
| MBE | 0.6890 | 0.5685 | 0.6500 | 0.7177 | 0.7729 | 0.7399 |
| MSE | 48.2218 | 48.5792 | 44.7551 | 45.7633 | 46.3984 | 45.2280 |
| RAE | 0.9449 | 0.9311 | 0.9104 | 0.9153 | 0.9201 | 0.9136 |
| RMAE | 0.0774 | 0.0763 | 0.0746 | 0.0750 | 0.0754 | 0.0749 |
| R2 | 0.0936 | 0.0854 | 0.1849 | 0.1544 | 0.1430 | 0.1703 |
| RMSE | 6.9442 | 6.9699 | 6.6899 | 6.7649 | 6.8116 | 6.7252 |

Table A14.
Performance assessments of Method (2) using Lasso in Scheme II.
Table A14.
Performance assessments of Method (2) using Lasso in Scheme II.
| 90 | 94 | 97 | 122 | 123 | 125 | |
|---|---|---|---|---|---|---|
| MAE | 5.5635 | 4.6024 | 4.5371 | 5.4963 | 5.6427 | 5.4473 |
| MBE | 0.5004 | −0.1300 | −0.1041 | 0.0767 | 0.3120 | 0.1021 |
| MSE | 44.0369 | 30.1984 | 28.8545 | 45.5965 | 47.5823 | 44.7454 |
| RAE | 0.9125 | 0.7549 | 0.7441 | 0.9015 | 0.9255 | 0.8934 |
| RMAE | 0.0748 | 0.0619 | 0.0610 | 0.0739 | 0.0758 | 0.0732 |
| R2 | 0.2106 | 0.4647 | 0.5017 | 0.1355 | 0.0992 | 0.1508 |
| RMSE | 6.6360 | 5.4953 | 5.3716 | 6.7525 | 6.8980 | 6.6892 |

Table A15.
Performance assessments of Method (3) using Lasso in Scheme II.
Table A15.
Performance assessments of Method (3) using Lasso in Scheme II.
| 90 | 94 | 97 | 122 | 123 | 125 | |
|---|---|---|---|---|---|---|
| MAE | 5.2652 | 4.5062 | 4.4865 | 4.5264 | 4.4594 | 4.4920 |
| MBE | −0.3712 | −0.0407 | 0.0162 | −0.1798 | −0.2095 | −0.1651 |
| MSE | 44.2580 | 29.6771 | 28.3256 | 27.6141 | 26.9206 | 27.5556 |
| RAE | 0.8636 | 0.7391 | 0.7358 | 0.7424 | 0.7314 | 0.7367 |
| RMAE | 0.0708 | 0.0606 | 0.0603 | 0.0608 | 0.0599 | 0.0604 |
| R2 | 0.2522 | 0.4938 | 0.5363 | 0.5690 | 0.5815 | 0.5601 |
| RMSE | 6.6527 | 5.4477 | 5.3222 | 5.2549 | 5.1885 | 5.2493 |

Table A16.
Performance assessments of Method (2) using ANN in Scheme III.
Table A16.
Performance assessments of Method (2) using ANN in Scheme III.
| 90 | 94 | 97 | 122 | 123 | 125 | |
|---|---|---|---|---|---|---|
| MAE | 6.2994 | 5.2302 | 6.0595 | 6.1559 | 6.1398 | 6.6527 |
| MBE | −0.1112 | 0.4508 | −2.1549 | −1.1404 | 0.1502 | 0.2486 |
| MSE | 55.1701 | 40.0847 | 49.7168 | 55.5155 | 53.7158 | 60.4465 |
| RAE | 1.0003 | 0.8305 | 1.0845 | 0.9775 | 0.9749 | 1.0564 |
| RMAE | 0.0848 | 0.0704 | 0.0837 | 0.0828 | 0.0826 | 0.0895 |
| R2 | 0.0212 | 0.3524 | 0.1883 | 0.0490 | 0.0396 | 0.0176 |
| RMSE | 7.4277 | 6.3312 | 7.0510 | 7.4509 | 7.3291 | 7.7747 |

Table A17.
Performance assessments of Method (3) using ANN in Scheme III.
Table A17.
Performance assessments of Method (3) using ANN in Scheme III.
| 90 | 94 | 97 | 122 | 123 | 125 | |
|---|---|---|---|---|---|---|
| MAE | 5.0361 | 4.3926 | 5.2298 | 4.9333 | 4.4255 | 6.2637 |
| MBE | −0.2201 | −0.3118 | −2.7404 | 3.0589 | 0.8591 | 1.3165 |
| MSE | 36.4218 | 28.5701 | 40.8884 | 39.8640 | 30.9662 | 53.8179 |
| RAE | 0.7997 | 0.6975 | 0.9360 | 0.7834 | 0.7027 | 0.9946 |
| RMAE | 0.0678 | 0.0591 | 0.0722 | 0.0664 | 0.0596 | 0.0843 |
| R2 | 0.3890 | 0.5228 | 0.3711 | 0.4563 | 0.4615 | 0.2986 |
| RMSE | 6.0350 | 5.3451 | 6.3944 | 6.3138 | 5.5647 | 7.3361 |

Table A18.
Performance assessments of Method (2) using RF in Scheme III.
Table A18.
Performance assessments of Method (2) using RF in Scheme III.
| 90 | 94 | 97 | 122 | 123 | 125 | |
|---|---|---|---|---|---|---|
| MAE | 5.7536 | 5.7735 | 5.8097 | 5.3915 | 5.4676 | 5.7674 |
| MBE | 0.7434 | 0.9106 | 0.7177 | 0.5475 | 0.6068 | 0.8337 |
| MSE | 47.7782 | 47.9977 | 49.3269 | 42.4011 | 44.3290 | 49.2858 |
| RAE | 0.9437 | 0.9469 | 0.9529 | 0.8843 | 0.8968 | 0.9459 |
| RMAE | 0.0773 | 0.0776 | 0.0781 | 0.0725 | 0.0735 | 0.0775 |
| R2 | 0.1139 | 0.1123 | 0.0736 | 0.2239 | 0.1876 | 0.0781 |
| RMSE | 6.9122 | 6.9280 | 7.0233 | 6.5116 | 6.6580 | 7.0204 |

Table A19.
Performance assessments of Method (3) using RF in Scheme III.
Table A19.
Performance assessments of Method (3) using RF in Scheme III.
| 90 | 94 | 97 | 122 | 123 | 125 | |
|---|---|---|---|---|---|---|
| MAE | 5.7275 | 5.7637 | 5.7773 | 5.3846 | 5.4090 | 5.6304 |
| MBE | 0.6181 | 0.6133 | 0.6858 | 0.5928 | 0.4608 | 0.6073 |
| MSE | 47.9028 | 48.4530 | 48.2440 | 41.9772 | 42.3528 | 45.1113 |
| RAE | 0.9394 | 0.9453 | 0.9476 | 0.8831 | 0.8871 | 0.9235 |
| RMAE | 0.0770 | 0.0775 | 0.0777 | 0.0724 | 0.0727 | 0.0757 |
| R2 | 0.1010 | 0.0917 | 0.0963 | 0.2287 | 0.2391 | 0.1713 |
| RMSE | 6.9212 | 6.9608 | 6.9458 | 6.4790 | 6.5079 | 6.7165 |

Table A20.
Performance assessments of Method (2) using Lasso in Scheme III.
Table A20.
Performance assessments of Method (2) using Lasso in Scheme III.
| 90 | 94 | 97 | 122 | 123 | 125 | |
|---|---|---|---|---|---|---|
| MAE | 4.7103 | 4.6984 | 4.7834 | 5.1858 | 5.3948 | 4.7562 |
| MBE | −0.0416 | −0.0791 | 0.1825 | −0.1542 | −0.0218 | −0.0998 |
| MSE | 31.1865 | 30.7809 | 31.8769 | 39.6046 | 43.5253 | 32.5621 |
| RAE | 0.7725 | 0.7706 | 0.7845 | 0.8505 | 0.8848 | 0.7801 |
| RMAE | 0.0633 | 0.0632 | 0.0643 | 0.0697 | 0.0725 | 0.0639 |
| R2 | 0.4491 | 0.4485 | 0.4697 | 0.2527 | 0.1981 | 0.4262 |
| RMSE | 5.5845 | 5.5481 | 5.6460 | 6.2932 | 6.5974 | 5.7063 |

Table A21.
Performance assessments of Method (3) using Lasso in Scheme III.
Table A21.
Performance assessments of Method (3) using Lasso in Scheme III.
| 90 | 94 | 97 | 122 | 123 | 125 | |
|---|---|---|---|---|---|---|
| MAE | 4.6009 | 4.5179 | 4.6147 | 4.6292 | 4.7545 | 4.1585 |
| MBE | −0.1027 | −0.1101 | −0.0105 | −0.1860 | −0.0864 | −0.6701 |
| MSE | 31.1756 | 29.9233 | 29.9498 | 32.8672 | 34.4832 | 25.9009 |
| RAE | 0.7546 | 0.7410 | 0.7569 | 0.7593 | 0.7798 | 0.6820 |
| RMAE | 0.0618 | 0.0607 | 0.0620 | 0.0622 | 0.0639 | 0.0551 |
| R2 | 0.4774 | 0.5093 | 0.5157 | 0.3820 | 0.3479 | 0.5179 |
| RMSE | 5.5835 | 5.4702 | 5.4726 | 5.7330 | 5.8722 | 5.0893 |

Table A22.
70 Identified core wavelengths from the Taylor-CC + NCC Method when 94 Core Wavelengths are Selected in the First Round (Unit: nm).
Table A22.
70 Identified core wavelengths from the Taylor-CC + NCC Method when 94 Core Wavelengths are Selected in the First Round (Unit: nm).
| 450 | 501 | 543 | 594 | 650 | 684 | 695 | 702 | 708 | 714 |
| 720 | 726 | 733 | 741 | 753 | 766 | 832 | 869 | 904 | 966 |
| 988 | 1000 | 1020 | 1050 | 1078 | 1105 | 1128 | 1150 | 1177 | 1212 |
| 1251 | 1287 | 1316 | 1338 | 1355 | 1365 | 1371 | 1377 | 1384 | 1441 |
| 1596 | 1634 | 1671 | 1737 | 1765 | 1787 | 1803 | 1816 | 1836 | 1872 |
| 1900 | 1907 | 1930 | 1946 | 2030 | 2103 | 2131 | 2156 | 2180 | 2261 |
| 2279 | 2294 | 2308 | 2321 | 2333 | 2345 | 2355 | 2365 | 2374 | 2390 |
Appendix B
The specific definitions of and are shown in Equations (A1) and (A2),
where is the size of the dataset, is the number of sample pairs distributed in the ij-th grid, and is the number of sample pairs distributed in the i-th grid.
The definition of the Pearson correlation coefficient for two random variables and is shown in Equation (A3),
where and represent the i-th observed values of two random variables, respectively. and denote the mean of these two random variables.
Appendix C
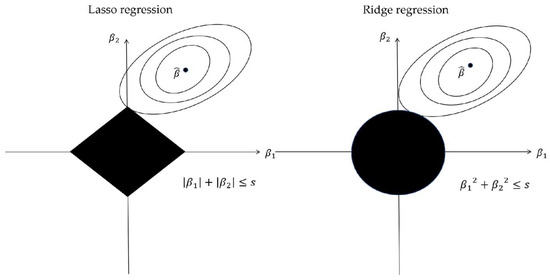
Figure A1.
Lasso regression and ridge regression examples in two-dimensional space. On the left is the Lasso regression diagram, and on the right is the ridge regression diagram. The elliptical region represents the function value of objective function, and the black region indicates constraints.
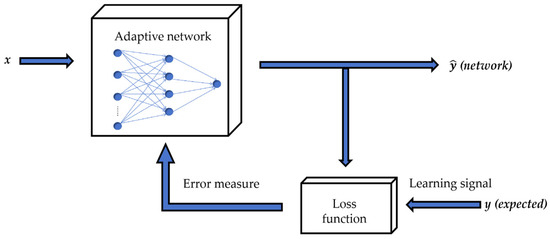
Figure A2.
Example of an ANN. The adaptive network includes an input layer, a hidden layer, and an output layer, which are connected by weights.
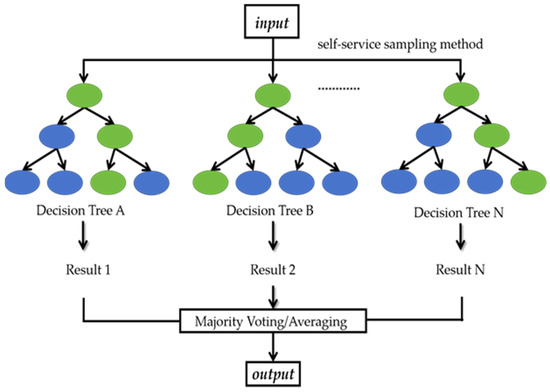
Figure A3.
Flow chart of random forest, which includes self-service sampling method, decision trees whose features are split at each node, and integrator.
References
- Sekar, N.; Ramasamy, R.P. Photosynthetic energy conversion: Recent advances and future perspective. Electrochem. Soc. Interface 2015, 24, 67. [Google Scholar] [CrossRef]
- Kume, A.; Akitsu, T.; Nasahara, K.N. Why is chlorophyll b only used in light-harvesting systems? J. Plant Res. 2018, 131, 961–972. [Google Scholar] [CrossRef] [PubMed]
- Croft, H.; Chen, J.M.; Luo, X.; Bartlett, P.; Chen, B.; Staebler, R.M. Leaf chlorophyll content as a proxy for leaf photosynthetic capacity. Glob. Chang. Biol. 2017, 23, 3513–3524. [Google Scholar] [CrossRef] [PubMed]
- Wang, S.; Li, Y.; Ju, W.; Chen, B.; Chen, J.; Croft, H.; Mickler, R.A.; Yang, F. Estimation of leaf photosynthetic capacity from leaf chlorophyll content and leaf age in a subtropical evergreen coniferous plantation. J. Geophys. Res. Biogeosci. 2020, 125, e2019JG005020. [Google Scholar] [CrossRef]
- Henson, S.A.; Sarmiento, J.L.; Dunne, J.P.; Bopp, L.; Lima, I.; Doney, S.C.; John, J.; Beaulieu, C. Detection of anthropogenic climate change in satellite records of ocean chlorophyll and productivity. Biogeosciences 2010, 7, 621–640. [Google Scholar] [CrossRef]
- Hodges, B.A.; Rudnick, D.L. Horizontal variability in chlorophyll fluorescence and potential temperature. Deep Sea Res. Part I Oceanogr. Res. Pap. 2006, 53, 1460–1482. [Google Scholar] [CrossRef]
- Pérez-Bueno, M.L.; Pineda, M.; Barón, M. Phenotyping plant responses to biotic stress by chlorophyll fluorescence imaging. Front. Plant Sci. 2019, 10, 1135. [Google Scholar] [CrossRef]
- Ritchie, R.J.; Sma-Air, S. Lability of chlorophylls in solvent. J. Appl. Phycol. 2022, 34, 1577–1586. [Google Scholar] [CrossRef]
- Milenković, S.M.; Zvezdanović, J.B.; Anđelković, T.D.; Marković, D.Z. The identification of chlorophyll and its derivatives in the pigment mixtures: HPLC-chromatography, visible and mass spectroscopy studies. Adv. Technol. 2012, 1, 16–24. [Google Scholar]
- Yue, X.; Quan, D.; Hong, T.; Wang, J.; Qu, X.; Gan, H. Non-destructive hyperspectral measurement model of chlorophyll content for citrus leaves. Trans. Chin. Soc. Agric. Eng. 2015, 31, 294–302. [Google Scholar]
- Li, D.; Hu, Q.; Ruan, S.; Liu, J.; Zhang, J.; Hu, C.; Liu, Y.; Dian, Y.; Zhou, J. Utilizing Hyperspectral Reflectance and Machine Learning Algorithms for Non-Destructive Estimation of Chlorophyll Content in Citrus Leaves. Remote Sens. 2023, 15, 4934. [Google Scholar] [CrossRef]
- Schmid, V.H.; Thomé, P.; Rühle, W.; Paulsen, H.; Kühlbrandt, W.; Rogl, H. Chlorophyll b is involved in long-wavelength spectral properties of light-harvesting complexes LHC I and LHC II. FEBS Lett. 2001, 499, 27–31. [Google Scholar] [CrossRef] [PubMed]
- Falcioni, R.; Antunes, W.C.; Oliveira, R.B.D.; Chicati, M.L.; Demattê, J.A.M.; Nanni, M.R. Assessment of Combined Reflectance, Transmittance, and Absorbance Hyperspectral Sensors for Prediction of Chlorophyll a Fluorescence Parameters. Remote Sens. 2023, 15, 5067. [Google Scholar] [CrossRef]
- Martel, E.; Lazcano, R.; López, J.; Madroñal, D.; Salvador, R.; López, S.; Juarez, E.; Guerra, R.; Sanz, C.; Sarmiento, R. Implementation of the principal component analysis onto high-performance computer facilities for hyperspectral dimensionality reduction: Results and comparisons. Remote Sens. 2018, 10, 864. [Google Scholar] [CrossRef]
- Li, W.; Feng, F.; Li, H.; Du, Q. Discriminant analysis-based dimension reduction for hyperspectral image classification: A survey of the most recent advances and an experimental comparison of different techniques. IEEE Geosci. Remote Sens. Mag. 2018, 6, 15–34. [Google Scholar] [CrossRef]
- Yuan, H.; Yang, G.; Li, C.; Wang, Y.; Liu, J.; Yu, H.; Feng, H.; Xu, B.; Zhao, X.; Yang, X. Retrieving soybean leaf area index from unmanned aerial vehicle hyperspectral remote sensing: Analysis of RF, ANN, and SVM regression models. Remote Sens. 2017, 9, 309. [Google Scholar] [CrossRef]
- Zhou, W.; Yang, H.; Xie, L.; Li, H.; Huang, L.; Zhao, Y.; Yue, T. Hyperspectral inversion of soil heavy metals in Three-River Source Region based on random forest model. Catena 2021, 202, 105222. [Google Scholar] [CrossRef]
- Pal, M.; Charan, T.B.; Poriya, A. K-nearest neighbour-based feature selection using hyperspectral data. Remote Sens. Lett. 2021, 12, 132–141. [Google Scholar] [CrossRef]
- Guo, A.J.; Zhu, F. Spectral-spatial feature extraction and classification by ANN supervised with center loss in hyperspectral imagery. IEEE Trans. Geosci. Remote Sens. 2018, 57, 1755–1767. [Google Scholar] [CrossRef]
- Kanthi, M.; Sarma, T.H.; Bindu, C.S. A 3D-deep CNN based feature extraction and hyperspectral image classification. In Proceedings of the 2020 IEEE India Geoscience and Remote Sensing Symposium (InGARSS), Ahmedabad, India, 1–4 December 2020. [Google Scholar]
- Hu, W.S.; Li, H.C.; Pan, L.; Li, W.; Tao, R.; Du, Q. Spatial–spectral feature extraction via deep ConvLSTM neural networks for hyperspectral image classification. IEEE Trans. Geosci. Remote Sens. 2020, 58, 4237–4250. [Google Scholar] [CrossRef]
- Duanyuan, H.; Zhou, T.; He, Z.; Peng, Y.; Lei, J.; Dong, J.; Wu, X.; Wang, J.; Yan, W. Effects of Straw Mulching on Soil Properties and Enzyme Activities of Camellia oleifera–Cassia Intercropping Agroforestry Systems. Plants 2023, 12, 3046. [Google Scholar] [CrossRef] [PubMed]
- Zhang, F.; Zhu, F.; Chen, B.; Su, E.; Chen, Y.; Cao, F. Composition, bioactive substances, extraction technologies and the influences on characteristics of Camellia oleifera oil: A review. Food Res. Int. 2022, 156, 111159. [Google Scholar] [CrossRef] [PubMed]
- Sun, Z.; Jiang, X.; Tang, X.; Yan, L.; Kuang, F.; Li, X.; Dou, M.; Wang, B.; Gao, X. Identifying core wavelengths of oil tree’s hyperspectral data by Taylor expansion. Remote Sens. 2023, 15, 3137. [Google Scholar] [CrossRef]
- Hasan, U.; Jia, K.; Wang, L.; Wang, C.; Shen, Z.; Yu, W.; Sun, Y.; Jiang, H.; Zhang, Z.; Guo, J.; et al. Retrieval of leaf chlorophyll contents (LCCs) in litchi based on fractional order derivatives and VCPA-GA-ML algorithms. Plants 2023, 12, 501. [Google Scholar] [CrossRef] [PubMed]
- Zhang, H.; Ge, Y.; Xie, X.; Atefi, A.; Wijewardane, N.K.; Thapa, S. High throughput analysis of leaf chlorophyll content in sorghum using RGB, hyperspectral, and fluorescence imaging and sensor fusion. Plant Methods 2022, 18, 60. [Google Scholar] [CrossRef]
- Wang, Q.; Shen, Y.; Zhang, J.Q. A nonlinear correlation measure for multivariable data set. Phys. D Nonlinear Phenom. 2005, 200, 287–295. [Google Scholar] [CrossRef]
- Wang, H.; Yao, X. Objective reduction based on nonlinear correlation information entropy. Soft Comput. 2016, 20, 2393–2407. [Google Scholar] [CrossRef]
- Zhou, H.; Deng, Z.; Xia, Y.; Fu, M. A new sampling method in particle filter based on Pearson correlation coefficient. Neurocomputing 2016, 216, 208–215. [Google Scholar] [CrossRef]
- Sedgwick, P. Pearson’s correlation coefficient. BMJ 2012, 345, e4483. [Google Scholar] [CrossRef]
- Johnstone, I.M.; Silverman, B.W. Wavelet threshold estimators for data with correlated noise. J. R. Stat. Soc. Ser. B Stat. Methodol. 1997, 59, 319–351. [Google Scholar] [CrossRef]
- Tibshirani, R. Regression shrinkage and selection via the lasso. J. R. Stat. Soc. Ser. B Stat. Methodol. 1996, 58, 267–288. [Google Scholar] [CrossRef]
- Ghosh, P.; Azam, S.; Jonkman, M.; Karim, A.; Shamrat, F.J.M.; Ignatious, E.; Shultana, S.; Reddy Beeravolu, A.; De Boer, F. Efficient prediction of cardiovascular disease using machine learning algorithms with relief and Lasso feature selection techniques. IEEE Access 2021, 9, 19304–19326. [Google Scholar] [CrossRef]
- Agatonovic-Kustrin, S.; Beresford, R. Basic concepts of artificial neural network (ANN) modeling and its application in pharmaceutical research. J. Pharm. Biomed. Anal. 2000, 22, 717–727. [Google Scholar] [CrossRef] [PubMed]
- Zupan, J. Introduction to artificial neural network (ANN) methods: What they are and how to use them. Acta Chim. Slov. 1994, 41, 327. [Google Scholar]
- Breiman, L. Random forests. Mach. Learn. 2001, 45, 5–32. [Google Scholar] [CrossRef]
- Rodriguez-Galiano, V.; Sanchez-Castillo, M.; Chica-Olmo, M.; Chica-Rivas, M. Machine learning predictive models for mineral prospectivity: An evaluation of neural networks, random forest, regression trees and support vector machines. Ore Geol. Rev. 2015, 71, 804–818. [Google Scholar] [CrossRef]
- Li, D.; Hu, Q.; Zhang, J.; Dian, Y.; Hu, C.; Zhou, J. Leaf Nitrogen and Phosphorus Variation and Estimation of Citrus Tree under Two Labor-Saving Cultivation Modes Using Hyperspectral Data. Remote Sens. 2024, 16, 3261. [Google Scholar] [CrossRef]
- Lu, B.; Dao, P.D.; Liu, J.; He, Y.; Shang, J. Recent advances of hyperspectral imaging technology and applications in agriculture. Remote Sens. 2020, 12, 2659. [Google Scholar] [CrossRef]
- Boldrini, B.; Kessler, W.; Rebner, K.; Kessler, R.W. Hyperspectral imaging: A review of best practice, performance and pitfalls for in-line and on-line applications. J. Near Infrared Spectrosc. 2012, 20, 483–508. [Google Scholar] [CrossRef]
- Aziz, R.; Verma, C.K.; Srivastava, N. Artificial neural network classification of high dimensional data with novel optimization approach of dimension reduction. Ann. Data Sci. 2018, 5, 615–635. [Google Scholar] [CrossRef]
- Bhadra, S.; Sagan, V.; Maimaitijiang, M.; Maimaitiyiming, M.; Newcomb, M.; Shakoor, N.; Mockler, T.C. Quantifying leaf chlorophyll concentration of sorghum from hyperspectral data using derivative calculus and machine learning. Remote Sens. 2020, 12, 2082. [Google Scholar] [CrossRef]
- Singh, K.D.; Ramakrishnan, D.; Mansinha, L. Relevance of transformation techniques in rapid endmember identification and spectral unmixing: A hypespectral remote sensing perspective. In Proceedings of the 2012 IEEE International Geoscience and Remote Sensing Symposium, Munich, Germany, 22–27 July 2012. [Google Scholar]
- Sun, Z.; Qian, W.; Huang, Q.; Lv, H.; Yu, D.; Ou, Q.; Lu, H.; Tang, X. Use remote sensing and machine learning to study the changes of broad-leaved forest biomass and their climate driving forces in nature reserves of northern subtropics. Remote Sens. 2022, 14, 1066. [Google Scholar] [CrossRef]
Disclaimer/Publisher’s Note: The statements, opinions and data contained in all publications are solely those of the individual author(s) and contributor(s) and not of MDPI and/or the editor(s). MDPI and/or the editor(s) disclaim responsibility for any injury to people or property resulting from any ideas, methods, instructions or products referred to in the content. |
© 2024 by the authors. Licensee MDPI, Basel, Switzerland. This article is an open access article distributed under the terms and conditions of the Creative Commons Attribution (CC BY) license (https://creativecommons.org/licenses/by/4.0/).