

Analysis of Spatial and Temporal Changes in Vegetation Cover and Driving Forces in the Wuding River Basin, Loess Plateau

Abstract
:
1. Introduction
2. Materials and Methods
2.1. Materials
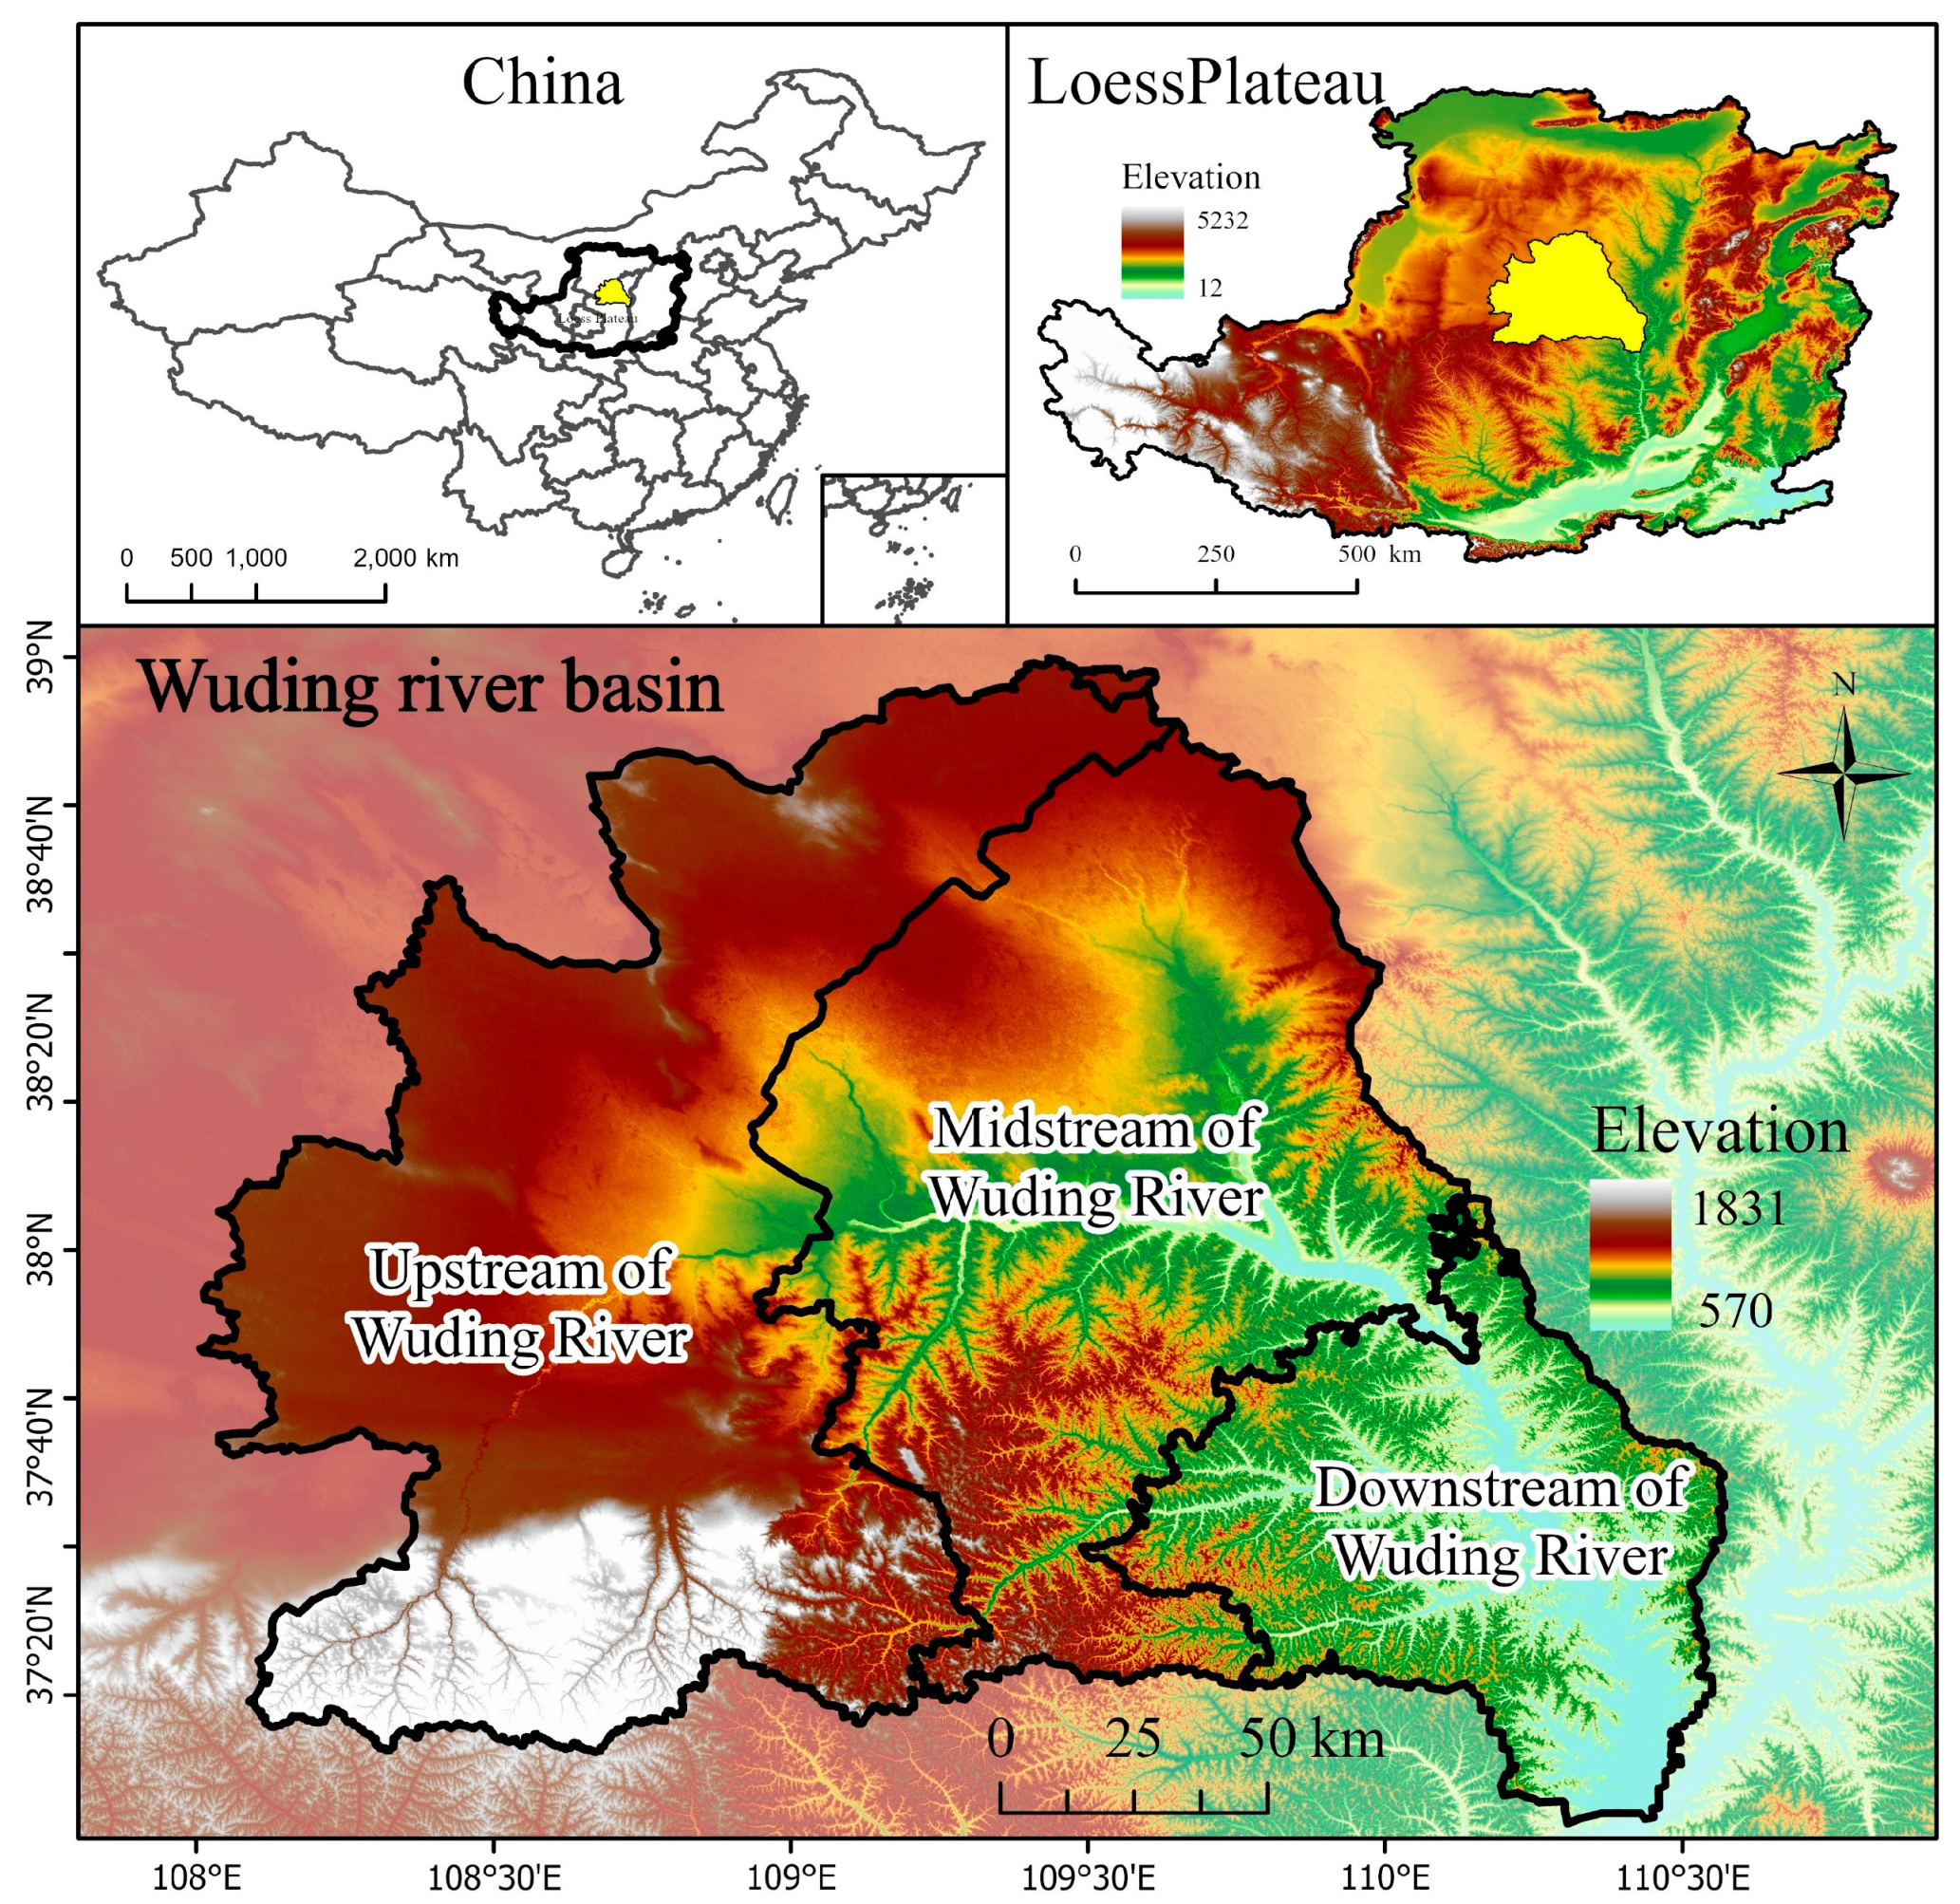
2.1.1. Study Area
2.1.2. Data Sources
2.2. Methods
2.2.1. Dimidiate Pixel Model
2.2.2. Theil–Sen Median and the Mann–Kendall Methods
2.2.3. Coefficient of Variation
2.2.4. Hurst Index
2.2.5. Geodetector
2.2.6. Contribution of Land Use Shifts to Vegetation Cover
3. Results
3.1. Characteristics of Temporal Changes in FVC
3.1.1. Temporal Trends in FVC
3.1.2. Characteristics of FVC Class Changes
3.2. Characteristics of Spatial Changes in FVC
3.2.1. Characteristics of FVC Spatial Distribution
3.2.2. Characteristics of FVC Spatial Variation
3.3. Analysis of Factors Driving Changes in FVC
3.3.1. Factor Detector
3.3.2. Interaction and Ecological Detector
3.3.3. Risk Detector
3.4. Impact of Land Use Type Shifts on Vegetation Cover
3.4.1. Trends in Land Use Types
3.4.2. Land Use Type Shifts and Contribution of Vegetation Cover
4. Discussion
4.1. Effect of Natural Factors on FVC in the Wuding River Basin
4.2. Effect of Human Factors on FVC in the Wuding River Basin
4.3. Optimal Conditions for Vegetation Growth in the Wuding River Basin
4.4. Limitations and Prospects
5. Conclusions
- [1]
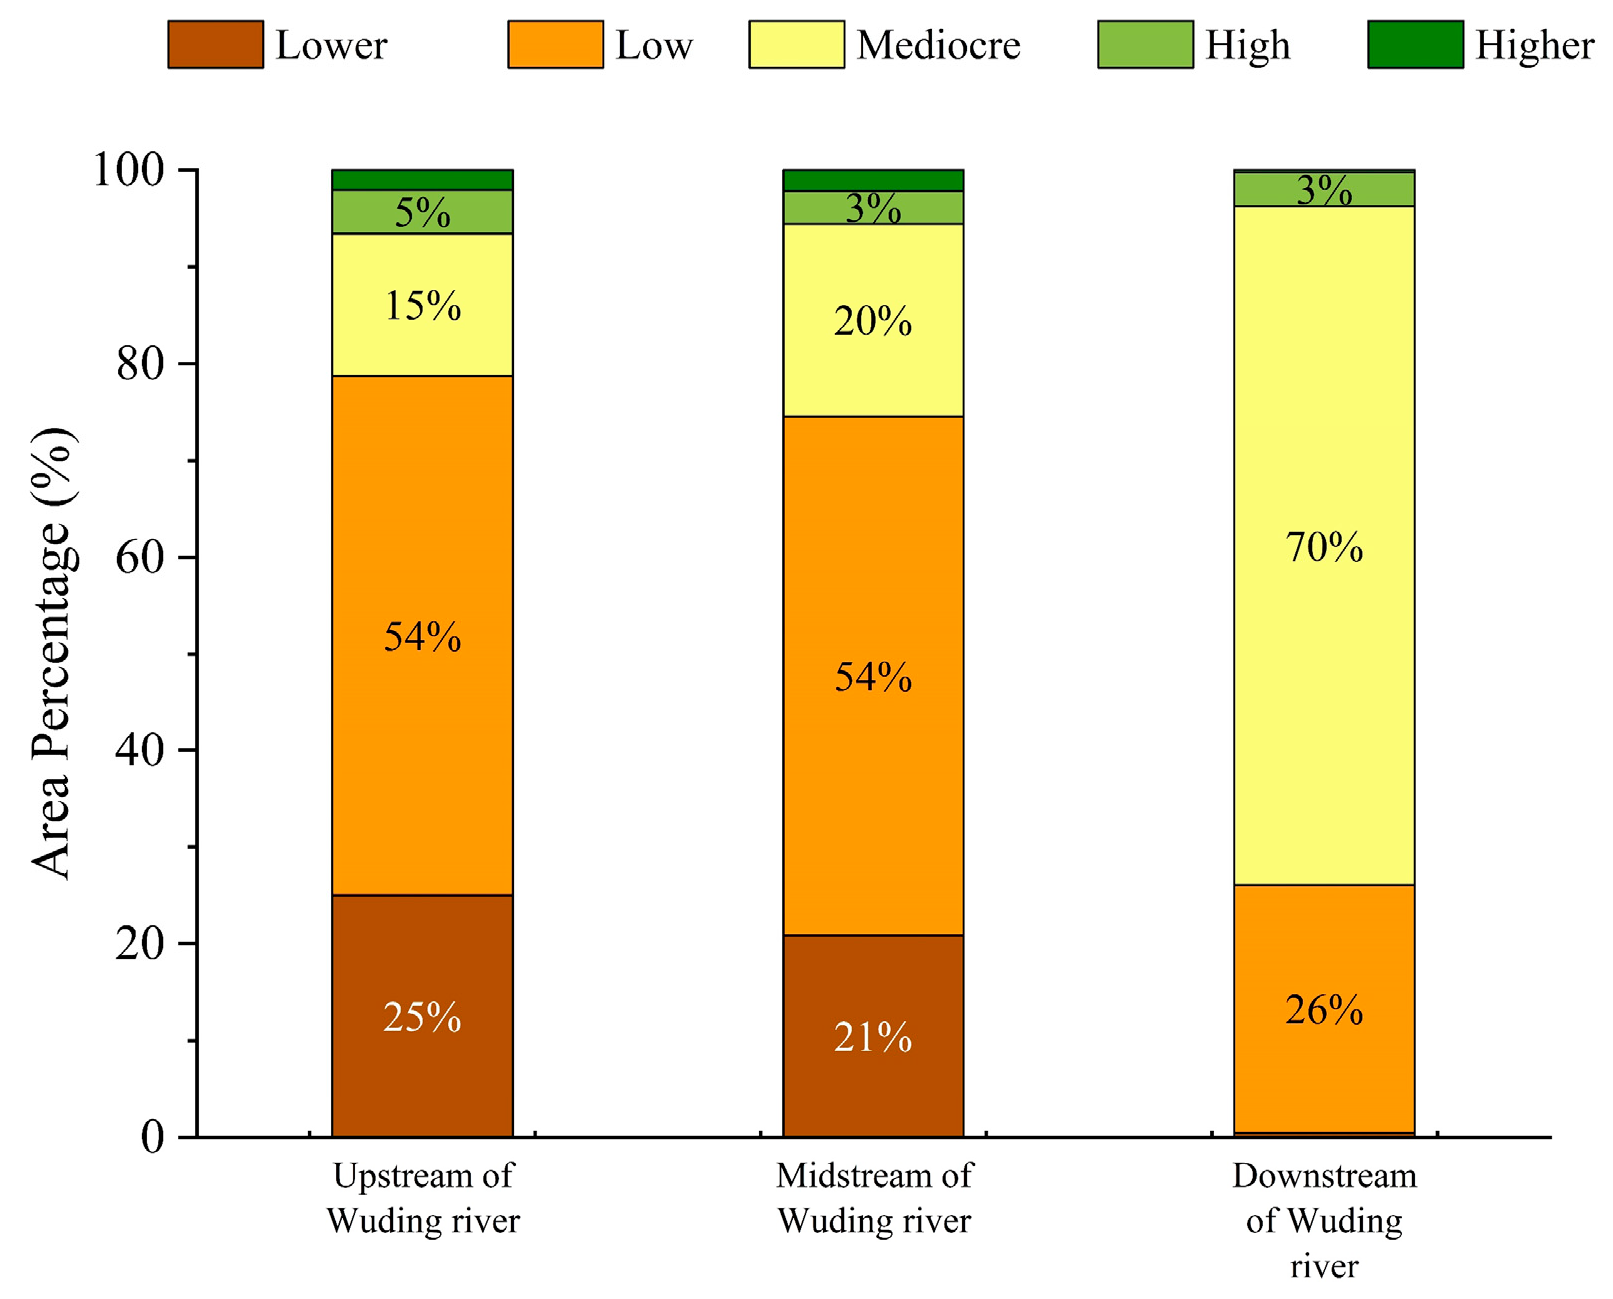
- The overall trend of the FVC in the Wuding River Basin slowly increased from 2000 to 2022 (S = 0.0046, p < 0.01). The FVC increased rapidly until 2013 (S = 0.011, p < 0.01), then decreased slowly after 2013 (S = −0.0027, p < 0.01). The downstream area had the fastest growth and decline rates in both periods. There was gradual conversion of low-grade FVC to higher grades and an overall improvement in vegetation cover in the study area.
- [2]
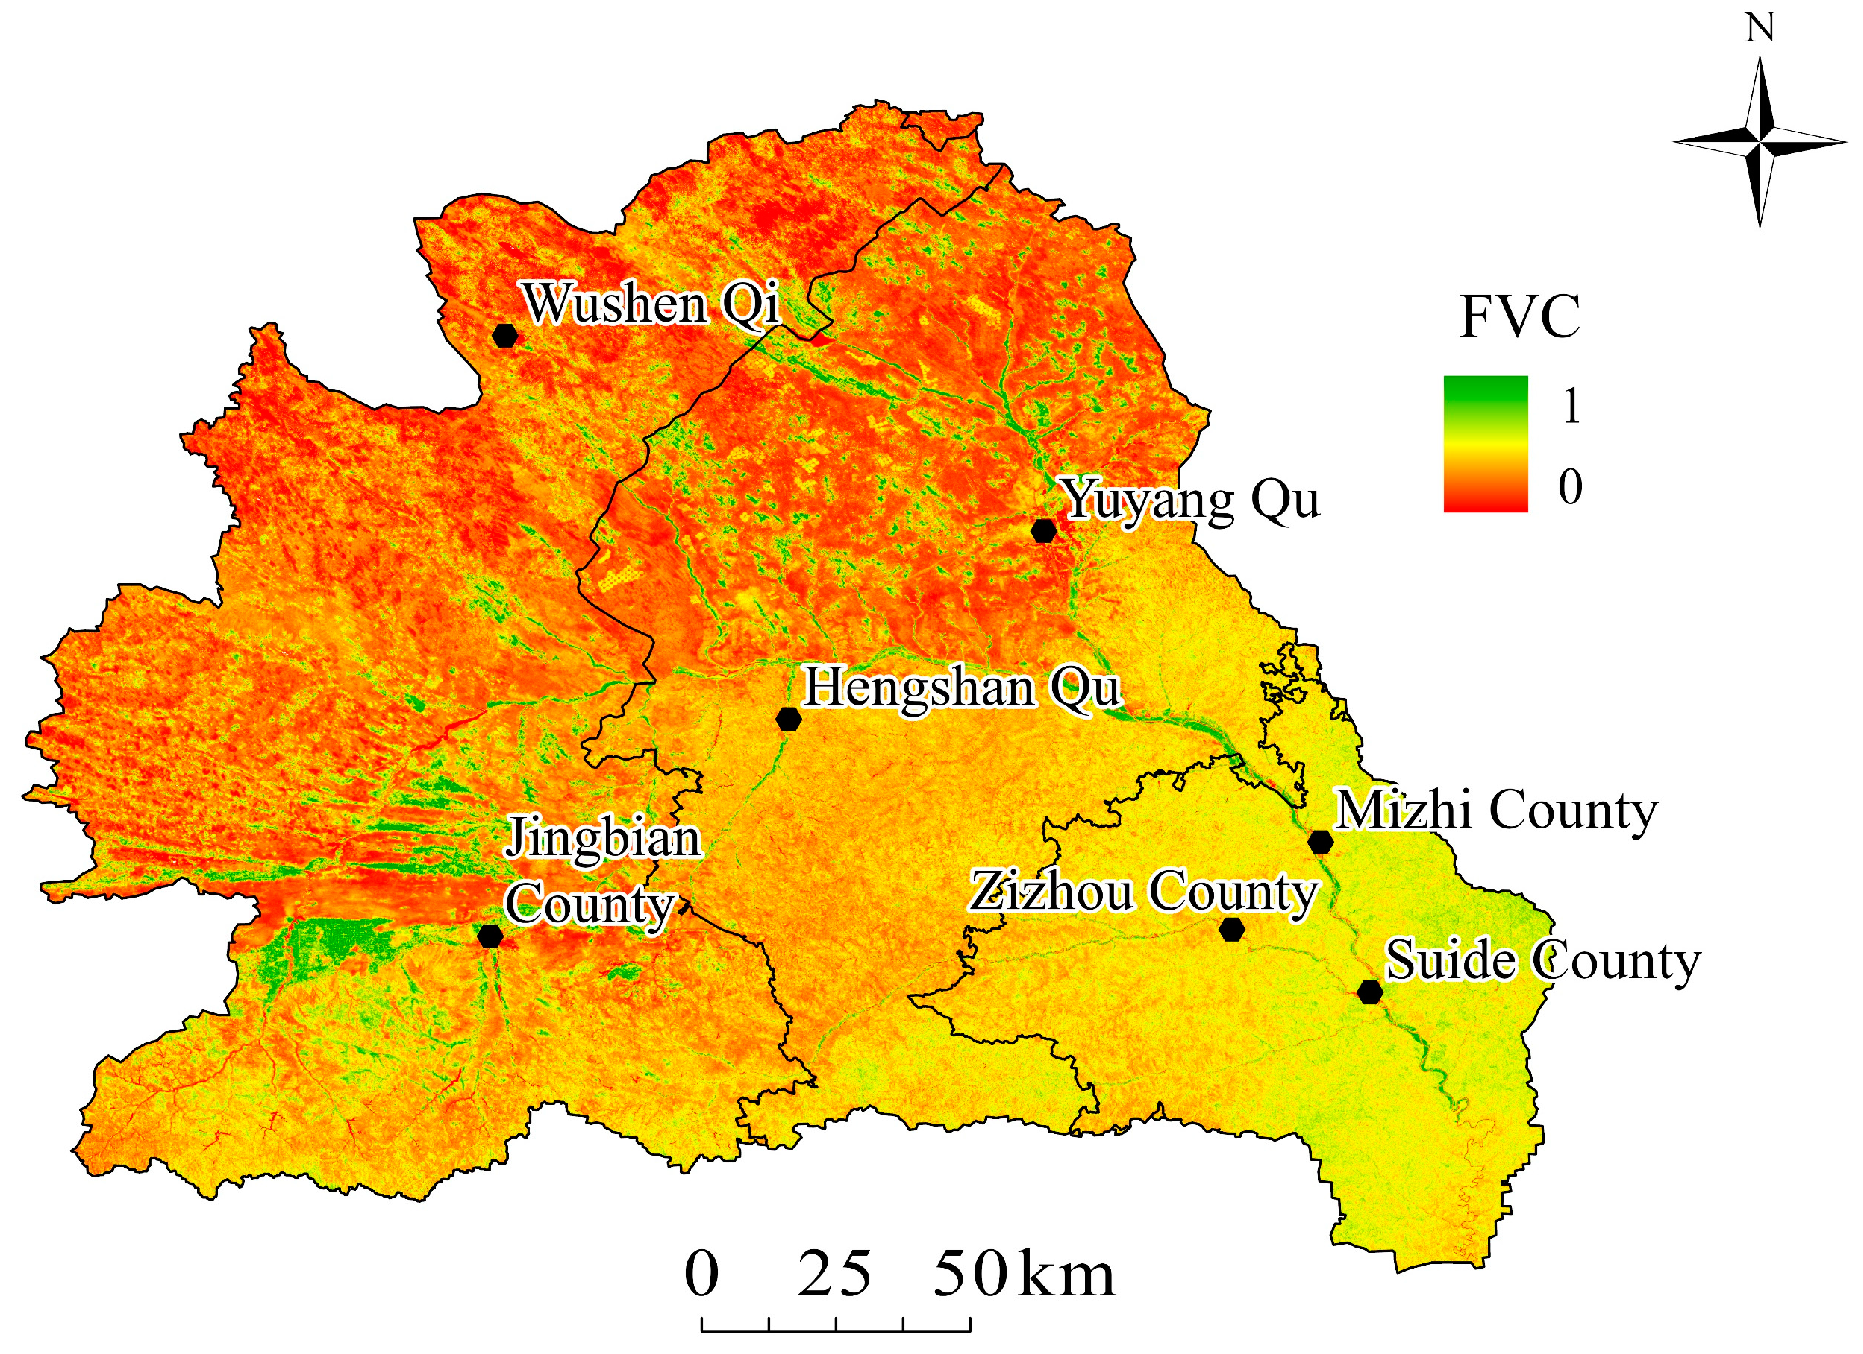
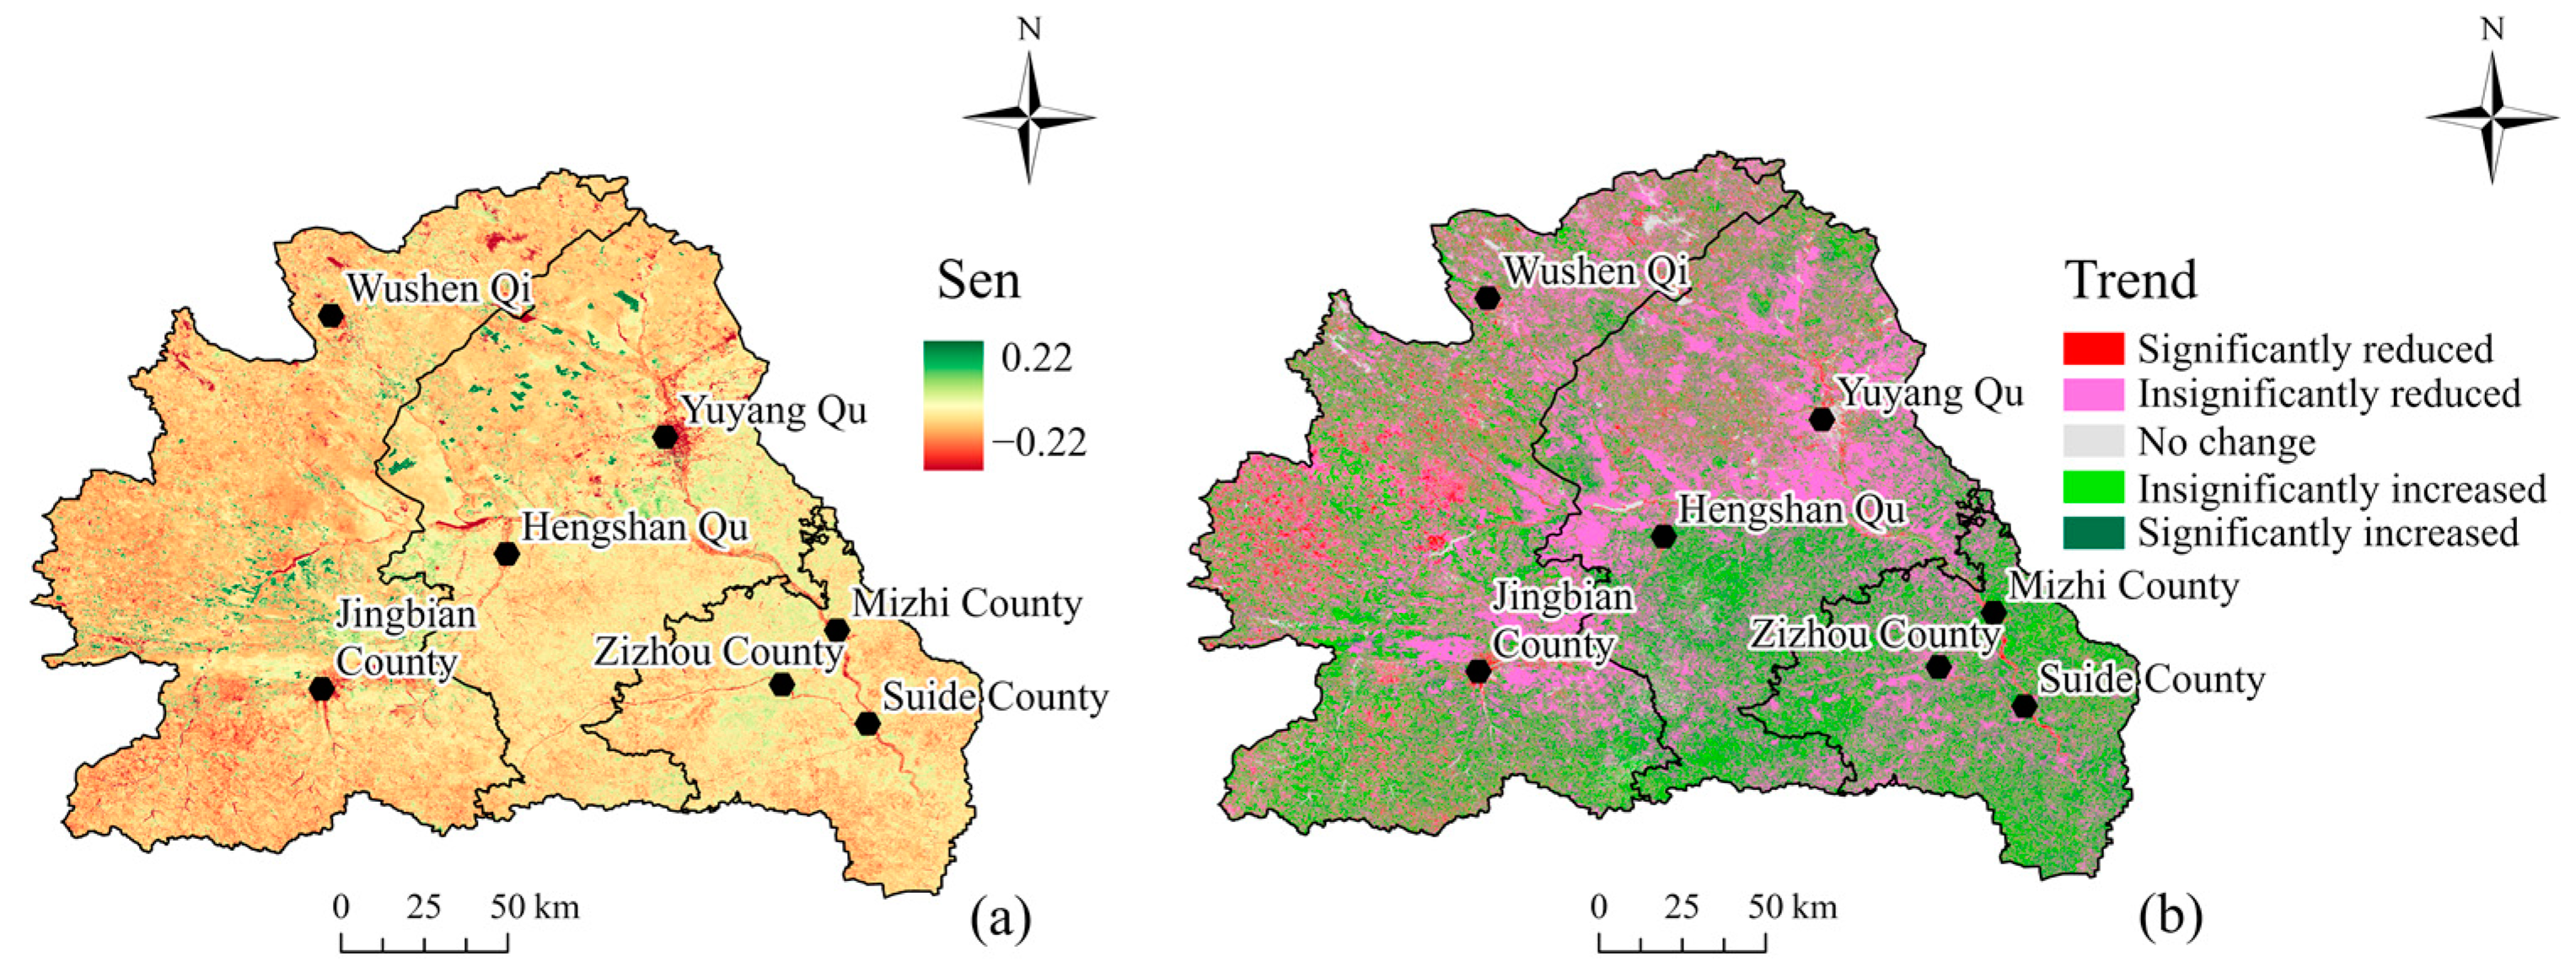
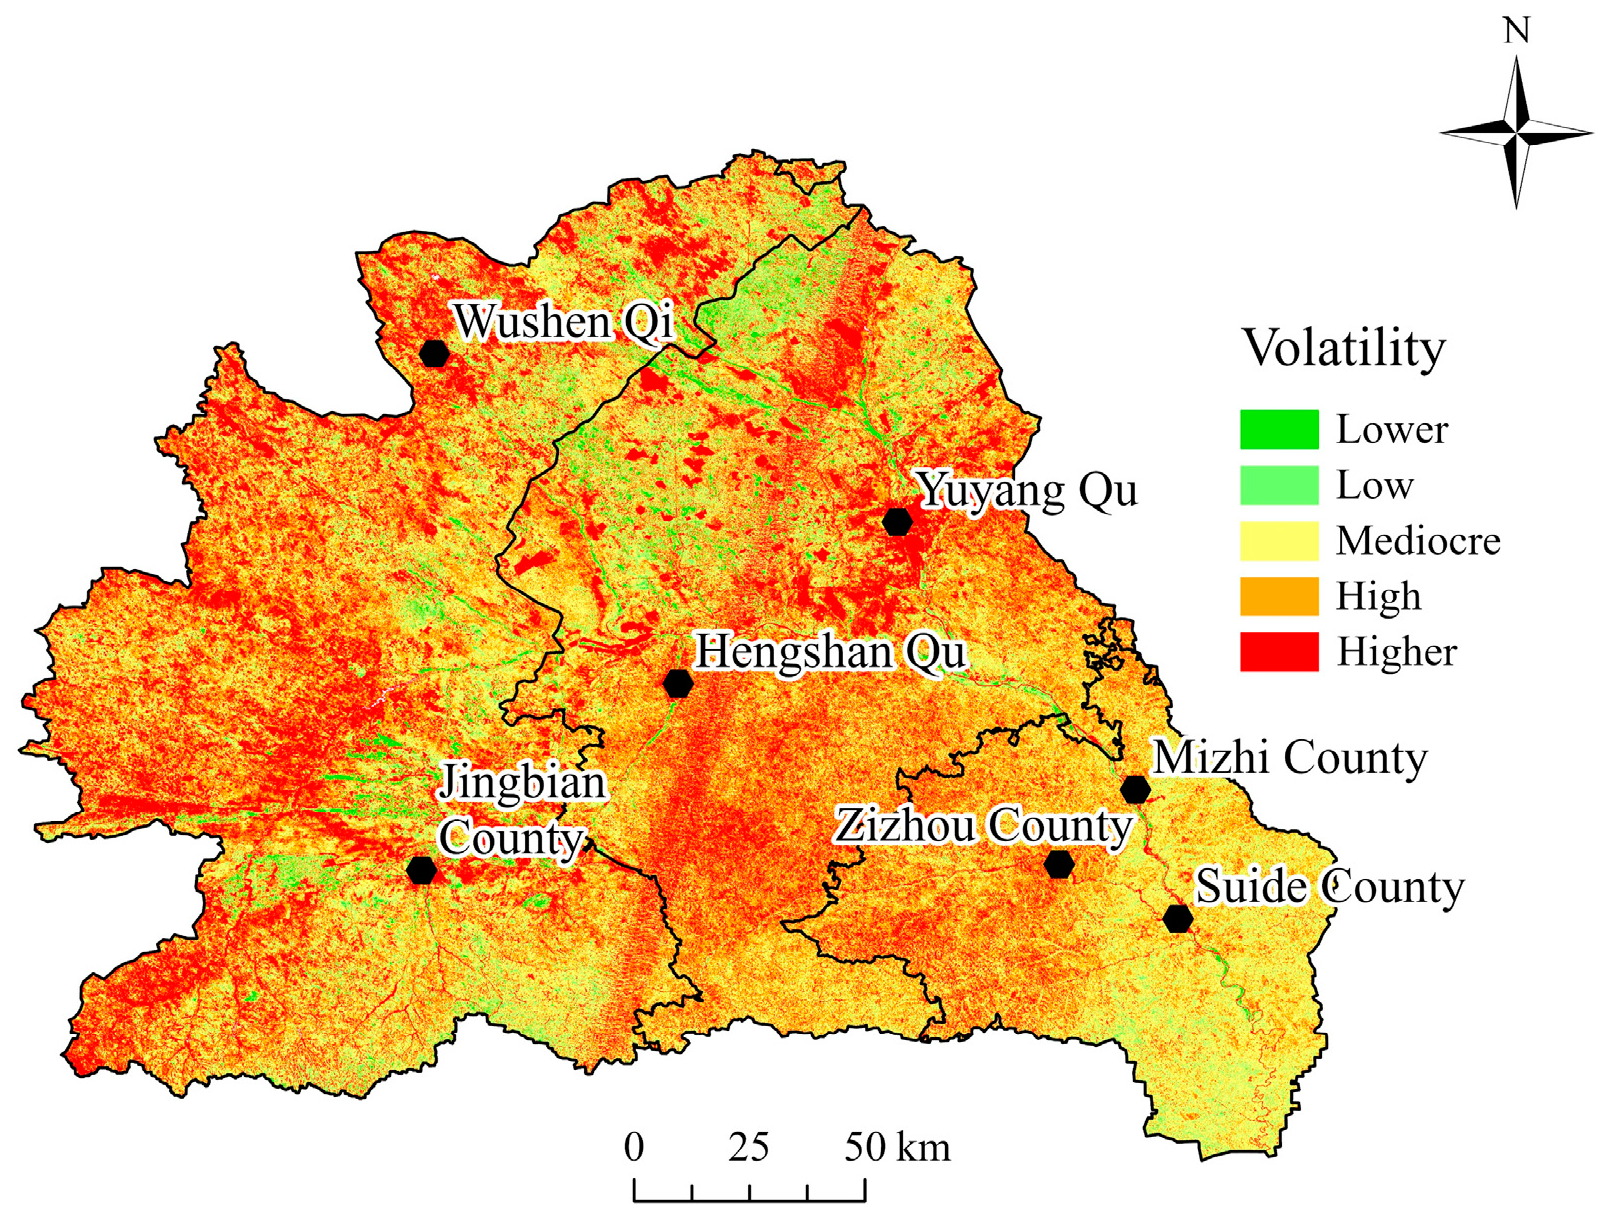
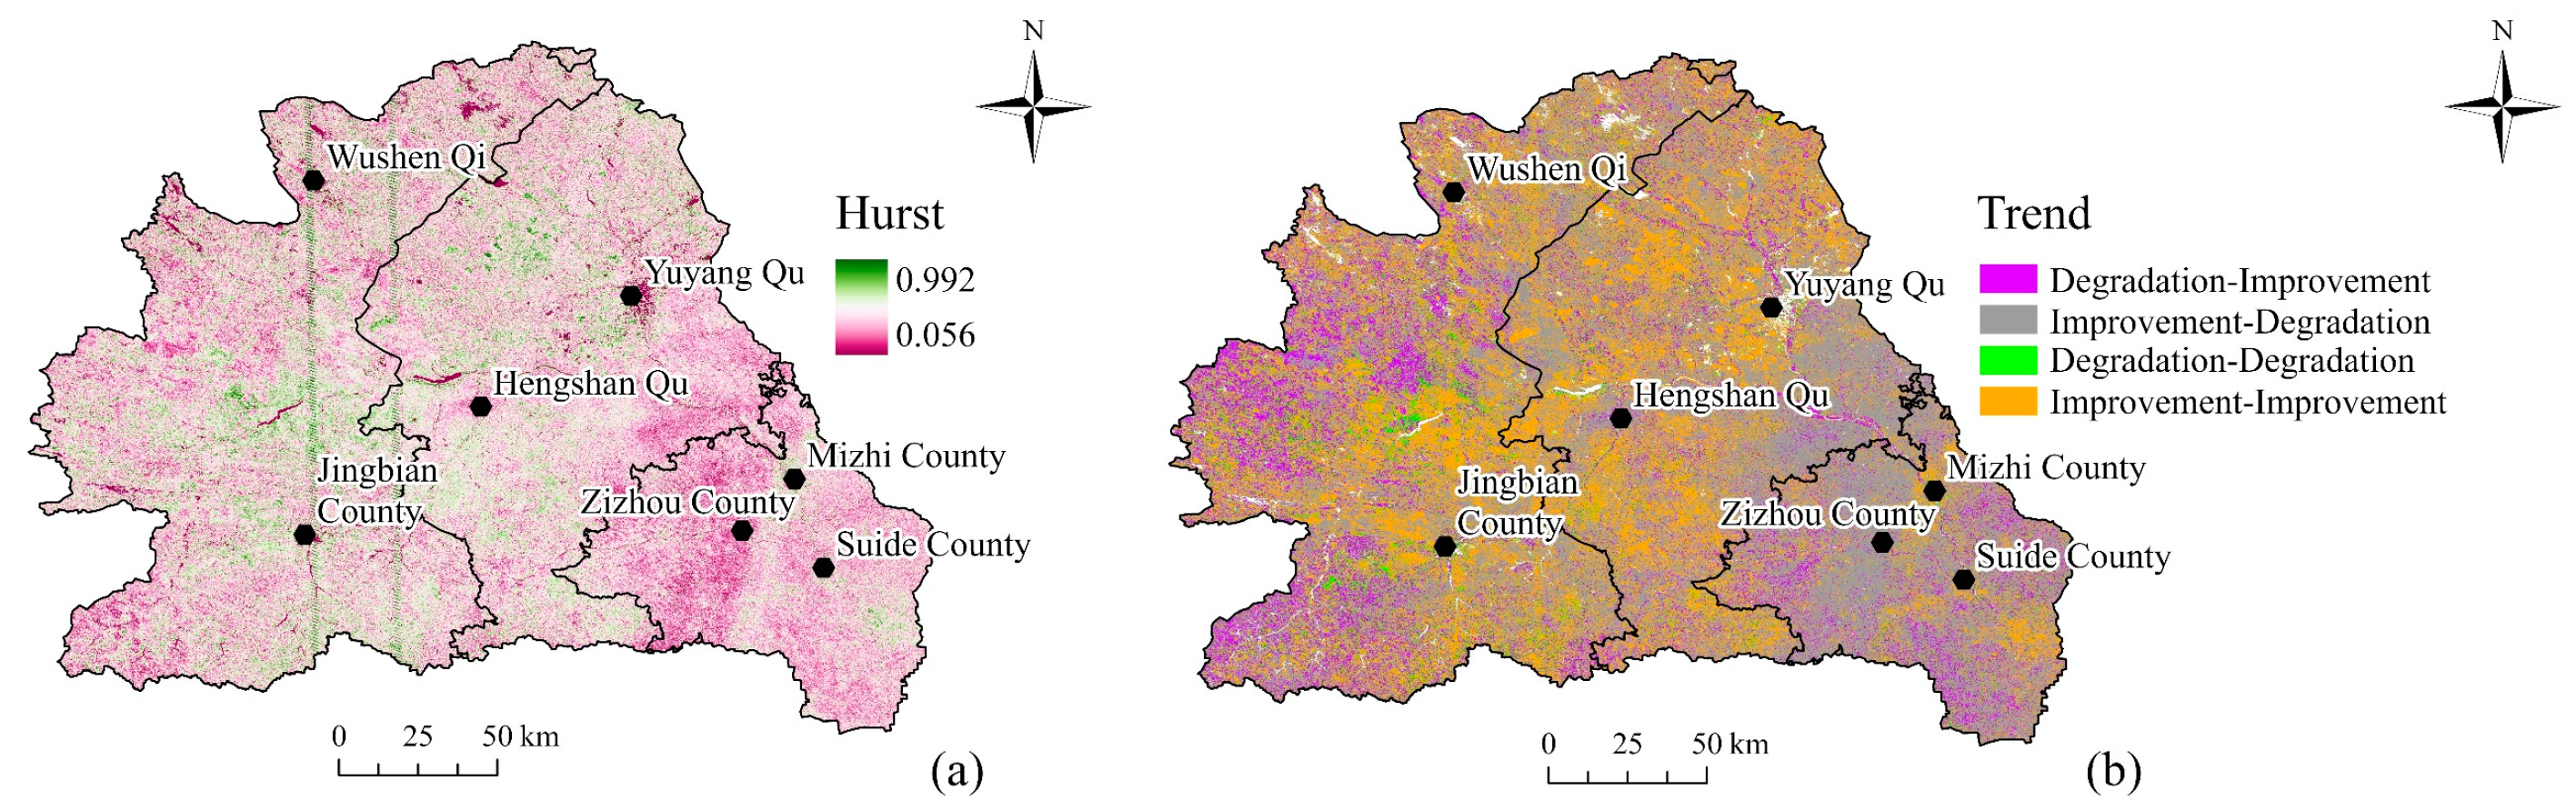
- From 2000 to 2022, the spatial distribution of the FVC in the Wuding River Basin showed a gradual increase from northwest to southeast, with obvious geographical differentiation. The high FVC areas were mainly distributed in the southeastern part, and the low areas were mainly distributed in the northern part of the study area. The future trend of the FVC is mainly decreasing (58.0%), which is mainly distributed in the downstream area of the Wuding River, such as Zizhou County and Mili County, where the vegetation cover is at a high risk of degradation, and needs to be strengthened for protection in the future.
- [3]
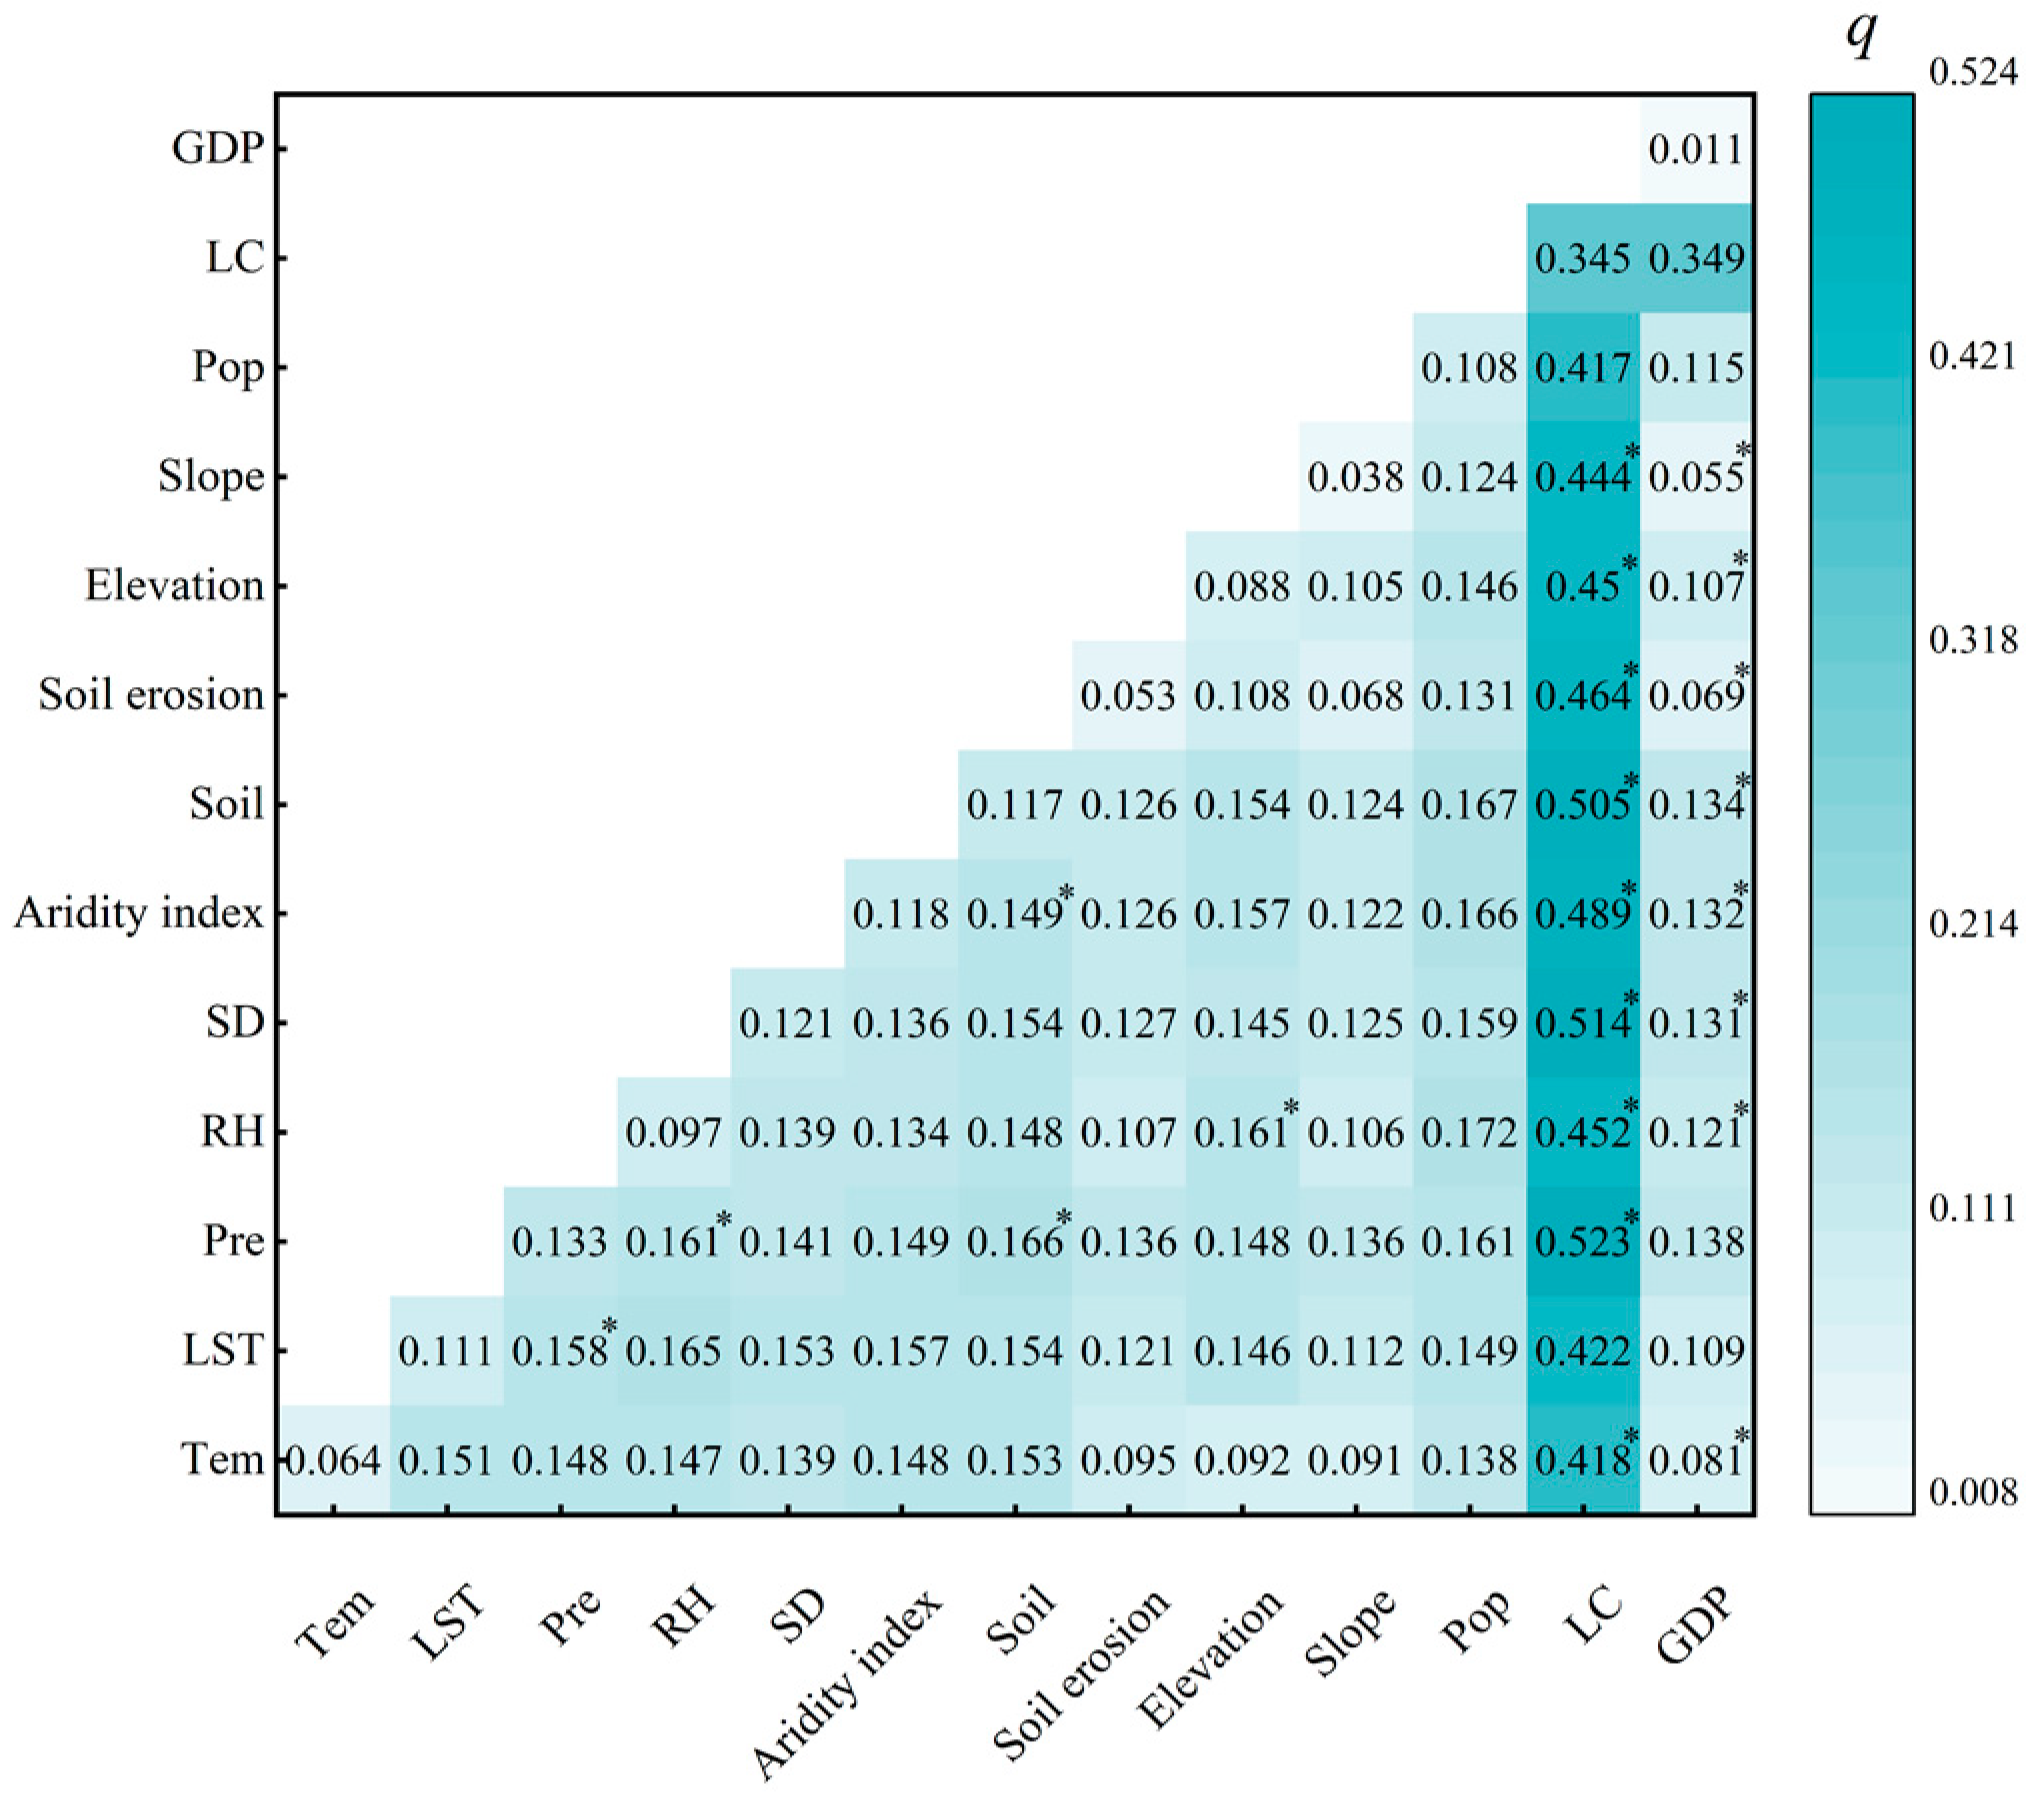
- The primary factor influencing the spatial differentiation of the FVC in the Wuding River Basin from 2000 to 2022 was the land cover, which was directly affected by human activities showing an explanatory power of 0.345. Additionally, natural factors, including precipitation, soil, and sunshine, also contributed to some extent. The interactions among most of the driving factors exhibited either two-factor enhancement or non-linear enhancement, with the most robust interaction explanatory power observed between land use and precipitation, reaching an explanatory power of 0.523.
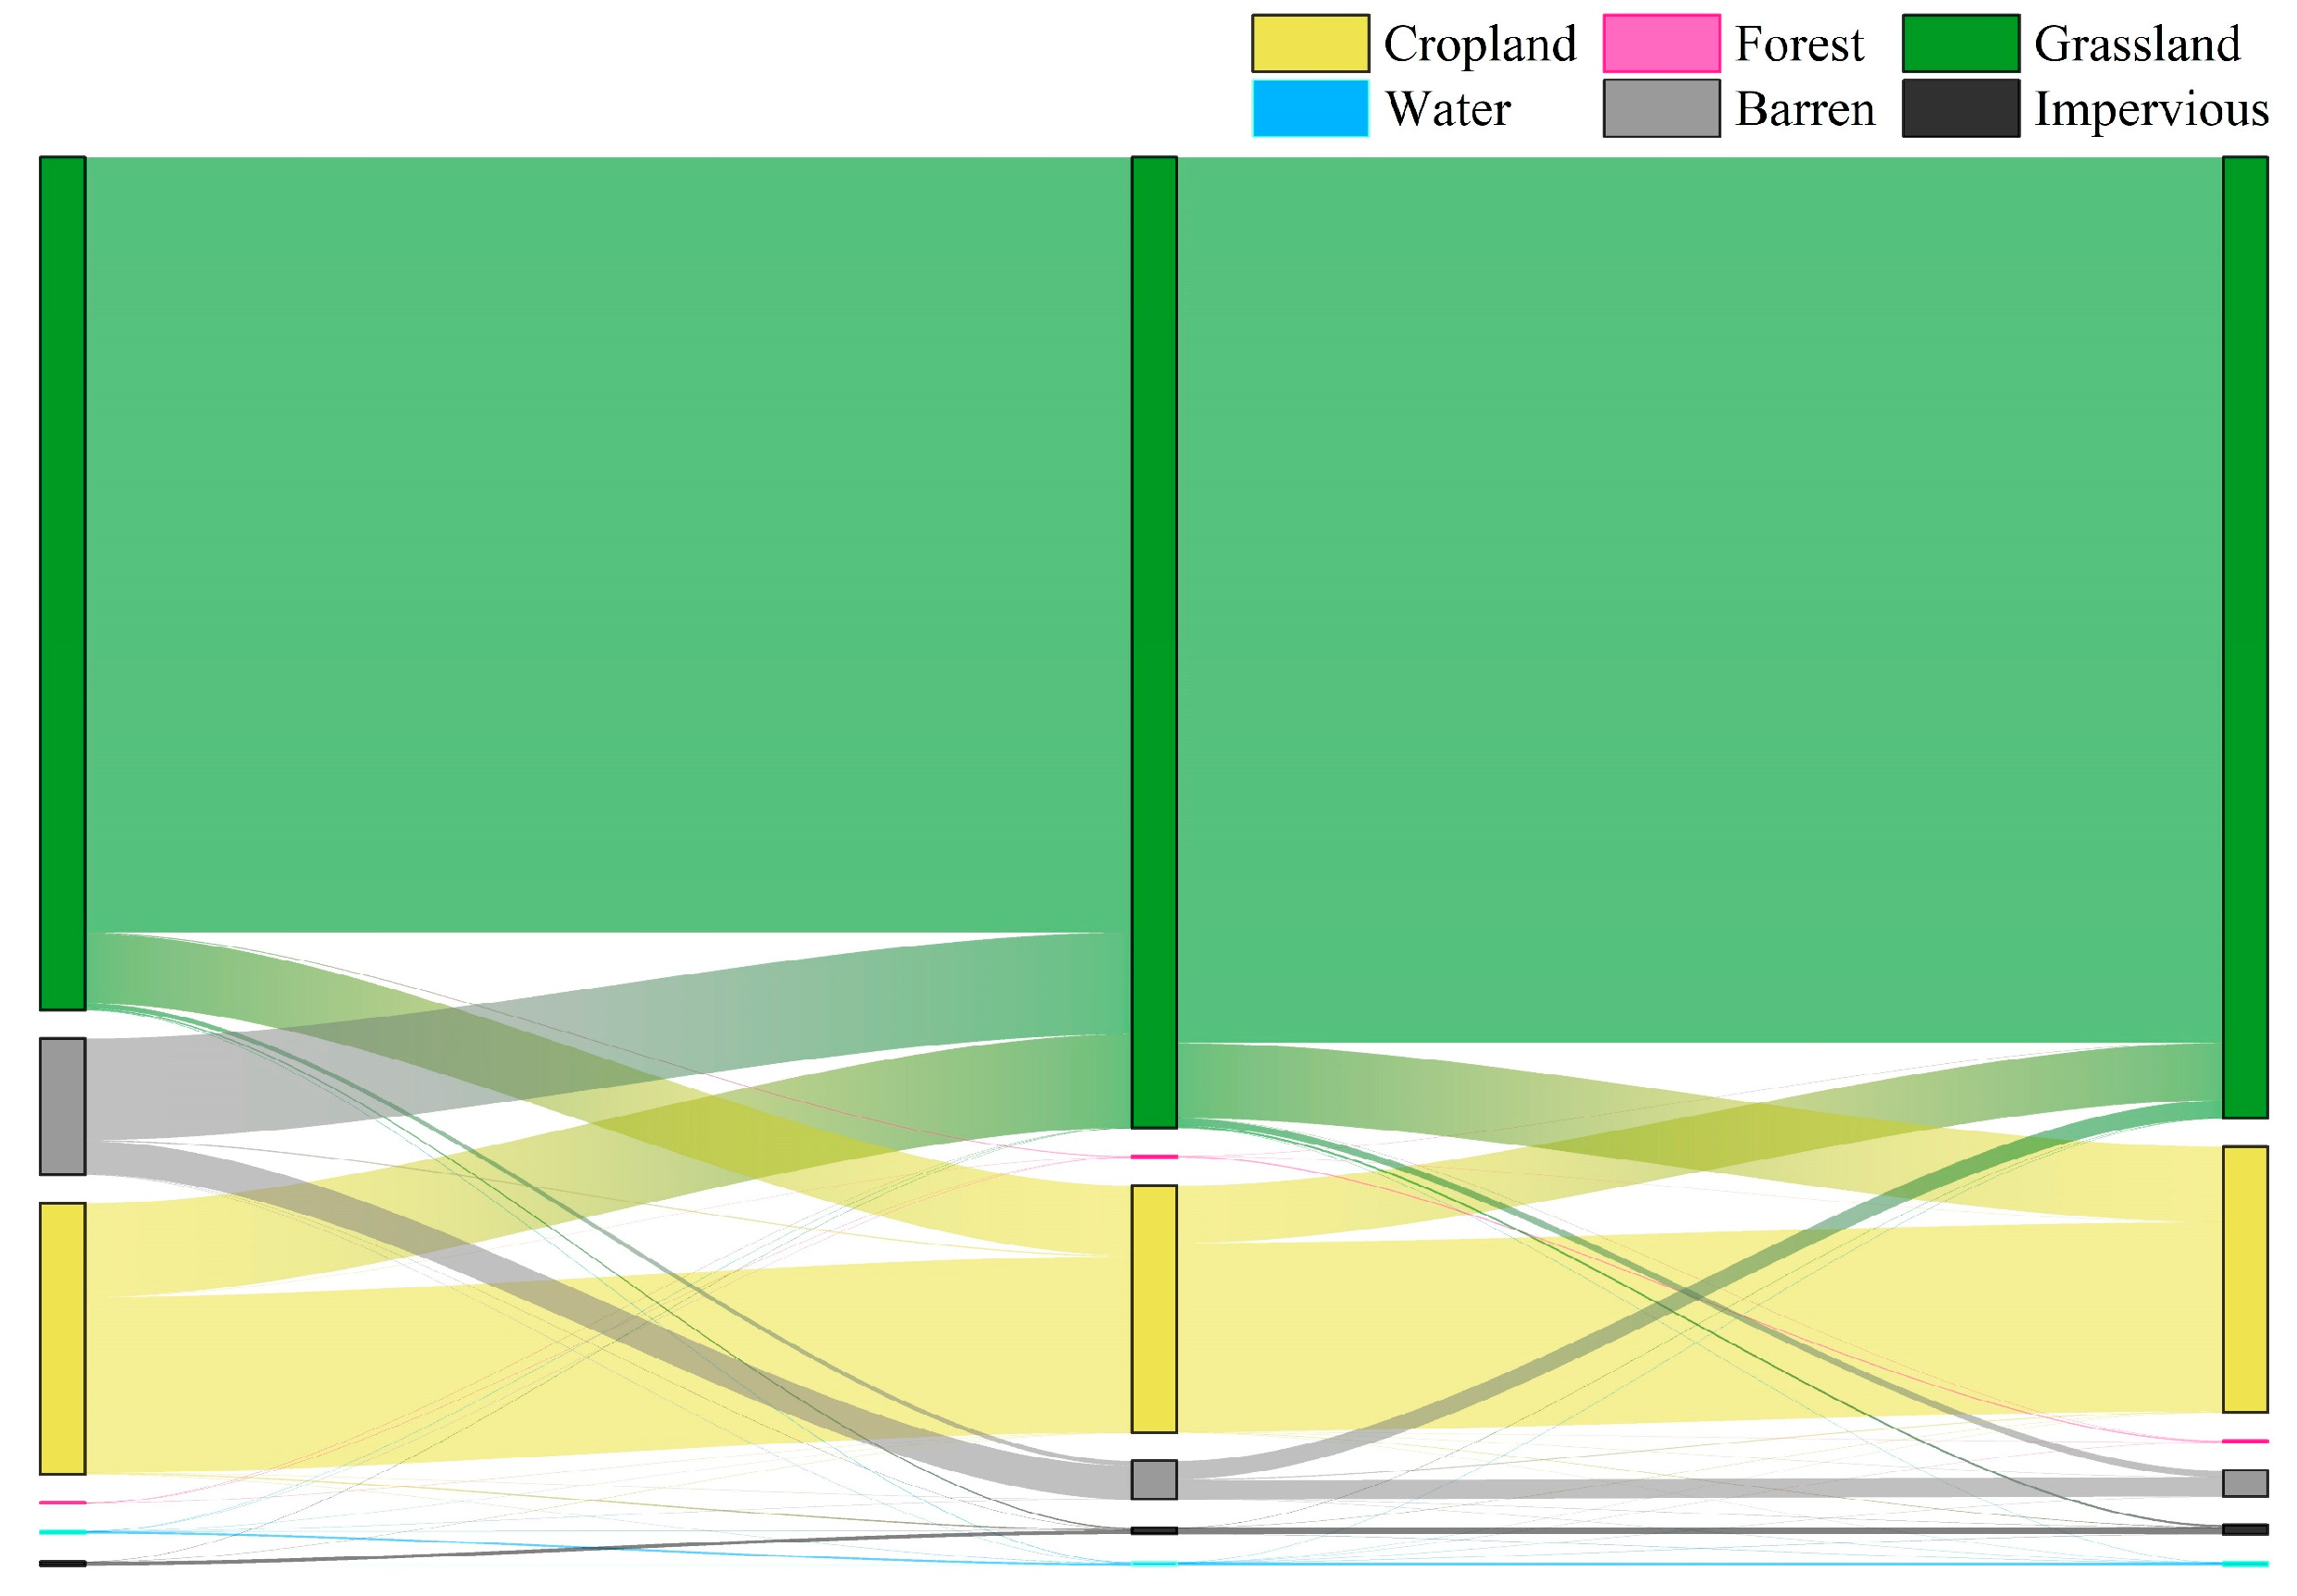
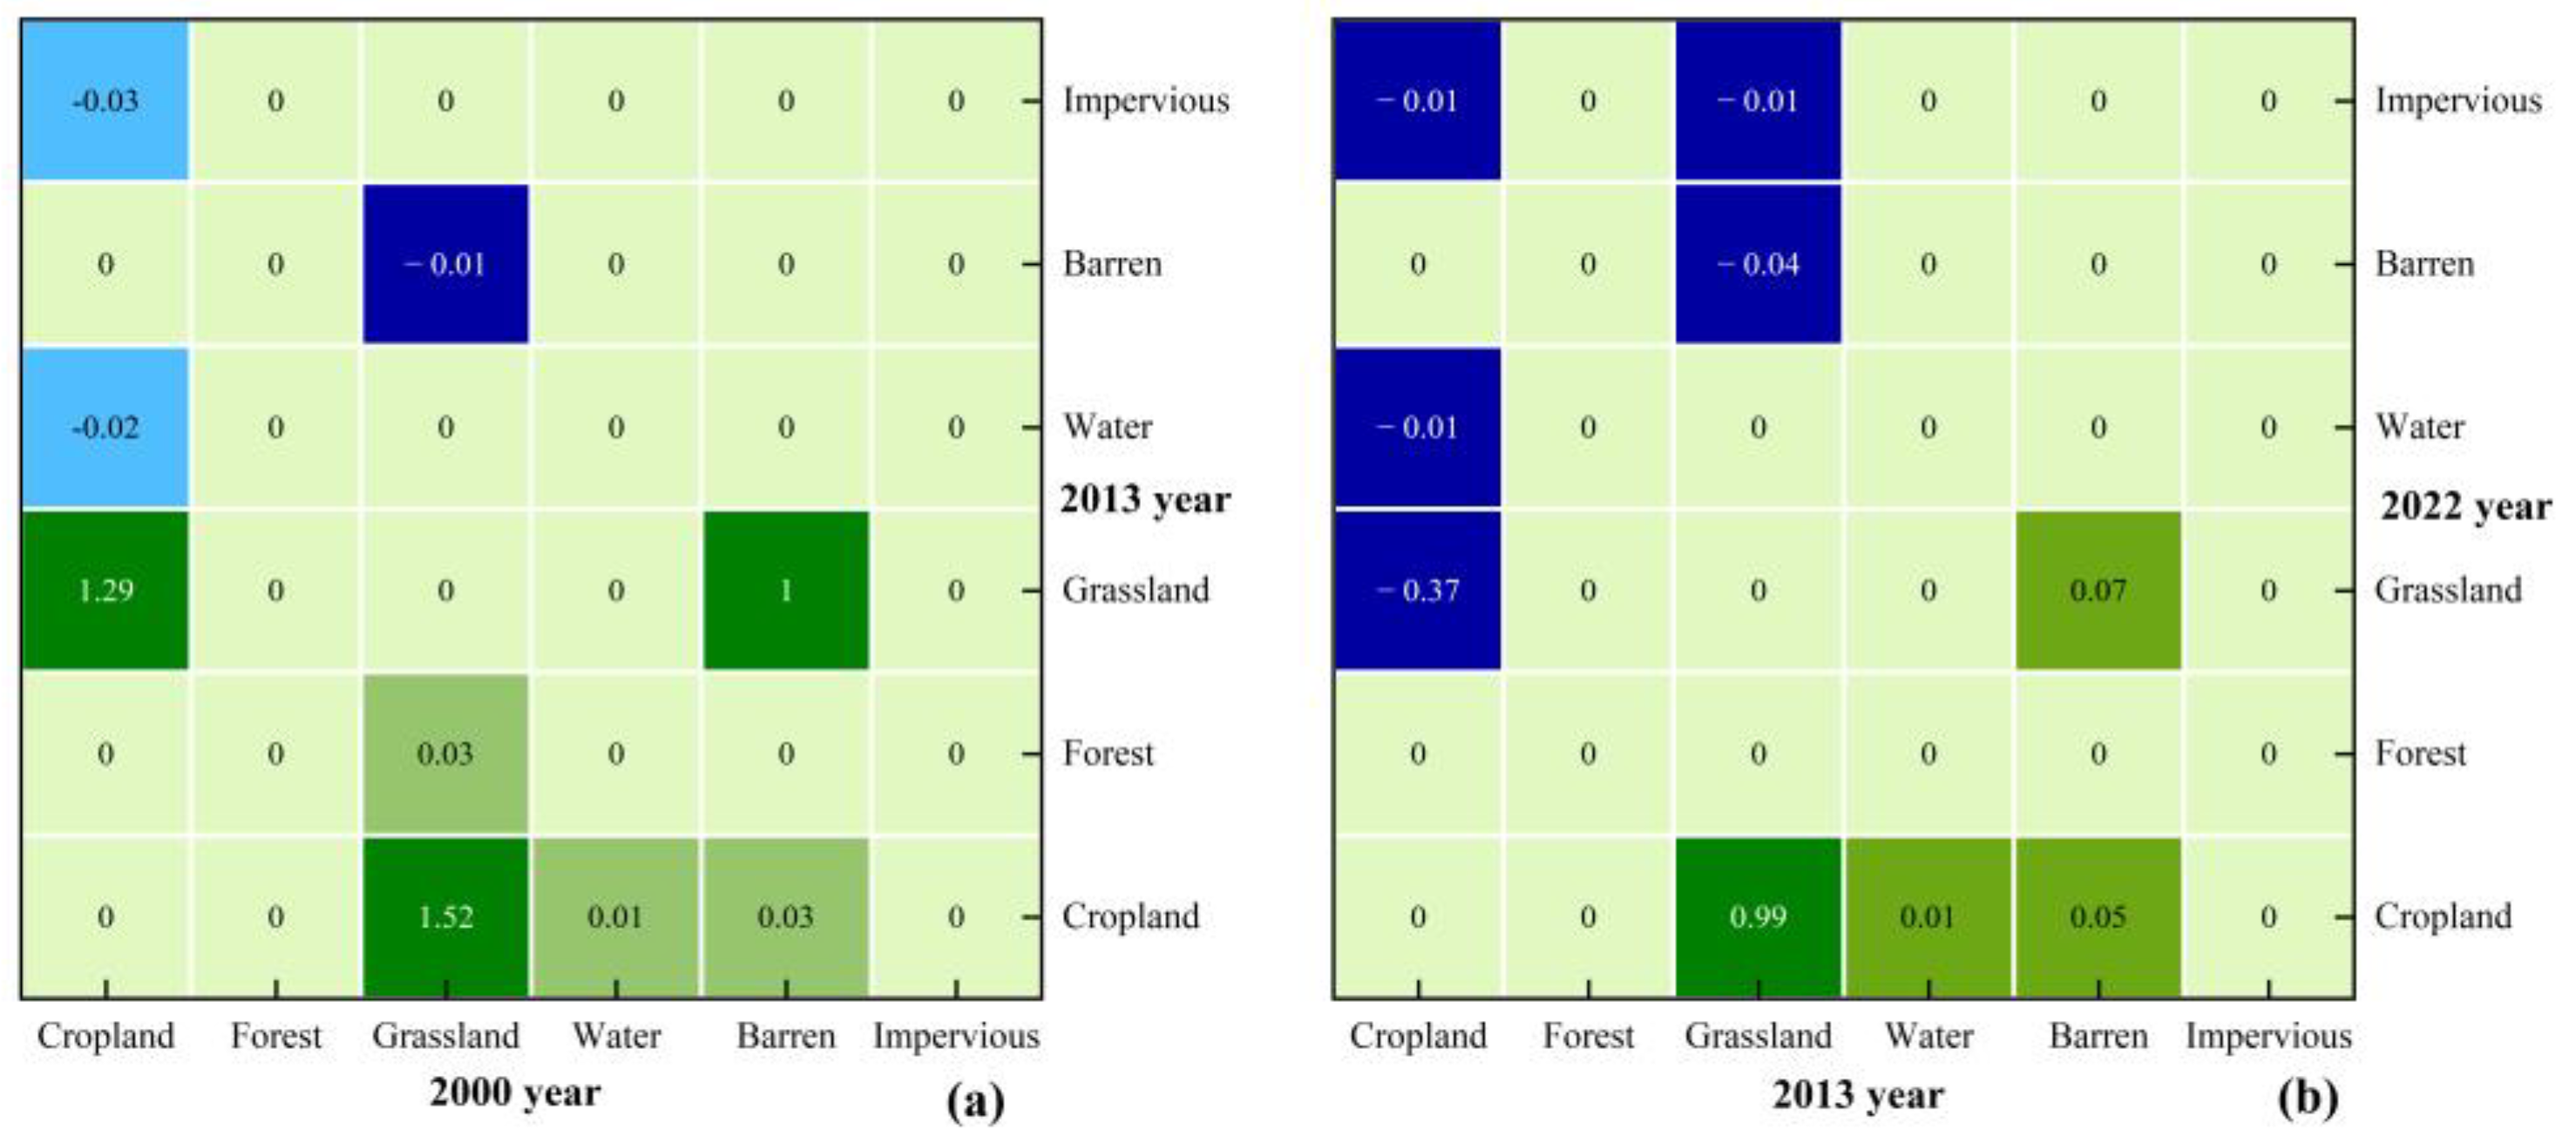
- [4]
- The land use types in the study area, including grassland, water, forest, and impervious, exhibited an increasing trend in their area shares, while cropland and barren showed a declining trend. Grassland is growing the fastest and cropland is declining the fastest. The transformation of grassland into cropland made the most positive significant contribution to vegetation cover, at 1.52%. The expansion of cropland was more favorable for enhancing vegetation cover in the study area.
Author Contributions
Funding
Data Availability Statement
Conflicts of Interest
References
- Trivedi, P.; Batista, B.D.; Bazany, K.E.; Singh, B.K. Plant-microbiome interactions under a changing world: Responses, consequences and perspectives. New Phytol. 2022, 234, 1951–1959. [Google Scholar] [CrossRef]
- Nzabarinda, V.; Bao, A.M.; Xu, W.Q.; Uwamahoro, S.; Xiaoran, H.; Habiyakare, T.; Sindikubwabo, C.; Habumugisha, J.M.; Itangishaka, A.C. A simple model to predict the spatiotemporally vegetation dynamics in terms of precipitation and temperature. Environ. Dev. 2022, 44, 100769. [Google Scholar] [CrossRef]
- Sutton, A.; Fisher, A.; Metternicht, G. Assessing the Accuracy of Landsat Vegetation Fractional Cover for Monitoring Australian Drylands. Remote Sens. 2022, 14, 6322. [Google Scholar] [CrossRef]
- Martínez-Vilalta, J.; Lloret, F. Drought-induced vegetation shifts in terrestrial ecosystems: The key role of regeneration dynamics. Glob. Planet. Chang. 2016, 144, 94–108. [Google Scholar] [CrossRef]
- Liu, X.; Pan, Y.; Zhu, X.; Li, S. Spatiotemporal variation of vegetation coverage in Qinling-Daba Mountains in relation to environmental factors. Acta Geogr. Sin. 2015, 70, 705–716. [Google Scholar]
- Hao, J.; Hu, Y.; Du, Y.; Hou, X.; Xiang, A. NDVI-Based Coverage Changes of Forest and Grass Vegetation in Yellow River Basin during 2009 to 2018. Sci. Silvae Sin. 2022, 58, 10–19. [Google Scholar]
- Zhang, X.J.; Wang, G.Q.; Xue, B.L.; Yinglan, A. Changes in vegetation cover and its influencing factors in the inner Mongolia reach of the yellow river basin from 2001 to 2018. Environ. Res. 2022, 215, 114253. [Google Scholar] [CrossRef] [PubMed]
- Qian, S.; Lin, Q.; Chen, X. An Improved Method of Spectral Unmixing of Remote Sensing Image and Its Application in Water Pollution Monitoring and Assessing. Geogr. Geo-Inf. Sci. 2003, 19, 36–38. [Google Scholar]
- Fernández-Guisuraga, J.M.; Calvo, L.; Suárez-Seoane, S. Comparison of pixel unmixing models in the evaluation of post-fire forest resilience based on temporal series of satellite imagery at moderate and very high spatial resolution. ISPRS J. Photogramm. Remote Sens. 2020, 164, 217–228. [Google Scholar] [CrossRef]
- Li, F.; Chen, W.; Zeng, Y.; Zhao, Q.; Wu, B. Improving Estimates of Grassland Fractional Vegetation Cover Based on a Pixel Dichotomy Model: A Case Study in Inner Mongolia, China. Remote Sens. 2014, 6, 4705–4722. [Google Scholar] [CrossRef]
- Zhang, Y.; Li, Q.; Su, Y.; Tao, H.; Jiang, Y.; Aihemaiti·Mahemujiang; Wei, J.; Yang, W. Spatial-Temporal Evolution of Vegetation Cover in Santun River Basin from 2000 to 2020 Based on Remote Sensing Monitoring. J. Yangtze River Sci. Res. Inst. 2023, 40, 93–99. [Google Scholar]
- Wang, J.; Xu, C. Geodetector: Principle and prospective. Acta Geogr. Sin. 2017, 72, 116–134. [Google Scholar]
- Zhang, S.; Nie, Y.; Zhang, H.; Li, Y.; Han, Y.; Liu, X.; Wang, B. Spatiotemporal Variation of Vegetation NDVI and its Driving Forces in Inner Mongolia Based on Geodetector. Acta Agrestia Sin. 2020, 28, 1460–1472. [Google Scholar]
- Li, M.; Han, Y.; Zhao, H.; Wang, Y. Analysis on Spatial-temporal Variation Characteristics and Driving Factors of Fractional Vegetation Cover in Ningxia Based on Geographical Detector. Ecol. Environ. Sci. 2022, 31, 1317–1325. [Google Scholar]
- Liu, T.; Sun, H.; Lu, B.; Zhang, L.; Yang, H.; Wu, F. Spatial-temporal Variation and Driving Force Analysis of Vegetation Coverage in the Ili River Valley of Xinjiang from 1998 to 2018. J. North-East For. Univ. 2023, 51, 68. [Google Scholar]
- Gao, H.; Li, Z.; Li, P.; Jia, L.; Xu, G.; Ren, Z.; Pang, G.; Zhao, B. The capacity of soil loss control in the Loess Plateau based on soil erosion control degree. Acta Geogr. Sin. 2015, 70, 1503–1515. [Google Scholar] [CrossRef]
- Zhang, K.; Lyu, Y.; Fu, B.; Yin, L.; Yu, D. The effects of vegetation coverage changes on ecosystem service and their threshold in the Loess Plateau. Acta Geogr. Sin. 2020, 75, 949–960. [Google Scholar]
- Wang, X.; Shi, S.; Chen, J. Change and driving factors of vegetation coverage in the Yellow River Basin. China Environ. Sci. 2022, 42, 5358–5368. [Google Scholar]
- Gou, J.; Wang, F.; Jin, K.; Dong, Q. Cooling effect induced by vegetation restoration on the Loess Plateau. Acta Ecol. Sin. 2018, 38, 3970–3978. [Google Scholar]
- Li, T.; Lu, Y.; Ren, Y.; Li, P. Gauging the effectiveness of vegetation restoration and the influence factors in the Loess Plateau. Acta Ecol. Sin. 2020, 40, 8593–8605. [Google Scholar]
- Yi, L.; Ren, Z.; Chong, Z.; Wen, L. Vegetation Cover, Climate And Human Activities on the Loess Plateau. Resour. Sci. 2014, 36, 166–174. [Google Scholar]
- Bai, J.-j.; Bai, J.-t.; Wang, L. Spatio-temporal Change of Vegetation NDVI and Its Relations with Regional Climate in Northern Shaanxi Province in 2000–2010. Sci. Geogr. Sin. 2014, 34, 882–888. [Google Scholar] [CrossRef]
- Zhang, C.; Bai, Z.; Li, X.; Ran, Q.; Wei, Z.; Lei, T.; Wang, N. Spatio-temporal evolution and attribution analysis of human effects of vegetation cover on the Loess Plateau from 2001 to 2018. Arid. Land Geogr. 2021, 44, 188–196. [Google Scholar]
- Yang, J.; Jin, J.; Shao, J.; Wang, Y. Vegetation Restoration and Its Impact on Runoff in Typical Areas of Middle Loess Plateau. Trans. Chin. Soc. Agric. Mach. 2021, 52, 258. [Google Scholar]
- Zhu, Q.; Zhou, Z.; Liu, T.; Bai, J. Vegetation restoration and ecosystem soil conservation service value increment in Yanhe Watershed, Loess Plateau. Acta Ecol. Sin. 2021, 41, 2557–2570. [Google Scholar]
- Xie, H.; Tong, X.; Li, J.; Zhang, J.; Liu, P.; Yu, P. Changes of NDVI and EVI and their responses to climatic variables in the Yellow River Basin during the growing season of 2000–2018. Acta Ecol. Sin. 2022, 42, 4536–4549. [Google Scholar]
- Liu, Y.; Fu, B. Topographical variation of vegetation cover evolution and the impact of land use/cover change in the Loess Plateau. Arid. Land Geogr. 2013, 36, 1097–1102. [Google Scholar]
- He, Q.; Wang, M.; Liu, K.; Li, K.; Jiang, Z. GPRChinaTemp1km: A high-resolution monthly air temperature data set for China (1951–2020) based on machine learning. Earth Syst. Sci. Data 2022, 14, 3273–3292. [Google Scholar] [CrossRef]
- Peng, S.; Ding, Y.; Li, Z. High-spatial-resolution monthly temperature and precipitation dataset for China for 1901–2017. Earth Syst. Sci. Data Discuss. 2019, 2019, 1–23. [Google Scholar] [CrossRef]
- Trabucco, A.; Zomer, R. Global Aridity Index and Potential Evapotranspiration (ET0) Climate Database v3; Figshare, 2022; Available online: https://figshare.com/articles/dataset/Global_Aridity_Index_and_Potential_Evapotranspiration_ET0_Climate_Database_v2/7504448 (accessed on 19 November 2023).
- Yang, J.; Huang, X. The 30 m annual land cover datasets and its dynamics in China from 1985 to 2022. Earth Syst. Sci. Data 2021, 13, 3907–3925. [Google Scholar] [CrossRef]
- Zhao, N.; Liu, Y.; Cao, G.; Samson, E.L.; Zhang, J. Forecasting China’s GDP at the pixel level using nighttime lights time series and population images. GIScience Remote Sens. 2017, 54, 407–425. [Google Scholar] [CrossRef]
- Li, B.Y.; Li, J.Z. The discovery and ecological cultural value of natural poplar forest in the upper reaches of Wuding River. J. Nat. Resour. 2007, 22, 160. [Google Scholar]
- Li, X.; Huang, C.; Pang, J. Palaeoflood events in the lower reaches of the Wudinghe River. Arid. Land Geogr. 2020, 43, 380–387. [Google Scholar]
- Singh, D.K.; Singh, K.K.; Petropoulos, G.P.; Boaz, P.S.; Jain, P.; Singh, S.; Gupta, D.K.; Sood, V. Spatiotemporal Vegetation Variability and Linkage with Snow-Hydroclimatic Factors in Western Himalaya Using Remote Sensing and Google Earth Engine (GEE). Remote Sens. 2023, 15, 5239. [Google Scholar] [CrossRef]
- Fu, H.; Wang, R.; Wang, X. Analysis of Spatiotemporal Variations and Driving Forces of NDVI in the Yellow River Basin During 1999–2018. Res. Soil Water Conserv. 2022, 29, 145. [Google Scholar]
- Sen, P.K. Estimates of the Regression Coefficient Based on Kendall’s Tau. J. Am. Stat. Assoc. 1968, 63, 1379–1389. [Google Scholar] [CrossRef]
- Cao, R.; Jiang, W.; Yuan, L.; Wang, W.; Lv, Z.; Chen, Z. Inter-annual variations in vegetation and their response to climatic factors in the upper catchments of the Yellow River from 2000 to 2010. J. Geogr. Sci. 2014, 24, 963–979. [Google Scholar] [CrossRef]
- Mamgain, S.; Roy, A.; Karnatak, H.C.; Chauhan, P. Satellite-based long-term spatiotemporal trends of wildfire in the Himalayan vegetation. Nat. Hazards 2023, 116, 3779–3796. [Google Scholar] [CrossRef]
- He, Z.; Yue, T.; Chen, Y.; Mu, W.; Xi, M.; Qin, F. Analysis of Spatial and Temporal Changes in Vegetation Cover and Driving Forces in the Yan River Basin, Loess Plateau. Remote Sens. 2023, 15, 4240. [Google Scholar] [CrossRef]
- Sangnawakij, P. Alternative confidence interval estimation for the mean and coefficient of variation in a two-parameter exponential distribution. J. Stat. Comput. Simul. 2023, 93, 2936–2955. [Google Scholar] [CrossRef]
- Tong, S.; Zhang, J.; Bao, Y.; Lai, Q.; Li, N.; Bao, Y. Analyzing vegetation dynamic trend on the Mongolian Plateau based on the Hurst exponent and influencing factors from 1982–2013. J. Geogr. Sci. 2018, 28, 595–610. [Google Scholar] [CrossRef]
- Feng, X.; Luo, L.; Feng, Z. Hurst index experiment on precipitation change trend and mutation of China in the near 50 years. Arid. Land Geogr. 2009, 32, 859–866. [Google Scholar]
- Tong, B.; Dang, A.; Zhou, H. The historical evolution of urban settlements and man-land coupling inWuding River Basin. J. Nat. Resour. 2021, 36, 38–54. [Google Scholar]
- Yan, M.; Zhang, Y.; He, L.; Cheng, W.; Wang, S.; Xu, J. Blocking effect of upper reaches ofWuding River on desertification. J. Desert Res. 2022, 42, 62–68. [Google Scholar]
- Yang, Y.; Liu, L. Characteristics of gully density in the Wuding river basin and its influencing factors. J. Arid. Land Resour. Environ. 2014, 28, 79–85. [Google Scholar] [CrossRef]
- Wei, X.; Wang, S.; Yuan, X.; Wang, X.; Zhang, B. Spatial and temporal changes and its variation of cultivated land quality in Shaanxi Province. Trans. Chin. Soc. Agric. Eng. 2018, 34, 240–248. [Google Scholar]
- Zhu, J.; Wang, H.; Diao, S.; Gu, Q. Eco-environmental stress evaluation of northeastern Shaanxi Province on a modified correspondence analysis-eco-environmental stress index (ESI) model. J. Beijing Norm. Univ. Nat. Sci. 2016, 52, 466–471. [Google Scholar] [CrossRef]
- Fan, J.; Li, D.; Zhou, H. Variation of fractional vegetation coverage in returning cropland to woodland project zones in Shaanxi Province. Agric. Res. Arid. Areas 2013, 31, 207. [Google Scholar]
- Wang, S.; Huang, Y.; Chen, Z. Remote sensing study of returning farmland to forest or grassland in the Yellow River Basin. J. Tsinghua Univ. (Sci. Technol.) 2005, 45, 306–309. [Google Scholar]
- Yinge, L.I.U. Analysis on the Change Trend of Precipitation in North Shaanxi Province in the Loess Plateau. Arid. Zone Res. 2007, 24, 49–55. [Google Scholar]
- Tavanti, R.F.R.; Queiroz, G.D.; Silva, A.C.D.; Peres, W.M.; Paixao, A.P.; Galindo, F.S.; Silva, V.M.; Bossolani, J.W.; Melero, M.M.; Oliveira, G.D.; et al. Changes in photosynthesis and antioxidant metabolism of cotton (Gossypium hirsutum L.) plants in response to manganese stress. Arch. Agron. Soil Sci. 2020, 66, 743–762. [Google Scholar] [CrossRef]
- Overpeck, J.T.; Breshears, D.D. The growing challenge of vegetation change. Science 2021, 372, 786–787. [Google Scholar] [CrossRef] [PubMed]
- Li, L.; Yang, J.; Jiang, D.; Li, J.; Hou, X. GIS-based study on spatial-temporal changes of land use in Wuding River Basin in the 1990s. Geogr. Res. 2005, 24, 527–534. [Google Scholar]
- Zhao, A.; Tian, X. Spatiotemporal Evolution and Influencing Factors of Vegetation Coverage in the Loess Plateau from 1986 to 2021 Based on GEE Platform. Ecol. Environ. Sci. 2022, 31, 2124–2133. [Google Scholar]
- Li, W.; Lu, C. Effects of ecological building on the vegetation change in Northern Shaanxi Province. Arid. Land Geogr. 2014, 37, 318–324. [Google Scholar]
- Xu, Y.; Sun, H.; Cui, X.; Liu, Y.; Wang, H. Relationship between Restored Vegetation Community and Soil Factors in Daliuta Coal Mine, Shanxi Province. Earth Environ. 2018, 46, 82–88. [Google Scholar]
- Sun, Z.J.; Xie, S.Y. Spatiotemporal variation in net primary productivity and factor detection in Yunnan Province based on geodetector. Shengtaixue Zazhi 2021, 40, 3836–3848. [Google Scholar] [CrossRef]


| Data Classification | Data | Datasets | Resolution | Data Origins |
|---|---|---|---|---|
| Image | Landsat | Landsat 5/7/8 Surface Reflectance Tier 1 | 30 m | https://earthengine.google.com/ |
| Atmospheric data | Temperature | GPRChinaTemp1 km [28] | 1 km | Zenodo (https://zenodo.org/) |
| Land surface temperature | China annual land surface temperature dataset | 1 km | Resource and Environmental Science Data Center (www.resdc.cn) | |
| Precipitation | China monthly gridded precipitation [29] | 1 km | Zenodo (https://zenodo.org/) | |
| Relative humidity | China Relative Humidity Dataset | 1 km | National Earth System Science Data Center (www.geodata.cn) | |
| Sunshine hours | China Sunshine Hours Dataset | 1 km | ||
| Aridity index | Global Aridity Index Dataset [30] | 1 km | CGIAR-CSI—Consortium for Spatial Information (wordpress.com) | |
| Land data | Soil | Soil Type | 1 km | Resource and Environmental Science Data Center (www.resdc.cn) |
| Soil erosion | China Soil erosion Dataset | 1 km | ||
| Digital Elevation Mode | NASADEM | 30 m | Earthdata (www.earthdata.nasa.gov) | |
| Anthropogenic data | Population density | LandScan Global | 1 km | LandScan (landscan.ornl.gov) |
| LC | CLCD [31] | 30 m | Zenodo (https://zenodo.org/) | |
| GDP | ChinaGDP [32] | 1 km |
| Class Name | Classification Criteria |
|---|---|
| Lower | 0 < FVC ≤ 0.2 |
| Low | 0.2 < FVC ≤ 0.4 |
| Mediocre | 0.4 < FVC ≤ 0.6 |
| High | 0.6 < FVC ≤ 0.8 |
| Higher | 0.8 < FVC ≤ 1.0 |
| Class Name | Classification Criteria |
|---|---|
| Lower | 0 < ≤ 0.05 |
| Low | 0.05 < ≤ 0.10 |
| Mediocre | 0.1 < ≤ 0.15 |
| High | 0.15 < ≤ 0.20 |
| Higher | > 0.20 |
| Type of Change | Classification Criteria |
|---|---|
| Anti-persistence | 0 < Hurst < 0.5 |
| Random | Hurst = 0.5 |
| Persistence | 0.5 < Hurst < 1.0 |
| Type of Detector | Function of Detector |
|---|---|
| Factor detector | Detecting the extent to which a factor X explains the spatial dissimilarity of an attribute Y. |
| Interaction detector | Identify interactions between different influences on factor X, i.e., assess whether factors X1 and X2, acting together, increase or decrease the explanatory power of the dependent variable Y. |
| Risk detector | Determine whether the mean values of the attributes of the corresponding independent variable Y are significantly different in different intervals of the X factor. |
| Ecological detector | Compare whether there is a significant difference between the effects of the two factors X1 and X2 on the spatial distribution of attribute Y. |
| Data Classification | Factor | Unit |
|---|---|---|
| Atmospheric factor | Temperature | °C |
| Land surface temperature | °C | |
| Precipitation | mm | |
| Relative humidity | % | |
| Sunshine hours | h | |
| Aridity index | - | |
| Land factor | Soil | - |
| Soil erosion | - | |
| Slope | ° | |
| DEM | m | |
| Anthropogenic factor | Population density | persons/km2 |
| LC | - | |
| GDP | million CNY |
| 2000 | 2022 | ||||||
|---|---|---|---|---|---|---|---|
| Lower | Low | Mediocre | High | Higher | Total | Roll-Out | |
| Lower | 3756.43 | 6031.05 | 2980.51 | 426.45 | 269.33 | 13,463.76 | 9707.33 |
| Low | 599.02 | 3869.46 | 5650.22 | 1354.38 | 335.70 | 11,808.78 | 7939.32 |
| Mediocre | 89.97 | 659.87 | 1560.47 | 782.02 | 253.74 | 3346.07 | 1785.60 |
| High | 28.69 | 107.89 | 249.38 | 310.10 | 215.77 | 911.83 | 601.73 |
| Higher | 38.70 | 68.54 | 96.14 | 220.96 | 306.21 | 730.55 | 424.34 |
| Total | 4512.82 | 10,736.81 | 10,536.72 | 3093.91 | 1380.75 | ||
| Roll-in | 756.39 | 6867.35 | 8976.24 | 2783.81 | 1074.53 | ||
| Variation | −8950.95 | −4941.43 | 5360.17 | 1871.98 | 343.98 | ||
| Factor | Tem | LST | Pre | RH | SD | Aridity Index | Soil | Soil Erosion | Elevation | Slope | Pop | LC | GDP |
|---|---|---|---|---|---|---|---|---|---|---|---|---|---|
| q | 0.064 | 0.111 | 0.133 | 0.097 | 0.123 | 0.121 | 0.117 | 0.056 | 0.088 | 0.038 | 0.108 | 0.345 | 0.011 |
| p | 0.000 | 0.000 | 0.000 | 0.000 | 0.000 | 0.000 | 0.000 | 0.000 | 0.000 | 0.000 | 0.000 | 0.000 | 0.000 |
| Factor | Tem | LST | Pre | RH | SD | Aridity Index | Soil | Soil Erosion | Elevation | Slope | Pop | LC | GDP |
|---|---|---|---|---|---|---|---|---|---|---|---|---|---|
| Tem | |||||||||||||
| LST | Y | ||||||||||||
| Pre | Y | Y | |||||||||||
| RH | Y | N | Y | ||||||||||
| SD | Y | Y | N | Y | |||||||||
| Aridity index | Y | Y | Y | Y | N | ||||||||
| Soil | Y | Y | Y | Y | N | N | |||||||
| Soil erosion | N | Y | Y | Y | Y | Y | Y | ||||||
| Elevation | Y | N | Y | N | Y | Y | Y | Y | |||||
| Slope | Y | Y | Y | Y | Y | Y | Y | N | Y | ||||
| Pop | Y | N | Y | N | N | N | N | Y | Y | Y | |||
| LC | Y | Y | Y | Y | Y | Y | Y | Y | Y | Y | Y | ||
| GDP | Y | Y | Y | Y | Y | Y | Y | Y | Y | Y | Y | Y |
| Driven Factor | Suitable Type or Range of FVC | FVC |
|---|---|---|
| Tem | 18.0–20.0 °C | 0.486 |
| LST | 19.5–20.3 °C | 0.427 |
| Pre | 601–648 mm | 0.470 |
| RH | 53.4%–54.4% | 0.421 |
| SD | 7.86–8.07 h | 0.490 |
| Aridity index | 58%–66% | 0.441 |
| Soil | irrigation-silting soil | 0.647 |
| Soil erosion | 1.5%–5.1% | 0.416 |
| Elevation | 850–990 m | 0.491 |
| Slope | 18.6–22.8° | 0.412 |
| Pop | 32–59 persons/km2 | 0.429 |
| LC | cropland | 0.575 |
| GDP | 0.93–2.58 | 0.391 |
Disclaimer/Publisher’s Note: The statements, opinions and data contained in all publications are solely those of the individual author(s) and contributor(s) and not of MDPI and/or the editor(s). MDPI and/or the editor(s) disclaim responsibility for any injury to people or property resulting from any ideas, methods, instructions or products referred to in the content. |
© 2023 by the authors. Licensee MDPI, Basel, Switzerland. This article is an open access article distributed under the terms and conditions of the Creative Commons Attribution (CC BY) license (https://creativecommons.org/licenses/by/4.0/).
Share and Cite
Zhang, H.; He, Z.; Xu, J.; Mu, W.; Chen, Y.; Wang, G. Analysis of Spatial and Temporal Changes in Vegetation Cover and Driving Forces in the Wuding River Basin, Loess Plateau. Forests 2024, 15, 82. https://doi.org/10.3390/f15010082
Zhang H, He Z, Xu J, Mu W, Chen Y, Wang G. Analysis of Spatial and Temporal Changes in Vegetation Cover and Driving Forces in the Wuding River Basin, Loess Plateau. Forests. 2024; 15(1):82. https://doi.org/10.3390/f15010082
Chicago/Turabian StyleZhang, Hao, Zhilin He, Junkui Xu, Weichen Mu, Yanglong Chen, and Guangxia Wang. 2024. "Analysis of Spatial and Temporal Changes in Vegetation Cover and Driving Forces in the Wuding River Basin, Loess Plateau" Forests 15, no. 1: 82. https://doi.org/10.3390/f15010082
APA StyleZhang, H., He, Z., Xu, J., Mu, W., Chen, Y., & Wang, G. (2024). Analysis of Spatial and Temporal Changes in Vegetation Cover and Driving Forces in the Wuding River Basin, Loess Plateau. Forests, 15(1), 82. https://doi.org/10.3390/f15010082