
Spatiotemporal Variation in Vegetation and Its Driving Mechanisms in the Southwest Alpine Canyon Area of China

Abstract
:1. Introduction
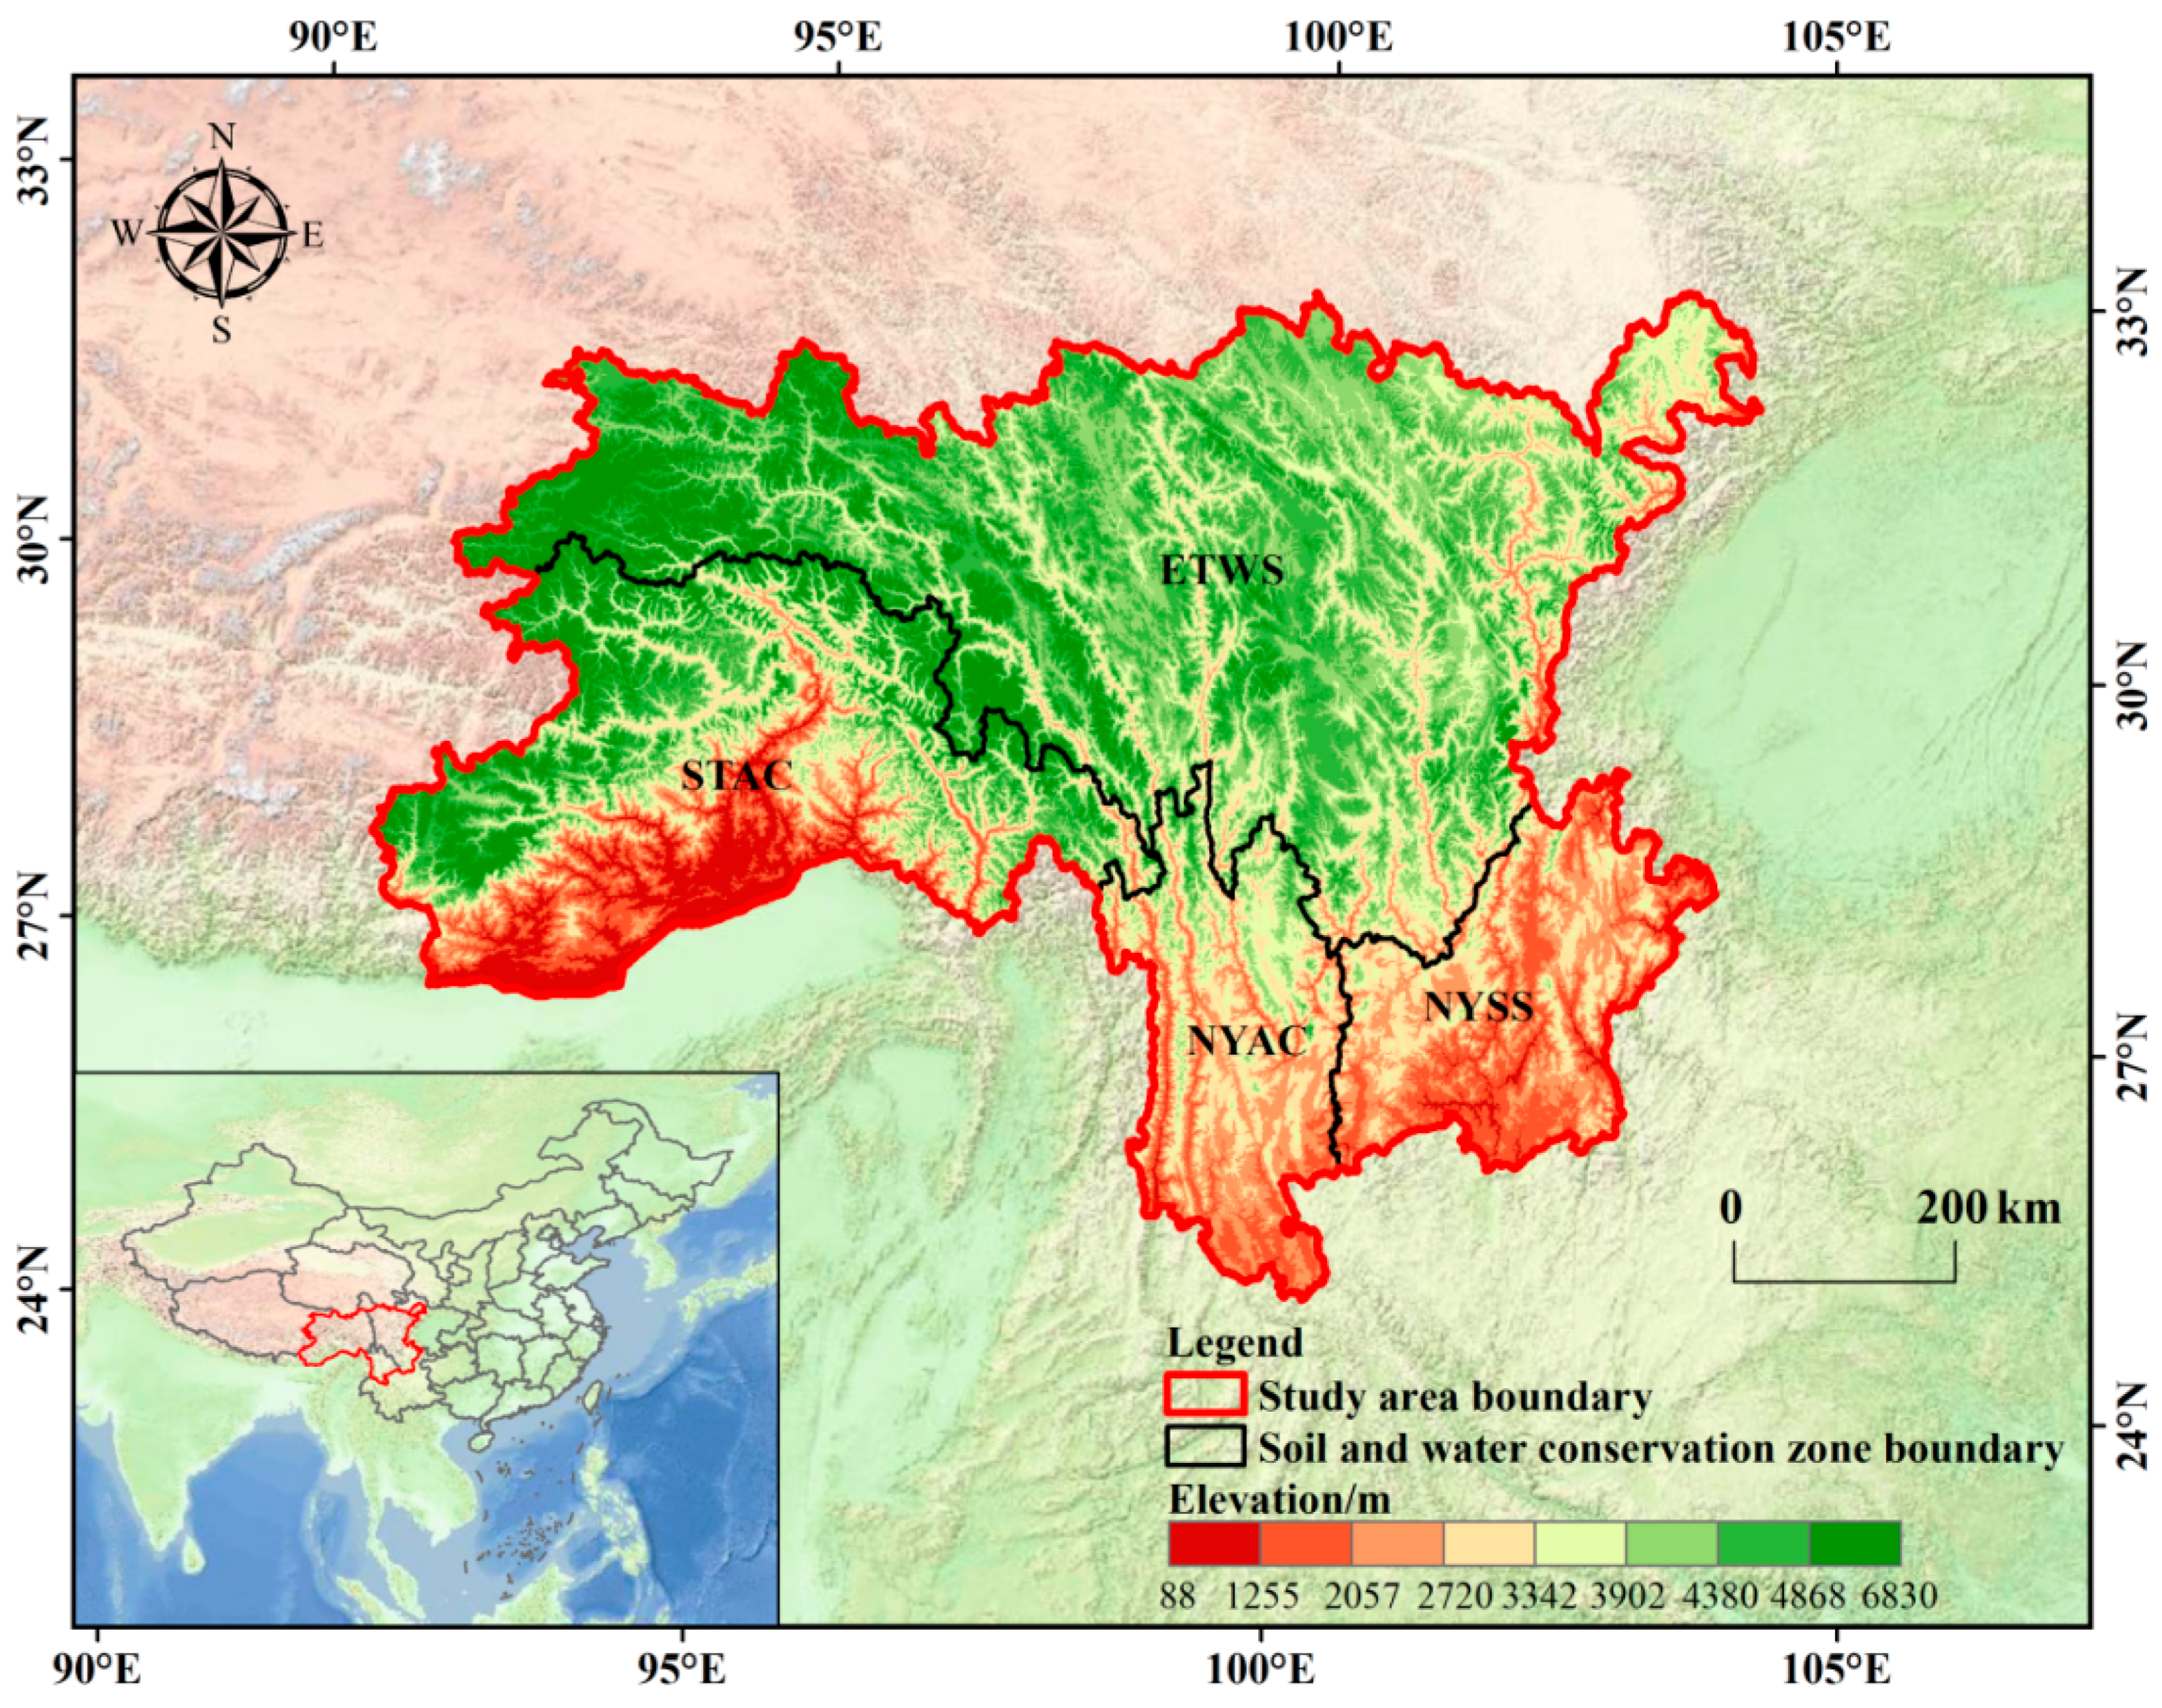
2. Study Area
3. Data and Methods
3.1. Data Sources and Processing
3.2. Methods
3.2.1. The Trends Analysis
3.2.2. Correlation Analysis
3.2.3. Geographical Detector Model
3.2.4. Residual Analysis Model and Calculation of Relative Contribution
4. Results and Analysis
4.1. Characteristics of Spatiotemporal Variations in NDVI
4.1.1. Spatial Distribution Pattern in NDVI
4.1.2. Temporal Variation Characteristics in NDVI
4.2. Characteristics of Climate Change and the Correlation Analysis of NDVI Change
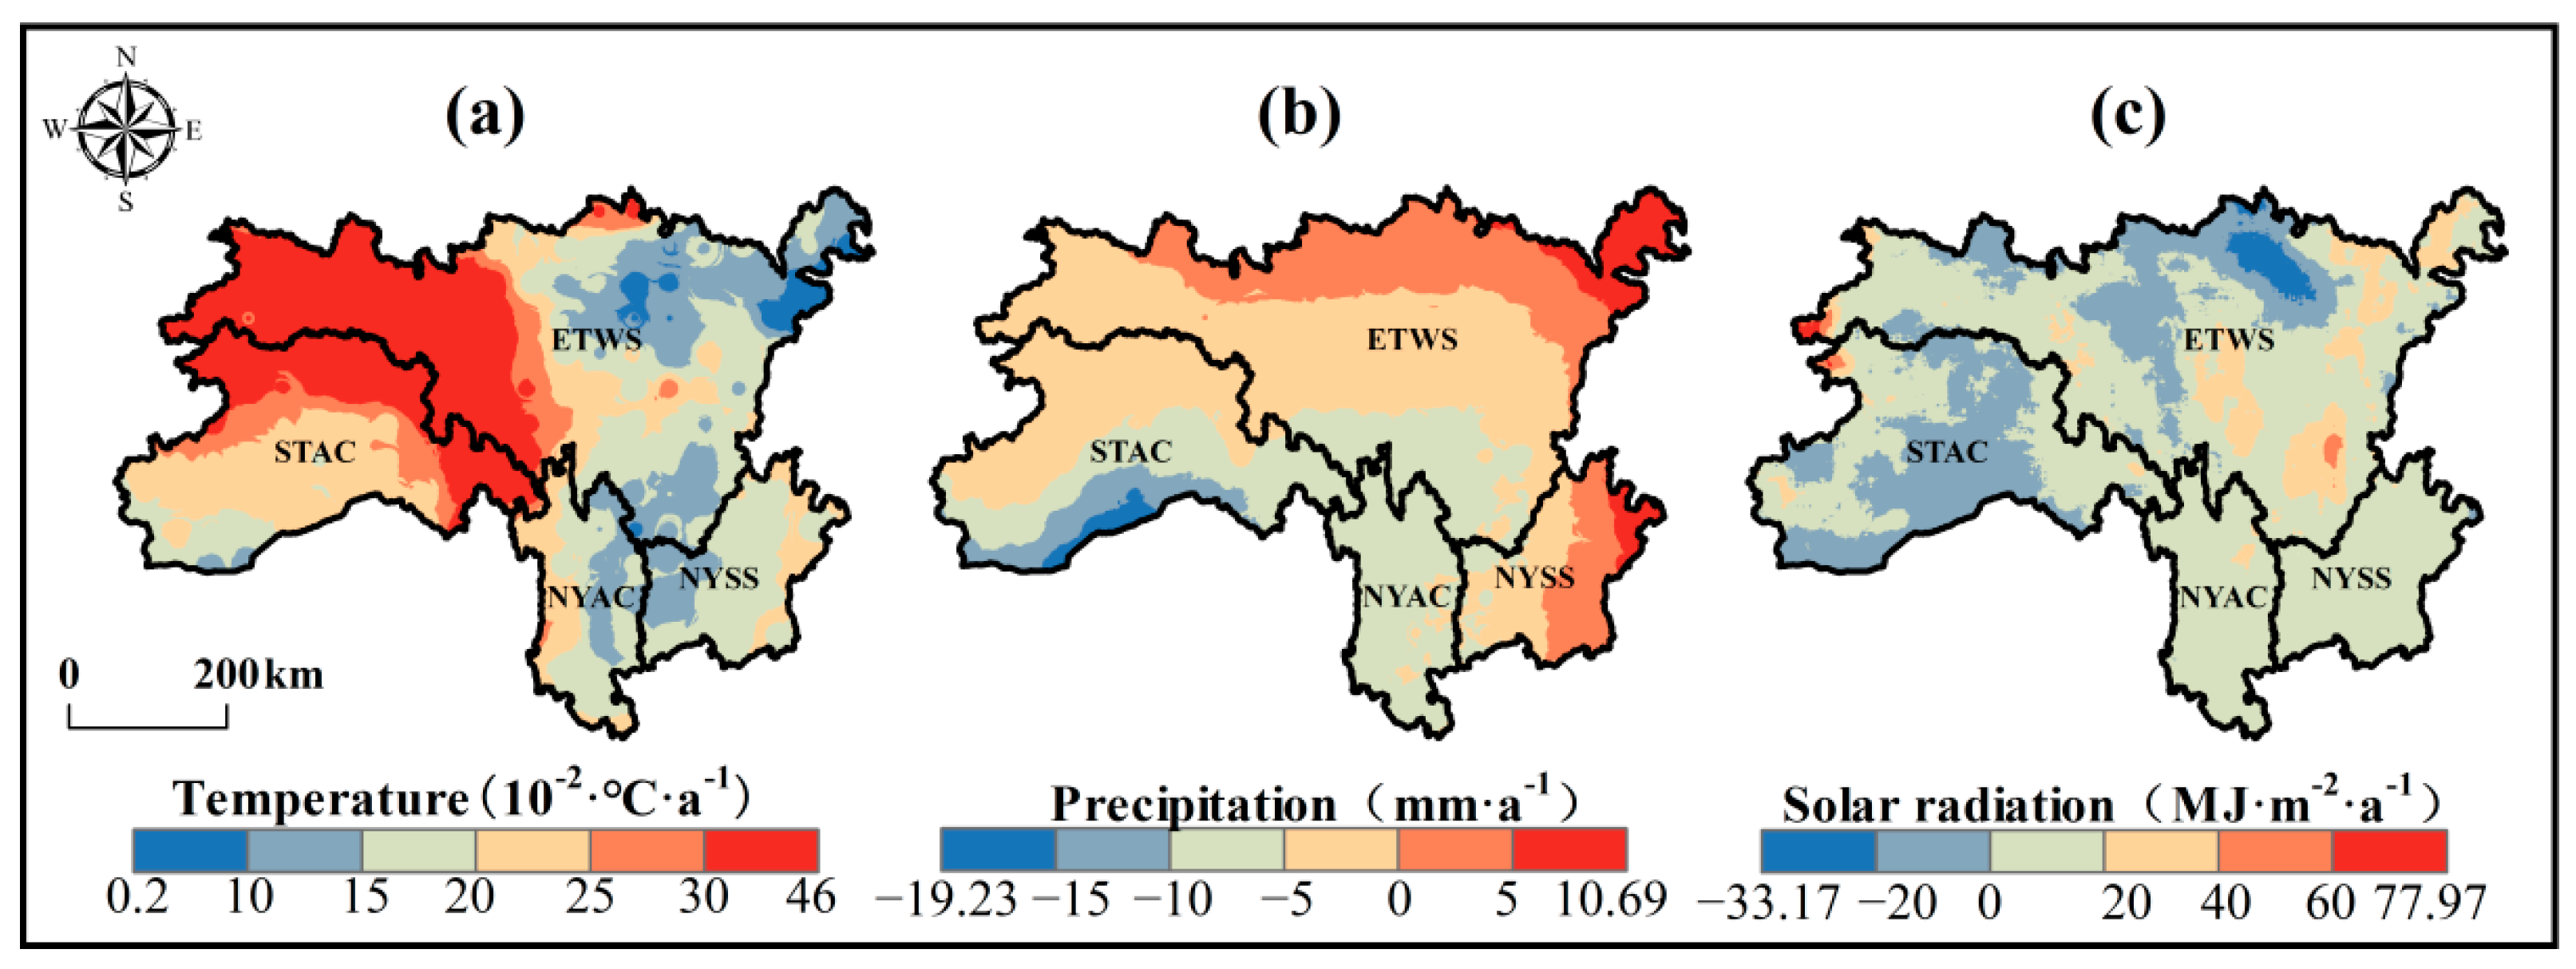
4.2.1. Spatiotemporal Variation Characteristics of Climate Factors
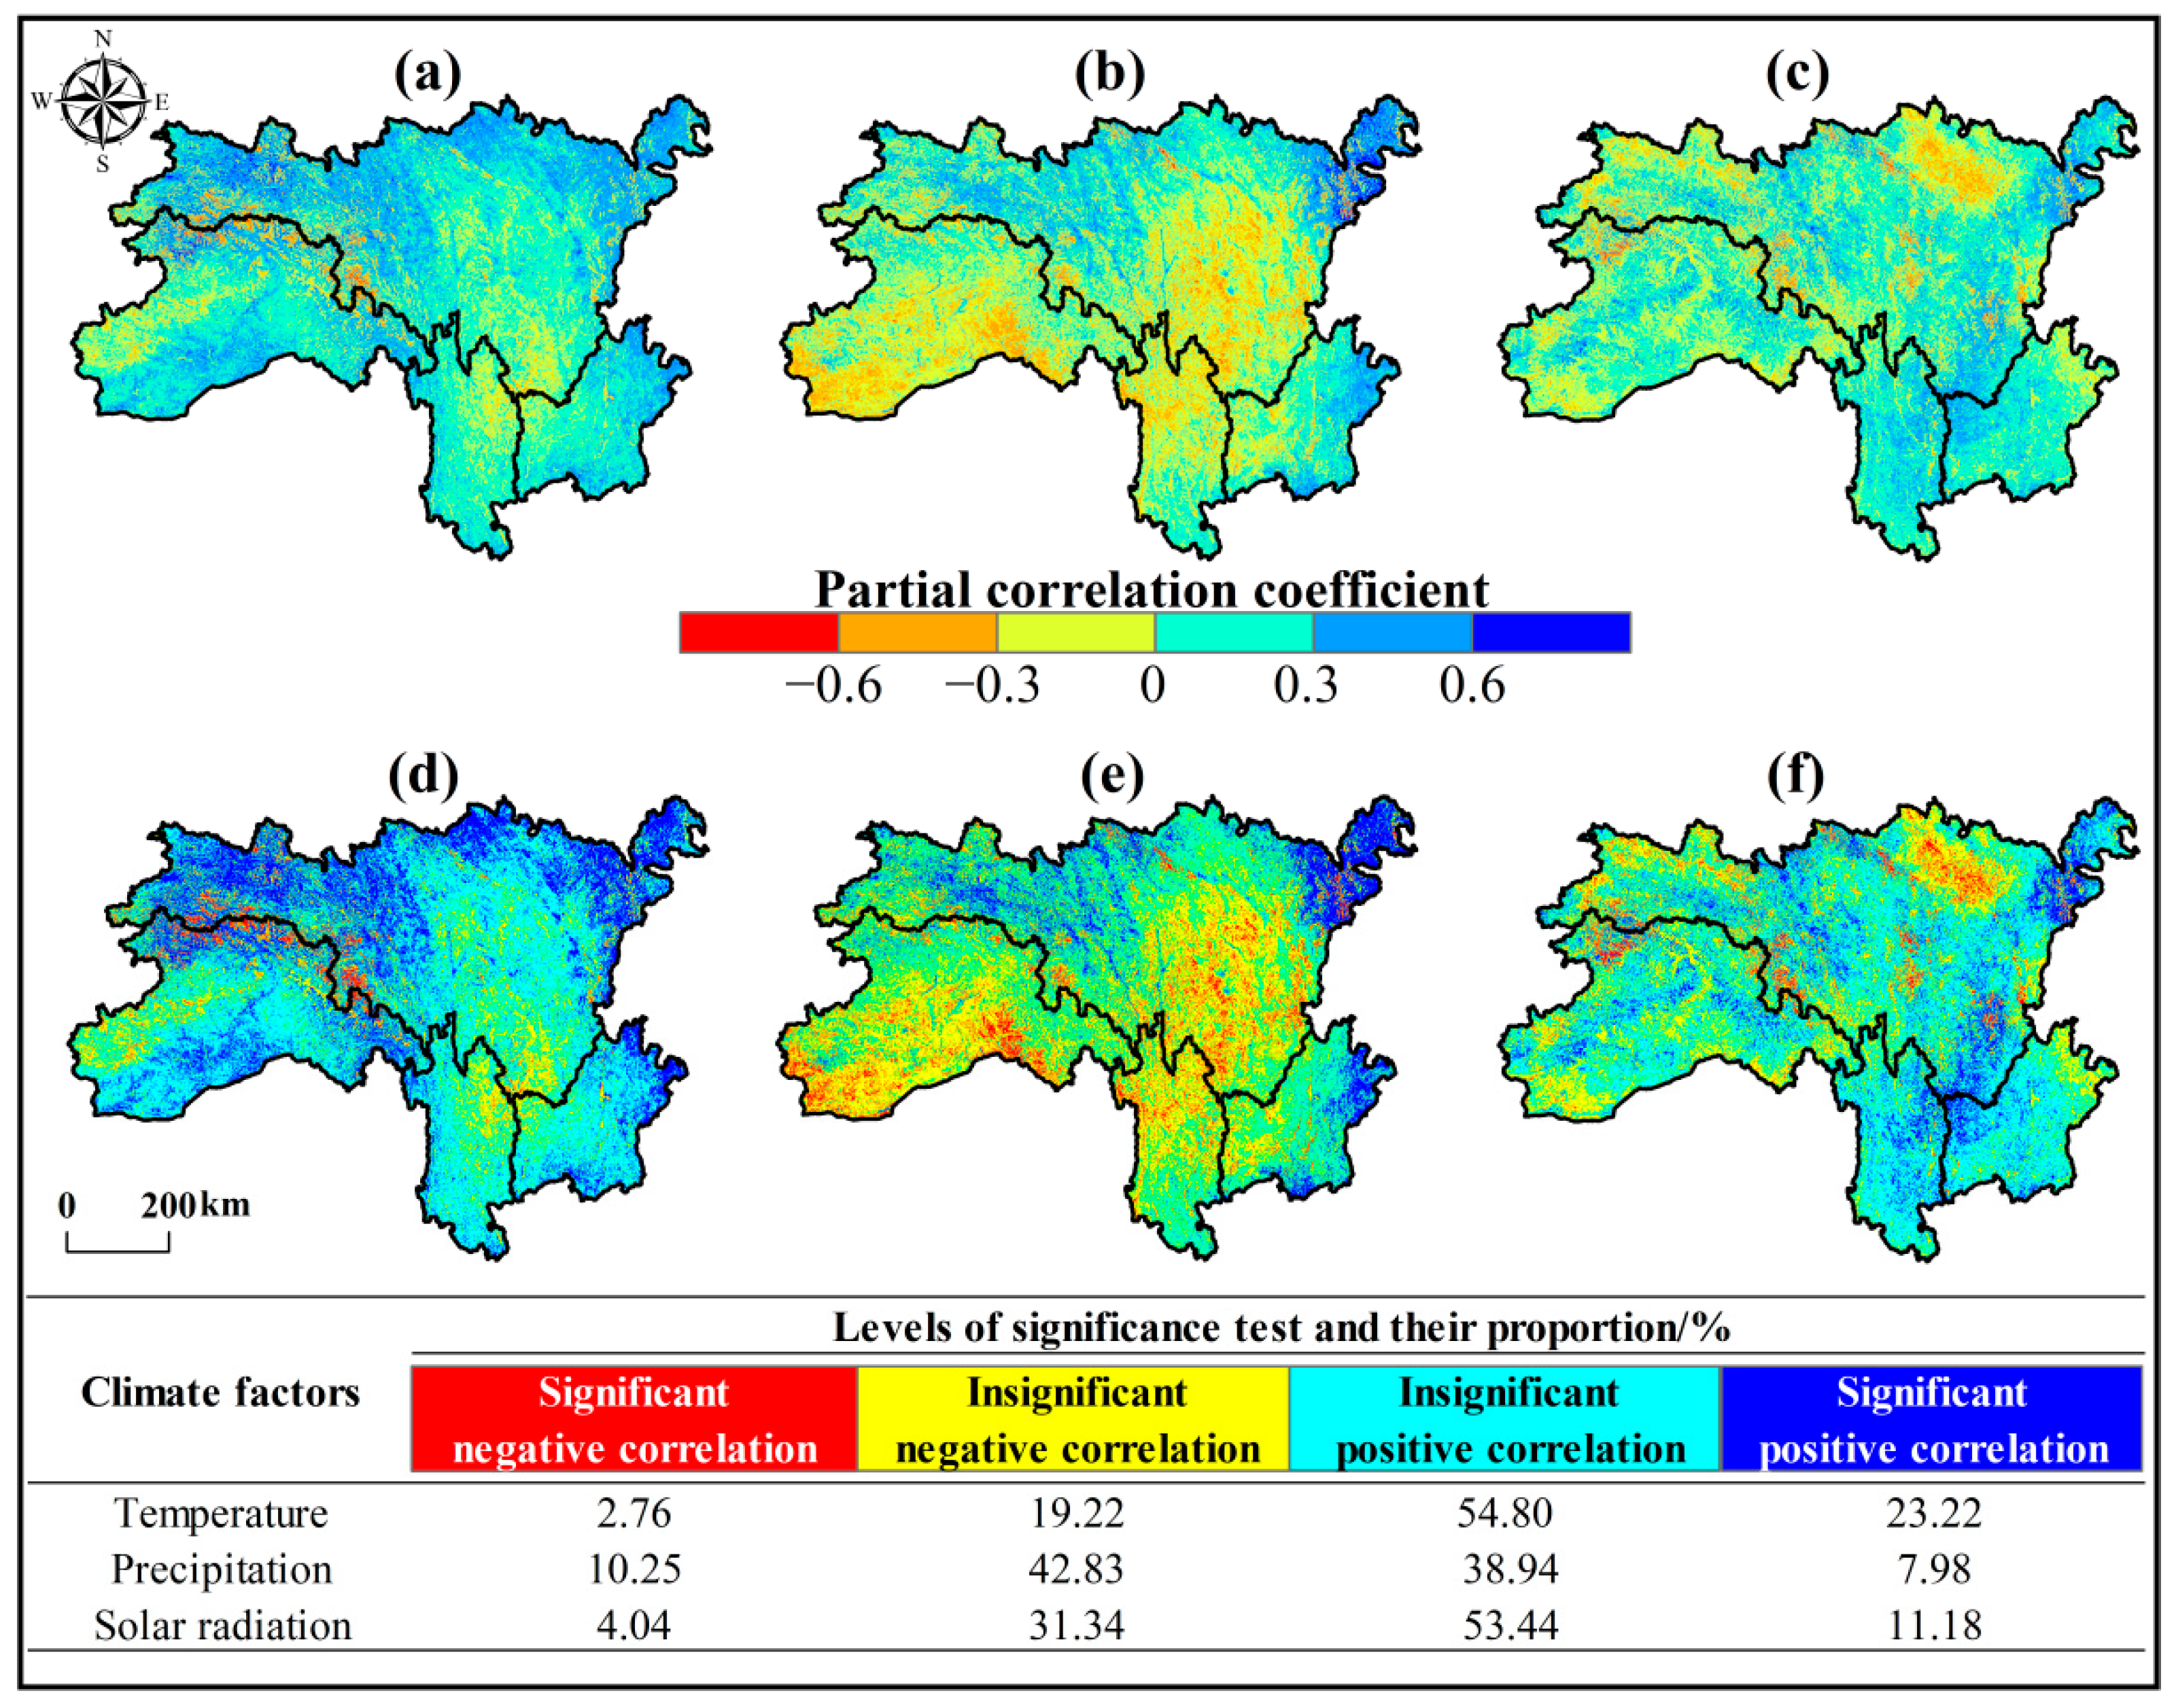
4.2.2. Correlation Analysis between Climate Factors and NDVI
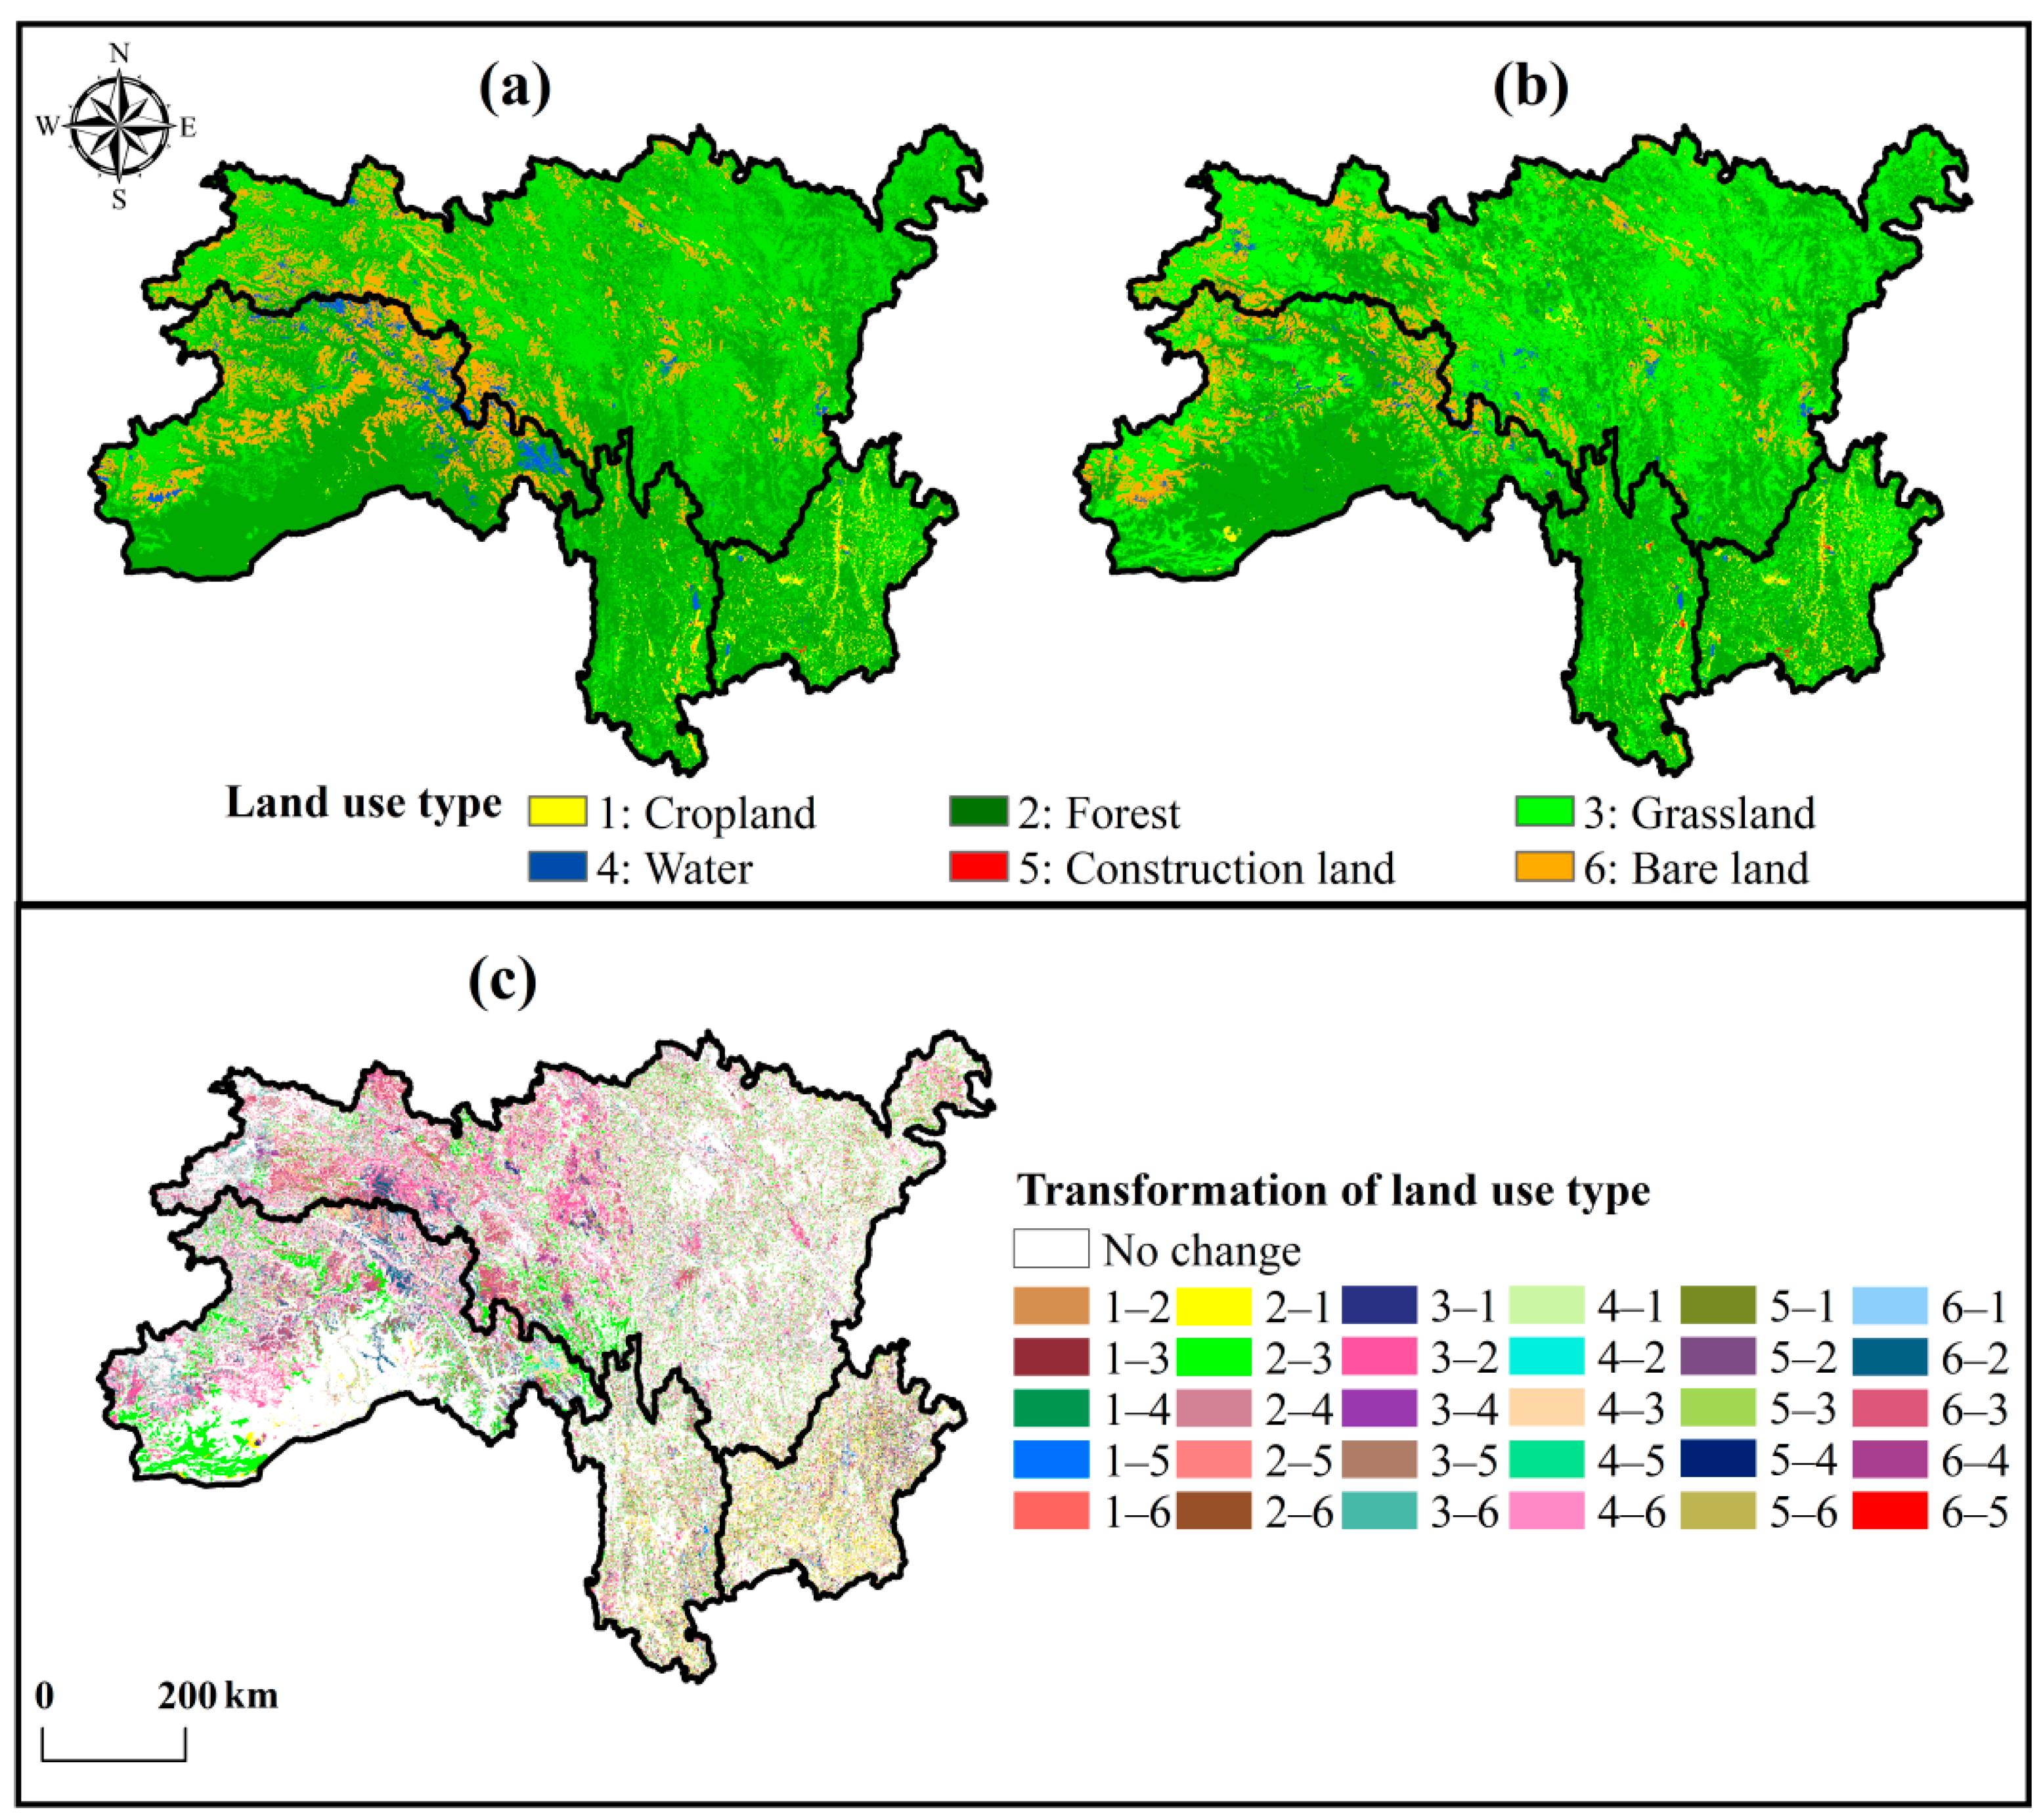
4.3. Analysis of Land Use Type Change
4.4. Detection of Factors Influencing the Spatial Heterogeneity of NDVI
4.4.1. Single Factor Detection
4.4.2. Interaction Detection
4.5. Impacts of Climate Change and Human Activities on NDVI Changes
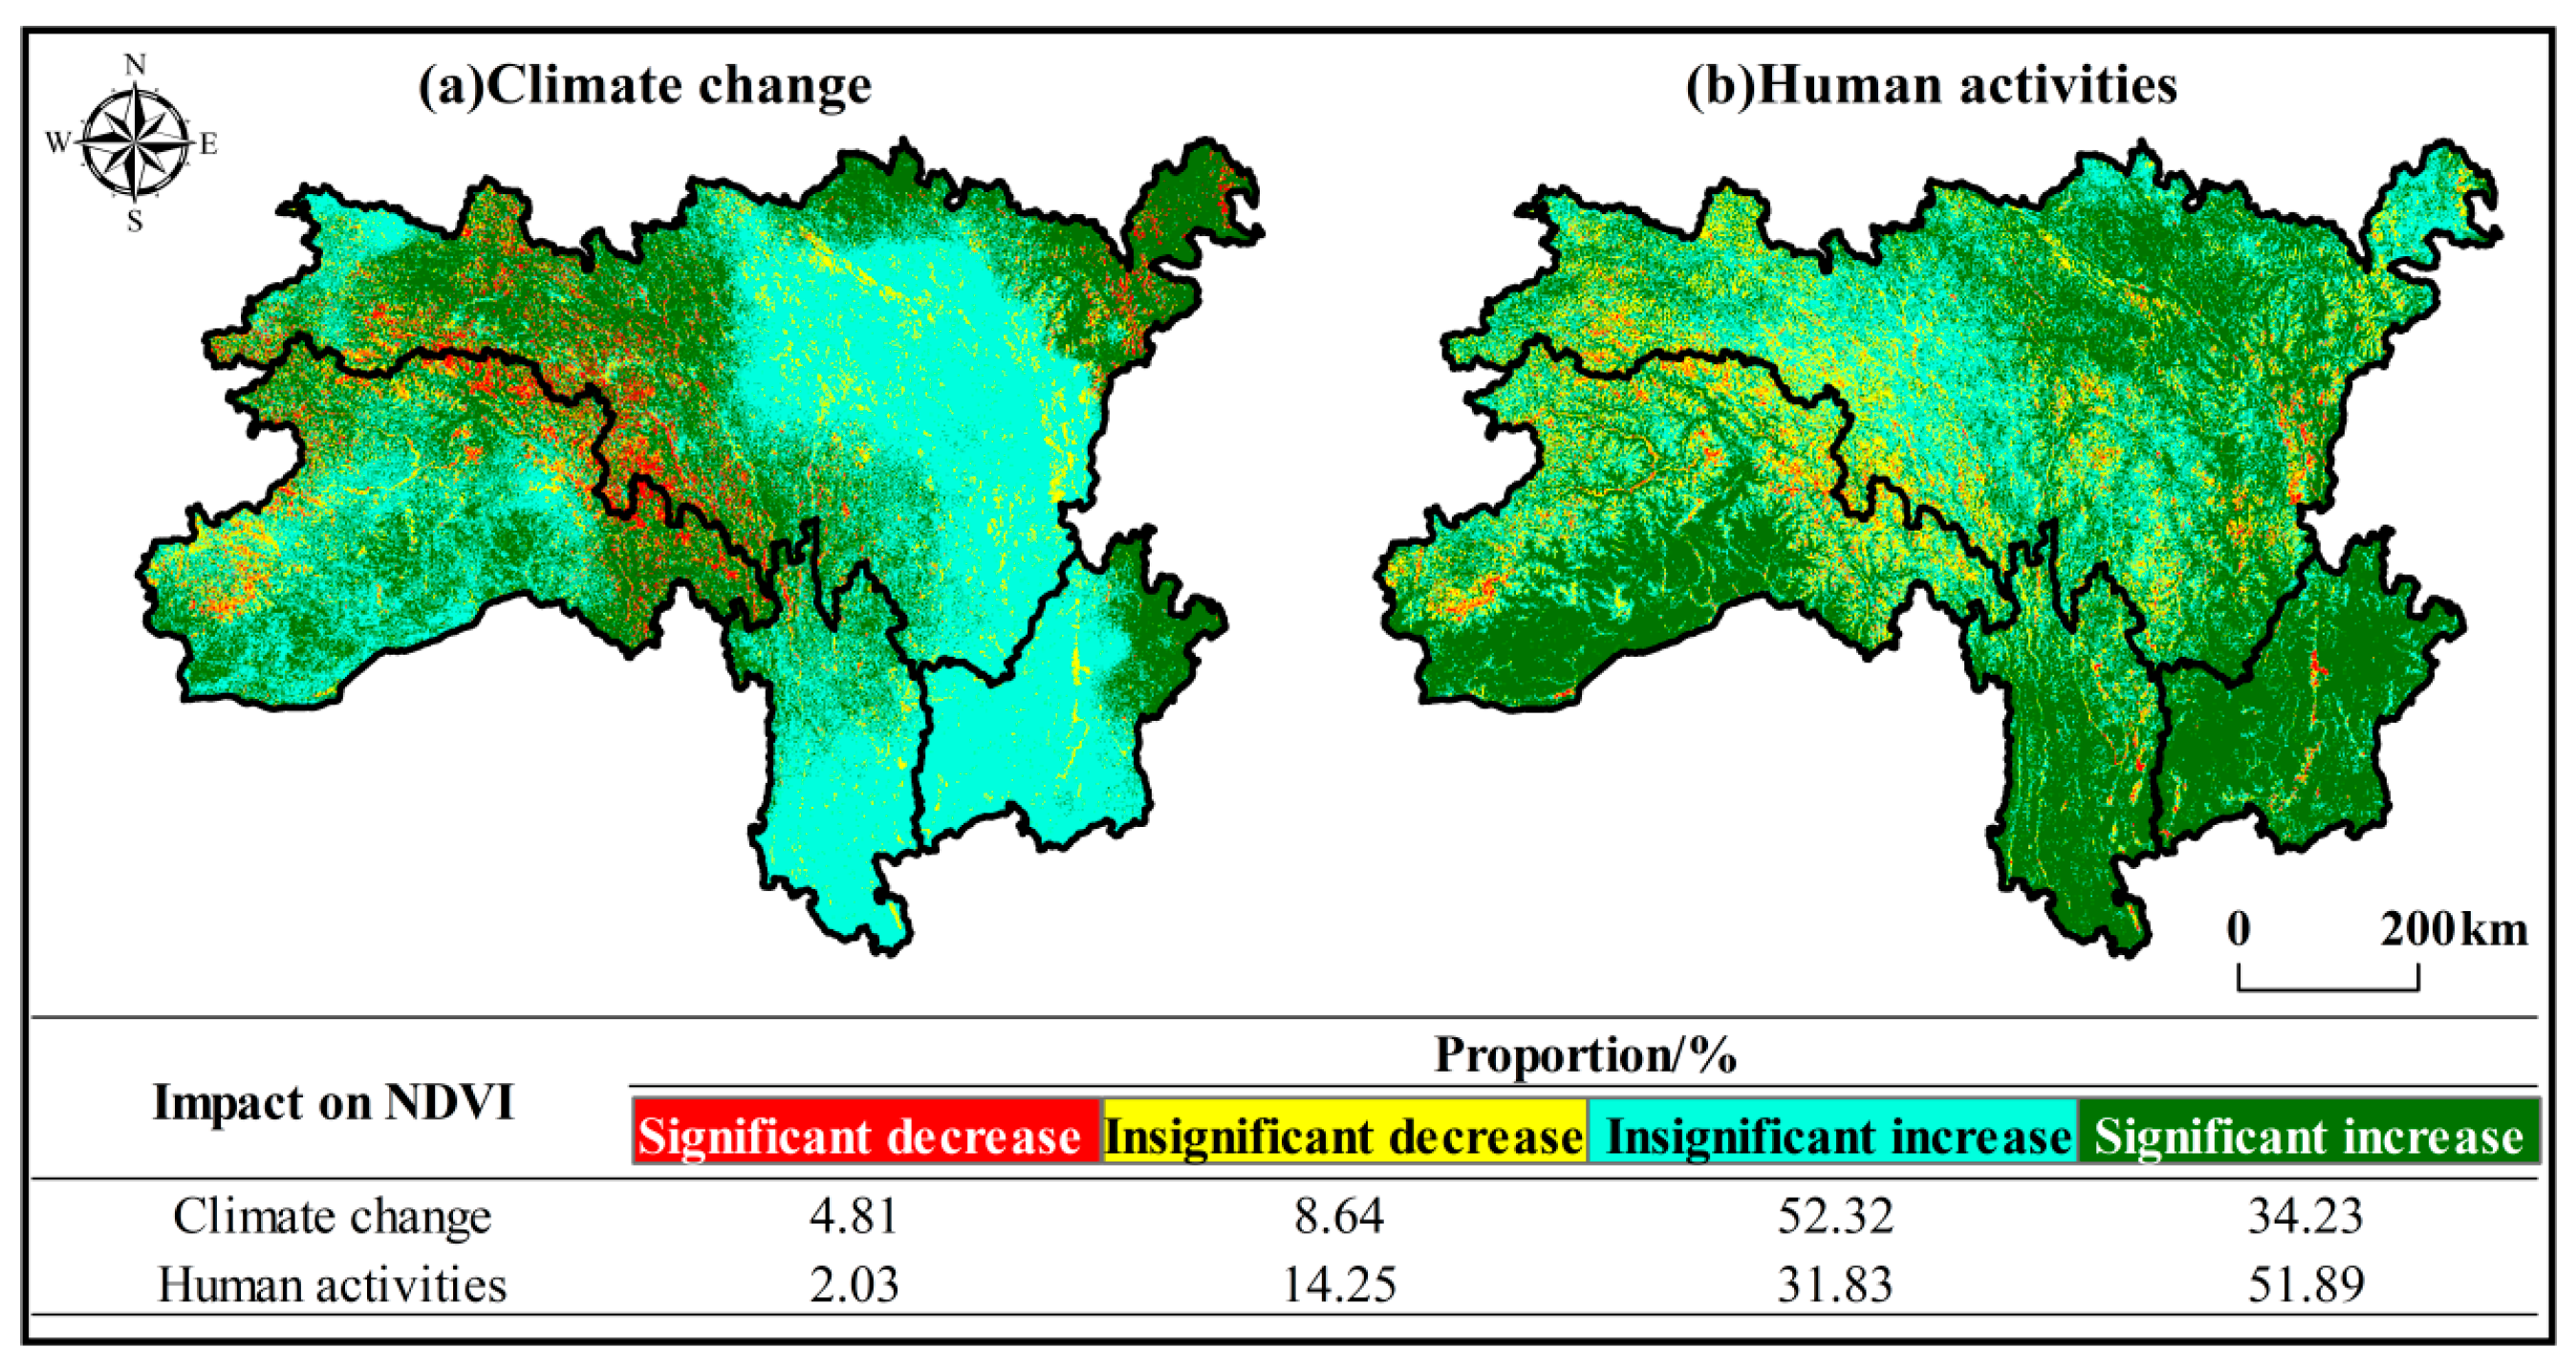
4.5.1. Changes in NDVI under the Influence of Climate Change and Human Activities
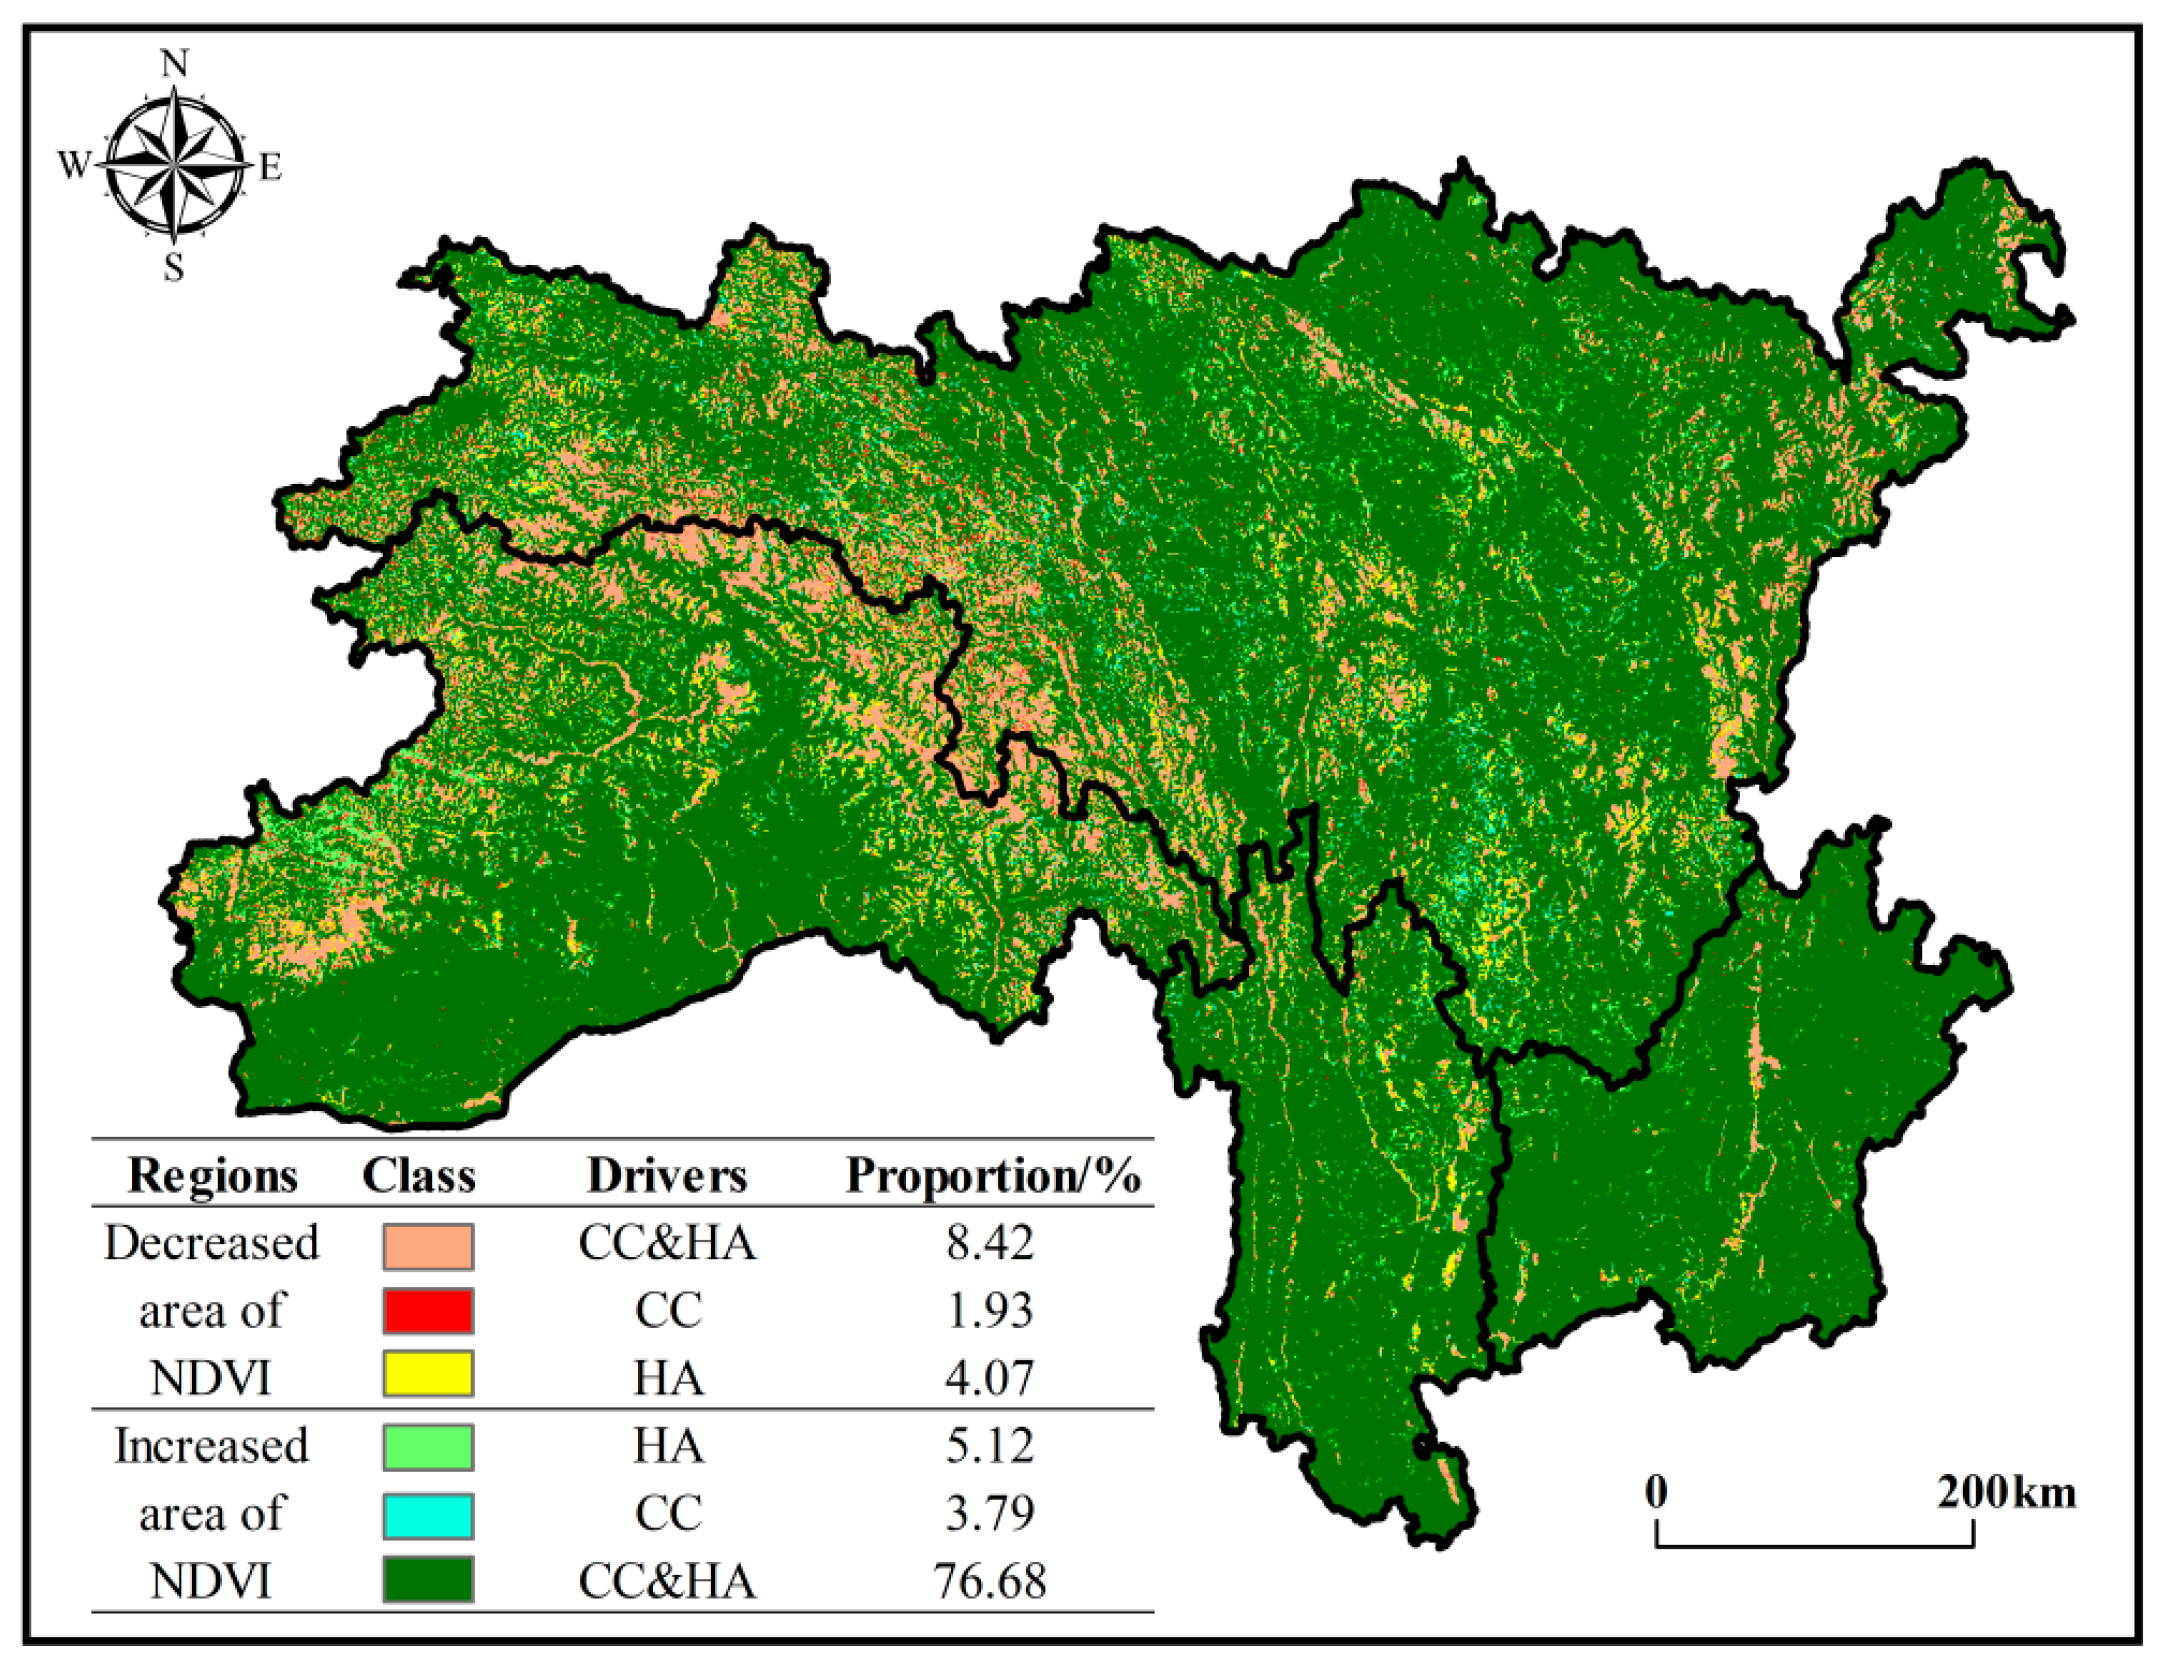
4.5.2. Driving Mechanism of NDVI Changes
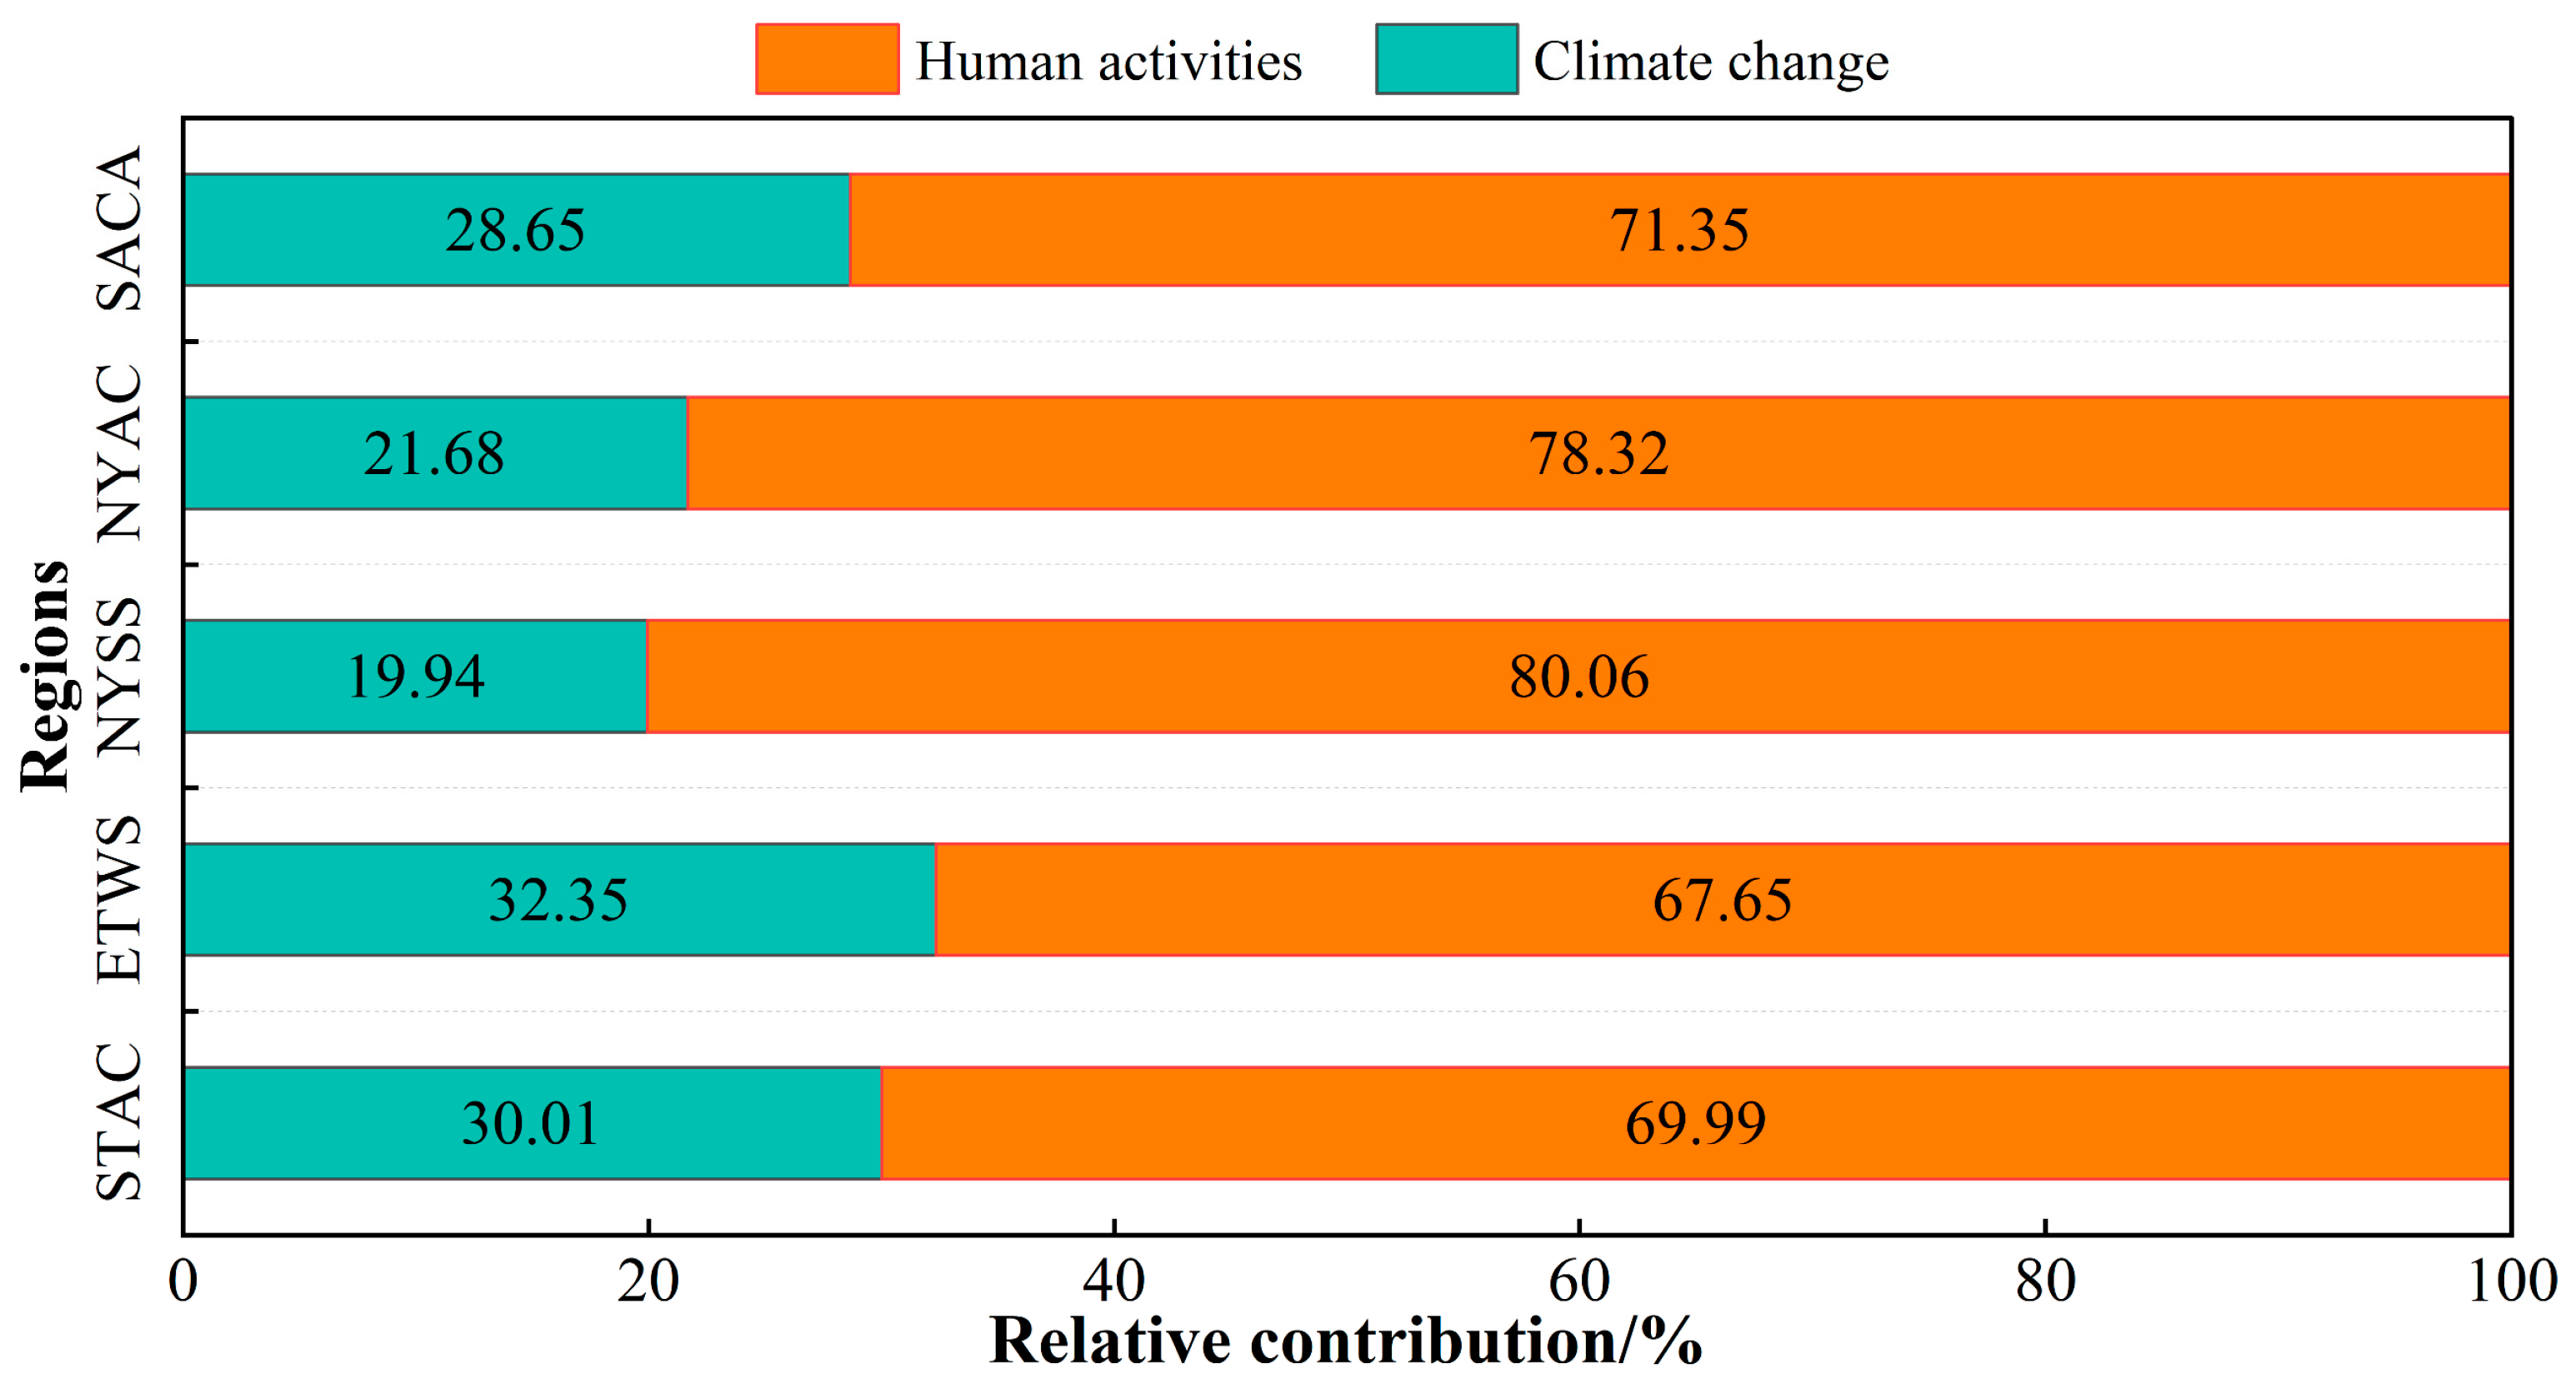
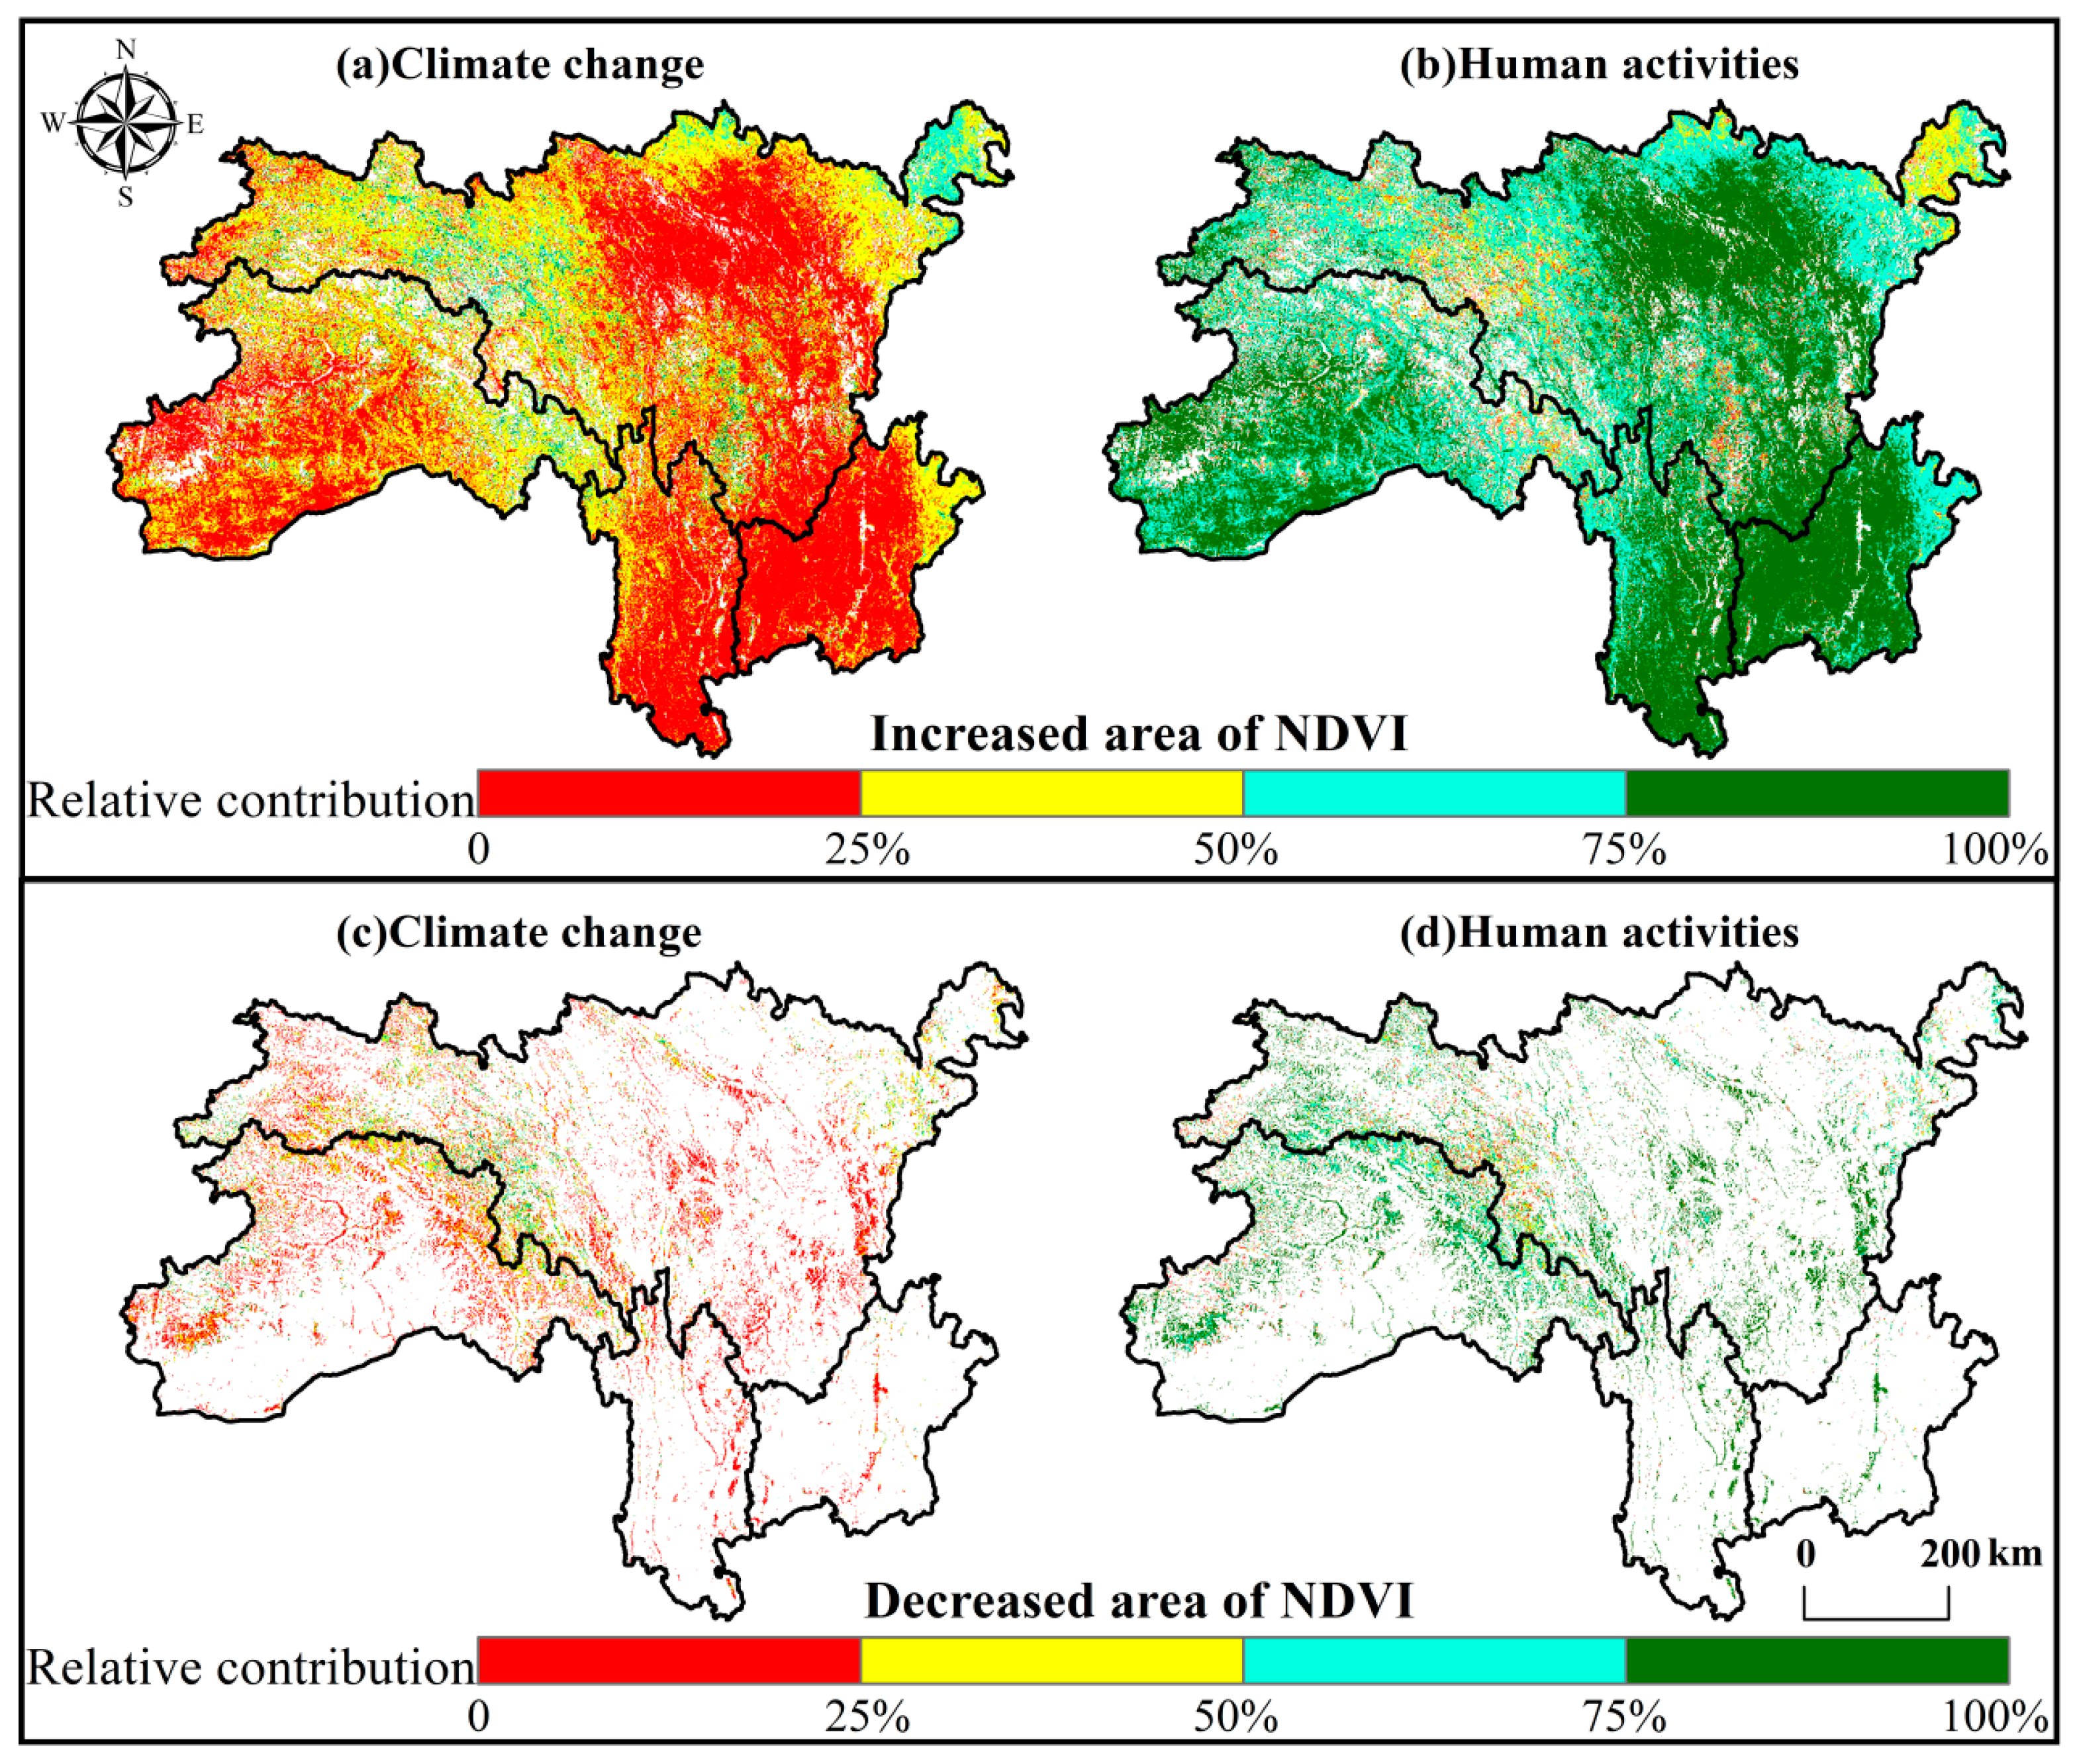
4.5.3. The Relative Contributions of Climate Change and Human Activities to NDVI Changes
5. Discussion
6. Conclusions
Author Contributions
Funding
Data Availability Statement
Conflicts of Interest
References
- Slayback, D.A.; Pinzon, J.E.; Los, S.O.; Tucker, C.J. Northern hemisphere photosynthetic trends 1982–1999. Glob. Chang. Biol. 2002, 9, 1–15. [Google Scholar] [CrossRef]
- Loisel, J.; Yu, Z. Surface vegetation patterning controls carbon accumulation in peatlands. Geophys. Res. Lett. 2013, 40, 5508–5513. [Google Scholar] [CrossRef]
- Wang, B.; Jia, K.; Wei, X.; Xia, M.; Yao, Y.; Zhang, X.; Liu, D.; Tao, G. Generating spatiotemporally consistent fractional vegetation cover at different scales using spatiotemporal fusion and multiresolution tree methods. ISPRS J. Photogramm. Remote Sens. 2020, 167, 214–229. [Google Scholar] [CrossRef]
- Morecroft, M.D.; Duffield, S.; Harley, M.; Pearce-Higgins, J.W.; Stevens, N.; Watts, O.; Whitaker, J. Measuring the success of climate change adaptation and mitigation in terrestrial ecosystems. Science 2019, 366, eaaw9256. [Google Scholar] [CrossRef]
- Fensholt, R.; Proud, S.R. Evaluation of Earth Observation based global long term vegetation trends—Comparing GIMMS and MODIS global NDVI time series. Remote Sens. Environ. 2012, 119, 131–147. [Google Scholar] [CrossRef]
- Zhao, Y.; Feng, Q. Identifying the spatiotemporal pattern and driving factors of vegetation dynamics in Shaanxi Province, China. Geocarto Int. 2022, 37, 17890–17916. [Google Scholar] [CrossRef]
- Zhang, S.; Ye, L.; Huang, C.; Wang, M.; Yang, Y.; Wang, T.; Tan, W. Evolution of vegetation dynamics and its response to climate in ecologically fragile regions from 1982 to 2020: A case study of the Three Gorges Reservoir area. CATENA 2022, 219, 106601. [Google Scholar] [CrossRef]
- Huang, J.; Minasny, B.; McBratney, A.B.; Padarian, J.; Triantafilis, J. The location- and scale- specific correlation between temperature and soil carbon sequestration across the globe. Sci. Total Environ. 2018, 615, 540–548. [Google Scholar] [CrossRef]
- Zhong, W.; Chu, T.; Tissot, P.; Wu, Z.; Chen, J.; Zhang, H. Integrated coastal subsidence analysis using InSAR, LiDAR, and land cover data. Remote Sens. Environ. 2022, 282, 113297. [Google Scholar] [CrossRef]
- Li, Y.; Xie, Z.; Qin, Y.; Zheng, Z. Responses of the Yellow River basin vegetation: Climate change. Int. J. Clim. Chang. Strat. Manag. 2019, 11, 483–498. [Google Scholar] [CrossRef]
- Shi, S.; Yu, J.; Wang, F.; Wang, P.; Zhang, Y.; Jin, K. Quantitative contributions of climate change and human activities to vegetation changes over multiple time scales on the Loess Plateau. Sci. Total Environ. 2021, 755, 142419. [Google Scholar] [CrossRef] [PubMed]
- Cleland, E.E.; Chuine, I.; Menzel, A.; Mooney, H.A.; Schwartz, M.D. Shifting plant phenology in response to global change. Trends Ecol. Evol. 2007, 22, 357–365. [Google Scholar] [CrossRef] [PubMed]
- Myers-Smith, I.H.; Kerby, J.T.; Phoenix, G.K.; Bjerke, J.W.; Epstein, H.E.; Assmann, J.J.; John, C.; Andreu-Hayles, L.; Angers-Blondin, S.; Beck, P.S.A.; et al. Complexity revealed in the greening of the Arctic. Nat. Clim. Chang. 2019, 10, 106–117. [Google Scholar] [CrossRef]
- Cui, X.; Xu, G.; He, X.; Luo, D. Influences of Seasonal Soil Moisture and Temperature on Vegetation Phenology in the Qilian Mountains. Remote Sens. 2022, 14, 3645. [Google Scholar] [CrossRef]
- Braswell, B.H.; Schimel, D.S.; Linder, E.; Moore, B., III. The response of global terrestrial ecosystems to interannual temperature variability. Science 1997, 278, 870–873. [Google Scholar] [CrossRef]
- Baumbach, L.; Siegmund, J.F.; Mittermeier, M.; Donner, R.V. Impacts of temperature extremes on European vegetation during the growing season. Biogeosciences 2017, 14, 4891–4903. [Google Scholar] [CrossRef]
- Zhao, J.; Huang, S.; Huang, Q.; Wang, H.; Leng, G.; Fang, W. Time-lagged response of vegetation dynamics to climatic and teleconnection factors. CATENA 2020, 189, 104474. [Google Scholar] [CrossRef]
- Gong, X.; Du, S.; Li, F.; Ding, Y. Study of mesoscale NDVI prediction models in arid and semiarid regions of China under changing environments. Ecol. Indic. 2021, 131, 108198. [Google Scholar] [CrossRef]
- Ma, Y.; Guan, Q.; Sun, Y.; Zhang, J.; Yang, L.; Yang, E.; Li, H.; Du, Q. Three-dimensional dynamic characteristics of vegetation and its response to climatic factors in the Qilian Mountains. CATENA 2022, 208, 105694. [Google Scholar] [CrossRef]
- Jiang, L.; Guli·jiapaer, G.; Bao, A.; Guo, H.; Ndayisaba, F. Vegetation dynamics and responses to climate change and human activities in Central Asia. Sci. Total Environ. 2017, 599–600, 967–980. [Google Scholar] [CrossRef]
- Yan, W.; Wang, H.; Jiang, C.; Jin, S.; Ai, J.; Sun, O.J. Satellite view of vegetation dynamics and drivers over southwestern China. Ecol. Indic. 2021, 130, 108074. [Google Scholar] [CrossRef]
- Foley, J.A.; DeFries, R.; Asner, G.P.; Barford, C.; Bonan, G.; Carpenter, S.R.; Chapin, F.S.; Coe, M.T.; Daily, G.C.; Gibbs, H.K.; et al. Global consequences of land use. Science 2005, 309, 570–574. [Google Scholar] [CrossRef] [PubMed]
- Li, J. Responses of Vegetation NDVI to Climate Change and Land Use in Ordos City, North China. Appl. Sci. 2022, 12, 7288. [Google Scholar] [CrossRef]
- Gemitzi, A.; Banti, M.; Lakshmi, V. Vegetation greening trends in different land use types: Natural variability versus human-induced impacts in Greece. Environ. Earth Sci. 2019, 78, 172. [Google Scholar] [CrossRef]
- Singh, P.; Chaudhuri, A.S.; Verma, P.; Singh, V.K.; Meena, S.R. Earth observation data sets in monitoring of urbanization and urban heat island of Delhi, India. Geomatics Nat. Hazards Risk 2022, 13, 1762–1779. [Google Scholar] [CrossRef]
- Zhao, A.; Zhang, A.; Liu, J.; Feng, L.; Zhao, Y. Assessing the effects of drought and “Grain for Green” Program on vegetation dynamics in China's Loess Plateau from 2000 to 2014. CATENA 2019, 175, 446–455. [Google Scholar] [CrossRef]
- Li, B.; Shi, X.; Lian, L.; Chen, Y.; Chen, Z.; Sun, X. Quantifying the effects of climate variability, direct and indirect land use cover change, and human activities on runoff. J. Hydrol. 2019, 584, 124684. [Google Scholar] [CrossRef]
- Deng, Y.; Wang, M.; Yousefpour, R.; Hanewinkel, M. Abiotic disturbances affect forest short-term vegetation cover and phenology in Southwest China. Ecol. Indic. 2021, 124, 107393. [Google Scholar] [CrossRef]
- Wan, L.; Liu, H.; Gong, H.; Ren, Y. Effects of Climate and Land Use changes on Vegetation Dynamics in the Yangtze River Delta, China Based on Abrupt Change Analysis. Sustainability 2020, 12, 1955. [Google Scholar] [CrossRef]
- Chen, W.; Bai, S.; Zhao, H.; Han, X.; Li, L. Spatiotemporal analysis and potential impact factors of vegetation variation in the karst region of Southwest China. Environ. Sci. Pollut. Res. 2021, 28, 61258–61273. [Google Scholar] [CrossRef]
- Duan, C.; Li, J.; Chen, Y.; Ding, Z.; Ma, M.; Xie, J.; Yao, L.; Tang, X. Spatiotemporal Dynamics of Terrestrial Vegetation and Its Driver Analysis over Southwest China from 1982 to 2015. Remote Sens. 2022, 14, 2497. [Google Scholar] [CrossRef]
- Peng, L.; Deng, W.; Liu, Y. Understanding the Role of Urbanization on Vegetation Dynamics in Mountainous Areas of Southwest China: Mechanism, Spatiotemporal Pattern, and Policy Implications. ISPRS Int. J. Geo-Inf. 2021, 10, 590. [Google Scholar] [CrossRef]
- Hussien, K.; Kebede, A.; Mekuriaw, A.; Beza, S.A.; Erena, S.H. Spatiotemporal trends of NDVI and its response to climate variability in the Abbay River Basin, Ethiopia. Heliyon 2023, 9, e14113. [Google Scholar] [CrossRef] [PubMed]
- Li, S.; Yang, S.; Liu, X.; Liu, Y.; Shi, M. NDVI-Based Analysis on the Influence of Climate Change and Human Activities on Vegetation Restoration in the Shaanxi-Gansu-Ningxia Region, Central China. Remote Sens. 2015, 7, 11163–11182. [Google Scholar] [CrossRef]
- Bao, G.; Qin, Z.; Bao, Y.; Zhou, Y.; Li, W.; Sanjjav, A. NDVI-Based Long-Term Vegetation Dynamics and Its Response to Climatic Change in the Mongolian Plateau. Remote Sens. 2014, 6, 8337–8358. [Google Scholar] [CrossRef]
- Alhumaima, A.S.; Abdullaev, S.M. Tigris Basin Landscapes: Sensitivity of Vegetation Index NDVI to Climate Variability Derived from Observational and Reanalysis Data. Earth Interact. 2020, 24, 1–18. [Google Scholar] [CrossRef]
- Han, W.; Chen, D.; Li, H.; Chang, Z.; Chen, J.; Ye, L.; Liu, S.; Wang, Z. Spatiotemporal Variation of NDVI in Anhui Province from 2001 to 2019 and Its Response to Climatic Factors. Forests 2022, 13, 1643. [Google Scholar] [CrossRef]
- Wang, J.-F.; Zhang, T.-L.; Fu, B.-J. A measure of spatial stratified heterogeneity. Ecol. Indic. 2016, 67, 250–256. [Google Scholar] [CrossRef]
- Han, J.; Zhang, X.; Wang, J.; Zhai, J. Geographic Exploration of the Driving Forces of the NDVI Spatial Differentiation in the Upper Yellow River Basin from 2000 to 2020. Sustainability 2023, 15, 1922. [Google Scholar] [CrossRef]
- Evans, J.; Geerken, R. Discrimination between climate and human-induced dryland degradation. J. Arid Environ. 2004, 57, 535–554. [Google Scholar] [CrossRef]
- Wessels, K.J.; van den Bergh, F.; Scholes, R.J. Limits to detectability of land degradation by trend analysis of vegetation index data. Remote Sens. Environ. 2012, 125, 10–22. [Google Scholar] [CrossRef]
- He, L.; Guo, J.; Jiang, Q.; Zhang, Z.; Yu, S. How did the Chinese Loess Plateau turn green from 2001 to 2020? An explanation using satellite data. CATENA 2022, 214, 106246. [Google Scholar] [CrossRef]
- Tao, J.; Xu, T.; Dong, J.; Yu, X.; Jiang, Y.; Zhang, Y.; Huang, K.; Zhu, J.; Dong, J.; Xu, Y.; et al. Elevation-dependent effects of climate change on vegetation greenness in the high mountains of southwest China during 1982–2013. Int. J. Clim. 2018, 38, 2029–2038. [Google Scholar] [CrossRef]
- Zheng, L.; Xu, J.; Tan, Z.; Xu, L.; Wang, X. Spatial Distribution of Soil Organic Matter Related to Microtopography and NDVI Changes in Poyang Lake, China. Wetlands 2019, 39, 789–801. [Google Scholar] [CrossRef]
- Chen, R.; Yin, G.; Liu, G.; Li, J.; Verger, A. Evaluation and Normalization of Topographic Effects on Vegetation Indices. Remote Sens. 2020, 12, 2290. [Google Scholar] [CrossRef]
- Wang, H.; He, L.; Yin, J.; Yu, Z.; Liu, S.; Yan, D. Effects of Effective Precipitation and Accumulated Temperature on the Terrestrial EVI (Enhanced Vegetation Index) in the Yellow River Basin, China. Atmosphere 2022, 13, 1555. [Google Scholar] [CrossRef]
- Ma, X.; Bai, H.; Deng, C.; Wu, T. Sensitivity of Vegetation on Alpine and Subalpine Timberline in Qinling Mountains to Temperature Change. Forests 2019, 10, 1105. [Google Scholar] [CrossRef]
- Zhang, H.; Chang, J.; Zhang, L.; Wang, Y.; Li, Y.; Wang, X. NDVI dynamic changes and their relationship with meteorological factors and soil moisture. Environ. Earth Sci. 2018, 77, 582. [Google Scholar] [CrossRef]
- Venkatesh, K.; John, R.; Chen, J.; Xiao, J.; Amirkhiz, R.G.; Giannico, V.; Kussainova, M. Optimal ranges of social-environmental drivers and their impacts on vegetation dynamics in Kazakhstan. Sci. Total Environ. 2022, 847, 157562. [Google Scholar] [CrossRef]
- Mekonnen, Z.; Berie, H.T.; Woldeamanuel, T.; Asfaw, Z.; Kassa, H. Land use and land cover changes and the link to land degradation in Arsi Negele district, Central Rift Valley, Ethiopia. Remote Sens. Appl. Soc. Environ. 2018, 12, 1–9. [Google Scholar] [CrossRef]


| Categories | Factors | Abbreviations | Spatial Resolution | Source |
|---|---|---|---|---|
| NDVI | 1 km | Resource and Environmental Sciences Data Center (https://www.resdc.cn/) | ||
| Natural factors | Elevation | Ele | 30 m | Geospatial Data Cloud (https://www.gscloud.cn/sources/, accessed on 12 September 2023) |
| Slope | Slo | 30 m | ||
| Solar radiation | Sol | 1 km | National Earth System Science Data Center (http://www.geodata.cn/, accessed on 12 September 2023) | |
| Precipitation | Pre | 1 km | ||
| Temperature | Tem | 1 km | ||
| Soil type | Soi | 1 km | Resource and Environmental Sciences Data Center (https://www.resdc.cn/, accessed on 12 September 2023) | |
| Vegetation type | Veg | 1 km | ||
| Anthropogenic factors | Land use type | Lut | 1 km | Resource and Environmental Sciences Data Center (https://www.resdc.cn/, accessed on 12 September 2023) |
| GDP | GDP | 1 km | ||
| Population density | Pop | 1 km |
| Judgment Basis | Role Relationship |
|---|---|
| q(X1 ∩ X2) < Min [q(X1), q(X2)] | Nonlinear weakening |
| Min [q(X1), q(X2)] < q(X1 ∩ X2) < Max [q(X1), q(X2)] | Single-factor nonlinear attenuation |
| q(X1 ∩ X2) > Max [q(X1), q(X2)] | Bivariate enhancement |
| q(X1 ∩ X2) = q(X1) + q(X2) | Independent |
| q(X1 ∩ X2) > q(X1) + q(X2) | Nonlinear enhancement |
| Drivers | Relative Contribution of Climate Change | Relative Contribution of Human Activities | |||
|---|---|---|---|---|---|
| NDVI | NDVIHA | NDVICC | |||
| >0 | >0 | >0 | CC&HA | ||
| >0 | <0 | HA | 100% | 0 | |
| <0 | >0 | CC | 0 | 100% | |
| <0 | <0 | <0 | CC&HA | ||
| <0 | >0 | HA | 100% | 0 | |
| >0 | <0 | CC | 0 | 100% | |
| Land Use Type | 2018 | |||||||
|---|---|---|---|---|---|---|---|---|
| To Cropland | To Forest | To Grassland | To Water | To Construction Land | To Bare Land | Total | ||
| 2000 | From cropland | 9074 | 7916 | 5325 | 381 | 459 | 42 | 23,197 |
| From forest land | 8958 | 189,284 | 57,610 | 1436 | 158 | 3909 | 261,355 | |
| From grassland | 6923 | 61,944 | 146,471 | 1890 | 272 | 14,987 | 232,487 | |
| From water | 270 | 1655 | 4486 | 2939 | 19 | 4808 | 14,177 | |
| From construction land | 201 | 58 | 78 | 25 | 126 | 19 | 507 | |
| From bare land | 125 | 13,135 | 32,290 | 2334 | 138 | 31,281 | 79,303 | |
| Total | 25,551 | 273,992 | 246,260 | 9005 | 1172 | 55,046 | 611,026 | |
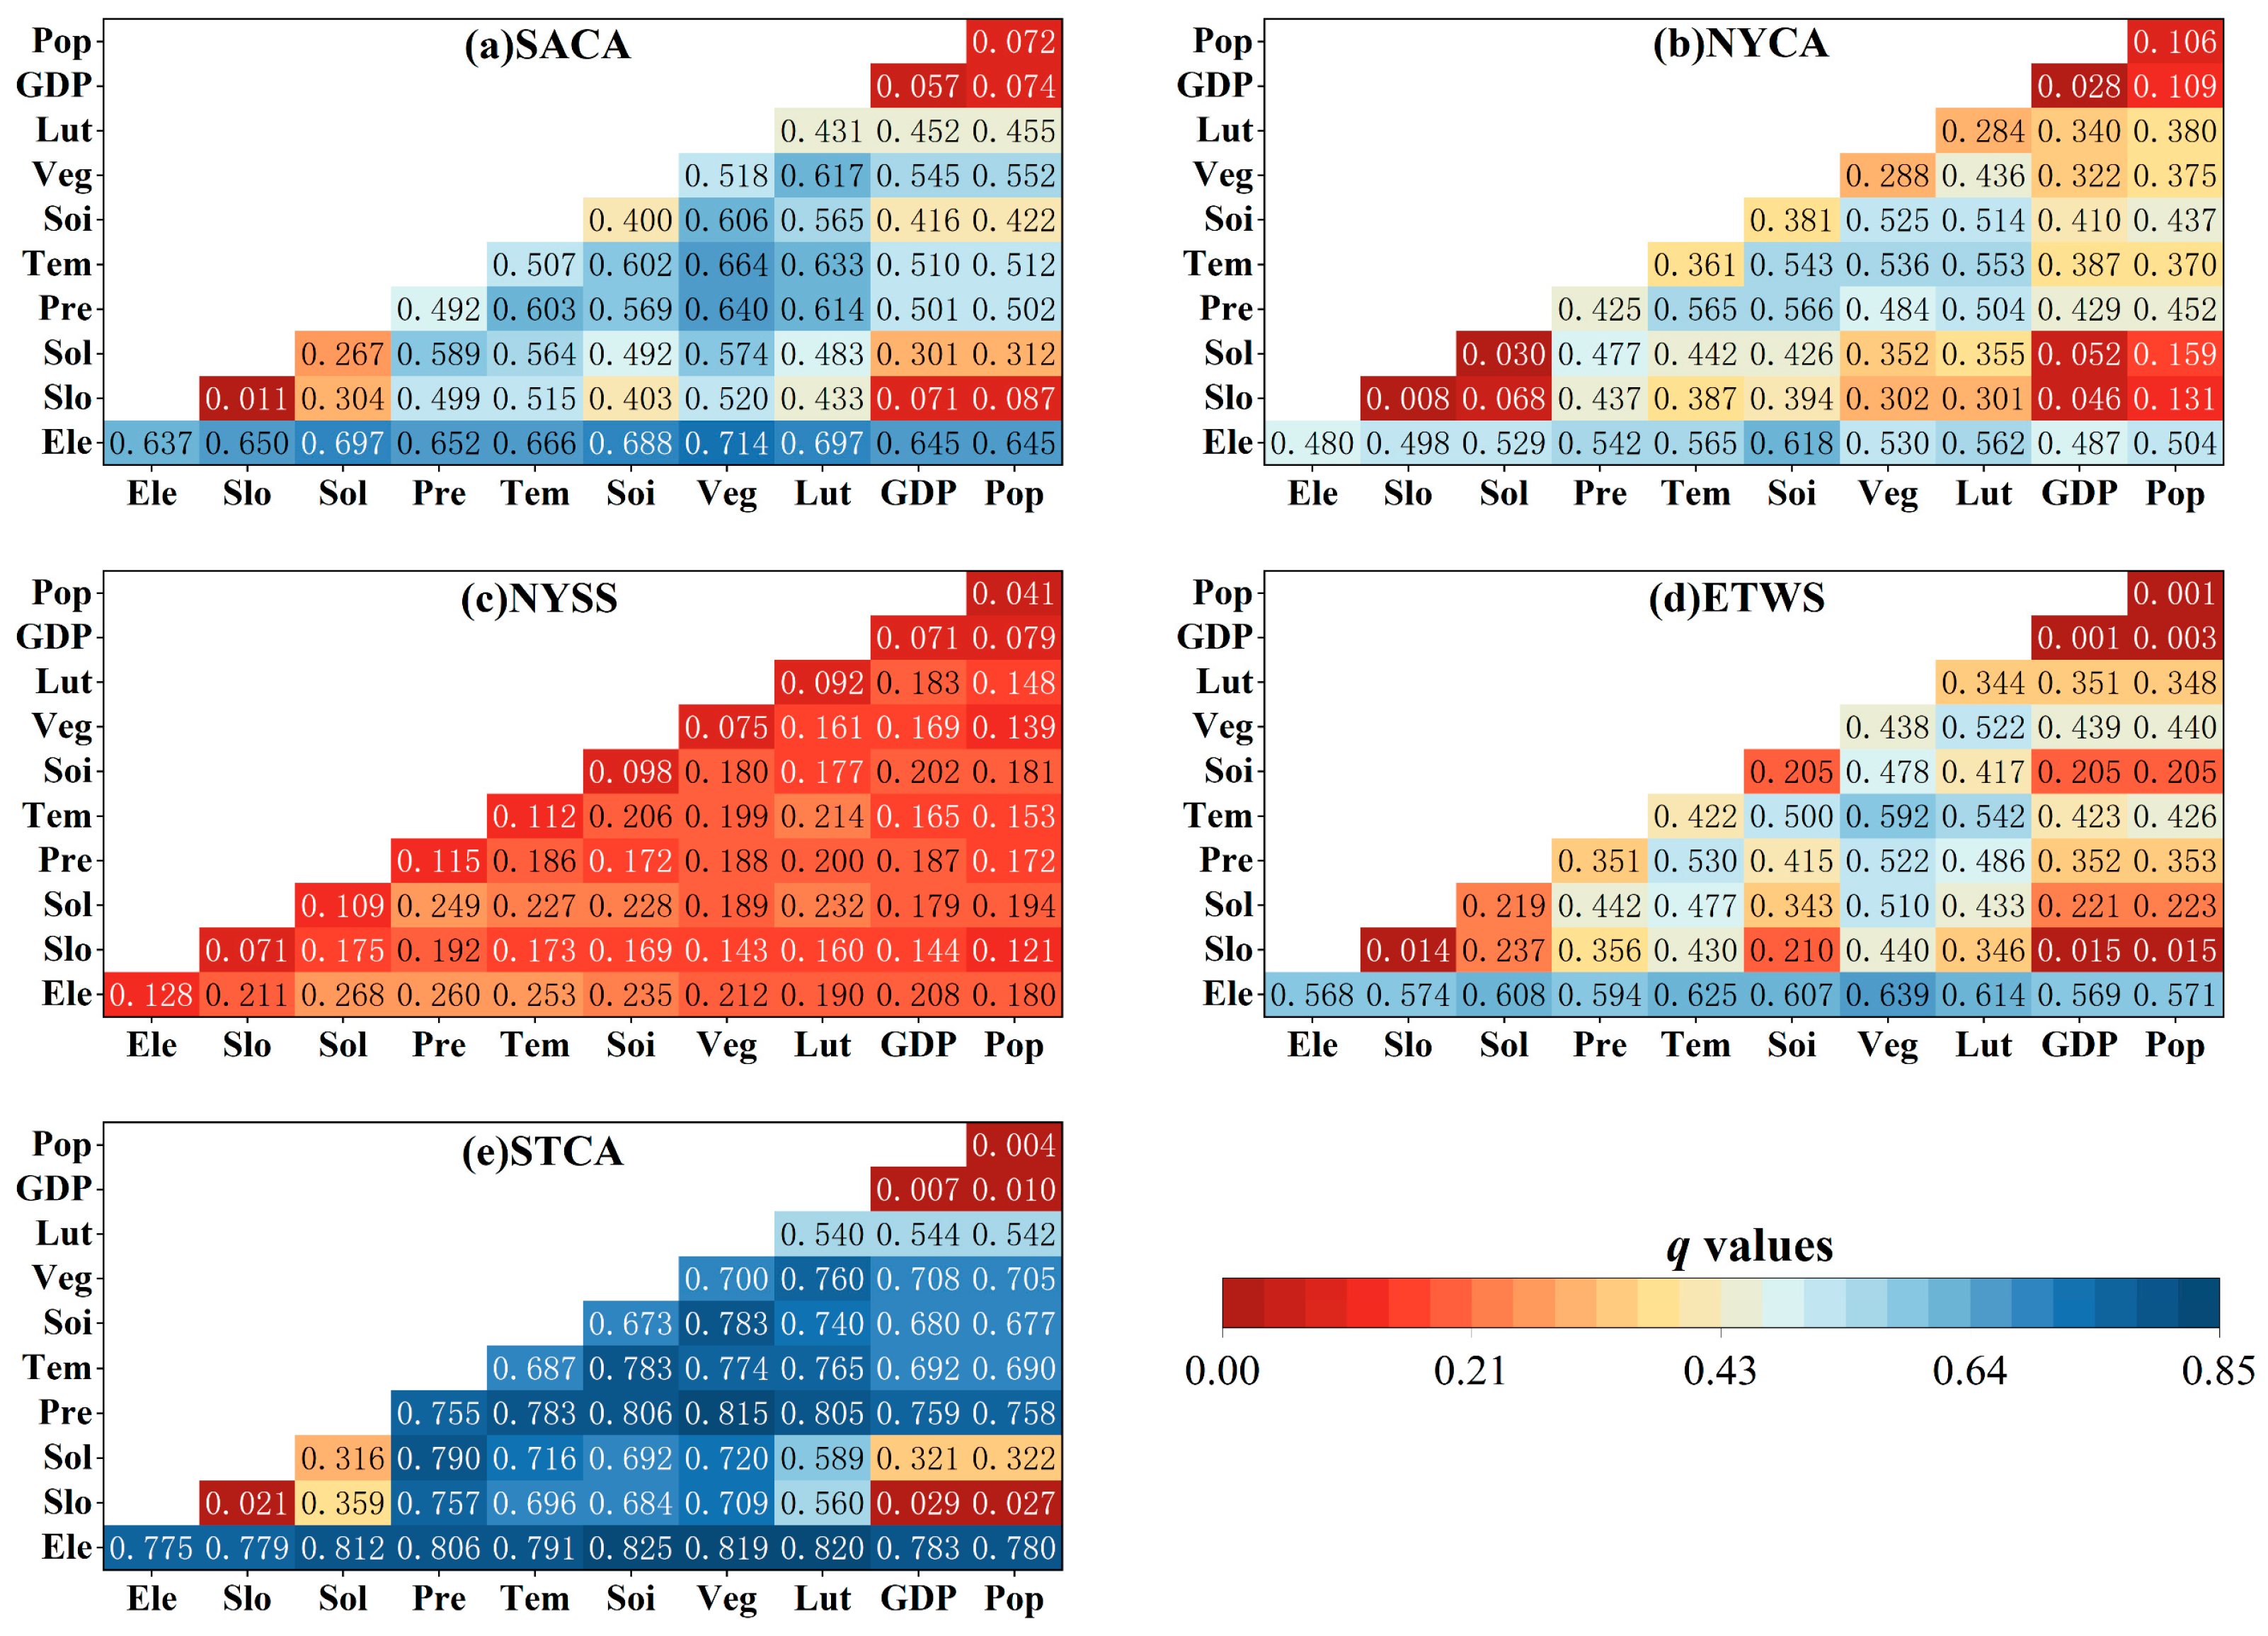
| Regions | Ele | Slo | Sol | Pre | Tem | Soi | Veg | Lut | GDP | Pop |
|---|---|---|---|---|---|---|---|---|---|---|
| SACA | 0.637 | 0.011 | 0.267 | 0.492 | 0.507 | 0.400 | 0.518 | 0.430 | 0.057 | 0.072 |
| NYAC | 0.480 | 0.008 | 0.030 | 0.425 | 0.361 | 0.381 | 0.288 | 0.284 | 0.028 | 0.106 |
| NYSS | 0.128 | 0.071 | 0.109 | 0.115 | 0.112 | 0.098 | 0.075 | 0.092 | 0.071 | 0.041 |
| ETWS | 0.568 | 0.014 | 0.219 | 0.351 | 0.422 | 0.205 | 0.438 | 0.344 | 0.001 | 0.001 |
| STAC | 0.775 | 0.021 | 0.316 | 0.755 | 0.687 | 0.673 | 0.700 | 0.540 | 0.007 | 0.004 |
Disclaimer/Publisher’s Note: The statements, opinions and data contained in all publications are solely those of the individual author(s) and contributor(s) and not of MDPI and/or the editor(s). MDPI and/or the editor(s) disclaim responsibility for any injury to people or property resulting from any ideas, methods, instructions or products referred to in the content. |
© 2023 by the authors. Licensee MDPI, Basel, Switzerland. This article is an open access article distributed under the terms and conditions of the Creative Commons Attribution (CC BY) license (https://creativecommons.org/licenses/by/4.0/).
Share and Cite
Lai, J.; Zhao, T.; Qi, S. Spatiotemporal Variation in Vegetation and Its Driving Mechanisms in the Southwest Alpine Canyon Area of China. Forests 2023, 14, 2357. https://doi.org/10.3390/f14122357
Lai J, Zhao T, Qi S. Spatiotemporal Variation in Vegetation and Its Driving Mechanisms in the Southwest Alpine Canyon Area of China. Forests. 2023; 14(12):2357. https://doi.org/10.3390/f14122357
Chicago/Turabian StyleLai, Jinlin, Tianheng Zhao, and Shi Qi. 2023. "Spatiotemporal Variation in Vegetation and Its Driving Mechanisms in the Southwest Alpine Canyon Area of China" Forests 14, no. 12: 2357. https://doi.org/10.3390/f14122357
APA StyleLai, J., Zhao, T., & Qi, S. (2023). Spatiotemporal Variation in Vegetation and Its Driving Mechanisms in the Southwest Alpine Canyon Area of China. Forests, 14(12), 2357. https://doi.org/10.3390/f14122357