Abstract
The objective of this study was to verify the link between climate change, changes in land use, and the increasing frequency of forest fires in the state of Acre. Recognizing the importance of an accurate assessment of fire risk, we also proposed a new fire risk index for the capital Rio Branco, using meteorological data. Validated reanalysis data from 1961 to 2020 extracted for Rio Branco and different land uses were used. Data on fire foci, deforestation, and agricultural crops were also obtained. The new model was based on the Fire Risk Atlantic Forest (FIAF) Index, developed for the Atlantic Forest biome, and was subjected to multiple regression analysis. To validate the new model, projections were calculated using different scenarios from the Intergovernmental Panel on Climate Change (IPCC). The new model, entitled Rio Branco Fire Risk (FIRERBR), revealed an increase in fire risk, especially associated with agriculture, in future scenarios (SSP2-4.5 and SSP5-8.5) from 2023 onward. Rainfall and relative air humidity also showed a reduction in projections, indicating a higher degree of fire danger for the region.
1. Introduction
The current climate change is real and has been intensifying at an astonishing rate in recent years. Its consequences are potentially very serious for humans and the Earth. Numerical simulations indicate that the northern region of South America will gradually become hotter and drier as global temperatures increase, which can seriously alter the ecosystem balance of the Amazon as a whole [1].
The state of Acre, located in the Brazilian Amazon, has been suffering from these changes, through extreme hydrological events. In 2015, the state capital recorded its largest flood, with the Acre River reaching 18 m and 40 cm [2]. In 2016, the same river experienced the most severe drought, recording 1 m and 30 cm [3].
During periods of extreme drought, forest fires are more recurrent. Factors such as high humidity and the lack of ignition of fires in areas far from urban centers prevent fires, but climate forecasts for the future and changes in land use may increase the presence of fires in these areas [4].
Generally, fire in forest areas originates from nearby areas being burned, either as part of the initial deforestation or in the subsequent management of agricultural and livestock systems [5].
In this sense, Acre has been undergoing changes in land use, mainly due to the increasing deforestation. In the Baixo Acre region, where the capital Rio Branco is located, it mainly occurs due to investments in the agricultural and livestock sector, and the increase in cattle herds [6]. The deforestation of areas in the Amazon with natural forest vegetation can change the physical and chemical processes between the atmosphere and terrestrial ecosystems, leading to changes in rainfall, temperature, and air humidity [7].
Changes in climate and land use are transforming the spatial and temporal characteristics of fire regimes in the Amazon, affecting the functioning of dense, open, and transitional rainforests [8]. In addition to the anthropic effect, many researchers associate the increase in fires in regions of South America with megadroughts and oceanic circulations such as the El Niño–Southern Oscillation (ENSO) event [9].
Several fire risk classification systems have been developed to help identify forest fires, providing numerical indices that estimate the intensity of possible fires [10]. In Brazil, the modified Monte Alegre Formula (FMA+) has been used in several studies, and it is calculated with the relative air humidity, precipitation, and wind speed as input variables [11,12,13].
Not only in Brazil but also in different regions of the world, new research and fire risk models have been widely tested and used in an attempt to reduce the threat to life and ecosystems in these regions, such as the studies conducted in India [14], Greece [15], and China [16].
Physical–mathematical models that take into account meteorological data input are also tested and used to monitor risks in other parts of the world, such as New Zealand, where the authors of [17] investigated the wind vector change using a model integrated with the Fire Weather Index (FWI). In China, also using the same FWI model, the authors of [18] combined two machine learning models with the FWI, namely the long short-term memory (LSTM) and random forest (RF) models.
Numerous climate models from the Intergovernmental Panel on Climate Change (IPCC) are being used to show future trends more effectively at the global level through distinct climate change scenarios called Shared Socioeconomic Pathways (SSPs) [1]. A study on climate change in South America using these scenarios predicts that, by 2040, there will be a reduction in rainfall, mainly in the north and northeast of South America, during the months of September, October, and November [19], making the climate drier and these regions most susceptible to forest fires.
In addition to the panel models, there are statistical models used by several researchers who seek to simulate the future of regions in South America that are victims of fires and climate change. These models have been widely used because they minimize the costs of field activities and are run with just a few input variables, such as the autoregressive integrated moving average (ARIMA) [19].
The analysis of time series from sensors installed on orbital platforms makes it possible to evaluate the variation in behavior over time. Therefore, these techniques are widely used for various purposes, including monitoring fire foci [20]. The Moderate-Resolution Imaging Spectroradiometer (MODIS) reference sensor for fire foci has been used in studies with this objective [21].
A better understanding of the relationship between meteorological elements and the degree of fire danger in the state of Acre, which is suffering from the advance of the deforestation arc, is important for a greater understanding of the effects of climate change in the Western Amazon and the maintenance of life. For this reason, the present study had the following objectives:
- Evaluate the impact of meteorological variables and the ENSO phenomenon on the occurrence of fires;
- Identify fire risks for different land uses and covers;
- Create a fire risk index for the capital Rio Branco, Acre, Brazil;
- Evaluate the behavior of fire risk in different IPCC scenarios;
- Promote this index as a monitoring tool and an alternative for obtaining new information about fires in the Amazon biome.
2. Materials and Methods
2.1. Study Area
Acre has the tropical equatorial (Af) and tropical monsoon (Am) climate types, characterized by high temperatures, high levels of rainfall, and high relative humidity. The average temperatures vary from 24.5 °C to 32 °C for the entire state [22]. The average annual precipitation is around 2166 mm [23]. The months of June to September correspond to the driest period of the year in the state, while the months of January to March correspond to the rainiest period [24].
The state is located in the northern region of Brazil (Figure 1), has 22 municipalities in an area of 164,173 km2, and an estimated population in 2022 of 830,018 inhabitants [25]. It is located in the Brazilian Amazon rainforest, bordering the state of Amazonas to the north and east and Bolivia and Peru to the south and west [26].
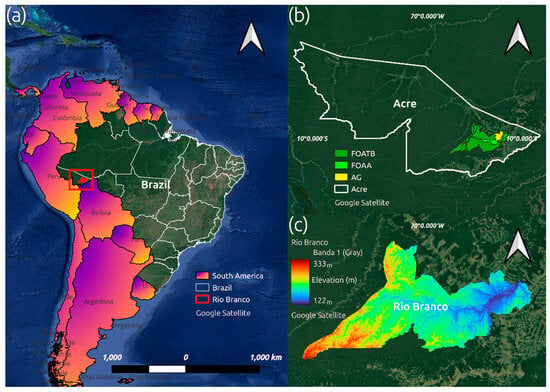
Figure 1.
(a) Geographic location of the study with the state and municipality of Rio Branco, Acre, highlighted in red on the left; (b) the state of Acre and the land use and cover used in the municipality of Rio Branco, Acre; (c) digital elevation model of the municipality of Rio Branco, Acre.
2.2. Observed Meteorological Data and Fire Data
The observed meteorological data (also called baseline in this article) were validated for the entire Brazilian territory [27]. Reanalysis data are widely used in scientific studies in Brazil that aim to assess climate trends [21,28]. Daily data on maximum and minimum air temperature (Tmax; Tmin; °C), evapotranspiration (ETo; mm day−1), rainfall (pr; mm), wind speed (u2; m s−1), relative air humidity (RH; %) and solar radiation (Rs; MJ m−2 day−1) were obtained. The period under study was from 1961 to 2020.
These data were extracted for the municipality of Rio Branco considering three types of land use and cover (Figure 1b), namely agricultural (AG), alluvial open rainforest (FOAA), and lowland dense rainforest (FOATB) [29] according to the RADAMBRASIL project. The extraction was carried out in R Studio version 4.3.1, using the readxl, raster, rgdal, maptools, RSAGA, and ncdf4 libraries. After data extraction, the average air temperature (Tavg; °C) was obtained using the maximum and minimum air temperature values. To generate the maps, the QGIS software version 3.28.10-Firenze was used.
To verify the accuracy of the new fire risk index, monthly fire outbreak data for 2001–2022 were downloaded from the Fire Information for Resource Management System (FIRMS) platform (https://firms.modaps.eosdis.nasa.gov/, accessed on 1 September 2023). The information was for the municipality of Rio Branco considering the three types of land use and cover.
2.3. Deforestation and Agricultural Crop Data
Deforestation data of Acre were obtained from 2001 to 2022 using the PRODES project, available at <https://www.dpi.inpe.br/prodesdigital/prodesmunicipal.php/> (accessed on 1 September 2023). The project involves the satellite monitoring of deforestation through clearcutting in the Legal Amazon and, since 1988, has presented annual deforestation rates in the region [30]. According to the PRODES system [30], deforestation by clearcutting is defined as deforestation that results in the complete removal of forest cover in a short period of time. In this process, the forest cover is completely removed and replaced by other covers and uses such as agricultural crops, urban areas, hydroelectric plants, and others, and can also be abandoned and enter a regeneration process. Data were also obtained from areas harvested from temporary crops (Temp; sugarcane, maize, and soybean; hectares) and permanent crops (Perm; banana, coffee, and orange; hectares) in the state for the same period [31].
2.4. IPCC Scenarios—SSP2-4.5 and SSP5-8.5 (Future)
For the future analysis of the new fire risk index, the Japanese MIROC6 model was chosen, as it is widely used in other similar studies. Meteorological data were downloaded for scenarios SSP2-4.5 and SSP5-8.5, adopting the period from 2021 to 2041. The SSP2-4.5 scenario is considered intermediate according to the IPCC [1] until mid-century CO2 concentrations remain around current levels with values above 410 ppm CO2. The very high-emission scenario in IPCC SSP5-8.5 results in the estimation that, by 2050 and 2100, CO2 concentrations will be doubled compared to current levels [1].
Daily data (future) were obtained for the maximum and minimum air temperature (°C), wind speed (m s−1), and rainfall (mm). These data were derived from the sixth phase of a project called the Coupled Model Intercomparison Project (CMIP6) [32].
The model in question does not include the relative air humidity (%) at 13:00, a component of the equation for the new fire risk index to be proposed. The estimation of this variable was made according to the work methodology in the Itatiaia National Park, in the Atlantic Forest [13]. The model data were also extracted for the three types of land use and cover, in the same way as the reanalysis data.
2.5. Fire Risk Index and ENSO Events
To estimate the fire risk for the city of Rio Branco, a modified Monte Alegre Formula was used, a methodology also adopted in the study conducted in the Itatiaia National Park [13]. Daily data on the relative air humidity at 13:00 (RH 13h; %), rainfall (mm), and wind speed (m s−1) from 1961 to 2020 were used. The calculation was performed using the SISCLASS spreadsheet developed by [12] and was also performed for AG, FOAA, and FOATB.
The data were classified by ENSO events. The years from 1961 to 2020 were classified as neutral (NE), weak El Niño (WE), moderate El Niño (ME), strong El Niño (SE), very strong El Niño (VSE), weak La Niña (WL), moderate La Niña (ML), and strong La Niña (SL). This classification (Table 1) was based on data available at <https://www.webberweather.com/ensemble-oceanic-nino-index.html/> (accessed on 1 September 2023) to verify the behavior of these variables and the fire risk per event.

Table 1.
Classification of baseline years by ENSO events.
2.6. Regression Model and Statistical Analysis of FIRERBR
For the new fire risk model for the capital of Acre, a multiple regression analysis was carried out, considering the following independent variables: relative air humidity at 13:00 (%), rainfall (mm), and wind speed (m s−1). The dependent variable (Yi) was the FMA+ value calculated from the independent variables (Xi, i = 1, 2, …, k). The equation of the new model was based on the equation used for calculating the Fire Risk Atlantic Forest (FIAF) Index [13]. Called the Rio Branco Fire Index (FIRERBR), the statistical regression model is given as follows:
The new model was presented for statistical analysis, presenting a coefficient of determination (R2) of 0.70 and a standard error of estimation (SEE) of 22.08 (Figure 2).
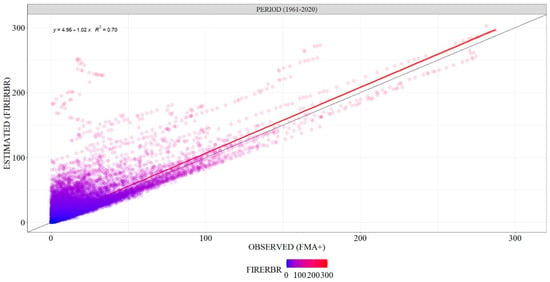
Figure 2.
Regression analysis of observed data using the FMA+ model (Eugenio) vs. data estimated with FIRERBR.
2.7. Statistical Analysis
For trend analysis, the Mann–Kendall [33,34] test (Equation (2)) was applied to the observed meteorological data (baseline), fire foci data, and deforestation and agricultural crop data. The test was applied in R Studio version 4.3.1, using the Kendall library.
where Zmk is the Z index of the Mann–Kendall test, S is the “score” statistic, and Var (S) is the variance of the statistical value S. The presence of a statistically significant trend was evaluated according to the Z index of the test, with positive values indicating an increasing trend and negative values indicating a decreasing trend.
The Pettitt [35] test was applied to fire foci data, with the aim of identifying the main significant changes during the time series used, based on the main inflection of the extreme years. With this information, the kernel density for the area was determined. The test was applied in R Studio version 4.3.1, using the trend library.
The average fire risk values for each of the ENSO events were compared according to the type of land use and land cover. In this way, the average fire risk for the neutral event years in AG was compared with the same average in FOAA and the same average in FOATB. This process was carried out for the other seven events, resulting in an analysis of the fire risk frequency for each of the events, taking the use with the highest average as a reference.
Spearman’s correlation coefficient was determined using data on evapotranspiration (mm day−1), rainfall (mm), the relative air humidity (%), solar radiation (MJ m−2 day−1), the average air temperature (°C), wind speed (m s−1), fire foci (number), deforestation (hectares), and temporary (hectares) and permanent (hectares) agricultural crops. For the correlation, data from 2001 to 2020 were used.
3. Results
3.1. Fire Foci
The behavior of fire foci in Rio Branco from 2001 to 2022 can be seen in Figure 3. The year 2005 presented many fire foci, concentrated in the months of August and September (dry season) and in the lowland dense rainforest. Another year that stood out was 2022, presenting more than 900 fire foci in the month of September alone, in the same vegetation. The other years in the time series presented monthly values below 900.
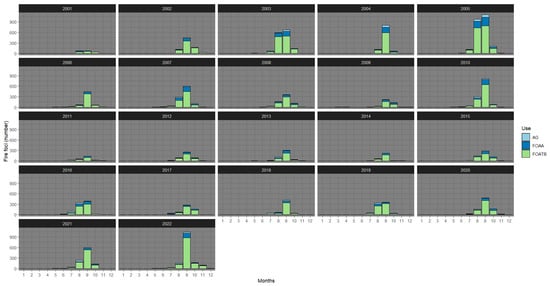
Figure 3.
Annual temporal analysis of fire foci for different types of land use and cover (2001–2022), for Rio Branco, Acre, Brazil. AG = agriculture; FOAA = alluvial open rainforest; FOATB = lowland dense rainforest.
Through the analysis presented in Figure 4, it is possible to verify the density of these fire foci over the analyzed months for the three types of land use and cover considered in this study. Agriculture presented values close to 60 fire foci in the month of September. The alluvial open rainforest, in turn, presented values close to 250 in the same month. This month was also the one with the highest concentration in the lowland dense rainforest, with values reaching 750 foci. The pattern of concentration of outbreaks in the months corresponding to the dry season remained the same for the three land uses.
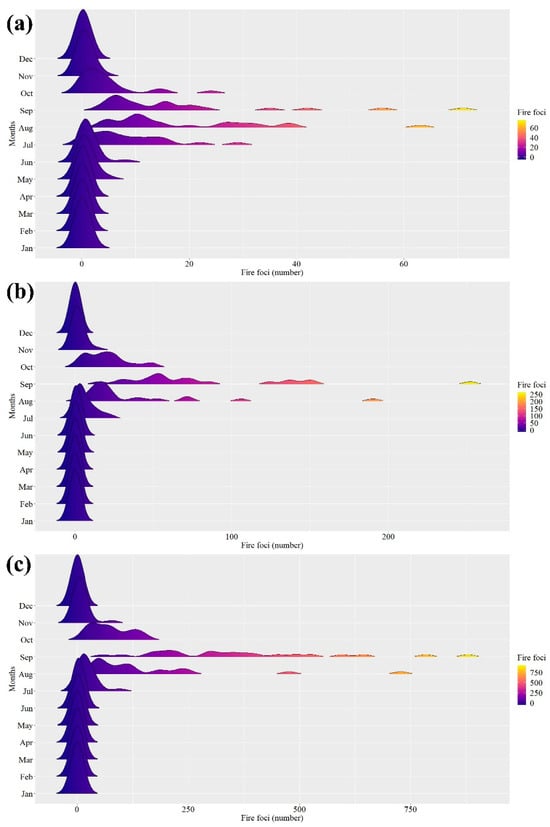
Figure 4.
Monthly density of fire foci for different types of land use and cover (2001–2022): (a) AG = agriculture; (b) FOAA = alluvial open rainforest; (c) FOATB = lowland dense rainforest.
The kernel density for fire foci in the municipality of Rio Branco is presented in Figure 5, showing a higher concentration during the dry season than in the rainy season. It was possible to observe a distribution closer to the center of the capital of these foci in both periods.
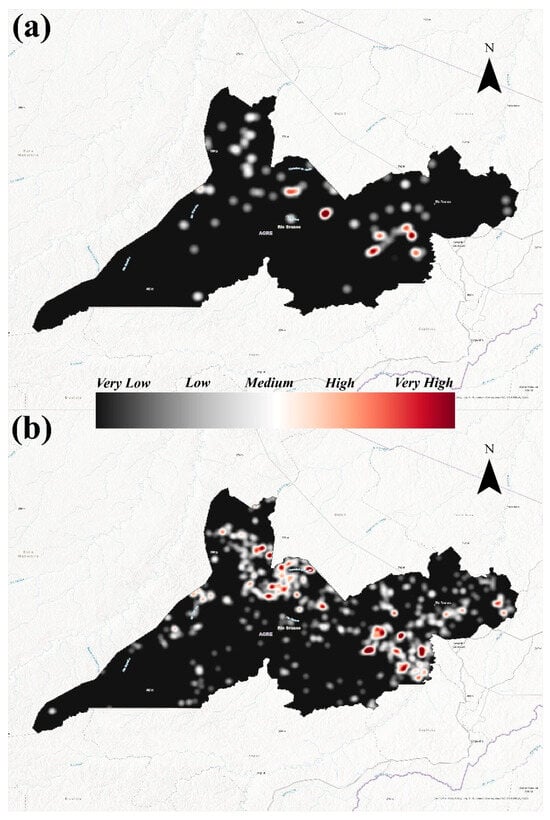
Figure 5.
Kernel density for the year 2007, using the Pettit test, in Rio Branco, Acre, Brazil: (a) rainy season; (b) dry season.
3.2. Deforestation and Agricultural Crops
During the time series analyzed, the years 2003, 2022, and 2002 ranked as the top-three years with the largest deforested areas in Acre, as shown in Figure 6. The behavior of permanent crops evaluated during the period did not show much variation, with banana being the crop that presented higher harvested area values, exceeding 5000 hectares in 2022. On the other hand, regarding temporary crops, the harvested area of soybeans increased in the last five years of the series (2018, 2019, 2020, 2021, and 2022), jumping from 480 to 6570. The maize crop, which had dropped to the level of 30,000 hectares harvested in 2018, increased again, with more than 40,000 hectares of maize harvest recorded in 2022.
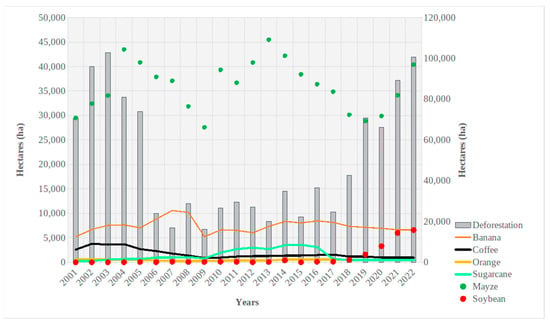
Figure 6.
Deforestation and harvested area of agricultural crops in Acre, Brazil.
3.3. FIRERBR and Future
The fire risk for Rio Branco during the period from 1961 to 2020 can be seen in Figure 7, which shows the months with the highest concentration using the new proposed FIRERBR model. The analysis shows a higher concentration of risk in the months of June, July, and August, a period corresponding to drought, with many fire foci. In the other months, most of which correspond to the rainy season, the concentration was low.
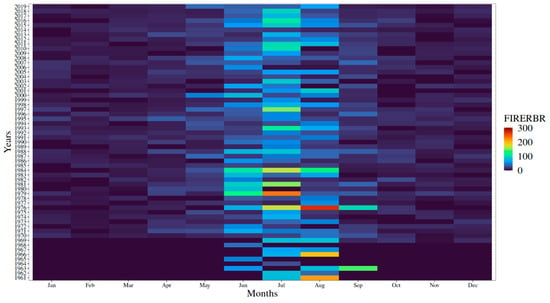
Figure 7.
Monthly temporal analysis of FIRERBR (1961–2020) in Rio Branco, Acre, Brazil.
The FIRERBR model can also be observed in Figure 8, which shows the behavior of the new proposed model in different ENSO events from 1961 to 2020, always considering the type of land use and coverage that presented the highest average index values as the reference. Thus, the AG use was the one that stood out the most, which was found to be related to strong El Niño (SE), strong La Niña (SL), very strong El Niño (VSE), weak El Niño (WE), weak La Niña (WL) and moderate La Niña (ML).
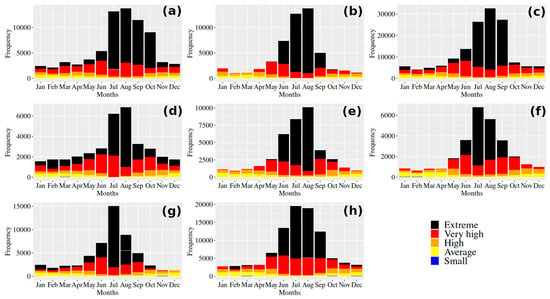
Figure 8.
FIRERBR degree of danger for different ENSO events across land use and cover types: (a) moderate El Niño; (b) moderate La Niña; (c) neutral; (d) strong El Niño; (e) strong La Niña; (f) very strong El Niño; (g) weak El Niño; (h) weak La Niña.
In all the events evaluated, the degree of extreme danger was most present in the months of July, August, and September (dry season). In the other months, the model presented lower rates, meaning a lower degree of danger.
In the SL and ML events, both related to AG, none of the months of the rainy season, presented a degree of extreme danger, except for October. In contrast to this behavior, in the SE event, also related to AG, all months of the year presented this degree of danger, regardless of the intensity.
A monthly analysis of the FIRERBR input variables in different ENSO events can be seen in Figure 9. Rainfall presented a pattern of behavior across the analyzed events, with June, July, August, and September (dry season) determined as the months with the lowest values. Likewise, the relative air humidity at 13:00 presented the lowest values in this season, with emphasis on the months of June, August, and September. The wind speed presented a similar distribution of values over the months.
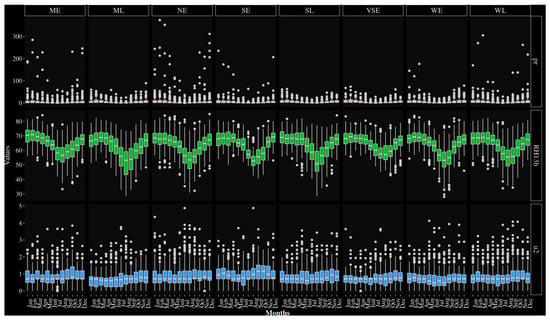
Figure 9.
Monthly temporal analysis of variables associated with the FIRERBR (1961–2020), for different ENSO events in Rio Branco, Acre, Brazil.
In Figure 10, it is possible to see a comparison between these same variables in the two IPCC scenarios considering the three types of land use and cover analyzed. In AG, all variables presented lower values in the SSP5-8.5 scenario than in the SSP2-4.5 scenario. The variable that showed the greatest reduction was the relative air humidity. In FOAA and FOATB, lower values were also observed in the SSP5-8.5 scenario, but no variable showed a discrepancy.
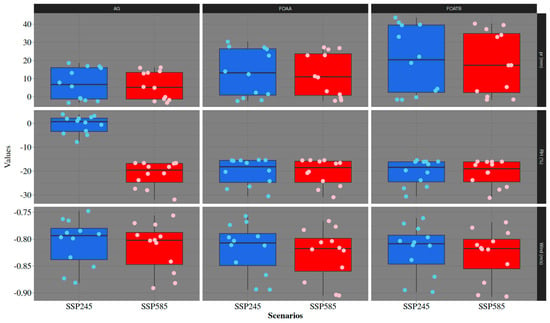
Figure 10.
Comparison of fire risk index variables between different IPCC scenarios, by different types of land cover in Rio Branco, Acre, Brazil: blue = SSP2-4.5 scenario; red = SSP5-8.5 scenario.
The FIRERBR in the period from 1961 to 2020 (baseline) and the IPCC scenarios (future) relative to the types of land use and cover can be seen in Figure 11. Our results show that the fire risk in the future (scenario SSP2-4.5 and scenario SSP5-8.5) will be higher, increasing from values close to 50 to values close to or greater than 100 in all uses.
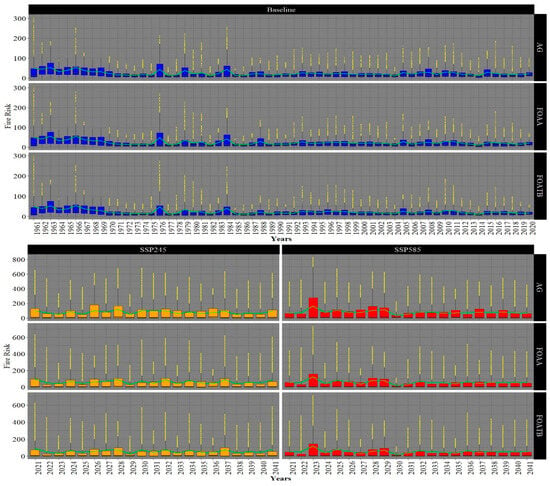
Figure 11.
Comparison of fire risk between the baseline and different IPCC scenarios relative to different types of use and land cover in Rio Branco, Acre, Brazil.
In the SSP5-8.5 scenario, AG was the use that presented the highest fire risk, registering an index close to 300 in 2023. This year also registered a high index in FOAA and FOATB uses. In the SSP2-4.5 scenario, AG also presented a higher risk, recording an index close to 200 in 2026.
3.4. Statistical Analysis
The result of the Mann–Kendall test for the observed meteorological data (baseline) can be seen in Table 2, with a significance interval of 5% and 10%. The relative air humidity showed significant decreasing trends in almost all months, while solar radiation showed a significant increasing trend only in April. The analysis of the other input data of the fire risk model revealed that rainfall exhibited the greatest reduction in December (rainy season), and wind speed exhibited the greatest reduction in May (dry season).

Table 2.
Z index (Zmk) of the Mann–Kendall test for the observed data (baseline) in Rio Branco, Acre, Brazil.
The results of the Mann–Kendall test for deforestation and agricultural crop data, soybean crops had the highest Z index (4.43), showing an increasing trend in the region. Deforestation had a Z index of 0.45, also indicating an increase.
For fire foci data, the Z index was higher for FOAA with 2.42, showing an increasing trend in this type of forest. FOATB was found to have a Z index of 2.2, and AG had a Z index of 1.87 (Figure 12).
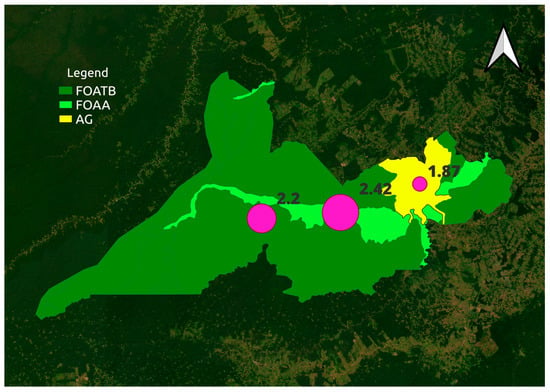
Figure 12.
Z index (Zmk) of the Mann–Kendall test for fire foci by different types of land use and land cover in Rio Branco, Acre, Brazil.
The results of the Spearman correlation can be seen in Figure 13, which shows the power of the relationships and their direction. Regarding rainfall, stronger relationships were found with evapotranspiration (−0.99), solar radiation (−0.93), and temporary crops (−0.71). These values show that an increase in rainfall is associated with a reduction in other variables, with the opposite also being true. Wind speed showed a moderate relationship with the average temperature of −0.54, indicating that the increase in the average temperature negatively affects wind speed.
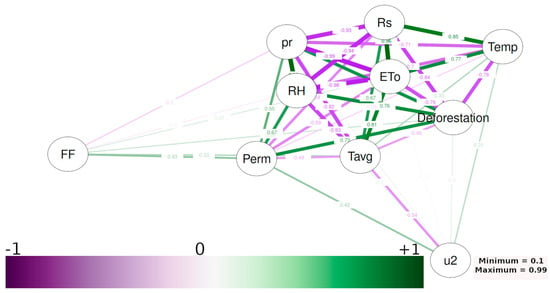
Figure 13.
Spearman correlation analysis. FF = Fire foci (number); pr = Rainfall (mm); RH = Relative air humidity (%); Perm = Permanent crops (hectares); Temp = Temporary crops (hectares); RS = Solar radiation (MJ m−2 day−1); ETo = Reference evapotranspiration (mm day−1); Tavg = Average air temperature (°C); Deforestation (hectares); u2 = Wind speed (m s−1).
Permanent crops (banana, coffee, and orange) exhibited a strong relationship (0.73) with deforestation, and their increase was associated with an increase in deforestation. Regarding fire foci, they presented a relationship close to moderate (0.43), indicating that an increase in these crops would lead to an increase in fires. Fire foci were also almost strongly related to deforestation (0.67), showing that an increase in forest fires was related to an increase in deforestation.
4. Discussion
4.1. Forest Fires and Anthropic Advance in the Western Amazon
The fire foci found in Rio Branco were concentrated in September, during the dry season, a result similar to that observed in similar studies carried out in the same region [23,26,36]. The results also showed that the land use most susceptible to fire was the lowland dense ombrophilous forest, a result similar to that found by [23]. Our results showed a high number of fire foci in September 2022, a behavior that was also observed for the Brazilian Amazon in a study that identified more than 74,000 active fires in the period of August and September of the same year, characterizing it as the year with the highest number of fires since 2010. The study also highlighted that 62% of fires occurred in deforested areas [37].
The kernel density is a methodology that provides greater reliability for analyzing fire behavior, as it transforms fire foci (points) into surface data [38]. In this aspect, our results showed a higher concentration of fire foci in Rio Branco during the dry season, following the pattern found by other studies [23,36,37].
The greater susceptibility of FOATB to fire found in our study, especially in the dry season, may be associated with the effects of climate change on forests, considering that a drier climate, with low humidity in the soil and vegetation, and a warmer climate constitute a favorable scenario for burning and spreading fire, increasing the likelihood of fires [39]. According to a report from the World Meteorological Organization (WMO), 2022 was one of the eight hottest years on record [40], which may have influenced the high value found in our study for September of that same year.
Our results showed an increase in deforestation and temporary crops, mainly maize and soybeans. According to the Institute of Economic Research (IPEA) [41], the advance in grain planting, mainly maize and soybeans, consolidates Acre as a new and promising agricultural frontier in the country. The institute reports that harvests of these crops are currently the highest in the last 30 years, which reinforces the results of our study.
Although the increase in deforestation recorded for the year 2022 was not statistically significant in this study, monitoring is necessary, given the increase in the production of the aforementioned agricultural crops in the Acre territory. Soybean farming alone grew 7000% between 2012 and 2022 [41]. Monitoring is also necessary due to the extensive livestock farming that is also advancing in the state, which requires the incorporation of new land for production and has converted forest into pasture [42].
4.2. FIRERBR for Baseline and the Future in the Western Amazon
Our FIRERBR model, based on the FIAF model, showed good results with meteorological data from Rio Branco. The FIAF model can be applied in regions with conditions similar to the Atlantic Forest, which is characterized by a large volume of rain during the rainy season and little precipitation during the dry season [13].
FIRERBR, using baseline data, indicated a greater risk of fire when associated with AG. However, the new model did not show major differences when using ENSO events to compare the degree of danger, which, according to [23], are important events for understanding the occurrence of fires in the state. This may indicate that the risk of fire in the region is not directly associated with ENSO events, as also found in a similar study [23] with fire foci in Acre.
Analyzing the variables used in the new model in future scenarios, it is possible to notice a reduction in all of them, associated with AG, indicating an influence of crop cultivation. A study conducted in South America using the SSP5-8.5 scenario also found a significant reduction in rainfall (−110 mm) in the north and northeast, during the months of September, October, and November [19]. An environment with low humidity and precipitation conditions facilitates the spread of fire. Therefore, arboreal individuals inserted in this context are more exposed to fires, normally caused by the management of the area before agricultural activities [43].
In the SSP2-4.5 scenario, our study showed a higher fire risk in the year 2026, associated with AG use. A similar study carried out in the Atlantic Forest using another fire risk model and the same scenario concluded that the rainy season will undergo more extreme fire conditions from the same year onward [13], indicating a greater distribution of fire over several months and no longer concentrated in the dry season. For the SSP5-8.5 scenario, our model showed that 2023 was the year with the highest fire risk in all uses, showing the effectiveness of the new index in practice. According to the WMO, the year 2023 is considered the hottest in 174 years of meteorological measurements. In Brazil, the year also stands out as being the hottest since the 1960s [44].
The projections of our study indicate that new fire events will likely occur in the coming years in the region, especially for the year 2026. The effects of these events can include the intensification of various economic, environmental, and mainly social impacts, making the population more vulnerable [45]. Our results are an important contribution, as they generate knowledge about the relationship between climate change and fire risk and land use and cover in the westernmost state of the Amazon.
5. Conclusions
The FIRERBR model that was developed in this work showed that, in the future, Acre may be subject to fires mainly in regions targeted by agricultural activities. Years like 2028 and 2029 could witness great fire activity, according to projections in an intermediate climate change scenario.
Given the advancement in the deforestation arc and the reduction in rainfall and the relative air humidity in the region, our study highlights the potential of the new model to combat possible fire events not only in the municipality of Rio Branco but also in other regions of the Western Amazon that are close to each other and have similar climatic characteristics.
Furthermore, it is important to highlight that the preservation of these areas and monitoring them with the proposal of a new fire model can serve as an aid to civil defense and contribute to not only short- and long-term actions for decision makers but also global actions to reduce greenhouse gas emissions.
Author Contributions
Conceptualization, R.C.D. and K.d.S.M.; formal analysis, K.d.S.M., R.C.D., M.G.P. and G.P.O.; investigation, K.d.S.M.; resources, R.C.D. and K.d.S.M.; data curation, K.d.S.M., R.C.D., M.G.P. and G.P.O.; writing—original draft preparation, R.C.D. and K.d.S.M.; writing—review and editing, K.d.S.M., R.C.D., M.G.P. and G.P.O.; visualization, K.d.S.M., R.C.D., M.G.P. and G.P.O.; supervision, R.C.D.; project administration, R.C.D. All authors have read and agreed to the published version of the manuscript.
Funding
Coordination for the Improvement of Higher Education Personnel (CAPES).
Data Availability Statement
Data are contained within the article.
Acknowledgments
The authors would like to thank the Federal University of Acre and the Postgraduate Program in Forestry Science—CIFLOR for the facilities and workplace for data analysis.
Conflicts of Interest
The authors declare no conflicts of interest.
References
- IPCC. Climate Change 2021: The Physical Science Basis. Contribution of Working Group I to the Sixth Assessment Report of the Intergovernmental Panel on Climate Change. Available online: https://report.ipcc.ch/ar6/wg1/IPCC_AR6_WGI_FullReport.pdf (accessed on 30 November 2023).
- Buffon, F.T.; Pinheiro, J.A.C.; Castro, H.P.e.; Barbosa, F.d.A.d.R.; Mendonça, R.R.; Gomes, W.R.; Gramacho, P.C.; Bezerra, S.R. Enchente de 2015 no rio Acre: Aquisição de dados e monitoramento. In Simpósio Brasileiro De Recursos Hídricos; ABRH: Brasília, Brazil, 2015. [Google Scholar]
- Bonotto, G.; Buffon, F.T.; Mendonça, R.R. Estações específicas e tendências geomorfológicas no rio Acre. In Simpósio Brasileiro De Recursos Hídricos; ABRH: Florianópolis, Brazil, 2017. [Google Scholar]
- Le Page, Y.; Morton, D.; Hartin, C.; Bond-Lamberty, B.; Pereira, J.M.C.; Hurtt, G.; Asrar, G. Synergy between land use and climate change increases future fire risk in Amazon forests. Earth Syst. Dynam. 2017, 8, 1237–1246. [Google Scholar] [CrossRef]
- Barni, P.E.; Rego, A.C.M.; Silva, F.D.C.F.; Lopes, R.A.S.; Xaud, H.A.M.; Xaud, M.R.; Barbosa, I.B.; Fearnside, P.M. Logging Amazon forest increased the severity and spread of fires during the 2015–2016 El Niño. For. Ecol. Manag. 2021, 500, 119652. [Google Scholar] [CrossRef]
- Duarte, M.L.; Brito, W.B.M.; da Silva, T.A.; de Castro, A.L. Padrões e causas do desmatamento no Baixo Acre, região oeste da Amazônia brasileira. J. Environ. Anal. 2020, 5, 117–127. [Google Scholar] [CrossRef][Green Version]
- Lawrance, D.; Vandecar, K. Effects of tropical deforestation on climate and agriculture. Nat. Clim. Change 2015, 5, 27–36. [Google Scholar] [CrossRef]
- Alencar, A.A.; Brando, P.M.; Asner, G.P.; Putz, F.E. Landscape fragmentation, severe drought, and the new Amazon forest fire regime. Ecol. Appl. 2015, 25, 1493–1505. [Google Scholar] [CrossRef]
- Santos, R.O.; Delgado, R.C.; Vilanova, R.S.; de Santana, R.O.; de Andrade, C.F.; Teodoro, P.E.; Lima, M. NMDI application to monitor the vegetation of the Atlantic Forest biome, Brazil. Weather Clim. Extremes 2021, 33, 100329. [Google Scholar] [CrossRef]
- Chelli, S.; Maponi, P.; Campetella, G.; Monteverde, P.; Foglia, M.; Paris, E.; Lolis, A.; Panagopoulos, T. Adaptation of the Canadian fire weather index to Mediterranean forests. Nat. Hazards 2015, 75, 1795–1810. [Google Scholar] [CrossRef]
- Nunes, J.R.S.; Soares, R.V.; Batista, A.C. FMA+—Um novo índice de perigo de incêndios florestais para o estado do Paraná, Brasil. Floresta 2006, 36, 75–91. [Google Scholar] [CrossRef]
- Eugenio, F.C.; dos Santos, A.R.; Pedra, B.D.; Pezzopane, J.E.M.; da Silva, S.D.P.; Fantinel, R.A. System for calculating and defining classes in modified Monte Alegre Formula—FMA+ Sisclass. Floresta 2021, 52, 131–139. [Google Scholar] [CrossRef]
- Delgado, R.C.; Wanderley, H.S.; Pereira, M.G.; Almeida, A.Q.d.; Carvalho, D.C.d.; Lindemann, D.d.S.; Zonta, E.; Menezes, S.J.M.d.C.d.; Santos, G.L.d.; Santana, R.O.d.; et al. Assessment of a New Fire Risk Index for the Atlantic Forest, Brazil. Forests 2022, 13, 1844. [Google Scholar] [CrossRef]
- Dhar, T.; Bhatta, B.; Aravindan, S. Forest fire occurrence, distribution and risk mapping using geoinformation technology: A case study in the sub-tropical forest of the Meghalaya, India. Remote Sens. Appl. Soc. Environ. 2023, 29, 100883. [Google Scholar] [CrossRef]
- Barmpoutis, P.; Kastridis, A.; Stathaki, T.; Yuan, J.; Shi, M.; Grammalidis, N. Suburban Forest Fire Risk Assessment and Forest Surveillance Using 360-Degree Cameras and a Multiscale Deformable Transformer. Remote Sens. 2023, 15, 1995. [Google Scholar] [CrossRef]
- Shao, Y.; Wang, Z.; Feng, Z.; Sun, L.; Yang, X.; Zheng, J.; Ma, T. Assessment of China’s forest fire occurrence with deep learning, geographic information and multisource data. J. For. Res. 2023, 34, 963–976. [Google Scholar] [CrossRef]
- Brody-Heine, S.; Zhang, J.; Katurji, M.; Pearce, H.G.; Kittridge, M. Wind vector change and fire weather index in New Zealand as a modified metric in evaluating fire danger. Int. J. Wildland Fire 2023, 32, 872–885. [Google Scholar] [CrossRef]
- Chen, Z.; Zhang, C.; Li, W.; Gao, L.; Liu, L.; Fang, L.; Zhang, C. Fire danger forecasting using machine learning-based models and meteorological observation: A case study in Northeastern China. Multimed. Tools Appl. 2023, 1, 1–21. [Google Scholar] [CrossRef]
- Delgado, R.C.; Santana, R.O.d.; Gelsleichter, Y.A.; Pereira, M.G. Degradation of South American biomes: What to expect for the future? Environ. Impact Assess. Rev. 2022, 96, 106815. [Google Scholar] [CrossRef]
- Li, L.; Vrieling, A.; Skidmore, A.; Wang, T.; Turak, E. Monitoring the dynamics of surface water fraction from MODIS time series in a Mediterranean environment. Int. J. Appl. Earth. Obs. Geoinf. 2018, 66, 135–145. [Google Scholar] [CrossRef]
- Barbosa, M.L.F.; Delgado, R.C.; Andrade, C.F.d.; Teodoro, P.E.; Junior, C.A.S.; Wanderley, H.S.; Capristo-Silva, G.F. Recent trends in the fire dynamics in Brazilian Legal Amazon: Interaction between the ENSO phenomenon, climate and land use. Environ. Dev. 2021, 39, 100648. [Google Scholar] [CrossRef]
- Alvares, C.A.; Stape, J.L.; Sentelhas, P.C.; Gonçalves, J.D.M.; Sparovek, G. Köppen’s climate classification map for Brazil. Meteorol. Zeitschrift 2013, 22, 711–728. [Google Scholar] [CrossRef]
- Silva Júnior, L.A.S.; Delgado, R.C.; Pereira, M.G.; Teodoro, P.E.; Silva Junior, C.A.d. Fire dynamics in extreme climatic events in western amazon. Environ. Dev. 2019, 32, 100450. [Google Scholar] [CrossRef]
- Bento, V.; Lima Jucá, E.V.; Menezes, R.S.d.; Lima, B.C.d.L.; Veras, N.M.; Moura, S.S. Interpretando a diversidade climática do Acre através da leitura de climogramas. Uáquiri 2022, 3, 2. [Google Scholar] [CrossRef]
- IBGE. Brasil/Acre. Available online: https://cidades.ibge.gov.br/brasil/ac/panorama (accessed on 5 December 2023).
- Arévalo, S.M.M.; Delgado, R.C.; Lindemann, D.d.S.; Gelsleichter, Y.A.; Pereira, M.G.; Rodrigues, R.d.Á.; Justino, F.B.; Wanderley, H.S.; Zonta, E.; Santana, R.O.d.; et al. Past and Future Responses of Soil Water to Climate Change in Tropical and Subtropical Rainforest Systems in South America. Atmosphere 2023, 14, 755. [Google Scholar] [CrossRef]
- Xavier, A.C.; Scanlon, B.R.; King, C.W.; Alves, A.I. New improved Brazilian daily weather gridded data (1961–2020). Int. J. Climatol. 2022, 42, 8390–8404. [Google Scholar] [CrossRef]
- Volpato, M.; Andrade, C.F.; Silva, E.L.; Barbosa, M.L.; Andrade, M.D.; Rocha, P.V.; Delgado, R.C.; Teodoro, P.E.; Silva, C.A.; Pereira, M.G. Fire foci and their spatiotemporal relations to weather variables and land uses in the state of Mato Grosso. Environ. Dev. Sustain. 2023, 25, 12419–12438. [Google Scholar] [CrossRef]
- SGB. RADAM-D. Available online: https://www.sgb.gov.br/publique/Geologia/Sensoriamento-Remoto-e-Geofisica/RADAM-D-628.html (accessed on 20 December 2023).
- INPE. Prodes—Amazônia. Available online: http://www.obt.inpe.br/OBT/assuntos/programas/amazonia/prodes (accessed on 10 December 2023).
- IBGE. PAM—Produção Agrícola Municipal. Available online: https://www.ibge.gov.br/estatisticas/economicas/agricultura-e-pecuaria/9117-producao-agricola-municipal-culturas-temporarias-e-permanentes.html?edicao=18051&t=series-historicas (accessed on 10 December 2023).
- Copernicus Climate Change Service. CMIP6 Climate Projections. Available online: https://cds.climate.copernicus.eu/cdsapp#!/dataset/projections-cmip6?tab=overview (accessed on 10 December 2023).
- Mann, H.B. Nonparametric tests against trend. Econom. J. Econom. Soc. 1945, 13, 245–259. [Google Scholar] [CrossRef]
- Kendall, K. Thin-film peeling-the elastic term. J. Phys. D: Appl. Phys. 1975, 8, 1449–1452. [Google Scholar] [CrossRef]
- Pettitt, A.N. A non-parametric approach to the change-point problem. Appl. Stat. 1979, 28, 126–135. [Google Scholar] [CrossRef]
- Ferreira, I.J.M.; Campanharo, W.A.; Barbosa, M.L.F.; Silva, S.S.d.; Selaya, G.; Aragão, L.E.O.C.; Anderson, L.O. Assessment of fire hazard in Southwestern Amazon. Front. For. Glob. Change. 2023, 6, 1107417. [Google Scholar] [CrossRef]
- Mataveli, G.; de Oliveira, G.; Silva-Junior, C.H.L.; Stark, S.C.; Carvalho, N.; Anderson, L.O.; Gatti, L.V.; Aragão, L.E.O.C. Record-breaking fires in the Brazilian Amazon associated with uncontrolled deforestation. Nat. Ecol. Evol. 2022, 6, 1792–1793. [Google Scholar] [CrossRef]
- Kerr, G.H.; DeGaetano, A.T.; Stoof, C.R.; Ward, D. Climate change effects on wildland fire risk in the Northeastern and Great Lakes states predicted by a downscaled multi-model ensemble. Theor. Appl. Climatol. 2018, 131, 625–639. [Google Scholar] [CrossRef]
- Faria, B.L.; Brando, P.M.; Macedo, M.N.; Panday, P.K.; Soares-Filho, B.S.; Coe, M.T. Current and future patterns of fire-induced forest degradation in Amazonia. Environ. Res. Lett. 2017, 12, 095005. [Google Scholar] [CrossRef]
- Nações Unidas Brasil. Últimos Oito Anos Foram Os Mais Quentes Já Registrados, Revela Relatório Das Nações Unidas. Available online: https://brasil.un.org/pt-br/228847-últimos-oito-anos-foram-os-mais-quentes-já-registrados-revela-relatório-das-nações-unidas (accessed on 18 December 2023).
- Notícias do Acre. Com Safra Recorde, Produção de Milho E Soja No Acre É A Maior Em 30 Anos. Available online: https://agencia.ac.gov.br/com-safra-recorde-producao-de-milho-e-soja-no-acre-e-a-maior-em-30-anos/ (accessed on 19 December 2023).
- Padrão, G.d.A.; Lirio, V.S.; De Lima, J.E. Determinantes do desmatamento na Amazônia legal: Um estudo de caso do estado do Acre. Rev. De Adm. E NegÓCios Da Amaz. 2016, 8, 85–108. [Google Scholar] [CrossRef]
- Rodrigues, A.F.; Mello, C.R.D.; Terra, M.D.C.N.S.; Beskow, S. Water balance of an Atlantic forest remnant under a prolonged drought period. Ciência E Agrotecnol. 2021, 45, e008421. [Google Scholar] [CrossRef]
- INMET. 2023 É O Mais Quente Em 174 Anos, Confirma Relatório Da OMM. Available online: https://portal.inmet.gov.br/noticias/2023-é-o-mais-quente-em-174-anos-confirma-relatório-da-omm (accessed on 20 December 2023).
- Santos, R.O.; Delgado, R.C.; Pereira, M.G.; Souza, L.P. Physical attributes of the river basin of Roncador river associated to the landscape change in the municipality of Magé, Rio de Janeiro-Brazil. Biosci. J. 2018, 34, 1146–1155. [Google Scholar] [CrossRef]
Disclaimer/Publisher’s Note: The statements, opinions and data contained in all publications are solely those of the individual author(s) and contributor(s) and not of MDPI and/or the editor(s). MDPI and/or the editor(s) disclaim responsibility for any injury to people or property resulting from any ideas, methods, instructions or products referred to in the content. |
© 2024 by the authors. Licensee MDPI, Basel, Switzerland. This article is an open access article distributed under the terms and conditions of the Creative Commons Attribution (CC BY) license (https://creativecommons.org/licenses/by/4.0/).