Article

Soil Carbon and Nitrogen Pools and Their Storage Characteristics under Different Vegetation Restoration Types on the Loess Plateau of Longzhong, China

1
College of Forestry, Gansu Agricultural University, Lanzhou 730070, China
2
College of Agriculture, Gansu Agricultural University, Lanzhou 730070, China
*
Authors to whom correspondence should be addressed.
These authors contributed equally to this work.
Forests 2024, 15(1), 173; https://doi.org/10.3390/f15010173
Submission received: 24 November 2023 / Revised: 31 December 2023 / Accepted: 9 January 2024 / Published: 15 January 2024
(This article belongs to the Section Forest Soil)

Abstract

:
Soil carbon and nitrogen pools are crucial for maintaining the balance of carbon and nitrogen cycling in ecosystems and also for reducing the impacts of global climate change. However, current research lacks an understanding of the effects of long-term vegetation restoration on soil carbon and nitrogen pools and their storage in vulnerable ecosystems. Therefore, we studied the characteristics of soil carbon (soil organic carbon, microbial biomass carbon, dissolved organic carbon) and nitrogen pools (total nitrogen, ammonium nitrogen, nitrate nitrogen) and their storage under four types of vegetation restoration (Stipa bungeana Trin., SB; Caragana korshinskii Kom., CK; Xanthoceras sorbifolia Bunge., XS; Picea asperata Mast., PA) in the Longzhong Loess Plateau area. We found that the carbon and nitrogen pools in the 0–40 cm soil layer under the XS and PA vegetation restoration types were higher compared to those under the SB and CK vegetation, and the values of soil ammonium–nitrogen ratios ranged from 0.72 to 0.83 under different vegetation types. Carbon and nitrogen interactions were stronger in the 0–40 cm soil under PA vegetation, which had significantly higher soil carbon (49.06 t·ha−1) and nitrogen (1.78 t·ha−1) storage than did the other vegetation types. We also found that soil carbon and nitrogen stores differed among different types of vegetation restoration. These elements were mainly distributed in soils from 0 to 20 cm depth, where the carbon and nitrogen pools in soils from 0 to 10 cm exceeded those in the lower layers. Furthermore, we discovered that redundancy analysis (RDA) supported by soil enzyme activity and physical properties significantly explained the variation in soil carbon and nitrogen triggered by vegetation restoration. According to this research, the stability and transformation of soil carbon and nitrogen pools in the region can be influenced by various forms of vegetation restoration. Additionally, the findings highlight that forest vegetation restoration can be a successful strategy for effectively sequestering soil carbon and nitrogen within the Longzhong Loess Plateau area.

1. Introduction

The cycling and transformation of the elements carbon (C) and nitrogen (N) in soil have always been the most important and active part of the elemental cycle in terrestrial ecosystems [1]. At the same time, the source–sink conversion and storage changes of soil C and N pools play a crucial role in regulating atmospheric C and N composition and mitigating global climate change [1,2]. The unstable soil C and N fractions, as active parts of soil C and N pools, are often considered important monitoring indicators to characterize soil nutritional status [3,4]. Research has revealed that soil microbial biomass carbon (MBC) directly contributes to the transformation and decomposition of soil organic matter and is considered a sensitive indicator of soil organic carbon (SOC) and that soil dissolved organic carbon (DOC) is more sensitive to external influences and changes in soil quality [3,5]. In addition, ammonium nitrogen (NH4+-N) and nitrate nitrogen (NO3-N) are the main types of N that plants directly absorb from the soil [6]. It is well known that soil C and N pools can be rapidly altered by small changes in the external environment and have some indicator function for ecosystem degradation or recovery [5,7]. Therefore, it is necessary to elucidate changes in the storage of C and N components in soils in order to better understand the characterization of the C and N pools in terrestrial ecosystems in the context of global climate change, as well as future changes in C and N storage.
Vegetation restoration enhances the regional ecological stability of terrestrial ecosystems and occupies an indispensable position in ecosystem C and N sinks [8,9]. Restored vegetation has been reported to alter trends in soil carbon and nitrogen sequestration and transformation of its associated pools, which is influenced by a variety of external factors, including soil characteristics (e.g., soil bulk density, pH, moisture, and temperature), climate, and type of vegetation restored [2,8,10,11]. Some previous studies have found that complex surface species compositions of forest vegetation can provide more soil litter, resulting in significantly higher soil total nitrogen (TN), NO3-N, SOC content, and soil C and N interactions than can shrub and grass vegetation [4,12]. During the restoration of vegetation from 0 to 21 years, the growth rate of TN, SOC, MBC, and DOC content in the soil of Hippophae rhamnoides Linn. was higher than that of Pinus tabuliformis Carrière. and grassland [13], and the distribution of C and N in the soil also changed [14]. In addition, most of the soil C and N stocks under different restored vegetation were concentrated in the upper soil layer [10,15], with more than 79% of the C stored in the 0–100 cm soil layer and more than 51% of the N stored in the 0–50 cm soil N pool [10]. Some studies have also found that the soil DOC concentration in varied vegetation restoration types is predominantly influenced by alkaline phosphatase [13,16]. Catabolic reaction involving catalase is instrumental during the gradual reduction of SOC content, while urease primarily affects it when SOC stabilizes [13]. These research studies have established a partial understanding of the correlation between types of vegetation restoration and soil C and N pools and stocks. However, the effects of long-term vegetation restoration on soil C and N pools in ecologically fragile areas under global climate change have not been sufficiently studied. Soil C and N pools in ecologically fragile areas play an important role in the C and N cycling of terrestrial ecosystems [14], and changes in the way vegetation is restored have much greater impacts on ecologically fragile areas than on other systems in the context of global climate change [8,17]. Therefore, in ecologically fragile areas, it is imperative to study the changes in soil C and N pools under different vegetation restoration methods.
The Longzhong Loess Plateau is frequently regarded as one of the Earth’s most vulnerable ecosystems [18]. Since 1990, the “Return of Farmland to Forest and Grassland Program” has been implemented in the region to restore its ecology [18,19]. Researchers have shown that converting farmland to forest and grassland can improve the C and N sinks and C emission reduction capacity of ecosystems and mitigate regional climate change [20]. For example, vegetation restoration has effectively increased soil C and N storage in desert regions [21] and southern China [22], and restoration of vegetation types such as Xanthoceras sorbifolia Bunge. and Suaedaglauca Bunge. has reduced carbon dioxide (CO2) and nitrous oxide (N2O) emissions in the soil of the Loess Plateau [23] and the Yangtze River Delta [24] regions, respectively. In the Loess Plateau region, large areas of sloping land have been abandoned and revegetated by allowing it to recover naturally to grassland or by converting it to trees and shrublands [18,25]. Several studies have demonstrated that different vegetation restoration types can have effects on nutrient supply [26] and microbial and enzymatic activities [16,27] in the area. Moreover, vegetation restoration in the region has reduced soil erosion [16,28], facilitated water storage in the soil [29], and promoted the rapid development of regional productivity [30], which ultimately improves soil quality [28,31]. In addition, there have been reports suggesting that the interplay among soil elements C and N can be modified through various modes of vegetation restoration, consequently influencing the cycling of C and N within terrestrial ecosystems [21,32]. However, the changing patterns of soil C and N pools and the interactions between C and N during long-term vegetation restoration on the Longzhong Loess Plateau have been relatively little studied, which has greatly affected our understanding of soil C and N cycling processes during long-term vegetation restoration in fragile habitats.
To supplement the above studies, we investigated the effects of four vegetation restoration types (Stipa bungeana Trin., SB; Caragana korshinskii Kom., CK; Xanthoceras sorbifolium Bunge., XS; and Picea asperata Mast., PA) on soil C pools (SOC, MBC, DOC), N pools (TN, NH4+-N, NO3-N), and their storage on the Longzhong Loess Plateau region. The study objectives were as follows: (a) investigate the attributes of alterations in the pools of soil C and N, as well as the variances in the interactions between C and N, across various types of vegetation restoration; and (b) investigate the main factors contributing to changes in the C and N pools of soils. The hypothesis was as follows: (1) soil C and N pools under different vegetation restoration types exhibit significant spatial differences in soil profiles, with soil C and N storage primarily concentrated in shallow soils, and (2) compared to naturally restored grassland, planted forest restoration vegetation with a complex composition of surface species has stronger C and N interactions and can effectively contribute to the accumulation and transformation of soil C and N elements.

2. Materials and Methods

2.1. Study Area

The study areas are located at Dingxi City, Gansu Province, China’s Experimental Station for Soil and Water Conservation Science (104°12′48″–105°01′06″ E, 35°17′54″–36°02′40″ N). This area belongs to the Anjiagou watershed of the Longzhong Loess Plateau, with a watershed area of 8.56 km2 and an average altitude of 2000 m [19]. The watershed has a typical midtemperate semiarid climate, with an average annual temperature of 6.3 °C recorded between 1998 and 2018. Additionally, the majority of precipitation occurs between the months of July and September, with an estimated total of around 203.79 mm [18]. The soils in the study area are secondary loess soils (Entisols in soil taxonomy of the USDA), characterized as yellowish, loose, and macroporous with a clayey or loamy texture [33]. The soil developed from a loose loess parent material formed under cold and dry climatic conditions during the Quaternary period and is rich in secondary calcium carbonate and small amounts of gypsum, iron, and manganese oxides, with quartz and feldspar dominating its mineral composition [34]. Before the 1990s, the vegetation within the watershed underwent intentional deforestation and clearance. Subsequently, in 1999, the “Program for Transforming Farmland into Forests and Grasslands” initiative began to facilitate natural regeneration following farmland abandonment. This project encompassed both the artificial cultivation of trees, shrubs, and herbaceous plants and the restoration of ecological balance [15,19]. Currently, the vegetation restoration types in this region are mainly natural restoration herbs such as Stipa bungeana Trin. and artificial afforestation trees such as Caragana korshinskii Kom., Xanthoceras sorbifolium Bunge., and Picea asperata Mast. [15,18,19,35].

2.2. Experimental Design

In July 2019, four vegetation restoration (Stipa bungeana, SB; Caragana korshinskii, CK; Xanthoceras sorbifolia, XS; Picea asperata, PA) test areas with a similar soil disturbance history in this test area were selected, each measuring 20 × 20 m (Table 1). Three sample plots were randomly selected for each vegetation type (8 × 8 m), and we measured the soil properties (both physical and chemical) of the 0–40 cm soil layer across various vegetation restoration types (Table 2).

2.3. Soil Sampling

Soil samples were collected at the end of each month, specifically from August to October 2019, from the soil layer of 0–40 cm (including 0–10 cm, 10–20 cm, and 20–40 cm). The collection was done using the “S” sampling method [1,18]. Following the removal of any debris found in the soil samples, the soil from each sample site within the same layer was merged to create a composite soil sample. Subsequently, this composite sample was transported to the laboratory.

2.4. Soil Analysis

2.4.1. Soil Environmental Factors

Soil bulk weight (BD), field water holding capacity (FWHC), and soil total porosity (STP) were determined with the ring knife method [36]. Briefly, we retrieved the original soil using a specific volume of cutting rings, recorded the weight of the original soil after 24 h of water immersion and 48 h of dry sand standing, and dried it in an oven at 105 °C for 24 h. Then, we calculated soil BD, FWHC, and STP. Soil pH was measured using a PHS-3S pH meter (INESA Scientific Instrument Co., Shanghai, China) through a 1:2.5 (soil:water) aqueous suspension [18]. Soil water content (SWC) was determined by drying the soil in an oven at 105 °C until a constant weight was achieved [36]. Soil total phosphorus (TP) was determined following the method of Wu et al. [37]. Air-dried soil samples (1 g) were digested at 400 °C with 5 mL of concentrated H2SO4. Once the extracting solution turned into a cloudy white hue, the process of heating was discontinued and followed by the transferring of the entire solution to a volumetric flask with a capacity of 100 mL. From this solution, an amount of 10 mL was utilized for assessing the overall phosphorus content through a molybdenum colorimetric method [37].
Sucrase and amylase activities were determined by colorimetric assay of 3,5-dinitrosalicylic acid according to Wang et al. [15]. Briefly, the soil was incubated with substrates (8% glucose solution, 2% starch solution), phosphate buffer (pH 5.5, pH 5.6), and 5 drops of toluene at 37 °C for 24 h. After incubation, the filtrate was filtered, and a portion of the filtrate was mixed together with 3,5-dinitrosalicylic acid solution in a volumetric flask and heated for 5 min. When the temperature reached room temperature, soil sucrase, and amylase activities were measured with an ultraviolet spectrophotometer (Beijing Uptech Co., Ltd., Beijing, China) at 508 nm and 540 nm, respectively, on the soil solution in the flask.
The measurement of soil urease activity was conducted utilizing the urea colorimetric technique as outlined by Ren et al. [16]. The experimental procedure involved employing a solution containing 10% urea as the substrate. A 2 g portion of soil was subjected to treatment with 10 mL of 10% urea, 20 mL of citrate buffer (1 M, pH 6.7), and 1 mL of toluene, followed by incubation at 37 °C for a duration of 24 h. Subsequent to the incubation period, the obtained mixture was subjected to filtration, and a resultant amount of 1 mL of filtrate was combined with 4 mL of sodium phenol solution and 3 mL of sodium hypochlorite solution (0.9%). The urease activity was quantified at a wavelength of 578 nm using an ultraviolet spectrophotometer (Beijing Uptech Co., Ltd., Beijing, China).
Soil protease activity was determined according to the method of Lin et al. [38]. Soil (2 g) was treated with 1 mL of toluene and 20 mL of casein solution (1%) and incubated at 30 °C for 24 h. After incubation, filtration was carried out, and 5 mL of filtrate was taken and mixed with 0.5 mL of sulfuric acid (0.05 M), 3 mL of sodium sulfate (20%), and 1 mL of ninhydrin (2%) and heated for 10 min. Protease activity was determined with an ultraviolet spectrophotometer (Beijing Uptech Co., Ltd., Beijing, China) at 560 nm.

2.4.2. Soil Carbon and Nitrogen Pools

We employed the Walkley–Black oxidation technique [39] to assess the SOC content. In this method, 0.1 g of soil samples was subjected to extraction using 7.5 mL of K2Cr2O7 (0.4 M) and 7.5 mL of concentrated H2SO4 at a temperature of 180 °C for a duration of 30 min. The SOC content was then calculated by assessing the decrease in potassium dichromate consumption. We used the method of He et al. and Wu et al. [3,37] for determination in fresh soil samples using fumigation extraction. Fumigated and nonfumigated soils were extracted with 0.5 M K2SO4, 5 mL of the extracted supernatant was titrated with the SOC method, and the MBC content was calculated as follows: (Cfumigated − Cnon-fumigated)/0.38. The microbial efficiency quotient (QMBC) was the ratio of soil MBC content to SOC content [40]. Alternatively, for the determination of DOC content, an externally heated potassium sulfate-leaching–potassium dichromate method was used as described in the study of Gau et al. [8]. The soil samples were digested using H2SO4-H2O2 at 400 °C until a milky color appeared. Subsequently, TN was determined using the semi-micro Kjeldahl method [8]. Meanwhile, fresh soil was extracted with KCl solution (2 M), and soil NH4+-N and NO3-N contents were determined in a Kjeldahl nitrogen analyzer (Beijing Uptech Co., Ltd., Beijing, China) by distillation through a MgO–Dyne alloy (50% Al, 45% Cu, 5% Zn) [37].

2.4.3. Soil Carbon and Nitrogen Storages

The calculation method of soil organic carbon storage (CS) and total nitrogen storage (NS) is as follows [1,32]:
C N s = i = 1 n S O C ( T N ) i × B D i × D i × 0.1
where Cand (N)S are the SOC and TN storages of the 0–40 cm soil (t·ha−1), respectively; i is the number of soil layers (0–10 cm, 10–20 cm, and 20–40 cm); SOC(TN)i is the SOC and TN content of soil layer i (g·kg−1), respectively; BDi is the soil BD of layer i (g·cm−3); Di is the thickness of soil layer i (cm); and 0.1 is the unit conversion factor [1,32].

2.5. Statistical Analysis

Differences in soil environmental factors, C and N pools, and their storage were analyzed between the different vegetation restoration types with SPSS 25.0 software (based on the LSD multiple variance test, with a significance level of 95%, p < 0.05), and the effects of the interaction of vegetation restoration type and soil depth on soil C and N pools were analyzed (based on two-way ANOVA). Redundancy (RDA) and correlation (Pearson) analyses were performed using Canoco 5.0 and Origin 2022 software. The objectives were to assess the correlation between soil C and N storages in different types of vegetation restoration and to explore the association between soil-related environmental factors and soil C and N.

3. Results

3.1. Changes in Soil Environmental Factors under Different Vegetation Restoration Types

The changes in environmental factors (SWC, TP, sucrase, amylase, urease, and protease) in each soil layer (0–10 cm, 10–20 cm, and 20–40 cm) varied significantly (p < 0.05) under different vegetation restoration types (Table 3). Among them, the content of sucrase and SWC was significantly (p < 0.05) higher under the XS and PA vegetation types than under SB and CK in the 0-40 cm soil layers, while the content of amylase was lowest under SB vegetation and significantly (p < 0.05) lower than that under PA vegetation. TP and protease contents in soils under CK vegetation were significantly (p < 0.05) lower than those under the XS and PA vegetation types in the 0–10 cm and 20–40 cm soil layers. Urease content was significantly (p < 0.05) higher in the 0–10 cm layer under SB vegetation than under other vegetation types but significantly (p < 0.05) lower in the 10–20 cm and 20–40 cm layers than that under XS and PA vegetation. In addition, the content of soil environmental factors decreased significantly (p < 0.05) with the increase in soil depth under different vegetation restoration types.

3.2. Changes in Soil Carbon Pools under Different Vegetation Restoration Types

The changes in SOC, MBC, DOC, and QMBC contents in each soil layer (0–10 cm, 10–20 cm, and 20–40 cm) varied significantly (p < 0.05) under different vegetation restoration types (Figure 1). In the 0–40 cm soil layer, XS and PA vegetation increased SOC, MBC, and QMBC by an average of 35.42%, 52.05%, and 14.96%, respectively, compared to SB vegetation. Meanwhile, in the 0–10 cm and 10–20 cm soil layers, soil DOC content was significantly (p < 0.05) higher under XS vegetation than under other vegetation treatments, while soil DOC content in 20–40 cm under SB vegetation was significantly (p < 0.05) lower than under other vegetation treatments. In addition, the contents of SOC, MBC, DOC, and QMBC decreased significantly (p < 0.05) with the increase in soil depth under different vegetation restoration types. A two-way ANOVA indicated a significant effect of vegetation restoration type and soil depth on SOC, as well as a significant interaction (p < 0.05) on soil MBC, DOC, and QMBC (Figure 1).

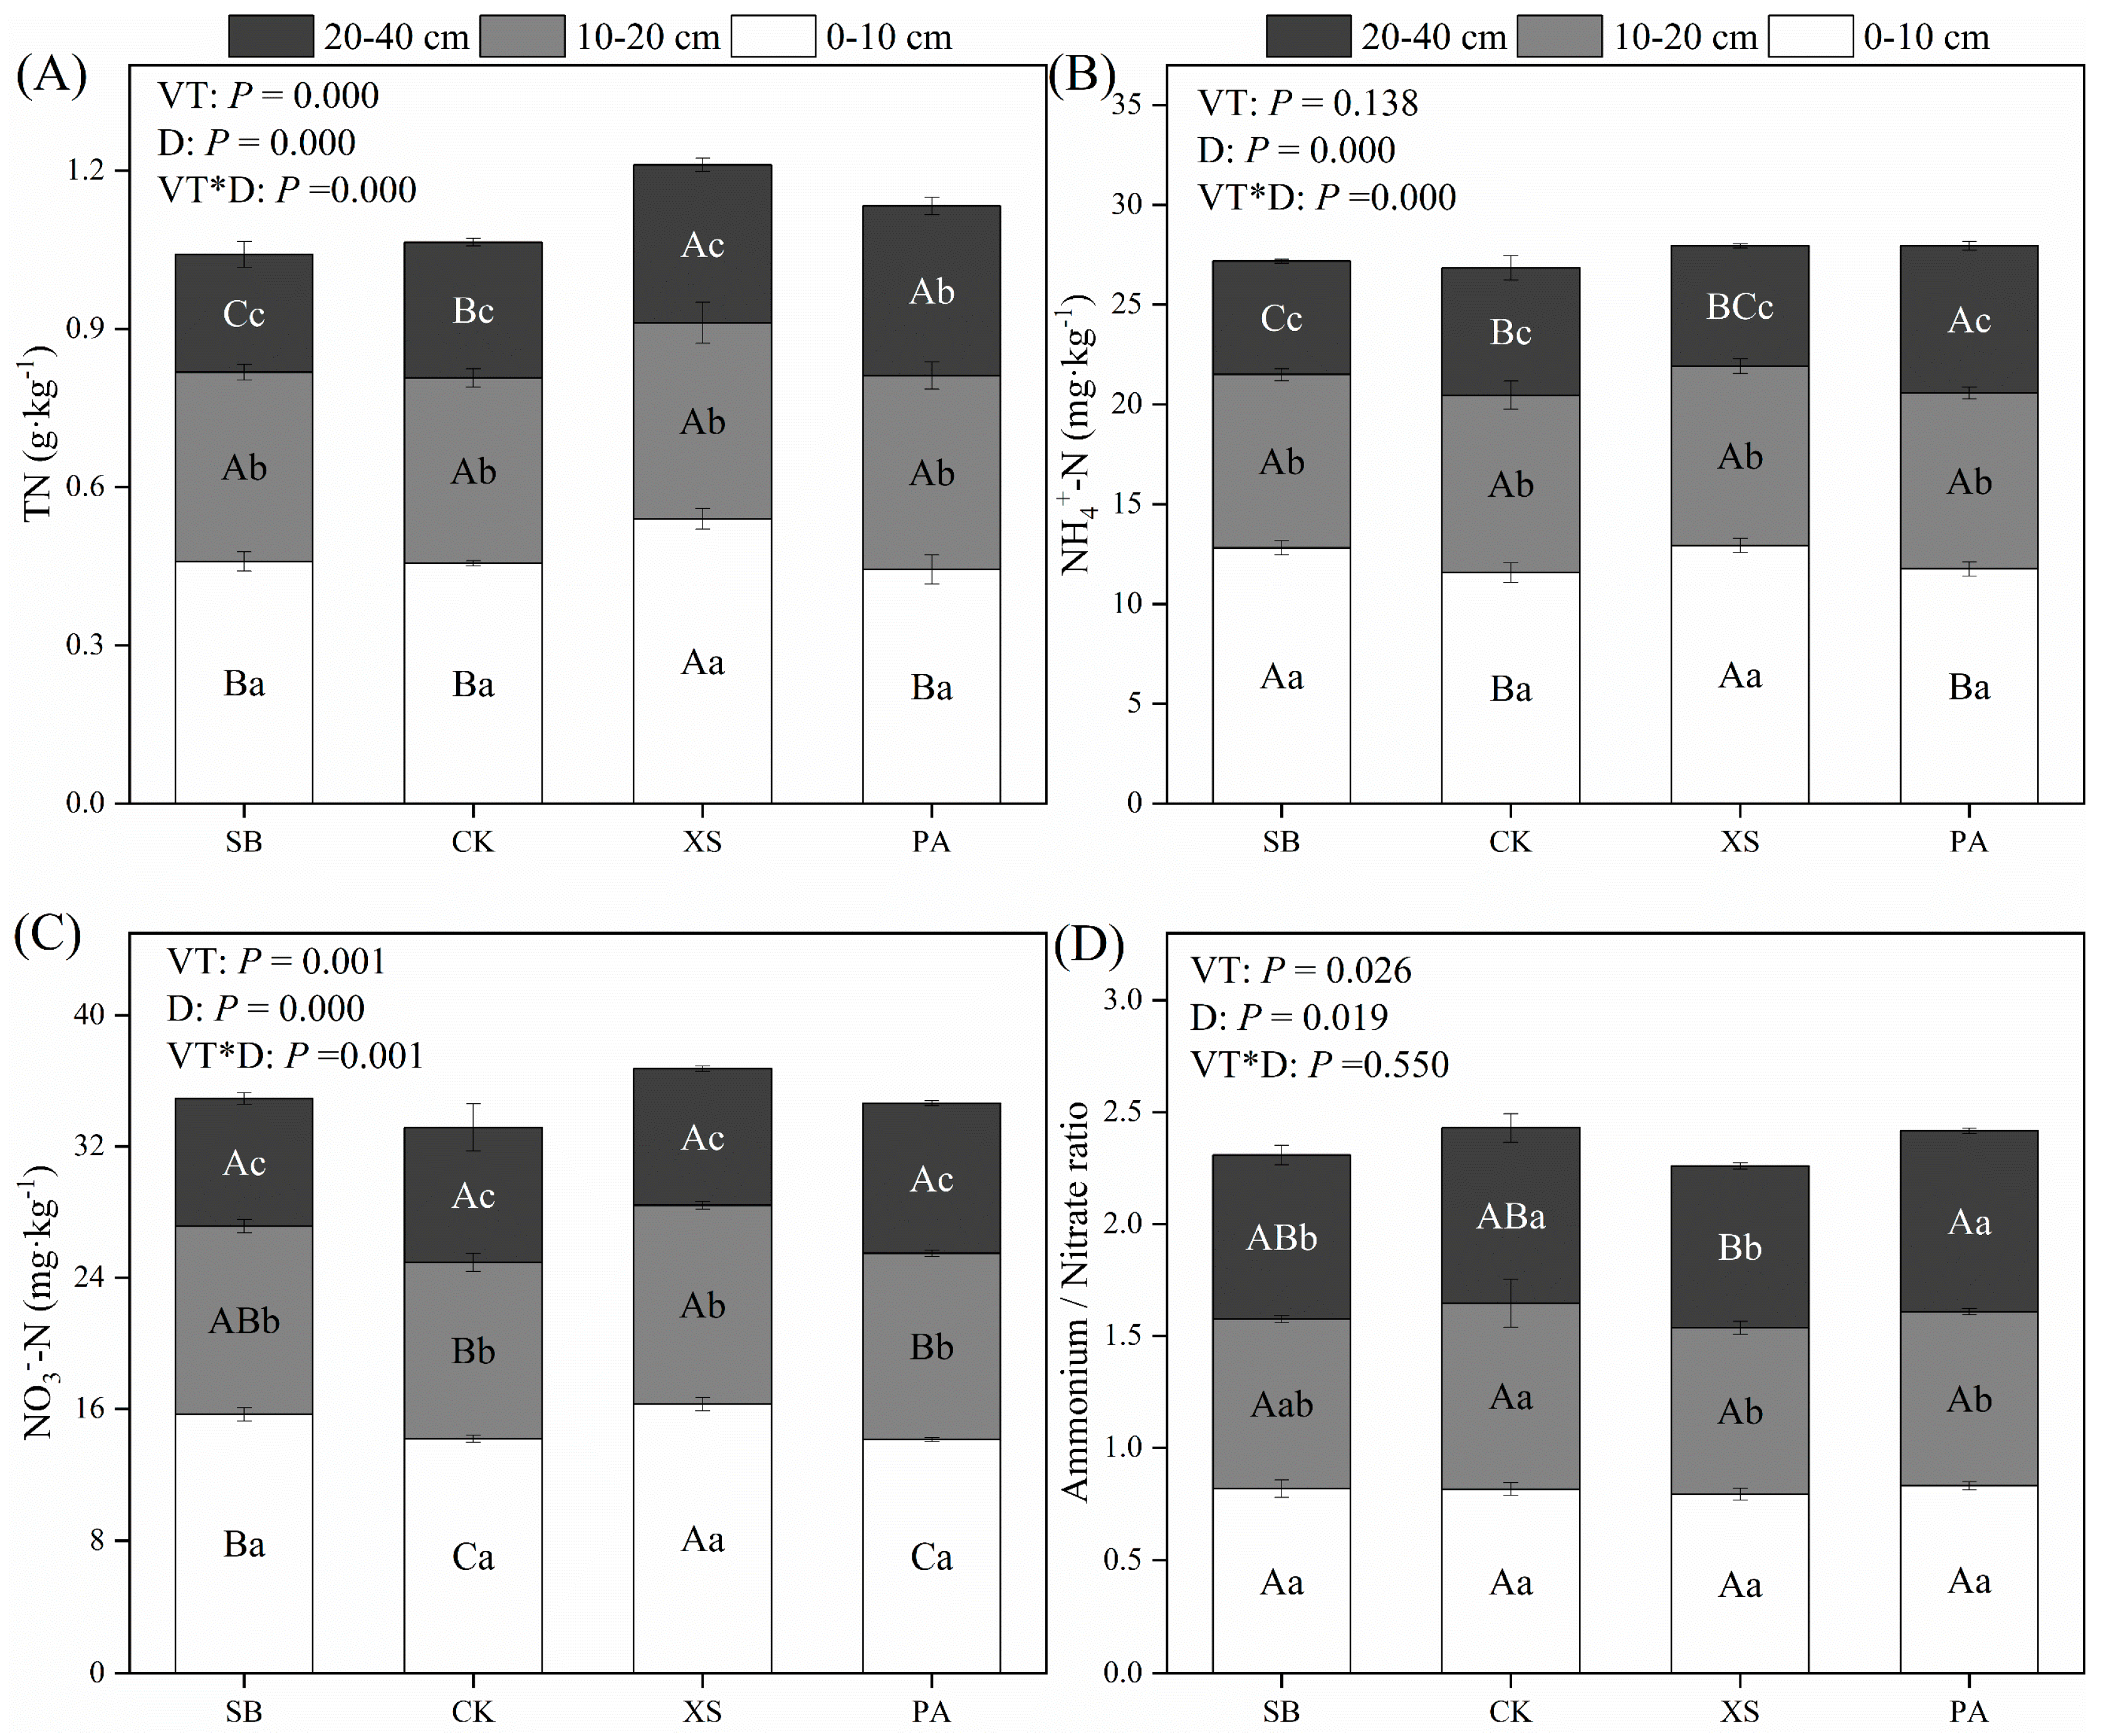
3.3. Changes in Soil N Pools under Different Vegetation Restoration Types

The variation in soil TN, NH4+-N, NO3-N, and ammonium/nitrate ratios varied significantly (p < 0.05) among soil layers (0–10 cm, 10–20 cm, and 20–40 cm) under different vegetation restoration types (Figure 2). Among them, the soil TN, NH4+-N, and NO3-N contents were significantly (p < 0.05) higher under XS vegetation than under SB, CK, and PA vegetation in the 0–10 cm soil layer. At the same time, the NO3-N content of the 10-20 cm soil under XS vegetation (12.12 mg·kg−1) was significantly (p < 0.05) higher than that under CK (12.71%) and PA vegetation (6.85%), respectively. Soil TN, NH4+-N, and ammonium/nitrate ratios were significantly (p < 0.05) higher under PA vegetation in the 20–40 cm soil layer. The ammonium to nitrate ratio in the 0-40 cm soil ranged from 0.72 to 0.83 under different vegetation types. In addition, soil TN, NH4+-N, NO3-N, and ammonium to nitrate ratios decreased significantly (p < 0.05) with increasing depth of the soil layer under different vegetation restoration types. A two-way ANOVA indicated that there was a significant interaction (p < 0.05) between vegetation restoration type and soil depth and soil TN, NH4+-N, and NO3-N (Figure 2).

3.4. Changes in Soil Carbon and Nitrogen Storages and C/N under Different Vegetation Restoration Types

Soil C and N storage in the 0–40 cm soil varied significantly between the different vegetation restoration types, specifically manifesting as PA > XS > SB > CK (p < 0.05) (Table 4). Under the four types of vegetation restoration, soil C, and N storage were mainly concentrated in the shallow soil at a depth of 0–20 cm, accounting for 54.07%–64.59% and 55.87%–66.54% of the total C and N storage in the soil at a depth of 40 cm, respectively. Soil C/N values ranged from 20.63 to 29.36 under different vegetation restoration types and differed significantly (p < 0.05) between soil layers (Table 4). Meanwhile, soil C/N values at 0-40 cm under PA and XS vegetation were significantly (p < 0.05) higher than those under SB and CK vegetation by 13.48%–32.39%.

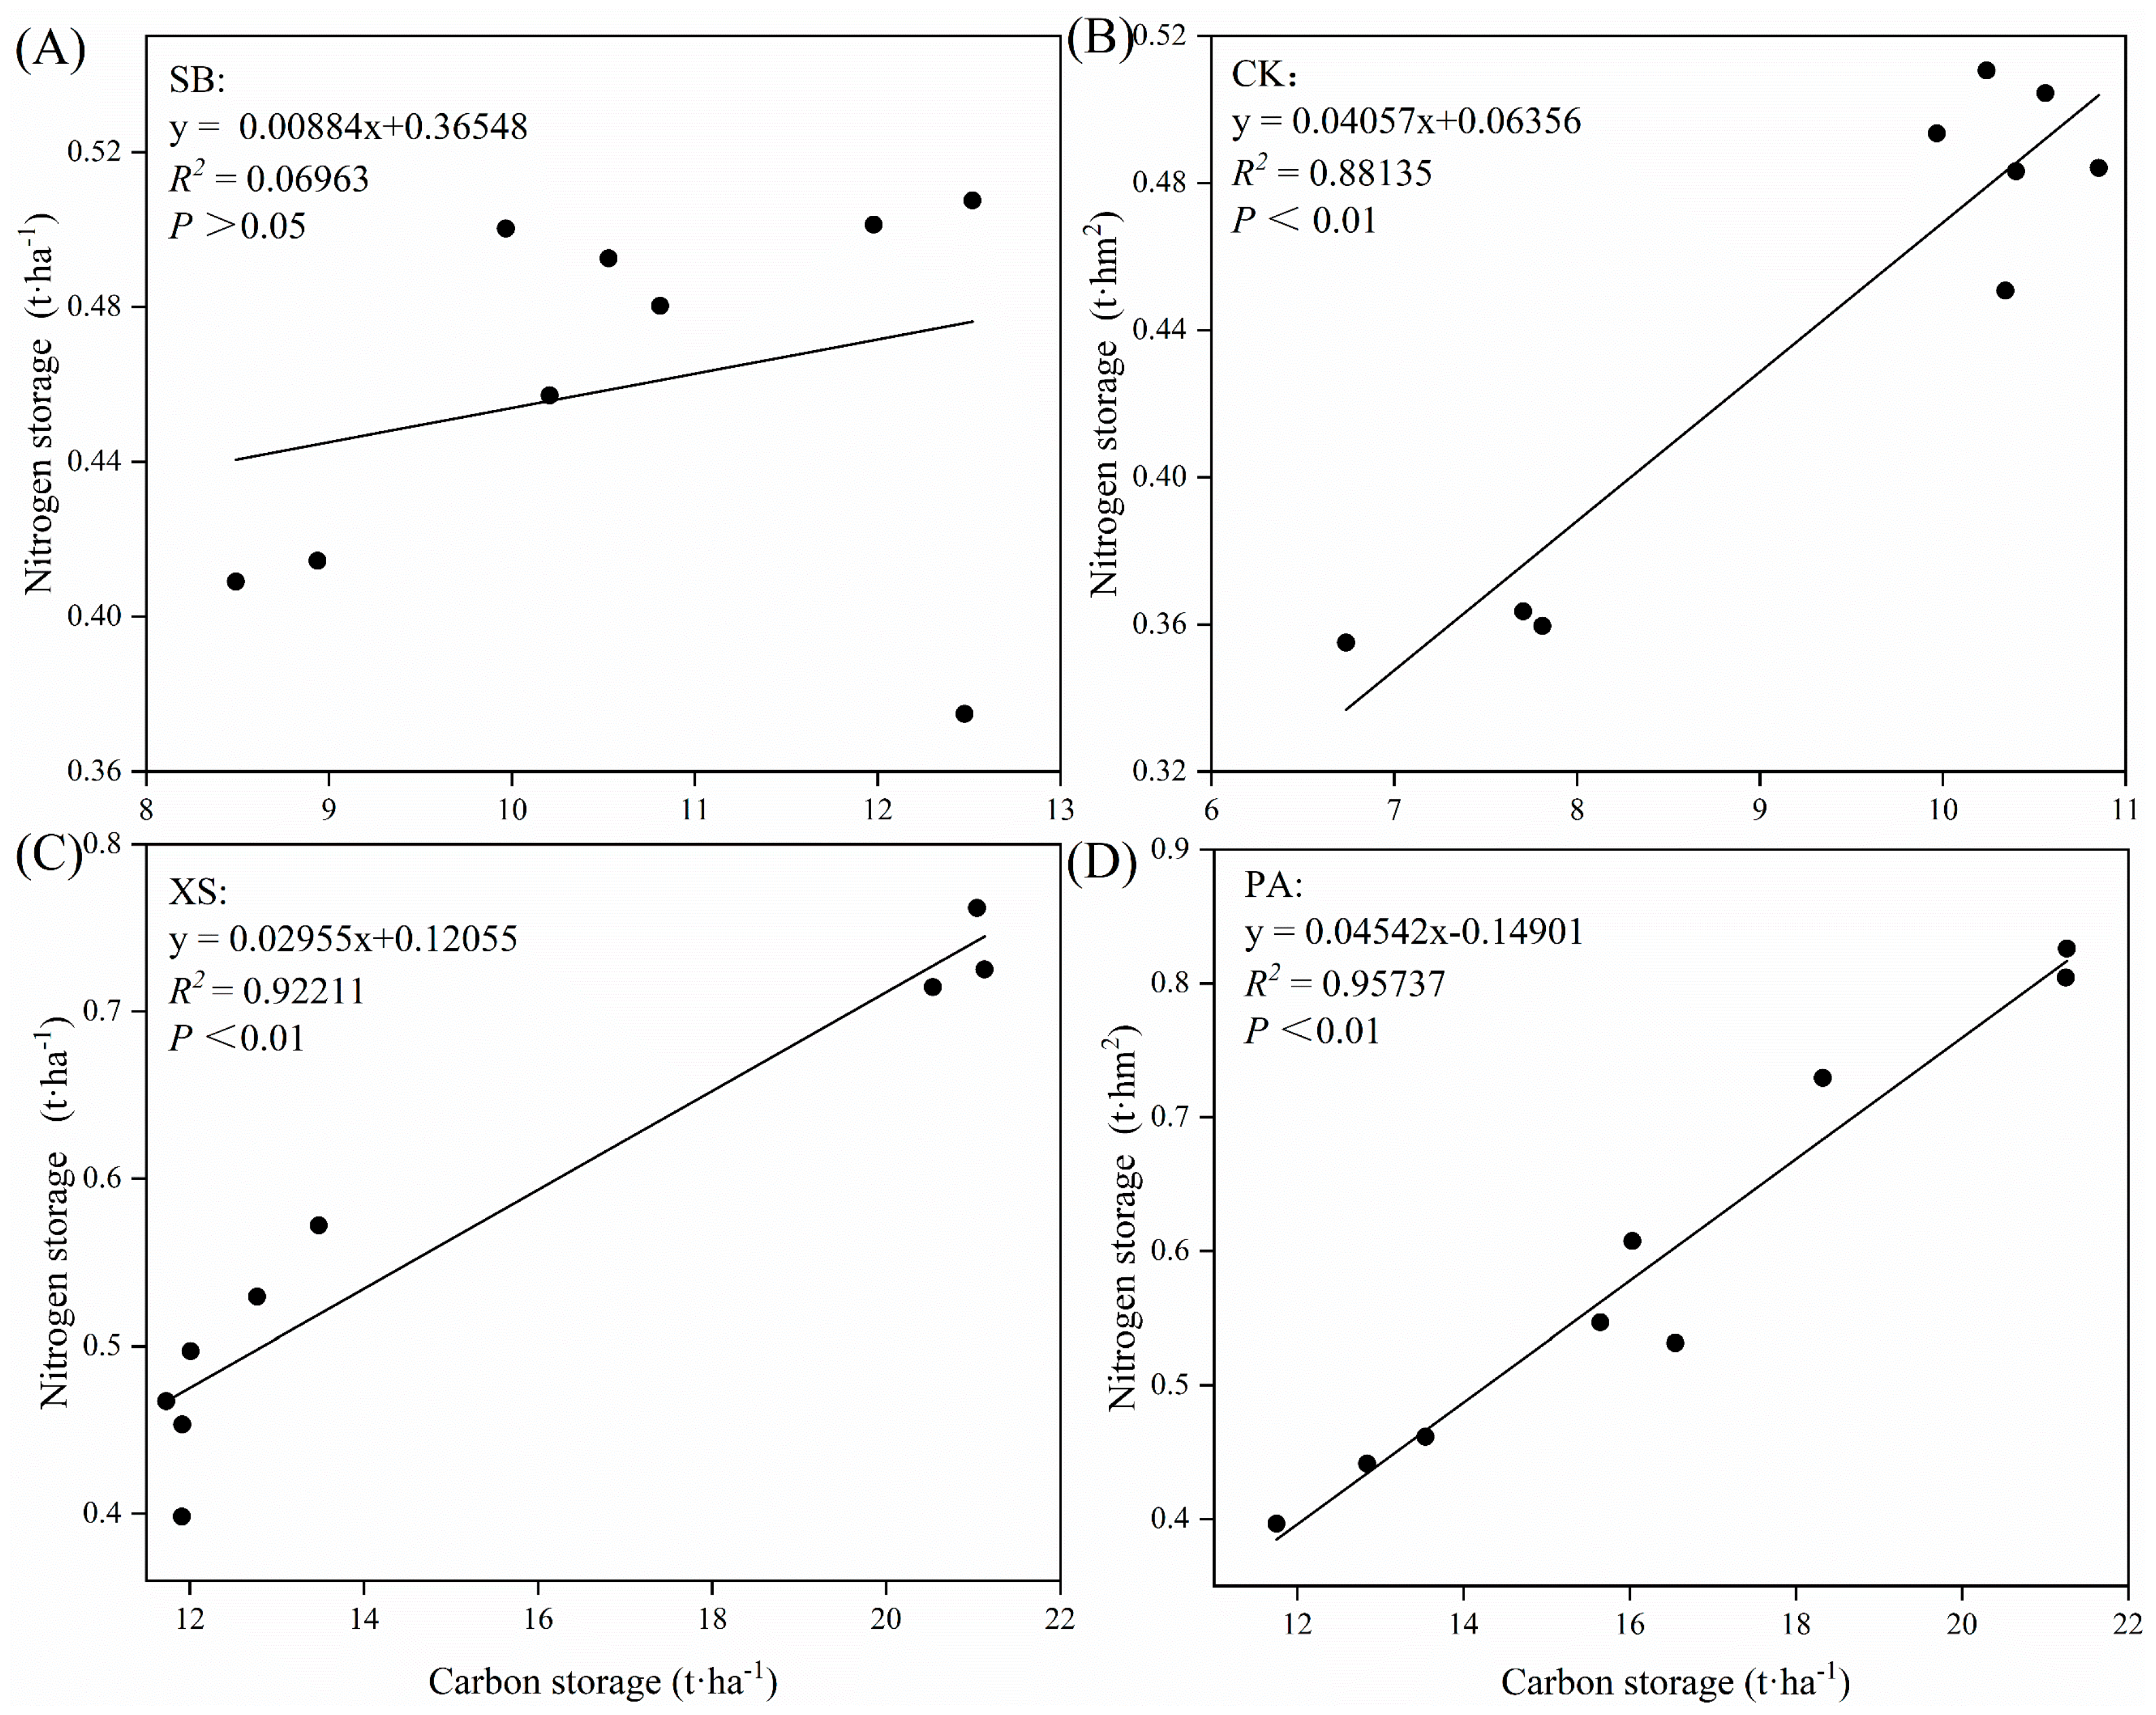
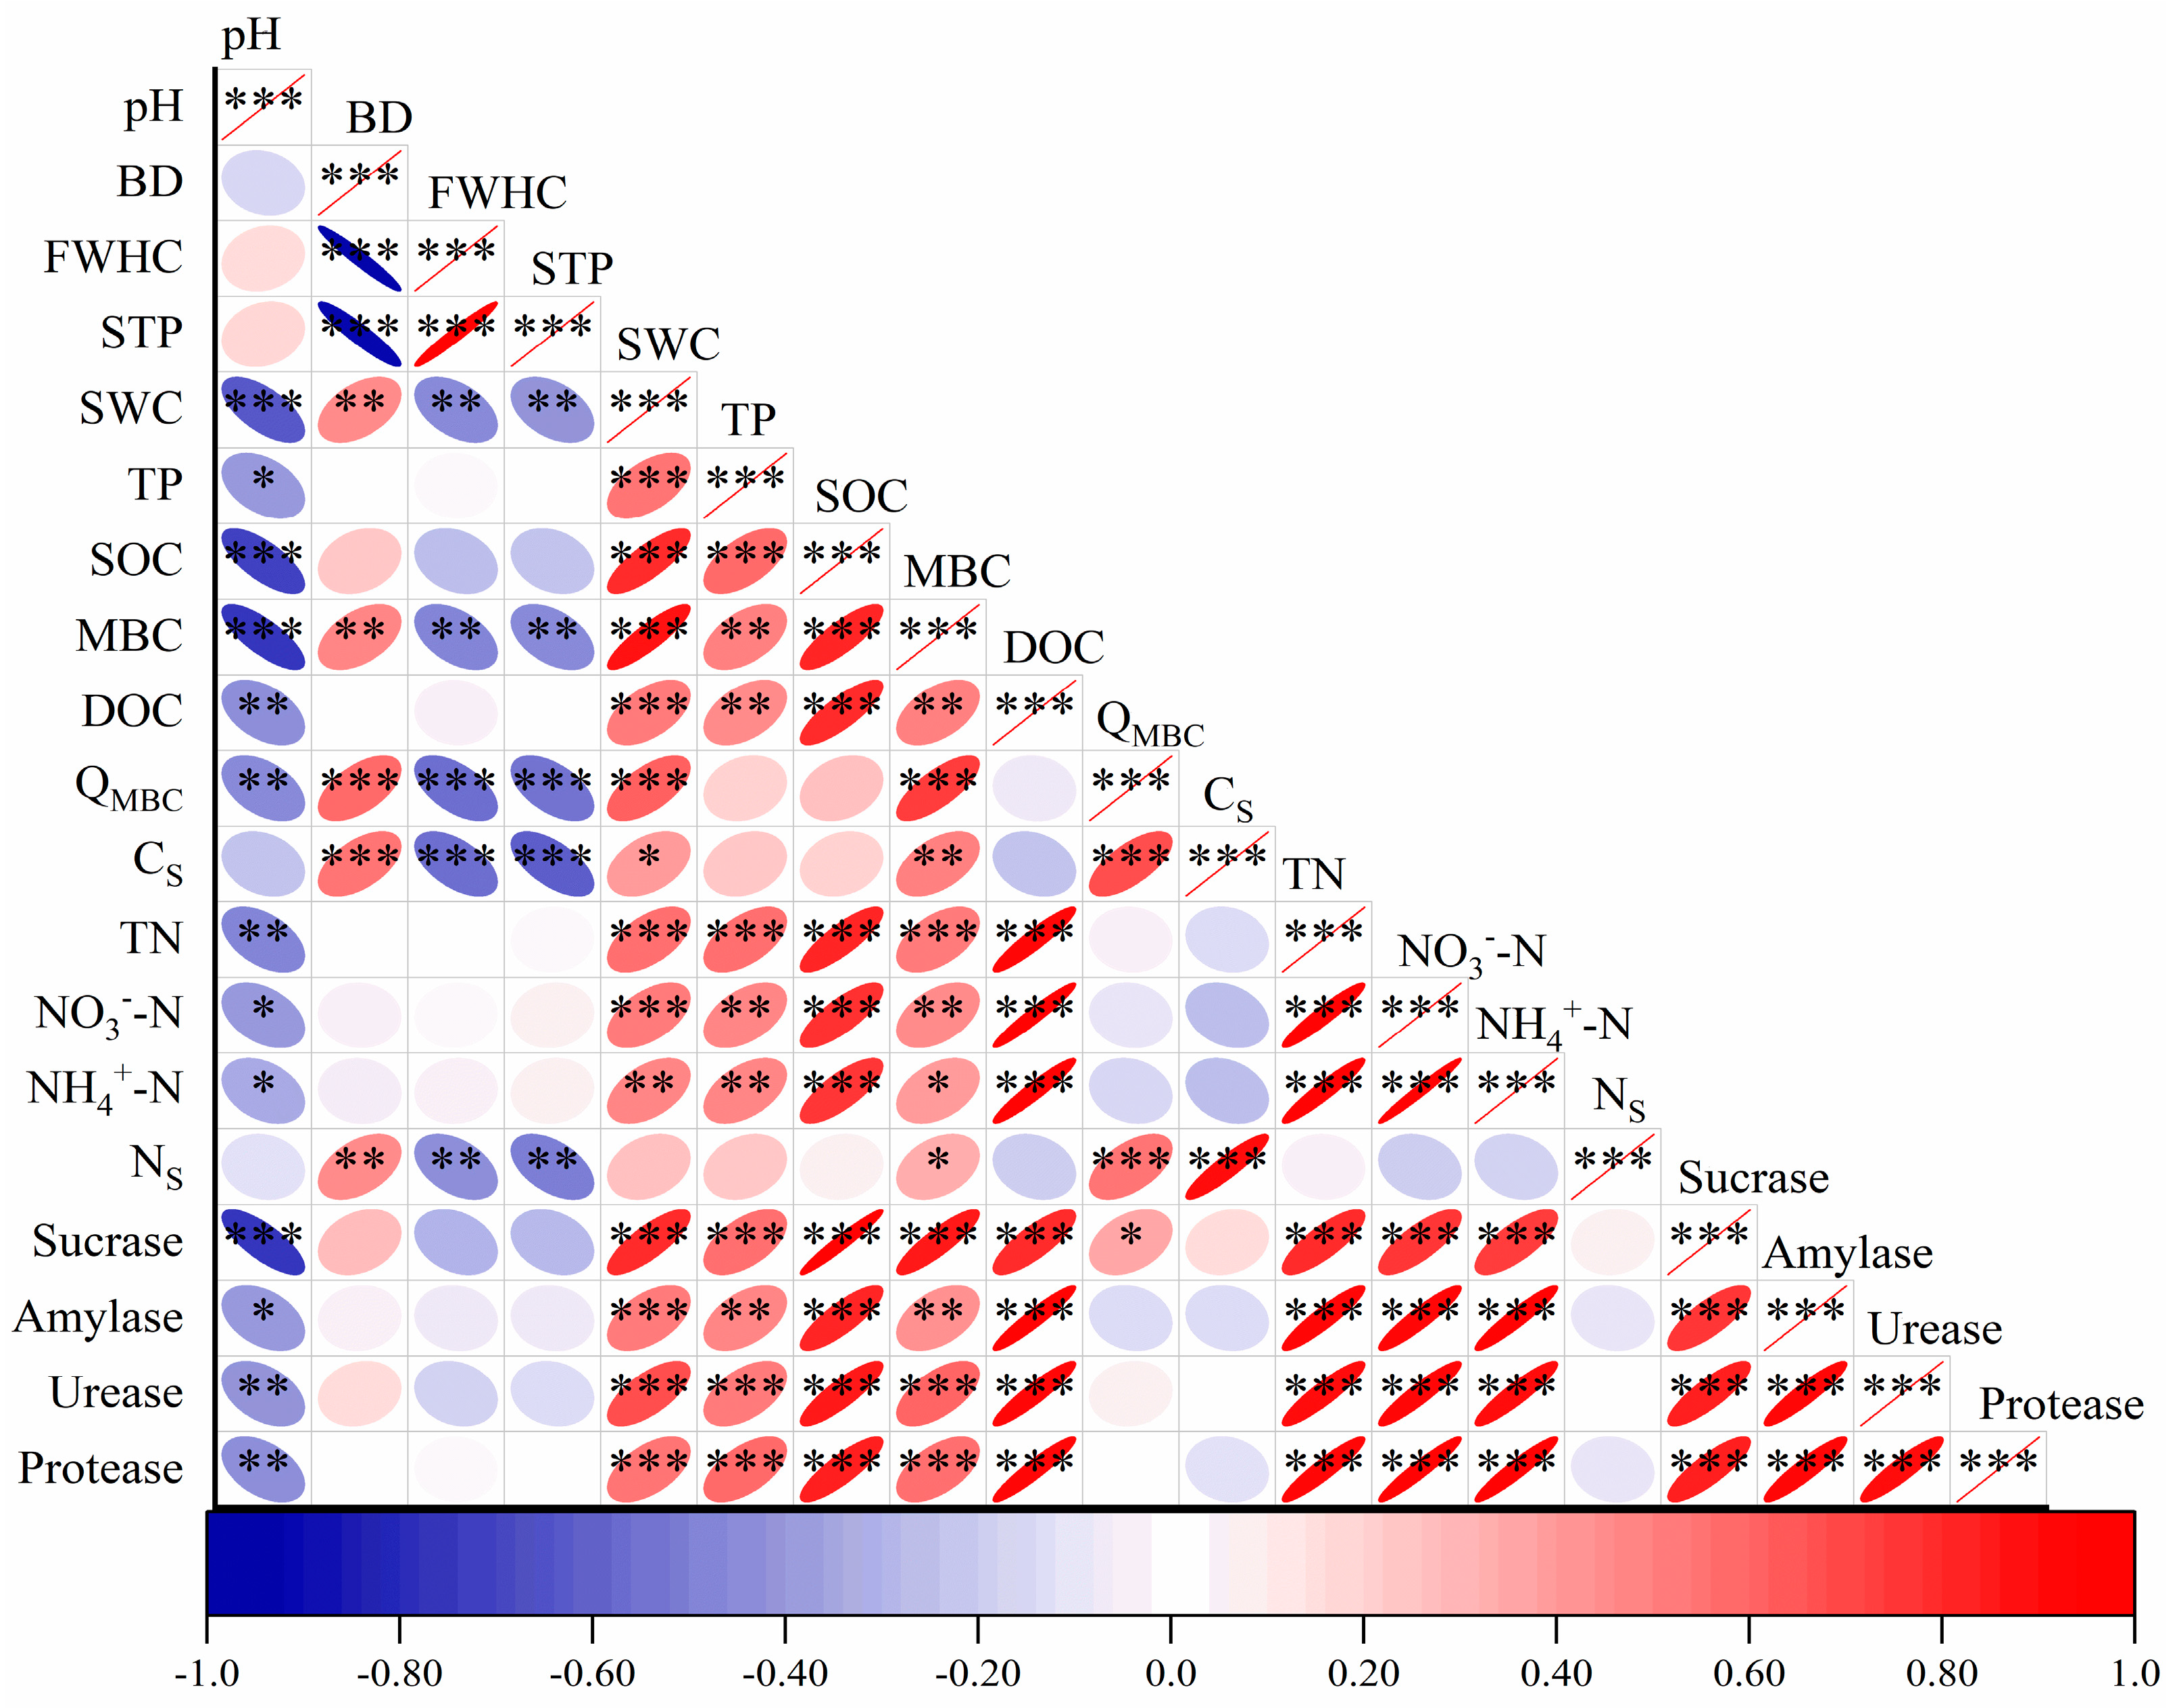
3.5. Relationships between Soil Carbon and Nitrogen Pools and Environmental Factors

Different types of vegetation restoration demonstrated a positive correlation between soil C storage and N storage at a depth of 0–40 cm (Figure 3), and the correlation coefficient under other vegetation treatments was significant (p < 0.05) except for SB vegetation. The slope of the regression between soil C and N stocks was 0.04, 0.03, and 0.05 for CK, XS, and PA vegetation, respectively, indicating that the interaction between soil C and N was stronger under PA vegetation than under other vegetation types.
Soil environmental factors have a greater influence on the 0–40 cm soil C/N pool and its storage capacity across various vegetation restoration types. According to the RDA test findings, the biaxial RDA accounted for 95.97% and 97.13% of the variability in the content of soil C and N, respectively (Table 5). Soil sucrase (degree of explanation = 73.6%) and amylase (degree of explanation = 17.0%) explained the variation in soil C content well (p = 0.002), and both sucrase and amylase showed highly significant positive correlations with C pools (In Figure 4, the smaller the area of the ellipse, the greater the correlation coefficient between the two indicators; at the same time, the ellipse is to the right, which indicates a positive correlation between the two indicators). Soil physical properties (SWC, STP, FWHC) explained a total of 4.5% (p < 0.05) of the variation in soil C content. SWC showed significant positive correlations with both soil C pool and C storage at different levels (p < 0.001 or p < 0.05), while STP and FWHC showed highly significant negative correlations with MBC and C storage, respectively (In Figure 4, the larger the area of the ellipse, the smaller the correlation coefficient between the two indicators; at the same time, the ellipse is to the left, indicating a negative correlation between the two indicators) (p < 0.01 or p < 0.001). Among the environmental factors that influence soil N levels, soil protease, amylase, and urease had the most significant impact. These factors contributed to about 89.7%, 2.5%, and 1.5%, respectively, in explaining the variations in soil N (p < 0.05). Furthermore, there was a strong and positive correlation between these enzymes and the soil nitrogen pool. This correlation was highly significant (p < 0.001) as depicted in Figure 4. STP and BD explained 2.0% and 0.7% of the soil N, respectively (p < 0.05). Among them, STP showed a highly significant negative correlation with N storage, but the opposite relationship was observed between BD and N storage (p < 0.01) (Figure 4). In conclusion, soil enzyme activity and soil physical properties explained well the variation in soil C and N.

4. Discussion

4.1. Effects of Different Vegetation Restoration Types on Soil Carbon and Nitrogen Storages

Restoring vegetation is a reliable approach to bolstering the ecological stability of terrestrial ecosystems in a given region [11]. Nonetheless, research findings indicate that the effects of afforestation for vegetation restoration on the storage of soil C and N differ significantly due to various factors including climate, planted species, and restoration duration [2,5,8,10,11]. These fluctuations can significantly influence the processes of C and N cycling in regional terrestrial ecosystems. Some research has demonstrated a reduction in soil C and N storage during the initial period of vegetation afforestation [11,41], while other research has found no significant changes [14,42]. However, long-term vegetation restoration is effective in increasing soil C and N storage in sandy areas [21], the Himalayas [32], and southern China [22]. Additionally, forest vegetation restoration types have exhibited a greater capacity to store soil C and N than has grassland vegetation [4,12].
This study demonstrated that artificial forest vegetation restoration types (PA, XS) were more effective in increasing C and N storage in soil than were naturally restored grassland (SB). Numerous studies have shown that changes in plant species and environmental factors under different types of restored vegetation will lead to differences in the quantity and quality of above-ground litter and below-ground roots, which in turn will result in different inputs of soil organic matter [10], ultimately affecting the accumulation of C and N in the soil [10,43]. In our study, the complex species composition of the PA and XS vegetation surface (Table 1) provided the soil with high litter accumulation and a complex plant root system, which enhanced the input of the soil C and N elements [22]. At the same time, sufficient water and suitable aeration structure under PA and XS vegetation (Table 2 and Table 3) enhanced soil microbial activity (Table 5 and Figure 4) and increased the contact area between litter, roots, and soil microbes, which in turn facilitated the conversion of exogenous inputs, leading to a higher C and N accumulation in the soil [43]. Furthermore, soil C and N interactions were stronger under PA vegetation than under other vegetation restoration types (Figure 3). It has been shown that higher inputs of exogenous materials allow vegetation to affect the dynamic balance between input and output of soil C and N elements during long-term restoration, which in turn affects soil C and N interactions by changing soil structure [8]. On the other hand, STP showed a highly significant negative correlation with soil C and N stocks in our study (Figure 4), and STP was one of the main factors affecting changes in soil C and N content (Table 5). Therefore, sufficient exogenous inputs and lower STP (Table 2) may be responsible for the stronger soil C and N interactions under PA vegetation.
In our study, soil C and N storages under the four vegetation restoration types were mainly concentrated in shallow soils at a depth of 0–20 cm. This observation aligns with the findings of previous studies [10,44]. Several research studies have indicated that the ample residues of plants and animals, along with plant roots in the topsoil [10], can create an adequate nutrient habitat to facilitate the decomposition and liberation of organic material in the upper layer of soil [15,45]. At the same time, the surface soil has suitable moisture and aeration structure, which is conducive to the reproduction of surface microorganisms (Table 2 and Table 3, Figure 1 and Figure 4) and the decomposition and transformation of exogenous inputs [43,46], which in turn leads to the accumulation of C and N reserves in the shallow soil. On the other hand, with the increase of soil depth in our study, soil moisture and aeration gradually decreased (Table 2 and Table 3), which made the number of soil fauna and microorganisms participating in the biochemical reaction process of exogenous inputs in the lower layer of the soil decrease dramatically (Table 3, Figure 1), which in turn reduced the effect of soil C and N accumulation [46]. The results of this study showed that soil enzyme activity, MBC, and SWC decreased as soil depth increased for all four vegetation restoration types (Table 3, Figure 1). These findings were consistent with the observation that soil C and N storages were predominantly found in the 0–20 cm soil layer. Additionally, the analysis revealed that the variation in soil C and N storages could be effectively explained by soil enzyme activity, MBC, and SWC (Table 5, Figure 4). This further supported the conclusion that these soil properties played a significant role in determining the distribution of soil C and N storages.

4.2. Effects of Different Vegetation Restoration Types on Soil Carbon Pools

Restoring vegetation represents a viable approach for bolstering the ecological stability of environmentally vulnerable regions [11] and greatly contributes to the C sink capacity of ecosystems [8,9]. Our study reveals that long-term vegetation restoration resulted in higher SOC content in the Loess Plateau than that in the Horqin sandy area [21], in earlier studies in the region by Wang [15] and Yang [19], and in the scrub and pine forests of the Mediterranean region [2,5]. This is mainly because the input and output processes of soil organic matter are subject to the combined effects of external climate, vegetation community composition, soil characteristics, bottom nutrients, and time scale in different study areas [43], which make the changes of SOC content under vegetation restoration inconsistent. Moreover, during the process of long-term vegetation restoration, the complexity and stability of forest, shrub, and grassland vegetation communities are enhanced. This, in turn, leads to an expansion in surface cover area and a significant influx of above-ground litter and root secretion into the soil [16]. Consequently, there is an elevation in the uninterrupted build-up of SOC.
Previous studies have shown similar findings to ours [15], and we found that XS and PA vegetation significantly increased SOC content compared to naturally restored grassland (SB). It has been suggested that SOC content results from a dynamic balance between C input (plant and animal residues, root secretions, etc.) and C loss (soil respiration, etc.) [43]. In the present study, the vegetation composition was more complex under PA and XS treatments (Table 1), providing the soil with abundant above-ground litter and below-ground roots. Consequently, this enhanced the influx of soil organic matter. [16]. At the same time, the suitable moisture and aeration structure created a good microbial living environment for the soil under PA and XS vegetation (Table 2 and Table 3 and Figure 4), which promoted the decomposition and transformation of exogenous materials [46]. Furthermore, alterations in the C/N ratio will have an impact on the microorganisms’ activity and composition in the soil, consequently influencing the breakdown and conversion of organic matter [10]. In this investigation, the soil C/N ratios varied between 20.63 and 29.36 across distinct types of vegetation restoration (China’s average soil C/N ratio was reported to be 11.9 [47]). Furthermore, the soil C/N ratios a showed significant increased under both PA and XS vegetation as compared to under the SB and CK vegetation types (Table 4). The higher C/N values indicate a slower rate of soil organic matter mineralization under PA and XS vegetation, which contributes to the accumulation of SOC [47] and further explains the higher SOC content under PA and XS vegetation.
The relative combination of microbial activity, root secretions, and the decomposition and conversion of organic matter in the soil significantly influence the content of MBC and DOC [5,48]. We found that compared to naturally restored grassland (SB), XS and PA vegetation significantly increased the MBC and DOC contents in the soil. For one, the complex and well-developed plant root system under PA and XS vegetation provided some DOC to the soil through secretions [48]. For another, sufficient nutrient substrates and suitable water and gas conditions promoted the growth and reproduction of soil microorganisms, leading to an increase in the MBC content of the soil (Figure 4) [13] and also increasing the decomposition and conversion of the insoluble state in the soil, which in turn increased the conversion of SOC to DOC [49]. Furthermore, the content of the soil C pool exhibited a gradual decrease as soil depth increased across various categories of vegetation restoration. The decline in soil depth results in reduced input of external organic matter, including residues from plants, animals, and plant roots. Consequently, this results in a notable reduction in the quantity of microorganisms and animals involved in the decomposition and conversion of organic matter in the underlying soil stratum [43,45,46]. Microbial efficiency quotient is often used as a sensitive indicator of changes in the quantity and quality of the soil C pool [40]. In general, a larger microbial efficiency quotient indicates that microorganisms have improved the efficiency of soil C pool utilization, soil C pools have been effectively accumulated, and soil quality has been improved [40]. In this study, soil QMBC was significantly higher in XS and PA vegetation than in SB and CK vegetation. These findings suggest that the reestablished plantation forests play a crucial role in soil C accumulation and the enhancement of the effectiveness of soil C pools in the region. In addition, QMBC can be used as an early indicator to assess the impact of vegetation restoration on soil C pools.

4.3. Effects of Different Vegetation Restoration Types on Soil Nitrogen Pools

In line with the findings of Xiao et al. [50], soil TN content was higher under forest vegetation than under shrubs and grass vegetation. Soil TN content is in dynamic change in the soil layer, and the change in its content is also closely related to the accumulation and consumption of N in the soil [50]. According to previous studies, the primary factor that affects the TN content is the accumulation and decomposition process of soil organic matter [39]. Our research specifically examined the relationship between TN and SOC, and it revealed a strong and meaningful positive correlation between the two variables (Figure 4). Thus, sufficient exogenous C input under forest vegetation enhanced soil N retention and supported the second hypothesis of this study. These results also indicate that the restored vegetation of planted trees can promote N accumulation more effectively and act as a soil N pool. Furthermore, it was observed that the content of the soil N pool exhibited a gradual decline as the soil depth increased across various forms of vegetation restoration. On the one hand, the exogenous inputs were mainly concentrated in the surface soil layer, and the amount of exogenous inputs decreased as the soil depth increased [43,45]. On the other hand, there was a decrease in the aeration of the lower layer of soil, leading to a decrease in the number of microorganisms engaged in the decomposition and conversion of organic matter in the soil. This leads to a lower content of N pool in the lower soil layer compared to the upper soil layer [46].
This study found that forest vegetation increased soil NO3-N and NH4+-N contents. This was mainly because forest revegetation increased the complexity of plant species composition, enhanced organic matter input and soil microbial activity, and promoted soil N mineralization [51], which in turn increased the inorganic N content of the soil. In some previous reports, soil inorganic N under vegetation systems was mostly dominated by NH4+-N [39,52]. However, soil inorganic N under each vegetation restoration type in this study was dominated by NO3-N. This supports the view of Wang et al. [53] which holds that soil inorganic N in well-permeable and human-disturbed planted secondary forests is dominated by NO3-N. This may be explained by several mechanisms. Firstly, it has been demonstrated in many studies that the process of plant uptake of NO3-N from the soil requires more energy than does the uptake of NH4+-N [53]. Consequently, plants generally display a greater preference for NH4+-N uptake [54]. When the plant root system absorbs NH4+, the hydrogen cations in the plant body flow out, and the surrounding area of the root system will strengthen the adsorption capacity of NO3 to ensure the charge balance in the soil, thereby increasing the NO3-N content in the soil. Furthermore, variations in nutrient requirements and physiological traits of vegetation also impact the degree to which inorganic N in the soil is utilized [52], leading to differences in soil NO3-N content under different types of vegetation [55,56]. Secondly, this study sampled from the end of August to October, during which the vegetation growth rate gradually decreased and the demand for nutrients gradually decreased, and the N demand of plants and soil microorganisms was gradually met [50,57]. At the same time, the ammonium nitrate ratio of soil under various vegetation types ranges from 0.72 to 0.83, indicating the accumulation of soil NO3-N content and an increase in N availability [50]. With the increase in soil N availability, nitrification gradually assumes a dominant role in stable and nitrogen-rich soil systems [50,58]. Finally, some studies have pointed out that NO3-N in soil originates from the oxidation process of NH4+-N [59]. Suitable moisture and good soil aeration structure in the study area enhanced the microbial activity in the soil (Table 2 and Table 5, Figure 4), allowing for the oxidation of ammonia released from the soil due to ammonification to NO3 by nitrifying bacteria [53,60] and resulting in a dominant regional expression of NO3-N in inorganic N.

5. Conclusions

This study showed that the artificially restored forest vegetation maintained carbon and nitrogen pools in the soil of the study area more effectively than did the naturally restored grassland and that carbon and nitrogen interactions between soils were stronger under Picea asperata vegetation. Simultaneously, the soil’s carbon and nitrogen storage in the diverse vegetation restoration types were primarily concentrated within the top 20 cm soil layer. Furthermore, as the soil depth increased, there was a decrease in the content of soil carbon and nitrogen pools. Carbon and nitrogen pools were greater in forest vegetation restoration than in Stipa bungeana and Caragana korshinskii vegetation. Moreover, soil inorganic nitrogen was mainly formed in the form of NO3-N under the different vegetation restoration types. Our results demonstrate that the choice of restoration species will affect the process of soil carbon and nitrogen cycling in the ecosystem. At the same time, forest vegetation restoration helps to improve the quality of carbon and nitrogen pools in the soil system of the Longzhong Loess Plateau, which can more effectively promote the sustainable accumulation of carbon and nitrogen elements in the soil.

Author Contributions

Conceptualization, M.X.; methodology, M.X., J.Y. and G.X.; formal analysis, M.X., J.Y. and S.L.; investigation, M.X., S.L., J.Y., L.Y. and G.X.; data curation, M.X., J.Y. and S.L.; writing—original draft preparation, M.X. and S.L.; writing—review and editing, J.Y. and G.L.; supervision, Y.L.; project administration, G.L. and Y.L.; funding acquisition, G.L. All authors have read and agreed to the published version of the manuscript.

Funding

This research was funded by the Outstanding Doctoral Dissertation Cultivation Project of Gansu Agricultural University (no. YB2023002); the Industrial Support Project of Gansu Higher Education Institutions (no. 2021CYZC-15; no. 2022CYZC-41); the Key Research and Development Program of Gansu Province (no. 22YF7FA116); and the Financial Special Project of Gansu Province, China (no. GSCZZ 20160909).

Data Availability Statement

The data that support this study cannot be publicly shared due to ethical or privacy reasons but may be shared upon reasonable request to the corresponding author if appropriate.

Acknowledgments

We sincerely thank the individuals and organizations that participated in the trial and facilitated the research.

Conflicts of Interest

The authors declare no conflicts of interest.

References

  1. Yuan, J.; Liang, Y.; Zhuo, M.; Sadiq, M.; Liu, L.; Wu, J.; Xu, G.; Liu, S.; Li, G.; Yan, L. Soil nitrogen and carbon storages and carbon pool management index under sustainable conservation tillage strategy. Front. Ecol. Evol. 2023, 10, 1082624. [Google Scholar] [CrossRef]
  2. De Marco, A.; Napoletano, P.; Panico, S.; Memoli, V.; Santorufo, L.; Ruggiero, A.; Colombo, C.; Barile, R.; Maisto, G. Combined effect of black locust invasion and fire on soils of Mediterranean shrublands and pine forests. Catena 2023, 220, 106656. [Google Scholar] [CrossRef]
  3. He, L.; Lu, S.; Wang, C.; Mu, J.; Zhang, Y.; Wang, X. Changes in soil organic carbon fractions and enzyme activities in response to tillage practices in the Loess Plateau of China. Soil Tillage Res. 2021, 209, 104940. [Google Scholar] [CrossRef]
  4. Omidvar, N.; Xu, Z.; Nguyen, T.; Salehin, B.; Ogbourne, S.; Ford, R.; Bai, S. A global meta-analysis shows soil nitrogen pool increases after revegetation of riparian zones. J. Soils Sediments 2021, 21, 665–677. [Google Scholar] [CrossRef]
  5. De Marco, A.; Panico, S.; Memoli, V.; Santorufo, L.; Zarrelli, A.; Barile, R.; Maisto, G. Differences in soil carbon and nitrogen pools between afforested pine forests and natural shrublands in a Mediterranean area. Appl. Soil Ecol. 2022, 170, 104262. [Google Scholar] [CrossRef]
  6. Bukomba, J.; Lusk, G. Spatial Variability in Inorganic Soil Nitrogen Production in a Mixed-Vegetation Urban Landscape. Nitrogen 2022, 3, 118–127. [Google Scholar] [CrossRef]
  7. Virk, L.; Liu, W.; Niu, J.; Xu, C.; Liu, Q.; Kan, Z.; Zhao, X.; Zhang, H. Effects of Diversified Cropping Sequences and Tillage Practices on Soil Organic Carbon, Nitrogen, and Associated Fractions in the North China Plain. J. Soil Sci. Plant Nutr. 2021, 21, 1201–1212. [Google Scholar] [CrossRef]
  8. Gao, G.; Tuo, D.; Han, X.; Jiao, L.; Li, J.; Fu, B. Effects of land-use patterns on soil carbon and nitrogen variations along revegetated hillslopes in the Chinese Loess Plateau. Sci. Total Environ. 2020, 746, 141156. [Google Scholar] [CrossRef]
  9. Liu, Y.; Yang, H.; Xing, Z.; Zou, Y.; Cui, Z. Vegetation Degradation of Guanshan Grassland Suppresses the Microbial Biomass and Activity of Soil. Land 2021, 10, 203. [Google Scholar] [CrossRef]
  10. Xiao, R.; Man, X.; Duan, B. Carbon and Nitrogen Stocks in Three Types of Larix gmelinii Forests in Daxing’an Mountains, Northeast China. Forests 2020, 11, 305. [Google Scholar] [CrossRef]
  11. Li, D.; Niu, S.; Luo, Y. Global patterns of the dynamics of soil carbon and nitrogen stocks following afforestation: A meta-analysis. New Phytol. 2012, 195, 172–181. [Google Scholar] [CrossRef]
  12. Li, T.; Liu, G. Age-related changes of carbon accumulation and allocation in plants and soil of black locust forest on Loess Plateau in Ansai County, Shaanxi Province of China. Chin. Geogr. Sci. 2014, 24, 414–422. [Google Scholar] [CrossRef]
  13. Liu, M.; Li, P.; Liu, M.; Wang, J.; Chang, Q. The trend of soil organic carbon fractions related to the successions of different vegetation types on the tableland of the Loess Plateau of China. J. Soils Sediments 2020, 21, 203–214. [Google Scholar] [CrossRef]
  14. Yang, W.; Zhang, D.; Cai, X.; Yang, X.; Zhang, H.; Wang, Y.; Diao, L.; Luo, Y.; Cheng, X. Natural revegetation over ~160 years alters carbon and nitrogen sequestration and stabilization in soil organic matter on the Loess Plateau of China. Catena 2023, 220, 106647. [Google Scholar] [CrossRef]
  15. Wang, H.; Wu, J.; Li, G.; Yan, L. Changes in soil carbon fractions and enzyme activities under different vegetation types of the northern Loess Plateau. Ecol. Evol. 2020, 10, 12211–12223. [Google Scholar] [CrossRef] [PubMed]
  16. Ren, C.; Kang, D.; Wu, J.; Zhao, F.; Yang, G.; Han, X.; Feng, Y.; Re, G. Temporal variation in soil enzyme activities after afforestation in the Loess Plateau, China. Geoderma 2016, 282, 103–111. [Google Scholar] [CrossRef]
  17. Zhong, Z.; Wu, S.; Lu, X.; Ren, Z.; Wu, Q.; Xu, M.; Ren, C.; Yang, G.; Han, X. Organic carbon, nitrogen accumulation, and soil aggregate dynamics as affected by vegetation restoration patterns in the Loess Plateau of China. Catena 2021, 196, 104867. [Google Scholar] [CrossRef]
  18. Liu, S.; Wu, J.; Li, G.; Yang, C.; Yuan, J.; Xie, M. Seasonal freeze-thaw characteristics of soil carbon pools under different vegetation restoration types on the Longzhong Loess Plateau. Front. Ecol. Evol. 2022, 10, 1019627. [Google Scholar] [CrossRef]
  19. Yang, C.; Li, G.; Yan, L.; Ma, W.; Wu, J.; Tan, Y.; Liu, S.; Zhang, S. Effects of Plant Community Type on Soil Methane Flux in Semiarid Loess Hilly Region, Central Gansu Province, China. Adv. Atmos. Sci. 2022, 39, 1360–1374. [Google Scholar] [CrossRef]
  20. Zhang, X.; Gao, Z.; Li, Y.; Sun, G.; Cen, Y.; Lou, Y.; Yao, Y.; Liu, W. Eco-Environment Quality Response to Climate Change and Human Activities on the Loess Plateau, China. Land 2023, 12, 1792. [Google Scholar] [CrossRef]
  21. Lv, P.; Sun, S.; Medina-Roladand, E.; Zhao, S.; Hu, Y.; Guo, A.; Zuo, X. Effects of habitat types on the dynamic changes in allocation in carbon and nitrogen storage of vegetation-soil system in sandy grasslands: How habitat types affect C and N allocation? Ecol. Evol. 2021, 11, 9079–9091. [Google Scholar] [CrossRef] [PubMed]
  22. Tang, X.; Liu, S.; Liu, J.; Zhou, G. Effects of vegetation restoration and slope positions on soil aggregation and soil carbon accumulation on heavily eroded tropical land of Southern China. J. Soils Sediments 2009, 10, 505–513. [Google Scholar] [CrossRef]
  23. Yang, C.; Li, G.; Yan, L.; Wu, J.; Li, J.; Liu, S.; Lu, Y. Effects of different vegetation types on ecosystem respiration in semiarid Loess Hilly Region, Central Gansu Province, China. Ecol. Indic. 2022, 145, 109683. [Google Scholar] [CrossRef]
  24. Zhang, L.; Song, L.; Zhang, L.; Shao, H.; Chen, X.; Yan, K. Seasonal dynamics in nitrous oxide emissions under different types of vegetation in saline-alkaline soils of the Yellow River Delta, China and implications for eco-restoring coastal wetland. Ecol. Eng. 2013, 61, 82–89. [Google Scholar] [CrossRef]
  25. Xiao, L.; Zhang, Y.; Li, P.; Xu, G.; Shi, P.; Zhang, Y. Effects of freeze-thaw cycles on aggregate-associated organic carbon and glomalin-related soil protein in natural-succession grassland and Chinese pine forest on the Loess Plateau. Geoderma 2019, 334, 1–8. [Google Scholar] [CrossRef]
  26. Guan, Y.; Zhou, W.; Bai, Z.; Cao, Y.; Huang, Y.; Huang, H. Soil nutrient variations among different land use types after reclamation in the Pingshuo opencast coal mine on the Loess Plateau, China. Catena 2020, 188, 104427. [Google Scholar] [CrossRef]
  27. Xu, M.; Wang, J.; Zhu, Y.; Han, X.; Ren, C.; Yang, G. Plant Biomass and Soil Nutrients Mainly Explain the Variation of Soil Microbial Communities during Secondary Succession on the Loess Plateau. Microb. Ecol. 2022, 83, 114–126. [Google Scholar] [CrossRef] [PubMed]
  28. Dong, L.; Li, J.; Zhang, Y.; Bing, M.; Liu, Y.; Wu, J.; Hai, X.; Li, A.; Wang, K.; Wu, P.; et al. Effects of vegetation restoration types on soil nutrients and soil erodibility regulated by slope positions on the Loess Plateau. J. Environ. Manag. 2022, 302, 113985. [Google Scholar] [CrossRef]
  29. Ge, F.; Xu, M.; Gong, C.; Zhang, Z.; Tan, Q.; Pan, X. Land cover changes the soil moisture response to rainfall on the Loess Plateau. Hydrol. Process. 2022, 36, e14714. [Google Scholar] [CrossRef]
  30. Jiang, X.; Shen, W.; Bai, X. Response of net primary productivity to vegetation restoration in Chinese Loess Plateau during 1986–2015. PLoS ONE 2019, 14, e0219270. [Google Scholar] [CrossRef]
  31. Deng, J.; Sun, P.; Zhao, F.; Han, X.; Yang, G.; Feng, Y.; Ren, G. Soil C, N, P and Its Stratification Ratio Affected by Artificial Vegetation in Subsoil, Loess Plateau China. PLoS ONE 2016, 11, e0151446. [Google Scholar] [CrossRef] [PubMed]
  32. Meena, V.; Mondal, T.; Pandey, B.; Mukherjee, A.; Yadav, R.; Choudhary, M.; Singh, S.; Bisht, J.; Pattanayak, A. Land use changes: Strategies to improve soil carbon and nitrogen storage pattern in the mid-Himalaya ecosystem, India. Geoderma 2018, 321, 69–78. [Google Scholar] [CrossRef]
  33. Xiao, B.; Sun, F.; Yao, X.; Hu, K.; Kidron, G. Seasonal variations in infiltrability of moss-dominated biocrusts on aeolian sand and loess soil in the Chinese Loess Plateau. Hydrol. Process. 2019, 33, 2449–2463. [Google Scholar] [CrossRef]
  34. Zhao, J.; Luo, X.; Ma, Y.; Shao, T.; Yue, Y. Soil characteristics and new formation model of loess on the Chinese Loess Plateau. Geosci. J. 2017, 21, 607–616. [Google Scholar] [CrossRef]
  35. Ma, Y.; Bi, Q.; Li, G.; Liu, X.; Fu, G.; Zhao, Y.; Wang, L. Provenance variations in kernel oil content, fatty acid profile and biodiesel properties of Xanthoceras sorbifolium Bunge in northern China. Ind. Crops Prod. 2020, 151, 112487. [Google Scholar] [CrossRef]
  36. Zhang, W.; Liu, W.; Xu, M.; Deng, J.; Han, X.; Yang, G.; Feng, Y.; Ren, G. Response of forest growth to C:N:P stoichiometry in plants and soils during Robinia pseudoacacia afforestation on the Loess Plateau, China. Geoderma 2019, 337, 280–289. [Google Scholar] [CrossRef]
  37. Wu, J.; Wang, H.; Li, G.; Wu, J.; Gong, Y.; Wei, X. Responses of CH4 flux and microbial diversity to changes in rainfall amount and frequencies in a wet meadow in the Tibetan Plateau. Catena 2021, 202, 105253. [Google Scholar] [CrossRef]
  38. Lin, S.; Wang, S.; Si, Y.; Yang, W.; Zhu, S.; Ni, W. Variations in eco-enzymatic stoichiometric and microbial characteristics in paddy soil as affected by long-term integrated organic-inorganic fertilization. PLoS ONE 2017, 12, e0189908. [Google Scholar] [CrossRef]
  39. Zhu, X.; Fang, X.; Xiang, W.; Chen, L.; Shuai, O.; Li, P. Vegetation restoration drives dynamics of soil nitrogen content and availability in the subtropics. Catena 2023, 220, 106720. [Google Scholar] [CrossRef]
  40. Munoz-Rojas, M.; Ereckson, T.; Martini, D.; Dixon, K.; Merritt, D. Soil physicochemical and microbiological indicators of short, medium and long term post-fire recovery in semi-arid ecosystems. Ecol. Indic. 2016, 63, 14–22. [Google Scholar] [CrossRef]
  41. Paul, K.; Polglase, P.; Nyakuengama, J.; Khanna, P. Change in soil carbon following afforestation. For. Ecol. Manag. 2002, 168, 241–257. [Google Scholar] [CrossRef]
  42. Sartori, F.; Lal, R.; Ebinger, M.; Eaton, J. Changes in soil carbon and nutrient pools along a chronosequence of poplar plantations in the Columbia Plateau, Oregon, USA. Agric. Ecosyst. Environ. 2007, 122, 325–339. [Google Scholar] [CrossRef]
  43. Delgado-Baquerizo, M.; Garcra-Palacios, P.; Milla, R.; Gallardo, A.; Maestre, F. Soil characteristics determine soil carbon and nitrogen availability during leaf litter decomposition regardless of litter quality. Soil Biol. Biochem. 2015, 81, 134–142. [Google Scholar] [CrossRef]
  44. Hussain, S.; Sharma, V.; Arya, V.; Sharma, K.; Rao, S. Total organic and inorganic carbon in soils under different land use/land cover systems in the foothill Himalayas. Catena 2019, 182, 104104. [Google Scholar] [CrossRef]
  45. Sun, X.; Wang, G.; Ye, Y.; Ma, Q.; Guan, Q.; Jones, D. Response of nitrogen fractions in the rhizosphere and bulk soil to organic mulching in an urban forest plantation. J. For. Res. 2021, 32, 2577–2588. [Google Scholar] [CrossRef]
  46. Liu, R.; Zhang, Y.; Hu, X.; Wan, S.; Wang, H.; Liang, C.; Chen, F. Litter manipulation effects on microbial communities and enzymatic activities vary with soil depth in a subtropical Chinese fir plantation. For. Ecol. Manag. 2021, 480, 118641. [Google Scholar] [CrossRef]
  47. Qin, H.; Jiao, L.; Zhou, Y.; Wu, J.; Che, X. Elevation affects the ecological stoichiometry of Qinghai spruce in the Qilian Mountains of northwest China. Front. Plant Sci. 2022, 13, 917755. [Google Scholar] [CrossRef]
  48. Wang, D.; Yi, W.; Zhou, Y.; He, S.; Tang, L.; Yin, X.; Zhao, P.; Long, G. Intercropping and N application enhance soil dissolved organic carbon concentration with complicated chemical composition. Soil Tillage Res. 2021, 210, 104979. [Google Scholar] [CrossRef]
  49. Cai, Y.; Chang, S.; Ma, B.; Edwardw, B. Watering increased DOC concentration but decreased N2O emission from a mixed grassland soil under different defoliation regimes. Biol. Fertil. Soils 2016, 52, 987–996. [Google Scholar] [CrossRef]
  50. Xiao, K.; Li, D.; Wen, L.; Yang, L.; Luo, P.; Chen, H.; Wang, K. Dynamics of soil nitrogen availability during post-agricultural succession in a karst region, southwest China. Geoderma 2018, 314, 184–189. [Google Scholar] [CrossRef]
  51. Cong, W.; Ruijven, J.; Werf, V.; Dedeyn, G.; Mommer, L.; Berendse, F.; Hoffland, E. Plant species richness leaves a legacy of enhanced root litter-induced decomposition in soil. Soil Biol. Biochem. 2015, 80, 341–348. [Google Scholar] [CrossRef]
  52. Chen, H.; Huang, X.; Shi, W.; Herbert, K.; Hou, L.; Yang, H.; Song, Q.; Liu, J.; Shi, J.; Yang, Q.; et al. Coordination of nitrogen uptake and assimilation favours the growth and competitiveness of moso bamboo over native tree species in high-NH4+ environments. J. Plant Physiol. 2021, 266, 153508. [Google Scholar] [CrossRef]
  53. Wang, L.; Macko, S. Constrained preferences in nitrogen uptake across plant species and environments. Plant Cell Environ. 2011, 34, 525–534. [Google Scholar] [CrossRef]
  54. Nasholm, T.; Kielland, K.; Ganeteg, U. Uptake of organic nitrogen by plants. New Phytol. 2009, 182, 31–48. [Google Scholar] [CrossRef] [PubMed]
  55. Bauhus, J.; Pare, D.; Te, L. Effects of tree species, stand age and soil type on soil microbial biomass and its activity in a southern boreal forest. Soil Biol. Biochem. 1998, 8, 1077–1089. [Google Scholar] [CrossRef]
  56. Jackson, L.; Burger, M.; Cavagnaro, T. Roots, nitrogen transformations, and ecosystem services. Annu. Rev. Plant Biol. 2008, 59, 341–363. [Google Scholar] [CrossRef]
  57. Wu, J.; Wang, H.; Li, G.; Ma, W.; Wu, J.; Gong, X.; Xu, G. Vegetation degradation impacts soil nutrients and enzyme activities in wet meadow on the Qinghai-Tibet Plateau. Sci. Rep. 2020, 10, 21271. [Google Scholar] [CrossRef] [PubMed]
  58. Bennett, J. Nitrogen Mineralization: Challenges of a Changing Paradigm. Ecology 2004, 85, 591–602. [Google Scholar]
  59. Zhang, J.; Zhu, T.; Cai, Z.; Muller, C. Nitrogen cycling in forest soils across climate gradients in Eastern China. Plant Soil 2011, 342, 419–432. [Google Scholar] [CrossRef]
  60. Zhang, Y.; Wang, S.; Wang, H.; Wang, R.; Wang, X.; Li, J. Crop yield and soil properties of dryland winter wheat-spring maize rotation in response to 10-year fertilization and conservation tillage practices on the Loess Plateau. Field Crops Res. 2018, 225, 170–179. [Google Scholar] [CrossRef]
Figure 1. Changes in SOC (A), MBC (B), and DOC (C) content and QMBC (D) in the 0–40 cm soil layers under different vegetation restoration types. Notes: SB—Stipa bungeana Trin.; CK—Caragana korshinskii Kom.; XS—Xanthoceras sorbifolia Bunge.; PA—Picea asperata Mast. VT and D denote the type of vegetation restoration and depth of the soil layer, respectively. The error bar is the standard error. Different uppercase letters indicate significant differences between different vegetation restoration types in the same soil layer, and different lowercase letters indicate significant differences between different soil layers of the same vegetation restoration type (p < 0.05, according to LSD ANOVA test).
Forests 15 00173 g001
Figure 2. Changes in soil TN (A), NH4+-N (B), and NO3-N (C) content and ammonium/nitrate ratio (D) under different vegetation restoration types. Notes: SB—Stipa bungeana Trin.; CK—Caragana korshinskii Kom.; XS—Xanthoceras sorbifolia Bunge.; PA—Picea asperata Mast. VT and D denote the type of vegetation restoration and depth of the soil layer, respectively. The error bar is the standard error. Different uppercase letters indicate significant differences between different vegetation restoration types in the same soil layer, and different lowercase letters indicate significant differences between different soil layers of the same vegetation restoration type (p < 0.05, according to LSD ANOVA test).
Forests 15 00173 g002
Figure 3. Relationship between soil carbon storage and nitrogen storage in 0–40 cm under different vegetation restoration types (AD). Notes: SB—Stipa bungeana Trin. (A); CK—Caragana korshinskii Kom. (B); XS—Xanthoceras sorbifolia Bunge. (C); PA—Picea asperata Mast. (D).
Forests 15 00173 g003
Figure 4. Correlation analysis between soil carbon/nitrogen and soil environmental factors. Notes: *, **, and *** are significantly correlated at p < 0.05, p < 0.01, and p < 0.001 levels (bilateral), respectively. BD—bulk density; FWHC—field water holding capacity; STP—soil total porosity; SWC—soil water content; TP—total phosphorus; SOC—soil organic carbon; MBC—microbial biomass carbon; DOC—dissolved organic carbon; QMBC—microbial efficiency quotient; CS—carbon storage; TN—total nitrogen; NH4+-N—ammonium nitrogen; NO3-N—nitrate nitrogen; NS—nitrogen storage.
Forests 15 00173 g004
Table 1. Basic overview of different vegetation restoration types.
Type of Vegetation RestorationGeographical CoordinatesAltitude (m)Coverage (%)Main SpeciesSoil Disturbance History
Stipa bungeana Trin. (SB)104°39′1″ E, 35°34′48″ N1985>90Stipa bungeana Trin., Plantago asiatica L., Setaria viridis (L.) Beauv., Leymus secalinus (Georgi) Tzvel.Abandoned at the end of 1990, naturally restored Stipa bungeana Trin. grassland.
Caragana korshinskii Kom. (CK)104°38′1″ E, 35°34′55″ N198030Caragana korshinskii Kom, Potentilla chinensis Ser., Picris hieracioides L.Felled and planted until the 1990s; it was abandoned at the end of 2000 and naturally restored to a shrub community.
Xanthoceras sorbifolia Bunge. (XS)104°39′11″ E, 35°34′45″ N201060Xanthoceras sorbifolium Bunge., Bupleurum chinense DC.,
Gentiana macrophylla Pall. var. fetissowii (Regel et Winkl.) Ma et K.C.Hsia., Leontopodium leontopodioides (Willd.) Beauv.
Cleared by deforestation until the 1990s; the forest was restored by artificial planting in 2002.
Picea asperata Mast. (PA)104°38′51″ E, 35°34′51″ N199060Picea asperata Mast., Stipa bungeana Trin., Leymus secalinus (Georgi) Tzvel.Picea asperata Mast. with a tree age of 10 years was transplanted in 2005 and naturally restored to the Picea asperata Mast. forest.
Table 2. Physicochemical properties of soils (0–40 cm) under different vegetation restoration types.
Type of Vegetation RestorationpHBD (g·cm−3)FWHC (g·kg−1)STP (%)SOC (g·kg−1)TN (g·kg−1)TP (mg·kg−1)
SB7.88 ± 0.01 A1.10 ± 0.04 BC576.26 ± 23.83 AB67.62 ± 1.09 AB8.51 ± 0.90 A0.43 ± 0.02 AB65.67 ± 2.66 C
CK7.84 ± 0.01 A1.02 ± 0.03 C650.30 ± 34.98 A70.03 ± 1.41 A8.17 ± 0.86 A0.39 ± 0.02 B95.00 ± 10.22 BC
XS7.38 ± 0.09 C1.13 ± 0.04 AB535.23 ± 36.69 BC64.32 ± 1.82 BC10.68 ± 1.18 A0.52 ± 0.06 A113.33 ± 6.79 AB
PA7.57 ± 0.02 B1.22 ± 0.03 A467.20 ± 28.86 C61.18 ± 1.98 C9.83 ± 0.36 A0.52 ± 0.03 A144.89 ± 21.13 A
Notes: SB—Stipa bungeana Trin.; CK—Caragana korshinskii Kom.; XS—Xanthoceras sorbifolia Bunge.; PA—Picea asperata Mast.; BD—bulk density; FWHC—field water holding capacity; STP—soil total porosity; SOC—soil organic carbon; TN—total nitrogen; TP—total phosphorus. Values in the table are means ± standard errors (n = 3). Different capital letters indicate significant differences between vegetation restoration types (p < 0.05, according to LSD ANOVA test).
Table 3. Changes of soil environmental factors in 0–40 cm under different vegetation restoration types.
Soil Layer (cm)Vegetation Restoration TypesSWC (%)TP (mg·kg−1)Sucrase (mg·g−1)Amylase (mg·g−1)Urease (mg·g−1)Protease (μg·g−1)
0–10SB17.10 ± 0.67 BCa0.16 ± 0.01 ABa401.68 ± 5.91 Ca45.09 ± 0.18 Ba67.26 ± 0.69 Aa208.58 ± 5.87 Ba
CK15.63 ± 0.70 Ca0.14 ± 0.12 Ba279.59 ± 7.95 Da47.53 ± 0.36 ABa56.89 ± 0.13 Ca152.38 ± 2.52 Ca
XS19.40 ± 0.06 Aa0.21 ± 0.02 Aa545.83 ± 2.65 Aa48.83 ± 1.08 ABa61.88 ± 2.66 Ba236.71 ± 0.92 Aa
PA18.43 ± 0.38 ABa0.16 ± 0.01 ABa519.81 ± 2.45 Ba50.66 ± 2.62 Aa60.89 ± 0.73 BCa213.74 ± 7.38 Ba
10–20SB15.43 ± 0.66 Bab0.12 ± 0.00 Ba277.99 ± 7.45 Cb30.68 ± 0.81 Bb37.53 ± 2.19 Bb115.61 ± 4.39 Ab
CK12.77 ± 0.73 Cb0.14 ± 0.00 Aa225.01 ± 6.67 Db34.97 ± 0.24 Ab35.53 ± 2.21 Bb103.46 ± 16.18 Ab
XS18.77 ± 0.12 Ab0.12 ± 0.01 Bb425.26 ± 2.11 Ab36.14 ± 0.12 Ab48.66 ± 1.50 Ab113.46 ± 4.59 Ab
PA17.57 ± 0.26 Aab0.15 ± 0.00 Aa401.83 ± 9.69 Bb35.79 ± 0.74 Ab44.03 ± 00.61 Ab129.06 ± 1.21 Ab
20–40SB14.40 ± 0.64 Bb0.14 ± 0.02 Aa124.77 ± 5.82 Bc22.31 ± 0.18 Bc21.20 ± 0.66 Cc54.96 ± 1.64 Cc
CK9.07 ± 0.61 Cc0.09 ± 0.00 Ba136.00 ± 4.77 Bc24.63 ± 0.94 ABc18.94 ± 0.60 Dc56.16 ± 1.11 Cc
XS17.37 ± 0.12 Ac0.14 ± 0.01 Ab280.23 ± 1.01 Ac28.34 ± 1.21 Ac37.54 ± 0.52 Ac61.85 ± 0.98 Bc
PA16.90 ± 0.35 Ab0.16 ± 0.01 Aa292.34 ± 4.91 Ac27.31 ± 2.01 Ac35.31 ± 0.71 Bc87.58 ± 0.79 Ac
Notes: SB—Stipa bungeana Trin.; CK—Caragana korshinskii Kom.; XS—Xanthoceras sorbifolia Bunge.; PA—Picea asperata Mast. SWC—soil water content; TP—total phosphorus. The error bar is the standard error. Different uppercase letters indicate significant differences between different vegetation restoration types in the same soil layer, and different lowercase letters indicate significant differences between different soil layers of the same vegetation restoration type (p < 0.05, according to LSD ANOVA test).
Table 4. C/N storage and C/N in the 0–40 cm soil layer under different vegetation restoration types.
Soil Layer/cmSBCKXSPA
CS/t·ha−10–1010.52 ± 0.17 Cb10.40 ± 0.09 Ca12.76 ± 0.42 Bb16.08 ± 0.26 Ab
10–209.13 ± 0.44 Bc7.42 ± 0.34 Cb11.85 ± 0.06 Ab12.71 ± 0.52 Ac
20–4012.32 ± 0.17 Ba10.39 ± 0.26 Ca20.90 ± 0.19 Aa20.28 ± 0.98 Aa
0–4031.97 ± 0.34 C28.21 ± 0.48 D45.51 ± 0.47 B49.06 ± 1.48 A
NS/t·ha−10–100.48 ± 0.01 Ba0.50 ± 0.01 Ba0.53 ± 0.02 ABb0.56 ± 0.02 Ab
10–200.44 ± 0.03 Aa0.36 ± 0.00 Bb0.44 ± 0.02 Ac0.43 ± 0.02 Ac
20–400.46 ± 0.04 Ba0.48 ± 0.01 Ba0.73 ± 0.01 Aa0.79 ± 0.03 Aa
0–401.38 ± 0.02 B1.34 ± 0.02 B1.71 ± 0.05 A1.78 ± 0.03 A
C/N0–1022.07 ± 0.35 BCab20.84 ± 0.43 Ca23.95 ± 0.19 Bb28.72 ± 1.37 Aa
10–2020.75 ± 0.47 Bb20.63 ± 0.84 Ba27.10 ± 1.45 Aa29.36 ± 0.16 Aa
20–4027.28 ± 3.01 Aa21.85 ± 0.84 Ba28.50 ± 0.45 Aa25.76 ± 0.37 ABb
0–4023.37 ± 1.33 B21.11 ± 0.41 B26.52 ± 0.80 A27.94 ± 0.69 A
Notes: SB—Stipa bungeana Trin.; CK—Caragana korshinskii Kom.; XS—Xanthoceras sorbifolia Bunge.; PA—Picea asperata Mast. CS and NS indicate soil carbon and nitrogen storages, respectively. The error bar is the standard error. Different uppercase letters indicate significant differences between different vegetation restoration types in the same soil layer, and different lowercase letters indicate significant differences between different soil layers of the same vegetation restoration type (p < 0.05, according to LSD ANOVA test).
Table 5. RDA test results between soil carbon (SOC, MBC, DOC, and C storage)/nitrogen (TN, NO3-N, NH4+-N, and N storage) and soil environmental factors.
C/N RDA Test ResultsFactorsExplains (%)Contribution (%)Fp
CEnvironmental factorsSucrase73.676.694.90.002
Amylase17.017.759.70.002
SWC2.93.014.20.002
STP1.01.05.60.012
FWHC0.60.73.90.022
RDA twin axisAxis 177.48---
Axis 218.49---
NEnvironmental factorsProtease89.792.32970.002
Amylase2.52.510.40.002
STP2.02.111.30.004
Urease1.51.510.70.006
BD0.70.75.60.016
RDA twin axisAxis 196.74---
Axis 20.39---
Notes: SWC—soil water content; STP—soil total porosity; FWHC—field water holding capacity; BD—bulk density.
Disclaimer/Publisher’s Note: The statements, opinions and data contained in all publications are solely those of the individual author(s) and contributor(s) and not of MDPI and/or the editor(s). MDPI and/or the editor(s) disclaim responsibility for any injury to people or property resulting from any ideas, methods, instructions or products referred to in the content.

