1. Introduction
Wood is an important construction material thanks to its high strength/weight ratio, ease of processing, and renewable nature [
1]. As a natural material, the structural characteristics of wood originate from trees’ growth. These structural characteristics closely define the mechanical performance of wood. Knots, as one type of typical structure originating from branches, commonly exist in wood and wood-based products. For softwood, the average knot volume in a stem is generally between 0.5 and 2%. The density of knots is higher than that in stem wood and frequently above 1000 kg/m
3 [
2]. Large knots drastically reduce strength and are major cause of the downgrading of timber [
3]. To use wood as a loadbearing material, especially in construction, it is necessary to minimize the impact of knots on the mechanical properties of wood. By carefully managing the forest, it is possible to reduce the number and size of knots [
4]. Currently, it is still hard to fully avoid the impact of knots through the management of forests. Hence, understanding and limiting the effect of knots on the mechanical properties of wood is vital and certainly contributes to wood processing and the applications envisaged.
The effect of knots on the mechanical properties of wood is related to the characteristics of knots and loading conditions. The size and position of different types of knots are believed to have a significant influence on the bending strength of wood [
3]. Researchers found that bending failure in thermally modified wood is initiated mainly at knot interfaces or close to knots and fractures often propagated from checks [
5]. The compressive strength of wood closely relates to the size of knots, and the effect of knots on the compressive strength of, for example, eucalyptus wood, is small when the knot size is smaller than 8.3 mm
2 [
6]. By conducting a shear test, it was found that there was no significant difference in the mean shear strength of clear and knot specimens [
7]. Furthermore, researchers have been trying to continuously evaluate the mechanical properties of wood by identifying knots in real time [
8,
9,
10,
11]. Although intensive research has been performed to understand and estimate the influence of knots on the mechanical properties of wood, the reasons for inducing these mechanical properties are still not fully understood.
The mechanical performance of wood can be determined from dynamic structural changes during a loading test. Dynamic structural changes closely relate to strain accumulation and transferal. Therefore, a combined investigation into structural changes and strain distribution is certainly helpful for disclosing the reasons behind the mechanical properties of wood. X-ray computed tomography (X-ray CT) has been successfully used to visualize the internal structure of knots in wood [
12]. Digital image correlation (DIC) is an effective tool to map the strain distribution around knots [
13]. By using DIC, researchers found that strain accumulation and structural failure occur in regions adjacent to knots [
14,
15]. Compared with the samples containing intergrown knots, the samples with loose knots showed slightly higher strain gradients due to the discontinued structural connection between the branch and stem tissue [
16].
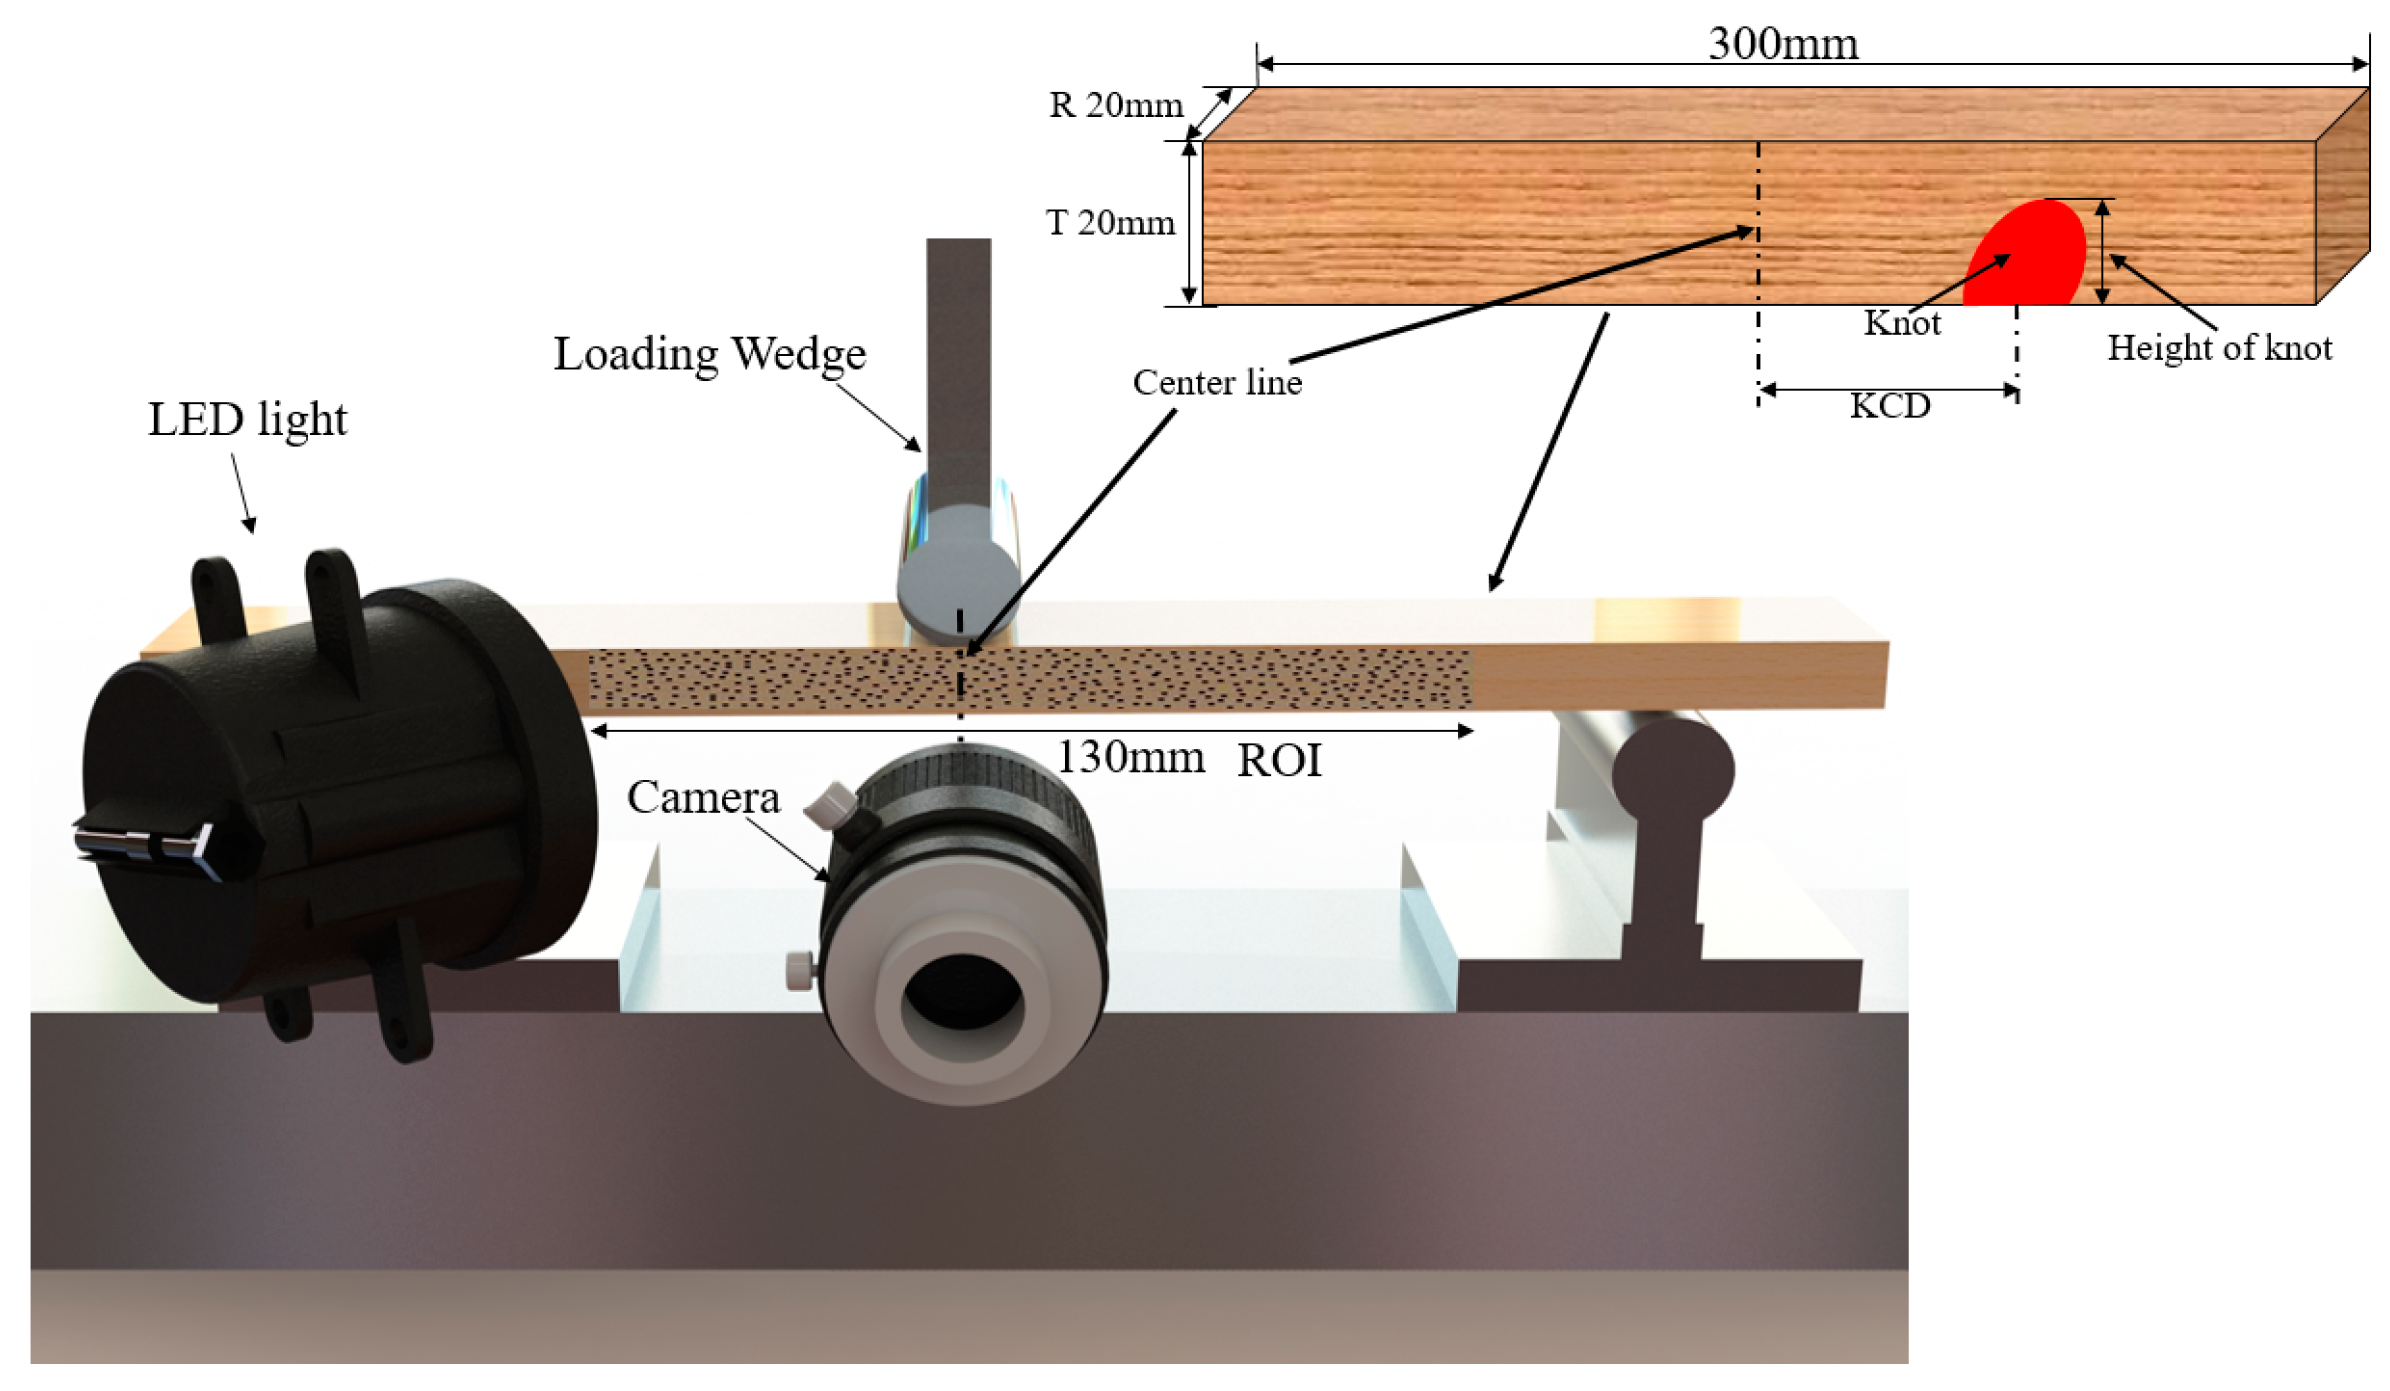
The objective of this study is to investigate the effect of knots on the mechanical properties of wood. The beam specimens with and without knots were cut from Chinese fir trees. The modulus of elasticity (MOE) and modulus of rupture (MOR) were measured using three-point bending testing. The dynamic strain distribution was recorded with DIC during the bending test. After the bending test, the internal structure of the specimens was visualized with X-ray CT. The relationship between the MOE, MOR, knot size, and knot position was studied. By combining the strain distribution and internal structure, the reasons for the effect of knots on the bending properties of wood were explained.
3. Results and Discussion
Figure 2 presents the MOE, MOR, and deformation (displacement of the loading wedge) of the specimens. Specimens without knots have a higher MOR and larger displacement than knot specimens with failure at knots. The difference in MOR and displacement between specimens without knots and knot specimens with failure not at knots is small. There is no obvious difference of MOE between specimens without knots, knot specimens with failure at knots, and knot specimens with failure not at knots. According to the
t-test results listed in
Table 1, it can be found that both the MOR and the displacement difference between specimens without knots and knot specimens with failure at knots is significant at the 5% level. The MOR and the displacement difference between knot specimens with failure not at knots and knot specimens with failure at knots is significant at the 5% and 10% level, respectively. Taking a closer look at the variation shown in
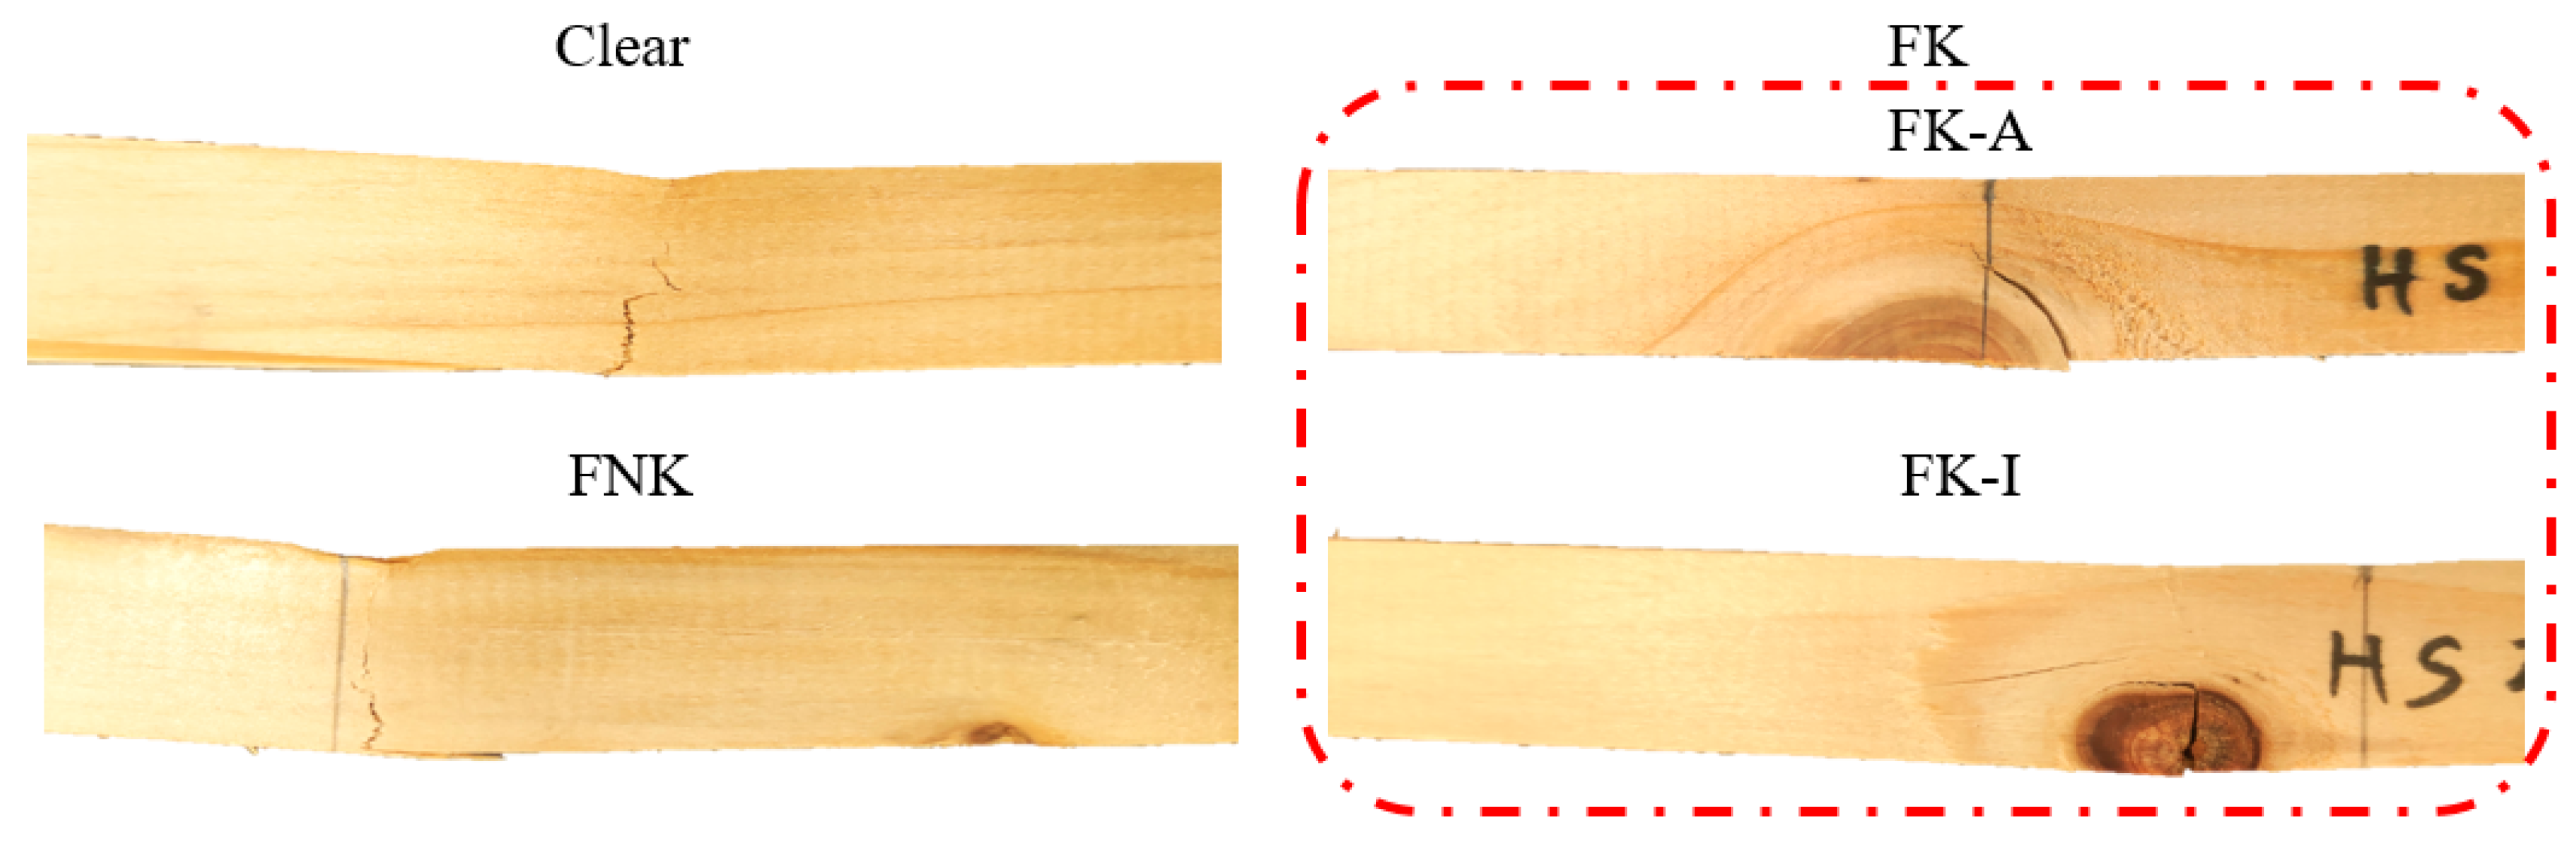
Figure 2, it can be seen that the variation in MOE and MOR in knot specimens with failure at knots is much larger than that in knot specimens with failure not at knots. By observing the failure pattern in knot specimens with failure at knots, two types of failure pattern, i.e., around knots (FK-A) or in knots (FK-I), are found (
Figure 3). The MOE of FK-A specimens is higher than the MOE of FK-I, and it is even slightly higher than the MOE of both specimens without knots and knot specimens without failure at knots (
Figure 2). The MOR of FK-A specimens is higher than the MOR of FK-I. The MOR difference between FK-A, specimens without knots, and knot specimens without failure at knots is small. Compared to FK-A, the displacement of FK-I is small. In
Table 1, the t-test results show that the MOE difference between FK-A and FK-I specimens is significant at the 10% level. The MOR difference between FK-A and FK-I specimens is significant at the 1% level. The existence of knots, therefore, has an influence on the mechanical properties of the wood. The extent of influence is significantly variable according to the failure patterns. Specifically, the impact of knots on the MOE and MOR is small when the specimens do not fail at knots or fail around knots. Both the MOE and MOR can be significantly lower when the specimens fail in knots. These results agree with the findings from the literatures [
3]. Researchers found that the position and size of knots significantly influence the MOE of wood specimens. The mechanisms of influence is, however, still unraveled. As such, both the process of failure and structural changes are necessary to investigate.
The mechanical properties and failure patterns are mainly determined by the characteristics of knots, e.g., knots’ size and position [
4].
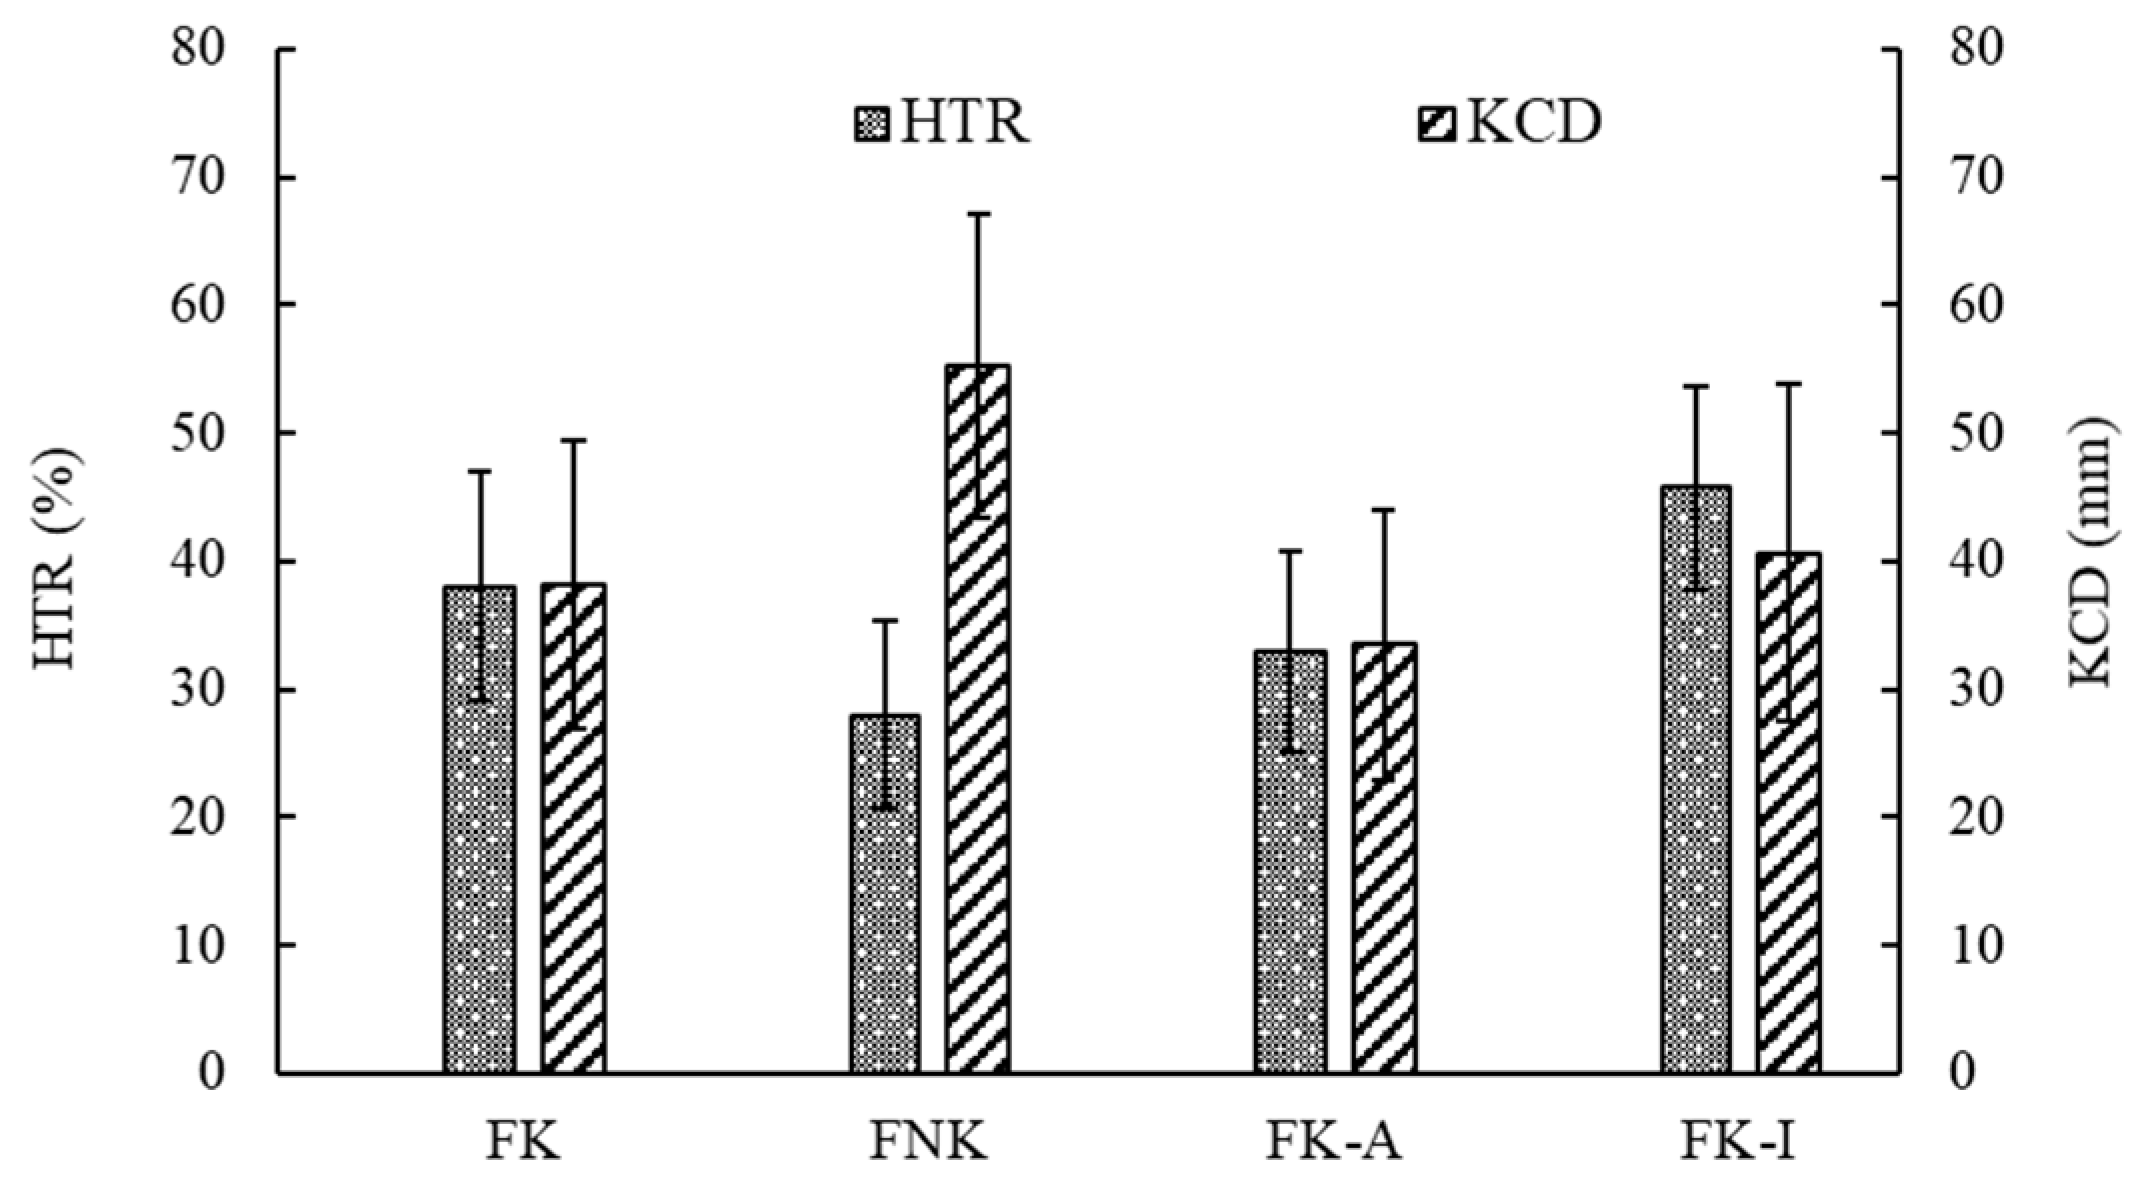
Figure 4 shows the ratio of knot height to specimen thickness (HTR) and the distance between the center line and knot in a specimen (KCD). The HTR of knot specimen failure at knots is significantly larger than that of knot specimens without failure at knots at the 10% level. The KCD of knot specimen failure at knots is significantly smaller than that of knot specimens without failure at knots at the 1% level. The position of knots, therefore, plays a crucial role in determining whether specimens will fail at knots. There is no significant difference in KCD between the FK-A and FK-I specimens. The HTR in FK-I specimens is significantly larger than that in FK-A specimens at the 10% level. Hence, the size of the knots plays a key role in determining whether specimens will fail in knots. The specimens with a small KCD are prone to fail at knots, and the specimens with a large HTR are prone to fail in the knot.
In order to understand the above results, ten representative specimens were selected and analyzed in detail. The basic information for these specimens is listed in
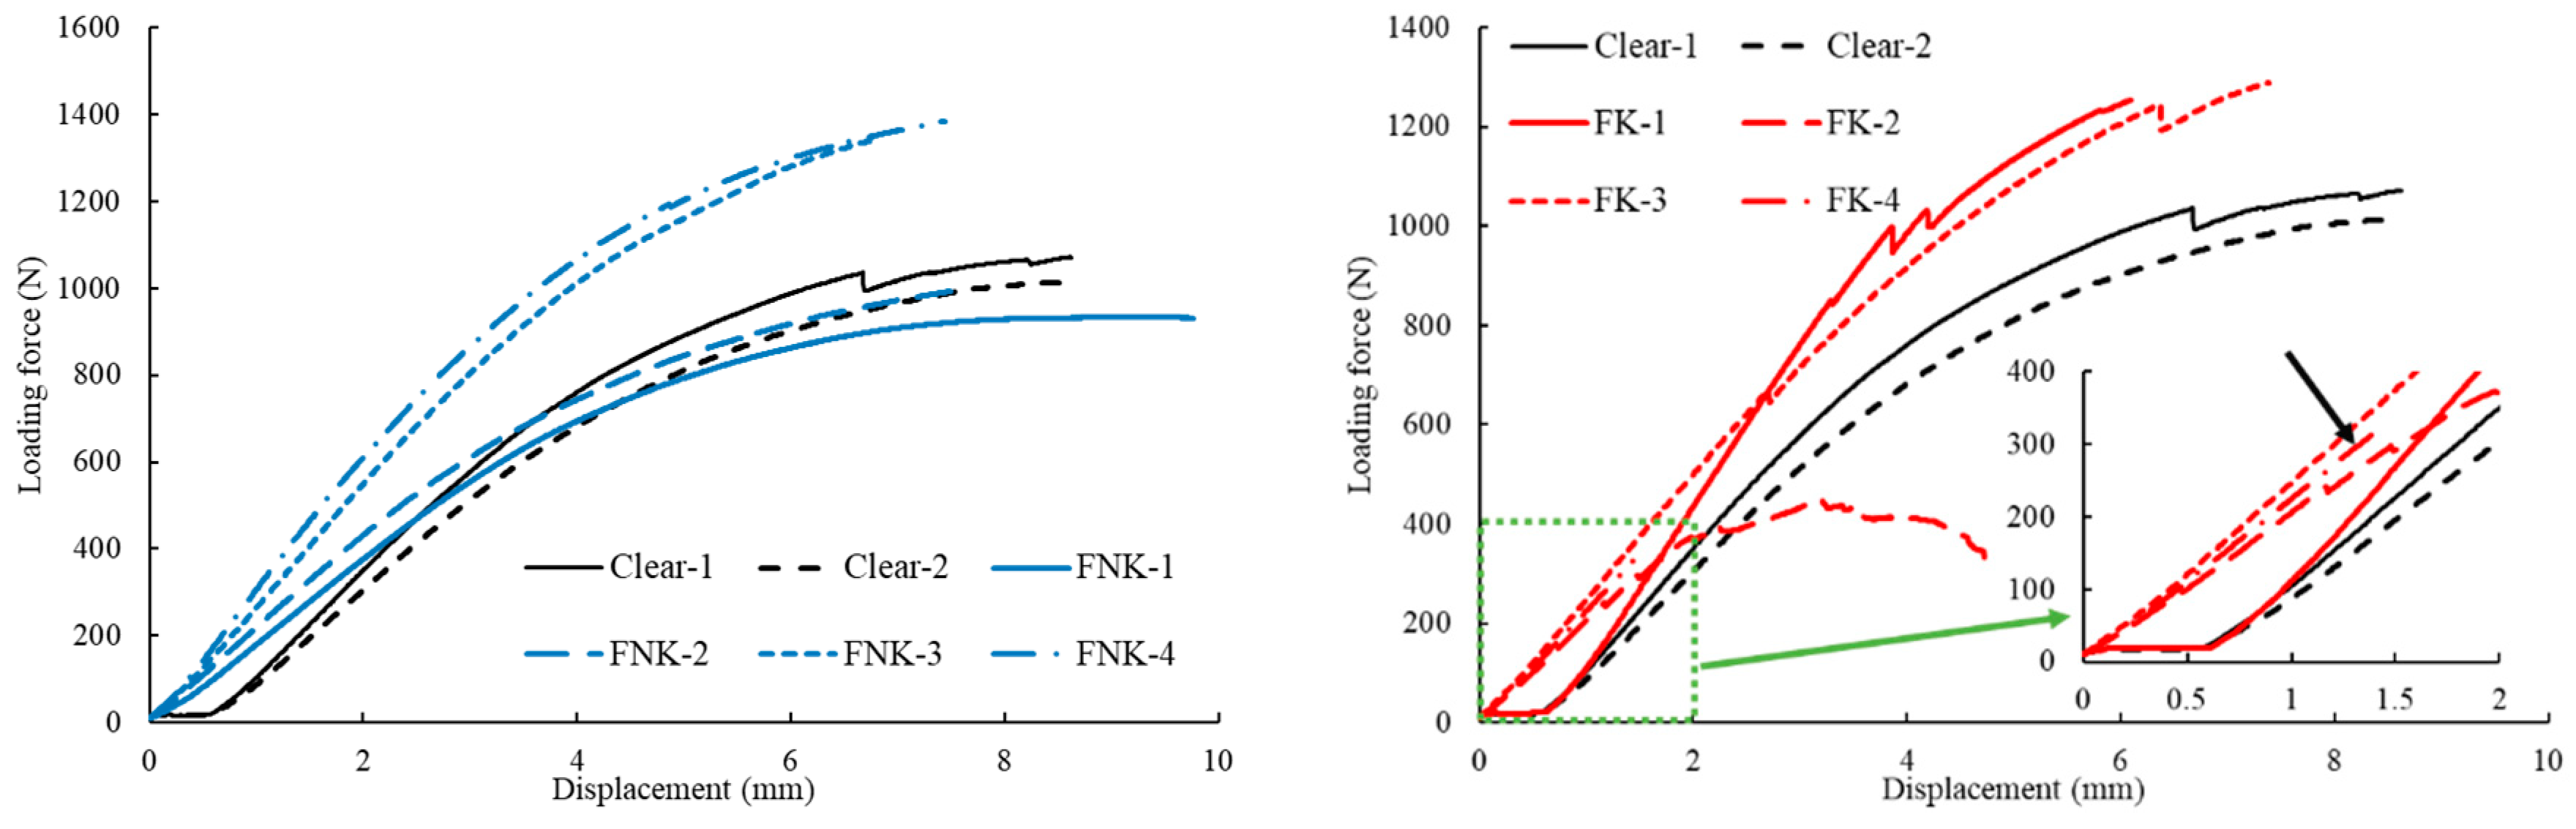
Table 2. The load-displacement (loading-wedge-displacement) profile is presented in
Figure 5. For two specimens without knots and four knot specimens with failure not at knots, the profiles are similar to the typical elastic–plastic profiles of wooden materials reported in the literature [
20]. This proves that knots have a minor impact on the mechanical behavior of the specimens in bending when the failure position is not at knots.
The MOR of FK-1 and FK-3 is as high as 59.42 MPa and 61.43 MPa, respectively, while the MOR of FK-2 and FK-4 is 14.25 MPa and 15.55 MPa, respectively.
Figure 5 shows that the bending profiles of FK-1 and FK-3 are similar to the typical elastic–plastic profiles of the specimens without knots. For FK-2 and FK-4, however, the displacement is small, and there is hardly any plastic domain in the profiles, leading to a low MOR. The loading force is determined with the capability of energy absorption. The capability of energy absorption originates from the strength of wood tissues and internal structural changes in the specimens. Internal structural changes instead of structural failure of the specimens contribute to energy absorption and a loading force increase [
21]. A large plastic domain means big internal structural changes, resulting in a large loading force and high MOR. On the contrary, sudden structural failure reduces the plastic domain and loading force, which is due to a large HTR and small KCD. During the three-point bending test, stress initiates from the loading wedge and transfers to nearby regions. A small KCD means that stress can transfer to knots instantly due to the short distance. A large HTR means that stress can hardly bypass knots and transfer to other regions. For these reasons, the coexistence of a large HTR and small KCD will lead to small displacement and low MOR. To further prove the above hypothesis, the strain distribution of six specimens was mapped.
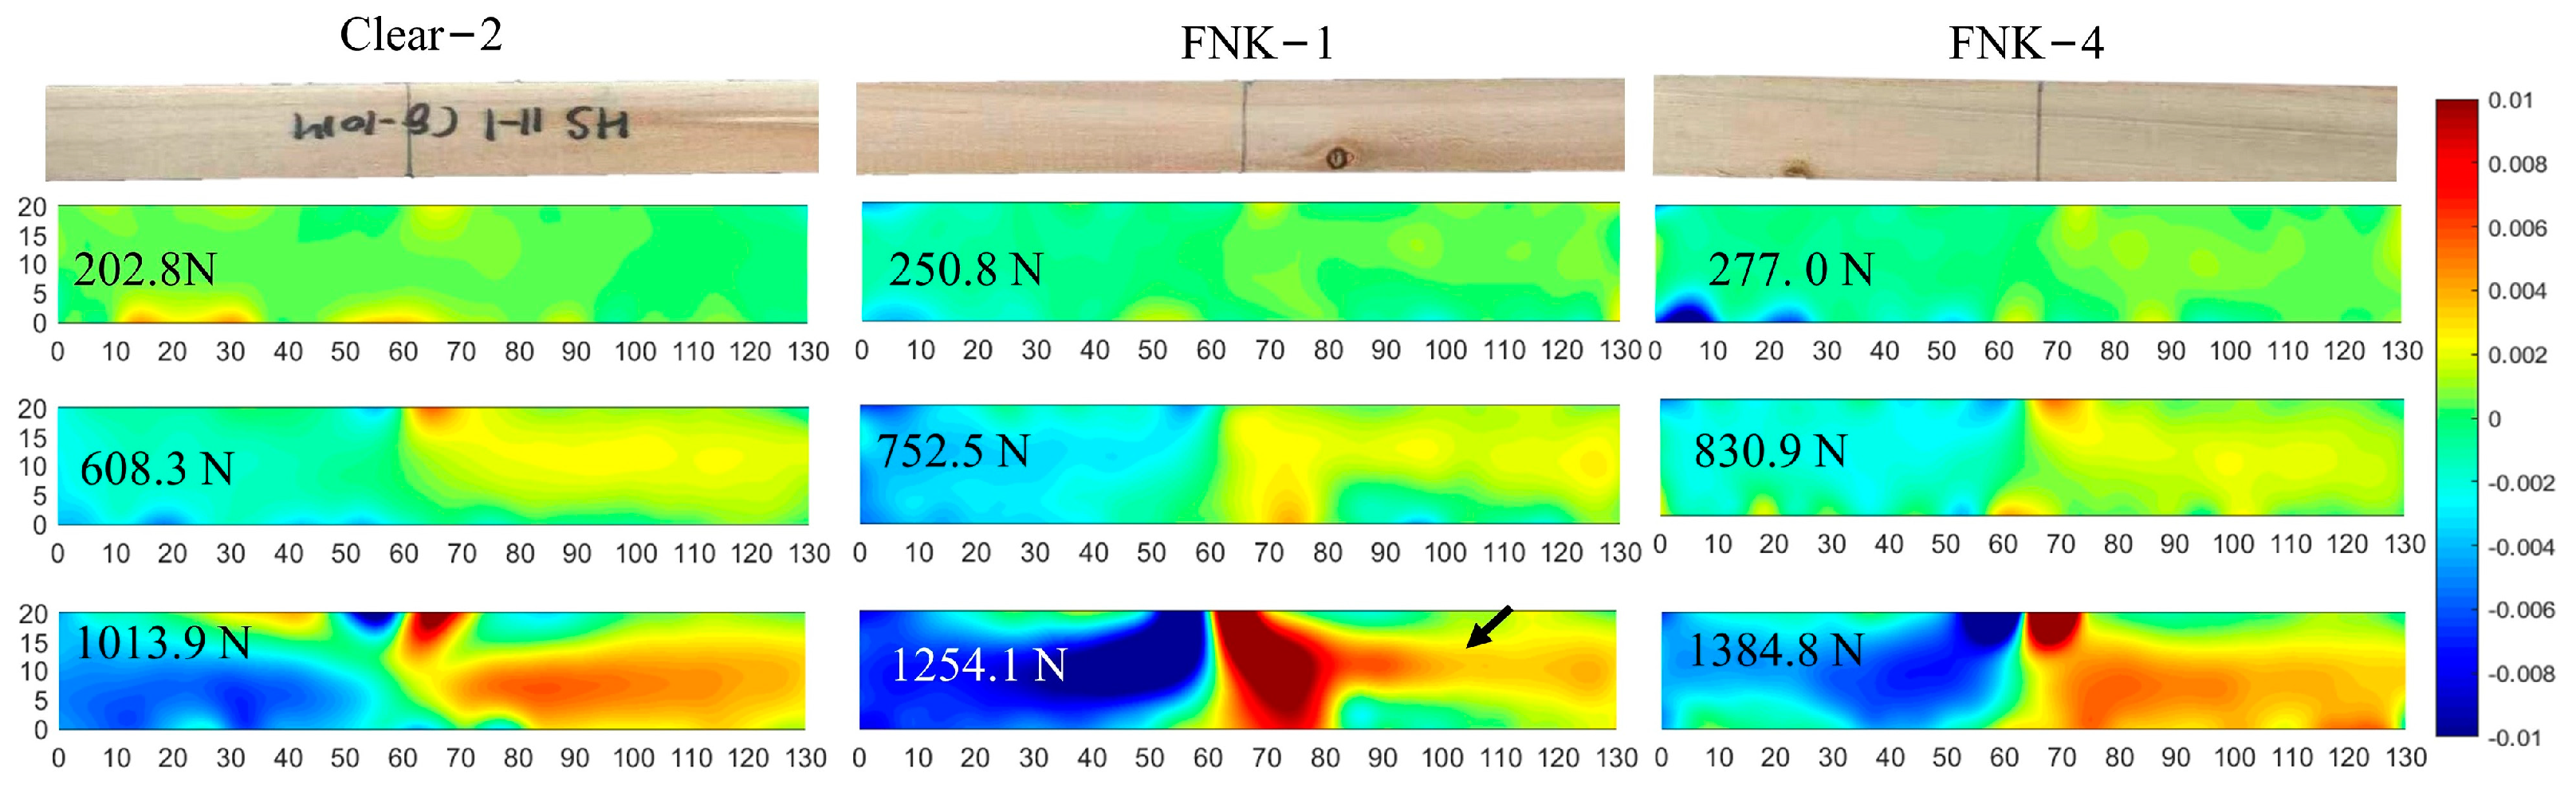
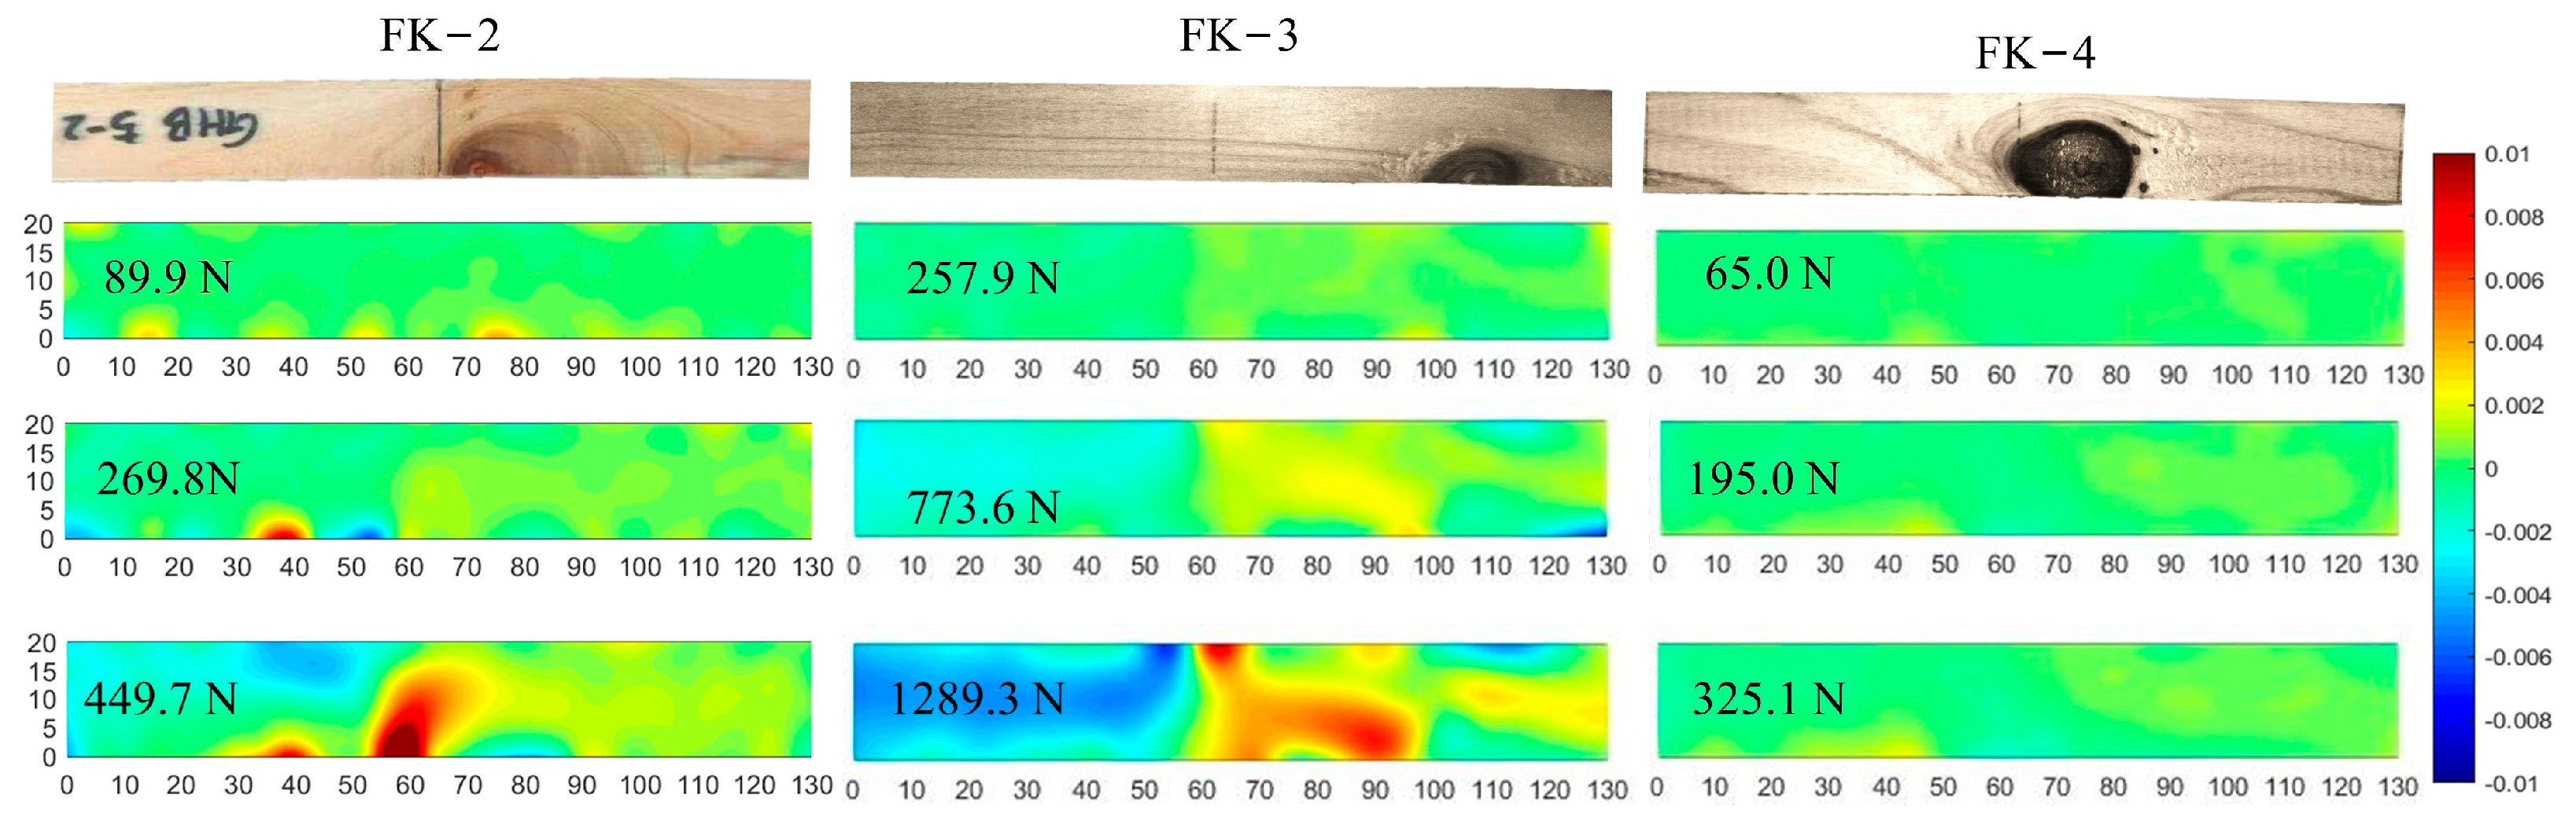
Figure 6 and
Figure 7 show the shear strain of six specimens at three different loading steps. These three loading steps represent 0.2, 0.6, and 1.0 times the maximum loading force of each specimen.
In general, the shear strain distribution in Clear-2, FNK-1, and FNK-4 is similar. Strain distribution mainly starts in regions adjacent to the loading wedge, which could be due to indentation. The indentation can be observed in
Figure 3 as well. With an increasing loading force, shear strain transfers to other regions, mainly along the specimens’ length (grain direction). Effective strain transferal and homogeneous strain distribution limit strain accumulation and regional structural failure. For FNK-1, there is strain accumulation in regions with a knot. Strain accumulation hinders strain transferal along specimens’ length, resulting in small strain on the right side of the specimen (highlighted with an arrow in
Figure 6). Although FNK-1 does not fail at the knot, its MOE and MOR are relatively low, i.e., 4575.90 MPa and 43.83 MPa, respectively. The occurrence of strain accumulation is related to a small KCD.
Differentiating the specimens without knots and knot specimens with failure not at knots, the shear strain distribution in knot specimens with failure at knots is substantially variable (
Figure 7). The shear strain distribution is obviously influenced by knots. For FK-2, shear strain mainly accumulates in regions adjacent to the knot, and shear strain accumulation caused by indentation is not even obvious. This agrees with the results shown in
Figure 3. This means that the structure close to a knot can be deformed at low strain levels. This is due to density variation and deviated fiber directions around knots, resulting in strain accumulation along the edge of the knot [
15]. Strain accumulation finally causes structural failure at knots under low loading forces. Looking at FK-4, there is hardly any strain accumulation due to a small displacement (1.44 mm). A large knot is right beneath the loading wedge. Because of the brittle structure of the knot, its structure fails under low loading force without effective strain transferal. Differentiating FK-2 and FK-4, the shear strain distribution in FK-3 is similar to the specimens without knots and knot specimens with failure not at knots. Shear strain can effectively be transferred along the grain direction as the loading force increases, resulting in an MOE of 581 5.55 MPa and an MOR of 61.43 MPa. Strain accumulation is found in regions near the knot, which finally leads to specimen failure at the knot. A high MOE and MOR are related to moderate HTR and KCD.
Based on the mechanical performances and dynamic strain distribution of the six specimens, it is found that the impact of knots on the MOE and MOR of the specimens can be explained via strain transferal. If knots induce serious strain accumulation or hinder strain transferal along the wood fibers, then the MOE and MOR of the specimens are reduced. On the contrary, the impact of knots on the MOE and MOR of the specimens is minor if strain is able to effectively transfer even though the specimens finally fail at the knot.
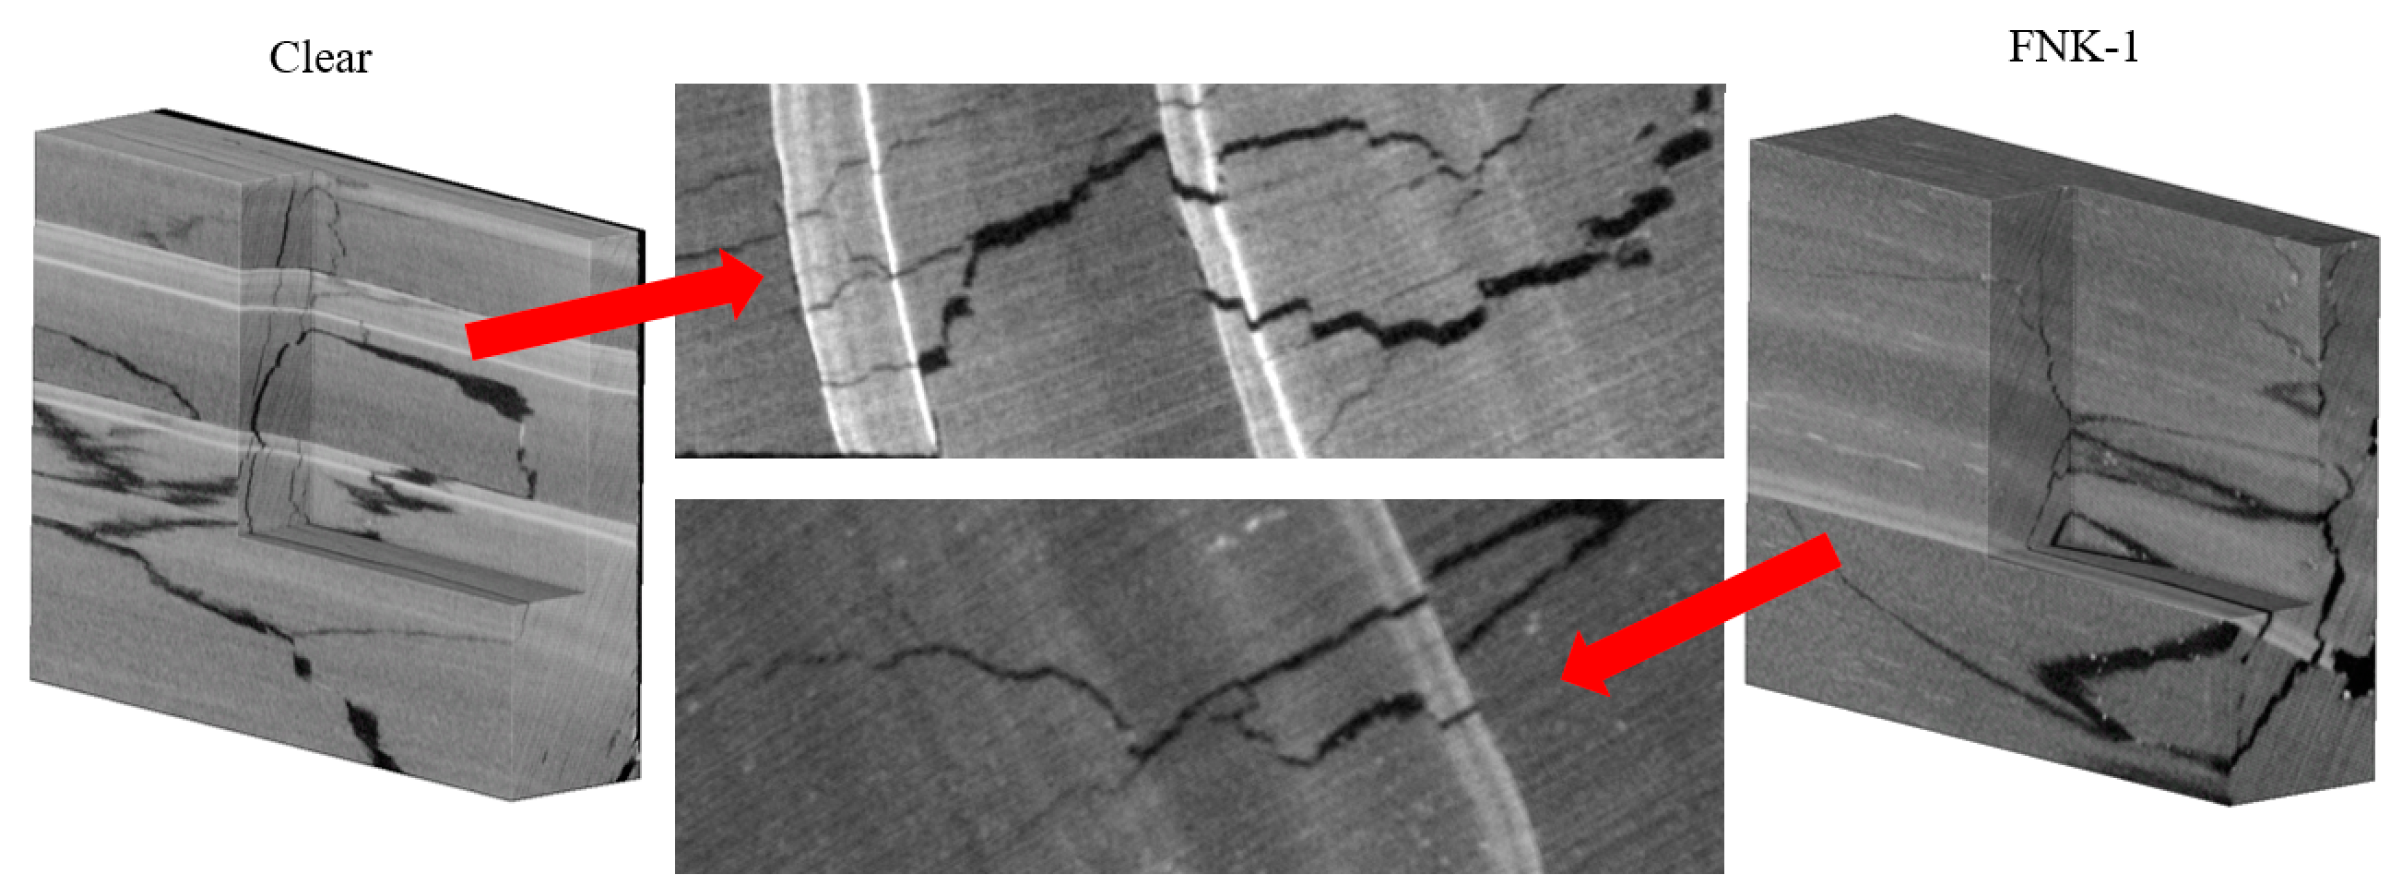
Mechanical properties and strain distribution closely relate to internal structural changes caused by the bending test.
Figure 8 shows the internal structure of one specimen without knots and a knot specimen with failure not at knots after the bending test. There are both large and small cracks, and these cracks are interconnected. The emergence of cracks is induced by external energy absorption. The combination of large and small cracks means that structural changes occur step by step. A large proportion of wood tissue is involved in structural changes, certainly contributing to large energy absorption and a high MOR. Taking a closer look, it is found that the direction of cracks is nearly perpendicular to the annual rings, because the loading force is applied perpendicular to the annual rings. Meanwhile, wood rays are prone to structural failure due to thin cell walls and low mechanical strength [
22].
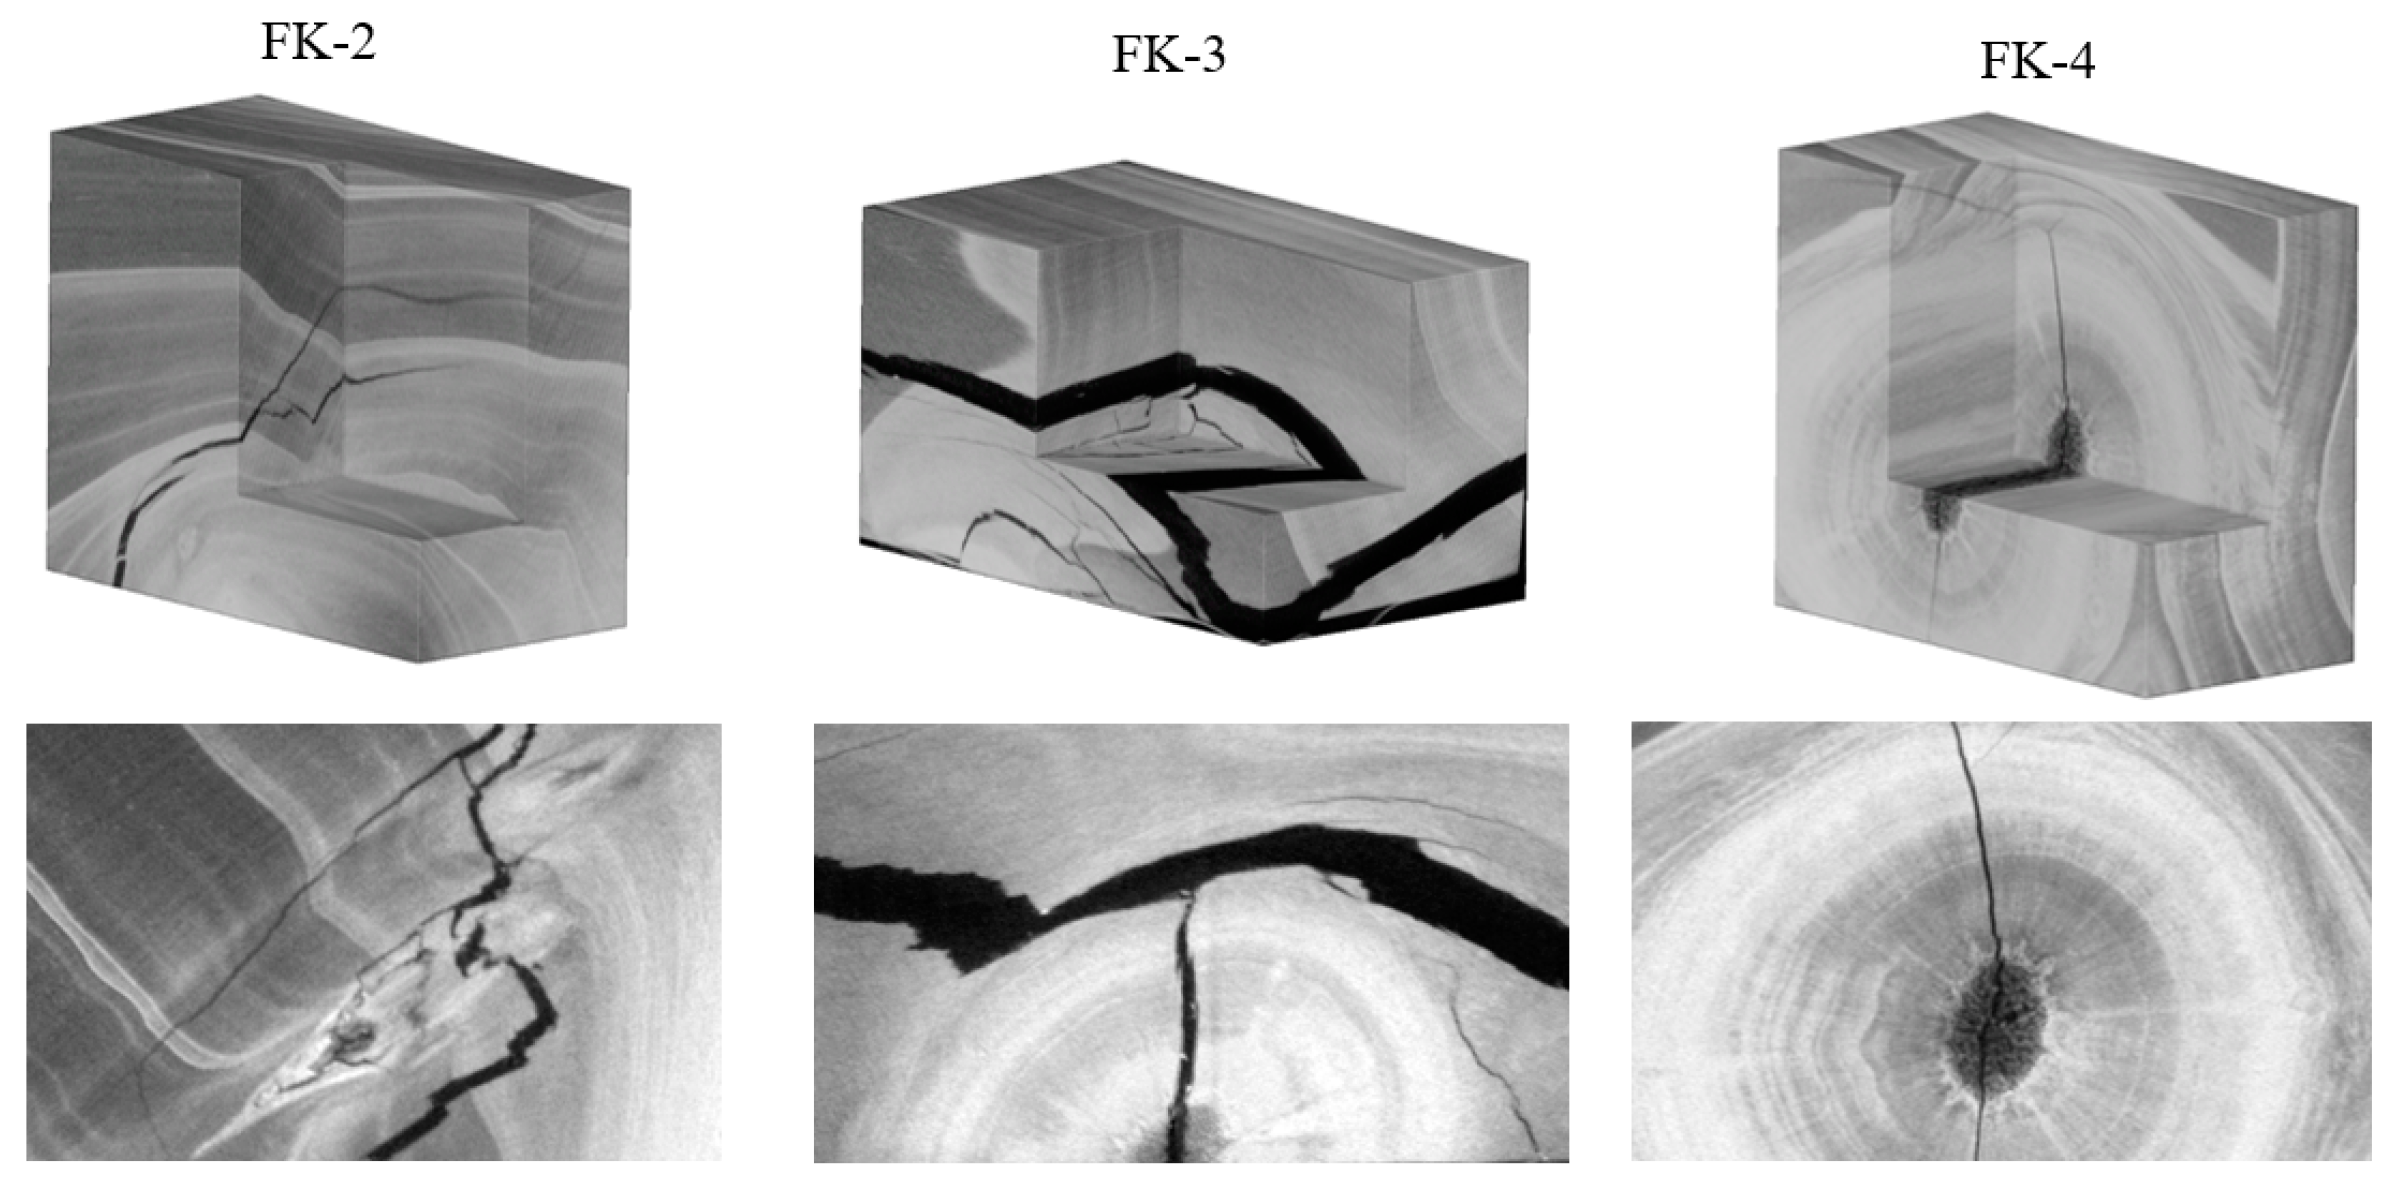
The internal structure of three specimens with failure in knots is shown in
Figure 9. Obvious cracks are found in the knots of the three specimens. Compared to normal wood tissues, cracks are prone to occur in knots, which corresponds to results in the published literature. Researchers found that fractures are typically initiated around knots and at knot interfaces due to crack propagation along the grain [
5]. For FK-2 and FK-4, several cracks are found across the knots, resulting in the specimens’ failure, and few cracks are found in regions outside the knots. As such, wood tissues in other regions have only shown minor structural changes and can hardly contribute to energy absorption during the bending test. This leads to a low MOR and small displacement (
Table 2). Looking at FK-3, there are cracks both across and around the knot, and many small cracks are found. Wood tissues in the knot, around the knot, and in other regions are all involved in energy absorption during the bending test. Meanwhile, the high density and high extractive content around the knots can increase both the density and brittleness [
23]. Hence, structural changes in knots possibly increase the mechanical strength of wood. This is the reason that the MOR of FK-3 is as high as 61.43MPa. It agrees with the findings from other researchers. It was reported that failures also occur at smaller knots and, in this case, the strength of the knots may be higher than the strength of the timber board [
24].
In practice, there are live knots, dead knots, intergrown knots, and knot holes in wood. These detailed characteristics of knots could hardly be classified and considered in a timely manner during wood-based product processing and envisaged applications. Considering the impact of the size and position of knots on the mechanical strength of wood, it is suggested that these two parameters should be carefully adjusted to improve the mechanical performance of wood-based products. Generally speaking, knots, especially those of a larger dimension, should be at a distance away from the loading position. This distance relates to specific wood properties and loading strategies. It is a challenge to track the size and position of knots in a timely manner; however, this target could be possible to achieve thanks to the fast development of machine vision technology.
4. Conclusions
The mechanical properties of the specimens without knots and with knots are measured using the three-point bending test. Knot specimens with failure at knots are analyzed according to failure in knots (FK-I) and failure around knots (FK-A). For the modulus of elasticity (MOE) and modulus of rupture (MOR), the difference among specimens without knots, knot specimens with failure not at knots, and FK-A specimens is small. The MOE of FK-I is significantly lower than that of FK-A specimens at the 10% level. The MOR of FK-I is significantly lower than that of FK-A specimens at the 1% level. Hence, the impact of knots on the MOE and MOR of wood is mainly due to failure in knots, which is related to the distance between the center line and knot, as well as the ratio of knot height to specimen thickness. The specimens with a small distance between the center line and knot are prone to failure at the knot, and the specimens with a large ratio of knot height to specimen thickness are prone to fail in the knot. The effect of knots on the MOE and MOR is due to strain transferal and structural changes. During the bending test, shear strain is prone to transferal along specimens’ length or wood grain direction. Effective shear strain transferal can limit strain accumulation and increase the MOE and MOR, which occurs in specimens without knots and knot specimens with failure not at knots. For knot specimens with failure at knots, the existence of knots greatly influences the shear strain distribution, leading to a variable MOE and MOR. If knots hinder the shear strain transferal along the grain direction, then the MOE and MOR will be low. The shear strain distribution closely relates to internal structural changes in the specimens. Effective shear strain transferal means that a proportion of wood tissue is involved in structural changes, including both large and small cracks. Few and large cracks in knots would diminish strain transferal and decrease the MOE and MOR.
In this study, the effect of knots on mechanical properties was evaluated. The specific reasons for structural changes are still not fully understood. The microstructure of knots and nearby wood tissue need to be mapped. It is necessary to map dynamic structural changes while conducting loading tests; this could be investigated by combining other state-of-the-art techniques, such as 4D X-ray CT. There is only one knot in each specimen in this study. The effect of multiple knots on the mechanical properties of wood still needs to be studied. Although the number of specimens was not small, a larger data set could be useful for future work.


 ,
, 

