
Quantification and Proxy Indicators of the Carbon Pool in Urban Tree Litterfall: A Case Study of Urban Green Spaces in Beijing

Abstract
1. Introduction
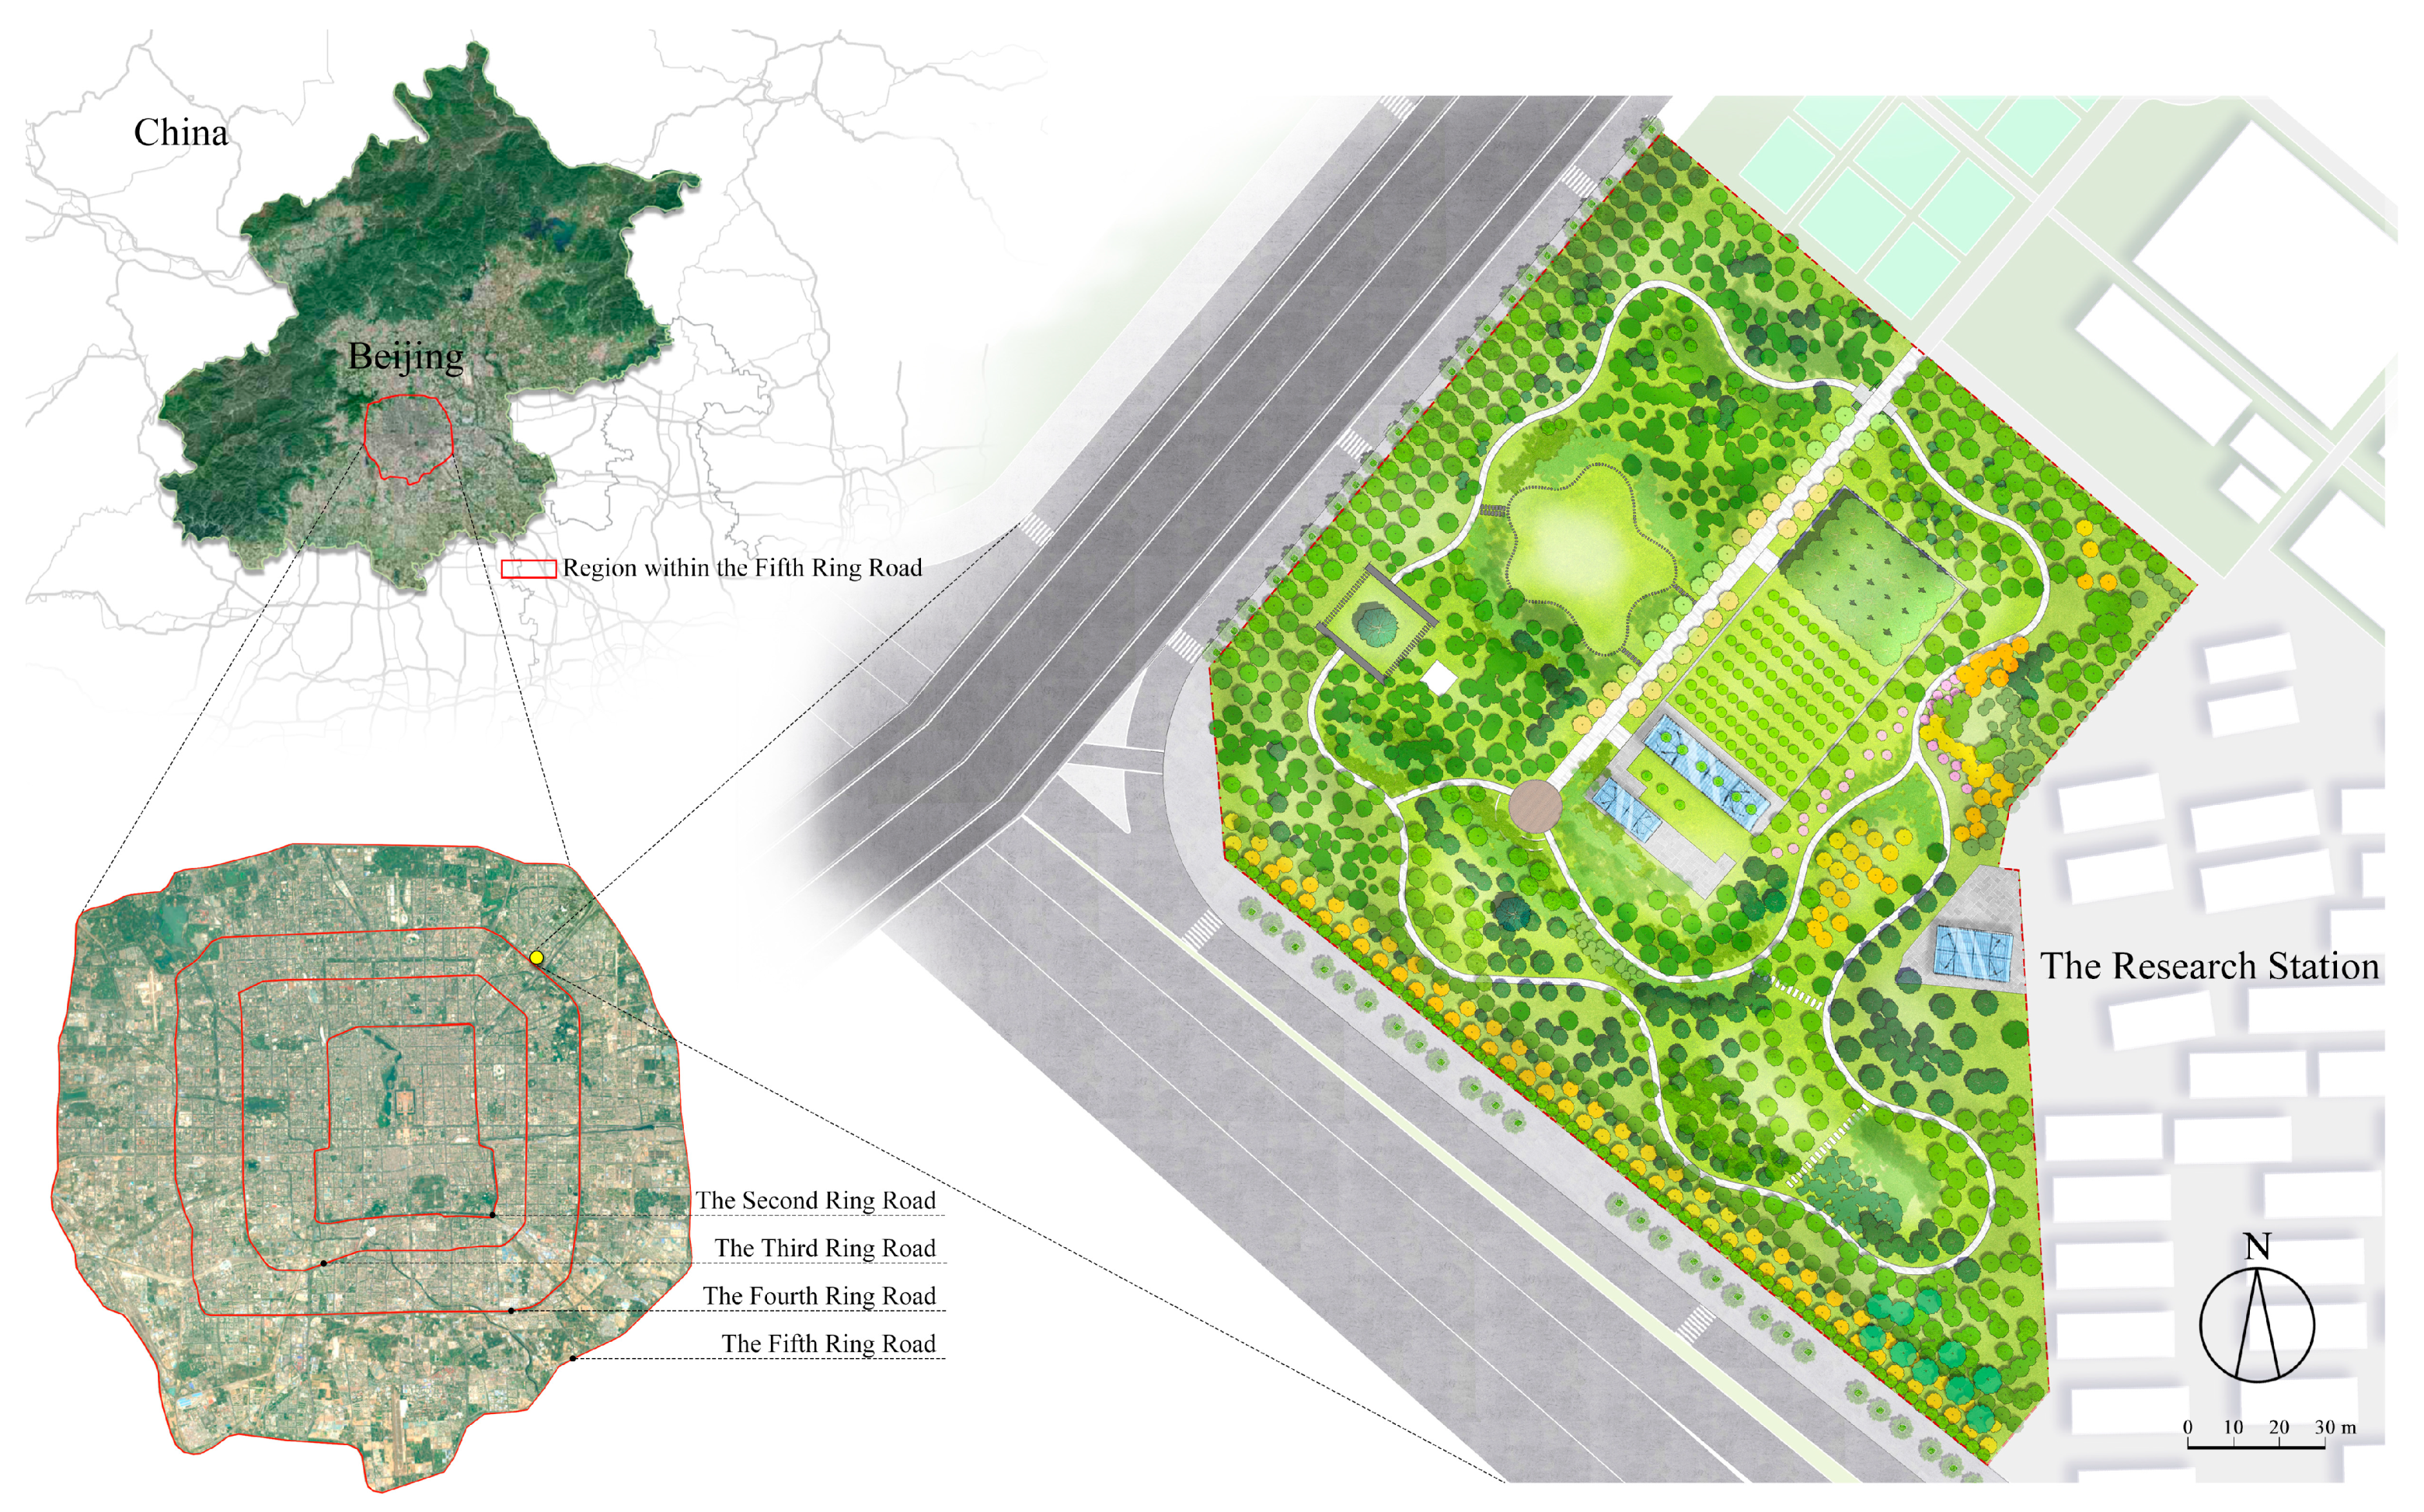
2. Study Area
3. Methodology
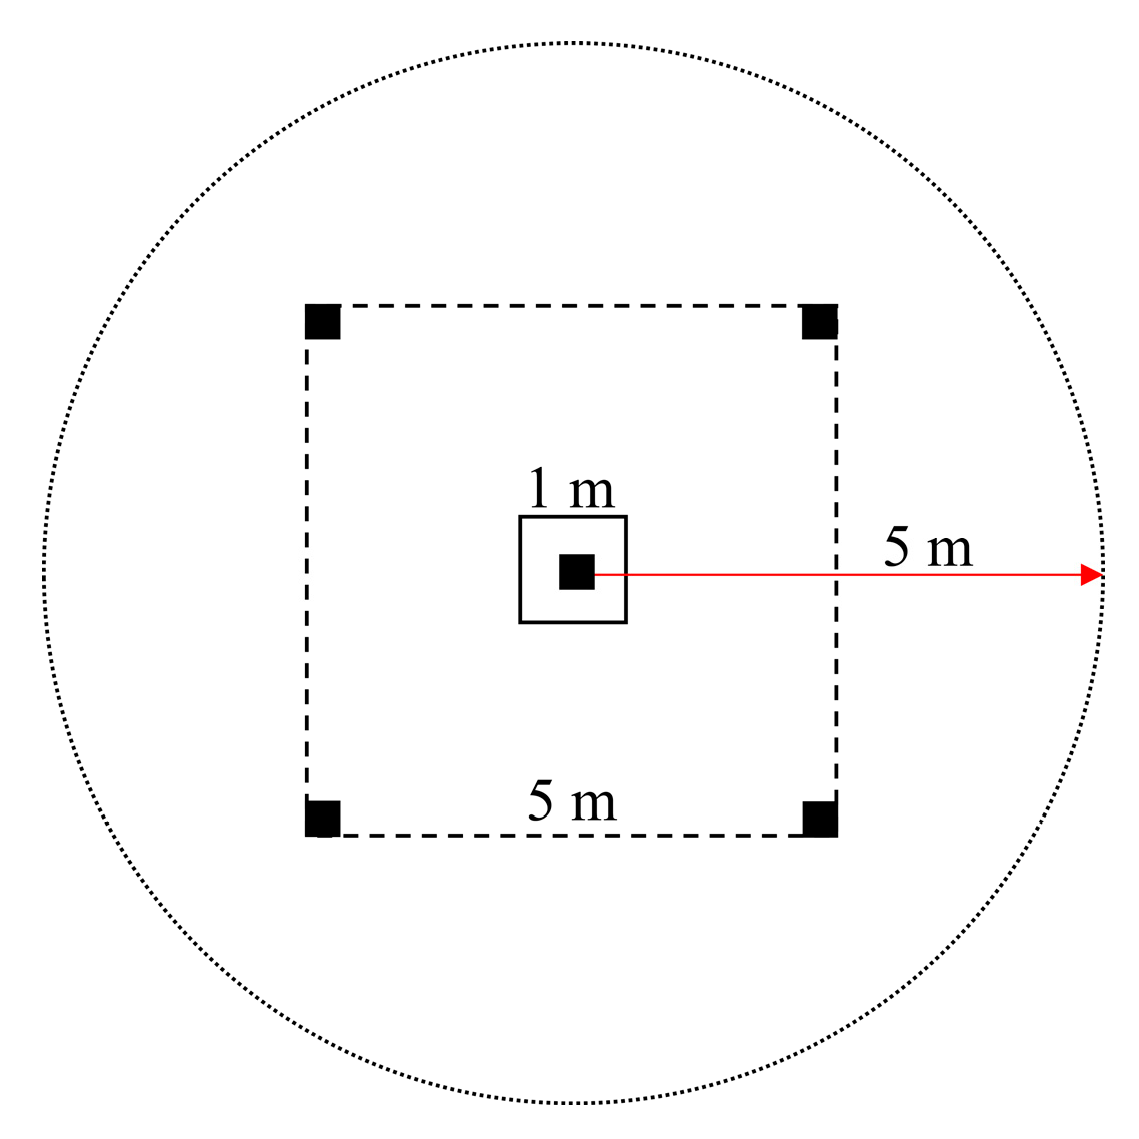
3.1. Sample Point Selection and Data Collection
3.2. Determination of the Biomass and Carbon Ratio of Litterfall
3.3. Structural Index Calculation and Proxy Indicators Screening
3.4. Satellite-Remote-Sensing-Data Inversion and Estimation of Annual Litterfall Carbon Storage in Urban Green Spaces
4. Results
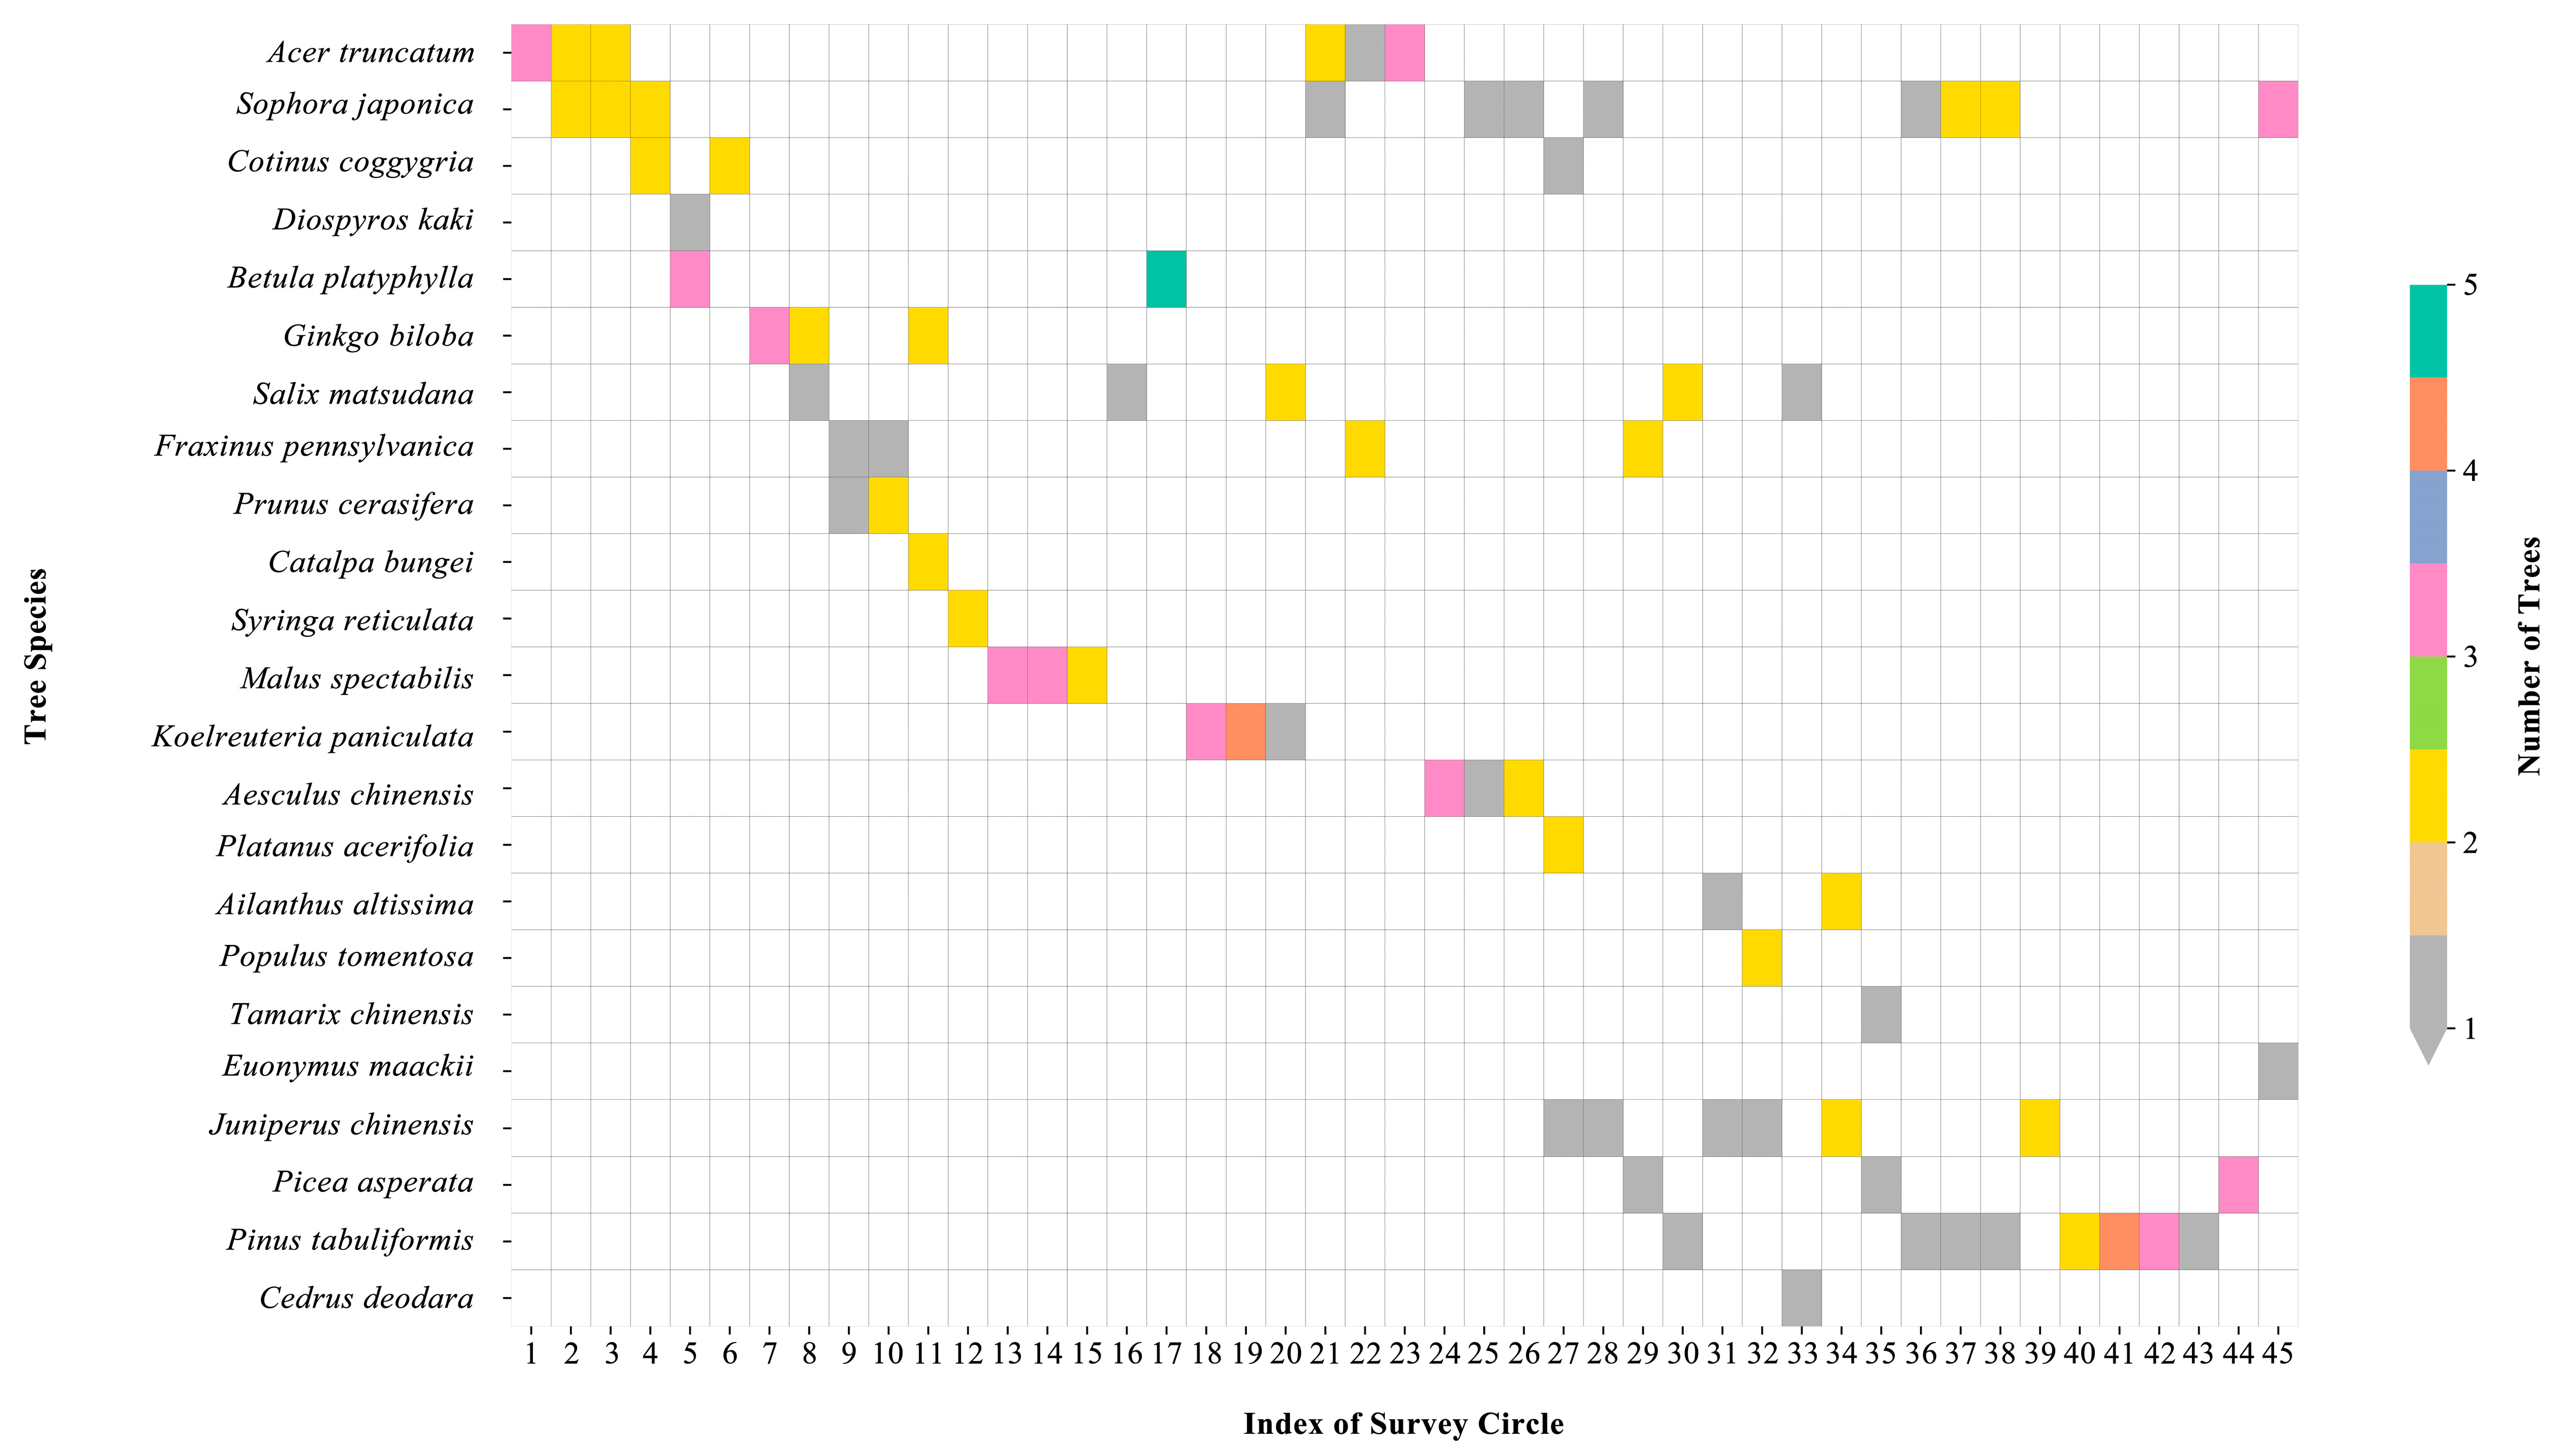
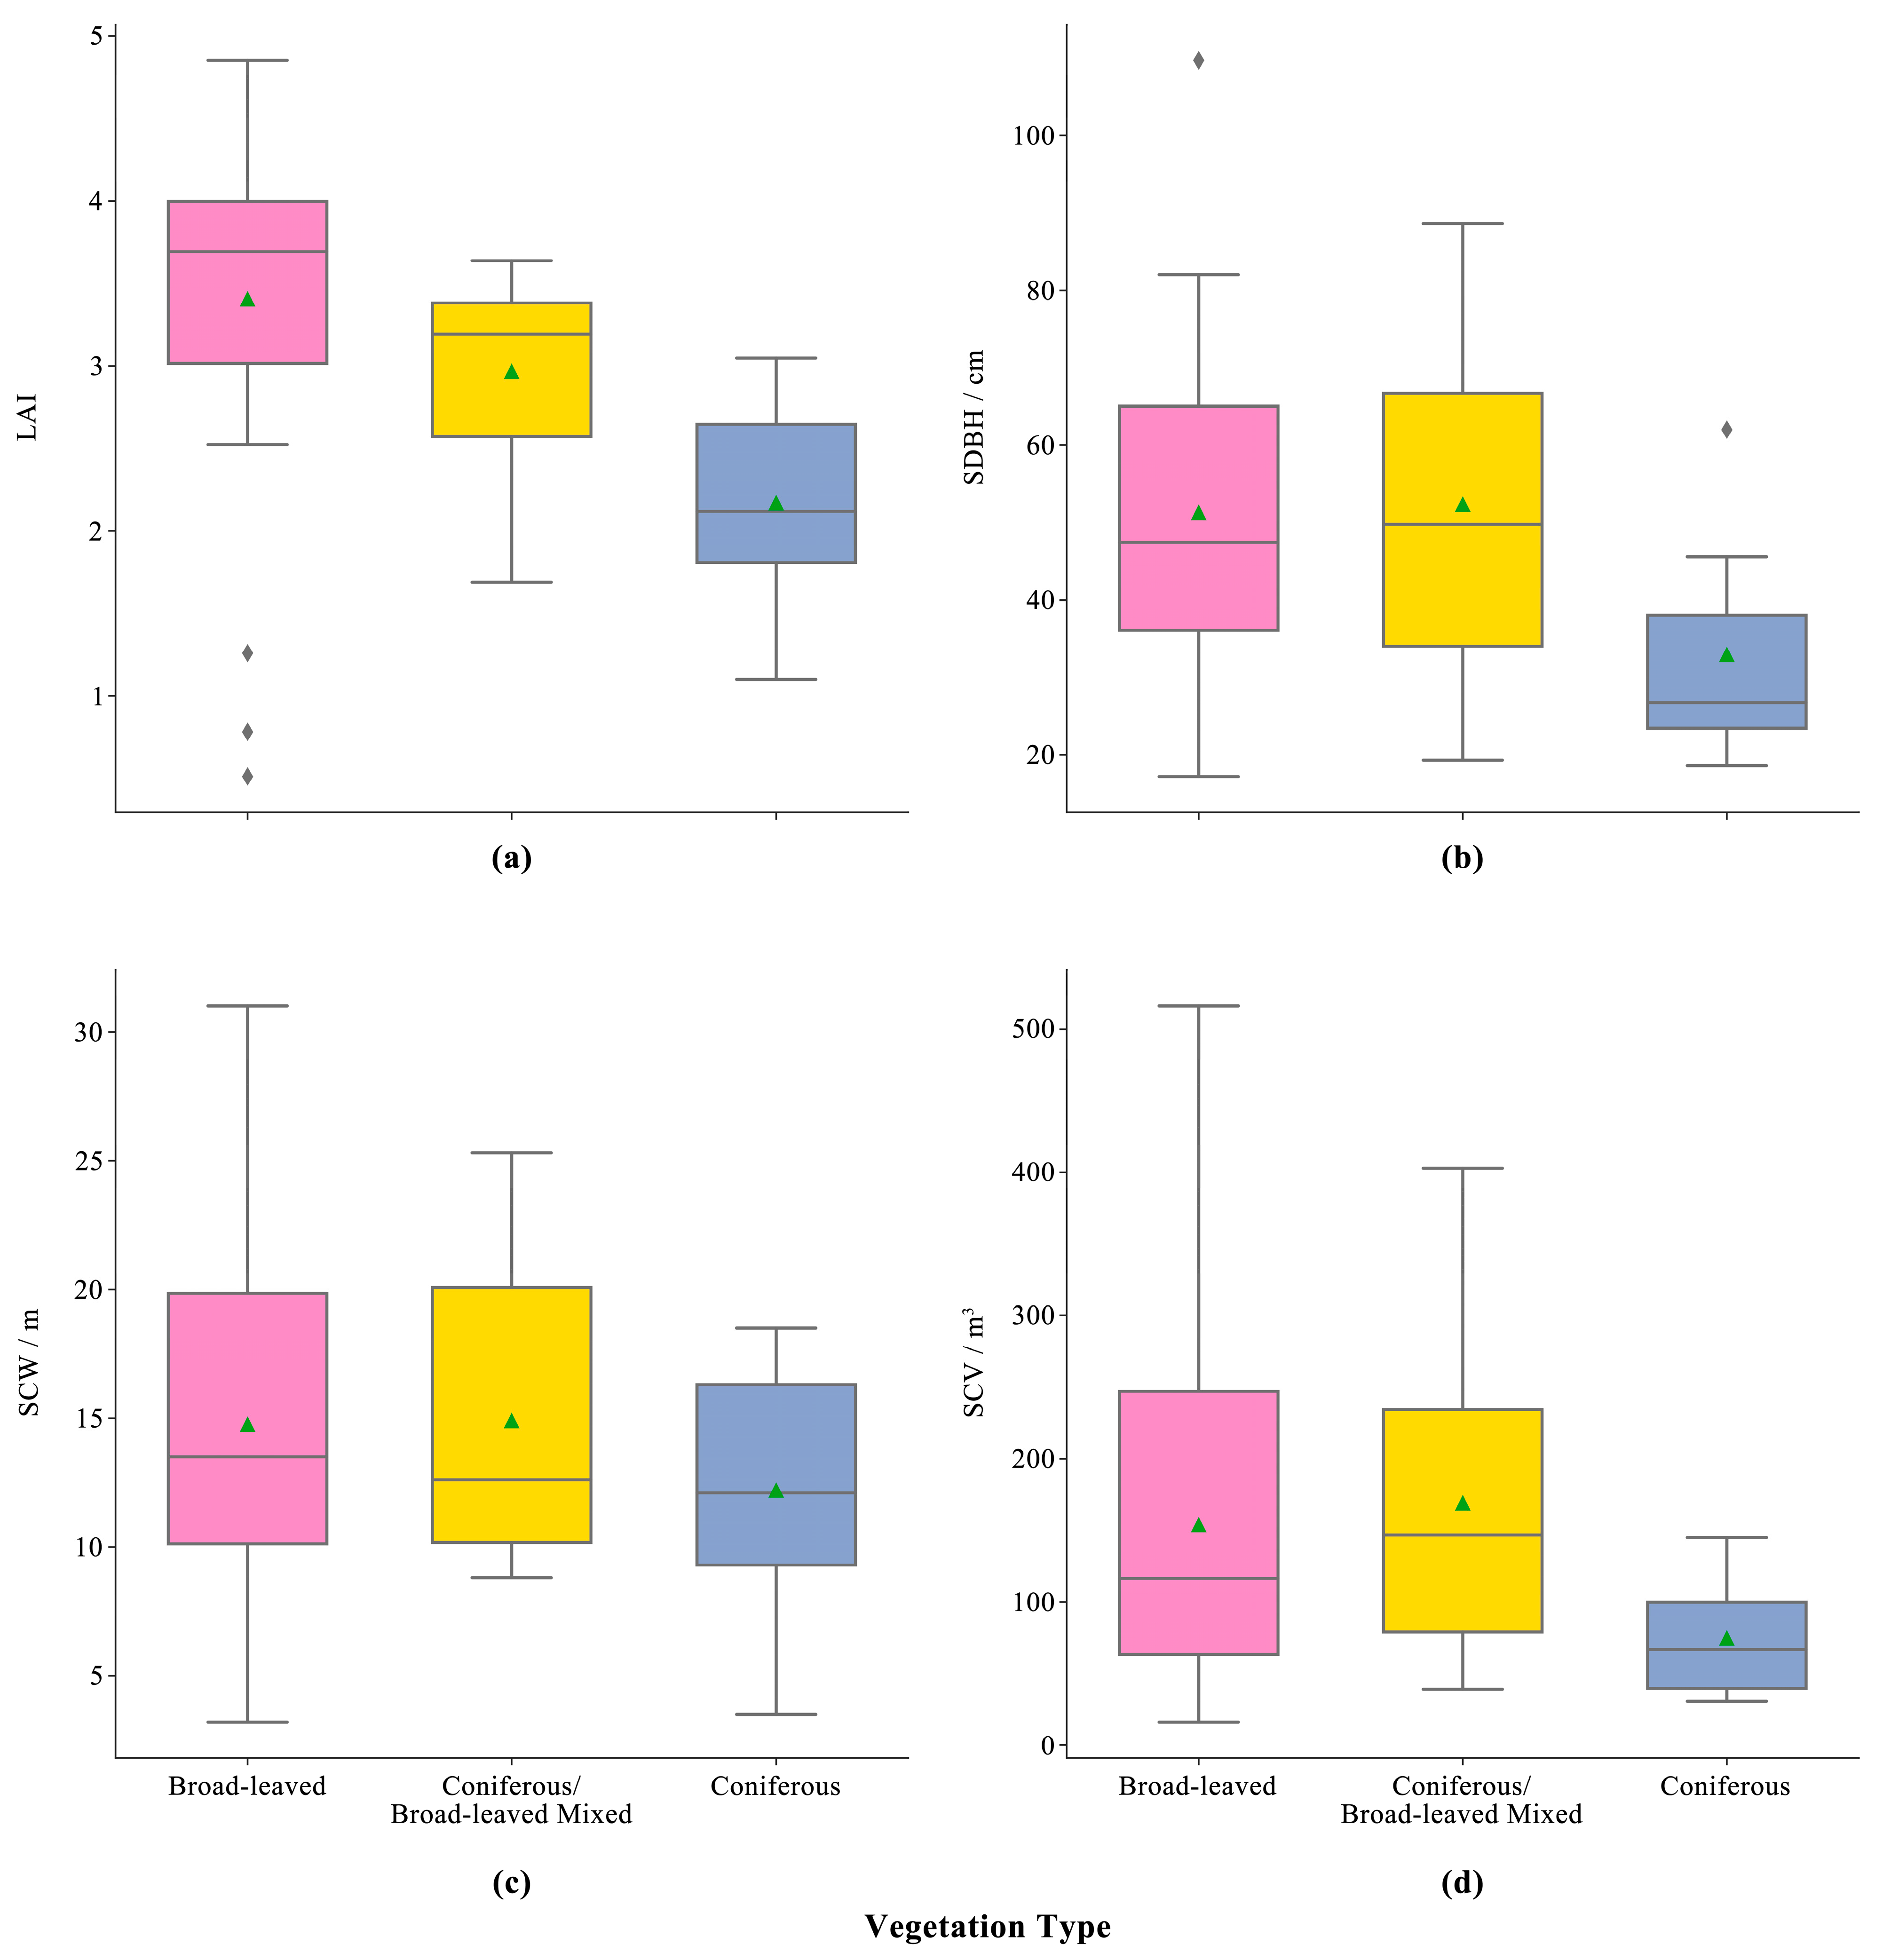
4.1. Distribution of Trees and Litterfall in Different Types of Sampling Units
4.2. Screening of Proxy Indicators
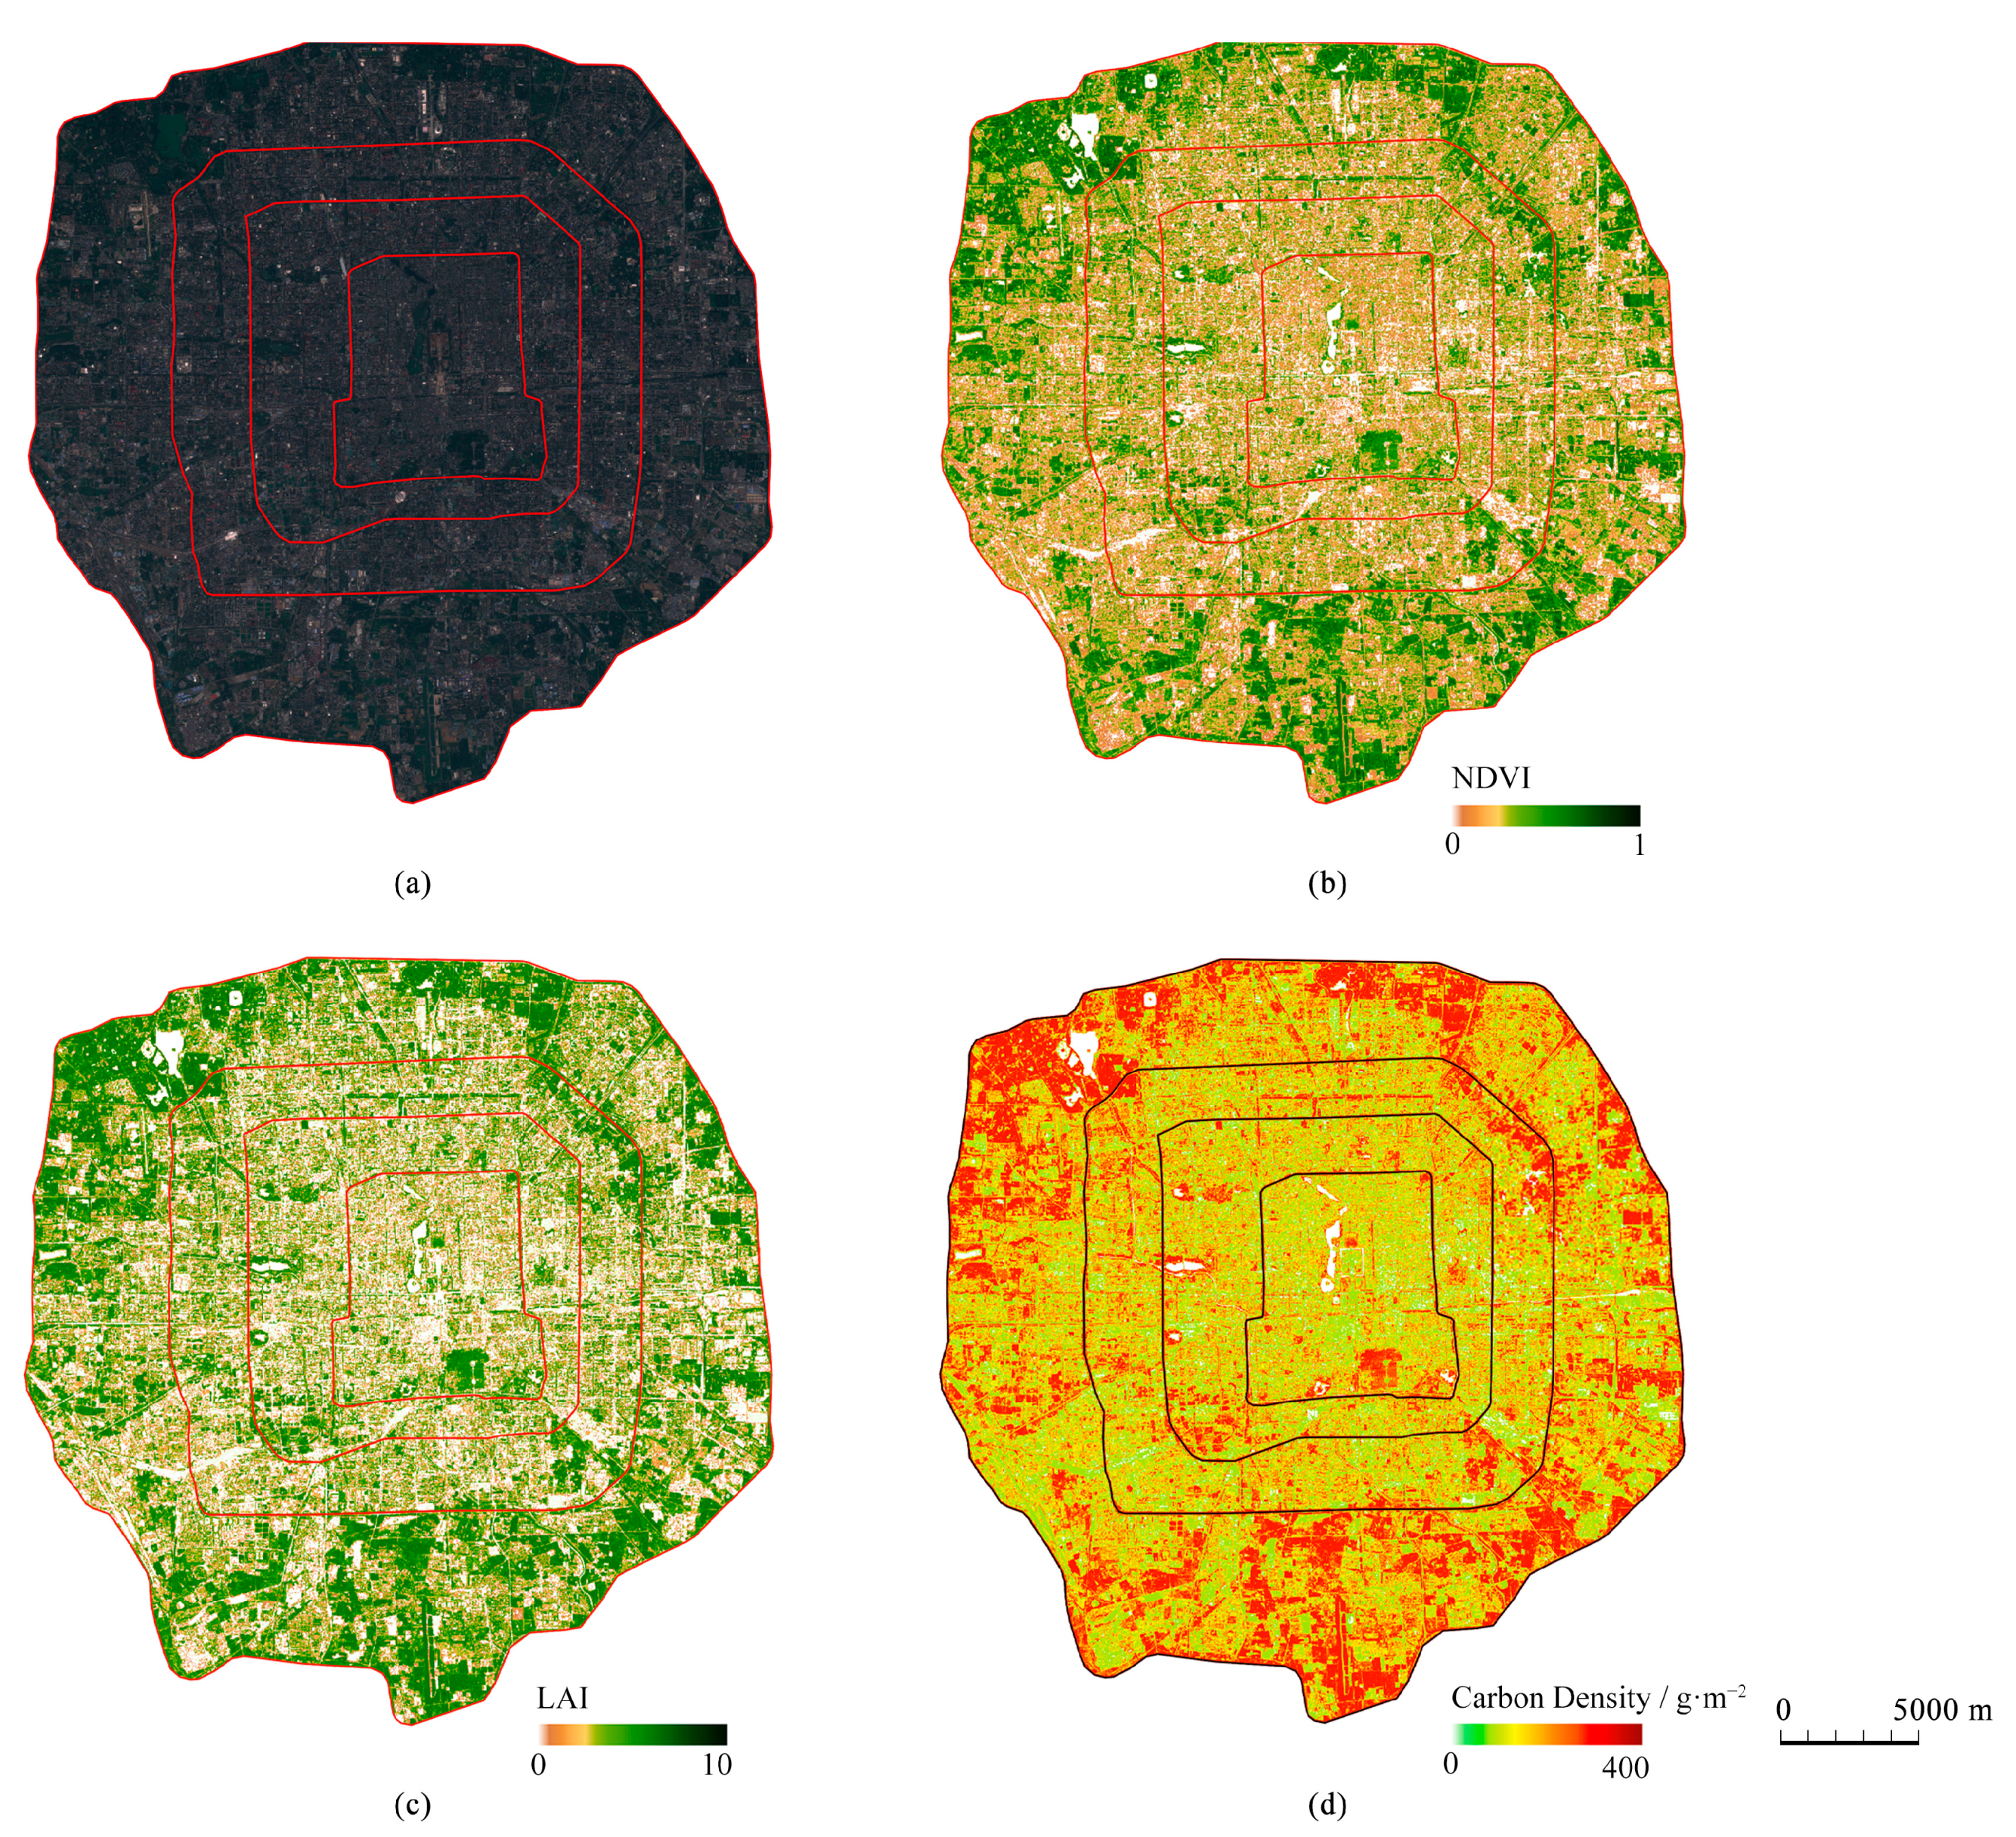
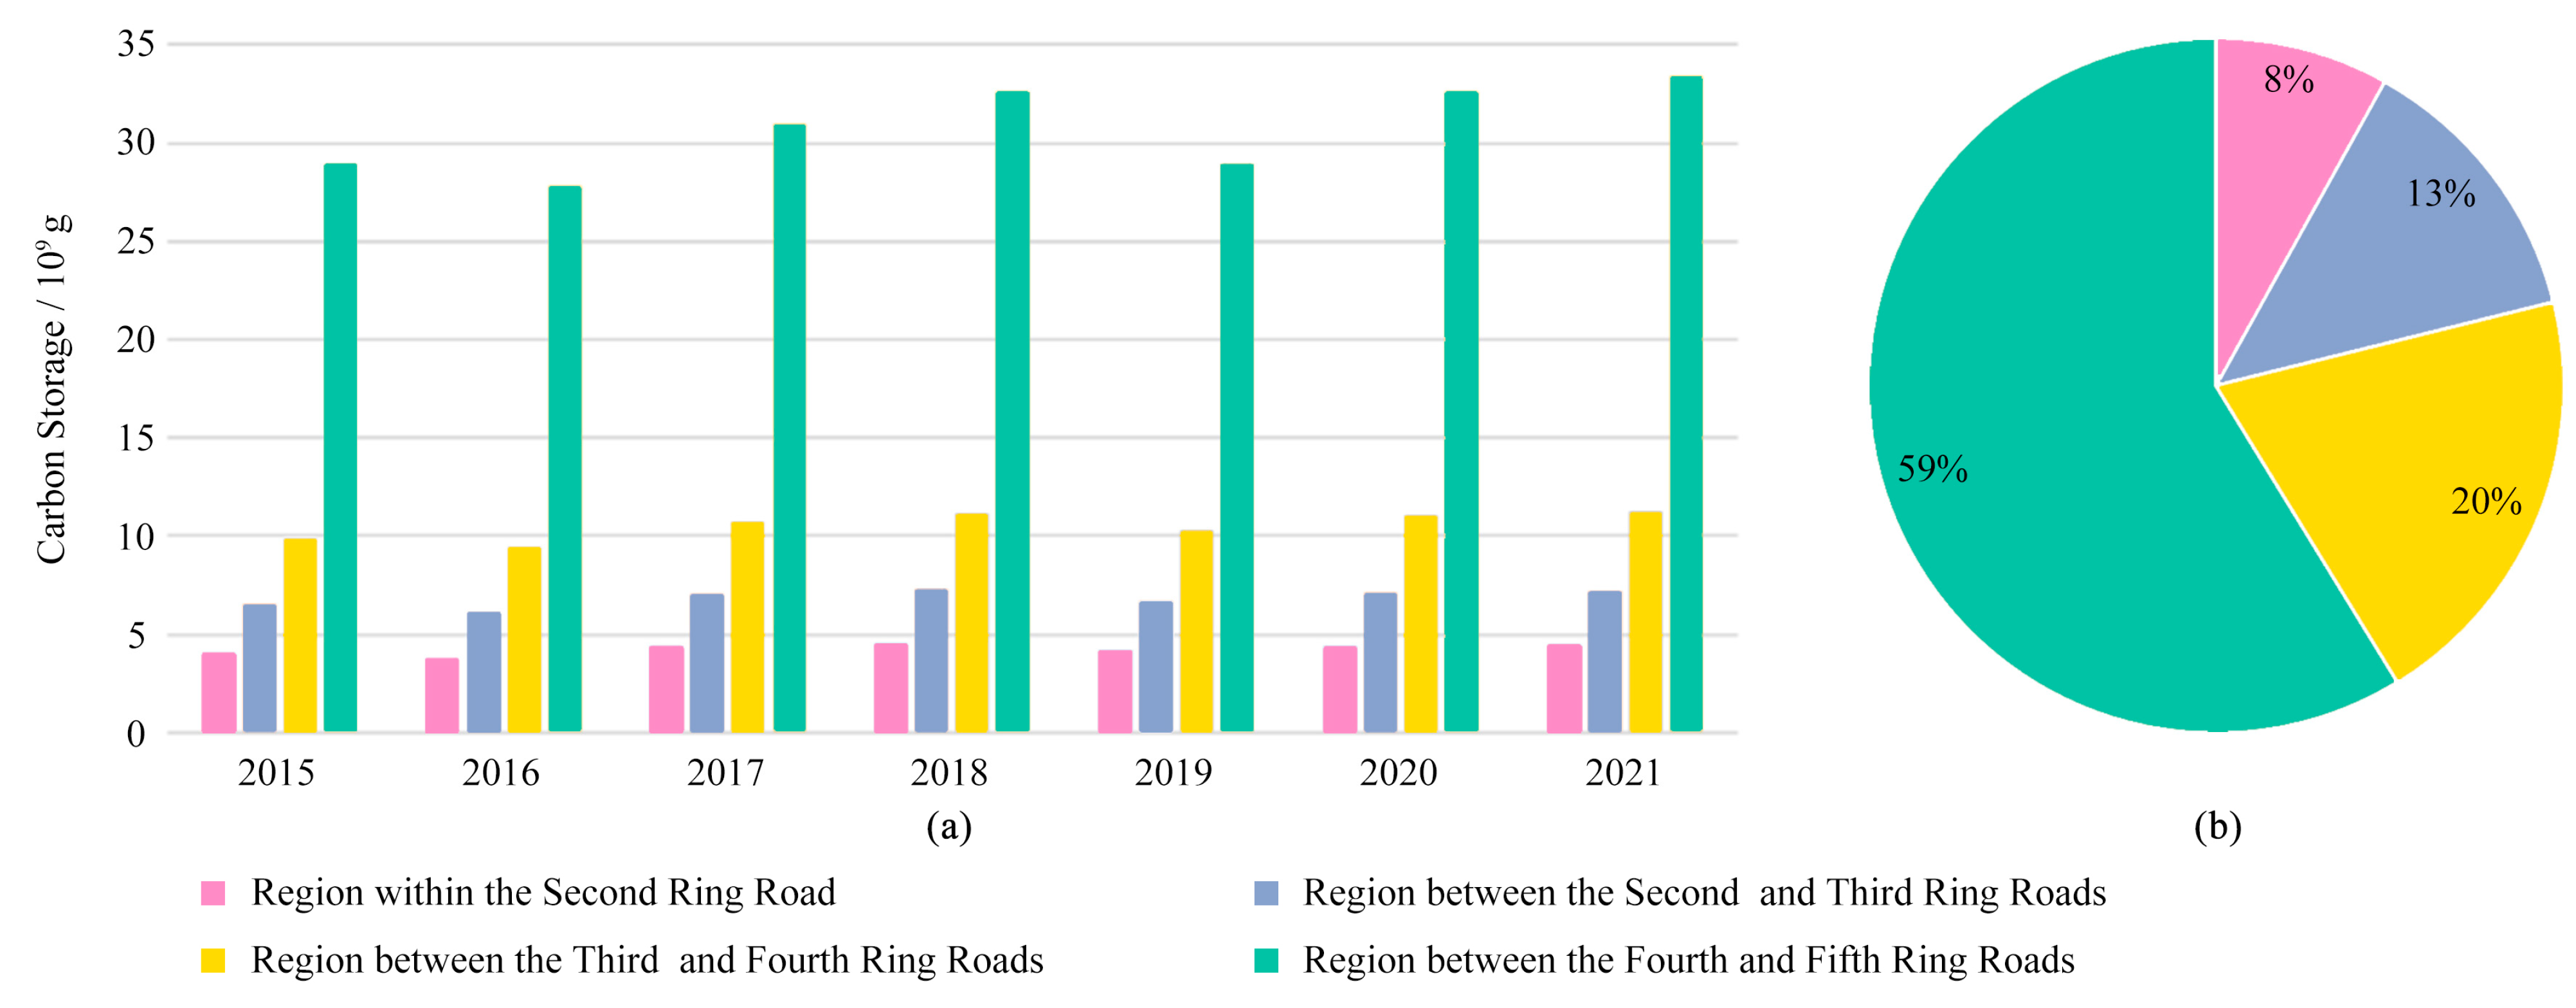
4.3. Estimation of Litterfall Carbon Density in Urban Green Spaces within the Fifth Ring Road
5. Discussion
5.1. Differences in Litterfall Carbon Storage among Tree Species with Different Traits
5.2. The LAI Can Be Used as a Proxy Indicator of Litterfall Carbon Density in Urban Green Space
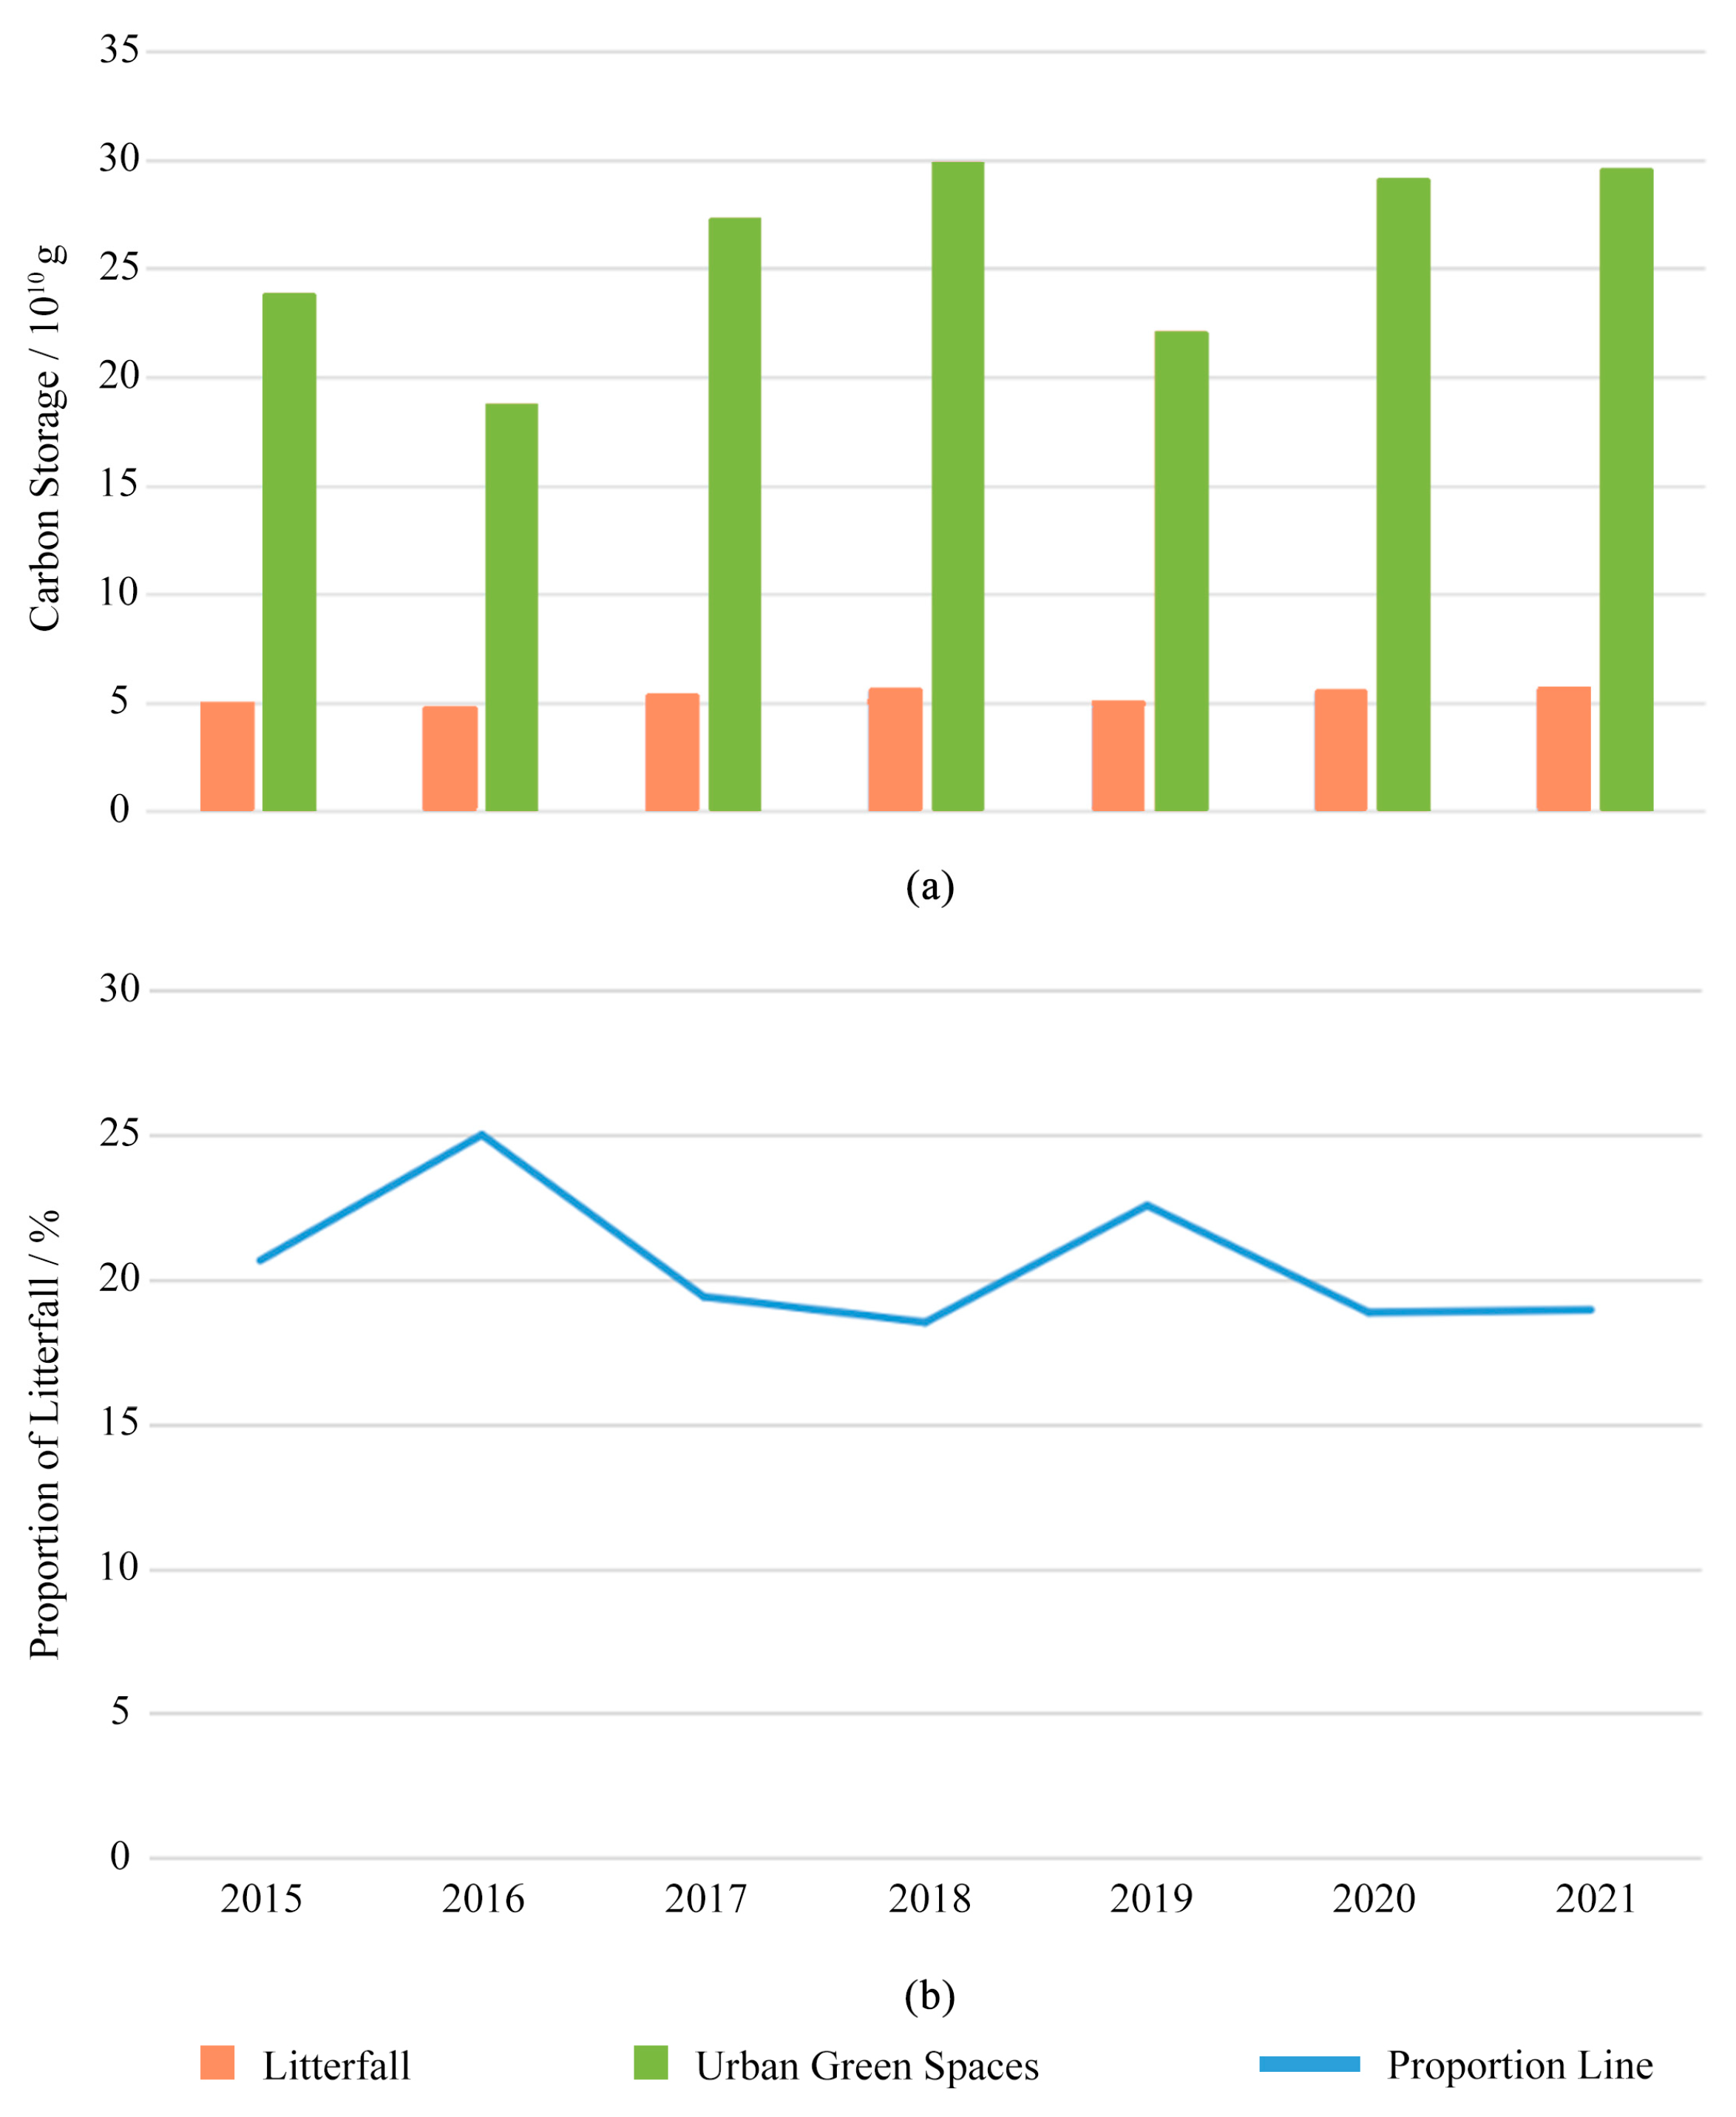
5.3. Underestimation of the Litterfall Carbon Pool in Urban Green Space
5.4. The Accuracy of Litterfall-Carbon-Density Inversion Using Remote Sensing Images Needs to Be Further Improved
6. Conclusions and Prospects
Author Contributions
Funding
Data Availability Statement
Acknowledgments
Conflicts of Interest
References
- Hobbie, S.E.; Grimm, N.B. Nature-based approaches to managing climate change impacts in cities. Philos. Trans. R. Soc. B 2020, 375, 20190124. [Google Scholar] [CrossRef]
- Chai, Q.M. Research on China’s pathways to achieve carbon peaking and carbon neutrality goals. Chin. J. Urban Environ. Stud. 2022, 10, 2250007. [Google Scholar] [CrossRef]
- Zhao, D.; Cai, J.; Xu, Y.M.; Liu, Y.H.; Yao, M.M. Carbon sinks in urban public green spaces under carbon neutrality: A bibliometric analysis and systematic literature review. Urban For. Urban Green. 2023, 86, 128037. [Google Scholar] [CrossRef]
- Zhang, Z.R.; Gao, X.X.; Zhang, S.B.; Gao, H.; Huang, J.; Sun, S.Y.; Song, X.F.; Fry, E.; Tian, H.Q.; Xia, X.H. Urban development enhances soil organic carbon storage through increasing urban vegetation. J. Environ. Manag. 2022, 312, 114922. [Google Scholar] [CrossRef] [PubMed]
- Thomas, S.C.; Malczewski, G.; Saprunoff, M. Assessing the potential of native tree species for carbon sequestration forestry in Northeast China. J. Environ. Manag. 2007, 85, 663–671. [Google Scholar] [CrossRef] [PubMed]
- Ma, X.T.; Yan, T.H.; Qin, Y.Y.; Wang, H.L.; Yan, Y.F. Optimization of green space plant configuration in residential areas of Chongqing central business district based on green plot ratio: A case study of Xuhui city residential community. J. Geosci. Environ. Protect. 2023, 11, 37–49. [Google Scholar] [CrossRef]
- Turner, D.P.; Koerper, G.J.; Harmon, M.E.; Lee, J.J. A carbon budget for forests of the conterminous United States. Ecol. Appl. 1995, 5, 421–436. [Google Scholar] [CrossRef]
- Horodecki, P.; Jagodziński, A.M. Site type effect on litter decomposition rates: A three-year comparison of decomposition process between spoil heap and forest sites. Forests 2019, 10, 353. [Google Scholar] [CrossRef]
- Hillier, J.; Whittaker, C.; Dailey, G.; Aylott, M.; Casella, E.; Richter, G.M.; Riche, A.; Murphy, R.; Taylor, G.; Smith, P. Greenhouse gas emissions from four bioenergy crops in England and Wales: Integrating spatial estimates of yield and soil carbon balance in life cycle analyses. Gcb Bioenergy 2009, 1, 267–281. [Google Scholar] [CrossRef]
- Vargas-Soplín, A.J.; Prochnow, A.; Herrmann, C.; Tscheuschner, B.; Kreidenweis, U. The potential for biogas production from autumn tree leaves to supply energy and reduce greenhouse gas emissions: A case study from the city of Berlin. Resour. Conserv. Recycl. 2022, 187, 106598. [Google Scholar] [CrossRef]
- Wei, Z.Q.; Cheng, Z.Q.; Shen, Y.F. Recent development in production of pellet fuels from biomass and polyethylene (PE) wastes. Fuel 2024, 358, 130222. [Google Scholar] [CrossRef]
- Zhang, J.M.; Chen, M.; Zhu, M.Y.; Yu, W.W.; Yao, J.C.; Xu, X.Y.; Ren, X.Q. Research on composting and substrate utilization of garden waste. Agr. Biotech. 2021, 10, 104–107,112. [Google Scholar]
- Shukla, S.; Waghe, K.; Singh, S. Production of organic fertilizer from garden waste. J. Emerg. Technol. Innov. Res. 2019, 6, 240–243. [Google Scholar]
- Beedie, D. A Method for the Production of Charcoaland the Generation of Power via the Pyrolysis of Biomass Material. Application Number GB19990016480, 20 November 2022. [Google Scholar]
- Xu, Z.C.; Ma, Y.; Zhang, L.X.; Han, Y.Y.; Yuan, J.; Li, G.X.; Luo, W.H. Relating bacterial dynamics and functions to gaseous emissions during composting of kitchen and garden wastes. Sci. Total Environ. 2021, 767, 144210. [Google Scholar] [CrossRef] [PubMed]
- Yu, Y.Y.; Jia, C.R.; Wu, C.L.; Chen, Q.Y.; Zhu, B.G. Research progress on compost utilization of garden waste. Mod. Hortic. 2022, 45, 47–48,58,154. [Google Scholar]
- Qu, B.; Sun, X.; Li, S.; Zhang, H.; Wang, X.; Xiong, K.; Yun, B. Manufacturing process and hydrological characteristics of ecological mulching mats made from green waste. J. Beijing For. Univ. 2018, 40, 77–85. [Google Scholar] [CrossRef]
- Li, Y.F.; Wang, Z.J.; Shi, W.L.; Yang, H.T. Litter quality modifies soil organic carbon mineralization in an ecological restoration area. Land Degrad. Dev. 2023, 34, 1806–1819. [Google Scholar] [CrossRef]
- Wei, Y.Q.; Zhang, Y.J.; Wilson, G.W.T.; Guo, Y.F.; Bi, Y.X.; Xiong, X.; Liu, N. Transformation of litter carbon to stable soil organic matter is facilitated by ungulate trampling. Geoderma 2021, 385, 114828. [Google Scholar] [CrossRef]
- Wu, F.Z.; Xu, Z.F.; Yang, W.Q. Carbon and nutrient transfer via above- and below-ground litter in forests. Forests 2022, 13, 2176. [Google Scholar] [CrossRef]
- Castellanos-Barliza, J.; León-Peláez, J.D.; Armenta-Martínez, R.; Barranco-Pérez, W.; Caicedo-Ruíz, W. Contributions of organic matter and nutrients via leaf litter in an urban tropical dry forest fragment. Rev. Biol. Trop. 2018, 66, 571–585. [Google Scholar] [CrossRef]
- Ridgeway, J.R.; Morrissey, E.M.; Brzostek, E.R. Plant litter traits control microbial decomposition and drive soil carbon stabilization. Soil Biol. Biochem. 2022, 175, 108857. [Google Scholar] [CrossRef]
- Li, Y.; Liu, X.J.; Xu, W.B.; Bongers, F.J.; Bao, W.K.; Chen, B.; Chen, G.K.; Guo, K.; Lai, J.S.; Lin, D.M.; et al. Effects of diversity, climate and litter on soil organic carbon storage in subtropical forests. For. Ecol. Manag. 2020, 476, 118479. [Google Scholar] [CrossRef]
- Guo, Y.; Chen, H.Y.H.; Mallik, A.U.; Wang, B.; Li, D.; Xiang, W.; Li, X. Predominance of abiotic drivers in the relationship between species diversity and litterfall production in a tropical karst seasonal rainforest. For. Ecol. Manag. 2019, 449, 117452. [Google Scholar] [CrossRef]
- Schlesinger, W.H. Biogeochemistry: An Analysis of Global Change; Academic Press: Oxford, UK, 1991. [Google Scholar]
- Templer, P.H.; Toll, J.W.; Hutyra, L.R.; Raciti, S.M. Nitrogen and carbon export from urban areas through removal and export of litterfall. Environ. Pollut. 2015, 197, 256–261. [Google Scholar] [CrossRef]
- Li, S.D.; Wang, C.; Sun, Z.K. Spatial layout of urban ecosystem positioning observation and research station in China. J. Chin. Urban For. 2023, 21, 52–59. [Google Scholar] [CrossRef]
- Yin, Z.; Zhang, Y.X.; Zhang, R.; Chen, G.J.; Cong, Y.P.; Ma, K.M. Structure of an urban green space indirectly affects the distribution of airborne particulate matter: A study based on structural equation modelling. Urban For. Urban Green. 2022, 72, 127581. [Google Scholar] [CrossRef]
- Behera, S.K.; Behera, M.D.; Tuli, R. An indirect method of estimating leaf area index in a tropical deciduous forest of India. Ecol. Indic. 2015, 58, 356–364. [Google Scholar] [CrossRef]
- Hughes, J.W.; Fahey, T.J.; Browne, B. A better seed and litter trap. Can. J. For. Res. 1987, 17, 1623–1624. [Google Scholar] [CrossRef]
- Qian, J.G.; Mopper, K. Automated high-performance, high-temperature combustion total organic carbon analyzer. Anal. Chem. 1996, 68, 3090–3097. [Google Scholar] [CrossRef]
- Becker, F.; Choudhury, B.J. Relative sensitivity of normalized difference vegetation Index (NDVI) and microwave polarization difference Index (MPDI) for vegetation and desertification monitoring. Remote Sens. Environ. 1988, 24, 297–311. [Google Scholar] [CrossRef]
- Chen, J.M. Remote sensing of leaf area index and clumping index. In Comprehensive Remote Sensing; Liang, S., Ed.; Elsevier: Oxford, UK, 2018; pp. 53–77. [Google Scholar]
- Jochem, V.; Gustau, C.V.; Jordi, M.M.; Pablo, R.J.; Frank, V.; Jan, G.P.W.C.; José, M. Optical remote sensing and the retrieval of terrestrial vegetation bio-geophysical properties—A review. ISPRS J. Photogramm. 2015, 108, 273–290. [Google Scholar] [CrossRef]
- Zheng, G.; Moskal, L.M. Retrieving leaf area index (LAI) using remote sensing: Theories, methods and sensors. Sensors 2009, 9, 2719–2745. [Google Scholar] [CrossRef] [PubMed]
- Houborg, R.; Anderson, M.; Daughtry, C. Utility of an image-based canopy reflectance modeling tool for remote estimation of LAI and leaf chlorophyll content at the field scale. Remote Sens. Environ. 2009, 113, 259–274. [Google Scholar] [CrossRef]
- Kobayashi, H.; Suzuki, R.; Kobayashi, S. Reflectance seasonality and its relation to the canopy leaf area index in an eastern Siberian larch forest: Multi-satellite data and radiative transfer analyses. Remote Sens. Environ. 2007, 106, 238–252. [Google Scholar] [CrossRef]
- Liu, N. Study on Sample Area Scale Effect of Urban Vegetation LAI Retrieval Based on TM and SPOT6 Images. Master’s Thesis, Huazhong Agricultural University, Wuhan, China, 2016. [Google Scholar]
- Soudani, K.; François, C.; Maire, G.L.; Dantec, V.L.; Dufrêne, E. Comparative analysis of IKONOS, SPOT, and ETM+ data for leaf area index estimation in temperate coniferous and deciduous forest stands. Remote Sens. Environ. 2006, 102, 161–175. [Google Scholar] [CrossRef]
- Wang, P.C.; Xing, L.J.; Xiao, W.F.; Huang, Z.L.; Pan, L.; Zeng, L.X. Organic carbon density and storage of forest ecosystems in Three Gorges Reservoir Area. Acta Ecol. Sin. 2009, 29, 97–107. [Google Scholar]
- Purevdorj, T.S.; Tateishi, R.; Ishiyama, T.; Honda, Y. Relationships between percent vegetation cover and vegetation indices. Int. J. Remote Sens. 1998, 19, 3519–3535. [Google Scholar] [CrossRef]
- Xi, Y.; Zhang, Z.Q.; Zhou, J.; Wang, L.Q.; Chen, L.X. Spatial and temporal variation of ground surface temperature under urbanization and its correlation with vegetation coverage: A case study of the 5th Ring Road of Beijing. Sci. Silvae Sin. 2021, 57, 1–13. [Google Scholar] [CrossRef]
- Yin, W.D.; Su, J.Y.; Xu, Z.Y.; Liu, Z.C. Urban green space carbon storage estimation based on remote sensing technology. Landsc. Archit. 2022, 29, 24–30. [Google Scholar]
- Tang, J.W.; Cao, M.; Zhang, J.H.; Li, M.H. Litterfall production, decomposition and nutrient use efficiency varies with tropical forest types in Xishuangbanna, SW China: A 10-year study. Plant Soil 2010, 335, 271–288. [Google Scholar] [CrossRef]
- Yuan, Z.Q.; Li, B.H.; Bai, X.J.; Lin, F.; Shi, S.; Ye, J.; Wang, C.G.; Hao, Z.Q. Composition and seasonal dynamics of litter falls in a broad-leaved Korean pine (Pinus koraiensis) mixed forest in Changbai Mountains, Northeast China. Chin. J. Appl. Ecol. 2010, 21, 2171–2178. [Google Scholar]
- Mathias, N.; Liisa, U.; James, J.; Sue, B.; Lars, V.; Radek, N.; Arne, V.; Lars, L.; Anne, T.; Panagiotis, M.; et al. Quantifying carbon and nutrient input from litterfall in European forests using field observations and modeling. Global Biogeochem. Cycles 2018, 32, 784–798. [Google Scholar] [CrossRef]
- Zhang, Z.J. Study on Carbon Potential and Its Cost-Benefit of Afforestation and Reforestation Activities in Guangxi, China. Ph.D. Thesis, Chinese Academy of Forestry, Beijing, China, 2009. [Google Scholar]
- Pan, Y.D.; Birdsey, R.A.; Fang, J.Y.; Houghton, R.; Kauppi, P.E.; Kurz, W.A.; Phillips, O.L.; Shvidenko, A.; Lewis, S.L.; Canadell, J.G.; et al. A large and persistent carbon sink in the world’s forests. Science 2011, 333, 988–993. [Google Scholar] [CrossRef]
- Mandal, S.; Chatterjee, P.; Das, N.; Banerjee, R.; Batabyal, S.; Gangopadhyay, S.; Mondal, A. Modelling the role of urban forest in the regulation of carbon balance in an industrial area of India. Acta Ecol. Sin. 2022, 42, 553–564. [Google Scholar] [CrossRef]
- Wang, D.S. Studies on Net Carbon Reserves in Beijing Urban Landscape Green Based on Biomass Measurement. Ph.D. Thesis, Beijing Forestry University, Beijing, China, 2010. [Google Scholar]


| Index | Abbr. | Definition | Formula |
|---|---|---|---|
| Leaf area index | LAI | Total surface area of leaves per unit area | / |
| Crown volume | CV | Volume occupied within the canopy contour | |
| Crown surface area | CA | Area of crown profile surface | |
| Crown extension | CE | Extent of outward crown expansion | |
| Crown projection ratio | CP | Coordination degree of crown width and ground diameter |
| Broad-Leaved | Coniferous/Broad-Leaved Mixed | Coniferous | All | ||
|---|---|---|---|---|---|
| Logarithmic linear regressions | R | 0.840 | 0.738 | 0.789 | 0.399 |
| R2 | 0.706 | 0.545 | 0.623 | 0.159 | |
| Adjusted R2 | 0.694 | 0.499 | 0.548 | 0.140 | |
| Estimated standard error | 0.251 | 0.187 | 0.226 | 0.440 | |
| ANOVA a | Sum of squares | 5.163 | 0.765 | 0.679 | 9.913 |
| Degrees of freedom | 25 | 11 | 6 | 44 | |
| F | 57.725 | 11.976 | 8.270 | 8.153 | |
| Regression coefficient b | Constant | 43.34 | 86.83 | 115.70 | 98.00 |
| Unstandardized coefficient | 0.338 | 0.332 | 0.342 | 0.182 | |
| Standardized coefficient | 0.840 | 0.738 | 0.789 | 0.399 | |
| T | 7.549 | 3.461 | 2.876 | 2.855 | |
| P | 0.000 ** | 0.006 ** | 0.035 * | 0.007 ** | |
| Model |
Disclaimer/Publisher’s Note: The statements, opinions and data contained in all publications are solely those of the individual author(s) and contributor(s) and not of MDPI and/or the editor(s). MDPI and/or the editor(s) disclaim responsibility for any injury to people or property resulting from any ideas, methods, instructions or products referred to in the content. |
© 2024 by the authors. Licensee MDPI, Basel, Switzerland. This article is an open access article distributed under the terms and conditions of the Creative Commons Attribution (CC BY) license (https://creativecommons.org/licenses/by/4.0/).
Share and Cite
Cao, Y.; Li, X.; Li, Y.; Guo, J.; Qi, Y. Quantification and Proxy Indicators of the Carbon Pool in Urban Tree Litterfall: A Case Study of Urban Green Spaces in Beijing. Forests 2024, 15, 144. https://doi.org/10.3390/f15010144
Cao Y, Li X, Li Y, Guo J, Qi Y. Quantification and Proxy Indicators of the Carbon Pool in Urban Tree Litterfall: A Case Study of Urban Green Spaces in Beijing. Forests. 2024; 15(1):144. https://doi.org/10.3390/f15010144
Chicago/Turabian StyleCao, Yujuan, Xinyu Li, Yanming Li, Jia Guo, and Yali Qi. 2024. "Quantification and Proxy Indicators of the Carbon Pool in Urban Tree Litterfall: A Case Study of Urban Green Spaces in Beijing" Forests 15, no. 1: 144. https://doi.org/10.3390/f15010144
APA StyleCao, Y., Li, X., Li, Y., Guo, J., & Qi, Y. (2024). Quantification and Proxy Indicators of the Carbon Pool in Urban Tree Litterfall: A Case Study of Urban Green Spaces in Beijing. Forests, 15(1), 144. https://doi.org/10.3390/f15010144