Article

Comparison of Xylem Anatomy and Hydraulic Properties in Black Locust Trees at Two Growth Stages in Semiarid China

1
State Key Laboratory of Eco-Hydraulics in Northwest Arid Region, Xi’an University of Technology, Xi’an 710048, China
2
College of Natural Resources and Environment, Northwest A&F University, Xianyang 712100, China
*
Author to whom correspondence should be addressed.
Forests 2024, 15(1), 116; https://doi.org/10.3390/f15010116
Submission received: 12 December 2023 / Revised: 31 December 2023 / Accepted: 5 January 2024 / Published: 7 January 2024

Abstract

:
Tree species transitioning between different developmental phases requires homeostatic adjustments in order to maintain the integrity of the tree hydraulic system. Hence, adjustments related to hydraulic traits (e.g., xylem conduit diameter) are of key functional significance. However, critical information on the differences between different developmental stages is rare. Using sapwood samples from 36 black locust trees with different growth stages (actively growing and declining stages) and a soil water gradient along a hillslope, xylem conduits at stem apexes and breast height (1.3 m above ground) stems were measured. The results showed marked differences in vascular traits between actively growing and declining trees. In contrast to actively growing trees, declining trees exhibited a reduction in conduit diameters accompanied by increased frequency with a positively skewed distribution and a subsequent decline in cumulative theoretical hydraulic conductivity. Across all sampled trees, the hydraulically weighted mean conduit diameter tapered acropetally from breast height to the stem apex. The extent of conduit tapering in actively growing trees (0.244, 95% CI 0.201–0.287) aligned with predictions from the hydraulic optimality model. Conversely, trees in a declining status displayed significantly reduced conduit tapering (0.175, 95% CI 0.146–0.198), indicating an elevation in hydraulic resistance with increasing tree height. Variations in hydraulic properties predominantly resulted from differences in tree height rather than variations in stem diameter or soil water content. The correlation between conduit diameter and soil water content in both actively growing and declining trees stemmed indirectly from variations in tree height rather than presenting a direct response to drought stress.

1. Introduction

In the last decade, an increasing tree decline with crown dieback has been observed in a variety of woodland and forest communities across the globe [1,2,3,4]. Forest dieback, marked by rapid defoliation and progressive stem mortality of canopy trees [4], plays a pivotal role in shaping forest ecosystem services [2,5,6]. Multiple factors contribute to tree dieback, encompassing biotic influences [7], carbon starvation [8,9], and hydraulic failure [4,10]. Among these, hydraulic failure within sapwood xylem stands as the widely acknowledged primary cause of tree dieback [6,11]. This is due to its hindrance to water transportation to the canopy, ultimately leading to tissue desiccation and subsequent mortality [11]. Given the critical role of the xylem hydraulic system in tree survival, comprehending the structural attributes of trees at distinct growth stages—both declining and actively growing—is imperative.
In trees, water moves from rootlets to leaves through an intricate network of conduits within xylem tissues [12]. The hydraulic traits of these conduits depend significantly on their quantity, diameter, and length [13,14]. According to the classic Hagen–Poiseuille formula ( Δ p = 8 μ L Q A 2 , ∆p is the pressure difference between the two ends, L is the length of the xylem, μ is the dynamic viscosity, Q is the volumetric flow rate, and A is the cross-sectional area of the xylem) describing laminar flow, the water-carrying capacity of a single conduit is directly related to the fourth power of its diameter and inversely proportional to its length [15,16]. Consequently, as trees grow taller, assuming uniform conduit sizes, the overall hydraulic conductance of the plant decreases [17]. This decline in hydraulic conductance can trigger water stress conditions, leading to reduced leaf water potential and osmotic turgor, subsequently affecting leaf metabolism and growth rates [18,19,20]. Such limitations escalate the risk of hydraulic failure due to cavitation, potentially resulting in decreased productivity and even plant mortality [18,21].
To counteract the impact of path length, trees adapt their architecture in various ways, such as increasing fine root production [22] or adjusting the leaf area-to-sapwood area ratio [23]. These adaptations enable only partial hydraulic compensation [24]. Theoretically, if stem conduit diameter widens towards the base (known as basipetal widening of xylem vessel diameter from terminal branches to the stem base), trees can mitigate the negative effects of height growth on hydraulic conductance, ensuring adequate resource supply—like water—to distant leaves, regardless of tree height [16,25,26]. Building on this theoretical premise, several hydraulic optimality (HO) models, like the West, Brown, and Enquist (WBE) model, have emerged. Numerous studies have validated this premise, specifically conduit tapering, across diverse tree species [16,24,27,28,29,30,31]. HO models posit universal conduit tapering in plants under the assumption that natural selection maximizes resource exchange within the vascular network while minimizing transport costs [24,32]. Typically, acropetal tapering of xylem conduits follows a power function d = a L b (where d represents conduit diameter, a denotes an allometric constant, and L signifies the distance from the stem apex), with a scaling exponent b around 0.20 [21,24,30,31,33,34]. This level of tapering ensures hydraulic resistance remains independent of tree height [26,27]. Anfodillo et al. (2006) [24], in a meta-analysis of 50 angiosperm and gymnosperm trees, found actively growing trees exhibit a similar tapering degree close to 0.20. However, mature or near-maximum-height trees slightly deviate from this universal trend (with an exponent b lower than 0.20). Information on conduit tapering and related characteristics for declining trees remains limited.
Recognizing the pivotal role of xylem conduits in water transport and elucidating the primary drivers behind variations in conduit diameter among tree species and communities is crucial. Such insights could significantly contribute to our understanding of plant hydraulic evolution [30]. Recent studies have suggested that plant size—stem height or diameter—holds greater influence over xylem conduit diameter across various plant species than climatic factors like water availability [30,31]. However, these findings contradict observations from other studies, which emphasize climate, particularly water availability, as the primary determinant for xylem conduit variations across diverse plant genera [35]. Given this discrepancy, further investigations are warranted to scrutinize this relationship within specific plant species under varying environmental conditions, such as soil water availability.
Located in the middle reaches of the Yellow River basin, the Loess Plateau represents a typical water-scarce region, with 85% of its precipitation (200–800 mm yr−1) lost to evaporation [36]. This area grapples with severe soil erosion, rendering it ecologically vulnerable [37,38,39]. To mitigate these challenges, the Chinese Government has implemented various national policies, such as the “Grain for Green Project”, over the past five decades, resulting in a 4.9% increase in forest cover from 2000 to 2008 [39,40]. Notably, within the afforested trees, the extensively planted black locust (Robinia pseudoacacia L.), known for its nitrogen-fixing ability, rapid growth, and ring-porous characteristics, dominates, constituting 90% of the afforestation in this region [41,42]. However, the region faces widespread early degradation of planted black locusts, typically beginning around 30 years of age, displaying initial symptoms of a dry crown top, shortened top shoot, and sparse crown, often termed as “dwarf aged tree” [43,44,45,46]. This scenario offers an ideal opportunity to investigate hydraulic architectural disparities, particularly xylem conduits, among trees at different growth stages—actively growing versus declining. Leveraging this background, our study monitored xylem anatomical properties across a soil-water gradient in black locust trees. Our primary objectives were twofold: (1) to assess whether the hydraulic architecture (e.g., conduit frequency distribution, conductance, taper) in declining trees resembles that of actively growing trees, and (2) to ascertain the predominant factor (e.g., tree size or soil water availability) driving variations in xylem conduit diameter.

2. Materials and Methods

2.1. Site Description

This study was conducted in Yeheshan catchment (34°31.76′ N, 107°54.67′ E), and the study site is situated on the south-facing hillslope at an altitude of 890–1150 m a.s.l (Figure 1). The mean slope angle is 9°, and the slope length is 1500 m. The silt loam soil in the region is homogeneous and over 50 m deep, with a mean particle size distribution of 6% sand, 73% silt, and 21% clay. The region experiences a semiarid continental climate characterized by a hot, humid summer and a cold, dry winter. Based on climate data (1958–2016) from the Fufeng Bureau of Meteorology, the nearest meteorology station to YHS (≤10 km), the average annual precipitation is 580 mm and the average annual temperature is 12.7 ℃. Rainfall mainly occurs from May through October and has a large inter-annual variation.
Due to soil and water conservation projects and the establishment of nature reserves, cultivated lands on the study slope have been gradually abandoned for planted black locust forest since the 1980s. This has resulted in spatial mosaic stands of differing ages, growth statuses (actively growing and declining statuses), and structures (e.g., canopy dieback). In this study, six black locust stands with an area exceeding 300 m2 and different growth statuses, structures (e.g., tree density), and slope positions (upper, middle, or bottom slope positions) were used. Two stands with different growth statuses were selected in the upper-slope position of the altitude range of 1120–1150 m. Another two stands were selected in the middle-slope position with different growth statuses and altitudes (1030–1050 m). The rest of the stands were selected for the bottom slope position, differing both in growth status and slope position (890–930 m).
At each of the six stands, two sample plots with an area of 10 m × 10 m were established. Tree height in each plot (n = 6–10) was measured using the Haglöf ultrasonic measuring system (Haglöf Sweden AB, Långsele, Sweden). Leaf area index (AL) was measured in July 2016 using the Nikon D100 fish-eye lens. For the best representation of the canopy gap fraction, 12 photos were taken within each stand (6 taken between tree rows and another 6 within tree rows), and the camera was oriented carefully such that the edge of the image was perpendicular to the tree row in each stand [47]. Detailed information on the six experimental stands is given in Table 1.

2.2. Sample Collection and Anatomical Measurements

At each stand site, the diameter distribution of the trees was determined, and six trees representative of stem diameter at breast height (DBH) were randomly selected. According to Arbellay et al. (2012) [48], anatomical changes in wood structure can be induced by mechanical damage. To avoid the effects of such damage on the sample, trees with visible wounding or deformation were not selected. Reaction wood was also avoided. Wood samples were collected at the DBH region of stem in the mornings of 2016. Two cores (5 mm in diameter, length was determined by DBH), with 30 mm apart from each other, were taken at two positions around the tree—upslope (north-facing) and downslope (south-facing) positions using the Suunto wood corer (SUUNTO, Vantaa, Finland). Apical samples were sampled from the tops of 2-year-old shoots (the endpoints of 1-year-old shoots) to mitigate any developmental delays between cambial reactivation and the secondary xylem development observed in 1-year-old shoots [24]. After extraction, samples were immediately wrapped in aluminum foil, placed in plastic bags, and stored in a sealed container (at 4 °C) to maintain freshness. The sapwood/heartwood boundary was determined by staining the samples with a 1% methyl orange solution, which stained sapwood yellow and heartwood red due to differences in pH. One sapwood core from each position (or all apical twig samples) was used for anatomical analysis, and the second core was used to determine tree age. The ages of the individual trees (n = 6) in each stand were determined by counting the number of annual growth rings in the wood cores. The stand ages were also obtained by inquiring with forestry personnel and conducting archival record searches within the forest area. All trees of actively growing status were 15 years old, and those of declining status were 35 years old.
A transverse section of each core was cut (20 μm thick) and samples collected (n = 12 for stem sapwood and n = 8 for apical twigs) using a sliding microtome (Leica RM2235; Leica Microsystems Nussloch GmbH, Nussloch, Germany). The sections were then stained with a 1% safranin solution to increase contrast between the wood and the void space of the conduits. After staining, sections were mounted in glycerol and prepared for microscopic analysis. Depending on conduit size and abundance, 4–6 images of each sample section were taken at random at ×40 magnification using the CCD digital camera (Guangzhou Mingmei Technology Co., Ltd., Guangzhou, China) mounted on an Olympus CX 31 microscope (Olympus Corp., Tokyo, Japan). For specific preparation procedures, please refer to the following website: https://www.wsl.ch/land/products/dendro/preparation.html (accessed on 4 January 2024). The total number of images was 541. Then data for conduit abundance, total conduit area, and image area were estimated from each image using the ImageJ software (version 1.47 V, US National Institutes of Health). After carefully checking the completeness of the conduits (incomplete conduits were not analyzed), a total of 22,532 conduits were processed for further analysis.

2.3. Hydraulic Properties

The hydraulic properties of sapwood xylem were estimated from the conduit area and abundance. Then the hydraulically weighted mean conduit diameter (Dh) was calculated as [10]:
D h = D 4 N 1 4
where D is the equivalent circle diameter of the conduit and N is the number of measured conduits. Using these values, the hydraulically weighted mean diameters of stem conduit (Dh0) and apical conduit (DhN-1) were calculated. Dh, which reflects actual conduit conductance, is biased towards wider conduits that transport most of the water and is governed by Hagen–Poiseuille’s law [35,49].
In this study, the theoretical hydraulic conductivity KTH (Kg m MPa−1 s−1) was calculated from Dh as:
K T H = D h 4 π 128 η × 1000
where η is the viscosity of water at 20 °C (1.002 × 10⁻⁹ MPa s). Note that to convert m3 of water to kg, it is multiplied by 1000.

2.4. Conduit Tapering Ratio (T)

The conduit tapering ratio (T) was calculated from the hydraulically weighted mean conduit diameter derived from stem sapwood at DBH (Dh0) and from apical branches (DhN-1):
T = D h 0 D h N-1

2.5. Soil Water Measurement

At each stand site, neutron probe access tubes (5 inches in length) were installed around the sampled trees. Volumetric soil water content was measured using a neutron probe at the tube locations during the period from 16 March to 15 October 2016. The sampling was conducted on a total of 12 occasions during the sampling period. Slow neutron counts were taken at an interval of 0.2 m up to a depth of 5.0 m. Then volumetric soil water content (θv) at each depth was calculated from the slow neutron count rate (CR) using the calibration curve [50]:
θ V = 0.5891 × CR + 0.0089   ( R 2 = 0.93 ,   p < 0.001 )
The calibration curve developed for the study area was considered valid for all soil depths. The soil water content along the 5 m soil profile was then averaged for the mean volumetric soil water content.

2.6. Data Analyses

Statistical analyses were performed in SPSS ver. 19.0 software (SPSS Inc., Chicago, IL, USA). To determine the spatial distribution of soil water along the hillslope, a regression equation was built for soil θv and altitude, and the mean values were calculated from the 12 measurements around the sample trees. Data for all variables, except for conduit diameter and theoretical hydraulic conductivity (KTH), were first log10 transformed prior to determining the best-fit function. The relative frequency distribution of conduit diameter and cumulative KTH were then used to explore the data further. The scale relationships between tree height vs. stem diameter plus growth status (T vs. stem diameter or stem length plus growth status/site) were analyzed as explained by Olson et al. (2014) [30]. To test the differences in tapering ratio between actively growing and declining trees, we fitted the model prediction of tapering ratio based on stem length, growth status, and stem-growth status interaction. Also, the regression coefficients, their significance, and 95% confidence prediction intervals were computed.

3. Results

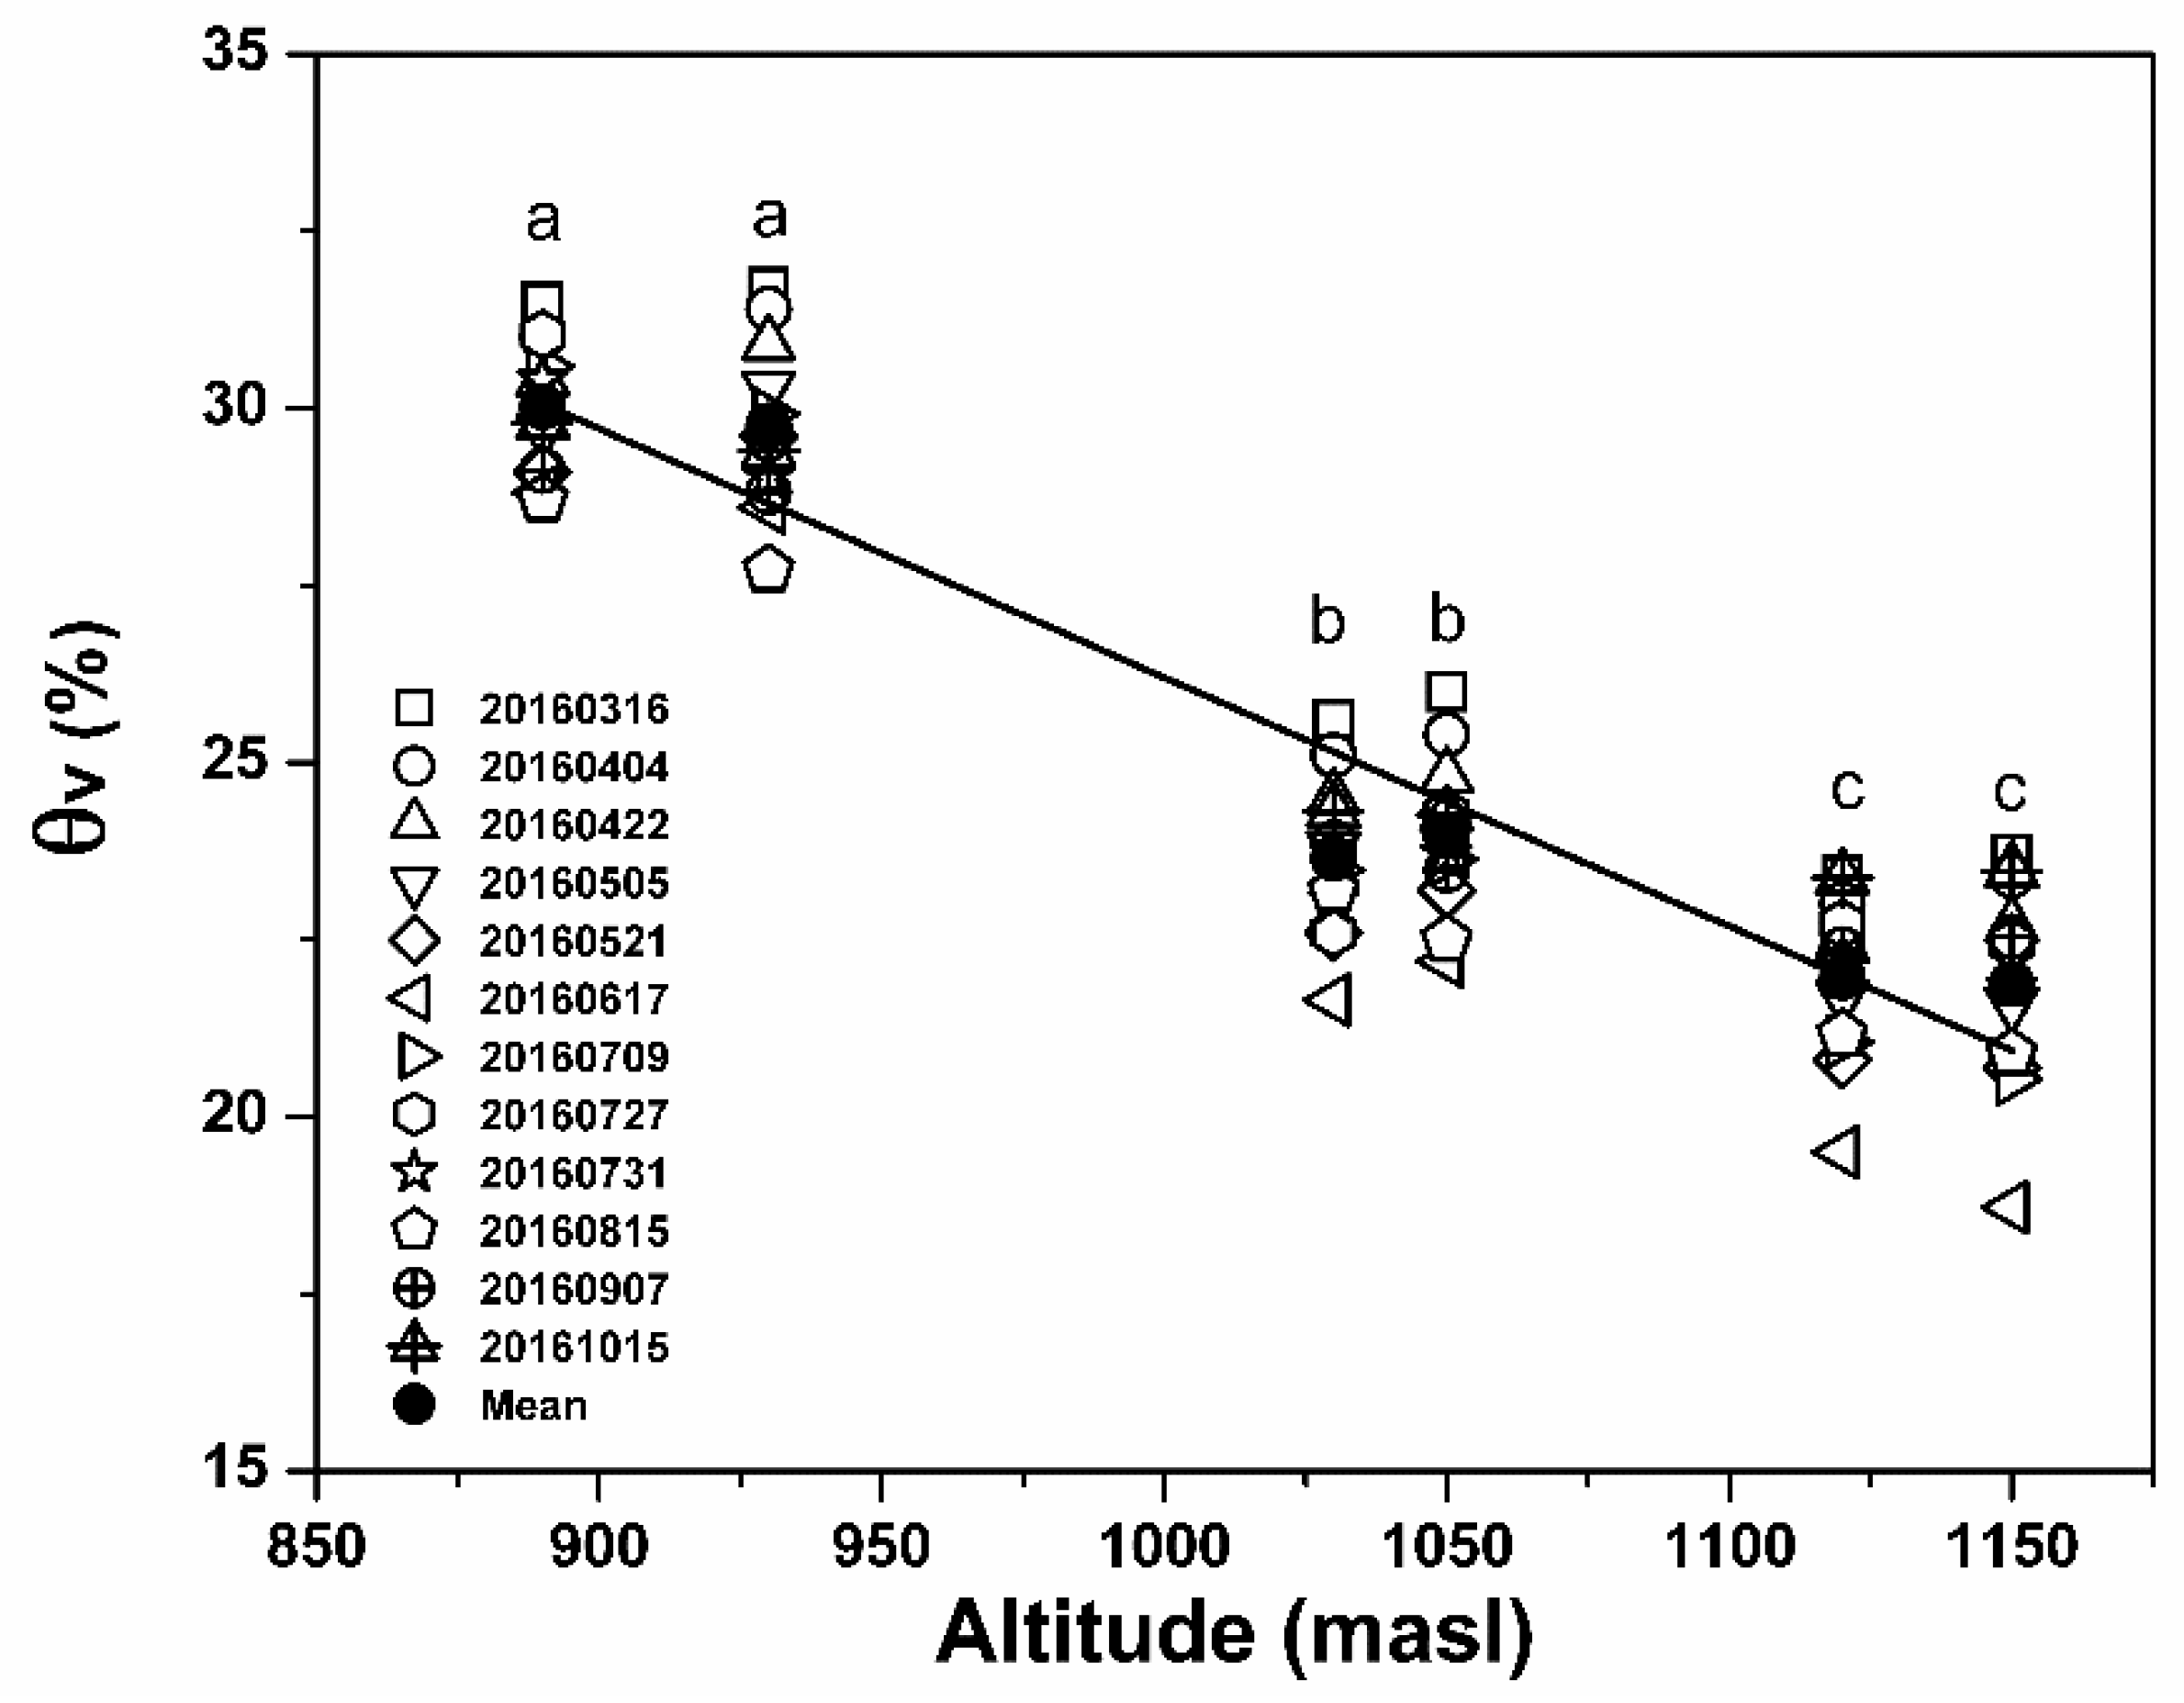
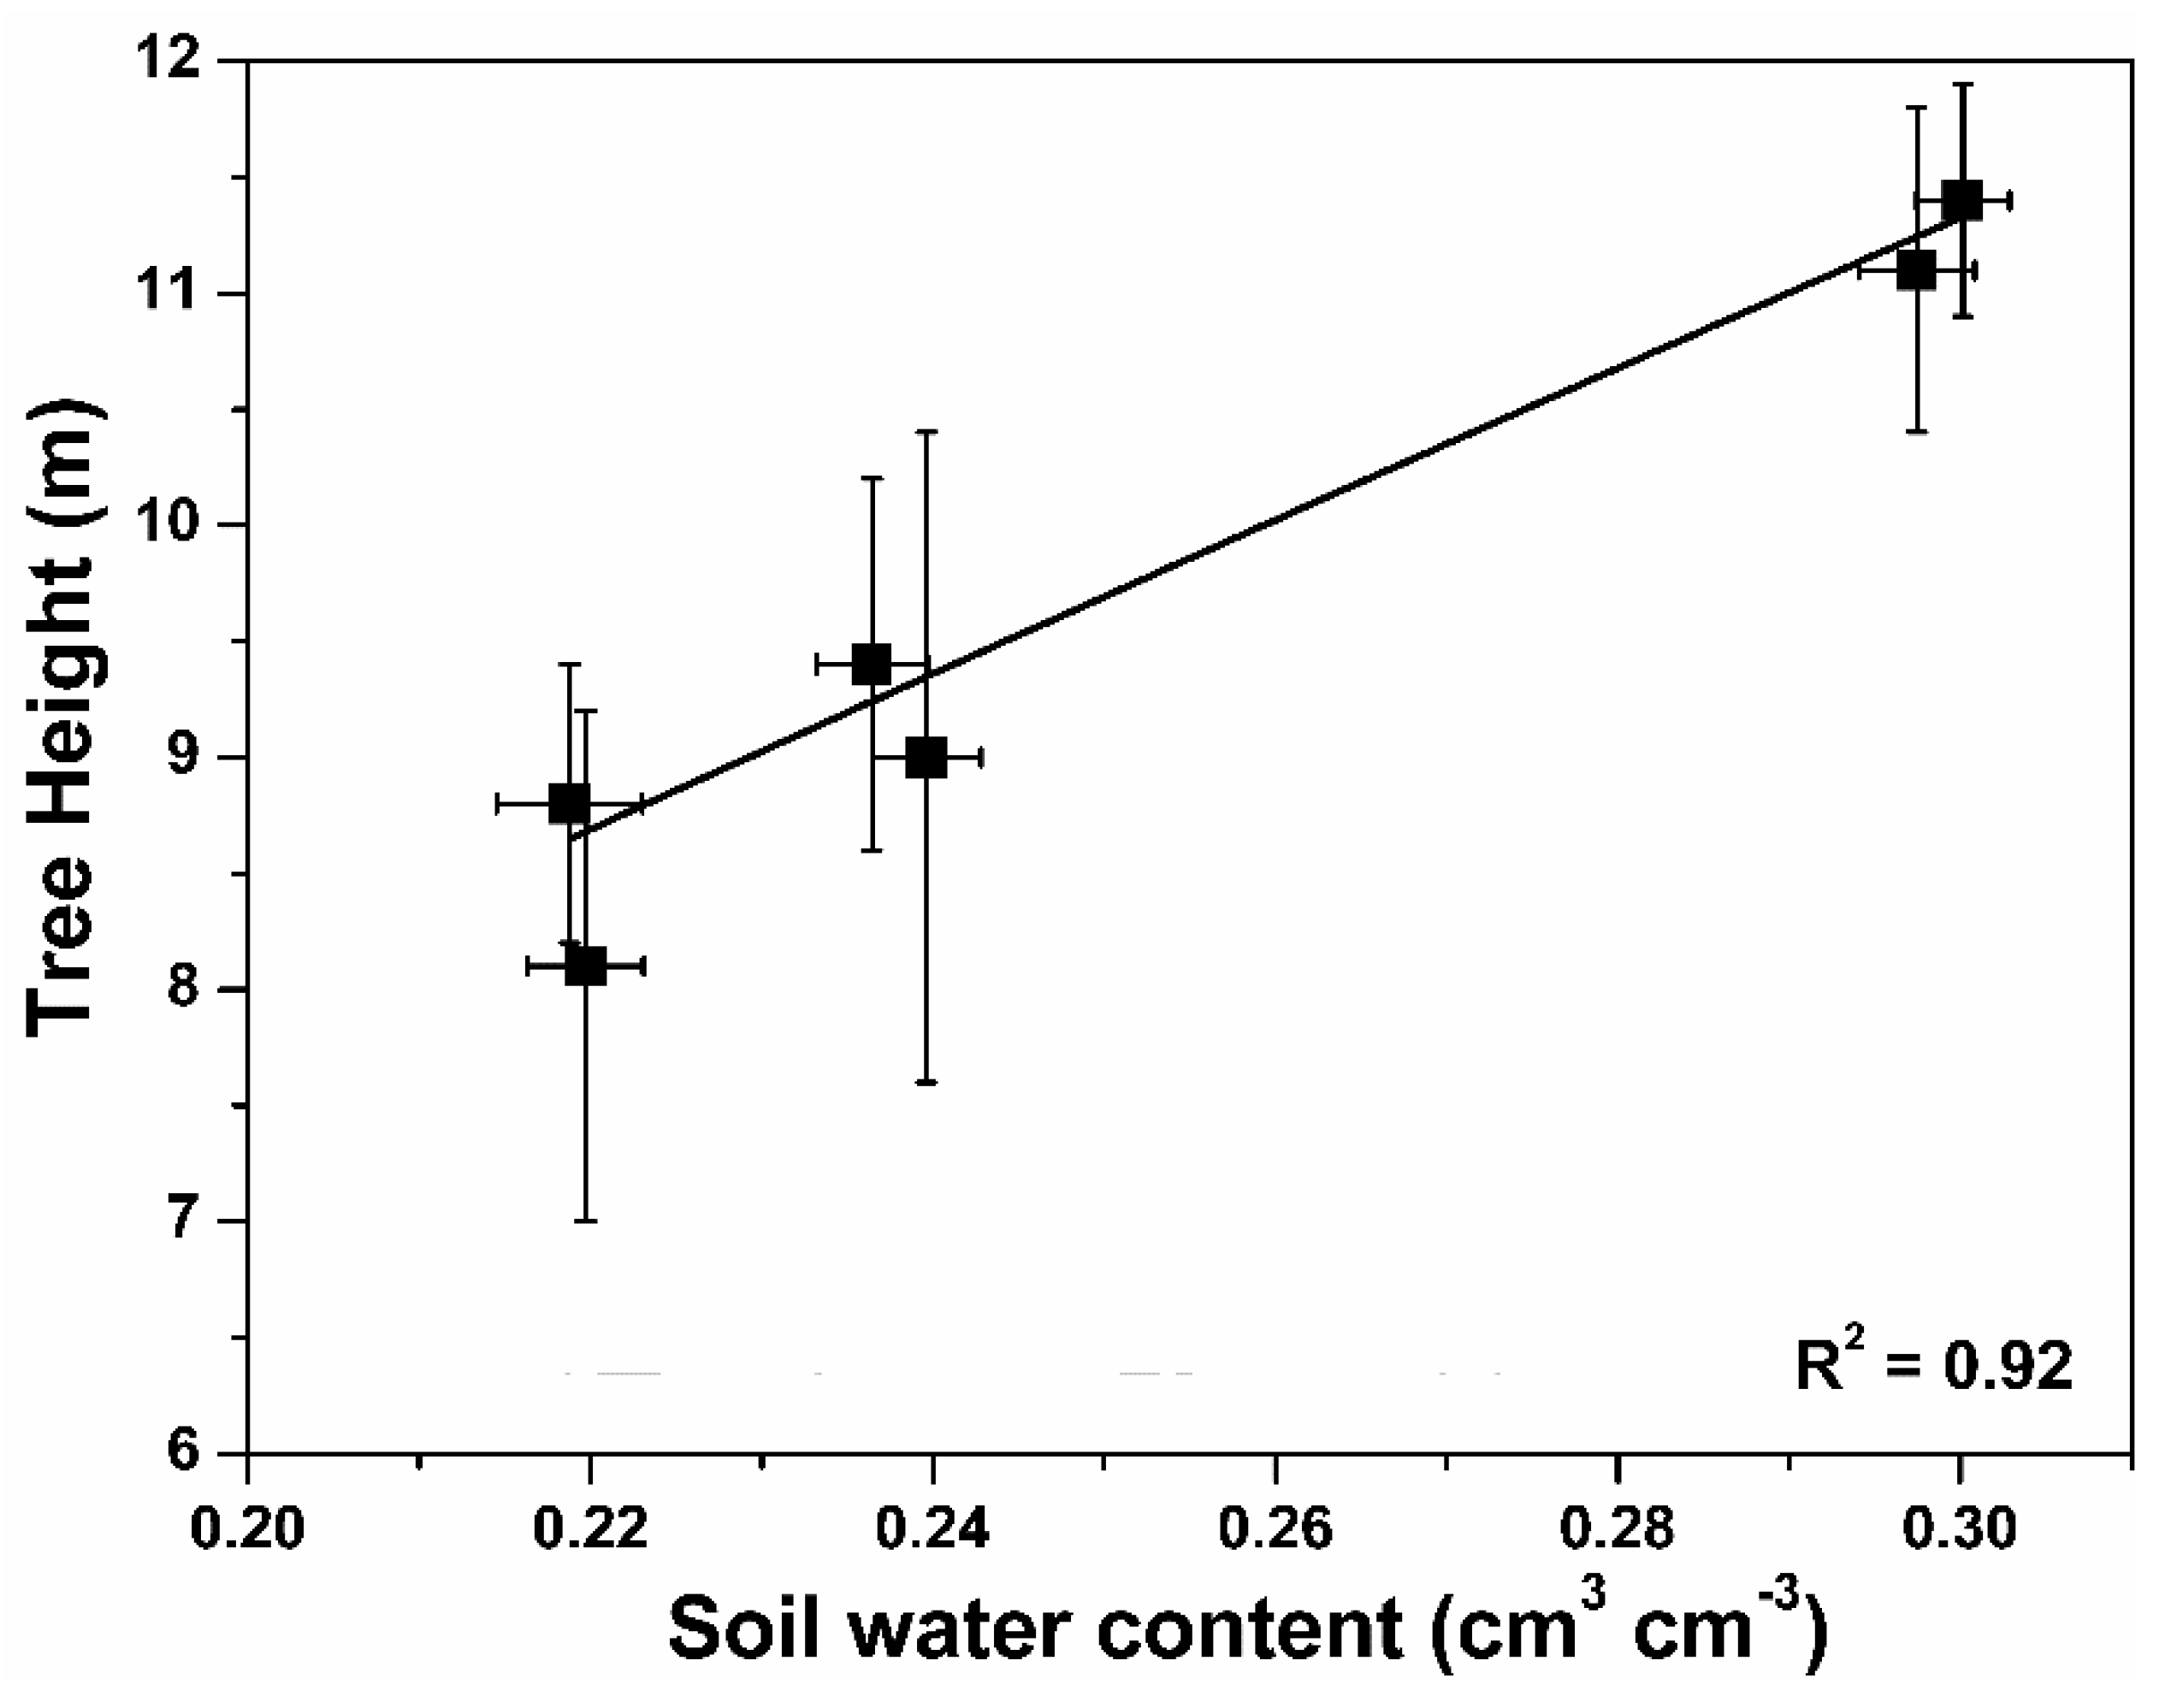
3.1. Soil Moisture Characteristics

The distribution of mean soil moisture content (θv) across the 0–500 cm soil profile along the investigated slope varied widely during the experimental period, ranging from 0.187 cm3 cm−3 in June to 0.317 cm3 cm−3 in March 2016 (Figure 2). Across the slope, θv decreased significantly (p = 0.002) from the bottom slope position to the upper slope position. Within the same slope position, there was no substantial difference (p > 0.05) in θv between the two black locust stands of differing growth status. Within the same growth status (actively growing or declining status), however, θv was significantly different across the different slope positions (p < 0.05, Figure 2).
In a simulated drought experiment, Wang et al. (2007) [51] tested the physiological response of black locust to steady soil water stress and noted that soil water levels less than 70% of field capacity severely retarded photosynthetic rate. Based on the soil water retention curve fitted by the van Genuchten equation, soil water content at 70% field capacity was 0.216 cm3 cm−3, similar to measured soil water values in the upper slope position (0.187–0.237 cm3 cm−3). This indicated that tree growth at the upper slope position could be subjected to frequent soil and water stress.

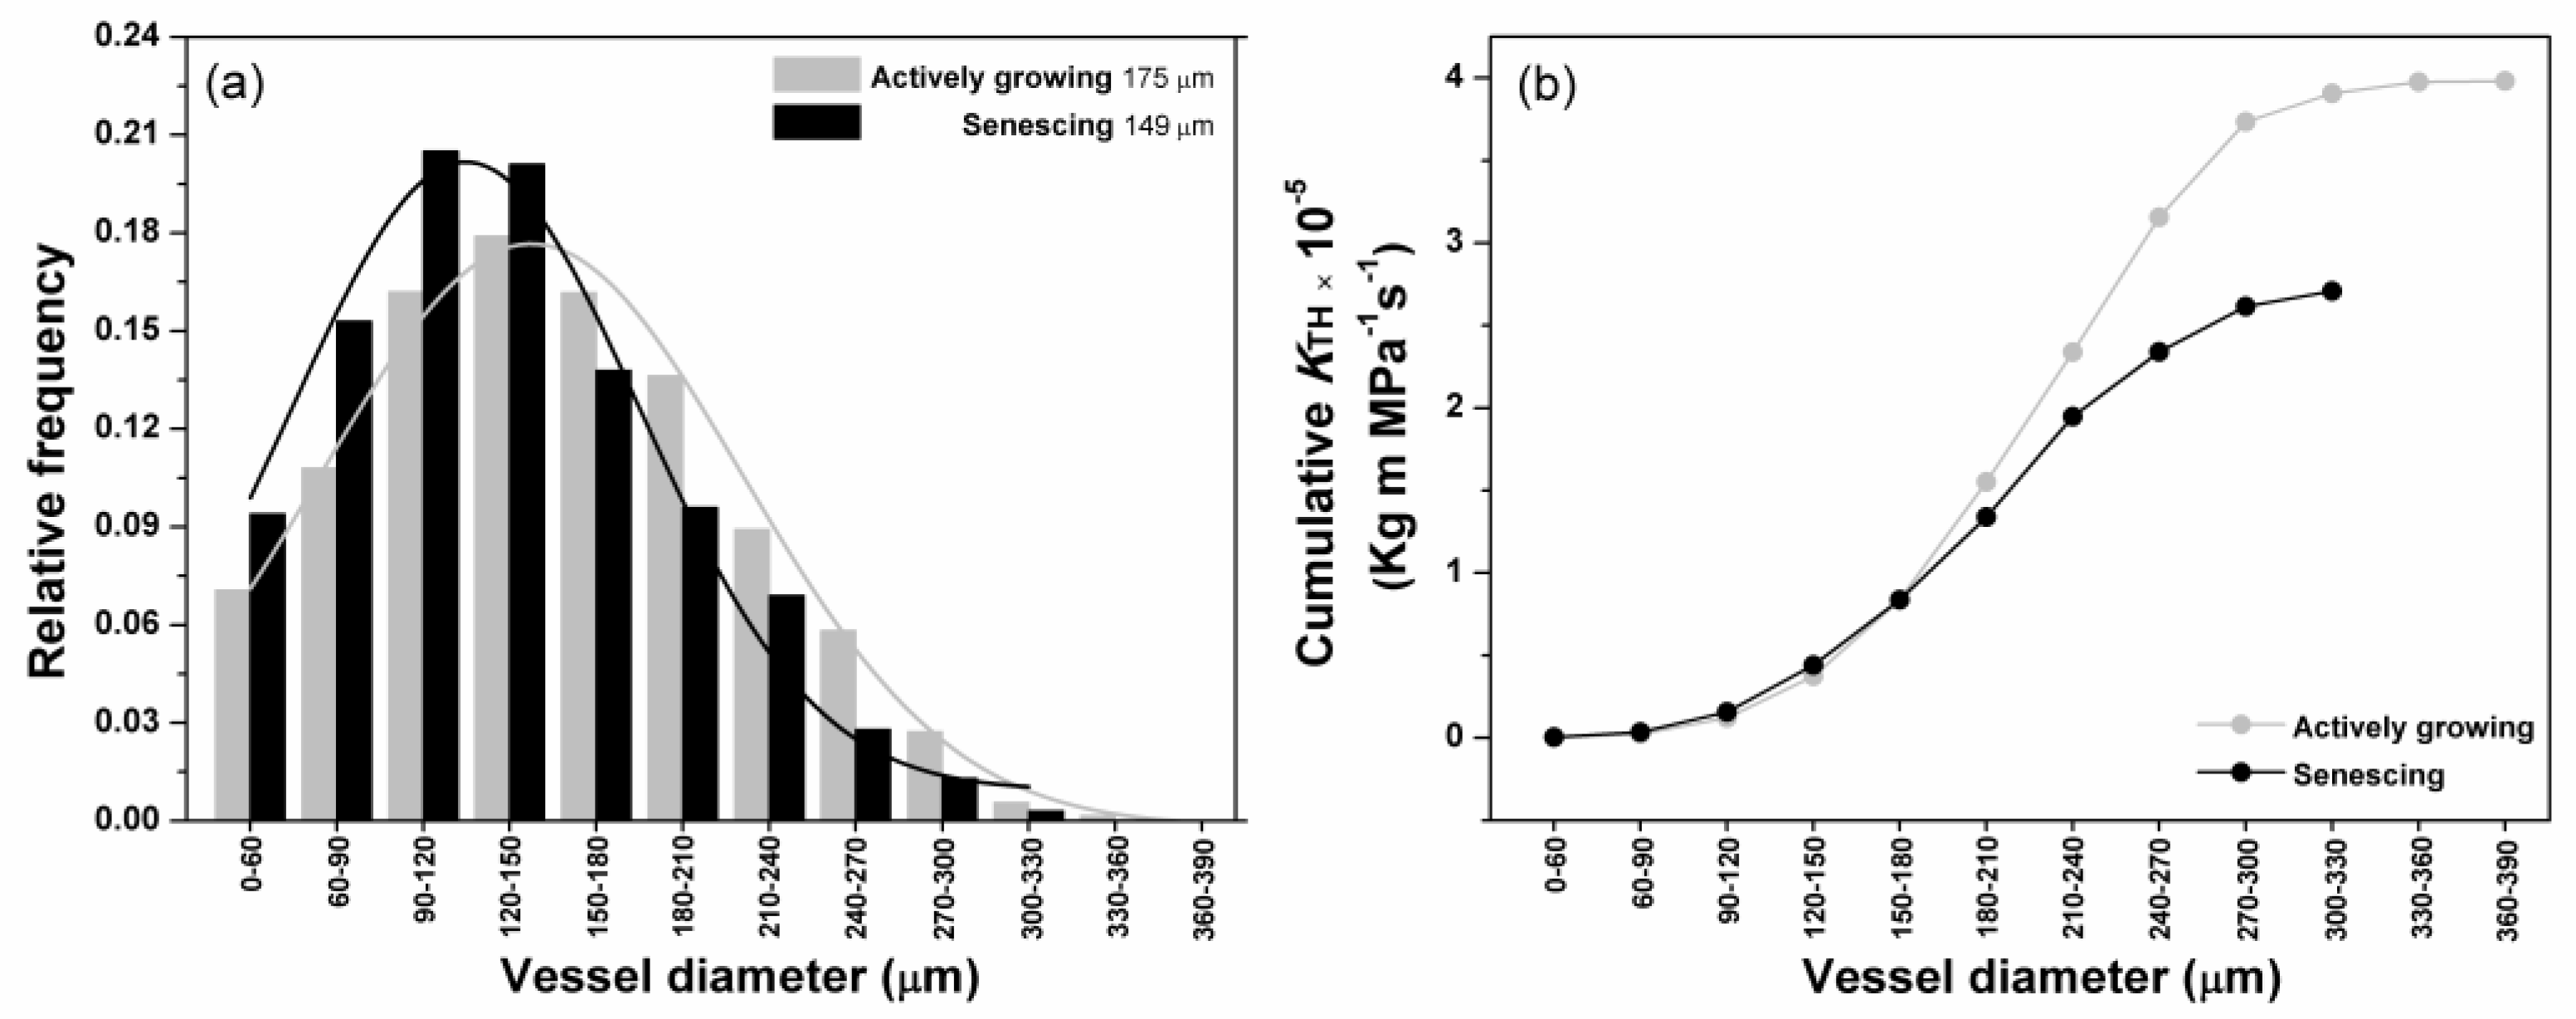
3.2. Xylem Conduit Diameter and Distribution

Conduit systems of actively growing black locust across the slope site were positively skewed but had a near-normal distribution of conduit diameter, with a mean of 175 μm (Figure 3a). In contrast, black locusts in declining status developed a hydraulic transport system of mostly narrow and only a few wide conduits (positively skewed distribution), with a mean conduit diameter of 149 μm. The difference in conduit diameter distribution between the two growing statuses was significant (p = 0.032) and well-illustrated the divergence of the cumulative theoretical hydraulic conductivity (KTH) at the larger conduit classes (Figure 3b). In this study, the mean KTH for actively growing trees was 3.98 kg m MPa−1 s−1, and that for declining trees was 2.71 kg m MPa−1 s−1.

3.3. Tapering Ratio (T)

The fitted model between conduit tapering ratio (T) and stem length predicted the trend well and explained 75% of the variations in T (Table 2). In all sample trees, T increased significantly with stem length (p < 0.001, Figure 4), implying that the change in T with stem length was independent of tree age and structure. For trees of different growth statuses, the fitted model even performed better, with stem length explaining 85% of T variation in declining trees and 89% in actively growing trees (Table 2). In all the measured trees, the calculated slope of the fitted model was 0.212, which was slightly larger than the 0.20 optimal tapering value [16,27,32]. However, for trees in actively growing or declining status, tapering ratios were significantly (p = 0.001) different. In actively growing trees, the calculated slope was 0.244 (95% CI 0.201–0.287), which is significantly above the 0.20 optimal tapering value. The calculated slope for declining trees was 0.175 (CI 0.146–0.198), markedly lower than the optimal value.

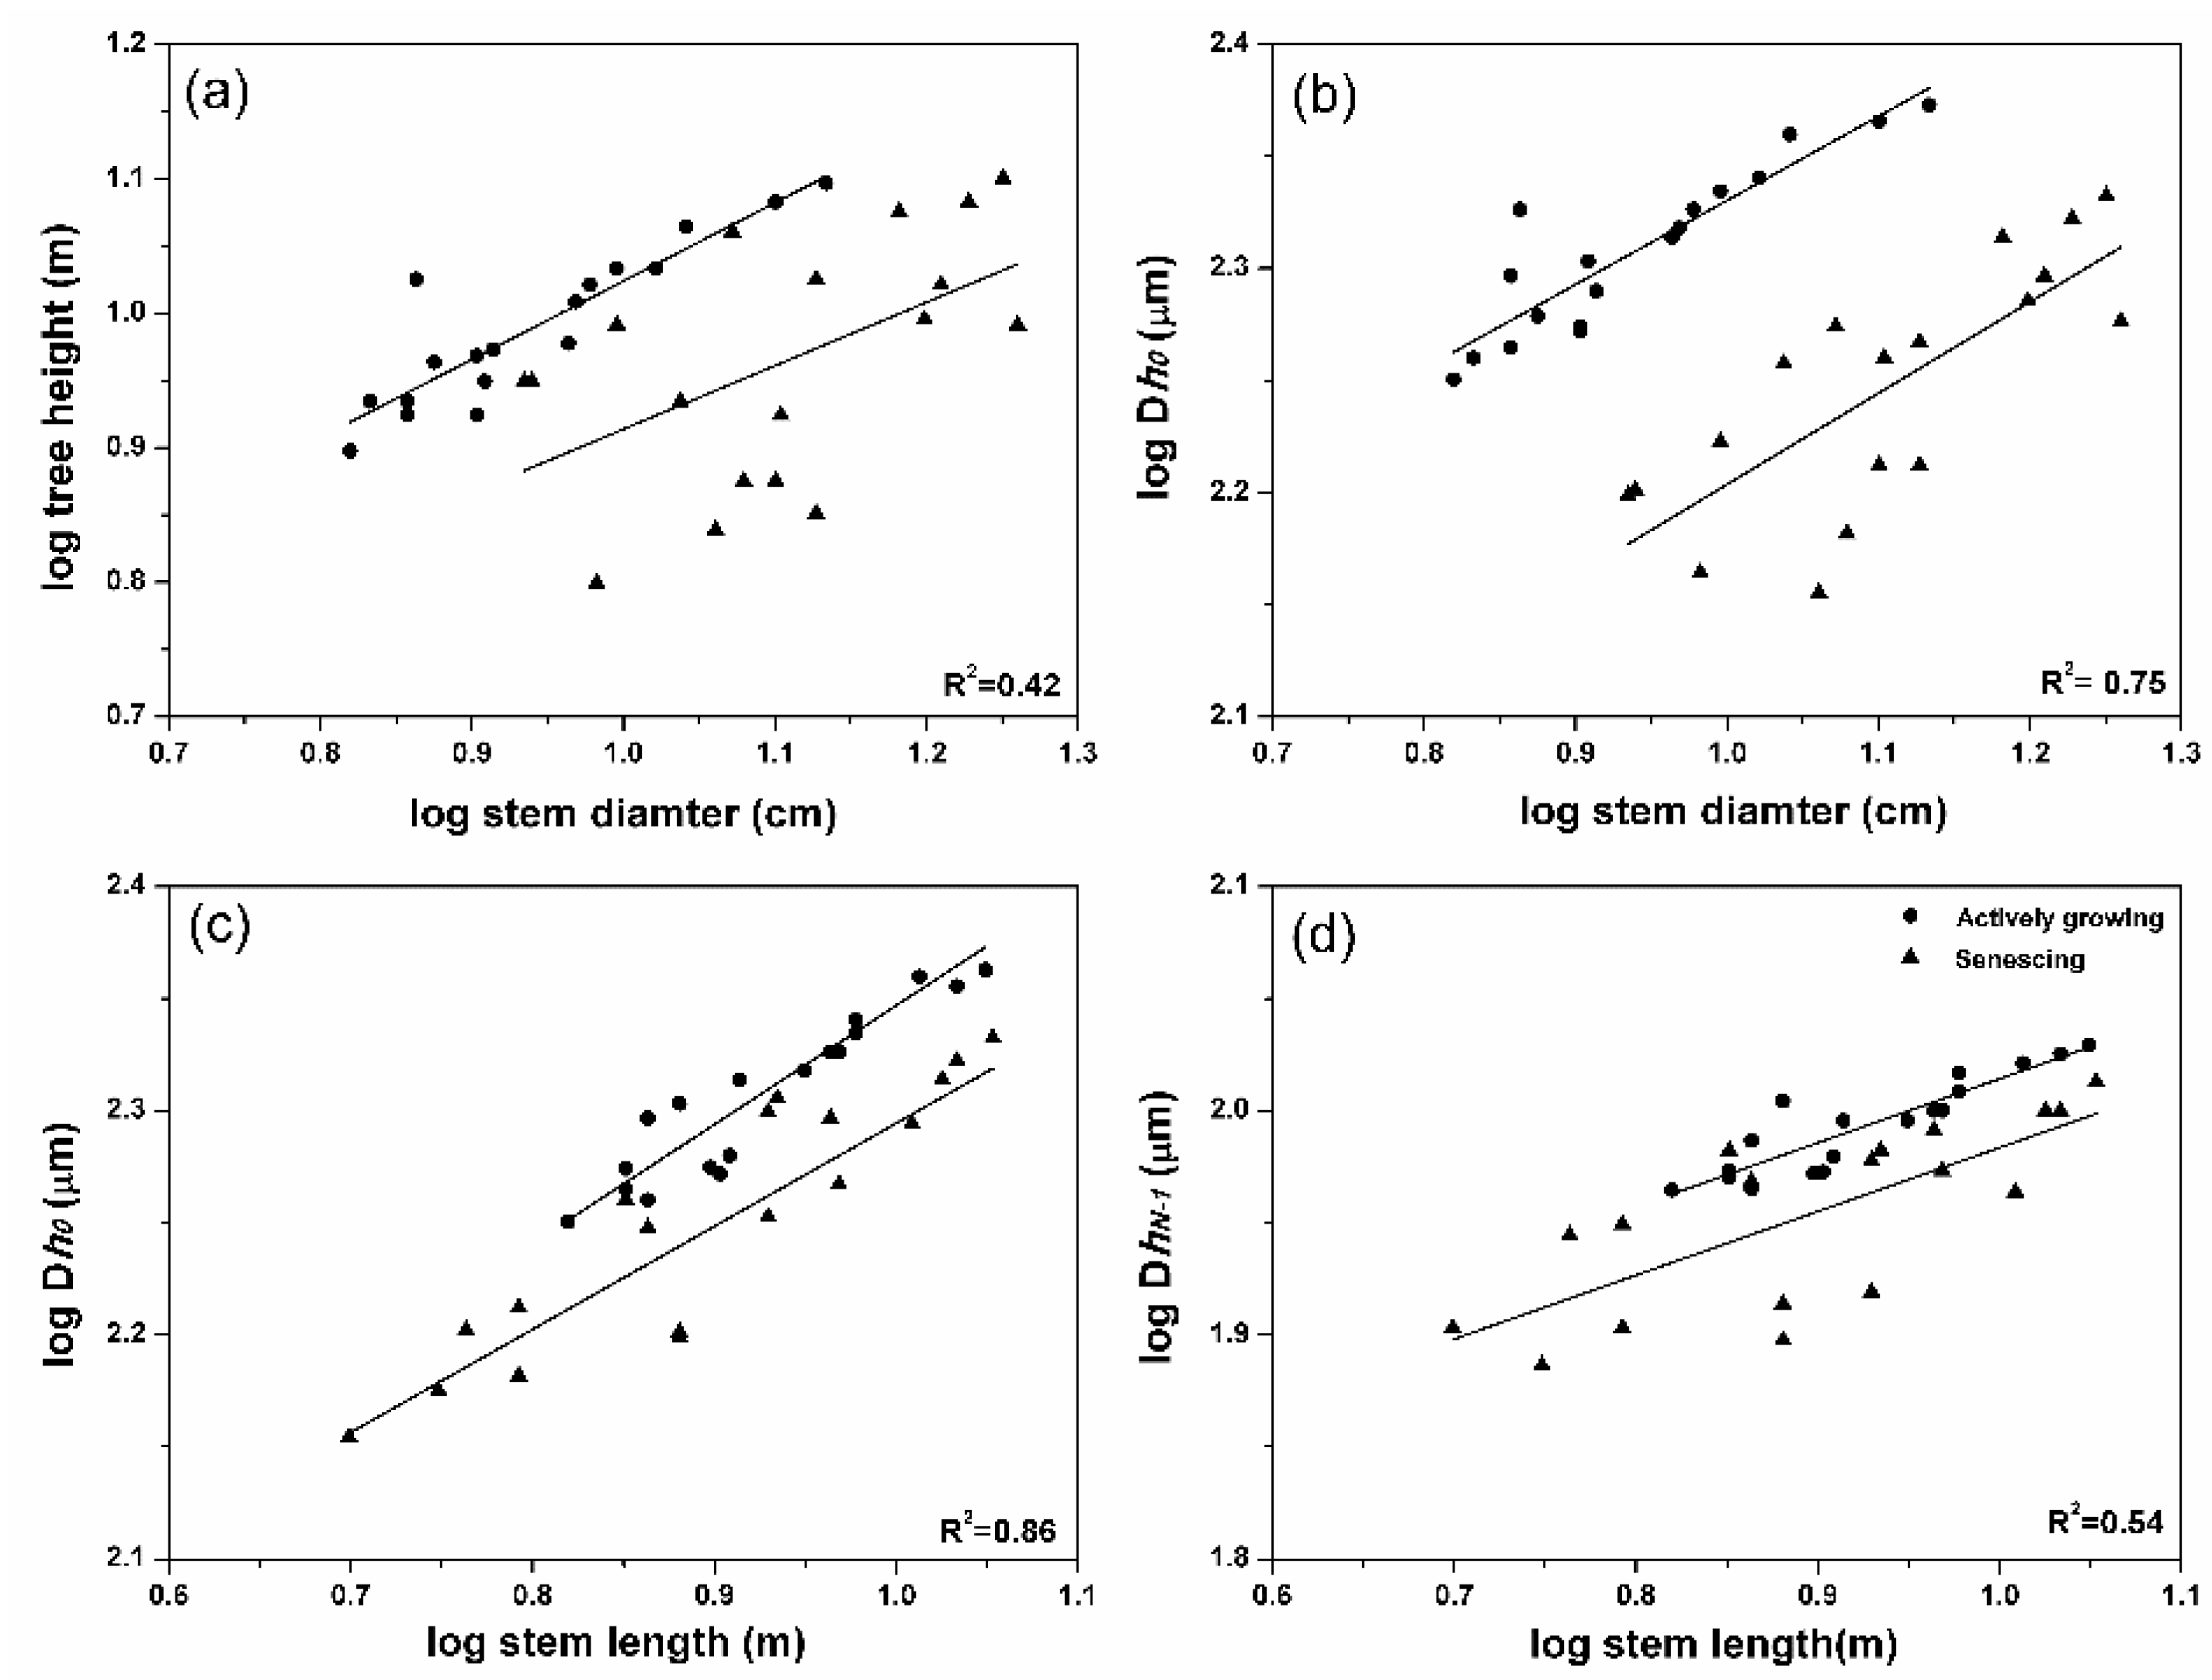
3.4. Conduit Diameter, Stem Diameter, and Stem Length

The fitted model for tree height and stem diameter across both actively growing and declining trees is given in Table 3. The model performed poorly and only explained 42% of the variations in stem length (Figure 5a). For trees with different growth statuses, however, the model-predicted value was better for actively growing trees (R2 = 0.80) than for declining trees (R2 = 0.24). Nevertheless, the stem diameter and growth status interaction term was insignificant (p = 0.622), indicating that all the trees had the same tree height-stem diameter scale slope regardless of the growth status. A comparison of the intercepts of the fitted model suggested that declining trees had a slightly lower tree height than actively growing trees for a given stem diameter but a wider 95% confidence interval (Table 3). The fitted relationship between hydraulically weighted mean conduit diameter of stem sapwood and stem diameter at breast height was parallel to the tree height-stem diameter relationship, but with a higher correlation (R2 = 0.75, Table 3). For a given stem diameter, actively growing trees had significantly larger Dh0 than declining trees (Figure 5b).
The performance of the fitted model improved a lot when stem length, not stem diameter, was plotted against Dh0 (Table 3). The fitted model between Dh0 and stem length and “growth status” performed well, explaining 86% of the variations in Dh0 (Figure 5c). The stem length × growth status interaction term was insignificant (p = 0.421, Table 3), and the differences in the intercept between actively growing trees (1.83) and declining trees (1.81) were minimal. This meant that trees in the two different growing statuses had the same Dh0-stem length scaling relationship, and the conduit diameter of actively growing trees was similar to that of declining trees for a given stem length. The fitted model between DhN-1 and stem length was similar to that of the Dh0-stem length relationship, but with a lower correlation coefficient (R2 = 0.54, Figure 5d and Table 3).
Table 3. Linear allometric models predicting vessel diameter based on stem diameter and stem length of both actively growing and senescent trees, and then the linear models predicting tree height based on stem diameter. All variables were log10 transformed.
SLtree-SD + StatusDh0-SD + StatusDh0-SL + Status DhN-1-SL + StatusDh0-SL + Site
R2 0.420.750.860.540.74
Slope (95% CI)0.52 (0.31, 0.73)0.40 (0.30, 0.50)0.48 (0.40, 0.56)0.29 (0.21, 0.37)0.39 (0.24, 0.55)
Intercept0.61 (0.44, 0.78)2.06 (1.98, 2.15)1.91 (1.83, 1.99)1.76 (1.68, 1.84)1.89 (1.78, 1.99)
Model fitF(2,33) = 13.66 ***F(2,33) =54.12 ***F(2,33) = 111.60 ***F(2,33) = 44.13 ***F(3,32) = 49.83 ***
Equality of slopesp = 0.622p = 0.768p = 0.421p = 0.992p = 0.631
Equality of interceptsp < 0.0001p < 0.0001p < 0.0001p < 0.0001p < 0.0001
Actively growing treesR2 = 0.80 ***R2 = 0.79 ***R2 = 0.9 ***R2 = 0.81 ***-
Intercept0.46 (0.29, 0.59)1.95 (1.86, 2.05)1.83 (1.72, 1.89)1.72 (1.65, 1.79)-
Declining treesR2 = 0.24 *R2 = 0.57 ***R2 = 0.76 ***R2 = 0.52 ***-
Intercept0.44 (0.11, 0.88)1.79 (1.59, 1.99)1.81 (1.72, 1.96)1.70 (1.58, 1.82)-
Upper-slope intercept----1.81 (1.59, 2.02)
Middle-slope intercept----1.91 (1.72, 2.07)
Bottom-slope intercept----2.00 (1.81, 2.20)
FigureFigure 5aFigure 5bFigure 5cFigure 5dFigure 6
SLtree = tree height; SD = stem diameter; Status = actively growing vs. senescing binary variable; Dh0 = hydraulically-weighted mean vessel diameter at the breast height diameter (DBH); SL = distance from tree top to DBH; DhN-1 = hydraulically-weighted mean vessel at stem apex diameter; Site = different slope positions, i.e., upper, middle, and down slope positions. CI = confidence interval; *** = p < 0.001; * = p < 0.05. Assumptions of distributional normality of residuals for all the models were tested through the Shapiro–Wilk W-test except SLtree-SD in senescing trees (p = 0.15).
Figure 5. Relationships between tree height vs. stem diameter at breast height (DBH, (a)), hydraulically weighted conduit diameter in stem sapwood vs. stem diameter at breast height (b), hydraulically weighted conduit diameter in stem sapwood vs. distance from tree top to sample area (stem length, (c)), and hydraulically weighted conduit diameter at stem tip (DhN-1) vs. stem length (d) for actively growing and senescing trees. The regression coefficients are given in Table 3.
Forests 15 00116 g005
Figure 6. The relationship between hydraulically weighted mean conduit diameter in stem sapwood (Dh0) vs. stem length across different slope positions (upper, middle, and bottom slope positions) had the same scaling slope (p = 0.631) between Dh0 and stem length regardless of different soil moisture conditions (full model in Table 3). The figures in the legend refer to the mean soil moisture content at different slope positions for the experimental period. Dotted lines represent the 95% confidence interval of the fitted curve.
Forests 15 00116 g006

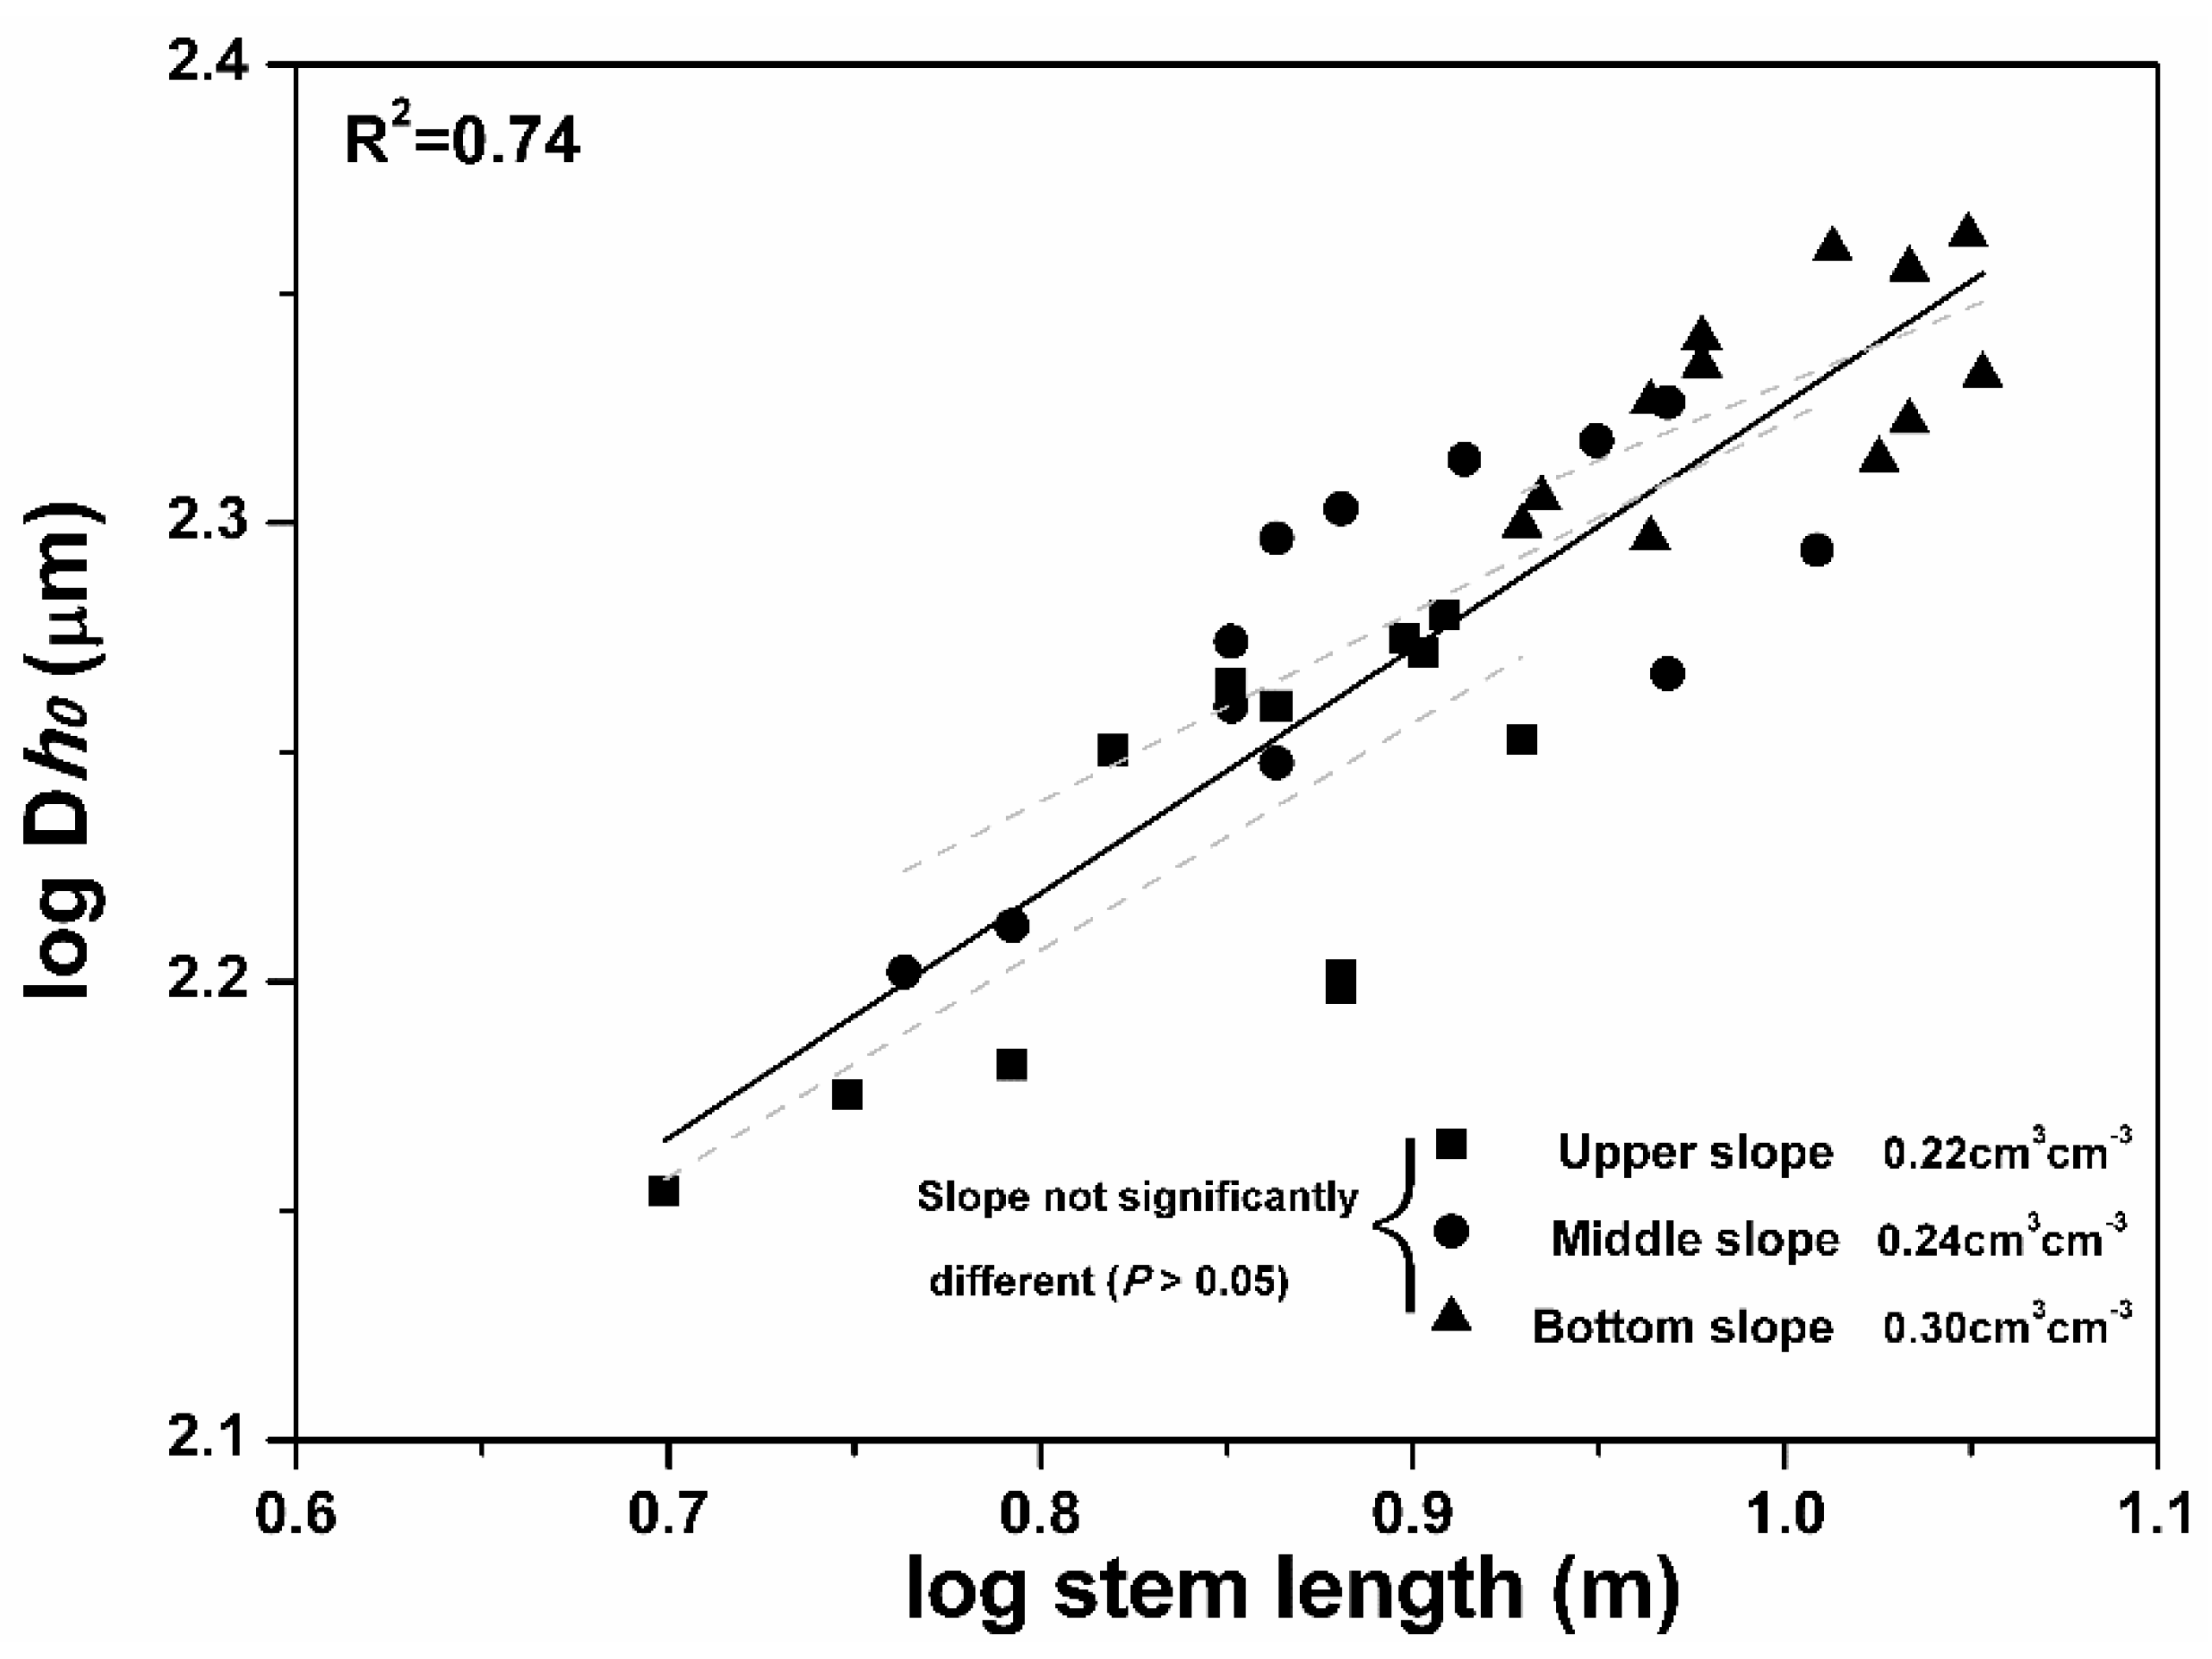
3.5. Soil Water Effect on Conduit Diameter–Stem Length Relationship

The model fit between Dh0 and stem length and “site” also performed well, explaining 74% of the variation in Dh0 (Figure 6 and Table 3). In contrast to our expectation that larger differences could exist in the scaling relationship between single-species trees growing under different soil water conditions (see Pfautsch et al., 2016 [35]), the fitted relationship indicated that trees growing in different slope positions had the same Dh0-stem length scaling relationship (the stem length × site interaction term was insignificant at p = 0.631, Table 3), regardless of soil water condition. Comparison of Dh0 using the intercept of the fitted linear model suggested that trees growing in the bottom slope position (relatively humid environment, intercept = 2.0) had slightly larger mean conduit diameters than trees in the upper or middle slope positions (relatively dry environment, intercept = 1.81–1.91). In this study, tree height was significantly correlated with soil moisture content (R2 = 0.92, Figure 7), which may suggest that the change in Dh0 with soil water content could reflect the change in Dh0 with tree height. Furthermore, the fitted relationship between Dh0 and stem length × site also showed that soil water condition can be used to predict conduit diameter (Dh0) with stem size (i.e., stem length) taken into consideration (Table 4).

4. Discussion

4.1. Conduit Diameter and Distribution

The data derived from the measurement of nearly 23,000 conduit diameters of black locust trees in different growing statuses along the soil water gradient permitted comparison of the differences in vascular characteristics (e.g., conduit distribution, tapering ratio, etc.) between actively growing and declining trees and to explore the dominant factor (e.g., environmental factors or stem size) driving the variations in conduit traits.
The analysis of the dataset showed marked differences (p = 0.032) in the frequency distribution of conduit diameter between trees in the two growing statuses, resulting in the cumulative theoretical hydraulic conductivity (KTH) of actively growing trees being 1.5 fold larger than that of declining trees (Figure 3b). The large difference in cumulative KTH was mainly attributed to the small proportion of large conduits in the stem sapwood [52]. As conduit sap transport increased with diameter to the fourth power [53], a small change in wide conduit diameter induced a large variation in water transport capacity [15,22]. Our measurements showed that the relative distribution of the conduits (82% of total) and cumulative KTH (1.55 kg m MPa−1 s−1) of actively growing trees were not different from those in declining trees (89% of total conduit and 1.34 kg m MPa−1 s−1) for conduit diameter below 210 μm (Figure 3a,b). However, for conduit diameters above 210 μm, large differences were detected in cumulative KTH between actively growing and declining trees (Figure 3b). Wide conduits (>210 μm) in actively growing trees accounted for over 61% of the water flow capacity, while those in declining trees accounted for 51%.
The differences in conduit distribution and cumulative KTH also reflected tree water use. Field measurements of the sap flux of the two growing tree types showed that the transpiration of declining trees was 72% that of actively growing trees. There have also been similar observations in several other studies on actively growing and declining trees, where water use or hydraulic conductivity in declining trees was significantly lower than that in actively growing trees [5,7,54]. On the other hand, black locusts in the study area can endure declining status for several years before eventual death. Therefore, it was speculated that the distribution of large amounts of narrow conduit in declining trees ensured continuous water transport under increasing drought conditions. If there is embolism in wide conduits, narrow conduits would still function and prevent the trees from rapid catastrophic mortality.

4.2. Tapering Ratio

Hydraulic optimality (HO) models predict that total hydrodynamic resistance in trees is invariant with plant size [16,30,32,55]. This implies that plants have evolved a universal structure of a vascular network of conduit tapering to minimize resource transport costs [24,27,31]. In order to fully compensate for increased hydraulic resistance with increasing tree height, conduit tapering should be above or at least equal to an optimal threshold of 0.20 [16,24]. Tapering larger than or equal to the threshold value suggests full agreement with the HO model prediction and that the vascular system is well optimized. In contrast, tapering lower than the threshold value is not supported by the HO model prediction and suggests a vascular network that is not optimized, and tree crown leaves could experience severe water stress.
The measurements showed that the hydraulically weighted mean conduit diameter at the tree apex (DhN-1) was smaller than that at breast-height stem sapwood (Dh0). This suggested that xylem conduits taper in the stems of black locust trees, which is in agreement with several other tree species [12,14,24,30,31,34,35,56]. For conduit tapering, the results indicated that the variations were highly associated with stem length and largely independent of tree age, structure, and growth status (Figure 4), much in agreement with Anfodillo et al. (2006) [24]. Tapering ratio for actively growing trees (0.244, 95% CI 0.201–0.287) exceeded the optimal threshold, which agrees with HO model prediction, whereas tapering in declining trees was markedly lower (0.175, 95% CI 0.146–0.198) than the optimal value and does not support HO model prediction. This implies that the vascular network of actively growing black locust trees was optimized and that of declining trees was not optimized. If the vascular network is not optimized (tapering < 0.20), hydrodynamic resistance increases with tree height. This can result in lower stomatal conductance and assimilation rates in leaves at tree tops, and the leaf area/sapwood area ratio will also drop ([23]; Table 1).
By testing the tapering ratio of trees in different growing statuses (actively growing stage and mature trees), Anfodillo et al. (2006) noted that the tapering ratio of actively growing trees (e.g., Fraxinus excelsior L.) agreed with the HO model prediction and that of trees approaching maximum height (e.g., Larix decidua Miller) disagreed with the model prediction [24]. For mature old trees, Mencuccini (2002) also noted that HO models cannot predict conduit tapering [22]. This, combined with the findings, further suggested that HO models can only be applied strictly to actively growing trees and not to mature old trees, trees approaching maximum height, or trees in declining status.

4.3. Conduit Diameter, Stem Diameter, and Stem Length

In all the sample trees, the measurements showed a close relationship between soil water content, conduit diameter, and stem size. Other studies show that natural selection favors narrow conduits for plants in semiarid/arid regions and wide conduits for plants in humid regions [10,57,58,59]. This is because wide conduits conduct water more efficiently and narrow conduits are more resistant to embolism [15,60,61,62]. The results, however, suggested that soil water availability had little effect on conduit diameter variation. There was a strong direct correlation between hydraulically weighted mean conduit diameter (Dh0) at stem sapwood and soil water availability (R2 = 0.51, p < 0.001, Table 4), although it was weaker than that between Dh0 and stem size (e.g., stem diameter and stem length, R2 = 0.75–0.86, Table 3). If soil water availability was the main driver of the variations in conduit diameter, then the Dh0-soil water availability correlation would be high once stem size terms were factored out. Statistical analysis, however, showed that once stem size terms (e.g., stem length) were factored in, the correlation between Dh0 and soil water availability decreased markedly and sometimes insignificantly (R2 = 0.049, p = 0.44, Table 4). This was sufficient evidence to suggest that soil water condition was not a direct driver of conduit diameter variation in black locust stem sapwood. As such, it cannot be used as an indicator for conduit diameter once stem size terms are taken into consideration.
As trees grow tall, conduits widen basipetally (‘taper’ Olson and Rosell, 2013; Becker and Gribben, 2000) [27,31] and conduit tapering reflects stem length [26]. Therefore, the Dh0-stem diameter relationship can be used as an indirect indicator (via stem length and conduit widening) for conduit tapering. The results supported this trend, as the correlation of the Dh0-stem length relationship (R2 = 0.86, Figure 5c) was higher than that of the Dh0-stem diameter relationship (R2 = 0.75, Figure 5b). At the same time, we examined the relationship between stem length and stem diameter, and the results were significantly different for the two tree-growing statues (Figure 5a and Table 3). The correlations of actively growing trees (R2 = 0.80) were much better than those of declining trees (R2 = 0.24), suggesting that larger uncertainties could arise when stem diameter is used to predict stem length in declining black locust trees. Under such conditions, we concluded that, compared with soil water availability and stem diameter, the stem length of black locust was by far the main factor driving the variations in conduit diameter at stem sapwood.
In contrast to the results, recent studies on the genus Eucalyptus suggested that climate (e.g., annual precipitation/potential evapotranspiration, etc.) was the dominant factor controlling the variation in conduit diameter and that tree height had only an ancillary effect [35]. The study also concluded that adaptive features (genotypic rather than environmental differences) were more likely responsible for smaller diameters in more arid environments. This conclusion, however, was in contrast with several other reports. Through meta-analysis across different tree species, Olson and Rosell (2013) [31] and Olson et al. (2014) [30] showed that tree height, and not climate, was the dominant factor driving the variations in conduit diameter. This, together with the findings, may suggest that the correlation between conduit diameter and soil water availability or climate is the indirect effect of variations in tree height rather than a direct response to drought stress for most tree species, particularly angiosperm species.
The measurements of trees for different growing statuses also indicated that growth has no effect on the Dh0-stem length scaling relationship because stem length × status was insignificant (p = 0.421, Table 3). This, together with the conduit diameter–stem length site scaling relationship, confirmed that selections that favor constant hydraulic resistance via conduit widening as a function of tree height were a critical factor shaping the vascular network of black locust trees, even differing in growth status under large soil water gradients.

5. Conclusions

The measurements of ~23,000 conduit diameters at breast height stems and apex stems from black locust trees in varying growth stages (actively growing and declining) along a soil water gradient revealed notable discrepancies in vascular characteristics between the two growth statuses. Declining trees exhibited narrowed conduit diameters, increased frequency with a positively skewed distribution, and decreased cumulative theoretical hydraulic conductivity compared to actively growing trees. Across all measured trees, the hydraulically weighted mean conduit diameter at breast height stem (Dh0) surpassed that at apex stem (DhN-1), indicating an acropetal tapering of xylem conduits from breast height to apex. Conduit tapering in actively growing trees aligned with predictions from hydraulic optimality models, while trees in declining status displayed significantly lower tapering, suggesting suboptimal vascular networks. This disparity implied an increased hydraulic resistance with tree height in declining trees. Variations in hydraulic traits between actively growing and declining trees were primarily associated with differences in tree height rather than stem diameter or soil water content. Correlations of conduit diameter with soil water availability across all measured trees were indirectly linked to variations in tree height rather than representing a direct response to drought stress. This study emphasizes the potential implications for breeding programs focused on enhancing the resilience of black locust trees against environmental stressors. Moreover, this study underscores the importance of considering hydraulic traits, particularly concerning tree growth stages and environmental conditions, in the development of tree cultivars better suited for specific environments or climate scenarios.

Author Contributions

Conception and design, C.M. and M.S.; Acquisition of data, C.M., X.Z. and Q.Y.; Analysis and Interpretation of data, Q.Y., X.Z., B.Z. and Q.W.; Drafting the article, C.M., M.S. and Q.W.; Conception and design, Q.W. and B.Z. All authors have read and agreed to the published version of the manuscript.

Funding

This work was supported by the National Natural Science Foundation of China (42107326) and Scientific Research Foundation of Xi’an University of Technology (256082313).

Data Availability Statement

The datasets generated and/or analyzed during the current study are available from the corresponding author on reasonable request.

Conflicts of Interest

The authors declare no conflicts of interest.

References

  1. Allen, C.D.; Macalady, A.K.; Chenchouni, H.; Bachelet, D.; McDowell, N.; Vennetier, M.; Kitzberger, T.; Rigling, A.; Breshears, D.D.; Hogg, E.H.; et al. A global overview of drought and heat-induced tree mortality reveals emerging climate change risks for forests. Forest Ecol. Manag. 2010, 259, 660–684. [Google Scholar] [CrossRef]
  2. Anderegg, W.R.L.; Kane, J.M.; Anderegg, L.D.L. Consequences of widespread tree Mortality triggered by drought and temperature stress. Nat. Clim. Chang. 2013, 3, 30–36. [Google Scholar] [CrossRef]
  3. Camarero, J.J.; Gazol, A.; Sanguesa-Barreda, G.; Oliva, J.; Vicenta-Serrano, S.M. To die or not to die early warnings of tree dieback in response to a severe drought. J. Ecol. 2015, 103, 44–57. [Google Scholar] [CrossRef]
  4. Rice, K.J.; Matzner, S.L.; Byer, W.; Brown, J.R. Patterns of tree dieback in Queensland, Australia: The importance of drought stress and the role of resistance to cavitation. Oecologia 2004, 139, 190–198. [Google Scholar] [CrossRef] [PubMed]
  5. Anderegg, W.R.L.; Anderegg, L.D.L.; Berry, J.A.; Field, C.B. Loss of whole-tree hydraulic conductance during severe drought and multi-year forest die-off. Oecologia 2014, 175, 11–23. [Google Scholar] [CrossRef] [PubMed]
  6. Nardini, A.; Battistuzzo, M.; Savi, T. Shoot desiccation and hydraulic failure in temperate woody angiosperms during an extreme summer drought. New Phytol. 2013, 200, 322–329. [Google Scholar] [CrossRef] [PubMed]
  7. Plaut, J.A.; Yepez, E.A.; Hill, J.; Pangle, R.; Sperry, J.S.; Pockman, W.T.; McDowell, N.G. Hydraulic limits preceding mortality in a pinon-juniper woodland under experimental drought. Plant Cell Environ. 2012, 35, 1601–1617. [Google Scholar] [CrossRef]
  8. Adams, H.D.; Guardiola-Claramonte, M.; Barron-Gafford, G.A.; Villegas, J.C.; Breshears, D.D.; Zou, C.B.; Troch, P.A.; Huxman, T.E. Temperature sensitivity of drought-induced tree mortality portends increased regional die-off under global-change-type drought. Proc. Natl. Acad. Sci. USA 2009, 106, 7063–7066. [Google Scholar] [CrossRef]
  9. McDowell, N.; Pockman, W.T.; Allen, C.D.; Breshears, D.D.; Cobb, N.; Kolb, T.; Plaut, J.; Sperry, J.; West, A.; Williams, D.G.; et al. Mechanisms of plant survival and mortality during drought: Why do some plants survive while others succumb to drought? New Phytol. 2008, 178, 719–739. [Google Scholar] [CrossRef]
  10. Tyree, M.T.; Zimmermann, M.H. Xylem Structure and the Ascent of Sap; Springer: New York, NY, USA, 2002. [Google Scholar]
  11. Hoffmann, W.A.; Marchin, R.M.; Abit, P.; Lau, O.L. Hydraulic failure and tree dieback are associated with high wood density in a temperate forest under extreme drought. Global Chang. Biol. 2011, 17, 2731–2742. [Google Scholar] [CrossRef]
  12. Zimmermann, M.H. Xylem Structure and the Ascent of Sap; Springer: New York, NY, USA, 1983. [Google Scholar]
  13. Schuldt, B.; Leuschner, C.; Brock, N.; Horna, V. Changes in wood density, wood anatomy and hydraulic properties of the xylem along the root-to-shoot flow path in tropical rainforest trees. Tree Physiol. 2013, 33, 161–174. [Google Scholar] [CrossRef]
  14. Tyree, M.T.; Ewers, F.W. The hydraulic architecture of trees and other woody plants. New Phytol. 1991, 119, 345–360. [Google Scholar] [CrossRef]
  15. Sperry, J.S.; Meinzer, F.C.; McCulloh, K.A. Safety and efficiency conflicts in hydraulic architecture: Scaling from tissues to trees. Plant Cell Environ. 2008, 31, 632–645. [Google Scholar] [CrossRef] [PubMed]
  16. West, G.B.; Brown, J.H.; Enquist, B.J. A general model for the structure and allometry of plant vascular systems. Nature 1999, 400, 664–667. [Google Scholar] [CrossRef]
  17. Ryan, M.G.; Yoder, B.J. Hydraulic limits to tree height and tree growth. Bioscience 1997, 47, 235–242. [Google Scholar] [CrossRef]
  18. Choat, B.; Jansen, S.; Brodribb, T.J.; Cochard, H.; Delzon, S.; Bhaskar, R.; Bucci, S.J.; Feild, T.S.; Gleason, S.M.; Hacke, U.G.; et al. Global convergence in the vulnerability of forests to drought. Nature 2012, 491, 752–755. [Google Scholar] [CrossRef] [PubMed]
  19. Zach, A.; Schuldt, B.; Brix, S.; Horna, V.; Culmsee, H.; Leuschner, C. Vessel diameter and xylem hydraulic conductivity increase with tree height in tropical rainforest trees in Sulawesi, Indonesia. Flora 2010, 205, 506–512. [Google Scholar] [CrossRef]
  20. Santiago, L.S.; Goldstein, G.; Meinzer, F.C.; Fisher, J.B.; Machado, K.; Woodruff, D.; Jones, T. Leaf photosynthetic traits scale with hydraulic conductivity and wood density in Panamanian forest canopy trees. Oecologia 2004, 140, 543–550. [Google Scholar] [CrossRef]
  21. Carrer, M.; von Arx, G.; Castagneri, D.; Petit, G. Distilling allometric and environmental information from time series of conduit size: The standardization issue and its relationship to tree hydraulic architecture. Tree Physiol. 2015, 35, 27–33. [Google Scholar] [CrossRef]
  22. Magnani, F.; Mencuccini, M.; Grace, J. Age-related decline in stand productivity: The role of structural acclimation under hydraulic constraints. Plant Cell Environ. 2000, 23, 251–263. [Google Scholar] [CrossRef]
  23. McDowell, N.G.; Phillips, N.; Lunch, C.; Bond, B.J.; Ryan, M.G. An investigation of hydraulic limitation and compensation in large, old Douglas-fir trees. Tree Physiol. 2002, 22, 763–774. [Google Scholar] [CrossRef] [PubMed]
  24. Anfodillo, T.; Carraro, V.; Carrer, M.; Fior, C.; Rossi, S. Convergent tapering of xylem conduits in different woody species. New Phytol. 2006, 169, 279–290. [Google Scholar] [CrossRef] [PubMed]
  25. Enquist, B.J.; West, G.B.; Charnov, E.L.; Brown, J.H. Allometric scaling of production and life-history variation in vascular plants. Nature 1999, 401, 907–911. [Google Scholar] [CrossRef]
  26. Petit, G.; Anfodillo, T.; De Zan, C. Degree of tapering of xylem conduits in stems and roots of small Pinus cembra and Larix decidua trees. Botany 2009, 87, 501–508. [Google Scholar] [CrossRef]
  27. Becker, P.; Gribben, R.J.; Lim, C.M. Tapered conduits can buffer hydraulic conductance from path-length effects. Tree Physiol. 2000, 20, 965–967. [Google Scholar] [CrossRef]
  28. Fan, Z.-X.; Cao, K.-F.; Becker, P. Axial and radial variations in xylem anatomy of angiosperm and conifer trees in Yunnan, China. Iawa J. 2009, 30, 1–13. [Google Scholar] [CrossRef]
  29. McCulloh, K.A.; Sperry, J.S. Patterns in hydraulic architecture and their implications for transport efficiency. Tree Physiol. 2005, 25, 257–267. [Google Scholar] [CrossRef]
  30. Olson, M.E.; Anfodillo, T.; Rosell, J.A.; Petit, G.; Crivellaro, A.; Isnard, S.; Leon-Gomez, C.; Alvarado-Cardenas, L.O.; Castorena, M. Universal hydraulics of the flowering plants: Vessel diameter scales with stem length across angiosperm lineages, habits and climates. Ecol. Lett. 2014, 17, 988–997. [Google Scholar] [CrossRef]
  31. Olson, M.E.; Rosell, J.A. Vessel diameterstem diameter scaling across woody angiosperms and the ecological causes of xylem vessel diameter variation. New Phytol. 2013, 197, 1204–1213. [Google Scholar] [CrossRef]
  32. Enquist, B.J. Universal scaling in tree and vascular plant allometry: Toward a general quantitative theory linking plant form and function from cells to ecosystems. Tree Physiol. 2002, 22, 1045–1064. [Google Scholar] [CrossRef]
  33. Anfodillo, T.; Deslauriers, A.; Menardi, R.; Tedoldi, L.; Petit, G.; Rossi, S. Widening of xylem conduits in a conifer tree depends on the longer time of cell expansion downwards along the stem. J. Exp. Bot. 2012, 63, 837–845. [Google Scholar] [CrossRef] [PubMed]
  34. Petit, G.; Anfodillo, T.; Mencuccini, M. Tapering of xylem conduits and hydraulic limitations in sycamore (Acer pseudoplatanus) trees. New Phytol. 2008, 177, 653–664. [Google Scholar] [CrossRef] [PubMed]
  35. Pfautsch, S.; Harbusch, M.; Wesolowski, A.; Smith, R.; Macfarlane, C.; Tjoelker, M.G.; Reich, P.B.; Adams, M.A. Climate determines vascular traits in the ecologically diverse genus Eucalyptus. Ecol. Lett. 2016, 19, 240–248. [Google Scholar] [CrossRef] [PubMed]
  36. Feng, X.; Fu, B.; Piao, S.; Wang, S.; Ciais, P.; Zeng, Z.; Lü, Y.; Zeng, Y.; Li, Y.; Jiang, X.; et al. Revegetation in China’s Loess Plateau is approaching sustainable water resource limits. Nat. Clim. Chang. 2016, 6, 1019–1022. [Google Scholar] [CrossRef]
  37. Shi, H.; Shao, M.G. Soil and water loss from the Loess Plateau in China. J. Arid. Environ. 2000, 45, 9–20. [Google Scholar] [CrossRef]
  38. Wang, S.; Fu, B.; Piao, S.; Lü, Y.; Ciais, P.; Feng, X.; Wang, Y. Reduced sediment transport in the Yellow River due to anthropogenic changes. Nat. Geosci. 2015, 9, 38–41. [Google Scholar] [CrossRef]
  39. Lu, Y.H.; Fu, B.J.; Feng, X.M.; Zeng, Y.; Liu, Y.; Chang, R.Y.; Sun, G.; Wu, B.F. A policy-driven large scale ecological restoration: Quantifying ecosystem eservices changes in the Loess Plateau of China. PLoS ONE 2012, 7, e31782. [Google Scholar]
  40. Liang, W.; Bai, D.; Wang, F.; Fu, B.; Yan, J.; Wang, S.; Yang, Y.; Long, D.; Feng, M. Quantifying the impacts of climate change and ecological restoration on streamflow changes based on a Budyko hydrological model in China’s Loess Plateau. Water Resour. Res. 2015, 51, 6500–6519. [Google Scholar] [CrossRef]
  41. Ma, C.; Luo, Y.; Shao, M.; Li, X.; Sun, L.; Jia, X. Environmental controls on sap flow in black locust forest in Loess Plateau, China. Sci. Rep. 2017, 7, 13160. [Google Scholar] [CrossRef]
  42. Xu, M.; Liu, G. The characteristics and evolution of soil nutrient in artificial black locust (Robinia pseudoacacia) forest-land in the hilly Loess Plateau. Plant Nutr. Fertil. Sci. 2004, 10, 40–46. [Google Scholar]
  43. Du, S.; Wang, Y.-L.; Kume, T.; Zhang, J.-G.; Otsuki, K.; Yamanaka, N.; Liu, G.-B. Sapflow characteristics and climatic responses in three forest species in the semiarid Loess Plateau region of China. Agric. For. Meteorol. 2011, 151, 1–10. [Google Scholar] [CrossRef]
  44. Tanaka-Oda, A.; Kenzo, T.; Koretsune, S.; Sasaki, H.; Fukuda, K. Ontogenetic changes in water-use efficiency (δ13C) and leaf traits differ among tree species growing in a semiarid region of the Loess Plateau, China. Forest Ecol. Manag. 2010, 259, 953–957. [Google Scholar] [CrossRef]
  45. Tateno, R.; Tokuchi, N.; Yamanaka, N.; Du, S.; Otsuki, K.; Shimamura, T.; Xue, Z.D.; Wang, S.Q.; Hou, Q.C. Comparison of litterfall production and leaf litter decomposition between an exotic black locust plantation and an indigenous oak forest near Yan’an on the Loess Plateau, China. Forest Ecol. Manag. 2007, 241, 84–90. [Google Scholar] [CrossRef]
  46. Wang, L.; Wei, S.P.; Horton, R.; Shao, M.A. Effects of vegetation and slope aspect on water budget in the hill and gully region of the Loess Plateau of China. Catena 2011, 87, 90–100. [Google Scholar] [CrossRef]
  47. Macfarlane, C.; Arndt, S.K.; Livesley, S.J.; Edgar, A.C.; White, D.A.; Adams, M.A.; Eamus, D. Estimation of leaf area index in eucalypt forest with vertical foliage, using cover and fullframe fisheye photography. Forest Ecol. Manag. 2007, 242, 756–763. [Google Scholar] [CrossRef]
  48. Arbellay, E.; Fonti, P.; Stoffel, M. Duration and extension of anatomical changes in wood structure after cambial injury. J. Exp. Bot. 2012, 63, 3271–3277. [Google Scholar] [CrossRef]
  49. Scholz, A.; Klepsch, M.; Karimi, Z.; Jansen, S. How to quantify conduits in wood? Front. Plant Sci. 2013, 4, 56. [Google Scholar] [CrossRef]
  50. Jia, X.X.; Shao, M.A.; Zhu, Y.J.; Luo, Y. Soil moisture decline due to afforestation across the Loess Plateau, China. J. hydrol. 2017, 546, 113–122. [Google Scholar] [CrossRef]
  51. Wang, M.-C.; Wang, J.-X.; Shi, Q.-H.; Zhang, J.-S. Photosynthesis and water use efficiency of Platycladus orientalis and Robinia pseudoacacia saplings under steady soil water stress during different stages of their annual growth period. J. Integr. Plant Biol. 2007, 49, 1470–1477. [Google Scholar] [CrossRef]
  52. McElrone, A.J.; Pockman, W.T.; Martinez-Vilalta, J.; Jackson, R.B. Variation in xylem structure and function in stems and roots of trees to 20 m depth. New Phytol. 2004, 163, 507–517. [Google Scholar] [CrossRef]
  53. Cruiziat, P.; Cochard, H.; Ameglio, T. Hydraulic architecture of trees: Main concepts and results. Ann. Forest Sci. 2002, 59, 723–752. [Google Scholar] [CrossRef]
  54. Borja, I.; Svetlik, J.; Nadezhdin, V.; Cermak, J.; Rosner, S.; Nadezhdina, N. Sap flux—A real time assessment of health status in Norway spruce. Scand. J. Forest Res. 2016, 31, 450–457. [Google Scholar] [CrossRef]
  55. Savage, V.M.; Bentley, L.P.; Enquist, B.J.; Sperry, J.S.; Smith, D.D.; Reich, P.B.; von Allmen, E.I. Hydraulic trade-offs and space filling enable better predictions of vascular structure and function in plants. Proc. Natl. Acad. Sci. USA 2010, 107, 22722–22727. [Google Scholar] [CrossRef]
  56. Meinzer, F.C.; Clearwater, M.J.; Goldstein, G. Water transport in trees: Current perspectives, new insights and some controversies. Environ. Exp. Bot. 2001, 45, 239–262. [Google Scholar] [CrossRef] [PubMed]
  57. Wheeler, E.A.; Baas, P.; Rodgers, S. Variations in dieot wood anatomy: A global analysis based on the insidewood database. Iawa J. 2007, 28, 229–258. [Google Scholar] [CrossRef]
  58. Barij, N.; Stokes, A.; Bogaard, T.; Van Beek, R. Does growing on a slope affect tree xylem structure and water relations? Tree Physiol. 2007, 27, 757–764. [Google Scholar] [CrossRef]
  59. Carlquist, S. Comparative Wood Anatomy, 2nd ed.; Springer: Berlin, Germany, 2001. [Google Scholar]
  60. Hacke, U.G.; Sperry, J.S.; Wheeler, J.K.; Castro, L. Scaling of angiosperm xylem structure with safety and efficiency. Tree Physiol. 2006, 26, 689–701. [Google Scholar] [CrossRef]
  61. Wheeler, J.K.; Sperry, J.S.; Hacke, U.G.; Hoang, N. Inter-vessel pitting and cavitation in woody Rosaceae and other vesselled plants a basis for a safety versus efficiency trade-off in xylem transport. Plant Cell Environ. 2005, 28, 800–812. [Google Scholar] [CrossRef]
  62. Meinzer, F.C. Functional convergence in plant responses to the environment. Oecologia 2003, 134, 1–11. [Google Scholar] [CrossRef]
Figure 1. Location of the study site in the Loess Plateau in Central China.
Forests 15 00116 g001
Figure 2. Volumetric soil water content (θv, %) distribution along the hillslope. θv decreased significantly from the bottom slope position to the upper slope position (or with increasing altitude: y = −0.035x + 61.329, R2 = 0.92, p = 0.002). The mean soil water content of the 500 cm soil profile was measured and calculated around sample trees in each stand. Different small letters above the symbols indicate a significant difference (p < 0.05) in θv between slope positions or between stands in different growth statuses.
Forests 15 00116 g002
Figure 3. Conduit diameter distribution (a) and cumulative percentage of total theoretical hydraulic conductivity contributed by each conduit size class (b) in stem sapwood for actively growing and senescing black locust trees (n = 18 trees per growth status). For senescing trees, the conduit diameter distribution was positively skewed (γ = +0.18); that of actively growing trees was slightly skewed and approached normal distribution (γ = +0.06). The values in (a) are mean conduit diameters.
Forests 15 00116 g003
Figure 4. Relationship between tapering ratio (T) and stem length across actively growing and senescent trees. A wider dotted line is a 95% prediction band, and a narrower line is a 95% confidence band. The regression coefficients are given in Table 2.
Forests 15 00116 g004
Figure 7. The relationship between tree height and soil water content at the study site. Each symbol represents the mean ± SE (standard error) per sample tree site, with the coefficient of determination (R2) shown on the plot.
Forests 15 00116 g007
Table 1. Characteristics of experimental stands and sample trees along the study slope site. Values in brackets are standard errors.
Growth StatusActively GrowingSenescing
Stand IDS1S2S3S4S5S6
Altitude (m)1150103089011201050930
Density (tree ha−1)230024002400800900700
AL/AS (m2 cm−2)0.130.110.080.070.050.04
Tree samples666666
Mean height of samples (m)8.8 (0.2)9.4 (0.4)11.4 (0.3)8.1 (0.6)9.0 (0.7)11.1 (0.5)
Mean diameter of samples (cm)7.4 (0.3)8.2 (0.4)11.2 (0.3)10.1 (0.6)12.5 (0.4)16.7 (0.5)
Note: Stand S1 and S4 sites are located at the upper slope position; S2 and S5 sites at the middle slope position; and S3 and S6 at the bottom slope position. AL (m2 m−2) is leaf area index; As (cm2) is sapwood area. Altitude was measured with an RTK-GPS receiver (precision of 5 m), and stem diameter was measured with a tape rule. Tree height was measured using an ultrasonic measuring system (Haglöf Sweden AB, Långsele, Sweden). In this study, the height of declining trees refers to the tree height without dieback tree proportion.
Table 2. Regression coefficients (R2) and confidence intervals (CI) of the relationships between tapering ratio (T) and distance from tree top (SL) to the sample position.
95% CI
ModelSlopeInterceptR2SlopeIntercept
All0.2120.1110.750.172–0.2520.074–0.148
Actively growing trees0.2440.0890.890.201–0.2870.049–0.129
Senescing trees0.1750.1360.850.146–0.1980.110–0.172
Note: All regressions are significant (p < 0.0001). Assumptions of distributional normality of residuals for all the models were tested through the Shapiro–Wilk W-test.
Table 4. Variations in log (Dh0) explained by soil moisture content (θv cm3 cm−3).
Explained Variable R2p
Explained variations in Dh0, not taking stem length into account.0.51<0.001
Explained variations in Dh0, taking stem length into account.
(Dh0 -stem length + site residuals)
0.0490.44
Disclaimer/Publisher’s Note: The statements, opinions and data contained in all publications are solely those of the individual author(s) and contributor(s) and not of MDPI and/or the editor(s). MDPI and/or the editor(s) disclaim responsibility for any injury to people or property resulting from any ideas, methods, instructions or products referred to in the content.

