Article

Individual Tree-Level Monitoring of Pest Infestation Combining Airborne Thermal Imagery and Light Detection and Ranging

1
Key Laboratory of Remote Sensing and Geographic Information System of Henan Province, Institute of Geography, Henan Academy of Sciences, Zhengzhou 450052, China
2
State Key Laboratory of Subtropical Silviculture, Zhejiang Agriculture and Forest University, Hangzhou 311300, China
3
Qianyanzhou Ecological Research Station, Key Laboratory of Ecosystem Network Observation and Modeling, Institute of Geographic Sciences and Natural Resources Research, Chinese Academy of Sciences, Beijing 100101, China
4
Key Laboratory for Silviculture and Conservation of Ministry of Education, Beijing Forestry University, Beijing 100083, China
5
China Siwei Surveying and Mapping Technology Co., Ltd., Beijing 100086, China
*
Authors to whom correspondence should be addressed.
Forests 2024, 15(1), 112; https://doi.org/10.3390/f15010112
Submission received: 17 November 2023 / Revised: 16 December 2023 / Accepted: 4 January 2024 / Published: 6 January 2024

Abstract

:
The infestation of pine shoot beetles (Tomicus spp.) in the forests of Southwestern China has inflicted serious ecological damages to the environment, causing significant economic losses. Therefore, accurate and practical approaches to detect pest infestation have become an urgent necessity to mitigate these harmful consequences. In this study, we explored the efficiency of thermal infrared (TIR) technology in capturing changes in canopy surface temperature (CST) and monitoring forest health at the scale of individual tree crowns. We combined data collected from TIR imagery and light detection and ranging (LiDAR) using unmanned airborne vehicles (UAVs) to estimate the shoot damage ratio (SDR), which is a representative parameter of the damage degree caused by forest infestation. We compared multiple machine learning methods for data analysis, including random forest (RF), partial least squares regression (PLSR), and support vector machine (SVM), to determine the optimal regression model for assessing SDR at the crown scale. Our findings showed that a combination of LiDAR metrics and CST presents the highest accuracy in estimating SDR using the RF model (R2 = 0.7914, RMSE = 15.5685). Our method enables the accurate remote monitoring of forest health and is expected to provide a novel approach for controlling pest infestation, minimizing the associated damages caused.

1. Introduction

Over the past twenty years, pest infestation by Tomicus spp. has caused significant economic and ecological damages in over 1.5 million hectares of Yunnan pine forests in Southwestern China [1,2]. Additionally, forest pests can heavily impact forest carbon sequestration and sustainable forest management [3,4]. The fast-spread characteristic of pest infestation severely threatens forest health status, thereby decreasing their vitality and carbon sequestration over large areas. Moreover, changes in climatic conditions, which have decreased forest resistance, have intensified outbreak opportunities for pest infestation [5,6]. The commonly used artificial ground survey exhibits great limitations and high costs for detecting pest infestation in a large region [7]. Therefore, the rapid and accurate assessment of pest stress in forests should be optimized to minimize and control the subsequent damage.
High-resolution remote sensing technologies, such as satellites and unmanned airborne vehicle (UAV)-based imagery, provide researchers with data that reflect the appearance and spread of forest pests quickly and objectively [8]. Several parameters have been used so far to monitor the degree of pest infestation using optical remote sensors, such as vegetation indices [9,10], spectral characteristics [11,12], and time series approaches [13,14]. However, these methods have limited application at the early stages for “green attack” due to invisible color changes of the needles. The Tomicus spp. pest infestation can be divided into two stages depending on the beetles’ life cycle, i.e., the shoot attack and trunk attack [9,10]. During the shoot attack that occurs from May to November, adult beetles feed the healthy shoots until they become sexually mature. The foliage color has an invisible change (green attack) during the first weeks. As time passes, the discoloration of the foliage occurs due to the decrease in water and nutrients, of which transportation was hindered by infestation, rendering them inaccessible [15]. The trunk attack starts from November, where the beetles lay thousands of eggs under the bark, and larva burrow into phloem for nutrients. At this stage, the destruction of phloem disrupts the transport of water and nutrients from the roots to canopy, ultimately resulting in tree death with red and gray crowns [16,17]. In the following May, a large number of adult beetles move on to the shoots of another host trees, which poses a great challenge for controlling pest infestation [18]. Because of the complexity of woodborers’ life cycles, the uncertainty and accuracy for detecting pest infestation has increased [19]. Therefore, timely detection of pest infestation during green attacks in a large area can provide effective pest management strategies for forest managers.
Although the red and gray crowns can be identified distinctly using spectral information acquired from optical imagery, it is too late by then to remove the infested trees for controlling the infestation spread [20]. However, due to the disruption of water transport tissues caused by pest boring, the water content of needles undergoes significant change during the green attack. The disturbance of water content affects the temperature through leaf evapotranspiration, which induces small but detectable changes probed by thermal infrared (TIR) remote sensing. Consequently, it is necessary to mine new remote sensing sources like TIR imagery for detecting pest infestation at the early stages [21,22].
TIR imagery is also sensitive to changes in the canopy surface temperature (CST), resulting from the energy transfer and exchange between the leaves and the atmosphere. Monitoring CST changes helps unveil the stress response of vegetation to environmental factors, such as drought [23], disease [24], and pest infestation [25,26,27]. UAVs equipped with thermal cameras enable the acquisition of high-resolution TIR images and subsequently describe the relationship between CST and evaporation in plant Eco physiological research [28]. Therefore, researchers can quantify the connection between CST and tree health and elucidate the response mechanism of the canopy water cycle to pest stress [24,29]. Woodborers destroy the water budget by boring into the trunk and shoots, heavily impacting the water cycle by temporarily or permanently decreasing the canopy’s water content. CST fluctuations associated with water content and evaporation changes can be detected by TIR imagery during green attack [30,31]. However, due to the complex structure and irregular shape of forest canopies, the CST is heavily affected by environmental factors and the physiological parameters of vegetation, degrading the appropriate accuracy of CST acquisition from TIR images [23]. Furthermore, the coarser resolution of TIR imagery compared to that of multispectral and hyperspectral imagery can result in mixed radiation from tree crowns and the ground. This aspect adds additional difficulties for accessing CST using the TIR method and reduces its accuracy relative to multispectral and hyperspectral methods [32].
Light detection and ranging (LiDAR) data provide detailed structural traits of tree canopies with dense cloud points to obtain the spatial distribution of needles [1,33,34]. The laser return intensity is useful for measuring the near infrared reflection trait of needles in a canopy, which is closely related to its water content [35], presenting a novel method for monitoring and mapping forest infestation [36,37]. Despite its high detection potential, only a few studies have explored the potential of LiDAR for measuring pest infestation of coniferous forests at the crown scale [38,39]. Although the three-dimensional (3D) structures of forest crowns can be accurately measured by LiDAR to map crown traits, such as leaf area index and crown shape, it remains challenging to use LiDAR intensity for measuring the biochemical parameters of leaves [40]. Therefore, a combination of LiDAR and TIR data is an interesting route to explore in terms of assessing forest pest infestation at the crown scale.
Several studies have used multi-source remote sensing data for extracting crown traits and quantifying damage degree caused by forest infestation [30,41]. Mostly, random forest (RF), partial least squares regression (PLSR), support vector machine (SVM), and deep learning algorithms have been used to study the relationship between damage degrees and spectral characteristics from UAV-based high-resolution multispectral or hyperspectral images for evaluating infestation in large areas [42,43,44]. However, the current literature has scarcely explored the efficiency of combining UAV-based TIR imaging data with other sensors to analyze infestation in the Yunnan pine forests.
In this study, we investigated the potential of integrating UAV-based TIR and LiDAR data to detect the shoot damage ratio (SDR) for the Yunnan pine forest at the individual tree level. We used SDR to assess the proportion of damaged shoot and the severity of canopy damage caused by beetle attacks at the crown level [1,27]. We generated the characteristic traits of crowns from LiDAR, TIR, and field measurements data. Furthermore, we used machine learning algorithms, such as RF, SVM, and PLSR, to assess the severity of crown damage. Our approach aims to improve the monitoring accuracy of beetle attack to individual Yunnan pine crowns.

2. Materials and Methods

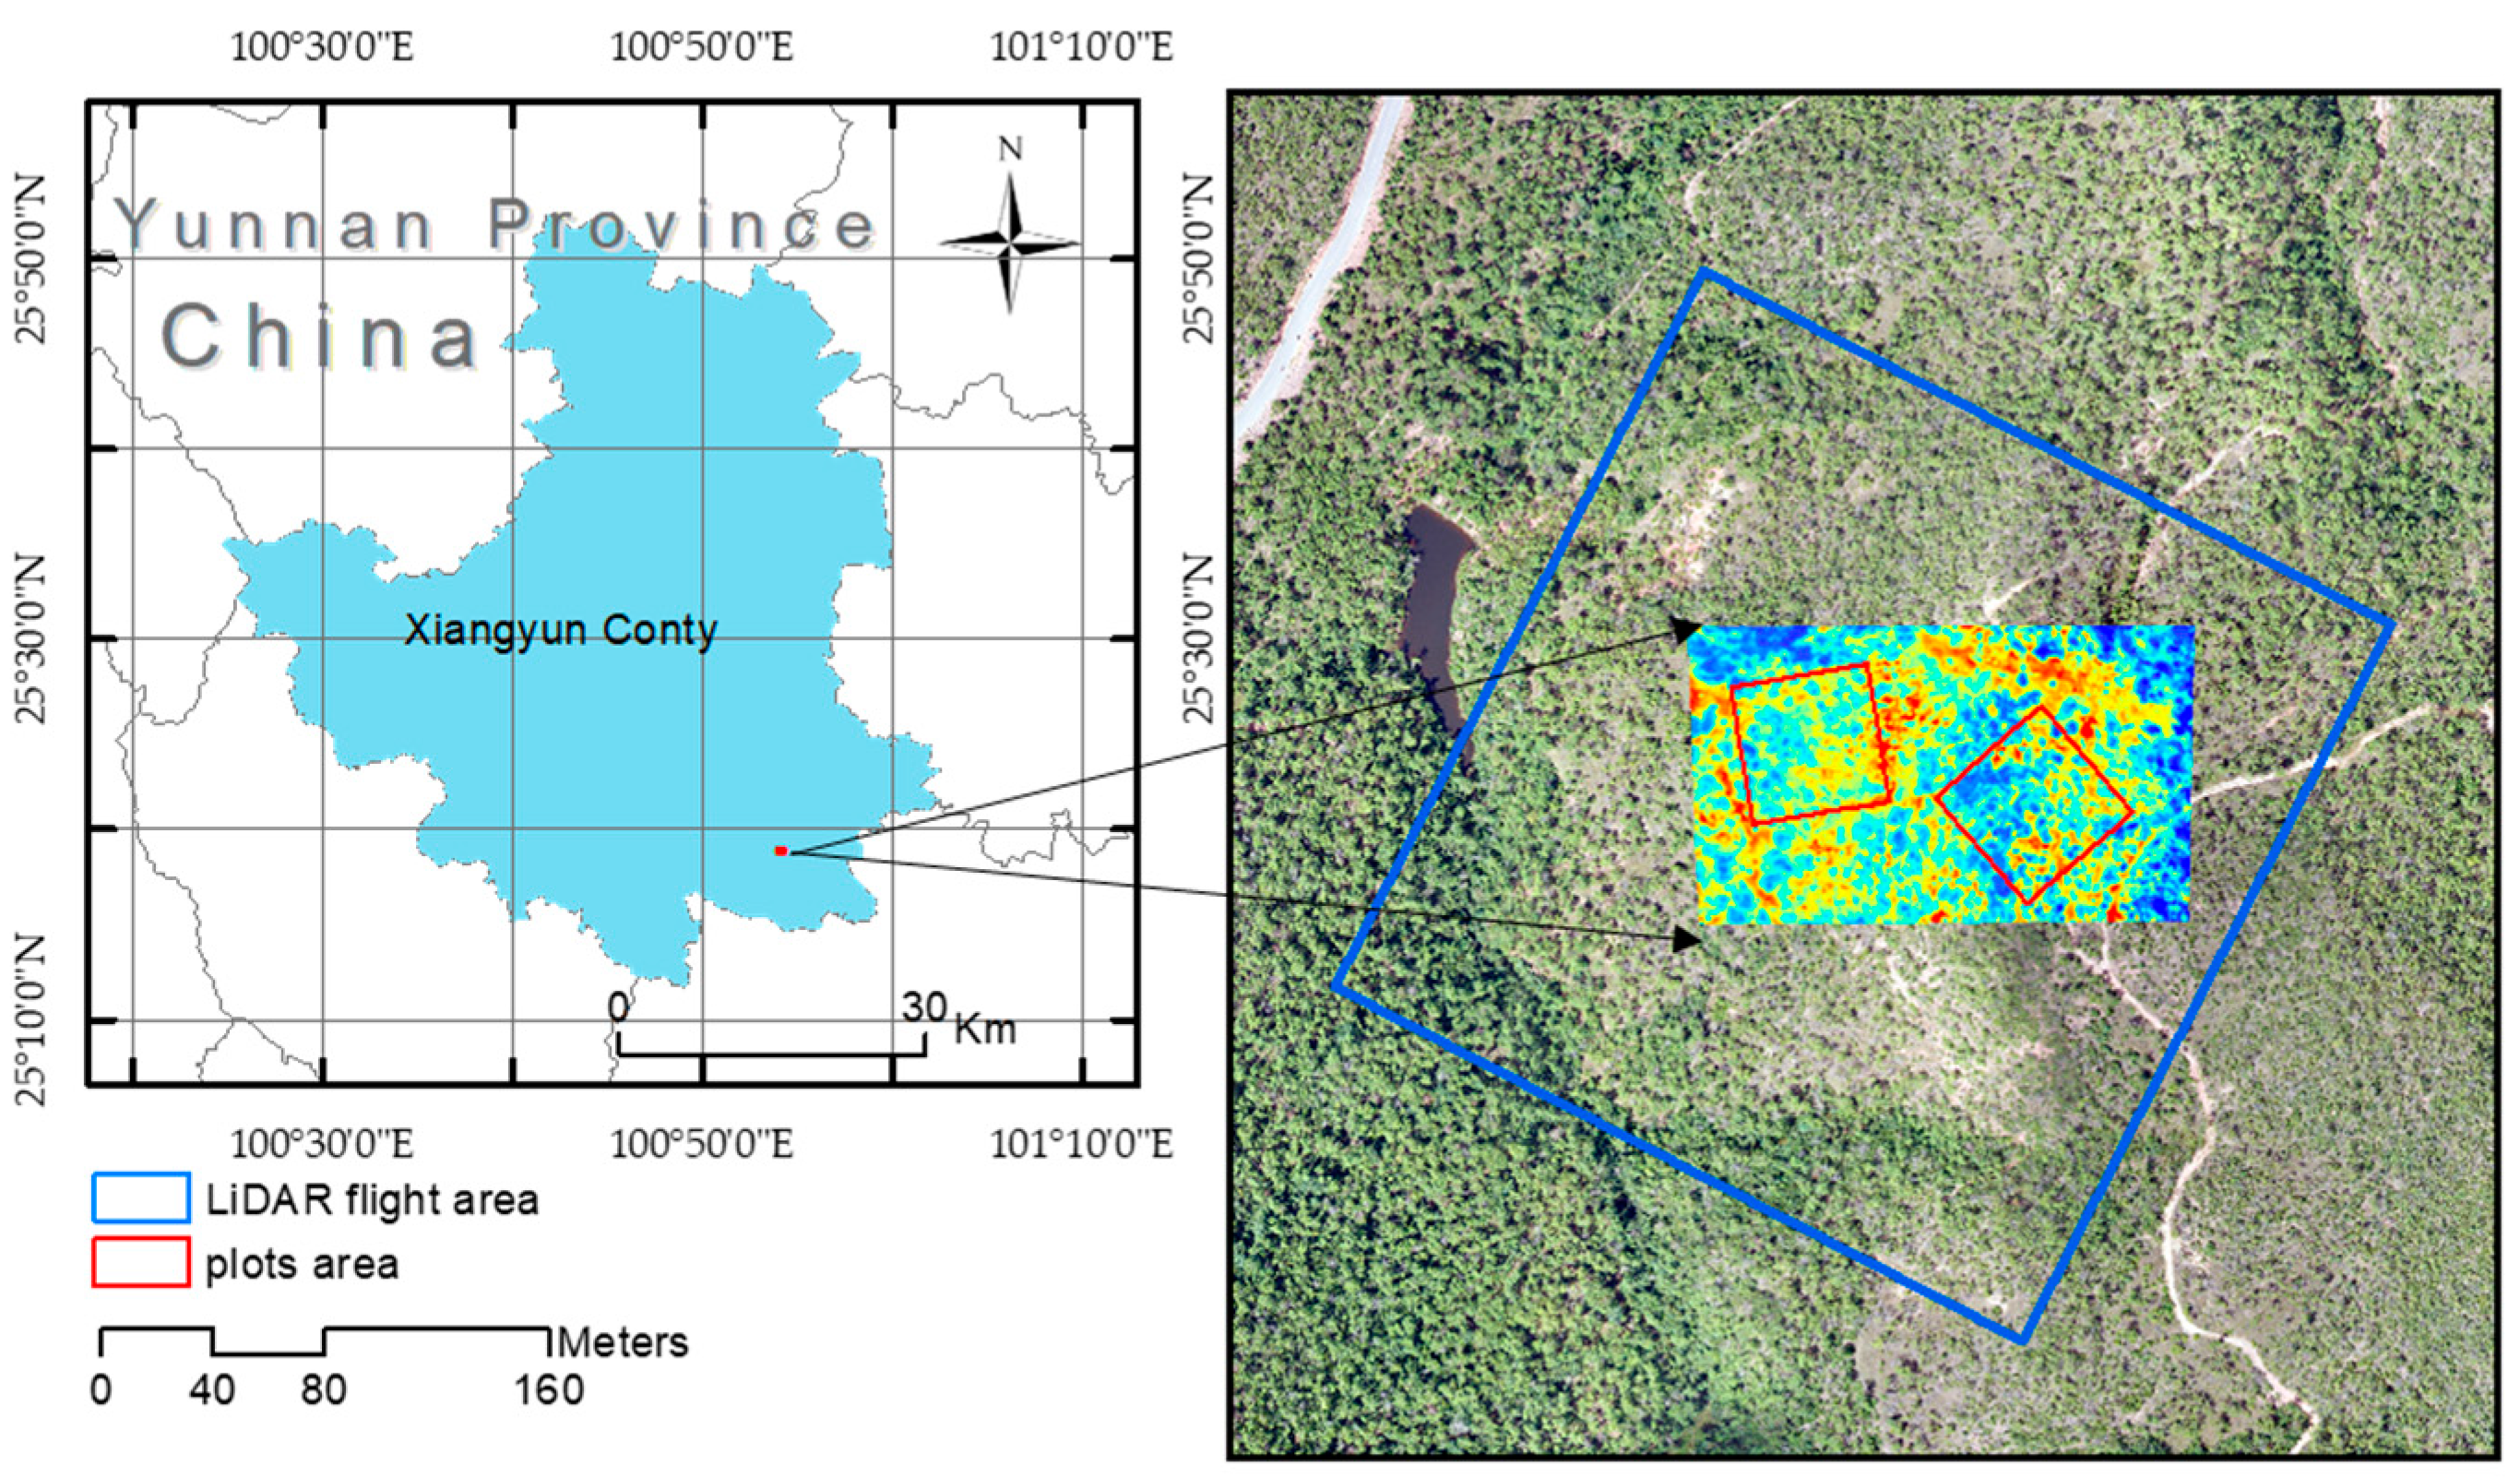
2.1. Study Sites and Field Measurements

The study sites are located at the Tianfeng Mountain in Yunnan Province, China, at an altitude between 1720 m and 2570 m. The annual average temperature in this area is 14.2 °C, and the annual precipitation is 783.7 mm. The area is dominantly covered by Yunnan pines (approximately 1000 ha); however, continuous drought has favored Tomicus spp. Infestations, causing death to a large numbers of Yunnan pine trees [2,27]. We designated two field plots (size: 50 m × 50 m) to represent the average damage severity of the surrounding forest (Figure 1).
We measured tree parameters for each tree in the plots, including height (H), diameter at breast height (DBH), crown diameter (CD), and SDR (DBH > 4 cm). We used SDR, which corresponds to the number of damaged shoots divided by the total shoots for each crown, as an indicator of the damage degree caused by infestation in the Yunnan pine trees [9]. We manually counted the number of dead shoots for each tree crown and estimated the total number of shoots of each crown from the selected branches (approximately 3–6) at the lower, middle, and upper layers of the canopy. Table 1 summarizes the tree parameters collected from the two plots.

2.2. UAV-Based Images Acquisition and Processing

2.2.1. Thermal Imagery and Correction

We used a thermal sensor (TAU2, FLIR, Wilsonville, OR, USA) implemented into a fixed-wing UAV for thermal imagery, and wavelengths ranged from 7.5 μm to 13.5 μm. We set the UAV flight altitude for imaging to 280 m, with 60% side overlap and 80% forward overlap, resulting in an image resolution equal to 0.23 m (Figure 2). To calibrate the thermal radiation values measured with the FLIR TAU2 sensor, we measured the temperature of four ground features (tile, polyvinyl chloride board, wood, and asphalt road) with known emissivity using a thermal infrared imager (T-420, FLIR, USA). Furthermore, the locations of the features were measured using a real-time kinematic (RTK) device (HI-TARGET A8 GNSS) with an accuracy of ±2.5 mm. The temperature and digital number (DN) of the four features whose positions matched each other were used to establish a linear regression equation that we used to convert the digital number (DN) values of the whole TIR image into brightness temperature, as described in our previous study [27].

2.2.2. LiDAR Data Acquisition

We used a LiAir 200 UAV-mounted system (GreenVlley Inc., Beijing, China) equipped with a 40-channel Pandar40 laser sensor, operating at a 10 Hz scan frequency and 10° scan angle. The sensors were flown at an altitude of 70 m, and the overall point density ranged between 200 and 1000 points per m2. The projection and geographical coordinate systems of the point cloud were established by World Geodetic System (WGS) 84 and Universal Transverse Mercator (UTM) 50 N, respectively. We preprocessed the LiDAR data to distinguish between ground and above-ground points, using the Lidar360 5.2.2 software package (GreenVlley Inc., Beijing, China). Consequently, we generated two models, namely the digital elevation model (DEM) and the canopy height model (CHM), from the classified cloud with a 0.5 m resolution. These models were used to register TIR images together with ground control points measured by the RTK device.

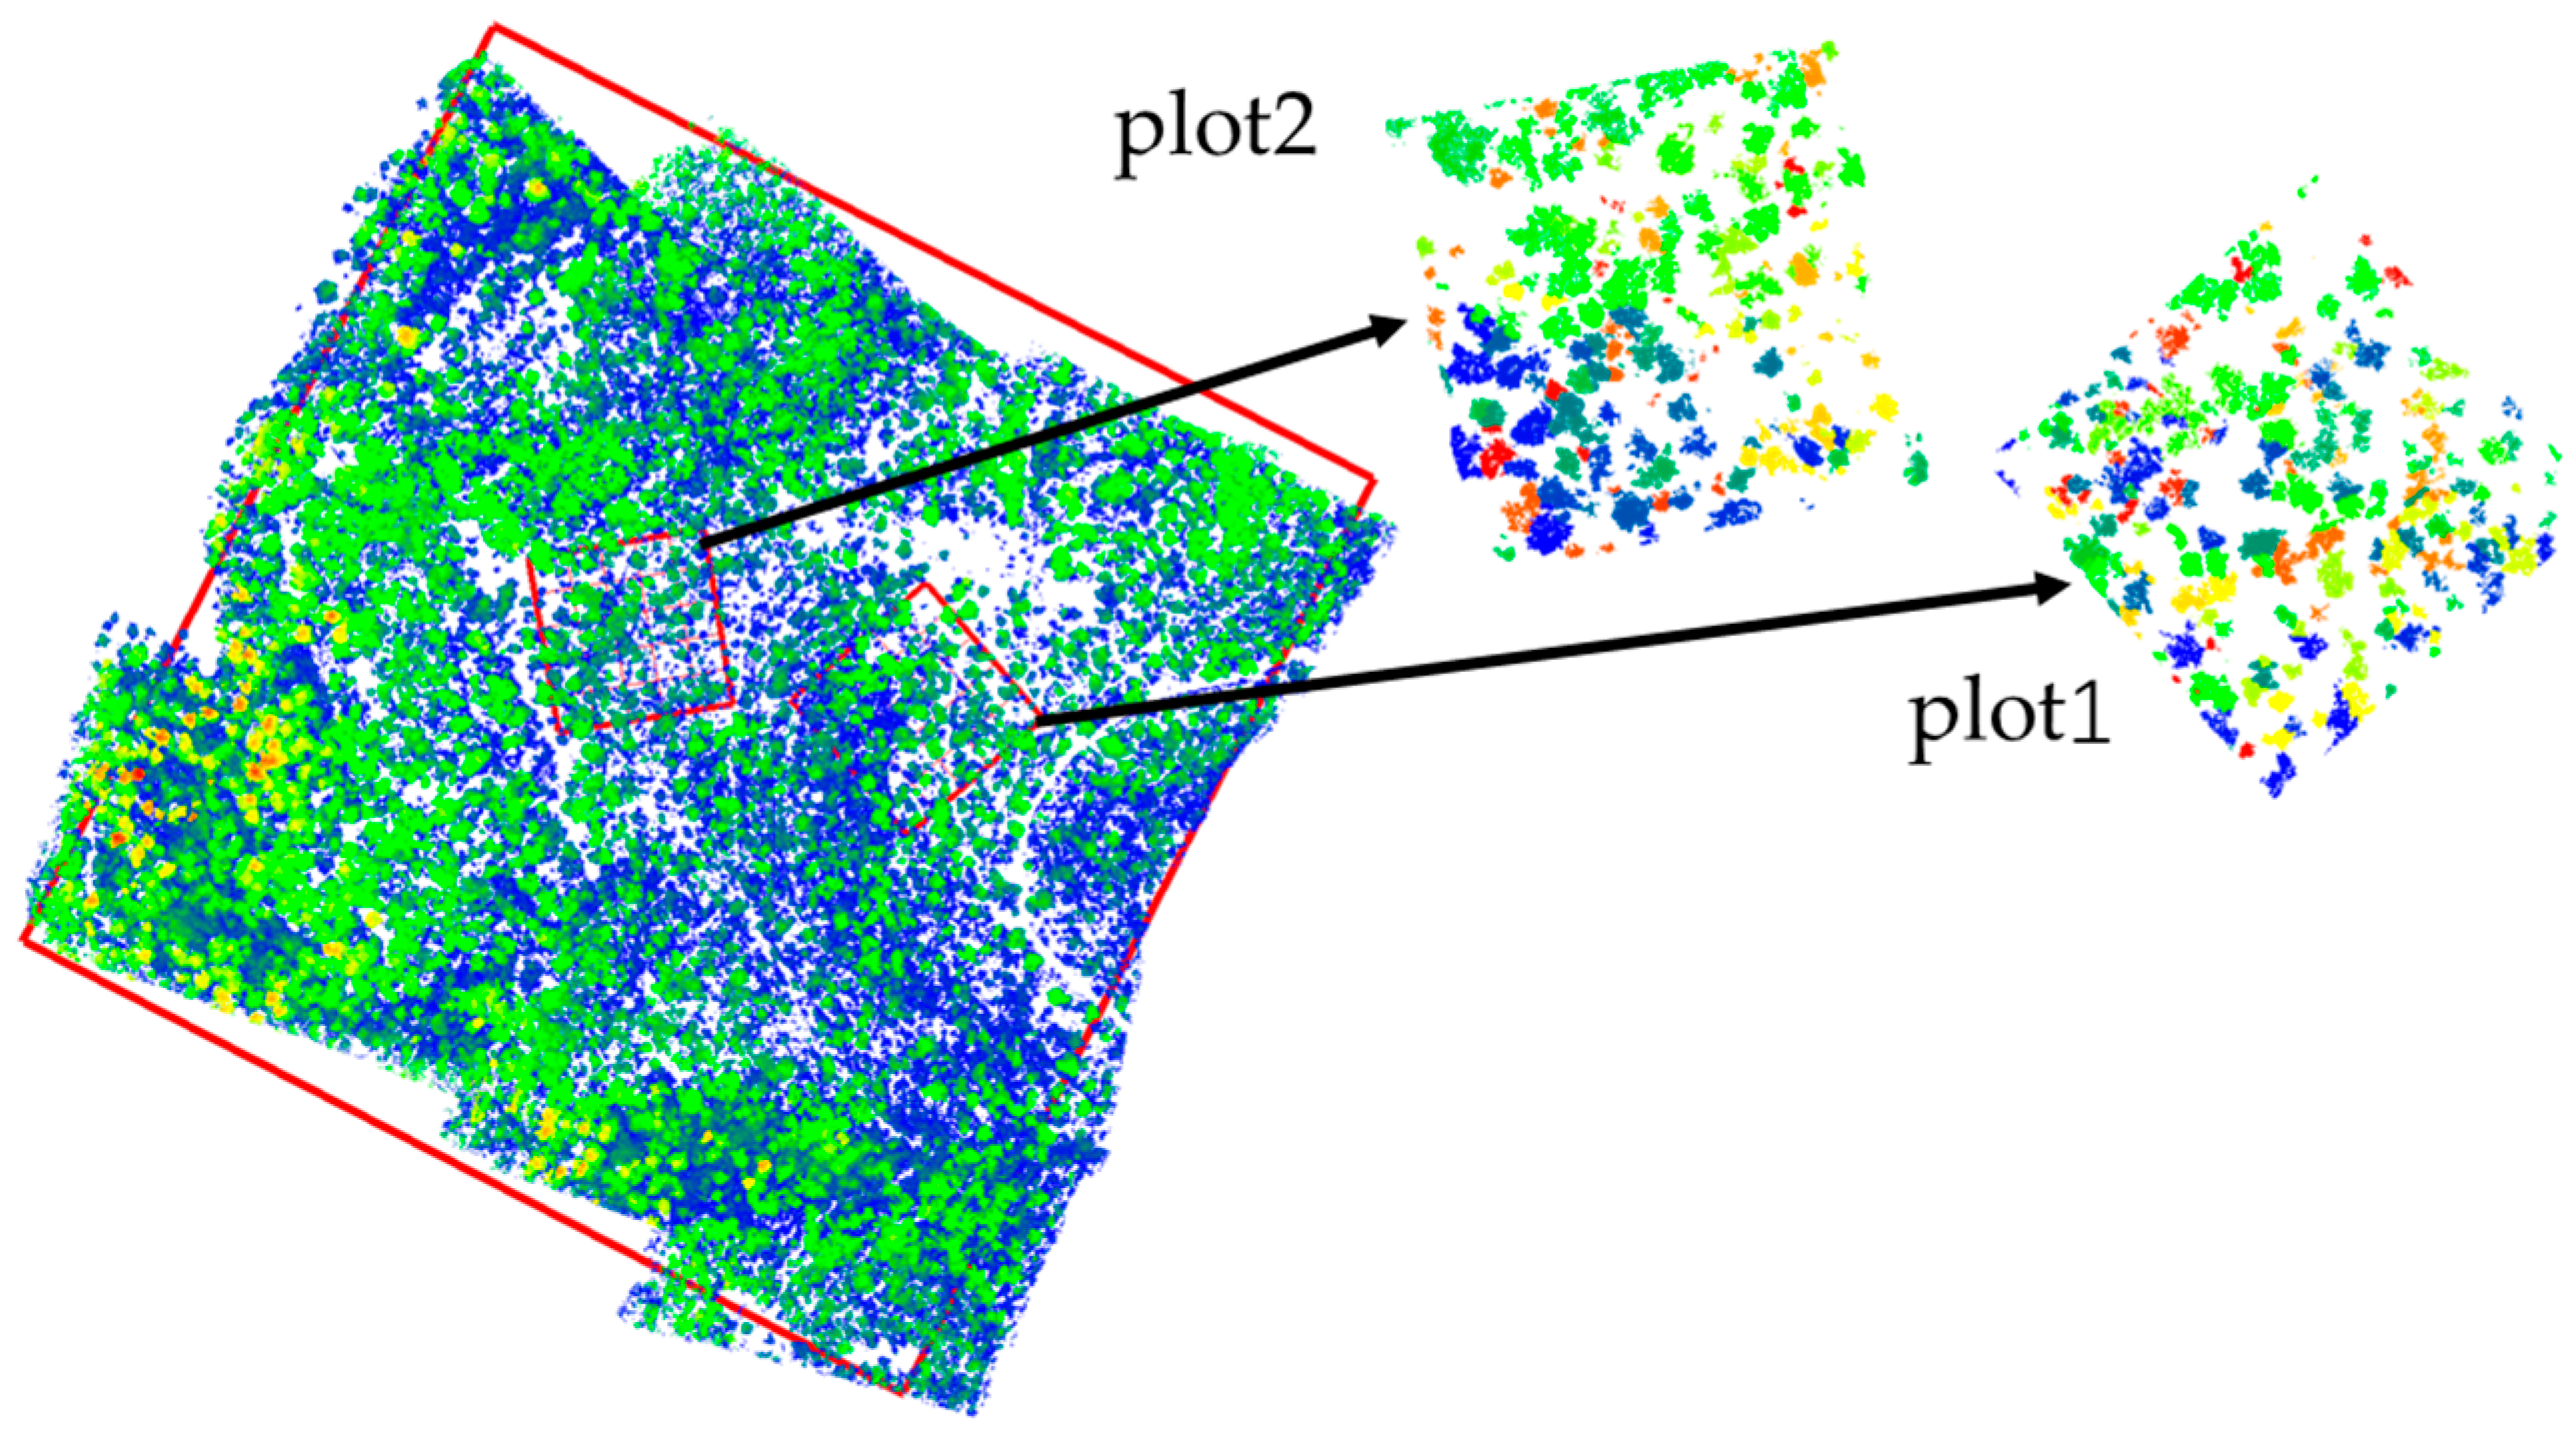
2.2.3. Individual Tree Crown Segmentation from LiDAR Point Clouds

Due to the coarse resolution (0.23 m) of the TIR image, it was difficult to define distinguishable crown boundaries. Therefore, we used the LiDAR point clouds to extract the individual tree crowns separated by the point cloud segmentation (PCS) algorithm embedded in the Lidar360 software with default parameters (Figure 3). Before point cloud segmentation, the LiDAR data were processed by denoising, filtering, ground point classification, DEM, and digital surface model (DSM) in Lidar360 software. The elevation of point cloud data were normalized by DEM. The CHM was generated from DEM and DSM, which was used to derive seed points with a watershed algorithm. Subsequently, the seed points and the normalized LiDAR point data were imported into Lidar360 software for individual tree segmentation used by PCS algorithm. In Lidar360 software, the seed points could be edited manually to improve the accuracy of tree segmentation. Following the segmentation of all trees, the crown boundary, height, and crown volume were generated from individual tree point clouds. The LiDAR segmentation results are shown in Table A1.

2.3. Features Extraction

2.3.1. Canopy Temperature Extraction

Following the correspondence between CHM and TIR data with high-resolution UAV-based RGB images, we extracted the canopy temperature through the seed points from the LiDAR data segmentation results. We treated seed points as the central points of the canopies and considered the values of adjacent pixels using bilinear interpolation. Moreover, we also used the canopy boundaries produced from LiDAR data to extract another temperature. After comparing the temperature accuracy of the two methods, we selected the canopy temperature dataset with the lowest error or external influence for the subsequent SDR analysis. We used a Phantom4 RTK UAV (DJI, Shenzhen, China) to capture high-resolution RGB images, which were then used to identify the coordinates of TIR and LiDAR data (Figure 4).

2.3.2. LiDAR Metrics Extraction

LiDAR metrics contain geometric (height, crown shape, and gap fraction) and radiometric (laser return intensity) data [1]. Following individual tree segmentation, we filtered the segmentation with tree height above 4 m; then, we divided the crown into eight directions and gridded its vertical profiles of each direction with 1 m resolution. The 30 LiDAR metrics (Table A2) containing the structure and intensity information of tree canopies were generated from point cloud data using the MATLAB 2016b software (MathWorks Inc., Natick, MA, USA). The 8-segmenting method and formulas of those metrics were thoroughly described in a previous report [45]. The information metrics contained crown volume, crown density, gap fraction, and the mean coefficient of variation, standard deviation of first return intensity, nth (25th, 50th, and 75th) percentile, and cumulative percentile of laser return intensity of tree crowns with a height above 0.5 m. Then, we applied machine learning algorithms to select characteristic variables, as described below.

2.4. Features Selection and Prediction Model for SDR

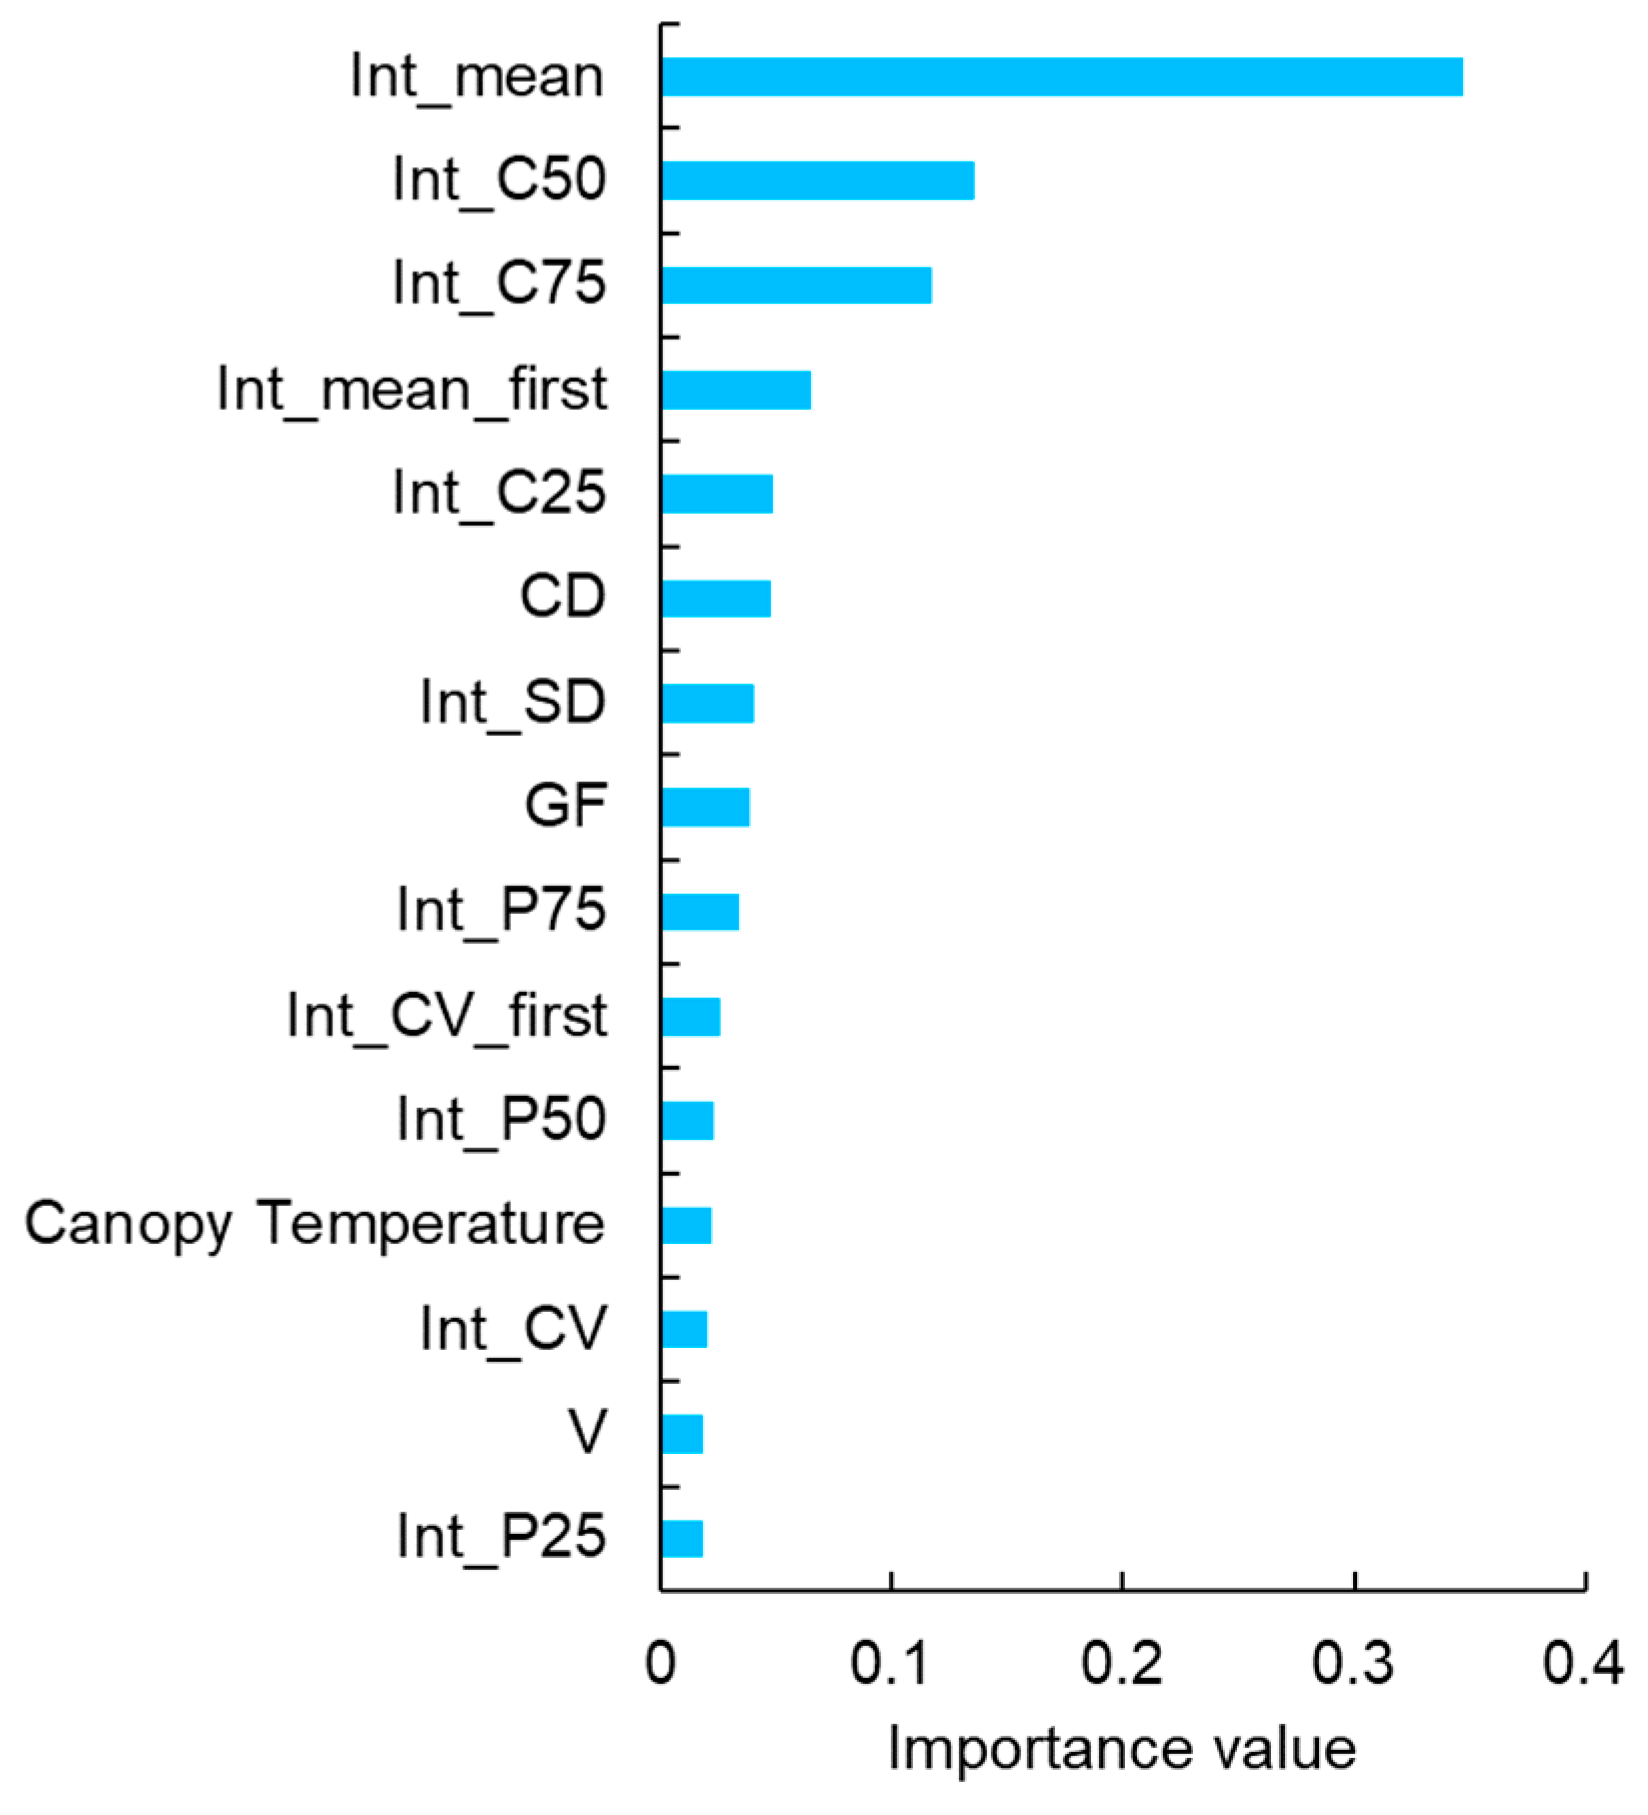
2.4.1. Important Features Selection

To establish an efficient regression model for predicting the SDR of the trees, the 30 variables in LiDAR metrics needed to be filtered so as to extract their important features. Consequently, we jointly applied the RF and PLSR regression models to select important variables, while ensuring variable importance measures (VIM). In the RF algorithm, the mean decrease accuracy (MDA) index of each predictor variable was calculated during the out-of-bag (OOB) error calculation [46] (Figure A2). In the PLSR algorithm, the variable importance scores (VIPs) were produced to provide insights into the usefulness of each individual variable in predicting SDR [47] (Figure A1). Subsequently, by intersecting the common predictor variables with the higher contribution on SDR estimation both in RF and PLSR algorithms (more than 90% cumulative explanation), we determined 14 LiDAR metrics as important features for SDR prediction, shown in Table A3.

2.4.2. Prediction Model

To select the most efficient regression model in our case, we compared the predictive capabilities of commonly used machine learning algorithms for predicting SDR at the individual tree level, such as RF, PLSR, and SVM models. The RF model is an ensemble learning algorithm that involves the bagging of regression trees [48]. The SVM regression model is a typical branch of generalized linear regression model, which was adopted with a linear kernel in the present study [49]. Since both models have low susceptibility to over-fitting, it is preferable to reduce the dimension of features in the case of a high predictor variable to sample ratio. In contrast, the PLSR model reduces collinear variables associated with remote sensing metrics to a few non-correlated latent variables or factors [50]. These latent variables contain maximum LiDAR information in the dataset, increasing the explanatory power of the prediction. We applied the aforementioned three regression models using a Python-based machine learning method encapsulated in the Scikit-learn module.
We randomly divided the dataset into 70% training data (n = 217) and 30% test data (n = 94), which were then used for validating the performance of the model. The 70/30 training to test data proportion is recommended in the literature as it provides more weight to model building [51]. Finally, we inputted the important variables (selected by the RF and PLSR models) into the three regression models (RF, SVM, and PLSR) to derive the determination coefficient (R2) and root mean squared error (RMSE). These parameters were used to assess the highest prediction performance of the models.

3. Results

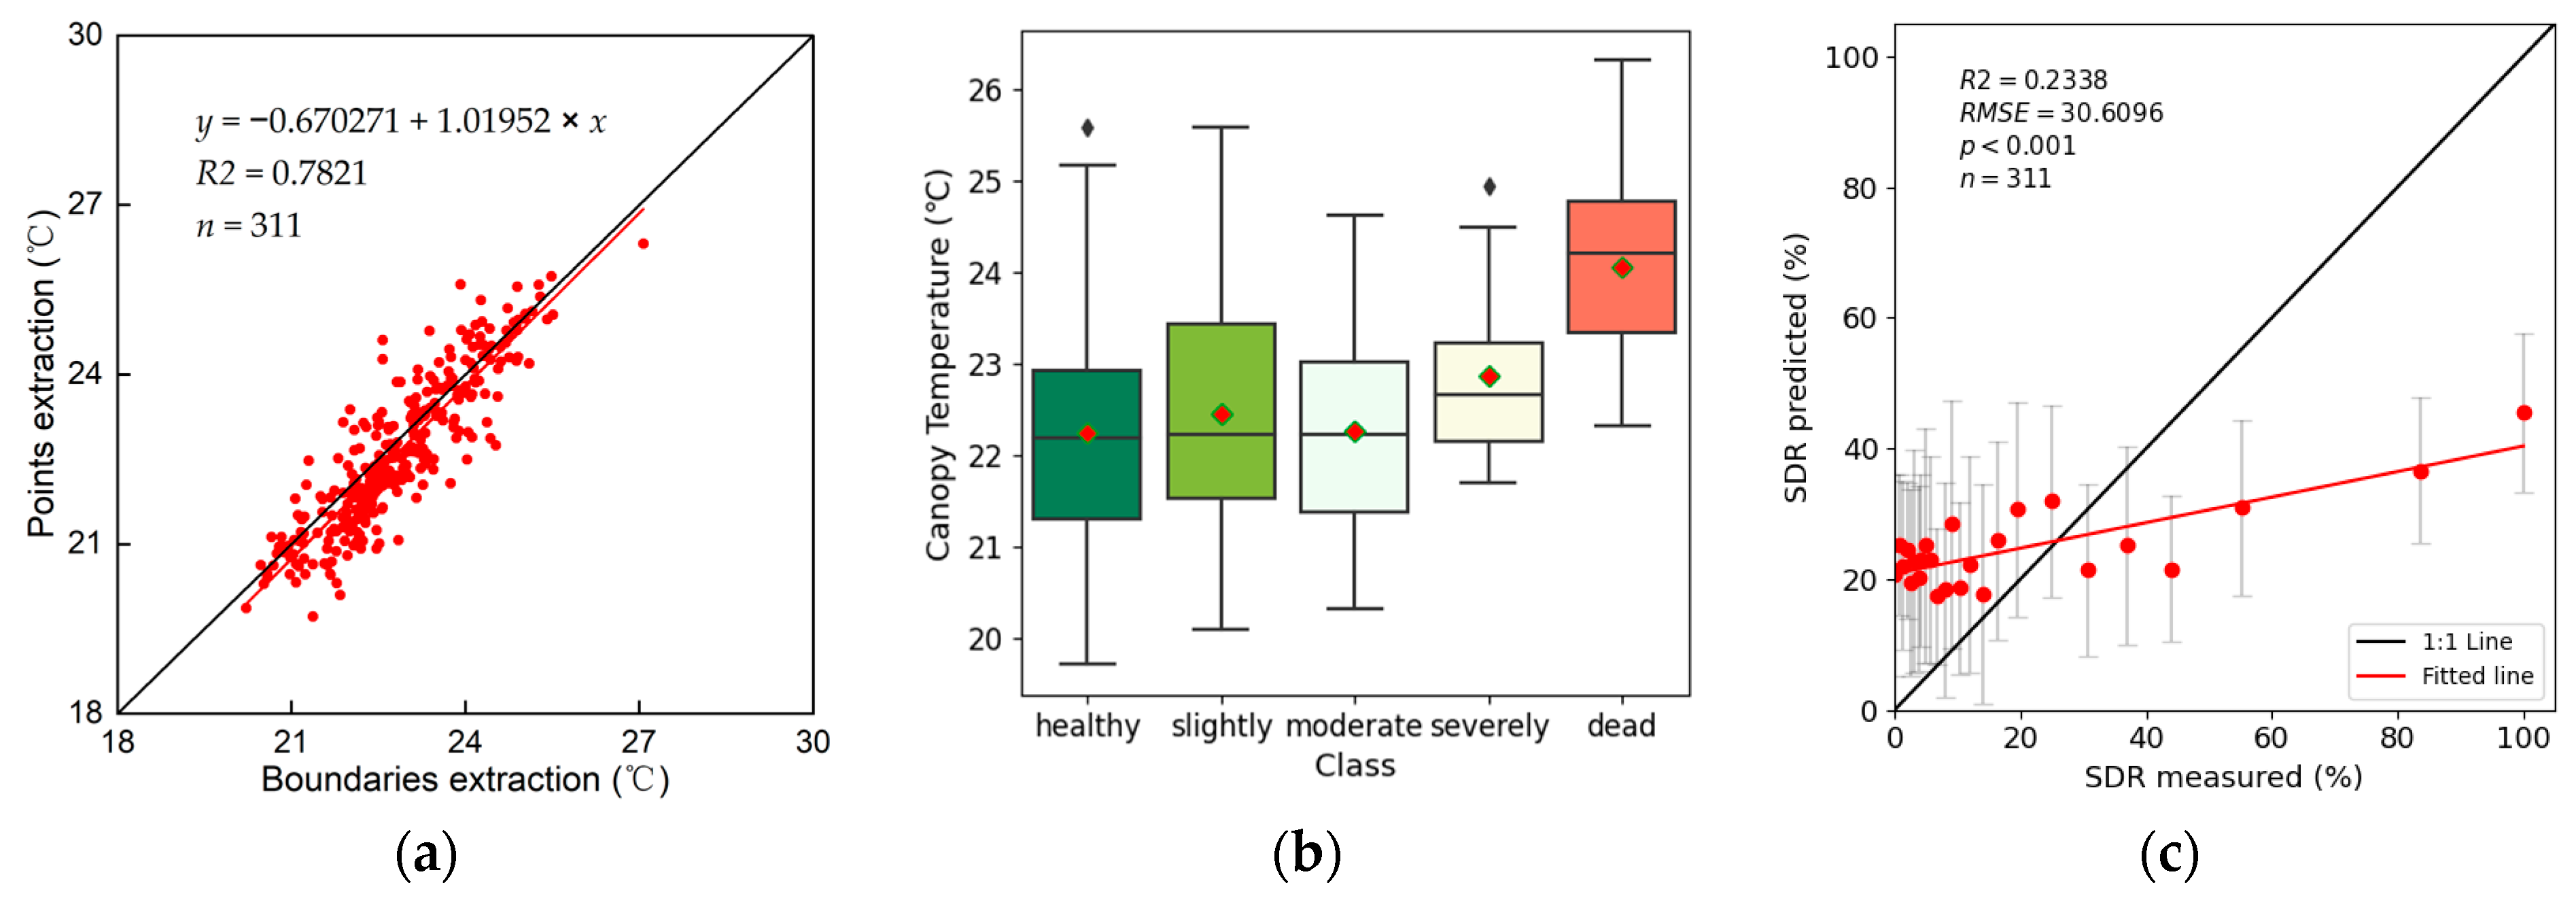
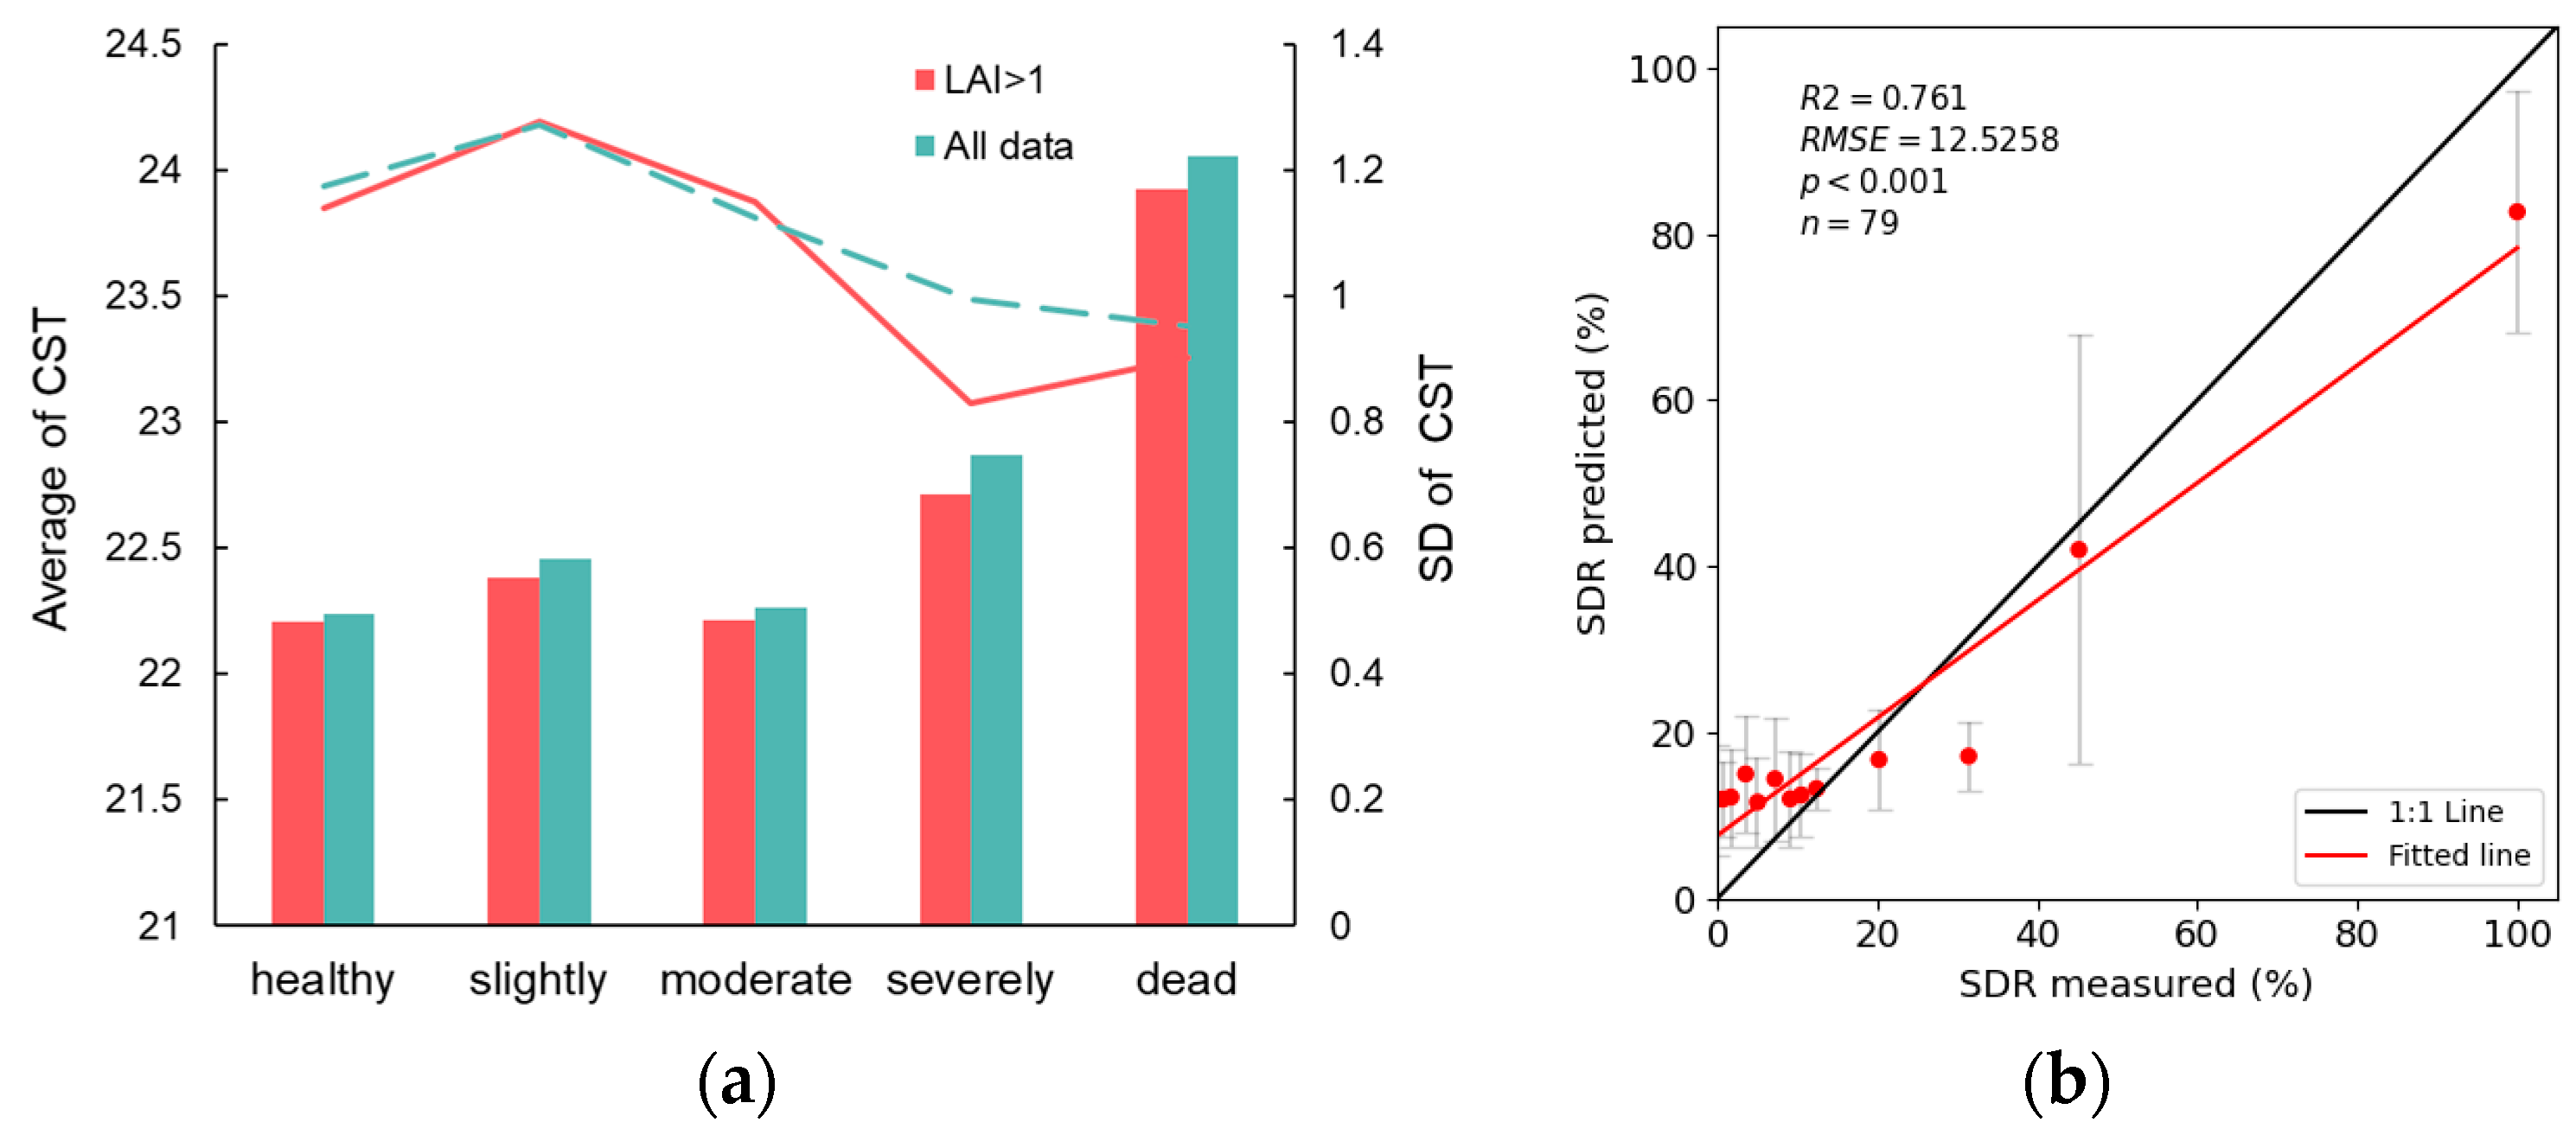
3.1. Canopy Temperature Extraction and Statistics with Different SDR Ranges

The canopy temperature of the individual tree crown was extracted to analyze the characteristic with different damage degrees. The seed points and canopy boundaries generated from LiDAR data were used to extract CST. Figure 5a shows that both approaches exhibited the same level of accuracy. Therefore, we selected the CST extraction using seed points as the canopy temperature data for the SDR analysis.
The SDR dataset was classified into five levels: healthy (0%–10%), slightly (10%–30%), moderate (30%–50%), severely (50%–80%), and dead (80%–100%). The results showed that CST increased with SDR. Healthy trees had the lowest CST owing to the normal evapotranspiration of healthy needles, whereas dead trees had the highest CST values. Due to the fact that the slightly and moderate trees still had healthy shoots with evapotranspiration, the CST of these crowns was lower than severely damaged and dead trees. The severely trees had a higher SDR with a higher proportion of dead shoots in the tree crown, inducing a higher canopy temperature. The simple use of canopy temperature for all samples revealed a relatively weak relationship between SDR and CST, with an underestimated tree crown SDR (R2 = 0.2338, RMSE = 30.6096, n = 311). These observations indicate the challenging difficulties in using TIR remote sensing alone to monitor SDR in coniferous forests. Moreover, the CST of tree crowns extracted from TIR shows high uncertainty levels due to the relative coarse resolution of TIR images.

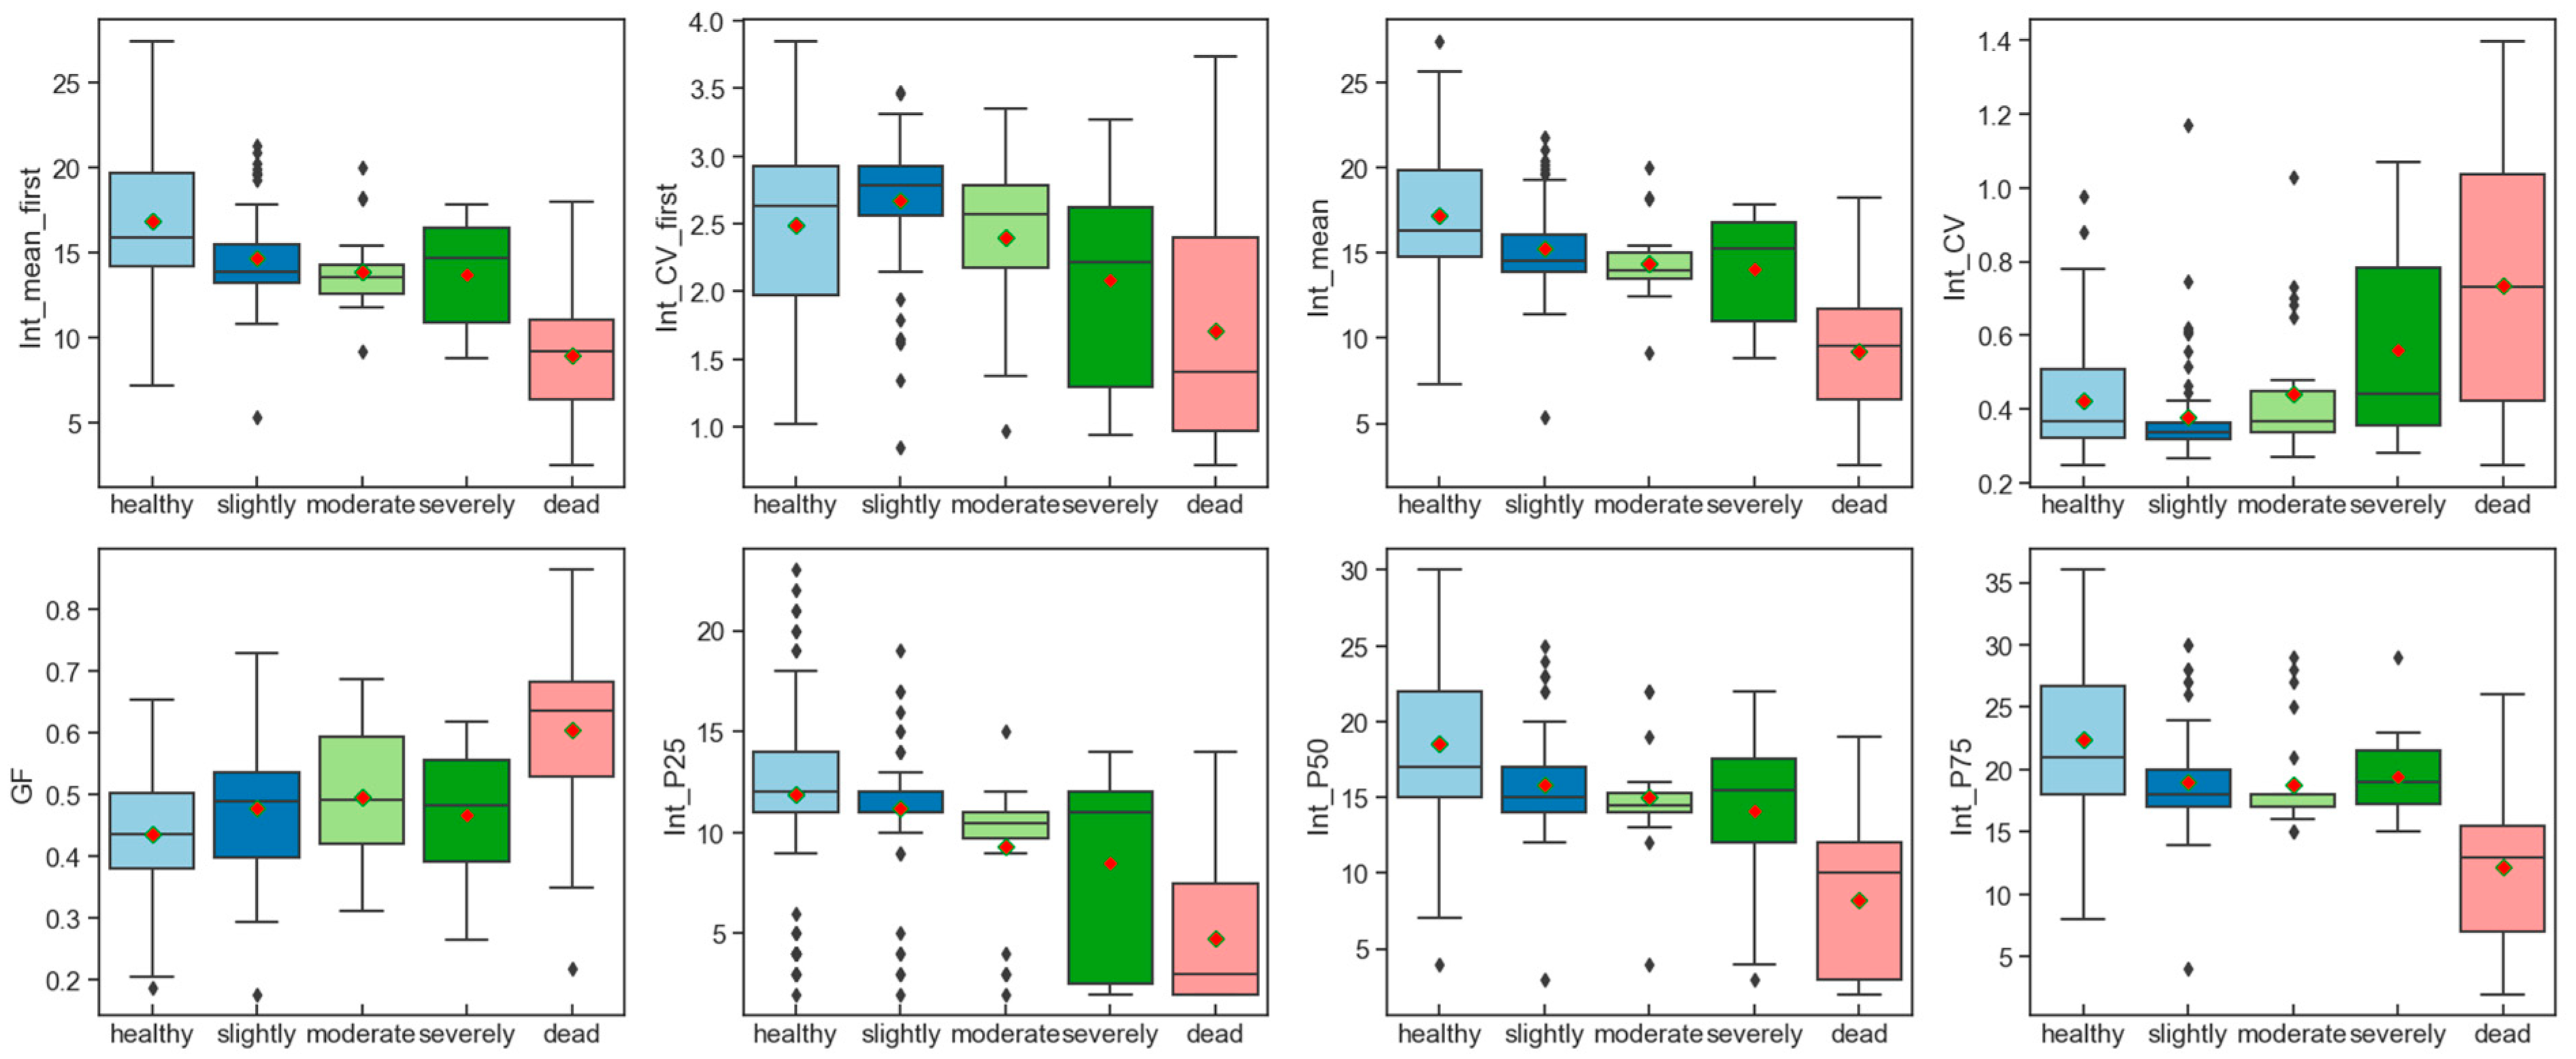
3.2. Statistics of Important Features from LiDAR Metrics with Different SDR Ranges

The significant characteristic variables (14 LiDAR metrics) were selected from LiDAR data to analyze their relationship with SDR, depending on its classification, as shown in Figure 6. The results showed that the crown return intensity at different heights (Int_P25, Int_P50, and Int_P75) decreased with increasing SDR. Similarly, the mean of crown return intensity (Int_mean) and first return intensity (Int_mean_first) decreased with increasing SDR. However, the gap fraction (GF) and the coefficient of variation of crown return intensity (Int_CV) and first return intensity (Int_cv_first) demonstrated an increasing trend with SDR. The intensity value recorded by the LiDAR sensor is a function of the reflectance in the near infrared band, which is insensitive to biochemical characteristics, such as chlorophyll and leaf water content [52]. The decrease in the canopy intensity is associated with the death of a large number of needles, resulting in an increase in the canopy’s SDR and a decrease in its water content. Similarly, the structural parameters of the tree canopy (i.e., leaf index area and GF) decreased with increasing degrees of damage, causing a large number of needles to fall from the canopy. As a result, the coefficient of variation of intensity increased as the number of needles decreased in the canopy.

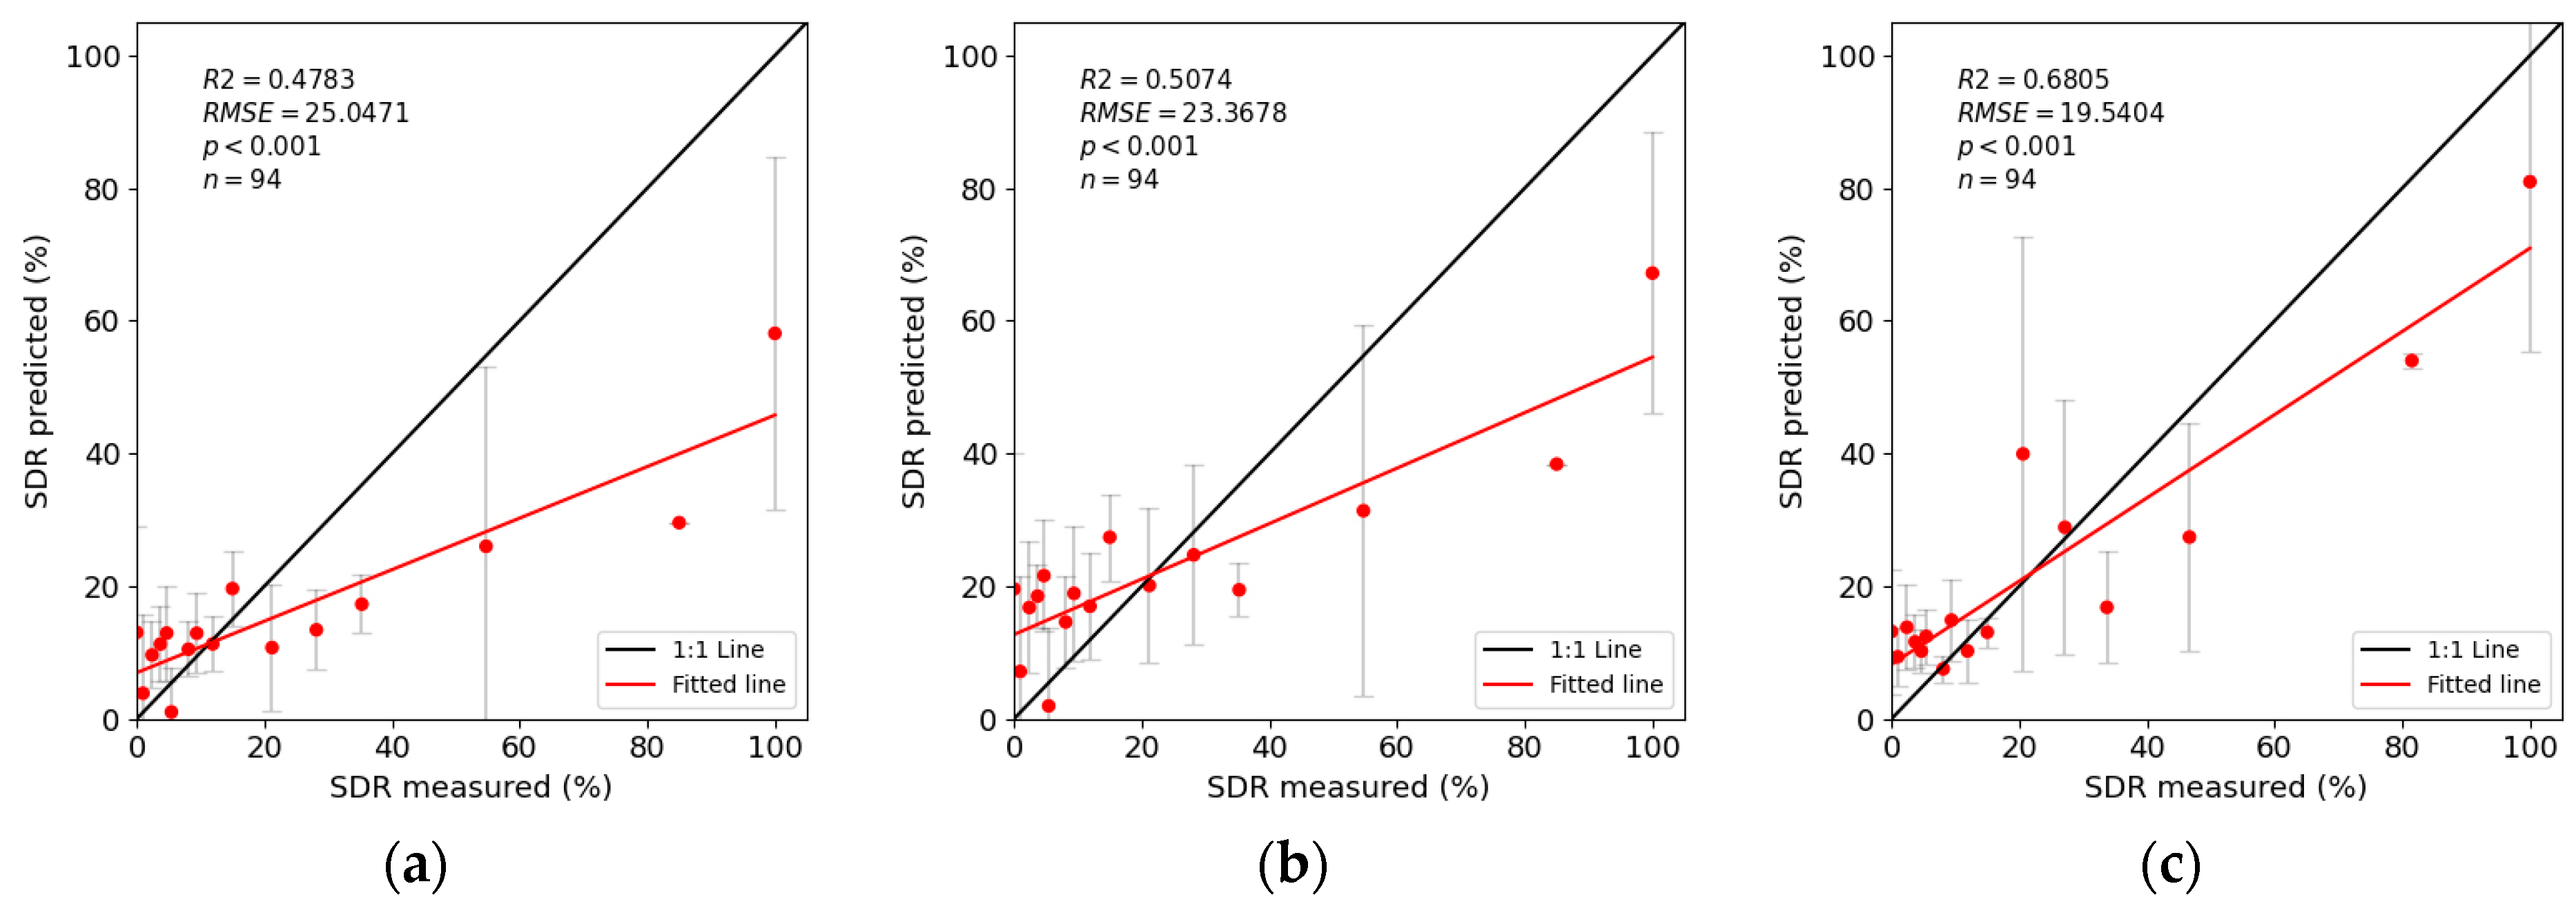
3.3. Prediction Models to Estimate SDR with LiDAR Metrics

Figure 7 shows a comparison of estimating SDR from LiDAR data using different methods at the individual tree crown level, including the SVM, PLSR, and RF models. To train these models, 70% of the LiDAR data (n = 217) containing 14 parameters were used, while the remaining 30% were used as test data (n = 94) to validate the accuracy of the models. The results showed that the RF model (R2 = 0.6805, RMSE = 19.5404) performed better than the PLSR (R2 = 0.5074, RMSE = 23.3678) and SVM models (R2 = 0.4783, RMSE = 25.0471) in terms of predicting the crown SDR. The RF model demonstrated the best performance of SDR estimation from LiDAR data, with an accuracy of 70% in identifying infested tree crowns in the coniferous forest. Nevertheless, this approach still underestimated the SDR values by 30%, which is considerably large compared to the standard deviation of SDR estimations for the damaged tree crowns (SDR > 40%).

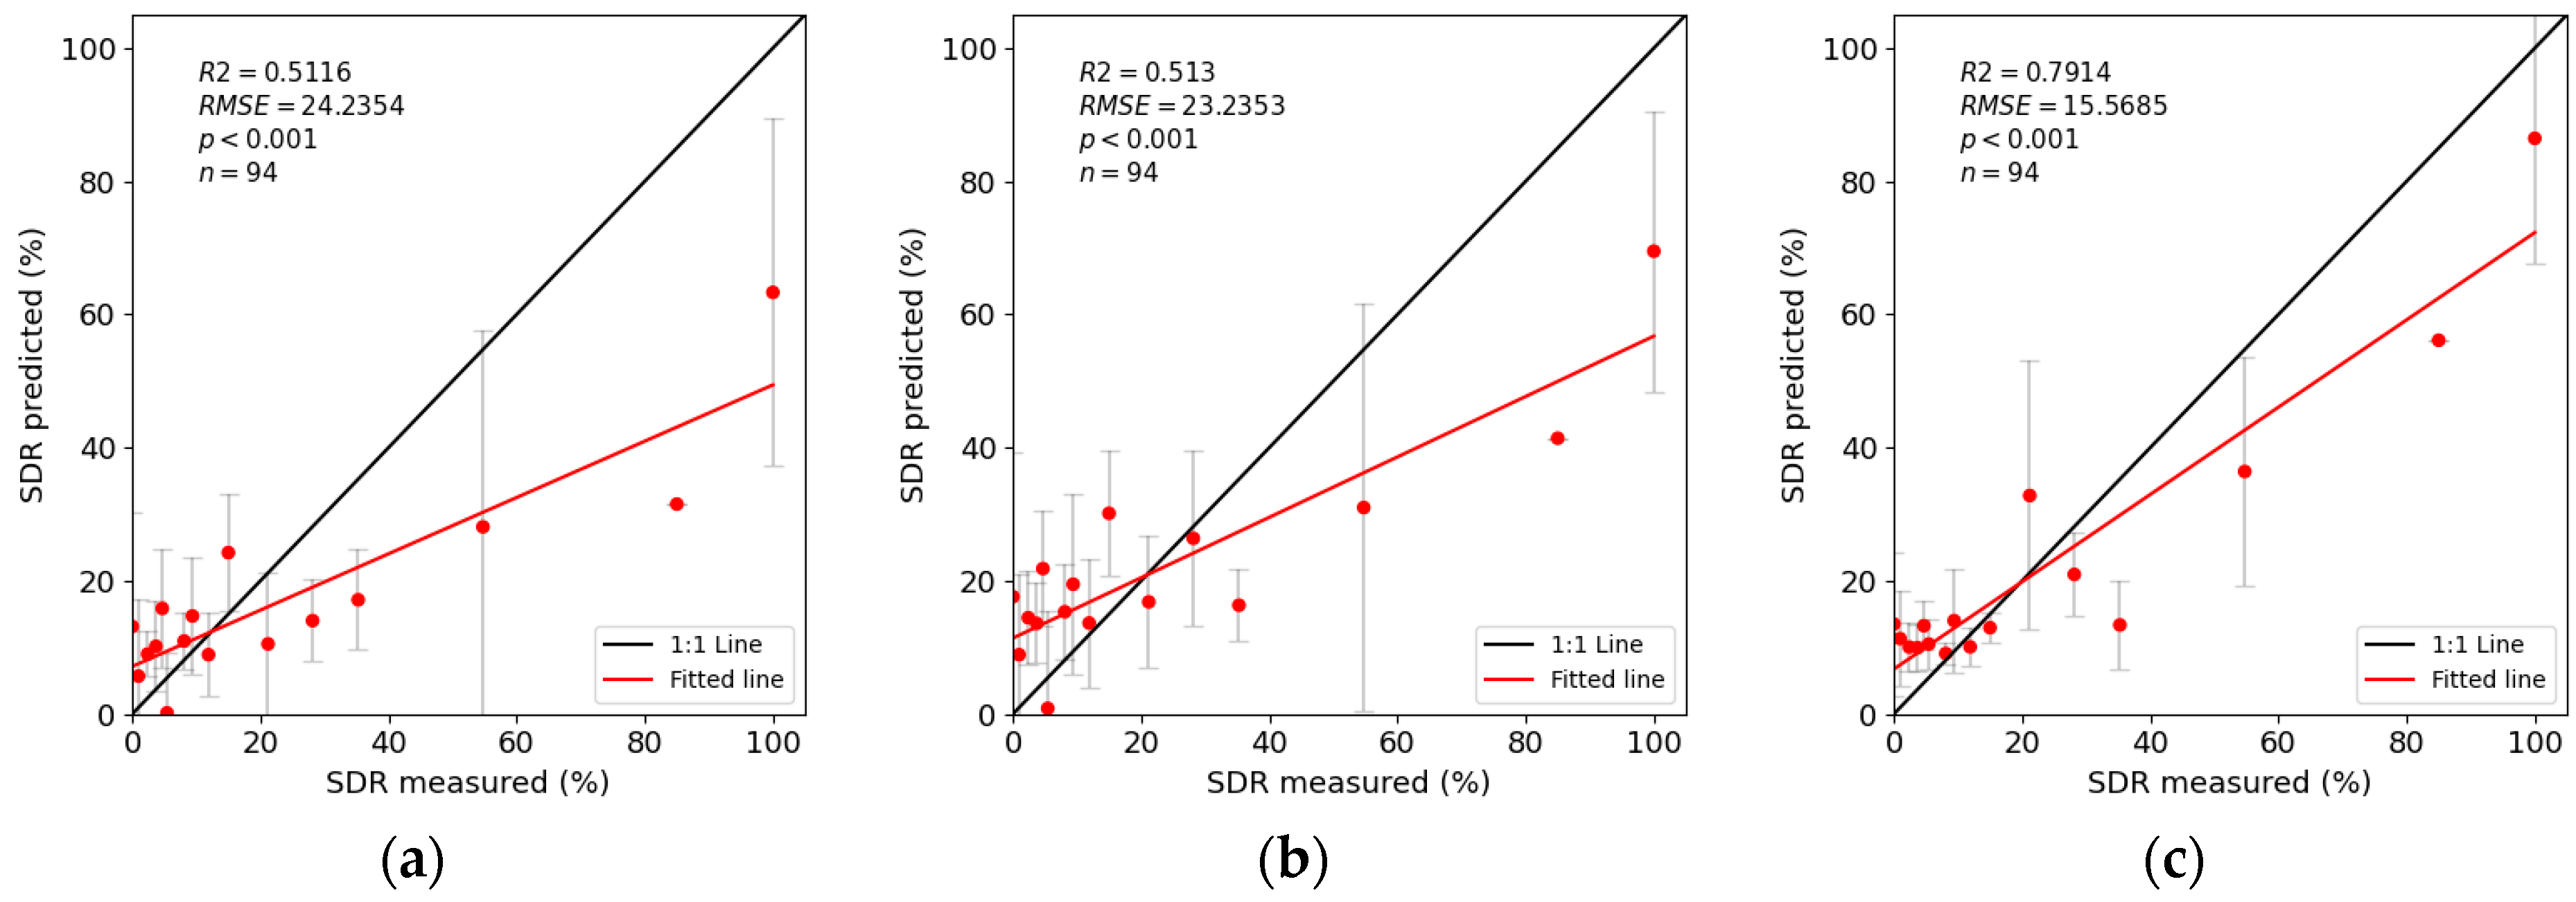
3.4. Estimating SDR Using LiDAR Metrics and Canopy Temperature

Here, we estimated SDR by combining LiDAR metrics with the canopy surface temperature (CST) using different regression models for 311 samples, as shown in Figure 8. The RF model (R2 = 0.7914, RMSE = 15.5685) exhibited a higher prediction performance compared to the SVM (R2 = 0.5116, RMSE = 24.2354) and PLSR (R2 = 0.513, RMSE = 23.2353) models for estimating SDR at the individual tree crown scale. A comparison with the results shown in Figure 7 shows that the accuracy of each regression method was improved due to the contribution of the CST data. For the RF model, R2 was increased from 0.6805 to 0.7914, with a lower standard deviation of SDR estimation. These results confirm that the combination of multi-source remote sensing data, such as LiDAR and TIR data, could enhance the ability for monitoring damaged tree crowns caused by pest infestation.
Figure 9 shows the importance values of 15 variables from the canopy temperature data and LiDAR metrics in the RF regression model. LiDAR metrics play a greater importance than the canopy temperature, especially in the mean of canopy return intensity (Int_mean). Despite its low importance value, CST was shown to greatly improve the accuracy of SDR estimation.

4. Discussion

4.1. The Effect of Canopy Temperature Uncertainty

The canopy temperature has been used in the previous literature for monitoring disease or pest infestation. Furthermore, it is a good indicator for moderate and severe stages due to a decrease in transpiration and a rise in temperature with the chlorotic and necrotic foliage [24,53]. However, the CST with insignificant increase at the early stage is insufficient for pest infestation monitoring. This result, shown in Figure 5b, is in agreement with a previous report [24]. This may be caused by high uncertainties in TIR-based canopy temperature values [54]. The CST is liable to influence directly by various environmental factors, such as ground surface radiation, especially when the canopy volume or leaf area index (LAI) is low [27,55]. This particular condition aggravates the mixed radiation of tree crowns measured by TIR sensors, weakening the correlation between SDR and CST [27]. Since the canopy structure of coniferous forests is sparser compared to that of broad-leaved forests, the effect of mixed crown/soil radiation on the canopy temperature undermines the accuracy of SDR calculations. However, few studies have focused on the effect of LAI on the relationship between CST and SDR.
In this study, we filtered out the low LAI (LAI < 1) and observed a decrease in the mean CST value and standard deviation, as shown in Figure 10a, which is particularly pronounced in the severely damaged stage. Compared with the results shown in Figure 8c, the RMSE of SDR estimation was decreased significantly (ΔRMSE = 3.0427), despite the small change in R2 (Figure 10b). These observations indicate that the measured parameters with LAI < 1, including CST, increase the uncertainty of the simulation. Therefore, to obtain accurate values of CST, either the resolution of TIR imagery should be improved or more accurate separation methods of mixed canopy/soil radiation should be promoted. In addition, adding higher resolution hyperspectral or multi-spectral data and providing more accurate vegetation indexes to evaluate the health status of vegetation may be conducive to time-efficient and accurate estimation of the forest pest infestation in a large area [56].

4.2. The Accuracy Contribution of LiDAR Data

LiDAR data have provided the accurate tree crown structure parameters (e.g., tree crown segmentation) and return intensity, which can be used as supplementary information for estimating the reflectance of the canopy in the NIR band [9]. The structural characteristics of crowns were helpful for extracting the individual tree shape and vertical information [57]. The intensity of the LiDAR metrics generated from first or all returns of crowns has been used to reverse the biochemical parameters of the tree crown, such as water content, chlorophyll, and nitrogen content [38,40]. Despite the LiDAR metrics being difficult to effectively distinguish the damaged degrees from slightly to severely, they were still able to separate the damaged degrees between healthy, infested, and dead tree crowns (Figure 6). Some studies have also indicated that LiDAR metrics only distinguished moderate infestation with a classification accuracy of 66% [38]. However, the researchers pointed out that LiDAR intensity still had the potential in assessments of infestation severity [10,38].
During the SDR estimation with the RF model, we found that the LiDAR metrics have a great contribution in detecting SDR in combination with TIR data. Especially, the Int_mean variables had a higher importance value than the other variables (Figure 9). Therefore, LiDAR data are great additional data to estimate SDR and also for improving the accuracy of forest pest detection with the combination of other remote sensing data sources. Nonetheless, the lower contribution of TIR data than that of LiDAR data still warrants attention, which indicates that using TIR data in monitoring pest infestation of coniferous forest remains challenging when thermal infrared sensors lack a high enough resolution [58].

5. Conclusions

Due to the limitation of spectral characteristics for detecting beetle infestation at an early stage, developing an additional remote sensing data source, such as TIR and LiDAR data, holds great potential. In this study, the UAV-based TIR and LiDAR data were used to detect crown damage at the individual tree level in a Yunnan pine forest. Fourteen important LiDAR metrics derived from LiDAR data using PLSR and RF models had more contribution in predicting SDR than CST. The combination of LiDAR and TIR data enhanced the accuracy of SDR estimation using an RF model, with R2 increasing from 0.6805 to 0.7914 and RMSE decreasing from 15.5685 to 19.5404. This approach exploits the advantages of LiDAR and TIR data to evaluate the health status of a pine forest accurately at the crown scale. In future works, we aim to explore the approach using the multiple indicators derived from multi-source remote sensing data fusion for improving the detection accuracy of forest infestation.

Author Contributions

J.W. and H.H. conceived and designed the experiments; Q.L., S.M. and Y.L. conducted the field experiments; J.W. and Q.L. analyzed the data; J.W. wrote the paper. All authors have read and agreed to the published version of the manuscript.

Funding

This research was funded by the National Natural Science Foundation of China (41571332) and Science and Technology Project of Henan Province (232102321112) and Talents Training Program of Henan Academy of Sciences (220401010).

Data Availability Statement

The data presented in this study are available on request from the corresponding author.

Conflicts of Interest

Author Yangyang Liu was employed by China Siwei Surveying and Mapping Technology Co., Ltd. The remaining authors declare that the research was conducted in the absence of any commercial or financial relationships that could be construed as a potential conflict of interest.

Appendix A

Table A1. Segmentation accuracy of individual trees in the two plots based on LiDAR data.
IDMeasured TreesDetected TreesFalse Detected TreesDetected Accuracy
plot 124323490.96
plot 216616150.97
Table A2. Thirty LiDAR metrics derived from point cloud data.
VariablesDefinition
VCrown volume
GFGap fraction
CDCrown density
Int_mean_firstMean value of crown first return intensity
Int_meanMean value of crown return intensity
Int_CV_firstCoefficient of variation of crown first return intensity
Int_CVCoefficient of variation of crown return intensity
Int_SD_firstStandard deviation of crown first return intensity
Int_SDStandard deviation of crown return intensity
Int_sc_firstMean absolute deviation of crown first return intensity
Int_scMean absolute deviation of crown return intensity
Int_vbs_firstMedian of the absolute deviations of crown first return intensity
Int_var_firstVariance of crown first return intensity
Int_varVariance of crown return intensity
Int_P2525th percentile of crown return intensity
Int_P5050th percentile of crown return intensity
Int_P7575th percentile of crown return intensity
Int_C2525th cumulative percentile of crown return intensity
Int_C5050th cumulative percentile of crown return intensity
Int_C7575th cumulative percentile of crown return intensity
numThe number of all laser points representing a tree
num_firstThe number of the laser points in first return
rcl Ratio between the centers height for the grids within each profile and the crown length
rcrRatio between the centers radius for the grids within 8 profiles and the crown radius (average for 8 profiles)
DmaxMaximum density of the laser points within all of 1 m grids for a crown.
PD20Ratio between the number of points in 0th–20th tree height and the number of all tree height (from tree bottom)
PD40Ratio between the number of points in 20th–40th tree height and the number of all tree height (from tree bottom)
PD60Ratio between the number of points in 40th–60th tree height and the number of all tree height (from tree bottom)
PD80Ratio between the number of points in 60th–80th tree height and the number of all tree height (from tree bottom)
PD100Ratio between the number of points in 80th–100th tree height and the number of all tree height (from tree bottom)

Appendix B

(1) Calculated VIPs of LiDAR metrics using PLSR model.
Figure A1. The variable importance scores of 30 LiDAR metrics derived with PLSR model.
Forests 15 00112 g0a1
(2) Calculated MDA index of LiDAR metrics using RF model.
Figure A2. The sorted MDA index of 30 LiDAR metrics derived with RF model.
Forests 15 00112 g0a2
(3) Important variables selected with VIPs and MDA index.
To ensure that the selected variables have the same importance in PLSR and RF models, the 14 variables of highest scores in VIPs and MDA index were chosen as the final variables for SDR prediction.
Table A3. Important variables selection from LiDAR metrics for SDR prediction.
VariablesDefinition
VCrown volume
GFGap fraction
CDCrown density
Int_mean_firstMean value of crown first return intensity
Int_CV_firstCoefficient of variation of crown first return intensity
Int_meanMean value of crown return intensity
Int_P2525th height percentile of crown return intensity
Int_P5050th height percentile of crown return intensity
Int_P7575th height percentile of crown return intensity
Int_C2525 h cumulative percentile of crown return intensity
Int_C5050 h cumulative percentile of crown return intensity
Int_C7575 h cumulative percentile of crown return intensity
Int_SDStandard deviation of crown return intensity
Int_CVCoefficient of variation of crown return intensity

References

  1. Lin, Q.N.; Huang, H.G.; Wang, J.X.; Huang, K.; Liu, Y.Y. Detection of pine shoot beetle (PSB) stress on pine forests at individual tree level using UAV-Based hyperspectral imagery and Lidar. Remote Sens. 2019, 11, 2540. [Google Scholar] [CrossRef]
  2. Yu, L.F.; Huang, J.X.; Zong, S.X.; Huang, H.G.; Luo, Y.Q. Detecting shoot beetle damage on Yunnan Pine using Landsat time-series data. Forests 2018, 9, 39. [Google Scholar] [CrossRef]
  3. Rimal, B.; Keshtkar, H.; Stork, N.; Sushila Rijal, S. Forest cover and sustainable development in the Lumbini Province, Nepal: Past, Present and Future. Remote Sens. 2021, 13, 4093. [Google Scholar] [CrossRef]
  4. Feng, X.M.; Fu, B.J.; Lu, N.; Zeng, Y.; Wu, B.F. How ecological restoration alters ecosystem services: An analysis of carbon sequestration in China’s Loess Plateau. Sci. Rep. 2013, 3, 2846–2851. [Google Scholar] [CrossRef] [PubMed]
  5. Georgieva, M.; Belilov, S.; Dimitrov, S.; Iliev, M.; Trenkin, V.; Mirchev, P.; Georgiev, G. Application of remote sensing data for assessment of bark beetle attacks in pine plantations in Kirkovo Region, the Eastern Rhodopes. Forests 2022, 13, 620. [Google Scholar] [CrossRef]
  6. Georgiev, G.; Georgieva, M.; Dimitrov, S.; Iliev, M.; Trenkin, V.; Mirchev, P.; Belilov, S. Remote sensing assessment of the expansion of Ips typographus attacks in the Chuprene Reserve, Western Balkan Range. Forests 2022, 13, 39. [Google Scholar] [CrossRef]
  7. Ma, Y.; Lu, J.; Huang, X. Damage diagnosis of Pinus yunnanensis canopies attacked by Tomicus using UAV hyperspectral images. Forests 2023, 14, 61. [Google Scholar] [CrossRef]
  8. Näsi, R.; Honkavaara, E.; Lyytikäinen-Saarenmaa, P.; Blomqvist, M.; Litkey, P.; Hakala, T.; Viljanen, N.; Kantola, T.; Tanhuanpää, T.; Holopainen, M. Using UAV-Based photogrammetry and hyperspectral imaging for mapping bark beetle damage at tree-Level. Remote Sens. 2015, 7, 15467–15493. [Google Scholar] [CrossRef]
  9. Lin, Q.; Huang, H.; Chen, L.; Wang, J.X.; Huang, K.; Liu, Y.Y. Using the 3D model RAPID to invert the shoot dieback ratio of vertically heterogeneous Yunnan pine forests to detect beetle damage. Remote Sens. Environ. 2021, 260, 112475–112494. [Google Scholar] [CrossRef]
  10. Yu, R.; Luo, Y.; Zhou, Q.; Zhang, X.; Wu, D.; Ren, L. A machine learning algorithm to detect pine wilt disease using UAV-based hyperspectral imagery and LiDAR data at the tree level. Int. J. Appl. Earth Obs. 2021, 101, 102363–102372. [Google Scholar] [CrossRef]
  11. Netherer, S.; Matthews, B.; Katzensteiner, K.; Blackwell, E.; Henschke, P.; Hietz, P.; Pennerstorfer, J.; Rosner, S.; Kikuta, S.; Schume, H.; et al. Do water-limiting conditions predispose Norway spruce to bark beetle attack? New Phytol. 2015, 205, 1128–1141. [Google Scholar] [CrossRef] [PubMed]
  12. Marx, A.; Sagischewski, H.; Sossna, I.; Chmara, S. Detecting bark beetle infestation in spruce stands using multi-temporal RapidEye Satellite Data. J. Magn. Reson. Imaging 2010, 42, 1281–1290. [Google Scholar]
  13. Senf, C.; Pflugmacher, D.; Wulder, M.A.; Hostert, P. Characterizing spectral–temporal patterns of defoliator and bark beetle disturbances using Landsat time series. Remote Sens. Environ. 2015, 170, 166–177. [Google Scholar] [CrossRef]
  14. Delalieux, S.; Hardy, T.; Ferry, M.; Gomez, S.; Kooistra, L.; Culman, M.; Tits, L. Red palm weevil detection in date palm using temporal UAVimagery. Remote Sens. 2023, 15, 1380. [Google Scholar] [CrossRef]
  15. Assal, T.J.; Sibold, J.; Reich, R. Modeling a historical mountain pine beetle outbreak using Landsat MSS and multiple lines of evidence. Remote Sens. Environ. 2014, 155, 275–288. [Google Scholar] [CrossRef]
  16. Mandl, L.; Lang, S. Early Detection of bark beetle induced forest stress using Sentinel-2 data. In Proceedings of the Dreiländertagung der DGPF, der OVG und der SGPF of the Conference, Dresden, Germany, 30 March 2022. [Google Scholar]
  17. Lin, Q.N.; Huang, H.G.; Wang, J.X.; Chen, L.; Du, H.Q.; Zhou, G.M. Early detection of pine shoot beetle attack using vertical profile of plant traits through UAV-based hyperspectral, thermal, and lidar data fusion. Int. J. Appl. Earth. Obs. 2023, 125, 103549. [Google Scholar] [CrossRef]
  18. Candotti, A.; De Giglio, M.; Dubbini, M.; Tomelleri, E. A Sentinel-2 based multi-temporal monitoring framework for wind and bark beetle detection and damage mapping. Remote Sens. 2022, 14, 6105. [Google Scholar] [CrossRef]
  19. Coops, N.C.; Johnson, M.; Wulder, M.A.; White, J.C. Assessment of QuickBird high spatial resolution imagery to detect red attack damage due to mountain pine beetle infestation. Remote Sens. Environ. 2006, 103, 67–80. [Google Scholar] [CrossRef]
  20. Hellwig, F.M.; Stelmaszczuk-Górska, M.A.; Dubois, C.; Wolsza, M.; Truckenbrodt, S.C.; Sagichewski, H.; Chmara, S.; Bannehr, L.; Lausch, A.; Schmullius, C. Mapping European spruce bark beetle infestation at its early phase using Gyrocopter-Mounted hyperspectral data and field measurements. Remote Sens. 2021, 13, 4659. [Google Scholar] [CrossRef]
  21. Michael, S.; Chen, J.; Peter, C. Combining land surface temperature and shortwave infrared reflectance for early detection of mountain pine beetle infestations in western Canada. J. Appl. Remote Sens. 2011, 5, 53566–53579. [Google Scholar]
  22. Shen, Q.; Deng, J.; Liu, X.S.; Huang, H.G. Prediction of bark beetles pests based on temperature vegetation dryness index. Trans. Chin. Soc. Agric. Eng. 2018, 34, 167–174. [Google Scholar]
  23. Scherrer, D.; Bader, M.K.; Körner, C. Drought-sensitivity ranking of deciduous tree species based on thermal imaging of forest canopies. Agric. Forest Meteorol. 2011, 151, 1632–1640. [Google Scholar] [CrossRef]
  24. López-López, M.; Calderón, R.; González-Dugo, V.; Pablo, J.; Zarco-Tejada, J.P.; Fereres, E. Early detection and quantification of almond red leaf blotch using high-resolution hyperspectral and thermal imagery. Remote Sens. 2016, 8, 276. [Google Scholar] [CrossRef]
  25. Hubbard, R.M.; Rhoades, C.C.; Elder, K.; Negron, J. Changes in transpiration and foliage growth in lodgepole pine trees following mountain pine beetle attack and mechanical girdling. Forest Ecol. Manag. 2013, 289, 312–317. [Google Scholar] [CrossRef]
  26. Niemann, K.O.; Quinn, G.; Stephen, R.; Visintini, F.; Parton, D. Hyperspectral remote sensing of mountain pine beetle with an emphasis on previsual assessment. Can. J. Remote Sens. 2015, 41, 191–202. [Google Scholar] [CrossRef]
  27. Wang, J.; Meng, S.; Lin, Q.; Liu, Y.; Huang, H. Detection of yunnan pine shoot beetle stress using UAV-Based thermal imagery and LiDAR. Appl. Sci. 2022, 12, 4732. [Google Scholar] [CrossRef]
  28. Gerhards, M.; Schlerf, M.; Rascher, U.; Udelhoven, T.; Juszczak, R.; Alberti, G.; Miglietta, F.; Inoue, Y. Analysis of airborne optical and thermal imagery for detection of water stress symptoms. Remote Sens. 2018, 10, 1139. [Google Scholar] [CrossRef]
  29. Wen, T.; Li, J.H.; Wang, Q.; Gao, Y.Y.; Hao, G.F.; Song, B.A. Thermal imaging: The digital eye facilitates high-throughput phenotyping traits of plant growth and stress responses. Sci. Total. Environ. 2023, 899, 165626. [Google Scholar] [CrossRef]
  30. Wang, J.-X.; Huang, H.-G.; Lin, Q.-N.; Wang, B.; Huang, K. Shoot beetle damage to Pinus yunnanensis monitored by infrared thermal imaging at needle scale. Chin. J. Plant Ecol. 2019, 43, 959–968. [Google Scholar] [CrossRef]
  31. Abdullah, H.; Darvishzadeh, R.; Skidmore, A.; Heurich, M. Sensitivity of Landsat-8 OLI and TIRS data to foliar properties of early stage bark beetle (Ips typographus, L.) infestation. Remote Sens. 2019, 11, 398. [Google Scholar] [CrossRef]
  32. Abdullah, H.M.; Mohana, N.T.; Khan, B.M.; Ahmed, S.M.; Hossain, M.; Islam, K.H.S.; Redoy, M.H.; Ferdush, J.; Bhuiyan, M.A.H.B.; Hossain, M.M.; et al. Present and future scopes and challenges of plant pest and disease (P&D) monitoring: Remote sensing, image processing, and artificial intelligence perspectives. Remote Sens. Appl. Soc. Environ. 2023, 32, 100996. [Google Scholar]
  33. Meng, R.; Dennison, P.E.; Zhao, F.; Shendryk, I.; Rickert, A.; Hanavan, R.P.; Cook, B.D.; Serbin, S.P. Mapping canopy defoliation by herbivorous insects at the individual tree level using bi-temporal airborne imaging spectroscopy and LiDAR measurements. Remote Sens. Environ. 2018, 215, 170–183. [Google Scholar] [CrossRef]
  34. Hovi, A.; Korhonen, L.; Vauhkonen, J.; Korpela, I. LiDAR waveform features for tree species classification and their sensitivity to tree- and acquisition related parameters. Remote Sens. Environ. 2016, 173, 224–237. [Google Scholar] [CrossRef]
  35. Zhu, X.; Wang, T.; Darvishzadeh, R.; Skidmore, A.K.; Niemann, K.O. 3D leaf water content mapping using terrestrial laser scanner backscatter intensity with radiometric correction. ISPRS J. Photogramm. Remote Sens. 2015, 110, 14–23. [Google Scholar] [CrossRef]
  36. Hanssen, K.H.; Solberg, S. Assessment of defoliation during a pine sawfly outbreak: Calibration of airborne laser scanning data with hemispherical photography. For. Ecol. Manag. 2007, 250, 9–16. [Google Scholar] [CrossRef]
  37. Senf, C.; Campbell, E.M.; Pflugmacher, D.; Wulder, M.A.; Hostert, P. A multi-scale analysis of western spruce budworm outbreak dynamics. Landsc. Ecol. 2017, 32, 501–514. [Google Scholar] [CrossRef]
  38. Junttila, S.; Holopainen, M.; Vastaranta, M.; Lyytikäinen-Saarenmaa, P.; Kaartinen, H.; Hyyppä, J.; Hyyppä, H. The potential of dual-wavelength terrestrial lidar in early detection of Ips typographus (L.) infestation—Leaf water content as a proxy. Remote Sens. Environ. 2019, 231, 111264–111279. [Google Scholar] [CrossRef]
  39. Huang, K.; Huang, H. Using ground-based LiDAR to detect shoot dieback: A case study on Yunnan pine shoots. Remote Sens. Lett. 2019, 10, 903–912. [Google Scholar] [CrossRef]
  40. Eitel, J.U.H.; Magney, T.S.; Vierling, L.A.; Brown, T.T.; Huggins, D.R. LiDAR based biomass and crop nitrogen estimates for rapid, non-destructive assessment of wheat nitrogen status. Field Crop. Res. 2014, 159, 21–32. [Google Scholar] [CrossRef]
  41. Smigaj, M.; Gaulton, R.; Suárez, J.C.; Barr, S.L. Combined use of spectral and structural characteristics for improved red band needle blight detection in pine plantation stands. Forest Ecol. Manag. 2019, 434, 213–223. [Google Scholar] [CrossRef]
  42. Huo, L.; Persson, H.J.; Lindberg, E. Early detection of forest stress from European spruce bark beetle attack, and a new vegetation index: Normalized distance red & SWIR (NDRS). Remote Sens. Environ. 2021, 255, 112240. [Google Scholar]
  43. Yu, R.; Ren, L.; Luo, Y. Early detection of pine wilt disease in Pinus tabuliformis in North China using a field portable spectrometer and UAV-based hyperspectral imagery. Forest Ecosyst. 2021, 8, 44. [Google Scholar] [CrossRef]
  44. Syifa, M.; Park, S.-J.; Lee, C.-W. Detection of the pine wilt disease tree candidates for drone remote sensing using artificial intelligence techniques. Engineering 2020, 6, 919–926. [Google Scholar] [CrossRef]
  45. Lin, Y.; Hyyppä, J. A comprehensive but efficient framework of proposing and validating feature parameters from airborne LiDAR data for tree species classification. Int. J. Appl. Earth Obs. 2016, 46, 45–55. [Google Scholar] [CrossRef]
  46. Abdel-Rahman, E.M.; Ahmed, F.B.; Ismail, R. Random forest regression and spectral band selection for estimating sugarcane leaf nitrogen concentration using EO-1 Hyperion hyperspectral data. Int. J. Remote Sens. 2013, 34, 712–728. [Google Scholar] [CrossRef]
  47. Ding, F.; Li, C.; Zhai, W.; Fei, S.; Cheng, Q.; Chen, Z. Estimation of nitrogen content in winter wheat based on multi-source data fusion and machine learning. Agriculture 2022, 12, 1752. [Google Scholar] [CrossRef]
  48. Bazrafkan, A.; Navasca, H.; Kim, J.-H.; Morales, M.; Johnson, J.P.; Delavarpour, N.; Fareed, N.; Bandillo, N.; Flores, P. Predicting dry pea maturity using machine learning and advanced sensor fusion with unmanned aerial systems (UASs). Remote Sens. 2023, 15, 2758. [Google Scholar] [CrossRef]
  49. Smola, A.J.; Scholkopf, B. A tutorial on support vector regression. Stat. Comput. 2004, 14, 199–222. [Google Scholar] [CrossRef]
  50. Abdullah, H.; Darvishzadeh, R.; Skidmore, A.K.; Groen, T.A.; Heurich, M. European spruce bark beetle (Ips typographus, L.) green attack affects foliar reflectance and biochemical properties. Int. J. Appl. Earth Obs. 2018, 64, 199–209. [Google Scholar] [CrossRef]
  51. Maimaitijiang, M.; Sagan, V.; Sidike, P.; Hartling, S.; Esposito, F.; Fritschi, F.B. Soybean yield prediction from UAV using multimodal data fusion and deep learning. Remote Sens. Environ. 2020, 237, 111599–111619. [Google Scholar] [CrossRef]
  52. Gaulton, R.; Danson, F.M.; Ramirez, F.A.; Gunawan, O. The potential of dual-wavelength laser scanning for estimating vegetation moisture content. Remote Sens. Environ. 2013, 132, 32–39. [Google Scholar] [CrossRef]
  53. Calderón, R.; Montes-Borrego, M.; Landa, B.B.; Navas-Cortés, J.A.; Zarco-Tejada, P.J. Detection of downy mildew of opium poppy using high-resolution multi-spectral and thermal imagery acquired with an unmanned aerial vehicle. Precis. Agric. 2014, 15, 639–661. [Google Scholar] [CrossRef]
  54. Chen, X.; Li, W.; Chen, J.; Rao, Y.; Yamaguchi, Y. A Combination of TsHARP and thin plate spline interpolation for spatial sharpening of thermal imagery. Remote Sens. 2014, 6, 2845–2863. [Google Scholar] [CrossRef]
  55. Hernández-Clemente, R.; Hornero, A.; Mottus, M.; Penuelas, J.; González-Dugo, V.; Jiménez, J.C.; Suárez, L.; Alonso, L.; Zarco-Tejada, P.J. Early diagnosis of vegetation health from high-resolution hyperspectral and thermal imagery: Lessons learned from empirical relationships and radiative transfer modelling. Curr. For. Rep. 2019, 5, 169–183. [Google Scholar] [CrossRef]
  56. Stereńczak, K.; Mielcarek, M.; Modzelewska, A.; Kraszewski, B.; Fassnacht, F.E.; Hilszczański, J. Intra-annual Ips typographus outbreak monitoring using a multi-temporal GIS analysis based on hyperspectral and ALS data in the Białowieża Forests. For. Ecol. Manag. 2019, 442, 105–116. [Google Scholar] [CrossRef]
  57. Shi, Y.; Skidmore, A.K.; Wang, T.; Holzwarth, S.; Heiden, U.; Pinnel, N.; Zhu, X.; Heurich, M. Tree species classification using plant functional traits from lidar and hyperspectral data. Int. J. Appl. Earth Obs. 2018, 73, 207–219. [Google Scholar] [CrossRef]
  58. Camino, C.; Calderón, R.; Parnell, S.; Dierkes, H.; Chemin, Y.; Román-Écija, M.; Montes-Borrego, M.; Landa, B.B.; Navas-Cortes, J.A.; Zarco-Tejada, P.J.; et al. Detection of Xylella fastidiosa in almond orchards by synergic use of an epidemic spread model and remotely sensed plant traits. Remote Sens. Environ. 2021, 260, 112420–112436. [Google Scholar] [CrossRef]
Figure 1. Study sites and flight area of the unmanned airborne vehicle (UAV). The blue rectangle represents the UAV-based light detection and ranging (LiDAR) flight area. The right images are the UAV-based RGB image and thermal infrared image.
Forests 15 00112 g001
Figure 2. Brightness temperature maps after calibration and the corresponding high-resolution RGB images of the two plots.
Forests 15 00112 g002
Figure 3. Point cloud data (Z coordinate > 0.3 m) from UAV-based LiDAR in the study area (left) and the individual tree segmentation of the two plots (right).
Forests 15 00112 g003
Figure 4. Temperature extraction using the canopy boundary and seed point produced by LiDAR data.
Forests 15 00112 g004
Figure 5. (a) A comparison of extracting CST using the seed points and canopy boundaries approaches. (b) Boxplot of canopy temperature with different degrees of shoot damage ratio (SDR), the red squares represent the mean and the black rhombuses are outlier. (c) Measured vs. predicted SDR using the canopy temperature data; each point represents the mean of SDR (the five nearest measured values of the individual tree crowns) with ±1 standard deviation bar.
Forests 15 00112 g005
Figure 6. Comparison of the eight variables derived from LiDAR metrics with different degrees of shoot damage ratio, the red squares represent the mean and the black rhombuses are outlier.
Forests 15 00112 g006
Figure 7. Measured vs. predicted SDR using LiDAR metrics with three different models: (a) SVM model, (b) PLSR model, and (c) RF model. Each point represents the mean SDR (five nearest measured values of individual tree crowns) with ±1 standard deviation bar.
Forests 15 00112 g007
Figure 8. Measured vs. predicted SDR using a combination of LiDAR metrics and canopy temperature data with three different models: (a) SVM model, (b) PLSR model, and (c) RF model. Each point represents the mean SDR (five nearest measured values of individual tree crowns) with ±1 standard deviation bar.
Forests 15 00112 g008
Figure 9. Importance value of each variable with LiDAR metrics and canopy temperature for estimating SDR from the RF regression model.
Forests 15 00112 g009
Figure 10. (a) A comparison of temperature characteristics using different data (LAI > 1 vs. all samples); the histogram represents the mean CST, and the line chart represents the standard deviation (SD) of CST. (b) SDR prediction of filtered data (LAI > 1) with LiDAR metrics and CST using the RF regression model.
Forests 15 00112 g010
Table 1. Tree variables collected from the two plots (n = 409).
VariablesMeanStandard DeviationMaximumMinimum
DBH (m)8.94.0252.5
H (m)4.51.69.81.2
CD (m)2.21.07.30.5
SDR (%)26351000
Disclaimer/Publisher’s Note: The statements, opinions and data contained in all publications are solely those of the individual author(s) and contributor(s) and not of MDPI and/or the editor(s). MDPI and/or the editor(s) disclaim responsibility for any injury to people or property resulting from any ideas, methods, instructions or products referred to in the content.

