Article

The Different Factors Driving SOC Stability under Different N Addition Durations in a Phyllostachys edulis Forest

1
School of Geographical Sciences, Fujian Normal University, Fuzhou 350007, China
2
State Key Laboratory for Subtropical Mountain Ecology of the Ministry of Science and Technology and Fujian Province, Fujian Normal University, Fuzhou 350007, China
3
Fujian Provincial Key Laboratory for Subtropical Resources and Environment, Fujian Normal University, Fuzhou 350007, China
*
Author to whom correspondence should be addressed.
Forests 2023, 14(9), 1890; https://doi.org/10.3390/f14091890
Submission received: 7 August 2023 / Revised: 11 September 2023 / Accepted: 16 September 2023 / Published: 17 September 2023

Abstract

:
As one of the most widespread driving forces in the world, atmospheric nitrogen (N) deposition can significantly alter the carbon cycling of ecosystems. In order to understand how N deposition regulates soil organic carbon (SOC) dynamics and its underlying mechanisms, a 7-year N addition experiment was set in a Phyllostachys edulis forest with three N addition levels (+0, +20, and +80 kg N hm−2 year−1) to evaluate the effects of N addition on the concentration and stability of SOC fractions in the third, fifth, and seventh years. The results are as follows: (1) short-term (third year) N addition markedly increased SOC stability by decreasing the concentration of particulate organic carbon (POC) and increasing the mineral-associated organic carbon (MAOC); longer duration of N addition (5 and 7 years) had an insignificant effect on SOC stability and fractions, suggesting that the effects of N deposition on the SOC stability varied under different duration regimes; (2) N addition did not significantly affect microbial community composition while increasing the ratio of fungi to bacteria (F:B) in the seventh year, and microbial biomass carbon (MBC) and carbon use efficiency (CUE) were significantly increased in the short-term (third year) high N addition regime and enzyme activity was significantly increased in the seventh years’ high N addition regime; (3) variation partitioning analysis and multiple regression analysis showed that SOC fractions are mainly regulated by CUE and MBC under short-term N addition, while enzyme activity was mainly regulated under the longer duration of N addition. Our results show that SOC stability was more sensitive in the short term, and the role of microbial characteristics varied under different N addition durations in the P. edulis forests. Overall, our findings provide a new perspective for the responses of the SOC pool to N deposition and contribute to predicting SOC dynamics in terrestrial ecosystems under future climate change.

1. Introduction

Nitrogen (N) deposition increased recently and will remain at high levels in the future [1]. N deposition extensively affects the structure and function of terrestrial ecosystems [2,3]. Soil has the largest carbon (C) pool in terrestrial ecosystems, with global soil organic carbon (SOC) storage of approximately 2270–2770 Pg (1 Pg = 1015 g) [4,5]. Due to the close coupling relationship of C and N cycles in terrestrial ecosystems [6], it has a significant meaning in exploring the SOC dynamics under N deposition.
It is well known that SOC is complex. In recent years, SOC was often divided into particulate organic carbon (POC) and mineral-associated organic carbon (MAOC) based on the physical methods, which provides a new way to further study the dynamics and response of SOC to N deposition [7,8,9]. In detail, POC (labile and fast-turnover, >53 μm) is unattached to mineral particles and vulnerable to disturbance, which consists of partially decomposed plant materials and byproducts [7,10]. On the contrary, MAOC (slow turnover, <53 μm) is adsorbed on the mineral surfaces by physicochemical mechanisms and normally inaccessible to microbes [7]. Given that the turnover rates and stability mechanisms vary among SOC fractions, the effects of the N deposition on them may be markedly different, which in turn may affect the stability of SOC [1]. For example, a 3-year study by Duan et al. [11] found that N addition significantly increased the concentration of POC, while decreasing that of MAOC. However, a 7-year study showed that N addition significantly reduced the POC concentration while increasing the MAOC concentration [12]. In summary, the fractions of SOC are affected not only by the levels of N addition, but also likely by the duration. Therefore, clarifying the responses of POC and MAOC under different N deposition durations is the key to understanding the changes in SOC dynamics and stability under N deposition.
POC promotes microbial growth, the products in the process of which, such as microbial exudates and necromass, are important precursors of MAOC [13,14,15]; thus, microbial communities contribute significantly to the processes of SOC [16]. Microbial groups and their produced extracellular enzymes participate in the decomposition of soil organic matter in different ways [17,18,19]. Moreover, microbial C use efficiency (CUE) is a key indicator to represent microbial physiological metabolism and plays an important role in understanding the stability of SOC, which was defined as the ratio of C for microbes growth to C uptake by themselves [19,20]. N addition may affect microbial activity and microbial CUE, thus affecting the decomposition of POC and the accumulation of MAOC [11,21] based on previous studies. For example, higher CUE may accelerate the decomposition of POC, in which the process of the production of microbial residues is conducive to the formation of MAOC [6,22]. In addition, CUE varied among different N addition durations, for example, a previous study by Stone et al. [23] showed that short-term N addition could improve the availability of N by providing NH4+-N and NO3--N, thus enhancing microbial CUE. In contrast, soil acidification caused by long-term N addition will reduce microbial activity and decrease microbial CUE [24,25]. Our previous studies at this site also found that the response of microbial characteristics to N addition may be mediated by the addition duration [26]. Therefore, we suggest that the different responses of microbial characteristics to N addition under different durations may lead to differences in POC and MAOC, which have great significance in understanding the response of SOC dynamics to long-term N deposition in the future.
The subtropical zone in China is one of the areas with the most severe N deposition in the world [27,28], and there is an abundant P. edulis forest resource of approximately 4.68 million ha−1, which is an important part of China’s subtropical forest resources [29]. In our study, a 7-year N addition experiment was set in a P. edulis forest in southeastern China to (1) determine the effects of different N addition durations on POC and MAOC and (2) explore the main factors driving changes in SOC stability. Based on our previous studies at this site, we hypothesized that: (1) a 3-year (short-term) N addition increase in N availability accelerates the decomposition of POC and increases microbial CUE and MBC, thereby promoting the accumulation of MAOC, and (2) a longer duration of N addition N addition inhibits microbial CUE by soil acidification, resulting in the little effect on POC and MAOC.

2. Materials and Methods

2.1. Study Sites and Long-Term Experimental Design

In 2014, the N addition experiment was launched at the P. edulis forest in Daiyun Mountain National Nature Reserve (25°38′07″ to 25°43′40″ N, 118°05′22″ to 118°20′15″ E), Fujian province, China. The soil at this site is classified as an Ultisol with a pH of about 4.7. The experimental station has a subtropical marine monsoon climate with a mean annual temperature of 15.6 to 19.5 °C and precipitation of 1700 to 2000 mm. In addition, the P. edulis in this experiment was mainly 5 to 6 years, and there were almost no other trees or shrubs in the forest with sparse understory vegetation. The basic information on understory vegetation is shown in Table S1 [26,27].
A completely randomized block design with three replicates was implemented in the experiment. Based on the N deposition background values in this area, three N addition treatments were set in with ammonium nitrate [30]: (i) no N addition (N0) [+0 kg N hm−2 a−1], (ii) low N addition (N20) [+20 kg N hm−2 a−1], and (iii) high N addition (N80) [+80 kg N hm−2 a−1]. A total of nine plots with a size of 3 m×10 m were set, with an interval of 2 m between each plot as a buffer zone to prevent mutual interference. The ammonium nitrate was dissolved in 20 L of Milli-Q water and applied every year in the growing season (March to September).

2.2. Sample Collection and Analysis

Soil samples were collected from every plot with a depth of 0 to 20 cm at the end of July in 2017, 2019, and 2020. Five soil cores were collected and the samples from the same treatment plot were then mixed. Thus, nine samples in total were returned to the laboratory for each sampling time. Then, gravel, debris, and roots were removed, and the soils were passed through a 2 mm sieve, and the soil physicochemical properties, microbial biomass, enzyme activity, and SOC fractions were determined.

2.3. Determination of Soil Physicochemical Properties

Soil pH was measured at a soil/water ratio of 1:2.5 (weight/volume) by a pH meter (STARTER 300, OHAUS, Parsippany, NJ, USA). Soil total carbon (STC) and total nitrogen (STN) were measured using an elemental analyzer (Elementar Vario EL III; Langenselbod, Germany). The results of soil carbonate determination by adding acid indicate that carbonates were not present, so the STC concentrations were equated to SOC concentrations. Dissolved organic carbon (DOC) and dissolved organic nitrogen (DON) concentrations were extracted by a soil/water ratio of 1:4 (weight/volume), filtered through a 0.45 µm Millipore filter and determined by a SHIMADZU TOC-VCPH/CPN analyzer (Shimadzu, Kyoto, Japan) and a continuous flow analysis system (Skalar san++; Skalar, Breda, Netherlands), respectively. Soil-available phosphorus (AP) and total phosphorus (TP) were extracted by Mehlich III and digested by HClO4-H2SO4, respectively, and determined by a continuous flow analyzer. Soil inorganic N was analyzed for ammonia (NH4+-N) and nitrate (NO3--N) by using a continuous flow analysis system after extraction with a 2 mol L−1 KCl solution [26,27]. The results of physicochemical properties are shown in Table S2.

2.4. Determination of Soil Organic Carbon Fractions

The POC (size > 53 µm) and MAOC (size < 53 µm) were determined according to Robertson et al. [31]. Specifically, 5 g of air-dried soil passed through a 2 mm sieve and 50 mL of sodium poly tungstate (SPT) were shaken for 18 h at 95 rpm to disperse the sample. After this, the suspension was poured onto a 53 µm sieve and washed thoroughly to separate the two SOC fractions. The soil passed through the sieve was identified as MAOC, while the soil on the sieve was identified as POC. All fractions were oven dried at 60 °C and weighed [19], and the STC of each was analyzed by an elemental analyzer.

2.5. Determination of Soil Microbial Biomass and Composition

Microbial biomass carbon (MBC), and microbial biomass nitrogen (MBN) were determined by Vance et al. [32]. MBC was determined by a TOC analyzer. MBN and MBP were determined by the continuous flow analyzer. The calculation equations are as follows:
MBC = ΔEC/KC
MBN = ΔEN/KN
MBP = ΔEP/KP/Kb
where ΔEX is the difference between fumigated and unfumigated total carbon, nitrogen, and phosphorus; and KC, KN, and KP are the extraction coefficients of MBC, MBN, and MBP for 0.45, 0.54, and 0.40, respectively. Kb is the recovery rate.
According to White et al. [33] and Bardgett et al. [34], the phospholipid fatty acid (PLFA) analysis was used to determine the microbial community composition. In detail, lipids were extracted from 3 g of freeze-dried soil by a mixture of chloroform–methanol–phosphate buffer with a ratio of 1:2:0.8 (volume/volume/volume). The extracted phospholipids were identified on a gas chromatograph (Agilent 6890 N, Santa Clara, CA, USA) after methylated to form fatty acid methyl esters (FAMEs). According to Joergensen [35], we identified the total PLFAs of Gram-positive bacteria (GP; i14:0, i15:0, i16:0, i17:0, i18, ai15:0, ai16:0, ai17:0, ai18:0, ai19:0, 10Me16:0, 10Me17:0, and 10Me18:0), Gram-negative bacteria (GN, cy17:0, cy19:0, 16:1ω7, 16:1ω9, 17:1ω8, and 18:1ω7), Actinobacteria (ACT; 10Me16:0, 10Me17:0, and 10Me18:0), fungi (18:1ω9c, 18:2ω6c, 16:1ω5c, and 18:3ω6,9,12), and arbuscular mycorrhiza fungi (AMF, 16:1ω5c). Total bacteria were calculated as the sum of GP and GN. The ratio of fungal to bacterial PLFAs (F:B) was used to estimate the change in the microbial community composition.

2.6. Determination of Soil Enzyme Activities and Microbial Carbon Use Efficiency

The soil enzyme activities, including β-glucosidase (βG), nacetyl glucosaminidase (NAG), and acid phosphatase (ACP), were determined according to Saiya-Cork et al. [36], and all enzyme activities were measured by a SpectraMax M5 Microplate reader (MDS Analytical Technologies, Sunnyvale, CA, USA). The microbial CUE was calculated as follows [37]:
CUE = CUEmax × {(SC:N × SC:P) ÷ [(KC:N + SC:N) × (KC:P + SC:P)]}0.5
SC:N = BC:N/LC:N × 1/EEAC:N
SC:P = BC:P/LC:P × 1/EEAC:P
where CUEmax is the ceiling for microbial growth efficiency, which was set to 0.6 [37], and KC:N and KC:P are set to 0.5 fot the half-saturation constants. EEAC:N and EEAC:P are βG/NAG and βG/ACP ratios, respectively. LC:N and LC:P are the SOC/STN and SOC/TP ratios, respectively. BC:N and BC:P were the ratios of MBC/MBN and MBC/MBP.

2.7. Statistical Analysis

A two-way ANOVA test was implemented to examine the N addition duration, levels, and their interaction. Tukey’s test was used to analyze the significant differences in the soil physicochemical properties, microbial biomass, SOC fractions, and microbial CUE under different N additions (p < 0.05). Before this, the normality and homogeneity of variance of the residuals were tested by Shapiro–Wilk and Levene’ tests, respectively. Box–Cox was used to transform the data when they were not normally distributed or did not have the same variance as the observed results. We calculated the response ratios (RRs) by the ratio of the variable in the N addition treatment (N20 and N80) to that in the corresponding control (N0). An RR value larger than 1 indicates a positive effect, whereas a value less than 1 indicates a negative effect.
In order to elucidate the influence exerted by soil physiochemical and microbial attributes on soil SOC fractions, a multiple linear regression analysis that followed was conducted by a variation partitioning analysis (VPA) [38], as follows: (1) all predictors and response variables were standardized by Z-scores to interpret parameter estimates on a comparable scale; (2) principal component analysis (PCA) was conducted, respectively, for soil physicochemical and microbial properties, and the PC1 and PC2 were subsequently utilized in the next multiple linear regression analysis; (3) the relative importance of physicochemical and microbial properties on SOC fractions was assessed through VPA, and the variable with a higher R2 was selected for further analysis; (4) the potential collinearity of relationships among model covariates were evaluated by the calculation of variance–inflation factors (VIFs) in “vif” function from the package “car” in R, and the variables exhibiting a VIF > 10 were omitted [39,40]; (5) the optimal model for selecting the best explanatory variable was identified based on the Akaike’s information criterion (AICc; AICc < 4) by the “dredge” function from the package “MuMIn” [41,42]. Model averaging was taken relying on the AICc weights when several models were selected. All statistical analyses were executed in R (3.4.1), and all images were generated using Origin 2023 and Adobe Illustrator 2021.

3. Results

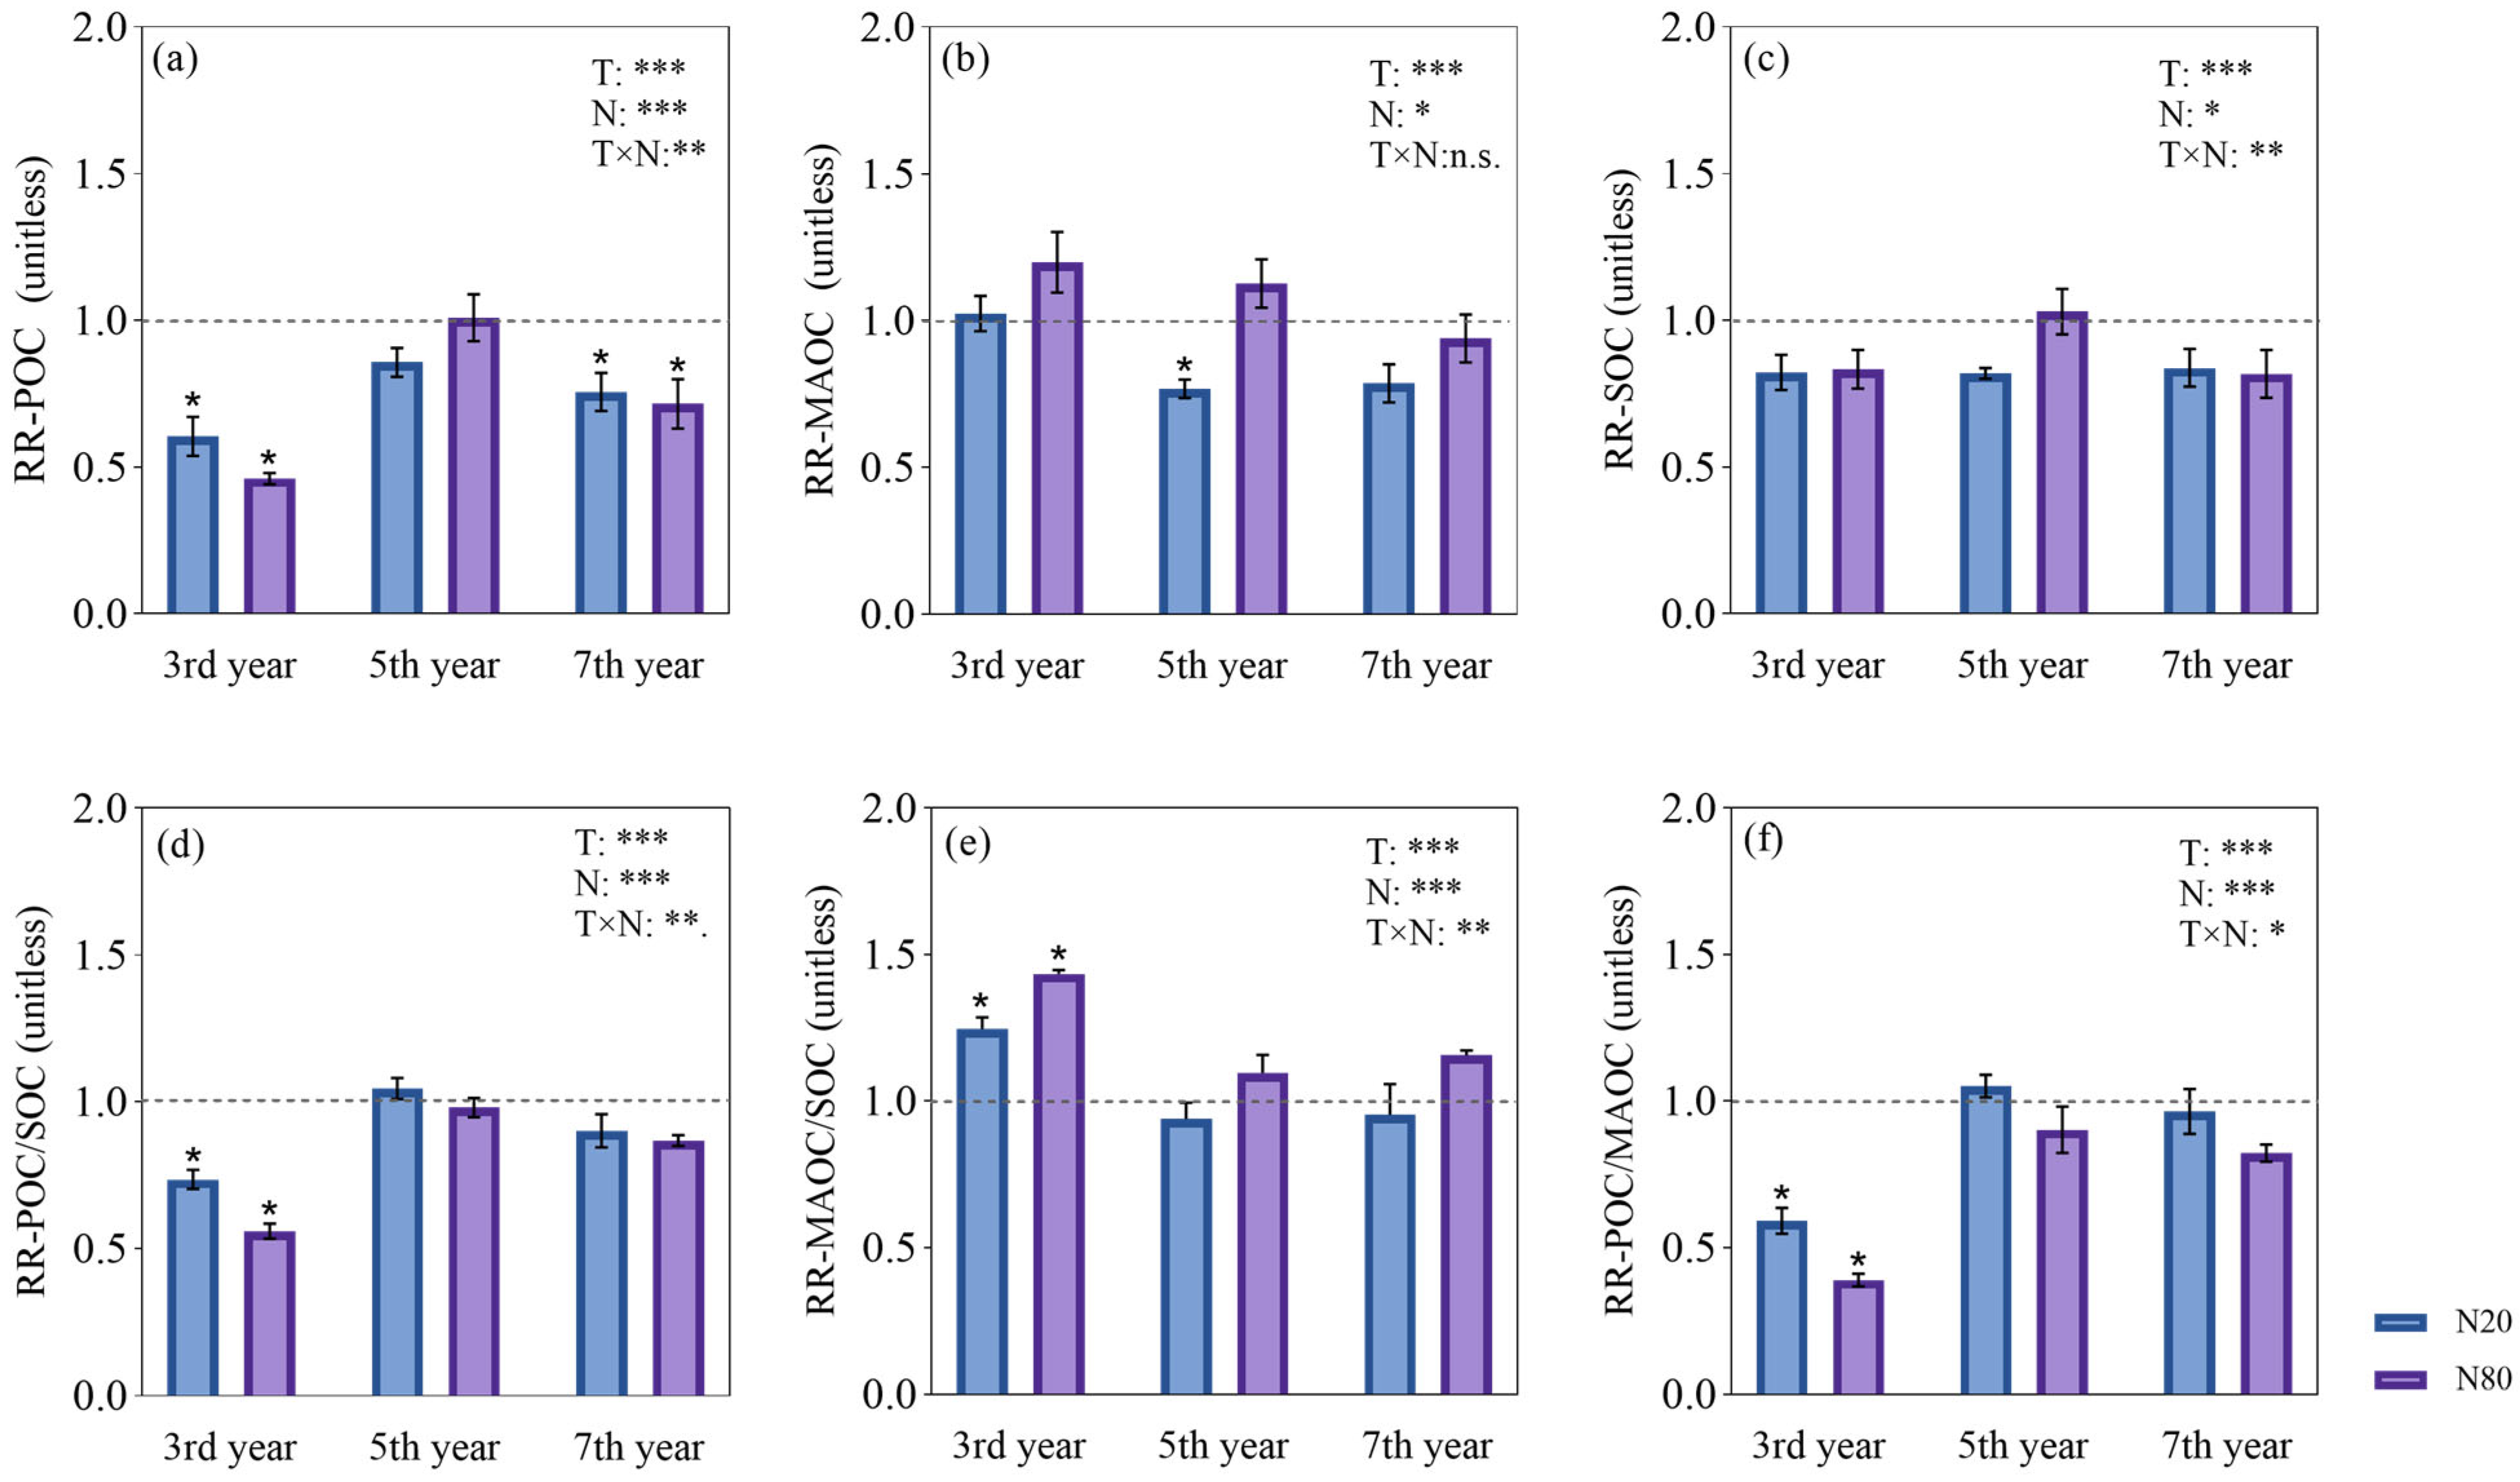
3.1. On the Response of SOC Fractions to Different N Addition Durations

The two-way analysis showed that N addition duration, N addition levels, and their interactions had significant effects on SOC and its fractions (p < 0.05). N addition had a negative effect on POC, POC/SOC, and POC/MAOC in the third year of N addition. In contrast, in the fifth year of N addition, POC, POC/SOC, MAOC/SOC, and POC/MAOC did not change significantly under different N addition treatments. In the seventh year of N addition, SOC, MAOC, POC/SOC, MAOC/SOC, and POC/MAOC did not change significantly under different N addition treatments. The RR-MAOC and RR-MAOC/SOC increased and then decreased with N addition duration. The MAOC was significantly decreased under N20 in the fifth year. SOC was significantly increased by N addition in the third year (p < 0.05, Figure 1b,e). Compared with the N0, N addition had an insignificant effect on SOC (Figure 1c), while the POC/MAOC was markedly decreased in the third year.

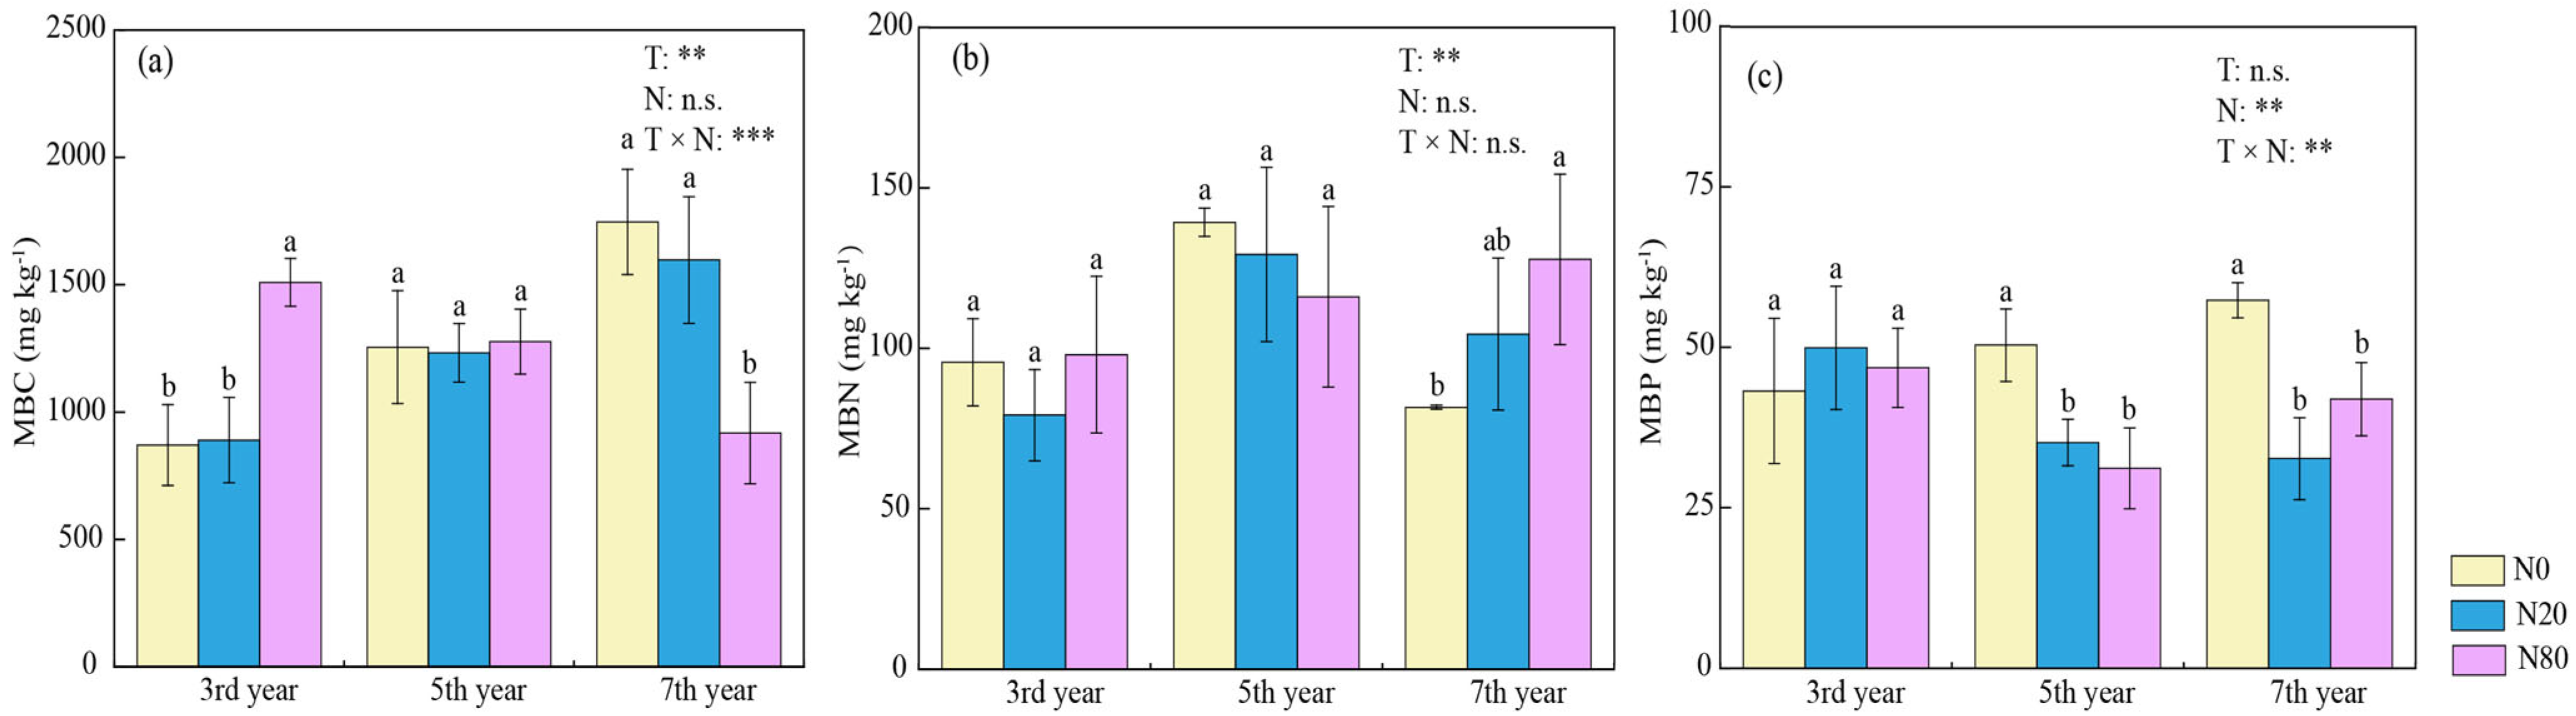
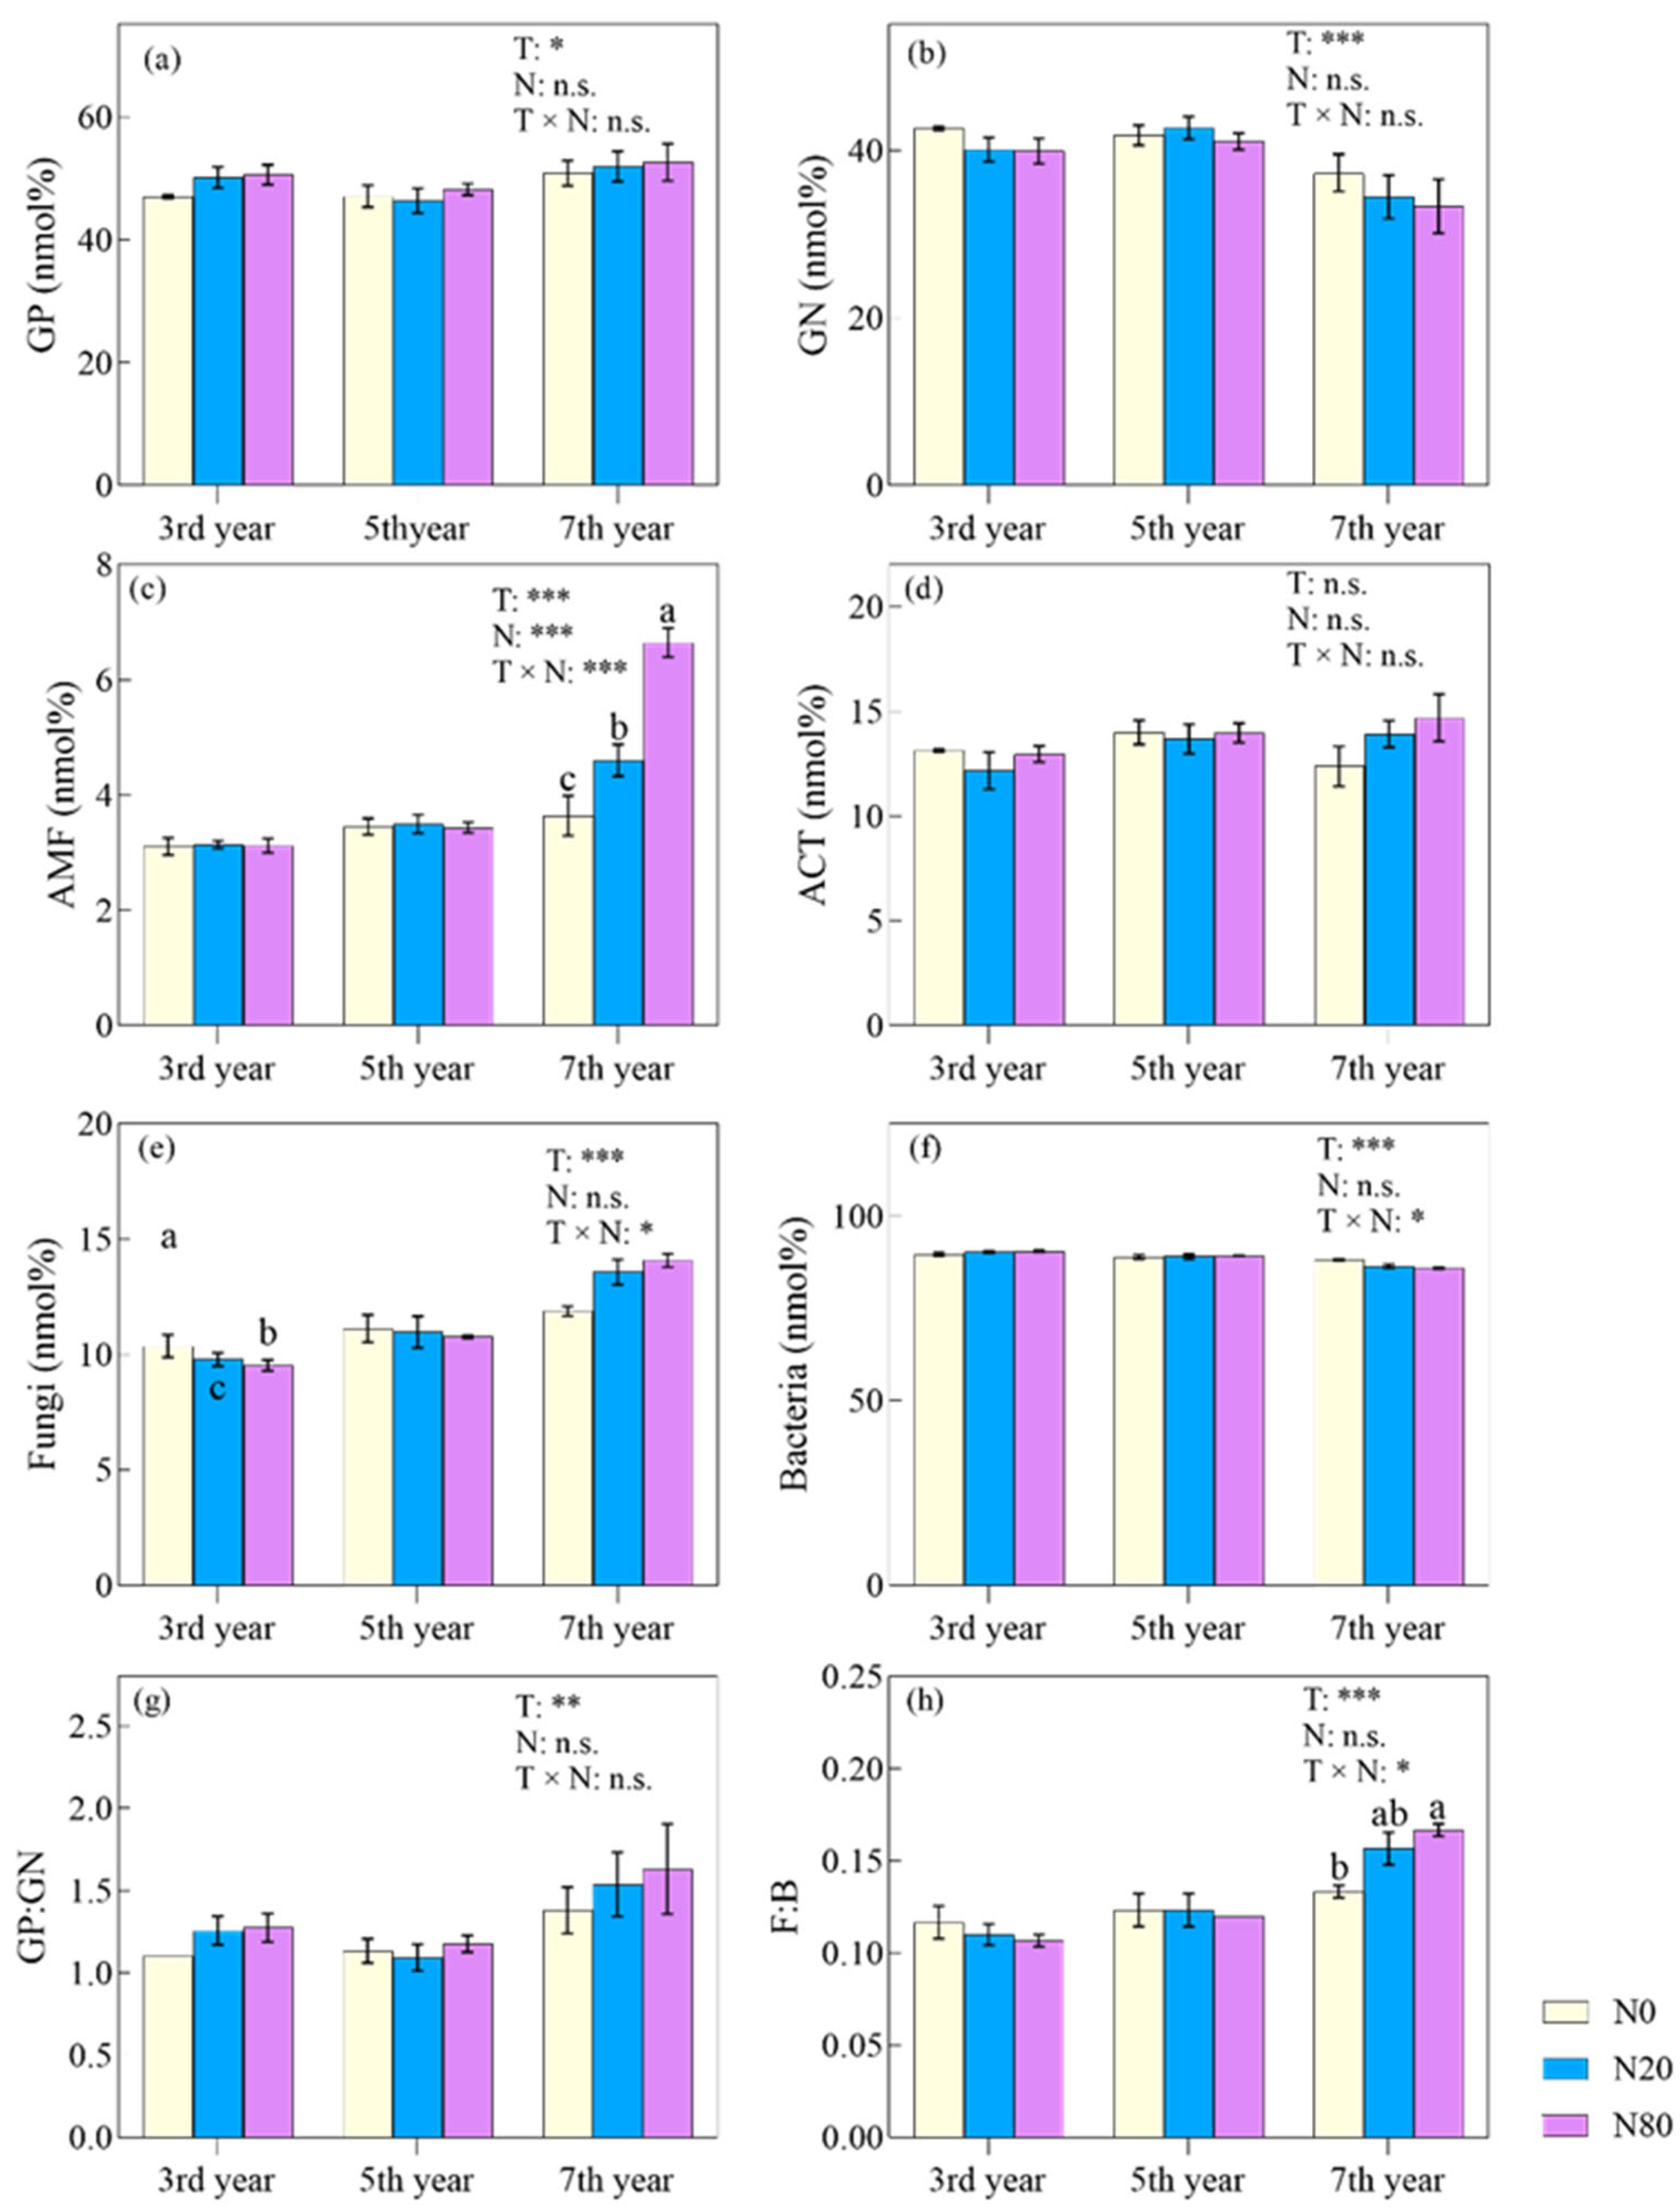
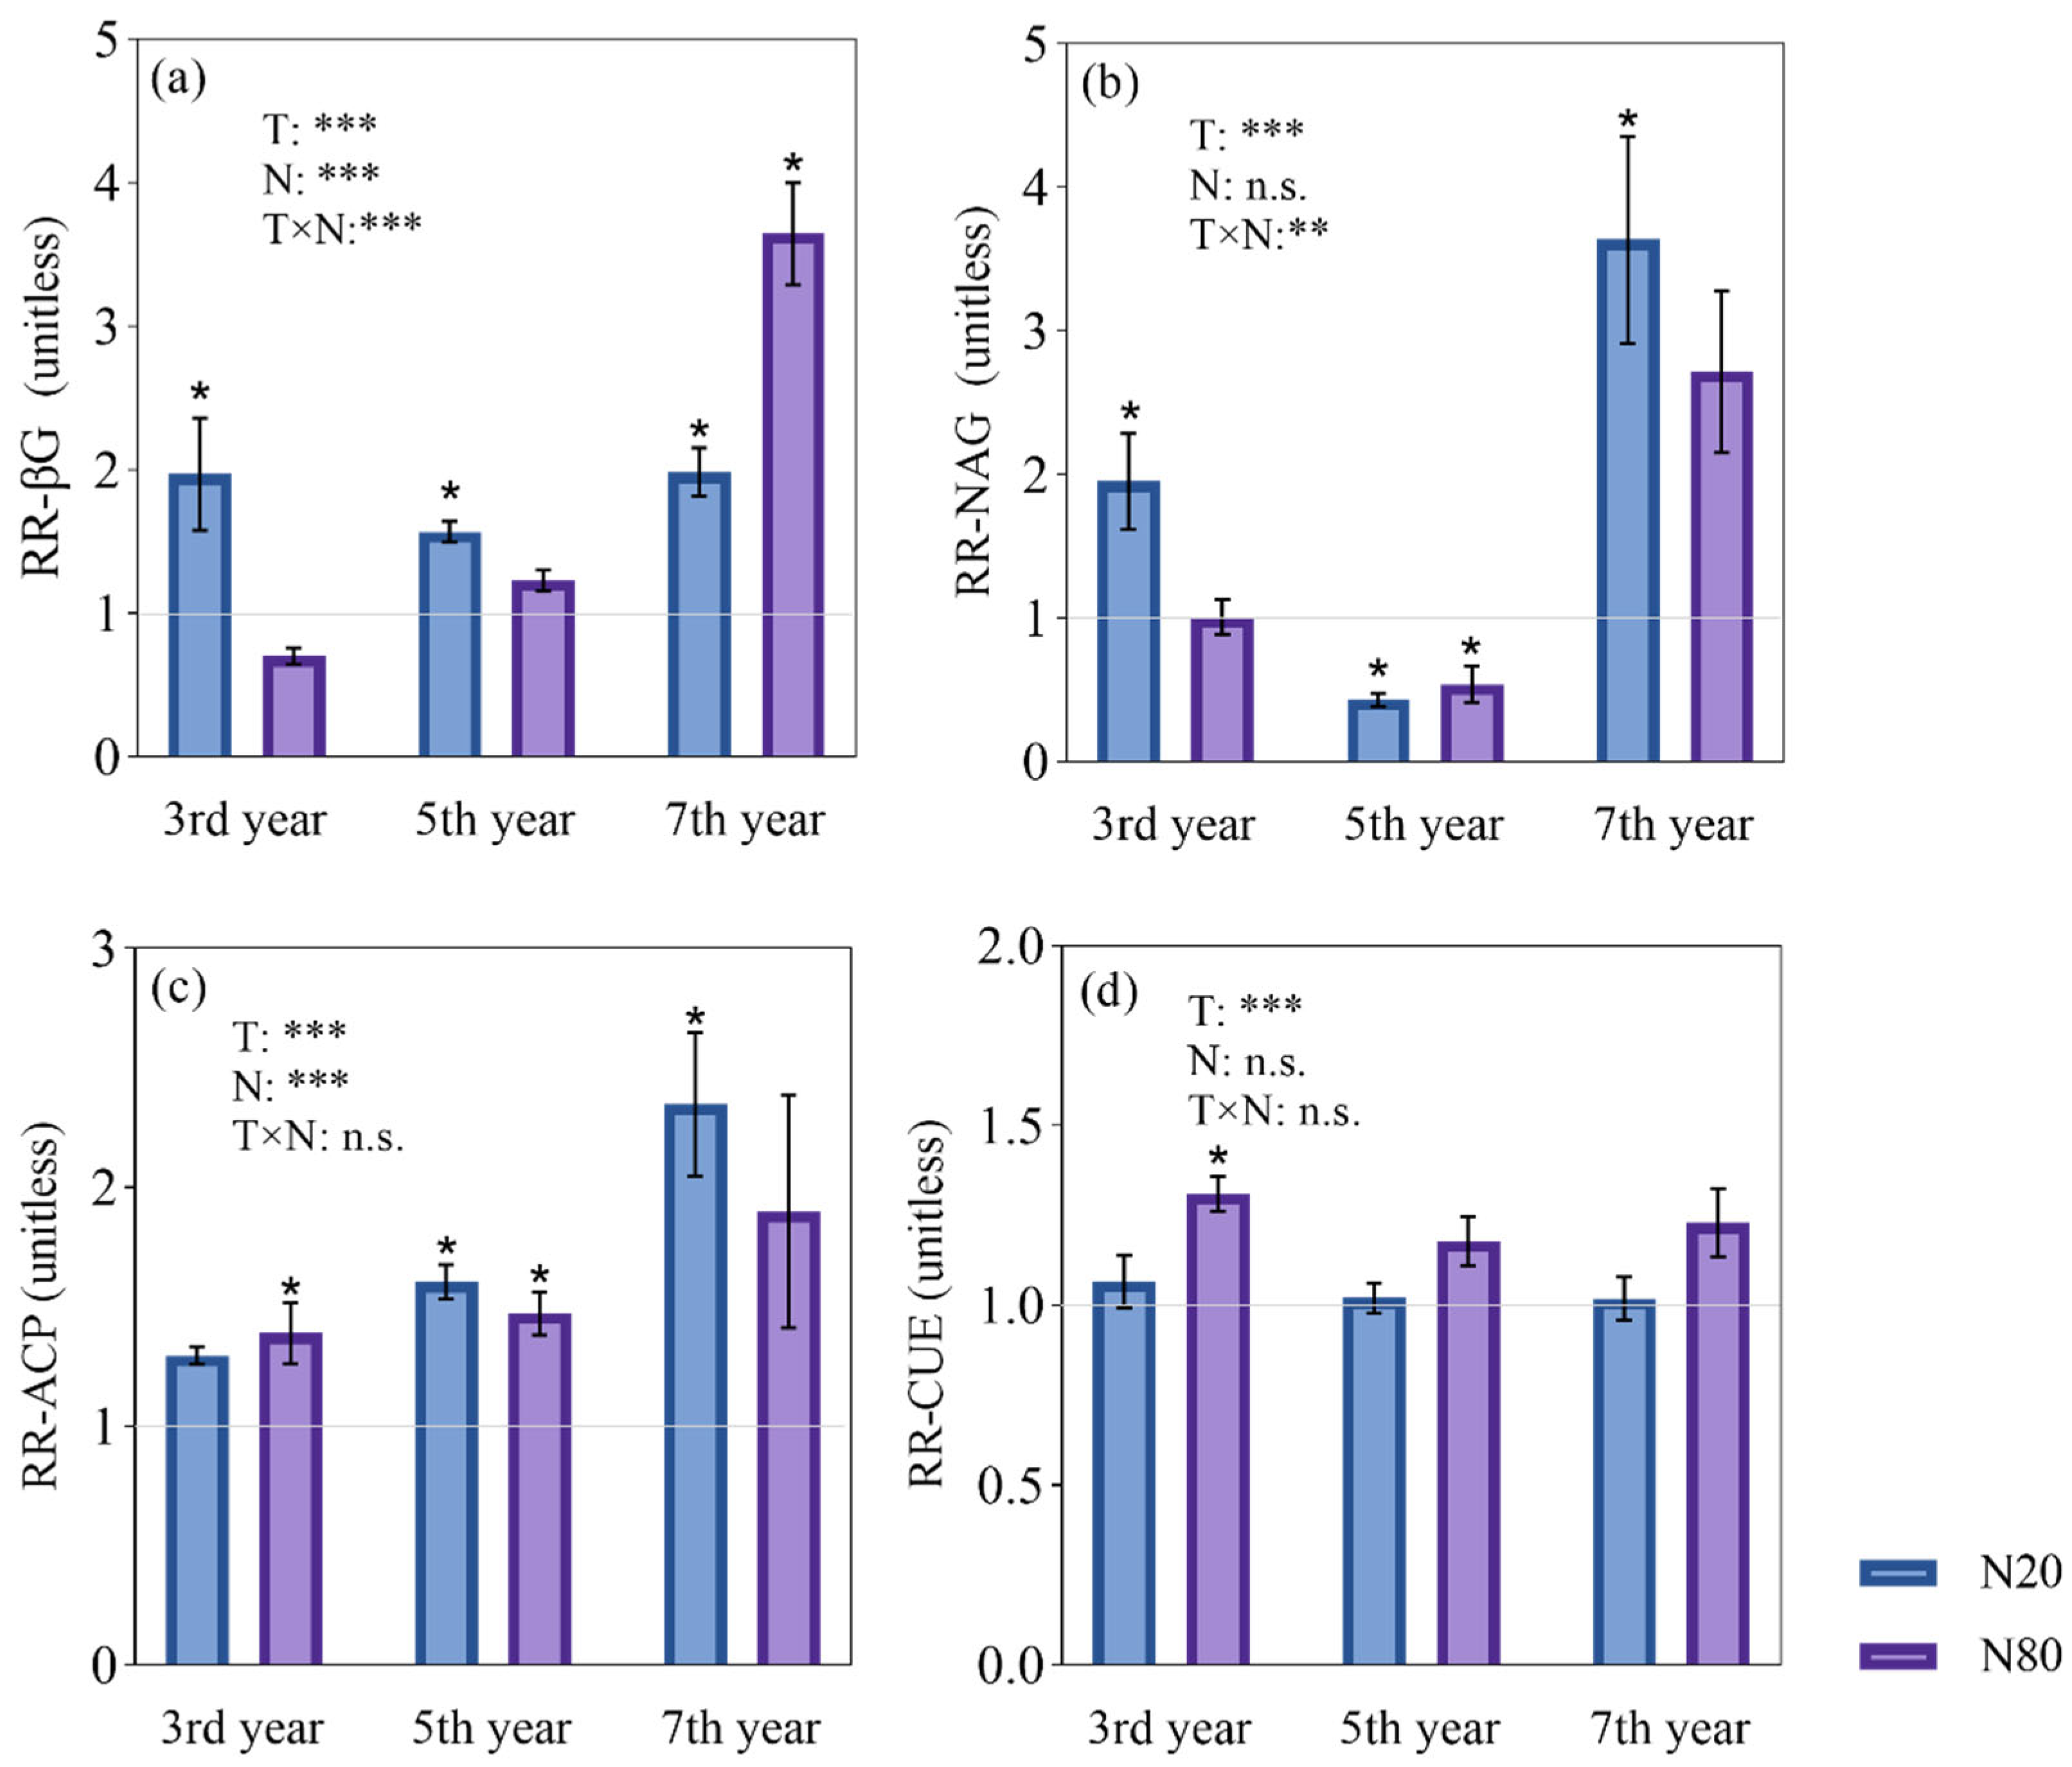
3.2. Effects of Nitrogen Addition on Microbial Characteristics

Compared to N0, high N addition increased the MBC in the third year, increased the MBN in the seventh year, and decreased the MBC and MBP in the seventh year (Figure 2). N addition had an insignificant effect on the proportion of PLFAs except AMF in the seventh year (Figure 3). Specifically, the proportion of AMF was increased by N addition, and it increased with the increasing addition. In addition, GP:GN and F:B were not affected by N addition (>0.05).
The enzyme activity and CUE were affected by N addition (Figure 4). βG and ACP were increased by N addition except βG under N80 in the third year (p < 0.05, Figure 4a, 4c). The NAG activity was, respectively, increased under N20 in the third and seventh years, and under N80 in the seventh year. Distinctively, the NAG activity was inhibited by N addition in the fifth year (p < 0.05, Figure 4b). In addition, CUE was markedly increased under N80 compared to N0 in the third year (p < 0.05, Figure 4d).

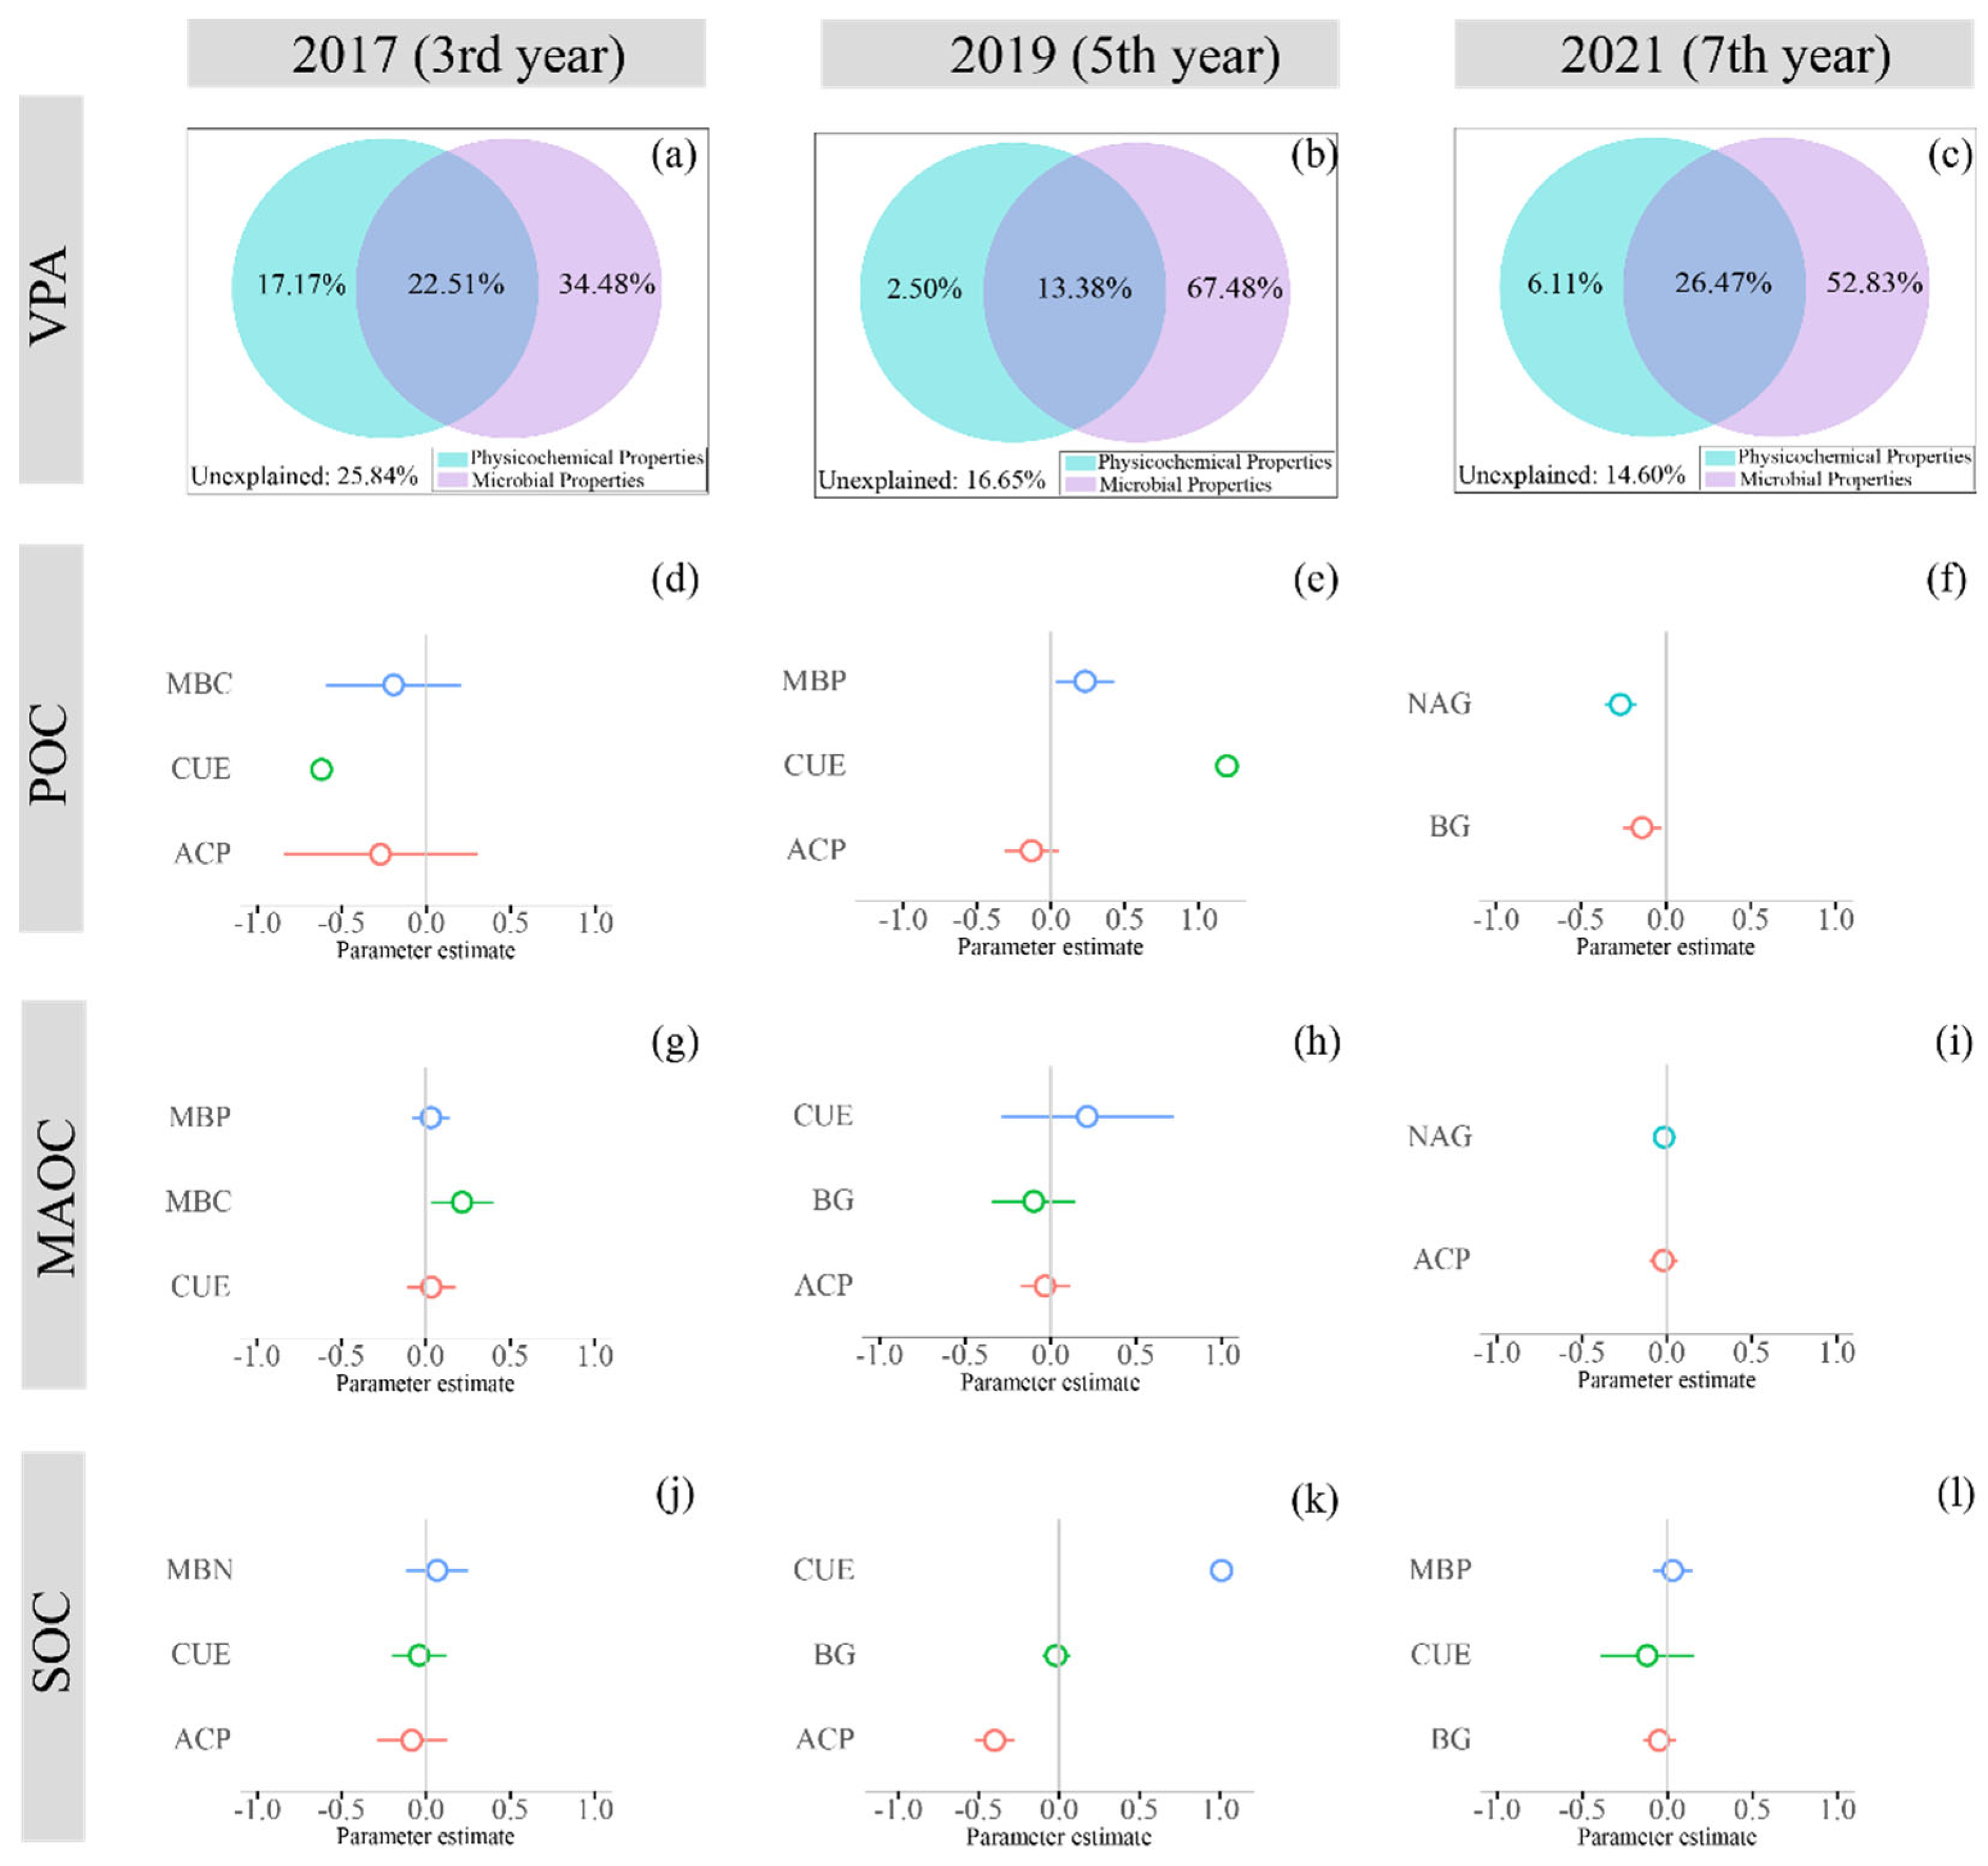
3.3. The Driving Factors of SOC Fractions under Different Durations

Soil physicochemical properties and the microbial community composition accounted for 74.16%, 83.35%, and 85.40% of the variation in SOC fractions in the third, fifth, and seventh years of N addition, respectively. Variance partitioning showed that the proportion of soil physicochemical properties decreased with N addition duration, accounting for 17.17%, 2.50%, and 6.11% of the variation in SOC fractions, respectively, for each duration, and the proportion of microbial properties increased, accounting for 34.48%, 67.48%, and 52.83%, respectively. The interaction of the two driving factors accounted for 22.51%, 13.38.00%, and 26.47% of the variation, respectively (Figure 5a–c).
As a whole, microbial properties dominated the variation in SOC fractions; therefore, the microbial biomass, composition, and function (enzyme activity and CUE) were selected in the model selection process to screen the main factors driving the variations in SOC fractions, as shown in Figure 5. In detail, POC was negatively related to CUE, while MAOC was positively related to MBC, and ACP, MBN, and MBP also explanatory variables for SOC and its fractions in the third year of N addition (Figure 5d,g,j). In the fifth year of N addition, CUE and ACP were positively and negatively related to POC, MAOC, and SOC, respectively. MBP and βG are also the explanatory variables for SOC and its fractions in the fifth year (Figure 5e,h,k). As shown in Figure 5f,i,l, NAG and βG were negatively related to POC in the seventh year, and ACP and MBP CUE were explanatory variables for MAOC and SOC, respectively.

4. Discussion

4.1. SOC Fractions Responded Differently under Different N Addition Durations

Our study showed that N addition had an insignificant effect on the SOC concentration (Figure 1, Table S3). SOC storage depends on the balance between input and output [43,44]. Increased N deposition generally increases C inputs to soil, as elevated N can facilitate plant biomass production [12,45,46] while increasing microbial activity and accelerating the mineralization of SOC, resulting in the relative balance of the SOC stock. The RR of POC and MAOC under N addition was opposite among N addition durations, suggesting that SOC fractions were significantly changed by N addition, and the effects varied with different N addition levels and durations.
The POC concentration decreased significantly under 3 years N addition, consistent with hypothesis 1, which is contrary to what was concluded in some studies that found that N induced increases in plant input and soil acidification, which inhibited the microbial decomposition of litter and led to the accumulation of POC [1,12,47,48]. However, we did not find soil acidification, and microbial composition was not significantly affected by N addition (Figure 3). In contrast, the addition of N increased the concentration of soil-available N, which may reduce the belowground C allocation to obtain N. Considering that plant-derived C is the main source of POC [49,50,51], this may be the reason for the decrease in POC under short-term N addition. In addition, relevant studies also pointed out that the increase in N availability will increase microbial activity and CUE, making the loss of POC by decomposition much larger than its input [21], which is similar to our findings.
Consistent with part of our hypothesis 1, MAOC/SOC increased under N addition in the third year of N addition, suggesting that short-term N addition significantly increased SOC stability. MAOC is considered a recalcitrant SOC with a relatively long turnover time [7,52], and is difficult for microbes to utilize [44]. Therefore, the increased microbial activity by N addition might not affect the persistence of MAOC. Moreover, it was also pointed out that microbial residues contribute to MAOC [15], and the accelerated microbial turnover rate and the microbe biomass determine the formation of new MAOC [14,53]. In our study, MBC significantly increased under short-term N addition in the third year (Figure 2a), which might lead to an increase in MAOC. In the fifth year of N addition, the MAOC of the N20 treatment was significantly lower than that of N0, but there was an insignificant difference between N80 and the control, suggesting that lower N addition in the fifth year might lead to a decline in SOC stability. Our study indicated that short-term N addition significantly increased MAOC/SOC, while a longer duration of N addition had an insignificant effect on MAOC/SOC (Figure 1), suggesting that the response of SOC stability to short-term N addition was more intense, and the short-term N addition significantly increased SOC stability, while longer duration of N addition had an insignificant effect on it.

4.2. Effects of N Addition on Microbial Properties under Different Durations

N addition had an insignificant effect on the microbial composition except for an increase in the proportion of AMF in the seventh year. AMF obtains carbohydrates from plant roots, which are used to mineralize SOM to provide nutrients for plant growth [54,55]. Our study showed that AMF was increased under long-term (>7 years) N addition, which is inconsistent with some previous studies. Han et al. [55] pointed out in a meta-analysis that pH change (soil acidification) rather than available N was more important in reducing AMF. Moreover, when phosphorus is limited in soil, there is a possibility that N addition will have a positive effect on AMF [55]. Our study area, located in the subtropical zone, is considered a relatively P-limited area [56], and the ACP enzyme activity was enhanced compared to N0 in our study, which shows our finding of relative P deficiency. In addition, Zhou et al. [57] also found that N addition improved GP:GN and decreased F:B, which is different from what we observed in our study in that N addition did not affect GP:GN and F:B ratios. The inconsistency may be due to the high utilization efficiency of soil-available N by P. edulis [49], which weakens the effect of N addition on soil microbes. Moreover, N addition increased BG and ACP activity at different periods except for NAG in the fifth year (Figure 4). NAG is the main extracellular enzyme for microbes to obtain N, and N addition reduces the microbial demand for N and thus NAG activity. Relevant studies also found that N promotes the synthesis of extracellular enzymes rich in N by microbes, and thus improves enzyme activity, which supports our results [58,59].

4.3. The Relationship between Microbial Communities and SOC Fractions under Different Durations

CUE is a function of both substrate quality, which is defined as the proportion of assimilated substrates that are used for growth and enzyme production, and being mineralized or respired [20]. It is announced that microbial CUE plays a key role in the formation and turnover of SOC fractions under N addition [13,19]. POC lacks a protection mechanism compared with MAOC [44] and might be easily utilized by microbes. Therefore, short-term N addition might improve microbial activity [23,44,60], and thus facilitate the utilization of labile fractions (POC). Consistently, we found that N addition increased the MBC, βG, and ACP while decreasing the POC concentration. Additionally, microbial utilization of POC might promote an increase in CUE, which explains the negative correlation between CUE and POC in our study (Figure 5d).
In addition, a positive correlation between MAOC and MBC under short-term N (third year) addition was found (Figure 5g), suggesting a positive impact of increased MBC on the formation of MAOC. Duan et al. [11] found that improved soil N availability by short-term N addition can increase MBC and microbial residues, and further promote the accumulation of MAOC, which is in agreement with the results of our study. Greater microbial CUE and/or turnover will lead to more MBC and microbial residue accumulation, thereby increasing the MAOC pool [11,61]. Therefore, the change in MAOC concentration may be caused by the change in MBC in response to N addition [62,63,64]. These findings support our hypothesis that increasing MBC promotes the accumulation of MAOC.
There was an insignificant change in CUE in the fifth and seventh years (Figure 4d), which might not be the most important driving factor for change in SOC and its fractions under longer duration of N addition. The longer duration did not change the soil pH in our study (Table S2), which is inconsistent with our hypothesis that microbial CUE is inhibited by soil acidification. However, N addition had greater positive impacts on βG and NAG activities in the seventh year than in to the third and fifth years (Figure 4). Moreover, these enzymes were the best predictors of the POC concentration under N addition for 7 years (Figure 5). Indeed, previous studies emphasized the importance of βG and NAG in the decomposition of SOC [65,66]. Therefore, we posit that long-term N addition (>7 years) will decrease the POC concentration by promoting enzyme activity. Notably, we did not find changes in POC/SOC and MAOC/POC in the fifth and seventh years as in the third year; thus, we still believe that a longer duration of N addition will not affect the SOC stability, although the RR-POC was decreased in the seventh year.
Moreover, some studies pointed out that increased available N in soil under long-term N addition might lead to a significant decrease in soil C/N, resulting in relative C limitation for microbes [67,68], and subsequently causing the microbial biomass to be reduced (Figure 2a,c) [69]. When soil microbes are relatively limited by a certain element, this will promote them to synthesize corresponding element acquisition enzymes [65,66], which is supported by the rapid increase in enzyme activity in our study (Figure 4). Additionally, the promotion of enzyme activity means that more energy or C may be allocated for microbial metabolism rather than growth, and thus explains the minor effect of N addition on CUE and MBC in the fifth and seventh years. Therefore, the fifth and seventh years of N addition did not increase the proportion of MAOC, probably because the longer durations of N addition reduce the contribution of CUE and MBC to MAOC formation. Collectively, our findings suggest that CUE and enzyme activity are important drivers of SOC fractions in response to different durations of N addition. Moreover, we found that microbial properties contributed more to SOC fractions in the fifth and seventh years than in the third year of N addition. Therefore, it is necessary to further quantify the effects of N addition on SOC sequestration and its microbial mechanisms over long durations. However, the duration of N addition was 3 to 7 years in our study, and in order to understand the response of SOC fractions under different N addition durations more clearly, it is necessary to extend the time scale to observe the long-term effects of N addition in the future research.

5. Conclusions

Although the dynamic response of SOC fractions to N deposition was extensively studied, whether and how the N deposition of different durations affects these responses remains poorly understood. SOC stability was more sensitive to short-term N addition than to a longer duration of N addition. Short-term N addition significantly changed the SOC fractions, decreasing the POC and increasing the MAOC, and affecting the stability of SOC, increasing the MAOC/SOC. However, there was an insignificant change in SOC fractions under the longer duration of N addition. Moreover, N addition had no effect on microbial composition, but regulated SOC fractions by increasing CUE and MBC in the short term, and by accelerating enzyme activity over a longer duration. Our results highlight the key role of different microbial characteristics in regulating SOC stability under different durations of N addition in P. edulis forests, and the effects of N addition over long durations on SOC and its microbial mechanisms should be paid more attention to in further research. Our study contributed to a better understanding of the effects of different durations of N addition on SOC stability in subtropical Phyllostachys edulis forests, and provided a theoretical basis for improving the artificial management and protection of forest soil under the background of N deposition.

Supplementary Materials

The following supporting information can be downloaded at: https://www.mdpi.com/article/10.3390/f14091890/s1; Table S1: Basic vegetation information of soil in our study. Table S2: Physical and chemical properties of soil in our study (mean ± Standard deviation). Table S3: The soil organic carbon fractions under different nitrogen addition durations (Mean ± Standard deviation). Table S4: The carbon use efficiency under different nitrogen addition durations (Mean ± Standard deviation).

Author Contributions

Conceptualization, Y.C.; Software, Q.Z. (Quanxin Zeng) and W.Z.; Formal analysis, Q.Z. (Quanxin Zeng) and W.Z.; Investigation, X.S.; Data curation, X.S.; Writing—original draft, Y.W.; Writing—review & editing, Y.W., Q.Z. (Qiufang Zhang) and Y.C.; Visualization, Y.W., Q.Z. (Quanxin Zeng), X.S. and W.Z.; Supervision, Q.Z. (Qiufang Zhang); Funding acquisition, Y.C. All authors have read and agreed to the published version of the manuscript.

Funding

This research was funded by Fujian Provincial Department of Science and Technology, grant number 2023R1002002.

Data Availability Statement

The data presented in this study are available on request from the corresponding author. The data are not publicly available due to privacy restrictions.

Conflicts of Interest

The authors declare no conflict of interest.

References

  1. Chen, J.G.; Xiao, W.; Zheng, C.Y.; Zhu, B. Nitrogen addition has contrasting effects on particulate and mineral-associated soil organic carbon in a subtropical forest. Soil Biol. Biochem. 2020, 142, 107708. [Google Scholar] [CrossRef]
  2. Clark, C.M.; Tilman, D. Loss of plant species after chronic low-level nitrogen deposition to prairie grasslands. Nature 2008, 451, 712–715. [Google Scholar] [CrossRef] [PubMed]
  3. Liu, X.J.; Zhang, Y.; Han, W.X.; Tang, A.H.; Shen, J.L.; Cui, Z.L.; Vitousek, P.; Erisman, J.M.; Goulding, K.; Christie, P.; et al. Enhanced nitrogen deposition over China. Nature 2013, 494, 459–462. [Google Scholar] [CrossRef] [PubMed]
  4. Bradford, M.A.; Wieder, W.R.; Bonan, G.B.; Fierer, N.; Raymond, P.A.; Crowther, T.W. Managing uncertainty in soil carbon feedbacks to climate change. Nat. Clim. Chang. 2016, 6, 751–758. [Google Scholar] [CrossRef]
  5. Jackson, R.B.; Lajtha, K.; Crow, S.E.; Hugelius, G.; Kramer, M.G.; Piñeiro, G. The ecology of soil carbon: Pools, vulnerabilities, and biotic and abiotic controls. Annu. Rev. Ecol. Evol. Syst. 2017, 48, 419–445. [Google Scholar] [CrossRef]
  6. Guenet, B.; Gabrielle, B.; Chenu, C.; Arrouays, D.; Balesdent, J.; Bernoux, M.; Bruni, E.; Caliman, J.P.; Cardinael, R.; Chen, S.C.; et al. Can N2O emissions offset the benefits from soil organic carbon storage? Glob. Chang. Biol. 2021, 27, 237–256. [Google Scholar] [CrossRef]
  7. Lavallee, J.M.; Soong, J.L.; Cotrufo, M.F. Conceptualizing soil organic matter into particulate and mineral-associated forms to address global change in the 21st century. Glob. Chang. Biol. 2020, 26, 261–273. [Google Scholar] [CrossRef]
  8. Lugato, E.; Lavallee, J.M.; Haddix, M.L.; Panagos, P.; Cotrufo, M.F. Different climate sensitivity of particulate and mineral associated soil organic matter. Nat. Geosci. 2021, 14, 295–300. [Google Scholar] [CrossRef]
  9. Cotrufo, M.F.; Ranalli, M.G.; Haddix, M.L.; Six, J.; Lugato, E. Soil carbon storage informed by particulate and mineral-associated organic matter. Nat. Geosci. 2019, 12, 989–994. [Google Scholar] [CrossRef]
  10. Yu, W.J.; Huang, W.J.; Weintraub-Leff, S.R.; Hall, S.J. Where and why do particulate organic matter (POM) and mineral-associated organic matter (MAOM) differ among diverse soils? Soil Biol. Biochem. 2022, 172, 108756. [Google Scholar] [CrossRef]
  11. Duan, P.P.; Wang, K.L.; Li, D.J. Nitrogen addition effects on soil mineral-associated carbon differ between the valley and slope in a subtropical karst forest. Geoderma 2023, 116357. [Google Scholar] [CrossRef]
  12. Zhu, X.M.; Zhang, Z.L.; Liu, D.Y.; Kou, Y.P.; Zheng, Q.; Liu, M.; Xiao, J.; Liu, Q.; Yin, H.J. Differential impacts of nitrogen addition on rhizosphere and bulk-soil carbon sequestration in an alpine shrubland. J. Ecol. 2020, 108, 2309–2320. [Google Scholar] [CrossRef]
  13. Cotrufo, M.F.; Soong, J.L.; Horton, A.J.; Campbell, E.E.; Haddix, M.L.; Wall, D.H.; Parton, A.J. Formation of soil organic matter via biochemical and physical pathways of litter mass loss. Nat. Geosci. 2015, 8, 776–779. [Google Scholar] [CrossRef]
  14. Kallenbach, C.M.; Frey, S.D.; Grandy, A.S. Direct evidence for microbial-derived soil organic matter formation and its ecophysiological controls. Nat. Commun. 2016, 7, 13630. [Google Scholar] [CrossRef] [PubMed]
  15. Liang, C.; Schimel, J.P.; Jastrow, J.D. The importance of anabolism in microbial control over soil carbon storage. Nat. Microbiol. 2017, 2, 17105. [Google Scholar] [CrossRef] [PubMed]
  16. Luo, R.Y.; Luo, J.F.; Fan, J.L.; Liu, D.Y.; He, J.S.; Perveen, N.; Ding, W.X. Responses of soil microbial communities and functions associated with organic carbon mineralization to nitrogen addition in a Tibetan grassland. Pedosphere 2020, 30, 214–225. [Google Scholar] [CrossRef]
  17. Zumsteg, A.; Bååth, E.; Stierli, B.; Zeyer, J.; Frey, B. Bacterial and fungal community responses to reciprocal soil transfer along a temperature and soil moisture gradient in a glacier forefield. Soil Biol. Biochem. 2013, 61, 121–132. [Google Scholar] [CrossRef]
  18. Cenini, V.L.; Fornara, D.A.; McMullan, G.; Ternan, N.; Carolan, R.; Crawley, M.J.; Clément, J.; Lavorel, S. Linkages between extracellular enzyme activities and the carbon and nitrogen content of grassland soils. Soil Biol. Biochem 2016, 96, 198–206. [Google Scholar] [CrossRef]
  19. Feng, X.H.; Qin, S.Q.; Zhang, D.Y.; Chen, P.D.; Hu, J.; Wang, G.Q.; Liu, Y.; Wei, B.; Li, Q.L.; Yang, Y.H.; et al. Nitrogen input enhances microbial carbon use efficiency by altering plant–microbe–mineral interactions. Glob. Chang. Biol. 2022, 28, 4845–4860. [Google Scholar] [CrossRef]
  20. Cotrufo, M.F.; Wallenstein, M.D.; Boot, C.M.; Denef, K.; Paul, E. The Microbial Efficiency-Matrix Stabilization (MEMS) framework integrates plant litter decomposition with soil organic matter stabilization: Do labile plant inputs form stable soil organic matter? Glob. Chang. Biol. 2013, 19, 988–995. [Google Scholar] [CrossRef]
  21. Chen, Q.Y.; Hu, Y.L.; Hu, A.; Niu, B. Shifts in the dynamic mechanisms of soil organic matter transformation with nitrogen addition: From a soil carbon/nitrogen-driven mechanism to a microbe driven mechanism. Soil Biol. Biochem. 2021, 160, 108355. [Google Scholar] [CrossRef]
  22. Averill, C.; Waring, B. Nitrogen limitation of decomposition and decay: How can it occur? Glob. Chang. Biol. 2018, 24, 1417–1427. [Google Scholar] [CrossRef] [PubMed]
  23. Stone, B.W.; Li, J.H.; Koch, B.J.; Blazewicz, S.J.; Dijkstra, P.; Hayer, M.; Hofmockel, K.S.; Liu, X.J.A.; Mau, R.L.; Morrissey, E.M.; et al. Nutrients cause consolidation of soil carbon flux to small proportion of bacterial community. Nat. Commun. 2021, 12, 3381. [Google Scholar] [CrossRef] [PubMed]
  24. Mueller, N.D.; Gerber, J.S.; Johnston, M.; Ray, D.K.; Ramankutty, N.; Foley, J.A. Closing yield gaps through nutrient and water management. Nature 2012, 490, 254–257. [Google Scholar] [CrossRef] [PubMed]
  25. Horn, E.L.; Cooledge, E.C.; Jones, D.L.; Hoyle, F.C.; Brailsford, F.L.; Murphy, D.V. Addition of base cations increases microbial carbon use efficiency and biomass in acidic soils. Soil Biol. Biochem. 2021, 161, 108392. [Google Scholar] [CrossRef]
  26. Zeng, Q.X.; Yuan, X.C.; Zhou, J.C.; Wu, J.M. Effects of nitrogen addition on the kinetic parameters of soil acid phosphomonoesterase in a Moso bamboo forest. Chin. J. Appl. Ecol. 2022, 33, 2178–2186. (In Chinese) [Google Scholar]
  27. Cheng, L.; Lin, K.M.; Zhou, J.C.; Zhang, Q.F.; Zeng, X.M.; Ji, Y.H.; Zheng, Y.; Xu, J.G.; Chen, Y.M. Effects of nitrogen deposition on the concentration and spectral characteristics of dissolved organic matter in soil in Moso bamboo plantations. Chin. J. Appl. Ecol. 2019, 30, 1754–1762. (In Chinese) [Google Scholar]
  28. Chen, J.; Luo, T.S.; Zhou, Z.; Xu, H.; Chen, D.X.; Li, Y.D.; Jiang, Z.Y. Research advances in nitrogen deposition effects on microbial processes involved in soil nitrogen cycling in tropical and subtropical forests. Acta Ecol. Sin. 2020, 40, 8528–8538. (In Chinese) [Google Scholar]
  29. Yu, G.R.; Jia, Y.L.; He, N.P.; Zhu, J.X.; Chen, Z.; Wang, Q.F.; Piao, S.L.; Liu, X.J.; He, H.L.; Guo, X.B.; et al. Stabilization of atmospheric nitrogen deposition in China over the past decade. Nat. Geosci. 2019, 12, 424–429. [Google Scholar] [CrossRef]
  30. Jia, Y.L.; Yu, G.R.; Gao, Y.N.; He, N.P.; Wang, Q.F.; Jiao, C.C.; Zuo, Y. Global inorganic nitrogen dry deposition inferred from ground- and space-based measurements. Sci. Rep. 2016, 6, 19810. [Google Scholar] [CrossRef]
  31. Robertson, A.D.; Paustian, K.; Ogle, S.; Wallenstein, M.D.; Lugato, E.; Cotrufo, M.F. Unifying soil organic matter formation and persistence frameworks: The MEMS model. Biogeosciences 2019, 16, 1225–1248. [Google Scholar] [CrossRef]
  32. Vance, E.D.; Brookes, P.C.; Jenkinson, D.S. An extraction method for measuring soil microbial biomass C. Soil Biol. Biochem. 1987, 19, 703–707. [Google Scholar] [CrossRef]
  33. White, D.C.; Davis, W.M.; Nickels, J.S.; King, J.D.; Bobbie, R.J. Determination of the sedimentary microbial biomass by extractible lipid phosphate. Oecologia 1979, 40, 51–62. [Google Scholar] [CrossRef] [PubMed]
  34. Bardgett, R.D.; Hobbs, P.J.; Frostegård, Å. Changes in soil fungal: Bacterial biomass ratios following reductions in the intensity of management of an upland grassland. Biol. Fertil. Soils 1996, 22, 261–264. [Google Scholar] [CrossRef]
  35. Joergensen, R.G. Phospholipid fatty acids in soil-drawbacks and future prospects. Biol. Fertil. Soils 2022, 58, 1–6. [Google Scholar] [CrossRef]
  36. Saiya-Cork, K.R.; Sinsabaugh, R.L.; Zak, D.R. The effects of long term nitrogen deposition on extracellular enzyme activity in an Acer saccharum forest soil. Soil Biol. Biochem. 2002, 34, 1309–1315. [Google Scholar] [CrossRef]
  37. Sinsabaugh, R.L.; Turner, B.L.; Talbot, J.M.; Waring, B.G.; Powers, J.S.; Kuske, C.R.; Moorhead, D.L.; Shah, J.J.F. Stoichiometry of microbial carbon use efficiency in soils. Ecol. Monogr. 2016, 86, 172–189. [Google Scholar] [CrossRef]
  38. Borcard, D.; Legendre, P.; Drapeau, P. Partialling out the spatial component of ecological variation. Ecology 1992, 73, 1045–1055. [Google Scholar] [CrossRef]
  39. Schmidt-Nielsen, K. Scaling: Why Is Animal Size So Important? Cambridge University Press: New York, NY, USA, 1984. [Google Scholar]
  40. Dormann, C.F.; Elith, J.; Bacher, S.; Buchmann, C.; Carl, G.; Carré, G.; Marquéz, J.R.G.; Gruber, B.; Lafourcade, B.; Leitão, P.J.; et al. Collinearity: A review of methods to deal with it and a simulation study evaluating their performance. Ecography 2013, 36, 27–46. [Google Scholar] [CrossRef]
  41. Burnham, K.; Anderson, D. Model Selection and Multimodel Inference: A Practical Information-Theoretic Approach; Springer: New York, NY, USA, 2002. [Google Scholar]
  42. Bartoń, K. MuMIn: Multi-Model Inference. R Package v. 1.43.17. 2020. Available online: https://CRAN.R-project.org/package=MuMIn (accessed on 15 May 2023).
  43. Shi, L.; Dech, J.P.; Yao, H.; Zhao, P.; Shu, Y.; Zhou, M. The effects of nitrogen addition on dissolved carbon in boreal forest soils of northeastern China. Sci. Rep. 2019, 9, 8274. [Google Scholar] [CrossRef]
  44. Tang, B.; Rocci, K.S.; Lehmann, A.; Rillig, M.C. Nitrogen increases soil organic carbon accrual and alters its functionality. Glob. Chang. Biol. 2023, 29, 1971–1983. [Google Scholar] [CrossRef] [PubMed]
  45. Chen, H.; Li, D.; Feng, W.; Niu, S.; Plante, A.; Luo, Y.; Wang, K. Different responses of soil organic carbon fractions to additions of nitrogen. Eur. J. Soil Sci. 2018, 69, 1098–1104. [Google Scholar] [CrossRef]
  46. Wan, D.; Ma, M.K.; Peng, N.; Luo, X.S.; Chen, W.L.; Cai, P.; Wu, L.H.; Pan, H.B.; Chen, J.B.; Yu, G.H.; et al. Effects of long-term fertilization on calcium-associated soil organic carbon: Implications for C sequestration in agricultural soils. Sci. Total Environ. 2021, 772, 145037. [Google Scholar] [CrossRef]
  47. Zak, D.R.; Freedman, Z.B.; Upchurch, R.A.; Steffens, M.; Kögel-Knabner, I. Anthropogenic N deposition increases soil organic matter accumulation without altering its biochemical composition. Glob. Chang. Biol. 2017, 23, 933–944. [Google Scholar] [CrossRef] [PubMed]
  48. Argiroff, W.A.; Zak, D.R.; Upchurch, R.A.; Salley, S.O.; Grandy, A.S. Anthropogenic N deposition alters soil organic matter biochemistry and microbial communities on decaying fine roots. Glob. Chang. Biol. 2019, 25, 4369–4382. [Google Scholar] [CrossRef]
  49. Lai, Y.N.; Zhong, Q.L.; Li, B.Y.; Cheng, D.L.; Yu, H.; Xu, C.B.; Xue, X.H.; Zheng, W.T. Effect of nitrogen addition on the growth of Phyllostachys edulis and evergreen broad-leaved trees in different Vegetation Types. Prot. For. Sci. Technol. 2021, 2, 1–7. (In Chinese) [Google Scholar]
  50. Niu, L.M.; Qin, H.; Xu, Q.F.; Wu, Q.F.; Miao, J.J.; Peng, D.C. Effects of Long-term plantation of Phyllostachys edulis on evolution of arbuscular mycorrhizal fungus community in soil. Acta Pet. Sin. 2017, 54, 722–734. (In Chinese) [Google Scholar]
  51. Ye, C.L.; Chen, D.M.; Hall, S.J.; Pan, S.; Yan, X.B.; Bai, T.S.; Guo, H.; Zhang, Y.; Bai, Y.F.; Hu, S.J. Reconciling multiple impacts of nitrogen enrichment on soil carbon: Plant, microbial and geochemical controls. Ecol. Lett. 2018, 21, 1162–1173. [Google Scholar] [CrossRef]
  52. Schmidt, M.W.I.; Torn, M.S.; Abiven, S.; Dittmar, T.; Guggenberger, G.; Janssens, I.A.; Kleber, M.; Kögel-Knabner, I.; Lehmann, J.; Manning, D.A.C.; et al. Persistence of soil organic matter as an ecosystem property. Nature 2011, 478, 49–56. [Google Scholar] [CrossRef]
  53. Liang, C.; Amelung, W.; Lehmann, J.; Kästner, M. Quantitative assessment of microbial necromass contribution to soil organic matter. Glob. Chang. Biol. 2019, 25, 3578–3590. [Google Scholar] [CrossRef]
  54. Treseder, K.K. A meta-analysis of mycorrhizal responses to nitrogen, phosphorus, and atmospheric CO2 in field studies. New Phytol. 2004, 164, 347–355. [Google Scholar] [CrossRef] [PubMed]
  55. Han, Y.; Feng, J.; Han, M.; Zhu, B. Responses of arbuscular mycorrhizal fungi to nitrogen addition: A meta-analysis. Glob. Chang. Biol. 2020, 26, 7229–7241. [Google Scholar] [CrossRef] [PubMed]
  56. Fan, Y.X.; Zhong, X.J.; Lin, F.; Liu, C.C.; Yang, L.M.; Wang, M.H.; Chen, G.S.; Chen, Y.M.; Yang, Y.S. Responses of soil phosphorus fractions after nitrogen addition in a subtropical forest ecosystem: Insights from decreased Fe and Al oxides and increased plant roots. Geoderma 2019, 337, 246–255. [Google Scholar] [CrossRef]
  57. Zhou, Z.H.; Wang, C.K.; Zheng, M.H.; Jiang, L.F.; Luo, Y.Q. Patterns and mechanisms of responses by soil microbial communities to nitrogen addition. Soil Biol. Biochem. 2017, 115, 433–441. [Google Scholar] [CrossRef]
  58. Allison, S.D.; Czimczik, C.I.; Treseder, K.K. Microbial activity and soil respiration under nitrogen addition in Alaskan boreal forest. Glob. Chang. Biol. 2008, 14, 1156–1168. [Google Scholar] [CrossRef]
  59. Sistla, S.A.; Schimel, J.P. Seasonal patterns of microbial extracellular enzyme activities in an arctic tundra soil: Identifying direct and indirect effects of long-term summer warming. Soil Biol. Biochem. 2013, 66, 119–129. [Google Scholar] [CrossRef]
  60. Manzoni, S.; Taylor, P.; Richter, A.; Porporato, A.; Ågren, G.I. Environmental and stoichiometric controls on microbial carbon-use efficiency in soils. New Phytol. 2012, 196, 79–91. [Google Scholar] [CrossRef]
  61. Wang, C.; Qu, L.R.; Yang, L.M.; Liu, D.W.; Morrissey, E.; Miao, R.H.; Liu, Z.P.; Wang, Q.K.; Fang, Y.T.; Bai, E. Large-scale importance of microbial carbon use efficiency and necromass to soil organic carbon. Glob. Chang. Biol. 2021, 27, 2039–2048. [Google Scholar] [CrossRef]
  62. Samson, M.-È.; Chantigny, M.H.; Vanasse, A.; Menasseri-Aubry, S.; Royer, I.; Angers, D.A. Management practices differently affect particulate and mineral-associated organic matter and their precursors in arable soils. Soil Biol. Biochem. 2022, 148, 107867. [Google Scholar] [CrossRef]
  63. Almeida, L.F.J.; Souza, I.F.; Hurtarte, L.C.C.; Teixeira, P.P.D.C.; Inagaki, T.M.; Silva, I.; Mueller, C.M. Forest litter constraints on the pathways controlling soil organic matter formation. Soil Biol. Biochem. 2021, 163, 108447. [Google Scholar] [CrossRef]
  64. Tian, J.; Zong, N.; Hartley, I.P.; He, N.P.; Zhang, J.J.; Powlson, D.; Zhou, J.Z.; Kuzyakov, Y.; Zhang, F.S.; Yu, G.R.; et al. Microbial metabolic response to winter warming stabilizes soil carbon. Glob. Chang. Biol. 2021, 27, 2011–2028. [Google Scholar] [CrossRef] [PubMed]
  65. DeForest, J.L.; Moorhead, D.L. Effects of elevated pH and phosphorus fertilizer on soil C, N and P enzyme stoichiometry in an acidic mixed mesophytic deciduous forest. Soil Biol. Biochem. 2020, 150, 107996. [Google Scholar] [CrossRef]
  66. Fanin, N.; Mooshammer, M.; Sauvadet, M.; Meng, C.; Alvarez, G.; Bernard, L.; Bertrand, I.; Blagodatskaya, E.; Bon, L.; Fontaine, S.; et al. Soil enzymes in response to climate warming: Mechanisms and feedbacks. Funct. Ecol. 2022, 36, 1378–1395. [Google Scholar] [CrossRef]
  67. Poeplau, C.; Helfrich, M.; Dechow, R.; Szoboszlay, M.; Tebbe, C.C.; Don, A.; Greiner, B.; Zopf, D.; Thumm, U.; Korevaar, H.; et al. Increased microbial anabolism contributes to soil carbon sequestration by mineral fertilization in temperate grasslands. Soil Biol. Biochem. 2019, 130, 167–176. [Google Scholar] [CrossRef]
  68. Soares, M.; Rousk, J. Microbial growth and carbon use efficiency in soil: Links to fungal-bacterial dominance, SOC-quality, and stoichiometry. Soil Biol. Biochem. 2019, 131, 195–205. [Google Scholar] [CrossRef]
  69. Tian, D.; Jiang, L.; Ma, S.H.; Fang, W.J.; Schmid, B.; Xu, L.C.; Zhu, J.X.; Li, P.; Losapio, G.; Jing, X.; et al. Effects of nitrogen deposition on soil microbial communities in temperate and subtropical forests in China. Sci. Total Environ. 2017, 607–608, 1367–1375. [Google Scholar] [CrossRef]
Figure 1. The response ratio (RR) of SOC fractions compared to the control treatment under different nitrogen addition durations (mean ± standard deviation). Asterisks indicate significant differences compared to the N0. The horizontal dotted line (RR = 1) indicates an insignificant effect of N addition on SOC fractions. RR > 1.0 indicates that the treatment has a positive effect, and RR < 1.0 indicates that the processing has a negative effect. (a) POC: particulate organic carbon, (b) MAOC: mineral-associated organic carbon, (c) SOC: soil organic carbon, (d) POC/SOC: the ratio of particulate and soil organic carbon, (e) MAOC/SOC: the ratio of mineral-associated and soil organic carbon, (f) POC/MAOC: the ratio of particulate and mineral-associated organic carbon. T: time scale, N: nitrogen addition, and T×N: time scale and nitrogen addition interaction. * p < 0.05, ** p < 0.01, *** p < 0.001, n.s. non-significant.
Forests 14 01890 g001
Figure 2. The soil microbial biomass under different nitrogen addition durations (mean ± standard deviation). (a) MBC: microbial biomass carbon, (b) MBN: microbial biomass nitrogen, and (c) MBP: microbial biomass phosphorus. Lowercase letters indicate significant differences in the variables at the three nitrogen levels per year. T: time scale, N: nitrogen addition, and T×N: time scale and nitrogen addition interaction. ** p < 0.01, *** p < 0.001, n.s. non-significant.
Forests 14 01890 g002
Figure 3. The proportional nmol% of phospholipid fatty acid biomarkers under different nitrogen addition durations (mean ± standard deviation). Lowercase letters indicate significant differences in the variables at the three nitrogen levels per year. (a) GP: Gram-positive, (b) GN: Gram-negative, (c) AMF: arbuscular mycorrhizal fungi, (d) ACT: actinomycetes, (e) fungi, (f) bacteria, (g) GP:GN: the ratio of Gram-positive and Gram-negative, (h) the ratio of fungi and bacteria. T: Time scale, N: Nitrogen addition, T×N: time scale and nitrogen addition interaction. * p < 0.05, ** p < 0.01, *** p < 0.001, n.s. non-significant.
Forests 14 01890 g003
Figure 4. The response ratio (RR) of enzyme activity and carbon use efficiency compared to the control treatment under different nitrogen addition durations (mean ± standard deviation). (a) βG: β-glucosidase, (b) NAG: nacetyl glucosaminidase, (c) ACP: acid phosphatase, and (d) CUE: carbon use efficiency. Asterisks indicate significant differences compared to the N0. The gray horizontal lines (RR = 1) indicate no effect of N addition on SOC fractions. RR > 1.0 indicates that the treatment has a positive effect, and RR < 1.0 indicates that the processing has a negative effect. T: time scale, N: nitrogen addition, and T×N: time scale and nitrogen addition interaction. * p < 0.05, ** p < 0.01, *** p < 0.001, n.s. non-significant.
Forests 14 01890 g004
Figure 5. Variation partition analysis (ac) in soil organic carbon fractions under different nitrogen addition duration in two sets of explanatory variables (soil physicochemical properties and microbial properties, values denote the proportion of variance accounted for by each of the explanatory variables), and the model-averaged effect size of the predictors (dl) on SOC fractions under different nitrogen addition durations.
Forests 14 01890 g005
Disclaimer/Publisher’s Note: The statements, opinions and data contained in all publications are solely those of the individual author(s) and contributor(s) and not of MDPI and/or the editor(s). MDPI and/or the editor(s) disclaim responsibility for any injury to people or property resulting from any ideas, methods, instructions or products referred to in the content.

