Article

The Impact of Permafrost Change on Soil Organic Carbon Stocks in Northeast China

1
School of Civil Engineering, Heilongjiang University, Harbin 150080, China
2
School of Forestry, Northeast Forestry University, Harbin 150080, China
3
Heilongjiang Province Hydraulic Research Institute, Harbin 150080, China
*
Author to whom correspondence should be addressed.
Forests 2024, 15(1), 14; https://doi.org/10.3390/f15010014
Submission received: 10 November 2023 / Revised: 11 December 2023 / Accepted: 15 December 2023 / Published: 20 December 2023

Abstract

:
Climate warming has resulted in significant changes in permafrost in Northeast China, leading to notable alterations in soil organic carbon (SOC) stocks. These changes are crucial for both the global carbon cycle and climate change, as well as directly impacting the sustainable development of ecosystems. In order to examine the SOC dynamics and the impact of permafrost changes on SOC, we investigate the changes of permafrost extent based on a regression model and TTOP (top temperature of permafrost) model and the relationship between land use and land cover (LULC), SOC stocks, and permafrost changes in Northeast China. The results showing a shrinking permafrost area from 37.43 × 10⁴ km2 to 16.48 × 10⁴ km2 during the period from the 1980s to the 2010s in Northeast China, and the SOC stock decreased by 24.18 Tg C from the 1980s to the 1990s and then rapidly increased by 102.84 Tg C in the 2000s. Permafrost degradation speeds up the succession of LULC, impacting about 90% of the SOC in permafrost regions. The relationship between permafrost changes and SOC in Northeast China shows that permafrost degradation significantly reduces SOC stocks in the short term but increases SOC stocks in the long term, and that LULC play a crucial role in regulating this relationship. The goals of this study are to acquire an understanding of permafrost status and deepening insights into the dynamics of SOC. Simultaneously, the study aims to furnish valuable scientific references for shaping policies on sustainable land use and management in the future, all the while advancing the cause of ecological equilibrium and sustainable development in Northeast China and other areas.

1. Introduction

Soil organic carbon (SOC) is a significant contributor to greenhouse gas emissions and has a considerable impact on the global carbon cycle [1] and represents the largest carbon (C) pool within terrestrial ecosystems [2]. Globally, there is an estimated SOC pool ranging from approximately 700 Pg to 2946 Pg [3]. Against the backdrop of global warming, the relationship between SOC, climate, and the environment has become a focal point of research [4]. Climate and land cover drive SOC [5]. Temperature, precipitation, and humidity, among other factors, impact SOC by affecting plant litter, soil respiration, and microbial decomposition processes [6]. It is worth noting that the cryosphere is a critical component of the Earth’s ecosystem, covering approximately 14% of the land surface [7]. Permafrost, as one of the components of the cryosphere, is also one of the most vulnerable carbon (C) pools [8]. It is estimated that the global permafrost contains approximately 1320 ± 200 Pg of SOC [9,10]. In the Intergovernmental Panel on Climate Change (IPCC) Sixth Assessment Report [11], it was stated with high confidence that permafrost temperatures have risen to record levels, leading to increased release of methane (CH4) and carbon dioxide (CO2) from permafrost regions. The rate of permafrost warming, as exemplified by the Qinghai-Tibet Plateau at 0.3 °C per decade, significantly exceeds the global average warming rate of 0.12 °C per decade [12]. During a warming trend, permafrost undergoes significant degradation [13,14,15], which affects the process of SOC decomposition [16,17]. Alterations in the SOC pool within permafrost can have a significant impact on atmospheric CO2 concentrations, further accelerating the effects of climate change caused by global warming [9].
The relationship between permafrost changes and SOC is intricately linked to the spatial distribution of permafrost. Permafrost simulation models primarily include the Stefan model [18], the frost number model [19], the altitude model [20], and the top temperature of permafrost (TTOP) model [21]. The TTOP model, specifically, has garnered significant attention for its exceptional performance and applicability. It links surface climate with subsurface thermal features and establishes a correlation between compensation effect and climatic factors [22]. With the development of remote sensing technologies such as optical remote sensing, thermal infrared remote sensing, and microwave remote sensing, observation and mapping of perennial permafrost are carried out by developing statistical learning [23], constructing models [24,25], and logical discriminations [26]. The application of TTOP modeling has thus led to many research results [27,28,29,30]. Permafrost degradation is typically marked by a reduction in the permafrost’s extent, an elevation in soil temperature, and an increase in the active layer’s thickness [11,31,32]. This alters surface drainage patterns and the structure of vegetation communities, which impacts the physical properties of soil and ecosystems [33]. The degradation characteristics of permafrost are obvious, but the resulting environmental effects and impacts on soil organic carbon (SOC) unfold over a long period of time. The response mechanisms are multifaceted, creating complex and interconnected relationships. Permafrost degradation can hasten microbial decomposition of organic matter, rendering SOC more vulnerable to exposure and release, which could result in a decrease in SOC [34,35]. In contrast, increased soil temperatures and soil moisture resulting from permafrost degradation promote vegetation growth in the short run [36]. The carbon sequestration from the increased vegetation can offset or even exceed carbon losses [10,37]. Such uncertainty provides a cushion against SOC release, making the study of the impact of permafrost change on SOC dynamics particularly crucial.
In Northeast China, permafrost has higher temperatures compared to the permafrost in high-altitude and Arctic regions, with a thinner permafrost thickness, making it more sensitive to climate warming [38,39]. According to a report [40], the mean annual air temperature in Northeast area has risen by 0.31 °C per decade from 1961 to 2017. Climate warming has resulted in a substantial degradation of permafrost, with continuous permafrost being transformed into discontinuous permafrost and the disappearance of many isolated permafrost patches and permafrost islands [14]. Many researchers have conducted extensive research on the extent of permafrost degradation in Northeast China, utilizing multiple sources of data such as meteorological station data, measurement data from boreholes, and remote sensing data (Landsat and MODIS inverted surface temperature data, interferometric synthetic aperture radar data, etc.) [41,42,43]. However, comparing the latest results of permafrost distribution in Northeast China during the same period, it is found that the area of permafrost varies greatly, reaching 12.81 × 10⁴ km2, which indicates that further research on the distribution of permafrost in Northeast China is needed. Furthermore, since 2003, Chinese meteorological stations have switched from manual to automated measurements, resulting in significant variations in recorded ground surface temperature (GST) over different periods. This has created a lack of uniformity in GST data after this transition. Undoubtedly, permafrost is mainly concentrated in the northern part of Northeast China, where there is abundant vegetation cover, and an amount of SOC is stored in permafrost [44]. Changes in permafrost could potentially affect SOC density, stock, and succession of land type, thus impacting ecosystem evolution [45]. Land use and land cover (LULC) have a direct influence on the density and stock of SOC. Their capacity to release or sequester SOC differs significantly [46]. However, the precise distribution of permafrost in Northeast China and its impact on SOC remains unexplored, as well as the impact of LULC types on SOC in permafrost degradation zones.

2. Materials and Methods
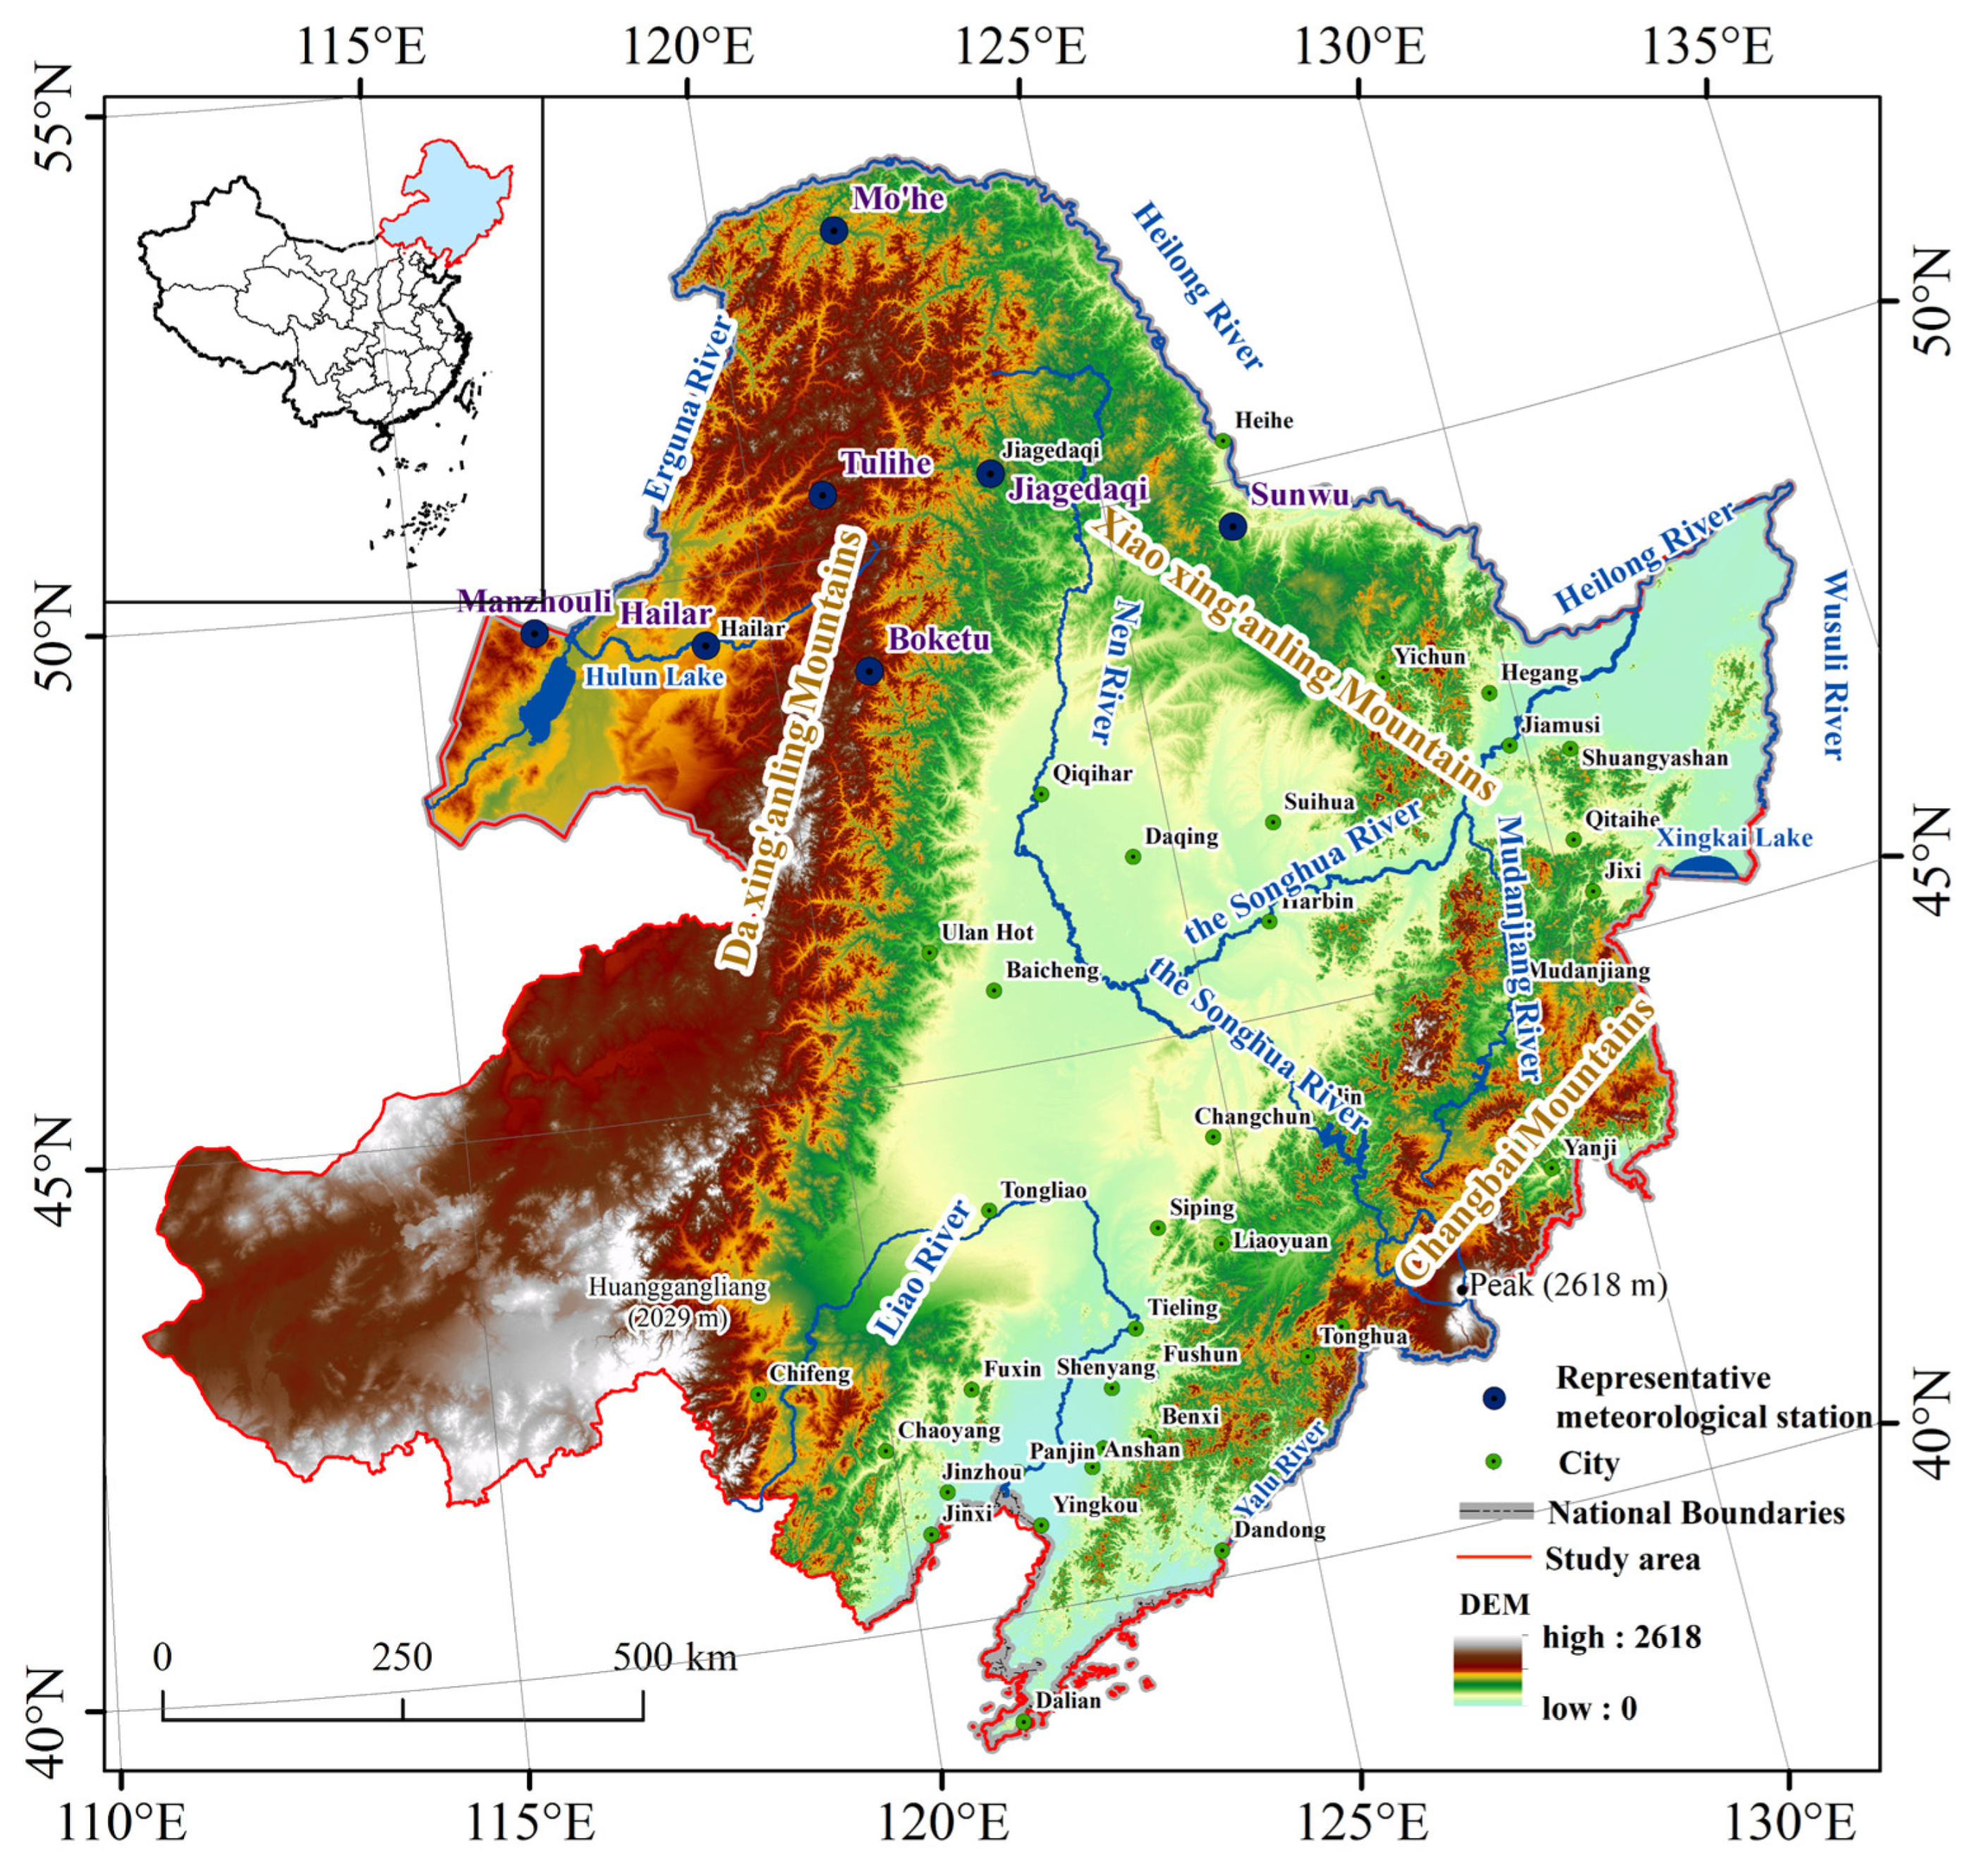
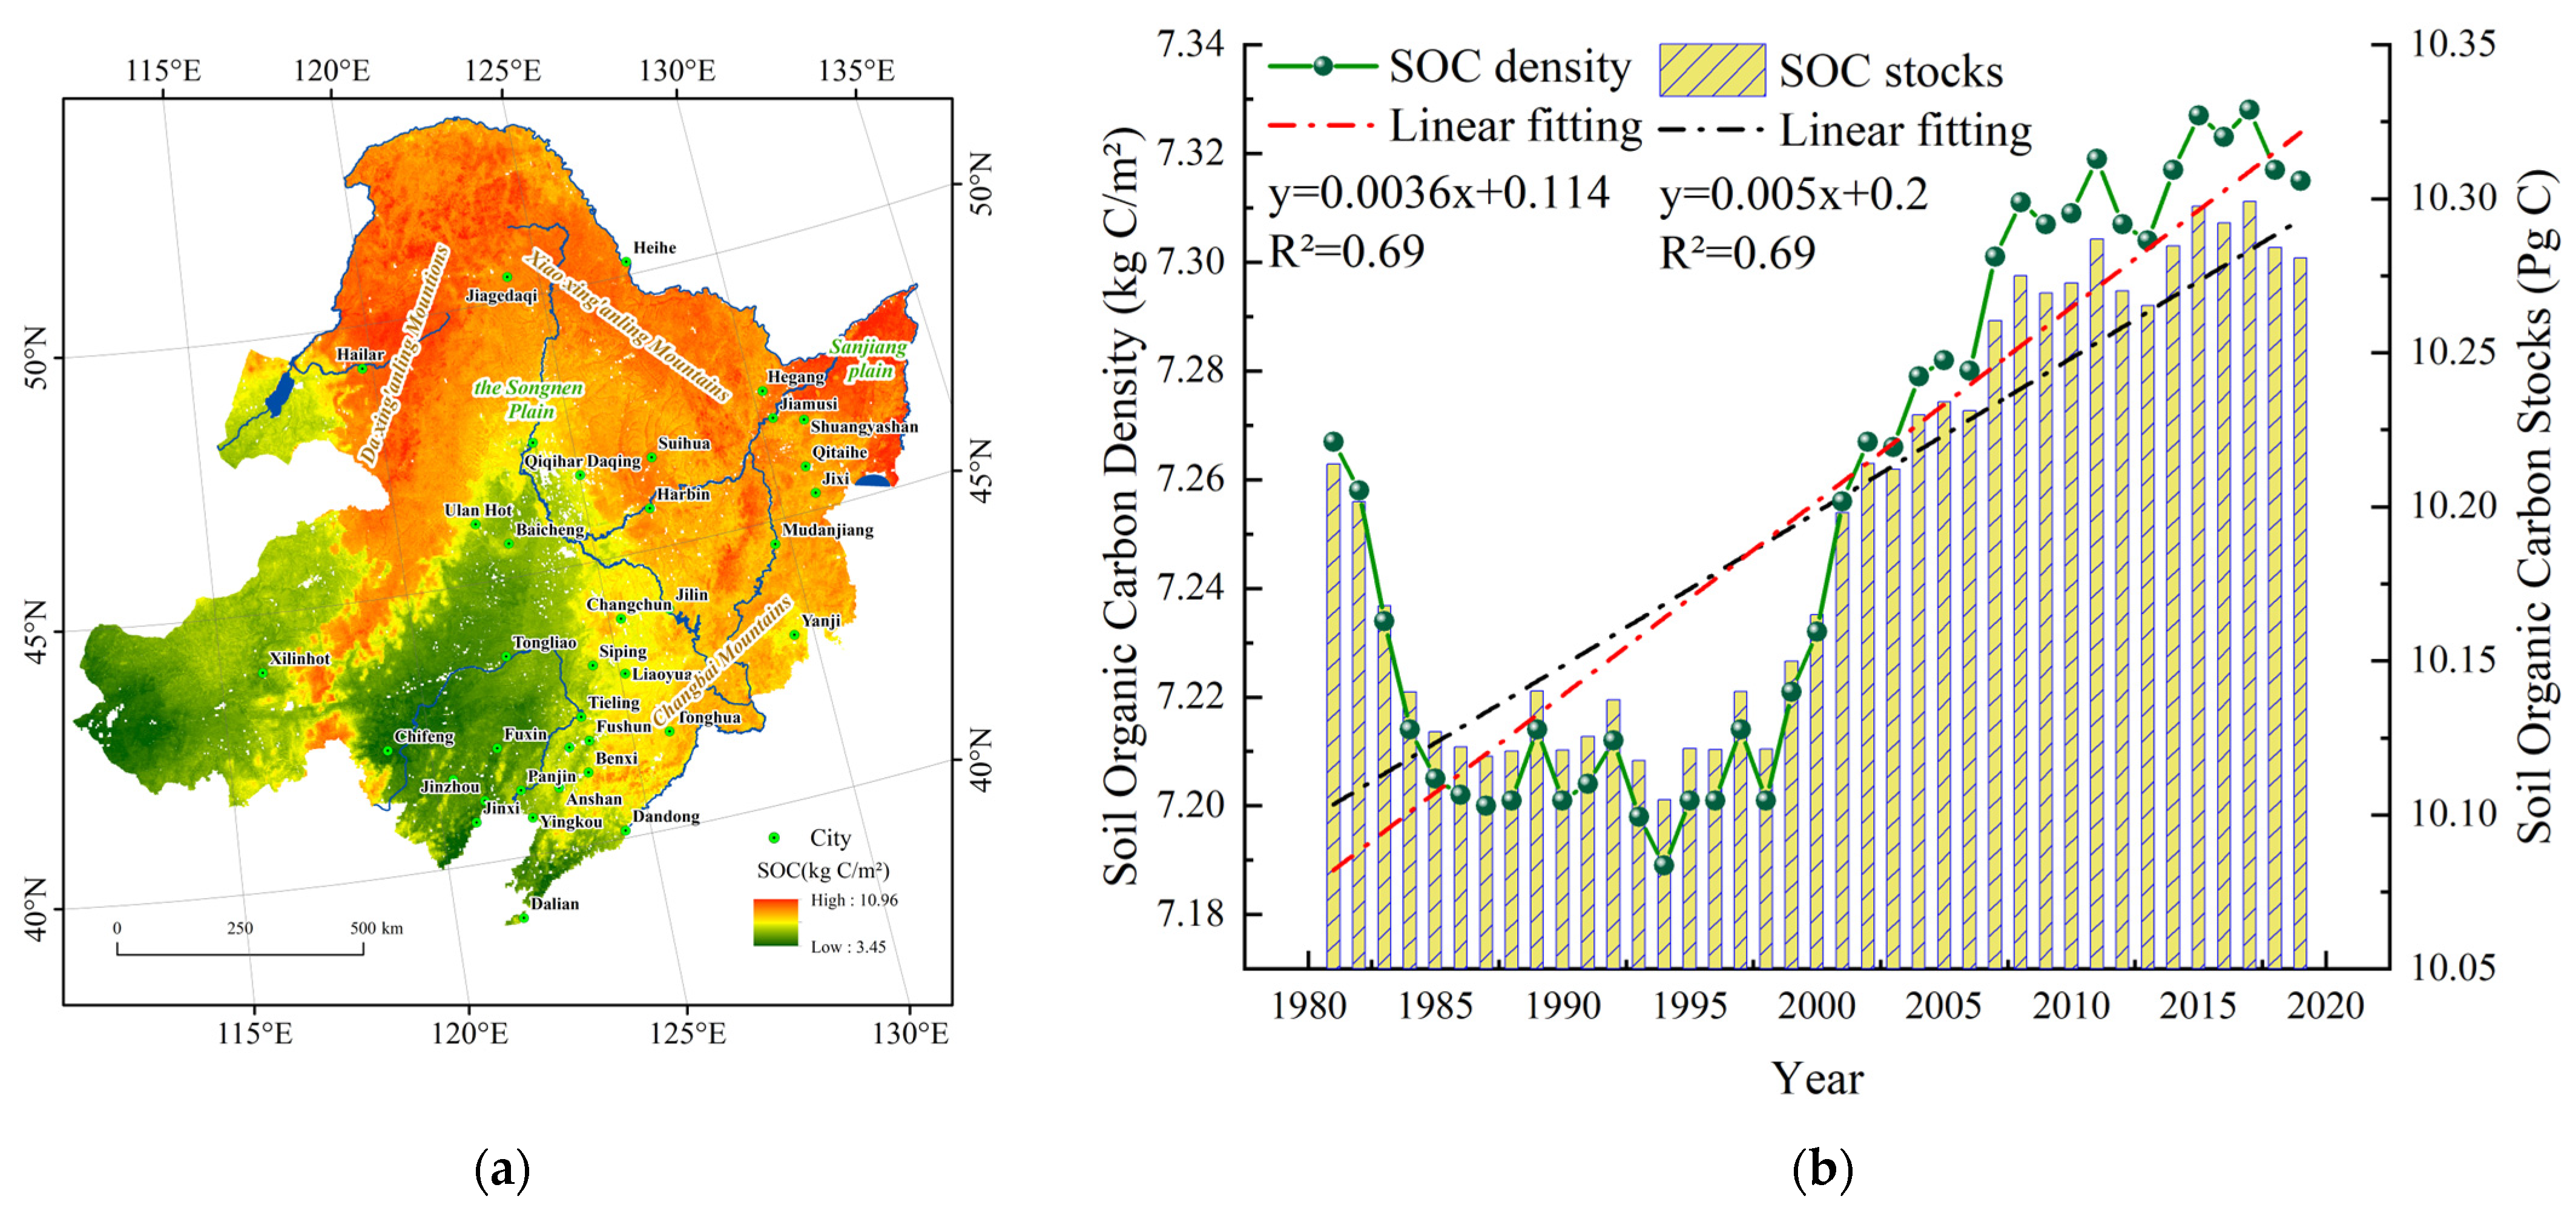
2.1. Study Area

Northeast China (Figure 1) is located in the southeastern region of the Eurasian. The permafrost in this region represents a transitional type between high-mountain permafrost and high-latitude permafrost, making it a unique form of permafrost known as the ‘Xing’an-Baikal’ permafrost. The permafrost in Northeast China is influenced by both environmental and climatic factors. The Northeast China region covers an area of approximately 14.2 × 10⁵ km2. The area is situated in both the temperate and cold temperate zones, and features a continental monsoon climate.

2.2. Data Sources

2.2.1. Meteorological Data

In this study, daily meteorological data including air temperature, ground surface temperature (GST), precipitation, relative humidity, air pressure, and sunshine duration were collected from 263 ground meteorological stations for the period from 1980 to 2020. The data were sourced from the National Meteorological Information Center (https://data.cma.cn, accessed on 20 May 2023). Additionally, daily snow cover data with a spatial resolution of 25 km from 1979 to 2020 were obtained from the China Snow Depth Long-term Time Series dataset available at the National Tibetan Plateau Data Center (https://data.tpdc.ac.cn, accessed on 20 May 2023).
During the period from 2003 to 2005, there was a transition in the monitoring methods of Chinese meteorological stations from manual to automatic measurements. This transition caused several systematic errors between snow-covered and non-snow-covered ground, due to the difference in GST between manual measurements (taken at the surface level of snow cover) and automatic measurements (which measure temperature at a depth of 5–10 cm in the ground) [47].

2.2.2. DEM

The Digital Elevation Model (DEM) data with a spatial resolution of 1 km were extracted from United States Geological Survey (https://earthexplorer.usgs.gov, accessed on 20 May 2023). These data were introduced as covariates when performing spatial interpolation using the Australian National University Spline (ANUSPLIN) software (ANUSPLIN 4.2, Canberra, Australia).

2.2.3. Land Use and Land Cover

Land use and land cover data with a spatial resolution of 1 km from 1980, 1990, 2000, 2010, and 2020 were obtained from the Resource and Environment Science and Data Center (https://www.resdc.cn, accessed on 20 May 2023).

2.2.4. Soil Organic Carbon (SOC)

The global 1 km surface (0–30 cm) SOC pool product for the years 1981 to 2019 was obtained from the National Earth System Science Data Center (http://www.geodata.cn, accessed on 20 May 2023). These data simulate the spatial and temporal distribution of global SOC pools from 1981 to 2019 based on global soil sample point SOC density data, combining static and dynamic covariates, and utilizing integrated machine learning and RothC process models. The production of SOC products at 1 km resolution was realized through the Random Forest Spatial and Temporal Substitution model, and the validation results showed an accuracy of R2 = 0.422, RMSE = 27.00, and MRE = 30.9%.

2.3. Data Processing Methods

2.3.1. TTOP Model

The TTOP (top temperature of permafrost) model as described below, developed by Smith and Riseborough in 1996, is an equilibrium equation used to describe the relationship between permafrost and climate:
T T O P = r k · D D T D D F P
D D T = i = 1 N T T i ,   T i < 0   ° C
D D F = i = 1 N F T i i ,   T i < 0   ° C
r k = λ t λ f
where DDT is ground surface thawing index (°C·d); DDF is ground surface freezing index (°C·d); Ti is temperature on the ith day (°C); NF and NT are the number of days in the year with surface temperature below and above 0 °C, respectively (d); λt is the thawing soil thermal conductivity coefficient (W/m·°C); λf is the freezing soil thermal conductivity coefficient (W/m·°C); P is total number of days in a year (d); and rk represents assigned values based on LULC types, as shown in Table 1.
The permafrost distribution type is determined by the following equation:
TTOP 0 ,   Permafrost TTOP > 0 ,   Seasonally   frozen   ground

2.3.2. Regression Model [48,49]

The ground freeze-thaw index (DDT/DDF) of the TTOP model is calculated based on GST. Currently, there are two methods for obtaining GST data: remote-sensing-based retrieval and meteorological station measurements. Among them, thermal infrared remote sensing collects and records the thermal infrared information of ground objects by means of on-board or airborne sensors and uses such thermal infrared information to identify the ground objects and invert the ground surface temperature, while the ground meteorological stations obtain the ground surface temperature by means of a temperature meter or temperature sensor observation. However, in Northeast China, which has dense vegetation cover and thick winter snow cover, the retrieval results often represent the temperature of the vegetation canopy or snow surface [50]. Therefore, in this study, GST data from meteorological stations were used as input parameters of the TTOP model. Due to the systematic error in GST measurements before 2003, the GST data before 2003 were used as the basis for training and validating historical data to obtain the feature coefficients in the model. Subsequently, the model was used to output daily GST data from 2003 onwards.
Regression model:
y = b 0 + b 1 x 1 + b 2 x 2 + + b n x n
Here, y represents the target variable (GST), b0 is the intercept, and b1 to bn are the coefficients of the features, while x1 to xn represent the feature values.
The regression model is a simple yet effective method, and it is well-suited for establishing relationships between meteorological factors. Utilizing a large amount of data enhances the model’s fitting capability, improves its robustness, and reduces errors. This model was built and calculated using the Sklearn (Scikit-learn) library in Python 3.10. The features used as input include longitude, latitude, elevation, air temperature, precipitation, relative humidity, air pressure, sunshine duration, and snow depth, with GST as the target variable.

2.3.3. Local Thin-Plate Smoothing Spline Interpolation Method

The results of the TTOP were interpolated using the ANUSPLIN software. The model calculations were interpolated utilizing longitude and latitude as independent variables, altitude as a covariate, and TTOP value as the dependent variable. The model expression is as follows:
Z i = f x i + b T y i + e i i = 1 ,   2 ,   3 ,   N
where Zi represents the dependent variable for spatial point i; xi represents the d-dimensional spline independent variables; f is the unknown smoothing function related to xi; yi is the p-dimensional independent covariate; b is the p-dimensional coefficients for yi; and ei is the random error associated with the independent variables; T is a symbol for transpose.
The function f and coefficients b are estimated using the least squares method:
m i n : i = 1 n Z i f x i b T y i w i + ρ J m f
where Jm(f) represents the mth-order partial derivative of the function f and ρ is a positive smoothing parameter; wi is the known local relative coefficient of variation used as a weight.

3. Results

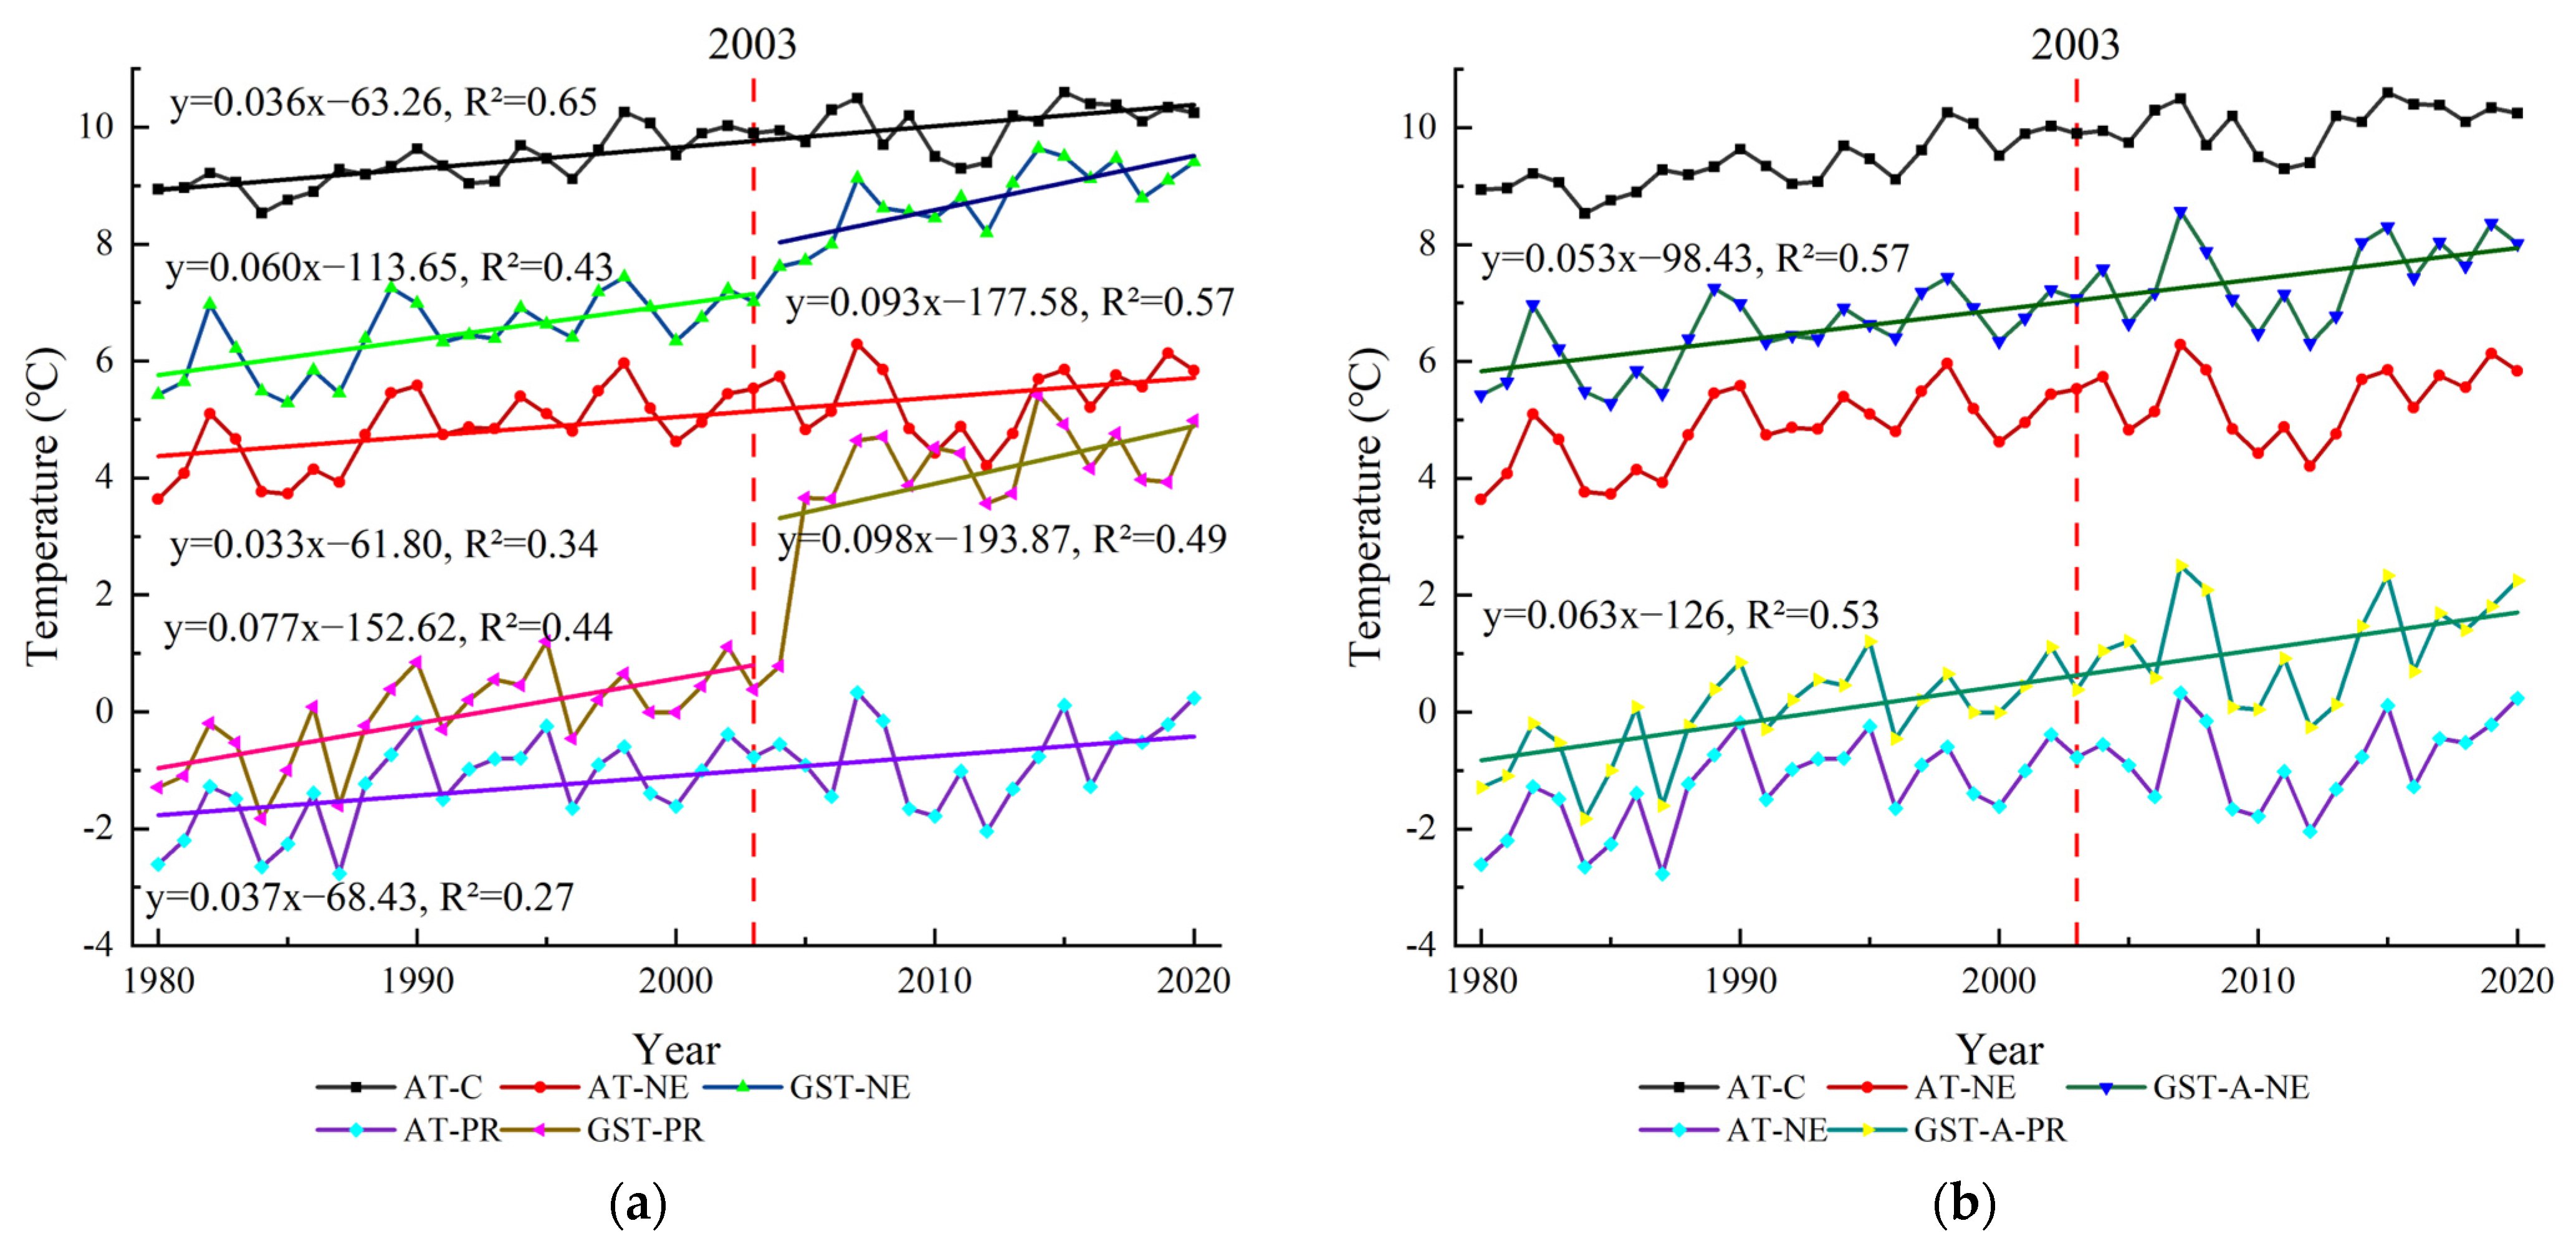
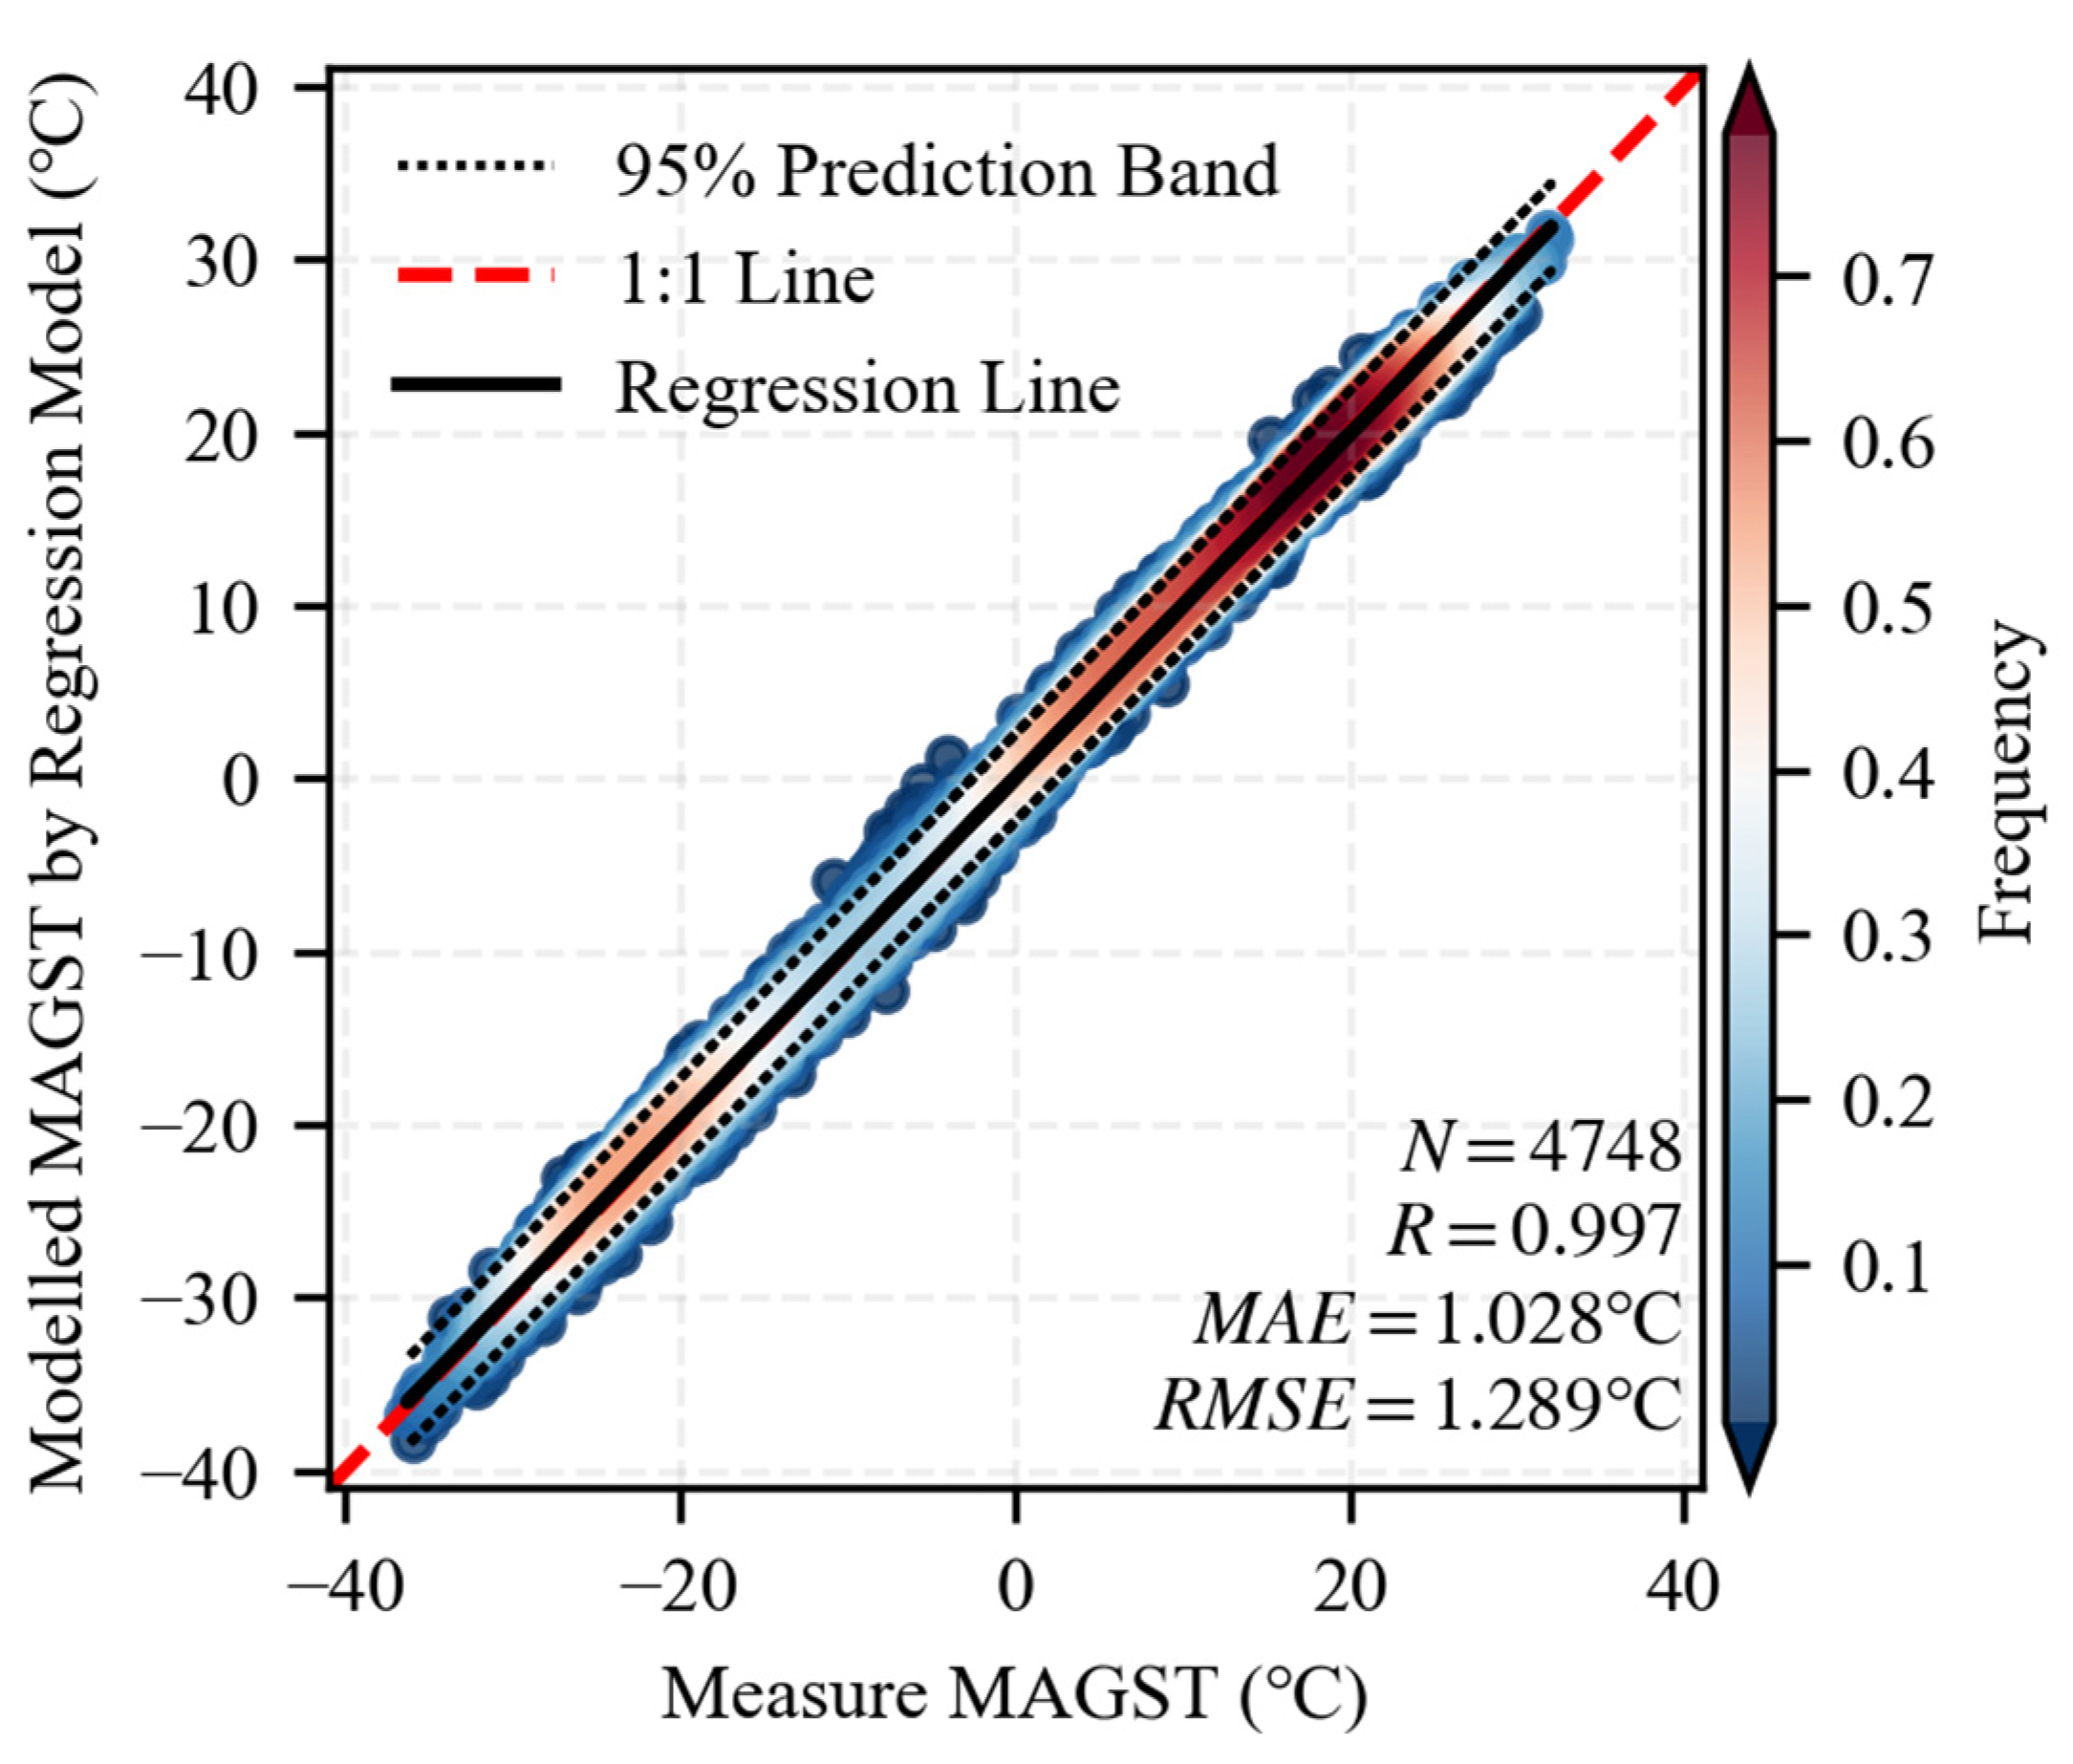
3.1. Regression Model Adjusted GST

We selected seven representative national meteorological stations in the northern part of Northeast China (Mo’he, Tulihe, Jiagedaqi, Manzhouli, Hailar, Sunwu, and Boketu) to represent the permafrost regions (Table 2), and compared the mean annual ground surface temperatures and mean annual air temperatures in China, Northeast China, and permafrost regions. As illustrated in Figure 2a, the mean annual air temperature warming rates from 1980 to 2020 for China, Northeast China, and permafrost regions stand at 0.36 °C/10a, 0.33 °C/10a and 0.37 °C/10a, respectively. During the period from 1980 to 2002, Northeast China and permafrost regions exhibited mean annual ground surface temperature warming rates of 0.61 °C/10a and 0.77 °C/10a, respectively. Notably, the mean annual ground surface temperature warming rates for Northeast China and permafrost regions between 2003 and 2020 are recorded at 1.1 °C/10a and 1.48 °C/10a, respectively.
After adjusting the GST data, as shown in Figure 2b, the mean annual ground surface temperature warming rates for Northeast China and permafrost regions from 1980 to 2020 are 0.53 °C/10a and 0.63 °C/10a, respectively.

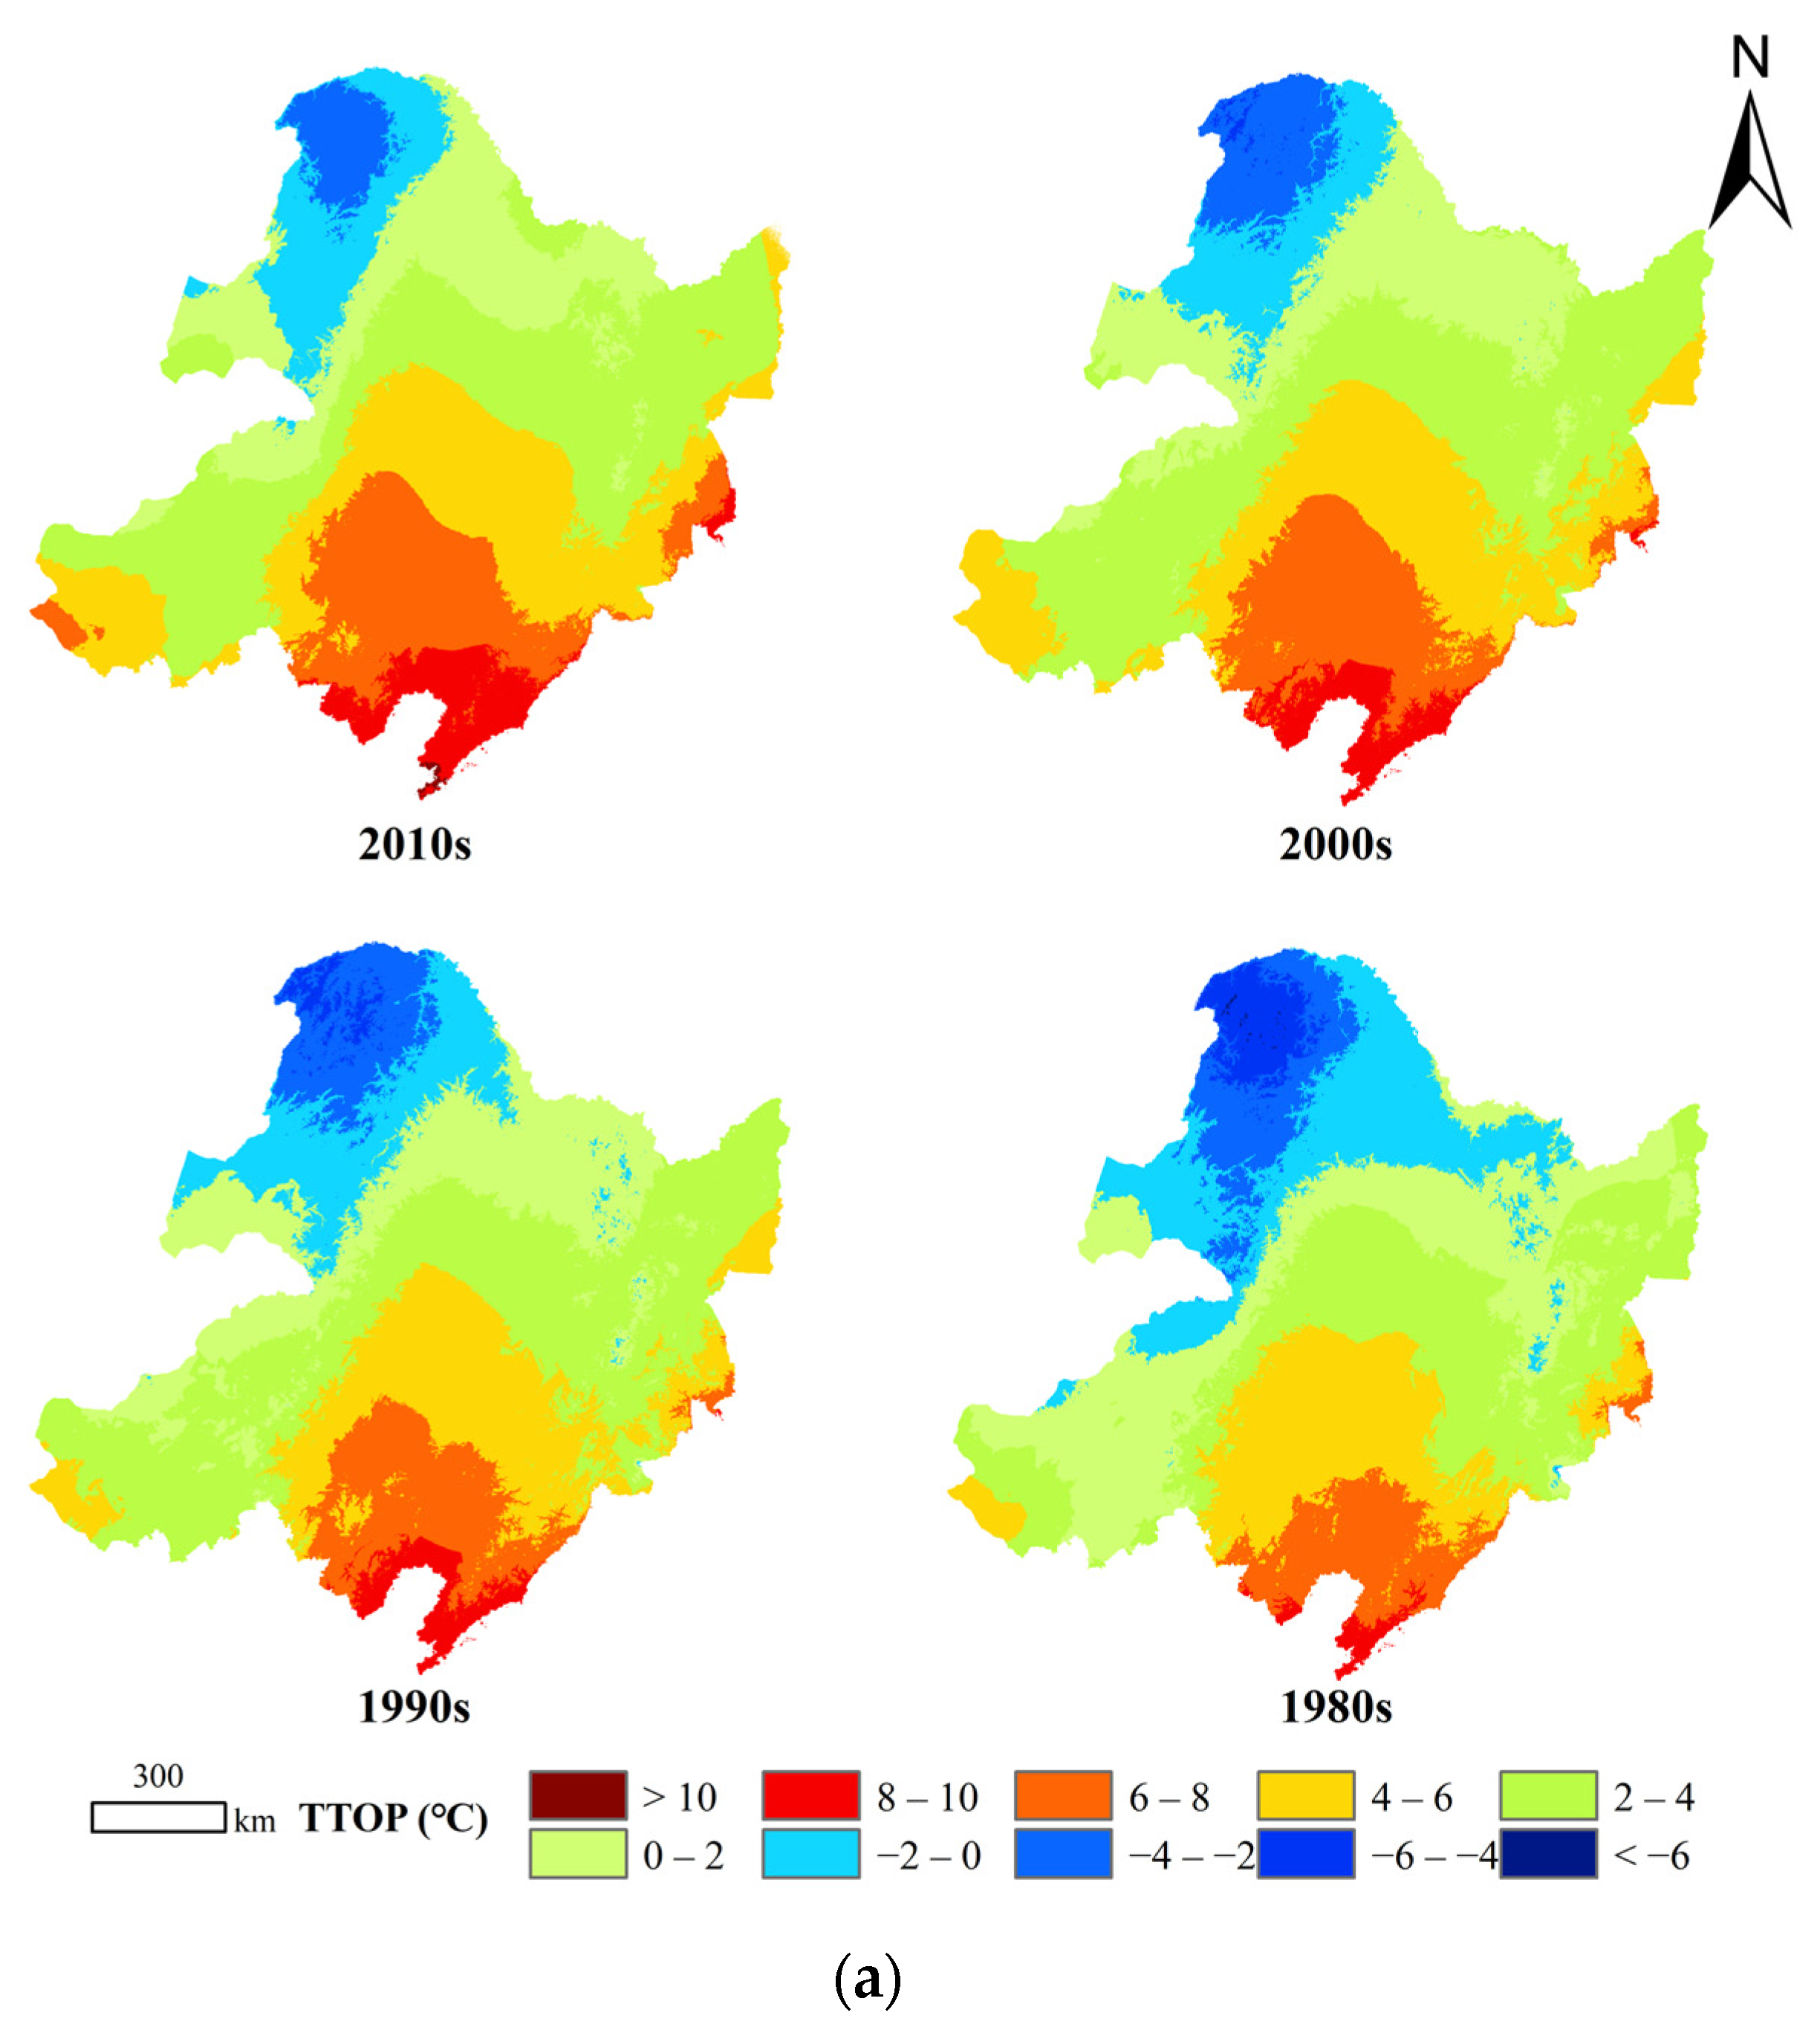
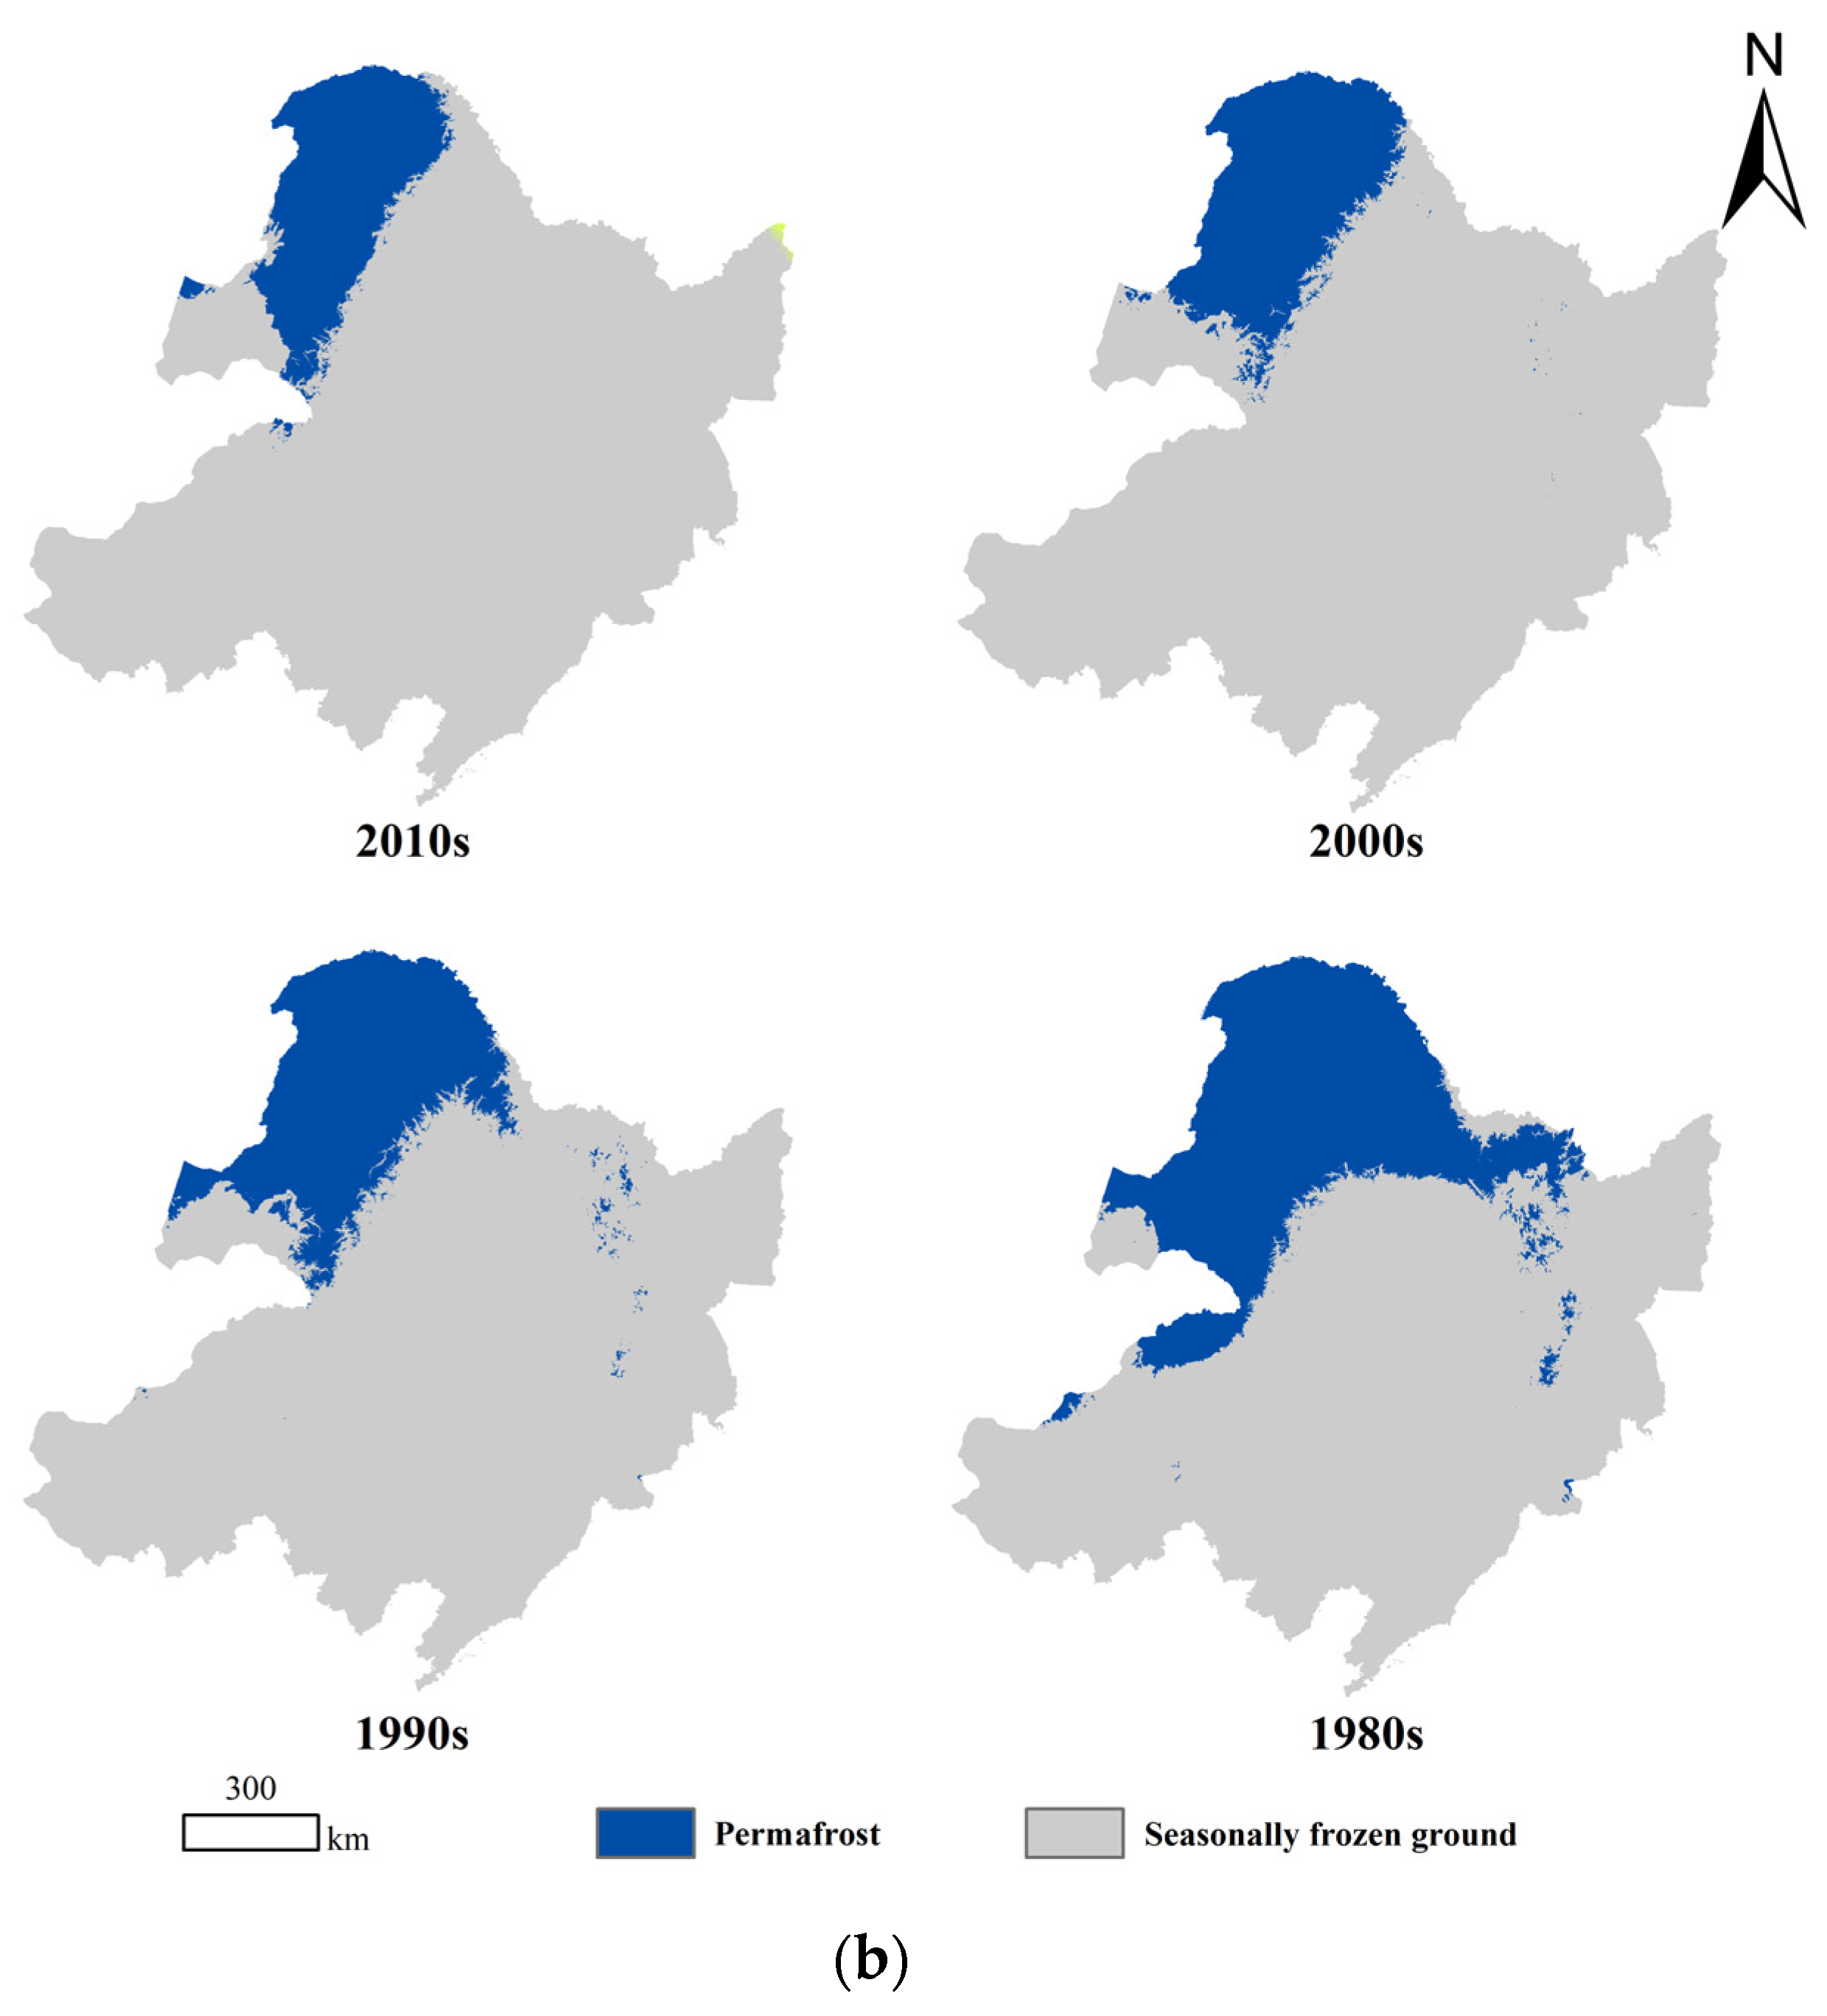
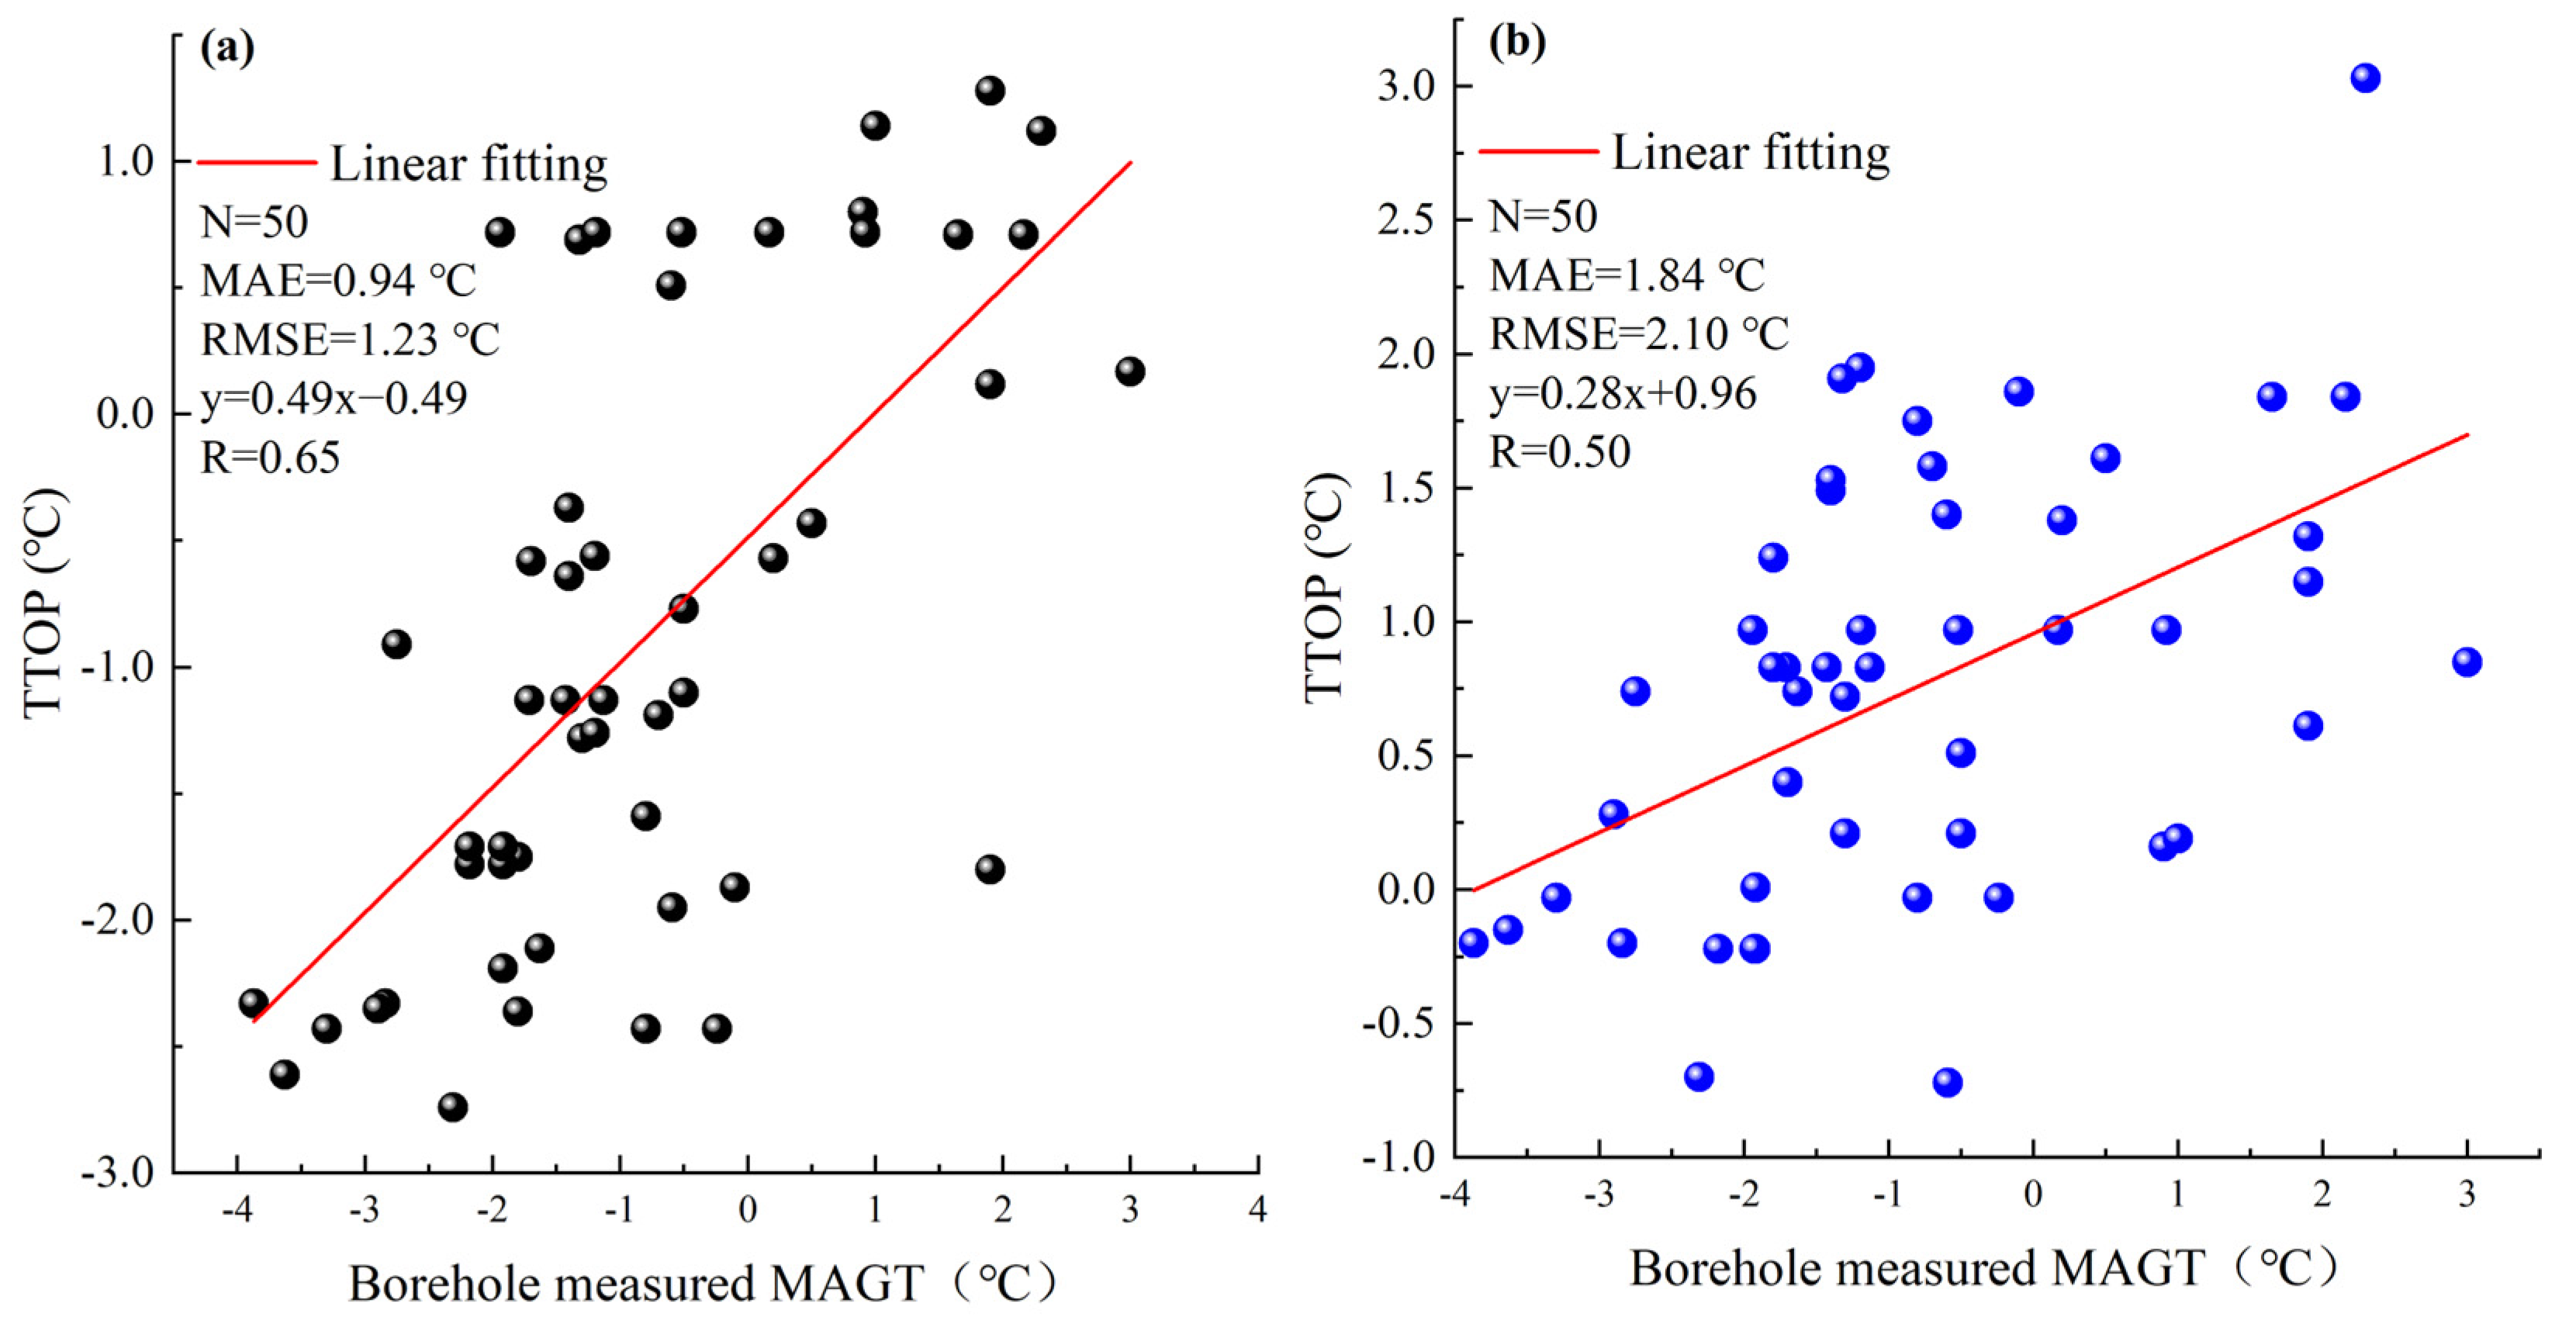
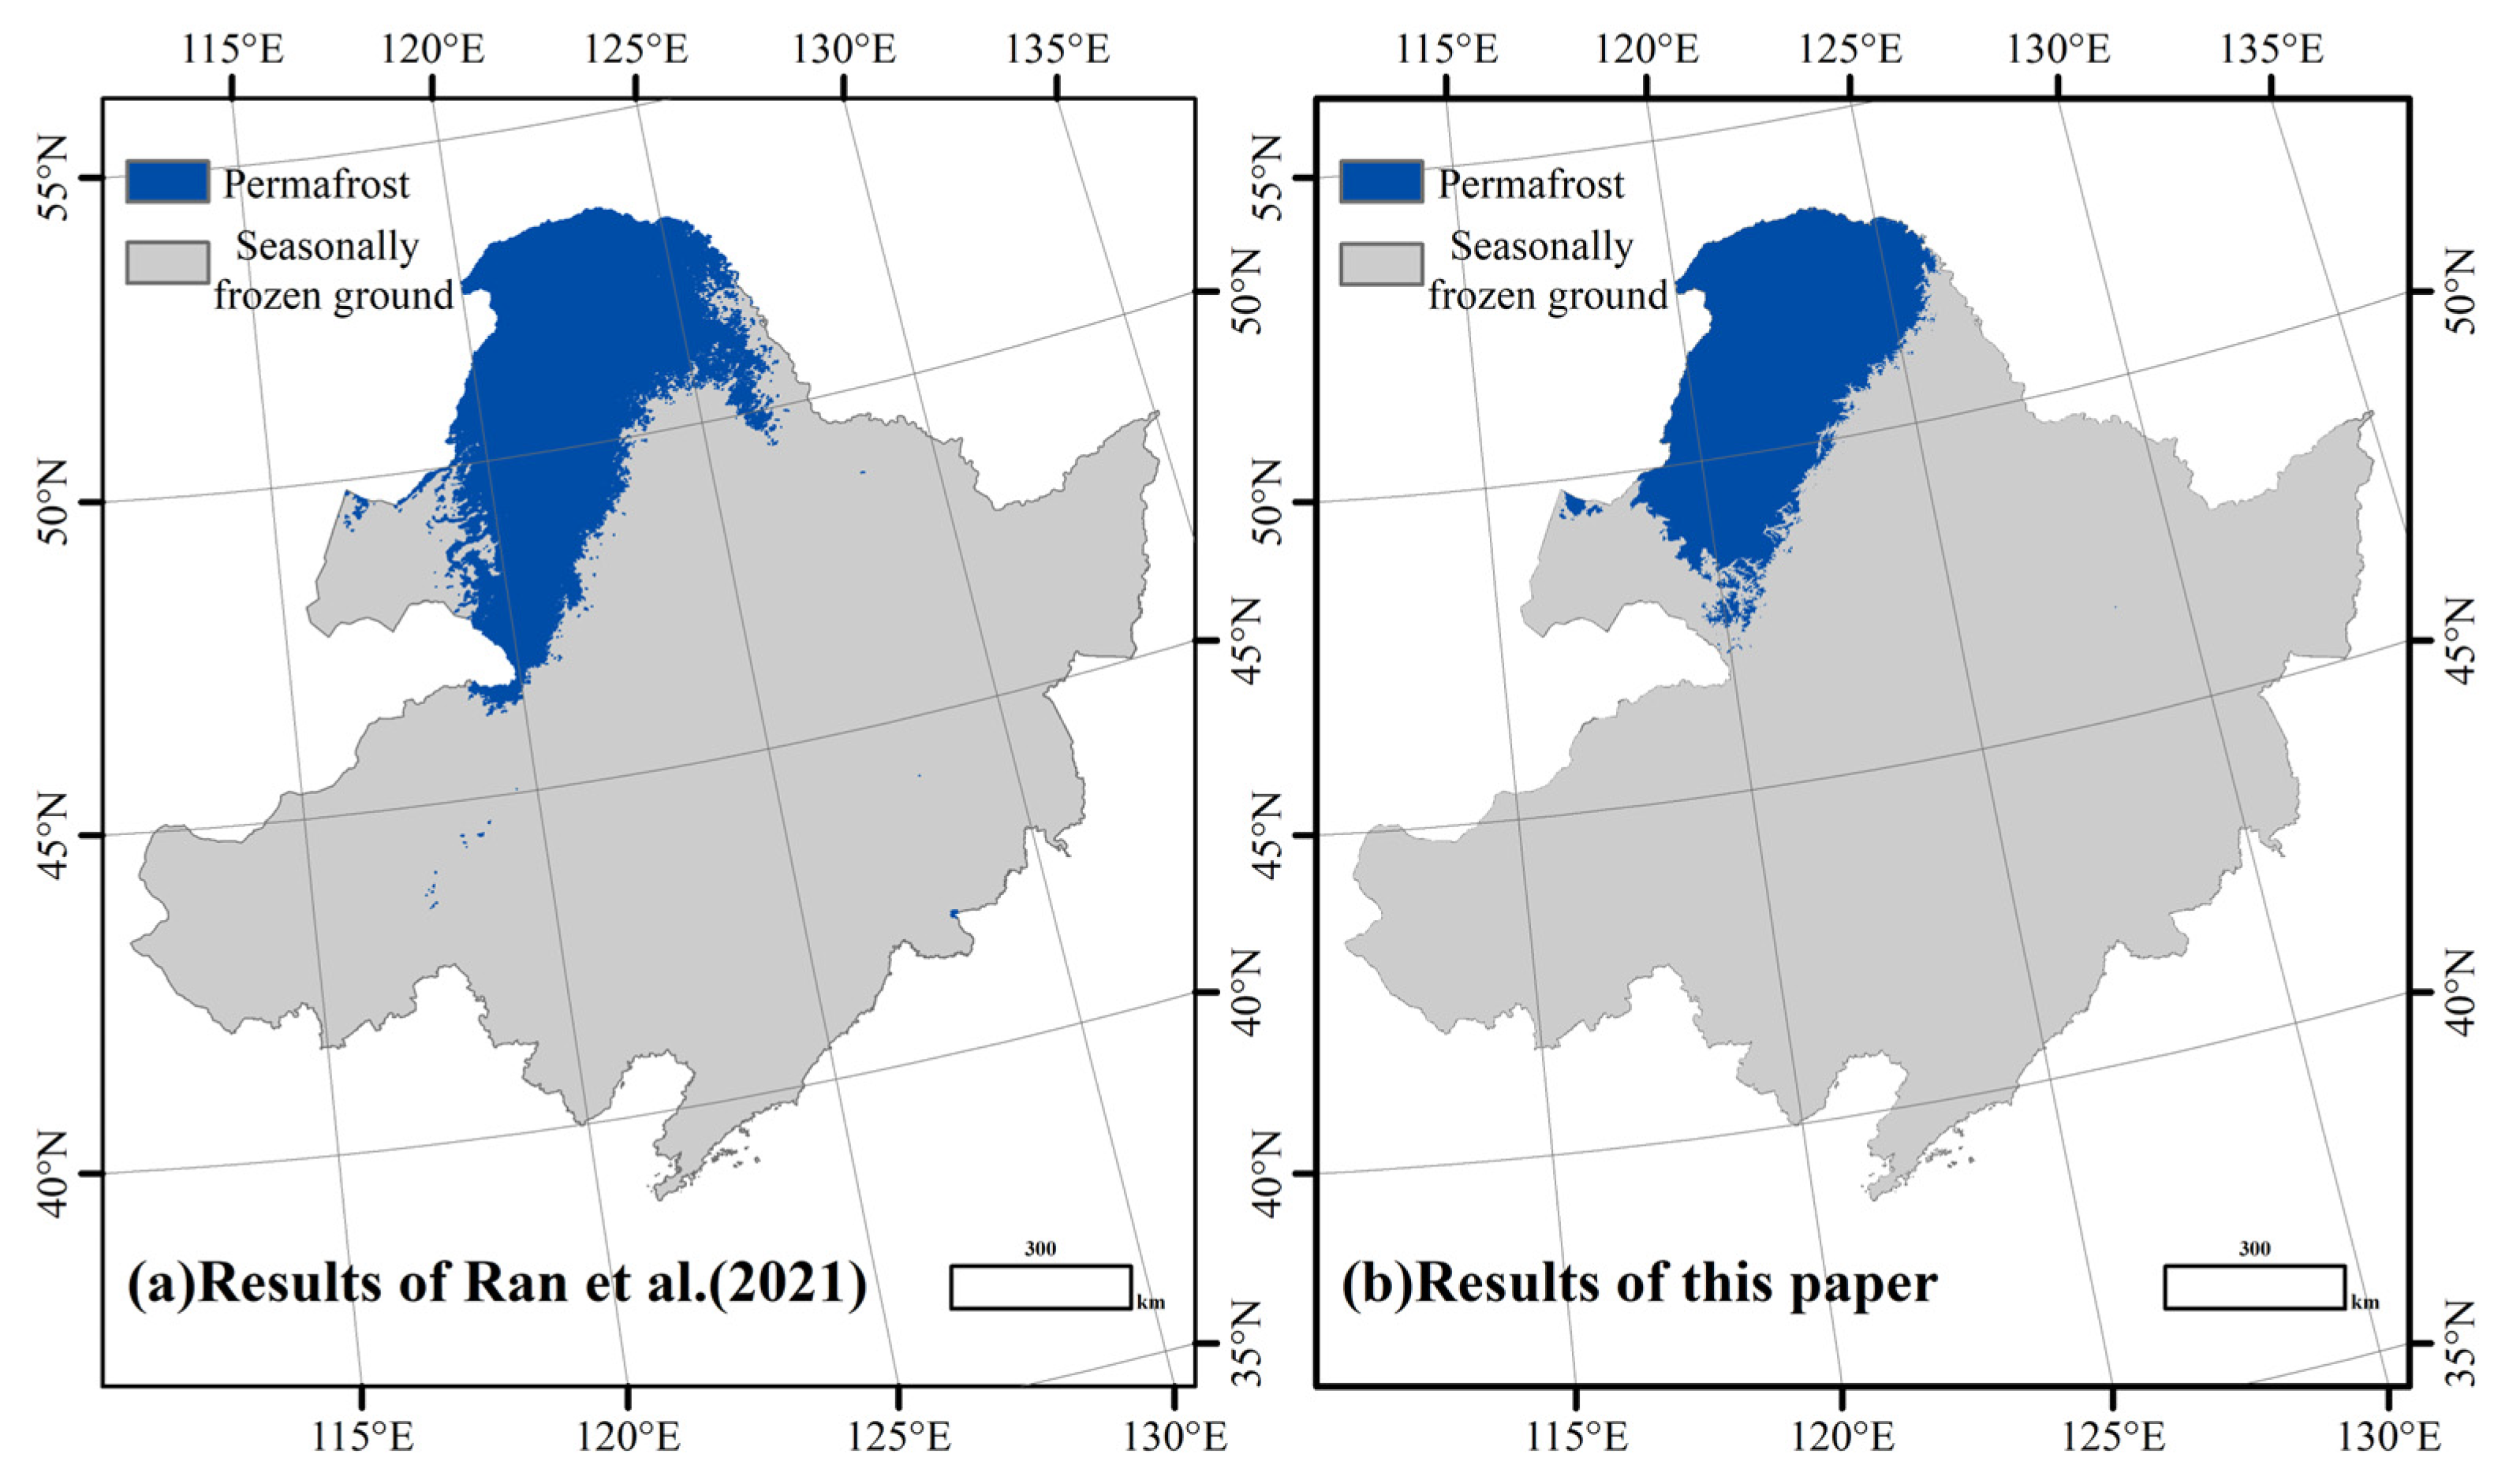
3.2. TTOP and Spatial Distribution of Permafrost

Using the ANUSPLIN software for spatial interpolation of TTOP, Figure 3a shows the TTOP results obtained for Northeast China. Upon analysis of the spatial distribution of TTOP and classification of permafrost types, the following observations were made: The highest temperature in Northeast China rose from 9.306 °C to 10.164 °C, indicating a warming trend of 0.858 °C or an increase of 9.22%. The lowest temperature increased from −6.972 °C to −3.886 °C, showing a warming of 3.086 °C or an increase of 44.26%. Seasonally frozen ground areas were defined as regions with TTOP ≥ 0 °C, while permafrost areas were defined as regions with TTOP < 0 °C, Figure 3b. The permafrost areas in the 1980s, 1990s, 2000s, and 2010s were about 37.43 × 10⁴ km2, 24.87 × 10⁴ km2, 18.93 × 10⁴ km2, and 16.48 × 10⁴ km2, respectively. The largest stage of permafrost degradation happened between the 1980s and the 1990s, resulting in a decrease in the area of 12.57 × 10⁴ km2. Over the span of four decades, from the 1980s to the 2010s, the extent of permafrost decreased by about 20.95 × 10⁴ km2, accounting for a 55.98% decline. In contrast, the proportion of seasonally frozen ground areas increased considerably as the permafrost area percentage fell from 25.90% to 11.41%. Presently, the Da Xing’anling Mountains host a significant proportion of the remaining permafrost, raising alarm about its preservation.

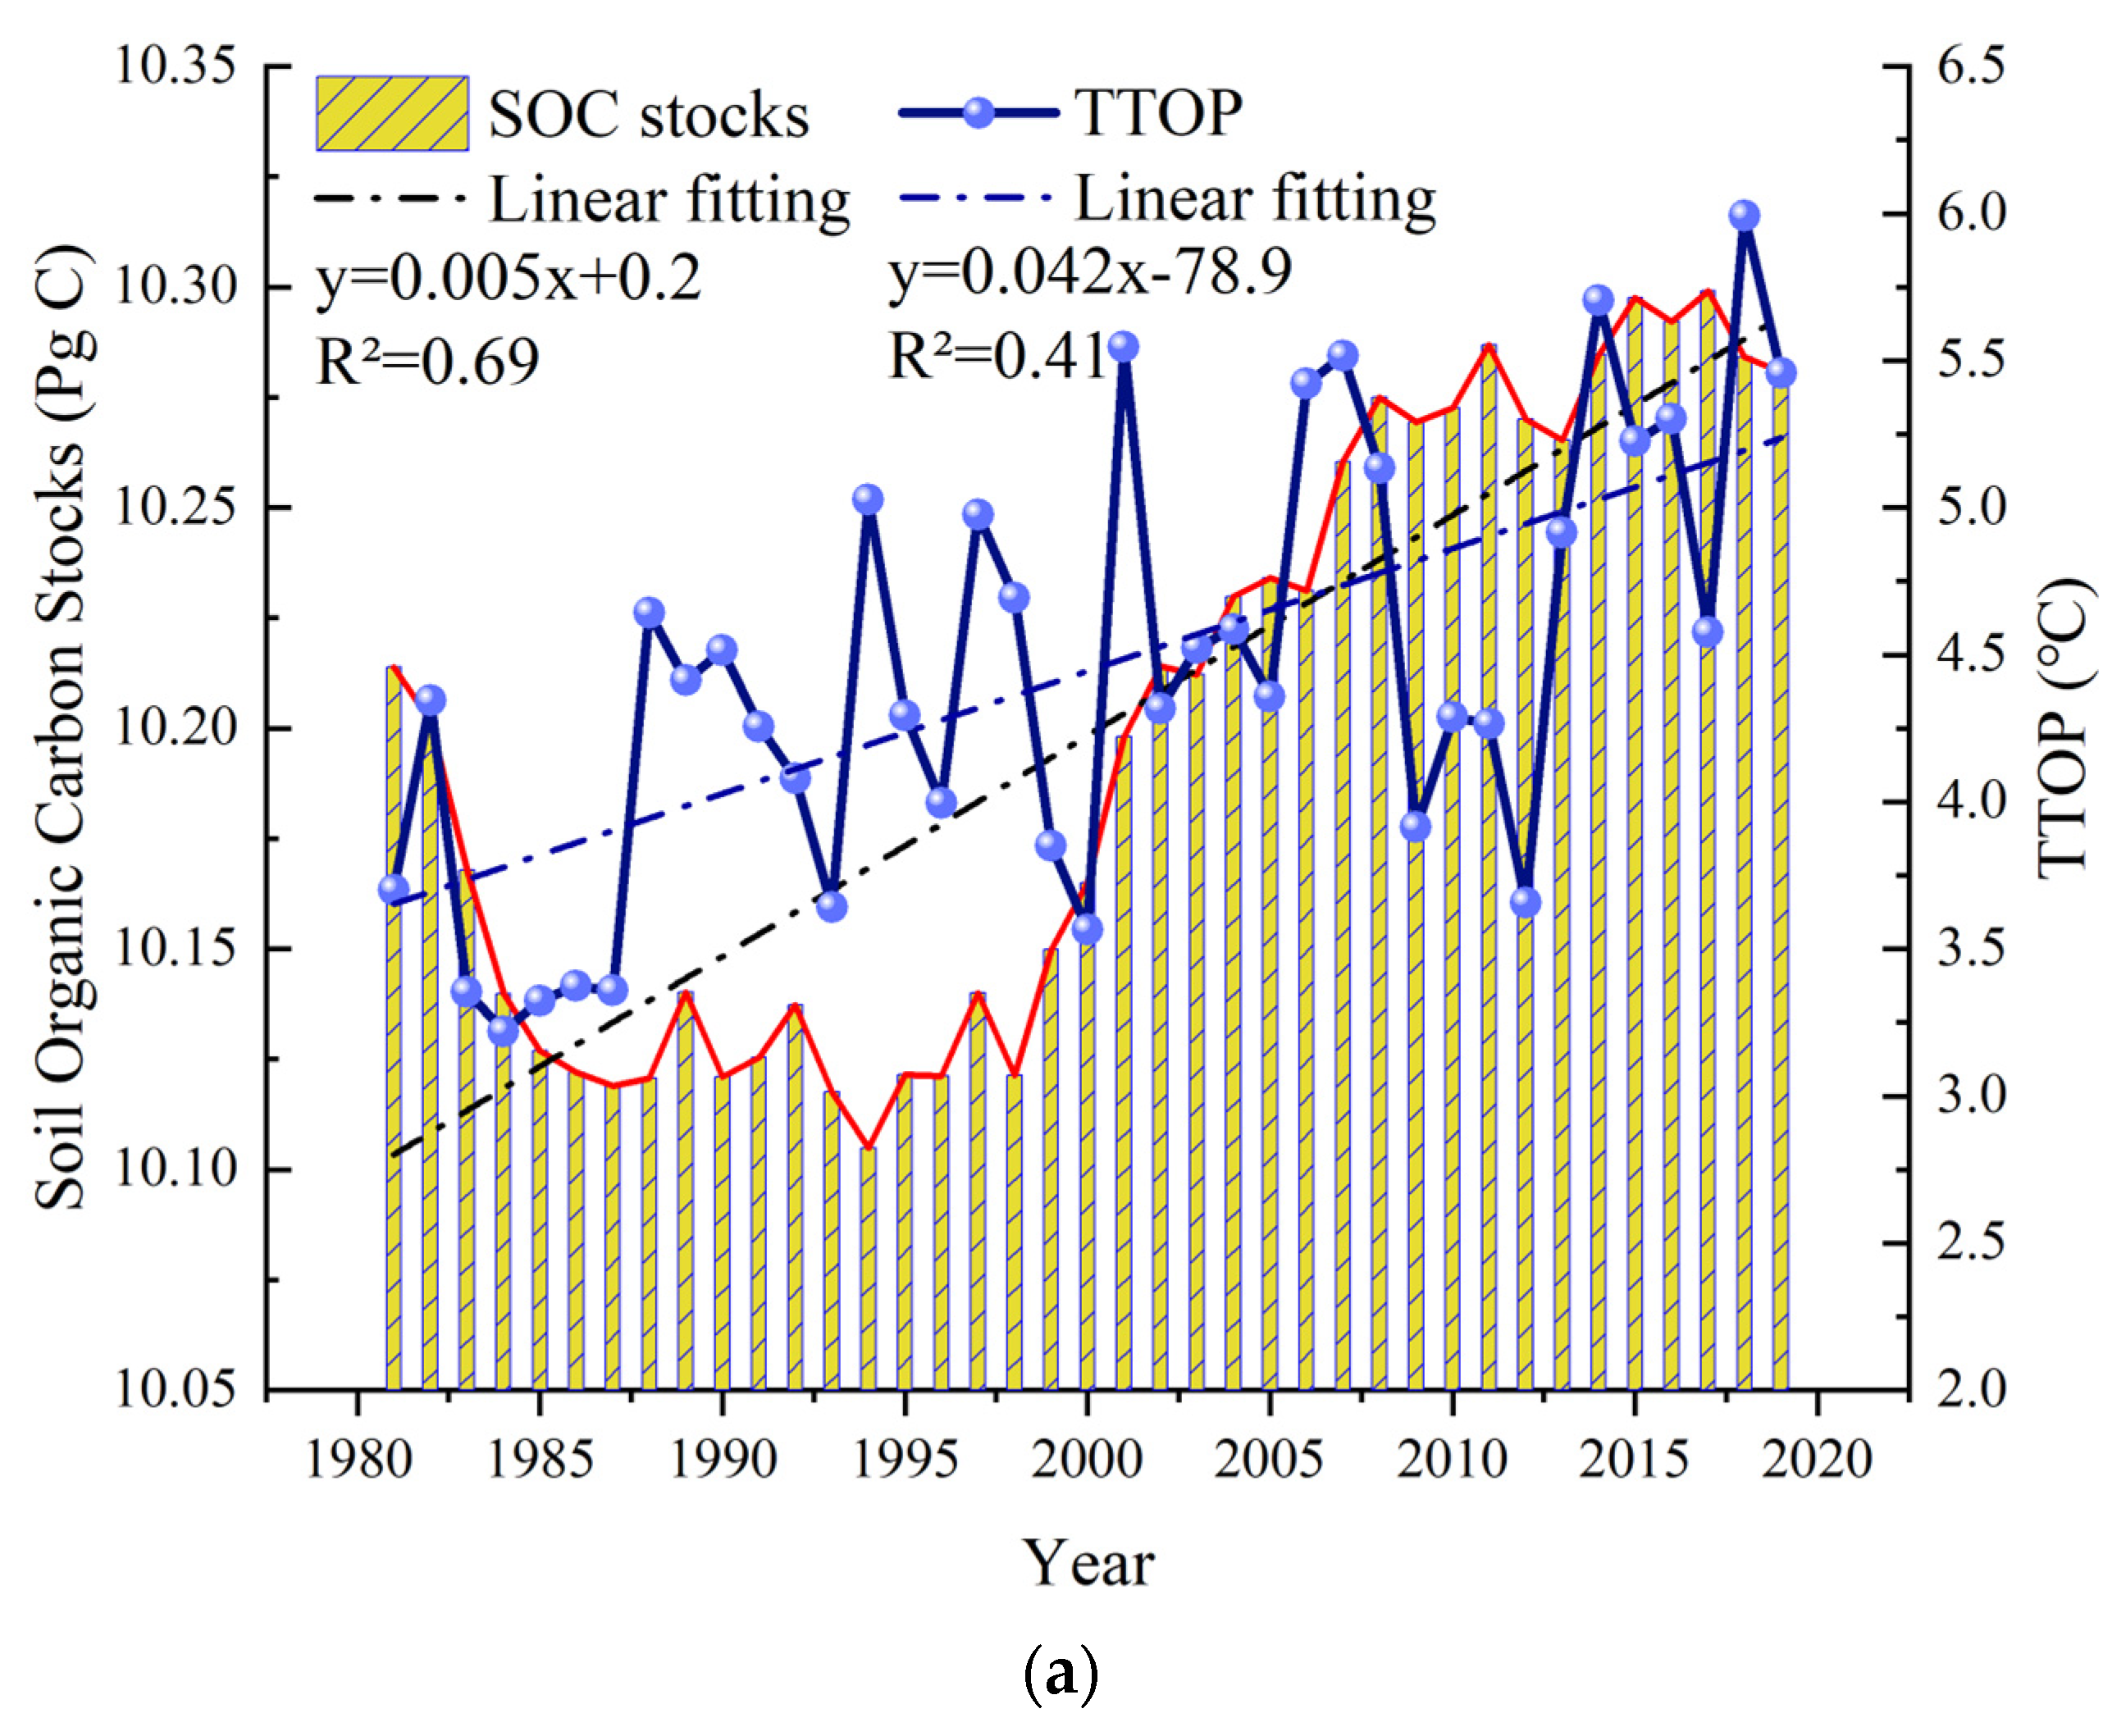
3.3. Changes in Soil Organic Carbon

As shown in Figure 4a, the regions in Northeast China that have the highest SOC density and SOC stocks are concentrated in the major forestland and grassland areas of the Da and Xiao Xing’anling Mountains, as well as the Songnen and Sanjiang Plains.
From the SOC data presented in Figure 4b, it can be observed that the overall trend of SOC density and SOC stocks in Northeast China experienced a rapid decrease followed by an increase. SOC density and stock increased at rates of 0.036 kg C/m2 a and 5 Tg C/a, respectively. SOC density decreased from 7.22 kg C/m2 in the 1980s to 7.20 kg C/m2 in the 1990s, before rising to 7.28 kg C/m2 in the 2000s and 7.32 kg C/m2 in the 2010s. The SOC stock started at 10.15 Pg C in the 1980s, experienced a rapid decline of 24.18 Tg C to 10.13 Pg C in the 1990s, and then substantially rose to 10.23 Pg C in the 2000s, finally reaching 10.28 Pg C in the 2010s. The trend in SOC stocks corresponds to that of SOC density. According to Table 4, the corresponding total SOC stocks and proportions are displayed for the four periods based on various LULC types and the extent of permafrost.
The area of arable land has steadily increased between 1980 and 2020, showing a total growth of 5.8 × 10⁴ km2. However, during the same period, the area covered by forestland and grasslands has consistently decreased, with a cumulative reduction of 7.0 × 10⁴ km2. Some of these lands have been converted into construction land, while others have become unused land. Table 5 displays the dynamics of LULC change in areas affected by permafrost degradation across various time periods. During the period from the 1980s to the 1990s, the increase in SOC stocks in arable land was the most significant in Northeast China, amounting to 267.94 Tg C. Conversely, forestland experienced the greatest loss in SOC stocks, totaling 129.71 Tg C, followed by grasslands. The region where permafrost is located witnessed a decrease in SOC stocks by 1026.97 Tg C. In the 1990s to 2000s, arable land contributed the most to the increase in SOC stocks, with an addition of 60.38 Tg C, followed by forestland, which had transitioned from losses to gains at this point, with an increase of 37.32 Tg C. Unused land experienced the greatest reduction in SOC stocks, amounting to 4.77 Tg C. In the region with permafrost, SOC stocks decreased by 494.52 Tg C. Between the 2000s and 2010s, unused land reversed its trend, registering the highest increase in soil SOC stocks, with an addition of 112.14 Tg C. Arable land followed closely behind. Both forestland and grasslands switched from gains to losses, with grasslands experiencing the most significant reduction in SOC stocks at 115.01 Tg C. The region with permafrost witnessed a decrease in SOC stocks of 202.45 Tg C.

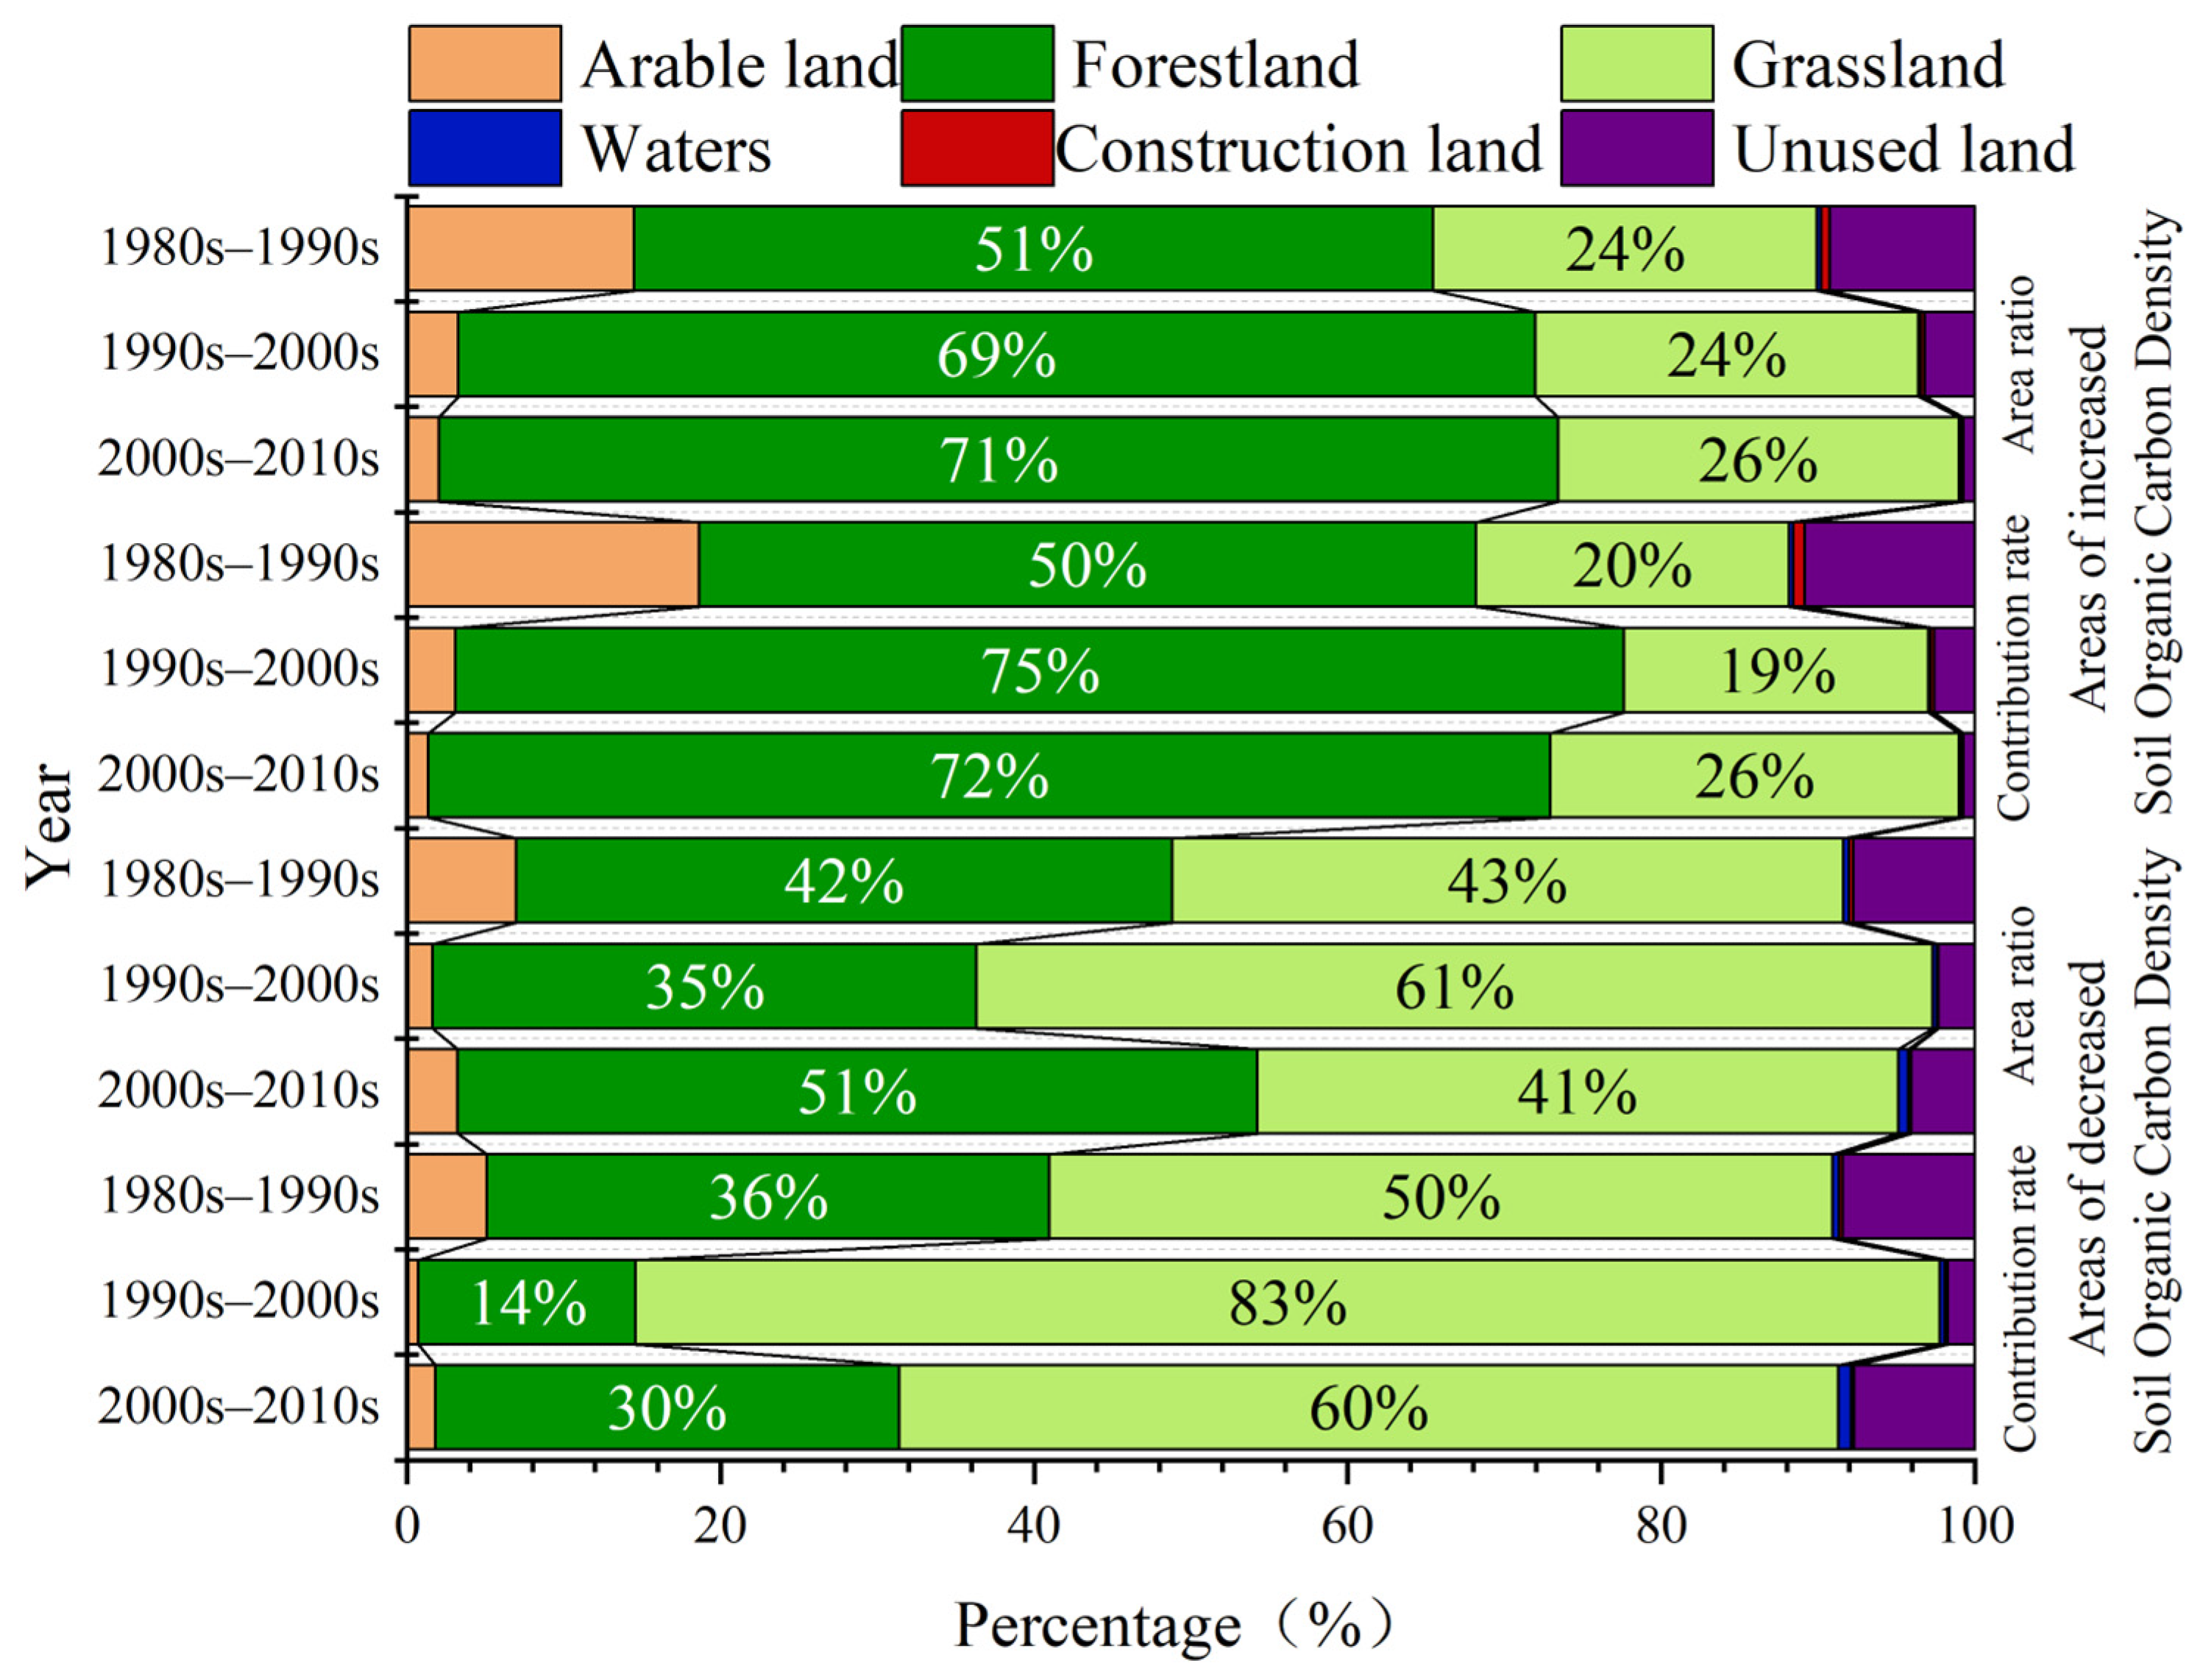
3.4. Relationship between LULC and SOC Changes in Permafrost Degradation Areas

Permafrost degradation can cause alterations in hydrogeological conditions, which subsequently impact the succession of LULC types.
During the period from the 1980s to the 2000s, the largest increase in arable land area occurred, totaling 5201 square kilometers and resulting in a dynamic change rate of 5.23%. The highest reduction in land area during this time period occurred in forestland areas, decreasing by 4436 square kilometers and resulting in a dynamic change rate of −7.91%. Additionally, grassland also experienced a decrease of 834 square kilometers, resulting in a dynamic change rate of −1.76%. Permafrost degradation was identified as the most significant contributing factor to the decrease in forestland and grassland areas, ultimately making the land more suitable for cultivation. The changes in SOC are significantly impacted by the combined effect of permafrost degradation and human activity.
SOC changes can be divided into two parts: SOC increase (density ≥ 0) and SOC decrease (density < 0). Comparing the area occupied by various LULC types in the permafrost degradation zone with their corresponding contributions to SOC alterations, the following trends can be observed. The outcomes are displayed in Figure 5:
The data suggest that ongoing permafrost degradation leads to a significant increase in the proportion of forestland and grassland within the affected area, accounting for over 75% during each succession period. Additionally, their respective contributions to SOC increase or decrease show the most notable changes. Forestland dominates the increase in SOC, with a contribution rate that is consistent with its proportion of the total area. The contribution rates for forestland are 50%, 75%, and 72%, for the periods of 1980s–1990s, 1990s–2000s, and 2000s–2010s, respectively. A decrease in SOC mainly occurs in grasslands, with contribution rates of 50%, 83%, and 60% for the same periods. This relationship remains unchanged, even when the area of forestland exceeds that of grassland. Unlike the situation of SOC increase, the ratio of forestland area to grassland area displays a fluctuation in strength when associated with SOC decrease. This trend may be related to the different carbon sequestration capacities and sensitivities of the two land types.

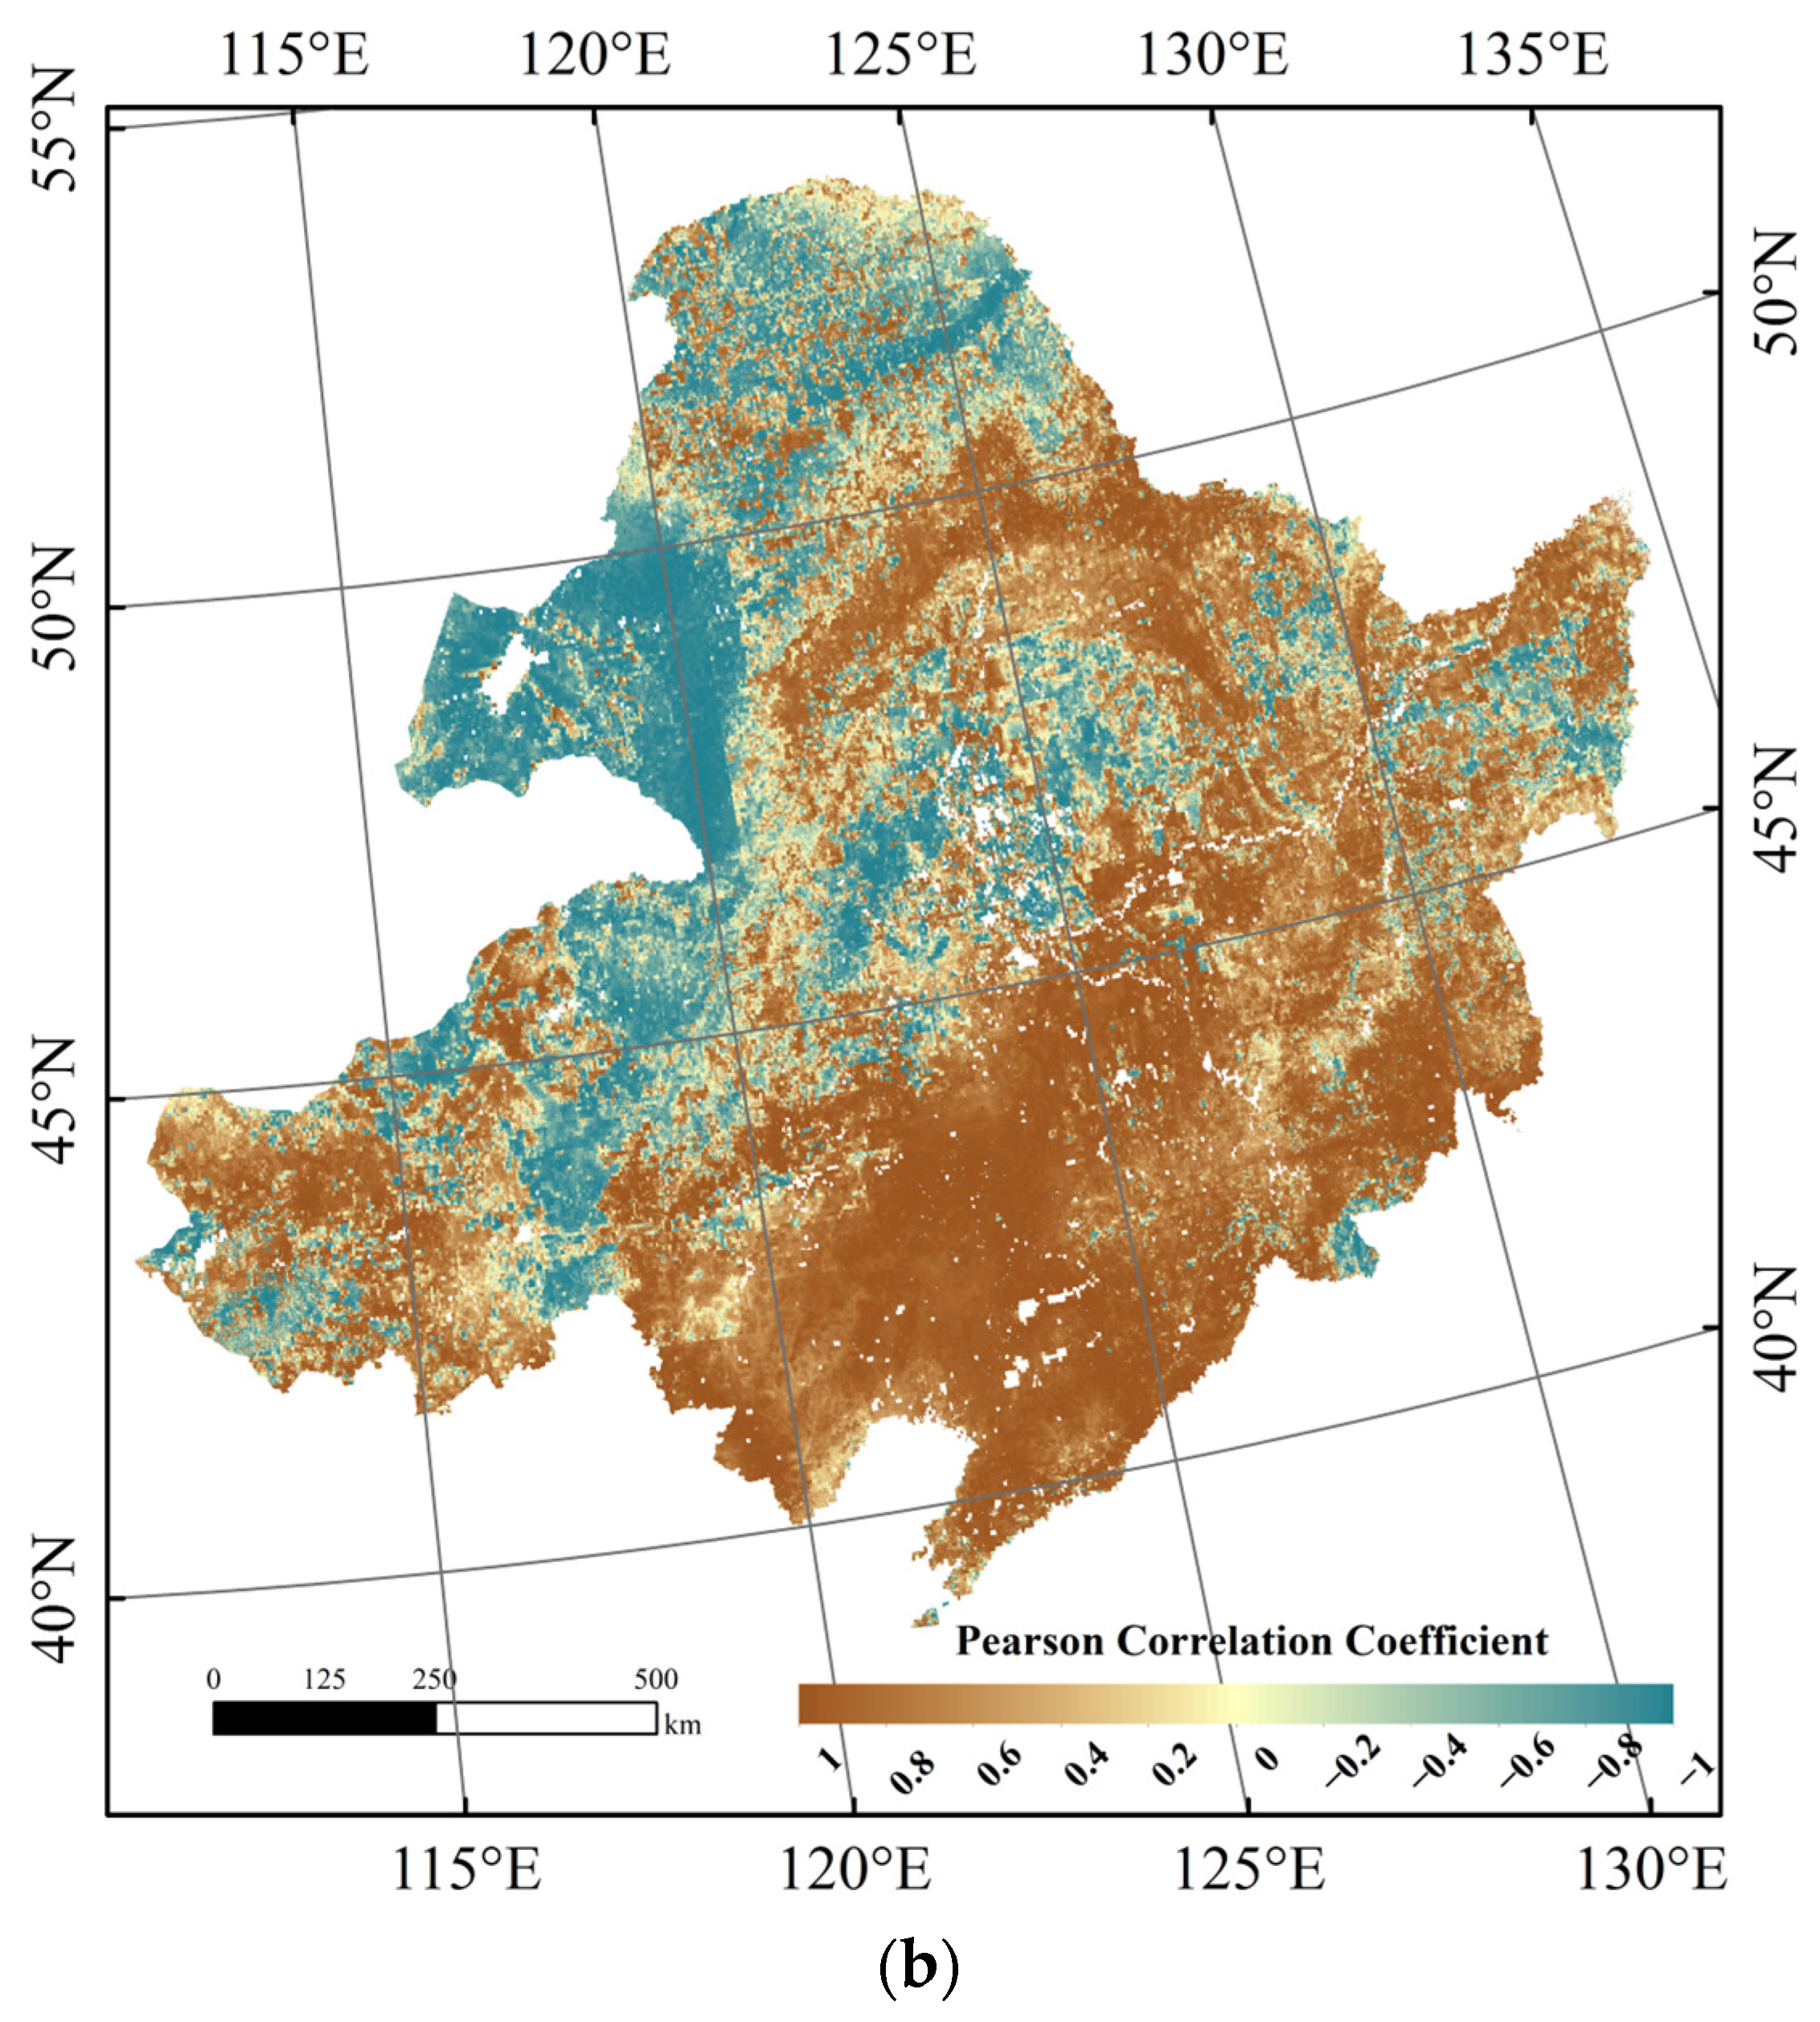
3.5. Relationship between Permafrost Change and SOC Change

When comparing the permafrost change status with the corresponding regional SOC stocks, the following observations can be made (Table 6).
The area of permafrost degradation between the 1980s and the 1990s was 12.52 × 10⁴ km2. Of this area, 3.77 × 10⁴ km2 was an area of SOC increase, with a total increase of SOC stocks of 2.05 Tg C, and 8.75 × 10⁴ km2 was an area of SOC decrease, with a total decrease of SOC stocks of 8.14 Tg C. Surprisingly, although the area of permafrost degradation in this period accounted for only 8.92% of the area of Northeast China, the total amount of the change in SOC stocks was 25.17% of the total change in SOC stocks in Northeast China, which is inconsistent with the correspondence between area and SOC and positively illustrates that the effect of permafrost degradation on SOC is significant and is especially pronounced when permafrost degradation are evident.
In the four periods of the 1980s, 1990s, 2000s, and 2010s, there was a region of permafrost between the Da Xing’anling Mountains, Genhe City, and Arctic Village with an area of 15.12 × 10⁴ km2. The SOC stocks in this region were 1.359 Pg C, 1.346 Pg C, 1.347 Pg C, and 1.349 Pg C for the respective periods. In the 1980s and 1990s, there was a significant increase in temperature, a rapid decrease in permafrost area, and a rapid decrease in SOC stocks. During this period, the longitudinal SOC stocks in this region also decreased rapidly. From the 1990s to the 2010s, there was a gradual increase, indicating that permafrost degradation not only affects SOC through area reduction, but also influences SOC changes in the active layer of permafrost.
In the permafrost growth area, the growth area is 12,610 km2, the increase in SOC stocks is 0.24 Tg, the decrease is 0.47 Tg, and the total amount is a decrease of 0.23 Tg. Among them, the SOC growth area is 5,486 km2, which accounts for 0.56% of SOC growth, and the SOC increment accounts for 0.32%; the SOC decrease area is 7,124 km2, which accounts for 1.66%, and the SOC decrease accounts for 2.20%. The total change in SOC stocks had an impact of −0.42% on SOC stocks in Northeast China.

3.6. Model Evaluation

The regression model is a machine learning technique that exhibits efficient and stable advantages when dealing with large datasets. The trend in MAGST from 1980 to 2002 is generally consistent with the 2003–2020 MAGST for the Northeast and permafrost regions, which has been adjusted by regression modeling. The model assesses the error outcomes (Figure 6) of a day-to-day surface air temperature simulation (N = 4748) from 1990 to 2002 with an RMSE of 1.289 °C, an MAE of 1.028 °C, and an R2 of 0.99. Thus, the model is deemed to have an accurate fit.
In this paper, 50 borehole data (MAGT) were collected from permafrost regions of Northeast China between 2000 and 2020 [51,52,53,54,55,56]. The data were divided into 25 groups each from the 2000s and 2010s and compared with the TTOP of the same period in the present study. The results are presented in Table 7:
The average temperature for the 50 boreholes’ data during both periods was −0.81 °C. In this study, the average TTOP was −0.89 °C, resulting in a difference of 0.09 °C. The root mean square error (RMSE) was 1.23 °C and the mean absolute error (MAE) was 0.94 °C. This indicates that the map of the distribution of permafrost in Northeast China developed through this study has a high degree of confidence.
As shown in Figure 7, the correlation (R) between the model results obtained in this study and the borehole data was 0.65 (p < 0.001), which is higher than that reported by Obu et al. [7] (R = 0.50, N = 50). Therefore, we believe that after adjusting the GST for the years 2003–2020 through the regression model, using the TTOP model to simulate the distribution of permafrost in Northeast China region becomes more reliable.

4. Discussion

4.1. Distribution and Degradation of Permafrost

Under the influence of global climate change, the degradation of permafrost in the northern hemisphere is an undeniable fact [57,58,59,60]. Different researchers have used different methods and data to assess the distribution of permafrost. In this study, the primary data source for permafrost distribution comes from ground meteorological station data. The data from 1980 to 2002 are consistent with the data used by other researchers. Therefore, in delineating permafrost regions, the areas for the 1980s (37.43 × 10⁴ km2) and 1990s (24.87 × 10⁴ km2) are basically consistent with the results of other studies [61,62]. Concerning the daily GST data, which were adjusted using regression models during the period of 2003–2020, it is crucial to note the substantial dissimilarities in GST measurements before and after a specific point. The discrepancy was observed in almost half of the data between 1980 and 2020, having a significant influence on the analysis of permafrost changes. Consequently, data adjustment is requisite to alleviate the irregularity in the information [63]. The study’s findings align with Ran et al.’s permafrost distribution map for the Northern Hemisphere during 2000–2016(Figure 8), available at https://data.tpdc.ac.cn (accessed on 22 August 2023), with the exception of a slightly lower total permafrost area. The discrepancy could be attributed to the use of different time intervals for the simulation [64].

4.2. The Relationship between SOC and TTOP

The classification of permafrost is based on mean annual ground temperature at the top temperature of permafrost (TTOP), so changes in permafrost are fundamentally related to changes in TTOP. A comparison between TTOP and SOC in Northeast China from 1981 to 2019 is shown in Figure 9a:
Both TTOP and SOC stocks show an overall increasing trend, but TTOP shows a fluctuating pattern with significant variations every few years, which is influenced by the climatic conditions at that time. In contrast, SOC stocks showed a rapid decline from 1981 to 1985, followed by small fluctuations. Starting in 1998, SOC stocks began to increase rapidly and have maintained a stable upward trend since then. In the early period, the increase in TTOP led to the degradation and release of a significant amount of organic matter, resulting in a decrease in SOC. In the middle period, as TTOP continued to increase, it promoted vegetation growth and increased the carbon sequestration capacity of both vegetation and soil, which slowed and stabilized SOC changes. In the later period, both the carbon sequestration capacity and the carbon content of vegetation and soil began to increase, indicating that Northeast China was continuously adding carbon to SOC during this period. This not only compensated for earlier losses, but also contributed to further increases in SOC, resulting in a stable upward trend.
The spatial correlation analysis between TTOP and SOC density over about 40 years is shown in Figure 9b. The average absolute correlation coefficient between SOC density and TTOP in Northeast China over about 40 years is 0.51. In the southeastern part of the region, TTOP and SOC density mostly show a positive correlation, indicating that higher TTOP is associated with higher SOC density levels. In the northwestern part of the region, TTOP and SOC density are mostly negatively correlated, indicating that lower ground surface temperatures are associated with higher SOC density. As ground surface temperatures continue to rise, the positive correlation is expected to increase. The permafrost area of Northeast China may become an enhanced carbon sink, serving as one of the buffer zones against global warming.

4.3. SOC in Different LULC and Response to Changes in Permafrost

Permafrost degradation can impact hydrogeological conditions [65], leading to changes in land use rotation and succession. These modifications, in turn, affect the rates of input and decomposition of SOC [66]. The surface soil layer (0–30 cm) is the most biologically active part, requiring careful attention [67]. As a result, changes in LULC types under the influence of permafrost degradation can have a significant impact on SOC [68]. The change in land area corresponds directly to the change in SOC within different LULC types in areas undergoing permafrost degradation. Northeast China has the highest land areas devoted to forestland, grasslands, and arable lands, resulting in the highest SOC content. Forestland and grasslands are the predominant land types in areas with concentrated permafrost distribution. Additionally, as one travels further northward and up to higher altitudes, there is a higher proportion of forestland and grasslands. This trend aligns with the degradation of permafrost.
Vegetation has a beneficial impact on safeguarding permafrost, leading to slower rates of permafrost degradation and subsequently, a deceleration in SOC change [69]. Within the region of permafrost degradation, forestlands are the primary contributors to an increase in SOC, while grasslands are a factor in SOC reduction. This can be attributed to several factors. On one hand, the extensive coverage of forestland in the area leads to an increase in SOC. Forestland produce greater amounts of plant litter and organic matter due to their vast size. This organic matter, combined with tree growth, improves carbon sequestration in the soil, increasing the land’s capacity for carbon storage and facilitating the growth of SOC. In contrast, grasslands have a weaker ability to sequester carbon compared to forestland. In large grassland areas, the release of SOC into the atmosphere through decomposition processes tends to exceed the rate of carbon fixation, resulting in a net decrease in SOC levels in regions dominated by grasslands. On the other hand, in the part of SOC growth, the contribution of forestland and grasslands to SOC growth is positively correlated with the ratio of their respective areas, with a ratio of approximately 1. In the part of SOC reduction, the loss of SOC from grasslands is intensified, with a contribution-to-area ratio ranging from 1.22 to 2.02. Conversely, the reduction in SOC from forestland is mitigated, with a contribution-to-area ratio ranging from 0.4 to 0.8. Even when forestland areas exceed those of grasslands, grasslands remain the primary contributor to SOC reduction. When there is a positive net change in SOC (1990s–2000s and 2000s–2010s), the ratio of the percentage of SOC growth to the percentage of multi-year permafrost area is approximately 0.46–0.53. However, when there is a negative net change in SOC (1980s–1990s), the ratio of the percentage of SOC decrease to the percentage of multi-year permafrost area is about 2.82. At the time of severe degradation of permafrost, the reduction in SOC was exacerbated by the enhancing effect of grassland compared to the inhibiting effect of forestland. This suggests that the decrease in SOC was greater, despite the fact that the area was dominated by forestland. Therefore, although the total area of permafrost in Northeast China is relatively small, permafrost degradation has a significant effect on the reduction in SOC.
The permafrost degradation trend in Northeast China undergoes an initial substantial decrease, followed by a gradual decline, resembling the SOC changes. The primary difference is that SOC exhibits a slow increase in the later stages. Rising air temperatures mainly contribute to permafrost degradation [70,71] which, combined with its degradation, induces significant SOC decomposition and release. Even small amounts of permafrost degradation can cause significant changes in SOC. Permafrost degradation upsets the equilibrium between the input of SOC and its decomposition, leading to a continuous adjustment of the environment to this dynamic. While SOC will initially decrease and then increase in the long term due to permafrost degradation, the prolonged impact on interrelationships between these factors under complex ecological circumstances may pose further complications.

5. Conclusions

In this study, we utilized a regression model and TTOP model to simulate the distribution of permafrost in Northeast China from 1980 to 2020. At the same time, we analyzed the changes in SOC over a forty-year period and examined the impacts of alterations in both permafrost and LULC on SOC changes. The study results demonstrate that climate warming has caused ongoing permafrost degradation in Northeast China, and the outlook for permafrost retention is not optimistic. SOC in Northeast China experienced a sharp decline, but has now recovered and is growing over the long term. In the short term, permafrost degradation has a negative impact on SOC growth, but over the long term, it has a positive effect. In the future, there is a need to enhance monitoring methods in Northeast China’s permafrost regions to provide more accurate observations of permafrost conditions. Additionally, further research efforts should be directed towards refining models that describe the nuanced response of SOC to permafrost degradation, taking into account different carbon fractions. This holistic approach will contribute to a more nuanced comprehension of the impacts of permafrost thaw on SOC dynamics in the region.

Author Contributions

Conceptualization, Y.S. and Y.L.; methodology, Y.S., Y.L. and L.D.; software, Y.S., S.H. and Q.W.; validation, Y.S., S.H., H.Z. and Q.W.; formal analysis, Y.S., S.H., H.Z. and Q.W.; investigation, Y.S. and Y.L.; resources, L.D. and Y.L.; data curation, Y.S., S.H. and H.Z.; writing—original draft preparation, Y.S.; writing—review and editing, S.H., H.Z., L.D. and Y.L.; visualization, Y.S. and Q.W.; supervision, Y.L. and L.D.; project administration, L.D.; funding acquisition, Y.L. and L.D. All authors have read and agreed to the published version of the manuscript.

Funding

This research was funded by Natural Science Foundation of Heilongjiang Province (grant number LH2023D022).

Data Availability Statement

Publicly available datasets were analyzed in this study. This data can be found here: Meteorological Data, https://data.cma.cn, accessed on 20 May 2023; Digital Elevation Model (DEM) data, https://earthexplorer.usgs.gov, accessed on 20 May 2023; Land use and land cover data, https://www.resdc.cn, accessed on 20 May 2023; Soil Or-ganic Carbon (SOC) data, http://www.geodata.cn, accessed on 20 May 2023.

Conflicts of Interest

The authors declare no conflict of interest.

References

  1. Ciais, P.; Sabine, C.; Bala, G.; Bopp, L.; Brovkin, V.; Canadell, J.; Chhabra, A.; DeFries, R.; Galloway, J.; Heimann, M. Carbon and other biogeochemical cycles. In Climate Change 2013: The Physical Science Basis; Contribution of Working Group I to the Fifth Assessment Report of the Intergovernmental Panel on Climate Change; Cambridge University Press: Cambridge, UK, 2014; pp. 465–570. [Google Scholar]
  2. Scharlemann, J.P.; Tanner, E.V.; Hiederer, R.; Kapos, V. Global soil carbon: Understanding and managing the largest terrestrial carbon pool. Carbon Manag. 2014, 5, 81–91. [Google Scholar] [CrossRef]
  3. Köchy, M.; Hiederer, R.; Freibauer, A. Global distribution of soil organic carbon–Part 1: Masses and frequency distributions of SOC stocks for the tropics, permafrost regions, wetlands, and the world. Soil 2015, 1, 351–365. [Google Scholar] [CrossRef]
  4. Schrumpf, M.; Schulze, E.; Kaiser, K.; Schumacher, J. How accurately can soil organic carbon stocks and stocks changes be quantified by soil inventories? Biogeosciences 2011, 8, 1193–1212. [Google Scholar] [CrossRef]
  5. Yigini, Y.; Panagos, P. Assessment of soil organic carbon stocks under future climate and land cover changes in Europe. Sci. Total Environ. 2016, 557, 838–850. [Google Scholar] [CrossRef] [PubMed]
  6. Taylor, P.G.; Cleveland, C.C.; Wieder, W.R.; Sullivan, B.W.; Doughty, C.E.; Dobrowski, S.Z.; Townsend, A.R. Temperature and rainfall interact to control carbon cycling in tropical forests. Ecol. Lett. 2017, 20, 779–788. [Google Scholar] [CrossRef] [PubMed]
  7. Obu, J.; Westermann, S.; Bartsch, A.; Berdnikov, N.; Christiansen, H.H.; Dashtseren, A.; Delaloye, R.; Elberling, B.; Etzelmüller, B.; Kholodov, A.; et al. Northern Hemisphere permafrost map based on TTOP modelling for 2000–2016 at 1 km2 scale. Earth-Sci. Rev. 2019, 193, 299–316. [Google Scholar] [CrossRef]
  8. Gruber, N.; Friedlingstein, P.; Field, C.B.; Valentini, R.; Heimann, M.; Richey, J.E.; Lankao, P.R.; Schulze, E.-D.; Chen, C.-T.A. The vulnerability of the carbon cycle in the 21st century: An assessment of carbon-climate-human interactions. Scope-Sci. Comm. Probl. Environ. Int. Counc. Sci. Unions 2004, 62, 45–76. [Google Scholar]
  9. Hugelius, G.; Strauss, J.; Zubrzycki, S.; Harden, J.W.; Schuur, E.A.; Ping, C.-L.; Schirrmeister, L.; Grosse, G.; Michaelson, G.J.; Koven, C.D. Estimated stocks of circumpolar permafrost carbon with quantified uncertainty ranges and identified data gaps. Biogeosciences 2014, 11, 6573–6593. [Google Scholar] [CrossRef]
  10. Ding, J.; Chen, L.; Ji, C.; Hugelius, G.; Li, Y.; Liu, L.; Qin, S.; Zhang, B.; Yang, G.; Li, F.; et al. Decadal soil carbon accumulation across Tibetan permafrost regions. Nat. Geosci. 2017, 10, 420–424. [Google Scholar] [CrossRef]
  11. IPCC. Climate Change 2021: The Physical Science Basis; Masson-Delmotte, V., Zhai, P., Pirani, A., Connors, S.L., Péan, C., Berger, S., Caud, N., Chen, Y., Goldfarb, L., Gomis, M.I., et al., Eds.; Contribution of Working Group I to the Sixth Assessment Report of the Intergovernmental Panel on Climate Change; Cambridge University Press: Cambridge, UK; New York, NY, USA, 2021. [Google Scholar] [CrossRef]
  12. Wei, D.; Qi, Y.; Ma, Y.; Wang, X.; Ma, W.; Gao, T.; Huang, L.; Zhao, H.; Zhang, J.; Wang, X. Plant uptake of CO2 outpaces losses from permafrost and plant respiration on the Tibetan Plateau. Proc. Natl. Acad. Sci. USA 2021, 118, e2015283118. [Google Scholar] [CrossRef]
  13. Jin, H.; Li, S.; Cheng, G.; Shaoling, W.; Li, X. Permafrost and climatic change in China. Glob. Planet. Chang. 2000, 26, 387–404. [Google Scholar] [CrossRef]
  14. Jin, H.; Yu, Q.; Lü, L.; Guo, D.; He, R.; Yu, S.; Sun, G.; Li, Y. Degradation of permafrost in the Xing’anling Mountains, Northeastern China. Permafr. Periglac. Process. 2007, 18, 245–258. [Google Scholar] [CrossRef]
  15. Jin, H.; Ma, Q. Impacts of Permafrost Degradation on Carbon Stocks and Emissions under a Warming Climate: A Review. Atmosphere 2021, 12, 1425. [Google Scholar] [CrossRef]
  16. Jin, H.; He, R.; Cheng, G.; Wu, Q.; Wang, S.; Lü, L.; Chang, X. Changes in frozen ground in the Source Area of the Yellow River on the Qinghai–Tibet Plateau, China, and their eco-environmental impacts. Environ. Res. Lett. 2009, 4, 045206. [Google Scholar] [CrossRef]
  17. Schuur, E.A.G.; McGuire, A.D.; Schädel, C.; Grosse, G.; Harden, J.W.; Hayes, D.J.; Hugelius, G.; Koven, C.D.; Kuhry, P.; Lawrence, D.M.; et al. Climate change and the permafrost carbon feedback. Nature 2015, 520, 171–179. [Google Scholar] [CrossRef] [PubMed]
  18. Philipp, M.; Dietz, A.; Buchelt, S.; Kuenzer, C. Trends in satellite Earth observation for permafrost related analyses—A review. Remote Sens. 2021, 13, 1217. [Google Scholar] [CrossRef]
  19. Nelson, F.E.; Outcalt, S.I. A computational method for prediction and regionalization of permafrost. Arct. Alp. Res. 1987, 19, 279–288. [Google Scholar] [CrossRef]
  20. Cheng, G.-D. Problems on zonation of high-altitude permafrost. Acta Geogr. Sin. Beijing 1984, 39, 185–193. [Google Scholar]
  21. Smith, M.; Riseborough, D. Permafrost monitoring and detection of climate change. Permafr. Periglac. Process. 1996, 7, 301–309. [Google Scholar] [CrossRef]
  22. Che, L.; Zhang, H.; Wan, L. Spatial distribution of permafrost degradation and its impact on vegetation phenology from 2000 to 2020. Sci. Total Environ. 2023, 877, 162889. [Google Scholar] [CrossRef]
  23. Ran, Y.; Li, X.; Cheng, G. Climate warming over the past half century has led to thermal degradation of permafrost on the Qinghai–Tibet Plateau. Cryosphere 2018, 12, 595–608. [Google Scholar] [CrossRef]
  24. Lewkowicz, A.G.; Bonnaventure, P.P. Equivalent elevation: A new method to incorporate variable surface lapse rates into mountain permafrost modelling. Permafr. Periglac. Process. 2011, 22, 153–162. [Google Scholar] [CrossRef]
  25. Gao, B.; Yang, D.; Qin, Y.; Wang, Y.; Li, H.; Zhang, Y.; Zhang, T. Change in frozen soils and its effect on regional hydrology, upper Heihe basin, northeastern Qinghai–Tibetan Plateau. Cryosphere 2018, 12, 657–673. [Google Scholar] [CrossRef]
  26. Morrissey, L.A.; Strong, L.; Card, D. Mapping permafrost in the boreal forest with thematic mapper satellite data. Photogramm. Eng. Remote Sens. 1986, 52, 1510. [Google Scholar]
  27. Ferreira, A.; Vieira, G.; Ramos, M.; Nieuwendam, A. Ground temperature and permafrost distribution in Hurd Peninsula (Livingston Island, Maritime Antarctic): An assessment using freezing indexes and TTOP modelling. CATENA 2017, 149, 560–571. [Google Scholar] [CrossRef]
  28. Garibaldi, M.C.; Bonnaventure, P.P.; Lamoureux, S.F. Utilizing the TTOP model to understand spatial permafrost temperature variability in a High Arctic landscape, Cape Bounty, Nunavut, Canada. Permafr. Periglac. Process. 2021, 32, 19–34. [Google Scholar] [CrossRef]
  29. Ni, J.; Wu, T.; Zhu, X.; Hu, G.; Zou, D.; Wu, X.; Li, R.; Xie, C.; Qiao, Y.; Pang, Q. Simulation of the present and future projection of permafrost on the Qinghai-Tibet Plateau with statistical and machine learning models. J. Geophys. Res. Atmos. 2021, 126, e2020JD033402. [Google Scholar] [CrossRef]
  30. Huang, S.; Ding, Q.; Chen, K.; Hu, Z.; Liu, Y.; Zhang, X.; Gao, K.; Qiu, K.; Yang, Y.; Ding, L. Changes in near-surface permafrost temperature and active layer thickness in Northeast China in 1961–2020 based on GIPL model. Cold Reg. Sci. Technol. 2023, 206, 103709. [Google Scholar] [CrossRef]
  31. Romanovsky, V.; Smith, S.; Isaksen, K.; Nyland, K.; Kholodov, A.; Shiklomanov, N.; Streletskiy, D.; Farquharson, L.; Drozdov, D.; Malkova, G. Terrestrial Permafrost [in “State of the Climate in 2019”]. Bull. Am. Meteorol. Soc. 2020, 101, S265–S271. [Google Scholar]
  32. Romanovsky, V.; Isaksen, K.; Drozdov, D.; Anisimov, O.; Instanes, A.; Leibman, M.; McGuire, A.D.; Shiklomanov, N.; Smith, S.; Walker, D. Changing Permafrost and Its Impacts, Snow, Water, Ice and Permafrost in the Arctic (SWIPA), 2017; Arctic Monitoring and Assessment Programme (AMAP): Oslo, Norway, 2017; pp. 65–102. [Google Scholar]
  33. Fu, Z.; Wu, Q.; Zhang, W.; He, H.; Wang, L. Water migration and segregated ice formation in frozen ground: Current advances and future perspectives. Front. Earth Sci. 2022, 10, 826961. [Google Scholar] [CrossRef]
  34. Schuur, E.A.; Vogel, J.G.; Crummer, K.G.; Lee, H.; Sickman, J.O.; Osterkamp, T. The effect of permafrost thaw on old carbon release and net carbon exchange from tundra. Nature 2009, 459, 556–559. [Google Scholar] [CrossRef] [PubMed]
  35. Abbott, B.W.; Brown, M.; Carey, J.C.; Ernakovich, J.; Frederick, J.M.; Guo, L.; Hugelius, G.; Lee, R.M.; Loranty, M.M.; Macdonald, R. We must stop fossil fuel emissions to protect permafrost ecosystems. Front. Environ. Sci. 2022, 10, 889428. [Google Scholar] [CrossRef]
  36. Piao, S.; Nan, H.; Huntingford, C.; Ciais, P.; Friedlingstein, P.; Sitch, S.; Peng, S.; Ahlström, A.; Canadell, J.G.; Cong, N. Evidence for a weakening relationship between interannual temperature variability and northern vegetation activity. Nat. Commun. 2014, 5, 5018. [Google Scholar] [CrossRef] [PubMed]
  37. Jiang, L.; Chen, H.; Zhu, Q.; Yang, Y.; Li, M.; Peng, C.; Zhu, D.; He, Y. Assessment of frozen ground organic carbon pool on the Qinghai-Tibet Plateau. J. Soils Sediments 2019, 19, 128–139. [Google Scholar] [CrossRef]
  38. Ran, Y.; Li, X.; Cheng, G.; Zhang, T.; Wu, Q.; Jin, H.; Jin, R. Distribution of permafrost in China: An overview of existing permafrost maps. Permafr. Periglac. Process. 2012, 23, 322–333. [Google Scholar] [CrossRef]
  39. Romanovsky, V.E.; Smith, S.L.; Christiansen, H.H. Permafrost thermal state in the polar Northern Hemisphere during the international polar year 2007–2009: A synthesis. Permafr. Periglac. Process. 2010, 21, 106–116. [Google Scholar] [CrossRef]
  40. Northeast Regional Climate Change Assessment Report: 2020 Writing Committee, Northeast Regional Climate Change Assessment Report: 2020 Summary for Decision Makers; Meteorological Press: Beijing, China, 2021.
  41. Shan, W.; Zhang, C.; Guo, Y.; Qiu, L.; Xu, Z.; Wang, Y. Spatial Distribution and Variation Characteristics of Permafrost Temperature in Northeast China. Sustainability 2022, 14, 8178. [Google Scholar] [CrossRef]
  42. Li, X.; Jin, H.; Sun, L.; Wang, H.; Huang, Y.; He, R.; Chang, X.; Yu, S.; Zang, S. TTOP-model-based maps of permafrost distribution in Northeast China for 1961–2020. Permafr. Periglac. Process. 2022, 33, 425–435. [Google Scholar] [CrossRef]
  43. Yang, D.; Zhan, D.; Li, M.; Zang, S. Factors Influencing the Spatiotemporal Changes of Permafrost in Northeast China from 1982 to 2020. Land 2023, 12, 350. [Google Scholar] [CrossRef]
  44. Jin, H.; Sun, G.; Yu, S.; Jin, R.; He, R. Symbiosis of marshes and permafrost in Da and Xiao Hinggan Mountains in northeastern China. Chin. Geogr. Sci. 2008, 18, 62–69. [Google Scholar] [CrossRef]
  45. Chen, S.; Zang, S.; Sun, L. Characteristics of permafrost degradation in Northeast China and its ecological effects: A review. Sci. Cold Arid. Reg. 2020, 12, 1–11. [Google Scholar]
  46. Cantarello, E.; Newton, A.C.; Hill, R.A. Potential effects of future land-use change on regional carbon stocks in the UK. Environ. Sci. Policy 2011, 14, 40–52. [Google Scholar] [CrossRef]
  47. Xu, W.; Sun, C.; Zuo, J.; Ma, Z.; Li, W.; Yang, S. Homogenization of Monthly Ground Surface Temperature in China during 1961–2016 and Performances of GLDAS Reanalysis Products. J. Clim. 2019, 32, 1121–1135. [Google Scholar] [CrossRef]
  48. Darajeh, N.; Idris, A.; Fard Masoumi, H.R.; Nourani, A.; Truong, P.; Sairi, N.A. Modeling BOD and COD removal from Palm Oil Mill Secondary Effluent in floating wetland by Chrysopogon zizanioides (L.) using response surface methodology. J. Environ. Manag. 2016, 181, 343–352. [Google Scholar] [CrossRef] [PubMed]
  49. Nguyen, X.C.; Nguyen, T.P.; Lam, V.S.; Le, P.-C.; Vo, T.D.H.; Hoang, T.-H.T.; Chung, W.J.; Chang, S.W.; Nguyen, D.D. Estimating ammonium changes in pilot and full-scale constructed wetlands using kinetic model, linear regression, and machine learning. Sci. Total Environ. 2024, 907, 168142. [Google Scholar] [CrossRef] [PubMed]
  50. Luo, D.; Jin, H.; Jin, R.; Yang, X.; Lü, L. Spatiotemporal variations of climate warming in northern Northeast China as indicated by freezing and thawing indices. Quat. Int. 2014, 349, 187–195. [Google Scholar] [CrossRef]
  51. Hong, H. Study on the Impact of China-Russia Oil Transmission Project on Surrounding Permafrost. Master’s Thesis, Heilongjiang University, Harbin, China, 2018. (In Chinese). [Google Scholar]
  52. Chang, X.; Jin, H.; He, R.; Jing, H.; Li, G.; Wang, Y.; Luo, D.; Yu, S.; Sun, H. Progress of perennial permafrost monitoring in the northern DaXingAnLing. Glacial Permafr. 2013, 35, 93–100. (In Chinese) [Google Scholar]
  53. Li, X.; Jin, H.; Wang, H.; Jin, X.; Bense, V.F.; Marchenko, S.S.; He, R.; Huang, Y.; Luo, D. Effects of fire history on thermal regimes of permafrost in the northern Da Xing’anling Mountains, NE China. Geoderma 2022, 410, 115670. [Google Scholar] [CrossRef]
  54. He, R.; Jin, H.; Luo, D.; Huang, Y.; Ma, F.; Li, X.; Wang, H.; Li, Y.; Jia, N.; Li, X. Changes in the permafrost environment under dual impacts of climate change and human activities in the Hola basin, northern Da Xing’anling Mountains, Northeast China. Land Degrad. Dev. 2022, 33, 1219–1234. [Google Scholar] [CrossRef]
  55. He, R.-X.; Jin, H.-J.; Luo, D.-L.; Li, X.-Y.; Zhou, C.-F.; Jia, N.; Jin, X.-Y.; Li, X.-Y.; Che, T.; Yang, X.; et al. Permafrost changes in the Nanwenghe Wetlands Reserve on the southern slope of the Da Xing’anling–Yile’huli mountains, Northeast China. Adv. Clim. Change Res. 2021, 12, 696–709. [Google Scholar] [CrossRef]
  56. He, R.; Jin, H.; Hao, J.; Chang, X.; Luo, D. Evaluation of environmental impacts of permafrost along the Sino-Russian oil pipeline (Mohe-Urqi section). Civ. Eng. Environ. Eng. 2011, 33 (Suppl. S2), 128–134. (In Chinese) [Google Scholar]
  57. Wang, J.; Liu, D. Vegetation green-up date is more sensitive to permafrost degradation than climate change in spring across the northern permafrost region. Glob. Change Biol. 2022, 28, 1569–1582. [Google Scholar] [CrossRef] [PubMed]
  58. Zhang, Z.-Q.; Wu, Q.-B.; Hou, M.-T.; Tai, B.-W.; An, Y.-K. Permafrost change in Northeast China in the 1950s–2010s. Adv. Clim. Change Res. 2021, 12, 18–28. [Google Scholar] [CrossRef]
  59. Liu, L.; Zhao, D.; Wei, J.; Zhuang, Q.; Gao, X.; Zhu, Y.; Zhang, J.; Guo, C.; Du, Z. Permafrost sensitivity to global warming of 1.5 °C and 2 °C in the Northern Hemisphere. Environ. Res. Lett. 2021, 16, 034038. [Google Scholar] [CrossRef]
  60. Hu, G.; Zhao, L.; Wu, T.; Wu, X.; Park, H.; Fedorov, A.; Wei, Y.; Li, R.; Zhu, X.; Sun, Z.; et al. Spatiotemporal variations and regional differences in air temperature in the permafrost regions in the Northern Hemisphere during 1980–2018. Sci. Total Environ. 2021, 791, 148358. [Google Scholar] [CrossRef] [PubMed]
  61. Desyatkin, R. Climate Change and Dynamics of Permafrost Ecosystems of the Center of the Continental Cryolithozone of the Northern Hemisphere. Her. Russ. Acad. Sci. 2018, 88, 494–501. [Google Scholar] [CrossRef]
  62. Zhongqiong, Z.; Qingbai, W.; Xueyi, X.; Yuncheng, L. Spatial distribution and changes of Xing’an permafrost in China over the past three decades. Quat. Int. 2019, 523, 16–24. [Google Scholar] [CrossRef]
  63. Zhou, C.; Wang, K.; Ma, Q. Evaluation of Eight Current Reanalyses in Simulating Land Surface Temperature from 1979 to 2003 in China. J. Clim. 2017, 30, 7379–7398. [Google Scholar] [CrossRef]
  64. Ran, Y.; Li, X.; Cheng, G.; Nan, Z.; Che, J.; Sheng, Y.; Wu, Q.; Jin, H.; Luo, D.; Tang, Z.; et al. Mapping the permafrost stability on the Tibetan Plateau for 2005–2015. Sci. China Earth Sci. 2021, 64, 62–79. [Google Scholar] [CrossRef]
  65. Carpino, O.A.; Berg, A.A.; Quinton, W.L.; Adams, J.R. Climate change and permafrost thaw-induced boreal forest loss in northwestern Canada. Environ. Res. Lett. 2018, 13, 084018. [Google Scholar] [CrossRef]
  66. Xu, M.; Li, X.; Cai, X.; Gai, J.; Li, X.; Christie, P.; Zhang, J. Soil microbial community structure and activity along a montane elevational gradient on the Tibetan Plateau. Eur. J. Soil Biol. 2014, 64, 6–14. [Google Scholar] [CrossRef]
  67. Buraka, T.; Elias, E.; Lelago, A. Soil organic carbon and its’ stock potential in different land-use types along slope position in Coka watershed, Southern Ethiopia. Heliyon 2022, 8, e10261. [Google Scholar] [CrossRef] [PubMed]
  68. Tellen, V.A.; Yerima, B.P.K. Effects of land use change on soil physicochemical properties in selected areas in the North West region of Cameroon. Environ. Syst. Res. 2018, 7, 3. [Google Scholar] [CrossRef]
  69. Jia, Y.; Chen, S.; Wu, M.; Gu, Y.; Wei, P.; Wu, T.; Shang, Z.; Wang, S.; Yu, H. Improved permafrost stability by revegetation in extremely degraded grassland of the Qinghai-Tibetan Plateau. Geoderma 2023, 430, 116350. [Google Scholar] [CrossRef]
  70. Biskaborn, B.K.; Smith, S.L.; Noetzli, J.; Matthes, H.; Vieira, G.; Streletskiy, D.A.; Schoeneich, P.; Romanovsky, V.E.; Lewkowicz, A.G.; Abramov, A.; et al. Permafrost is warming at a global scale. Nat. Commun. 2019, 10, 264. [Google Scholar] [CrossRef]
  71. Zhang, G.; Nan, Z.; Zhao, L.; Liang, Y.; Cheng, G. Qinghai-Tibet Plateau wetting reduces permafrost thermal responses to climate warming. Earth Planet. Sci. Lett. 2021, 562, 116858. [Google Scholar] [CrossRef]
Figure 1. Digital Elevation Model (DEM) Map of Northeast China.
Forests 15 00014 g001
Figure 2. The mean annual air temperatures and mean annual ground surface temperatures in representative areas of Northeast China and permafrost regions from 1980 to 2020, and the trend of mean annual air temperature change in China. (a) Actual observed data. (b) Adjusted data. AT-C: mean annual air temperature of China; AT-NE: mean annual air temperature of Northeast China; AT-PR: mean annual air temperature of permafrost regions; GST-NE: mean annual ground surface temperature of Northeast China; GST-PR: mean annual ground surface temperature of permafrost regions; GST-A-NE: adjusted mean annual ground surface temperature of Northeast China; GST-A-PR: adjusted mean annual ground surface temperature of permafrost regions (Table 3).
Forests 15 00014 g002
Figure 3. Mean annual top temperature of permafrost and spatial distribution of permafrost in Northeast China from the 1980s to the 2010s based on the TTOP model. (a) Mean annual top temperature of permafrost from 1980s to 2010s based on the TTOP model. (b) Permafrost distribution based on mean annual top temperature of permafrost division from 1980s to 2010s.
Forests 15 00014 g003aForests 15 00014 g003b
Figure 4. (a) The spatial distribution of SOC density in Northeast China from 1981 to 2019. (b) The annual average variation trend of SOC density and stocks in Northeast China.
Forests 15 00014 g004
Figure 5. Proportion of LULC type area and contribution to increase/decrease in SOC stock in areas of permafrost degradation during different successional periods.
Forests 15 00014 g005
Figure 6. The regression model calculates MAGST versus measured MAGST and error analysis.
Forests 15 00014 g006
Figure 7. Comparison of correlation between modeled mean annual ground temperatures at the top temperature of permafrost (TTOP) and mean annual ground temperatures measured in boreholes (MAGT). (a) is the result of this research; (b) is from Obu et al. (2019) [7].
Forests 15 00014 g007
Figure 8. Comparison of spatial distribution of permafrost in Northeast China. (a) is based on the results of Ran et al. (2021) [64] from 2000 to 2016; (b) Results of this study from 2000 to 2019.
Forests 15 00014 g008
Figure 9. (a) is the average annual trend of SOC stocks and TTOP; (b) is the spatial correlation analysis of SOC density and TTOP.
Forests 15 00014 g009aForests 15 00014 g009b
Table 1. rk (the ratio of thermal conductivity of soil under thawed to frozen states) value in different LULC types.
LULC Typesrk ValueLCCS Classification System Number
Bare areas0.95140, 150, 152, 153, 200, 201, 202
Grasslands and croplands0.7510, 11, 12, 20, 130
Shrubs0.80120, 121, 122
Deciduous forest0.9550, 60, 61, 62, 70, 71, 72, 80, 81, 82
Wetlands0.55180
Urban land0.70190
Table 2. Basic information on representative national meteorological stations of the permafrost region.
StationLongitude (°E)Latitude (°N)Elevation (m)
Mo’he122.5252.97439.7
Tulihe121.6850.48733.7
Jiagedaqi124.1250.40371.7
Manzhouli117.3249.58661.8
Hailar119.7049.25649.6
Sunwu127.3549.43234.5
Boketu121.9248.77739.7
Table 3. Maximum, minimum, and average of GST at different time intervals in Northeast China and permafrost regions.
YearMaximum (°C)Minimum (°C)Average (°C)
Northeast ChinaActual observed data1980–20037.445.286.45
2004–20209.637.618.77
1980–20209.635.287.41
Adjusted data1980–20037.445.286.45
2004–20208.566.307.49
1980–20208.565.286.88
permafrost regionsActual observed data1980–20031.21−1.29−0.08
2004–20204.980.784.10
1980–20204.98−1.291.65
Adjusted data1980–20031.21−1.29−0.08
2004–20202.50−0.261.18
1980–20202.50−1.290.44
Table 4. Proportion of SOC stocks (SOCS) corresponding to permafrost and different LULC types.
YearLULCPermafrost
Arable LandForestlandGrasslandWatersConstruction LandUnused Land
SOCS (Pg C)Proportion (%)SOCS (Pg C)Proportion (%)SOCS (Pg C)Proportion (%)SOCS (Pg C)Proportion (%)SOCS (Pg C)Proportion (%)SOCS (Pg C)Proportion (%)SOCS (Pg C)Proportion (%)
1980s2.3222.864.1440.862.7527.120.131.300.171.650.636.223.1831.34
1990s2.5925.564.0139.672.6426.060.121.190.171.680.595.852.1521.26
2000s2.6525.894.0539.642.6425.820.121.170.181.740.595.741.6616.23
2010s2.7426.723.9638.592.5224.590.111.090.232.210.706.811.4614.17
Table 5. Dynamics of LULC change in areas affected by permafrost degradation across various time periods (%).
YearLULC
Arable LandForestland Grassland WatersConstruction LandUnused Land
1980–200045.23−7.91−1.7619.8217.33−3.26
1990–201050.68−1.25−0.24−8.5527.45−0.51
2000–202010.84−1.86−9.33−8.4772.97184.07
Table 6. Types of permafrost changes and corresponding types and proportions of SOC alterations.
YearSubjectAreas of Permafrost DegradationNortheast ChinaProportion (%)SubjectAreas of Permafrost
Degradation
Northeast China Proportion (%)
1980s–1990sAreas of increased SOC (km2)3.77 × 10461.66 × 1046.11Areas of reduced SOC (km2)8.75 × 10478.60 × 10411.13
Total increase in SOC stocks (Tg C)2.0544.334.63Total reduction in SOC stocks (Tg C)8.1468.5211.88
Total area (km2)12.52 × 104140.26 × 1048.92The total amount of change in SOC stocks (Tg C)−6.09−24.1825.17
1990s–2000sAreas of increased SOC (km2)3.90 × 104106.22 × 1043.66Areas of reduced SOC (km2)1.99 × 10434.04 × 1045.84
Total increase in SOC stocks (Tg C)3.91121.103.23Total reduction in SOC stocks (Tg C)1.9318.2610.57
Total area (km2)5.88 × 104140.26 × 1044.19The total amount of change in SOC stocks (Tg C)1.98102.841.93
2000s–2010sAreas of increased SOC (km2)2.50 × 10497.36 × 1042.57Areas of reduced SOC (km2)1.17 × 10442.90 × 1042.72
Total increase in SOC stocks (Tg C)1.4275.811.88Total reduction in SOC stocks (Tg C)0.6621.423.07
Total area (km2)3.67 × 104140.26 × 1042.62The total amount of change in SOC stocks (Tg C)0.7754.391.41
SubjectPermafrost Growth AreasNortheast ChinaProportion (%)SubjectPermafrost Growth AreasNortheast ChinaProportion (%)
2000s–2010sAreas of increased SOC (km2)0.55 × 10497.36 × 1040.56Areas of reduced SOC (km2)0.71 × 10442.90 × 1041.66
Total increase in SOC stocks (Tg C)0.2475.810.32Total reduction in SOC stocks (Tg C)0.4721.422.20
Total area (km2)1.26 × 104140.26 × 1040.90The total amount of change in SOC stocks (Tg C)−0.2354.39−0.42
Table 7. The average annual ground temperature (MAGT) measured by boreholes and the top temperature of permafrost (TTOP)simulated in this study. (When the borehole-measured MAGT is greater than 0 °C, that temperature represents the average temperature of the borehole and there is no permafrost at that borehole location).
SiteLongitude (°E)Latitude (°N)Borehole Measured MAGT (°C)TTOP (°C)TTOP (°C) by Obu, J. et al. (2019) [7]
CW1123.9853.33−1.63−2.110.74
CW3124.5852.99−0.1−1.871.86
CW4124.5152.741.9−1.81.32
CW5124.5852.54−1.8−1.751.24
CW6124.6652.43−0.8−1.591.75
CW7124.6652.06−0.7−1.191.58
CW8124.5351.81−0.5−1.10.21
CW9124.3951.70−1.3−1.280.21
CW10124.2751.47−2.75−1.260.74
CW12124.2151.21−1.3−0.910.72
CW13124.3150.701.90.120.61
CW14124.2150.4730.170.85
CW15124.6549.772.31.123.03
XL1124.3951.69−1.13−1.130.83
XL2124.3951.69−1.71−1.130.83
XL3124.3951.69−1.43−1.130.83
GH1121.5150.94−0.24−2.43−0.03
GH2121.5150.94−0.8−2.43−0.03
GH3121.5050.93−3.87−2.33−0.20
GH4121.5050.93−2.84−2.33−0.20
GH5121.5350.80−0.59−1.95−0.72
GH6121.5050.80−1.92−2.190.01
GH9121.5150.94−3.3−2.43−0.03
YT1121.5550.63−2.18−1.78−0.22
YT2121.5550.63−1.92−1.78−0.22
DW01124.1953.210.2−0.571.38
DW02124.2053.19−1.2−0.561.95
DW04124.4253.100.5−0.431.61
DW05124.5753.00−1.4−0.371.49
DW06124.4952.69−0.5−0.770.51
DW07124.6952.23−0.60.511.40
DW08124.6652.03−1.4−0.641.53
DW09124.3451.59−1.7−0.580.40
DW10124.3350.900.90.80.16
DW11124.3450.7411.140.19
DW12124.2950.601.91.281.15
MH1122.0253.03−2.9−2.350.28
MH2122.0253.02−1.8−2.360.83
NE2125.1451.13−1.940.720.97
NE3125.1451.130.920.720.97
NE4125.1451.122.160.711.84
NE5125.1551.15−1.320.691.91
YTLH1121.5550.63−2.18−1.71−0.22
YTLH2121.5550.63−1.93−1.71−0.22
MG122.2852.28−2.31−2.74−0.70
ALS121.9051.89−3.63−2.61−0.15
P1125.1451.13−0.520.720.97
P2125.1451.13−1.190.720.97
P3125.1451.130.170.720.97
P4125.1451.121.650.711.84
Average Value−0.81−0.890.75
Disclaimer/Publisher’s Note: The statements, opinions and data contained in all publications are solely those of the individual author(s) and contributor(s) and not of MDPI and/or the editor(s). MDPI and/or the editor(s) disclaim responsibility for any injury to people or property resulting from any ideas, methods, instructions or products referred to in the content.

