
Geographical Variation Reveals Strong Genetic Differentiation in Cryptomeria japonica var. sinensis

Abstract
:1. Introduction
2. Materials and Methods
2.1. Population Sites and Plant Materials
2.2. Needle Trait Analyses
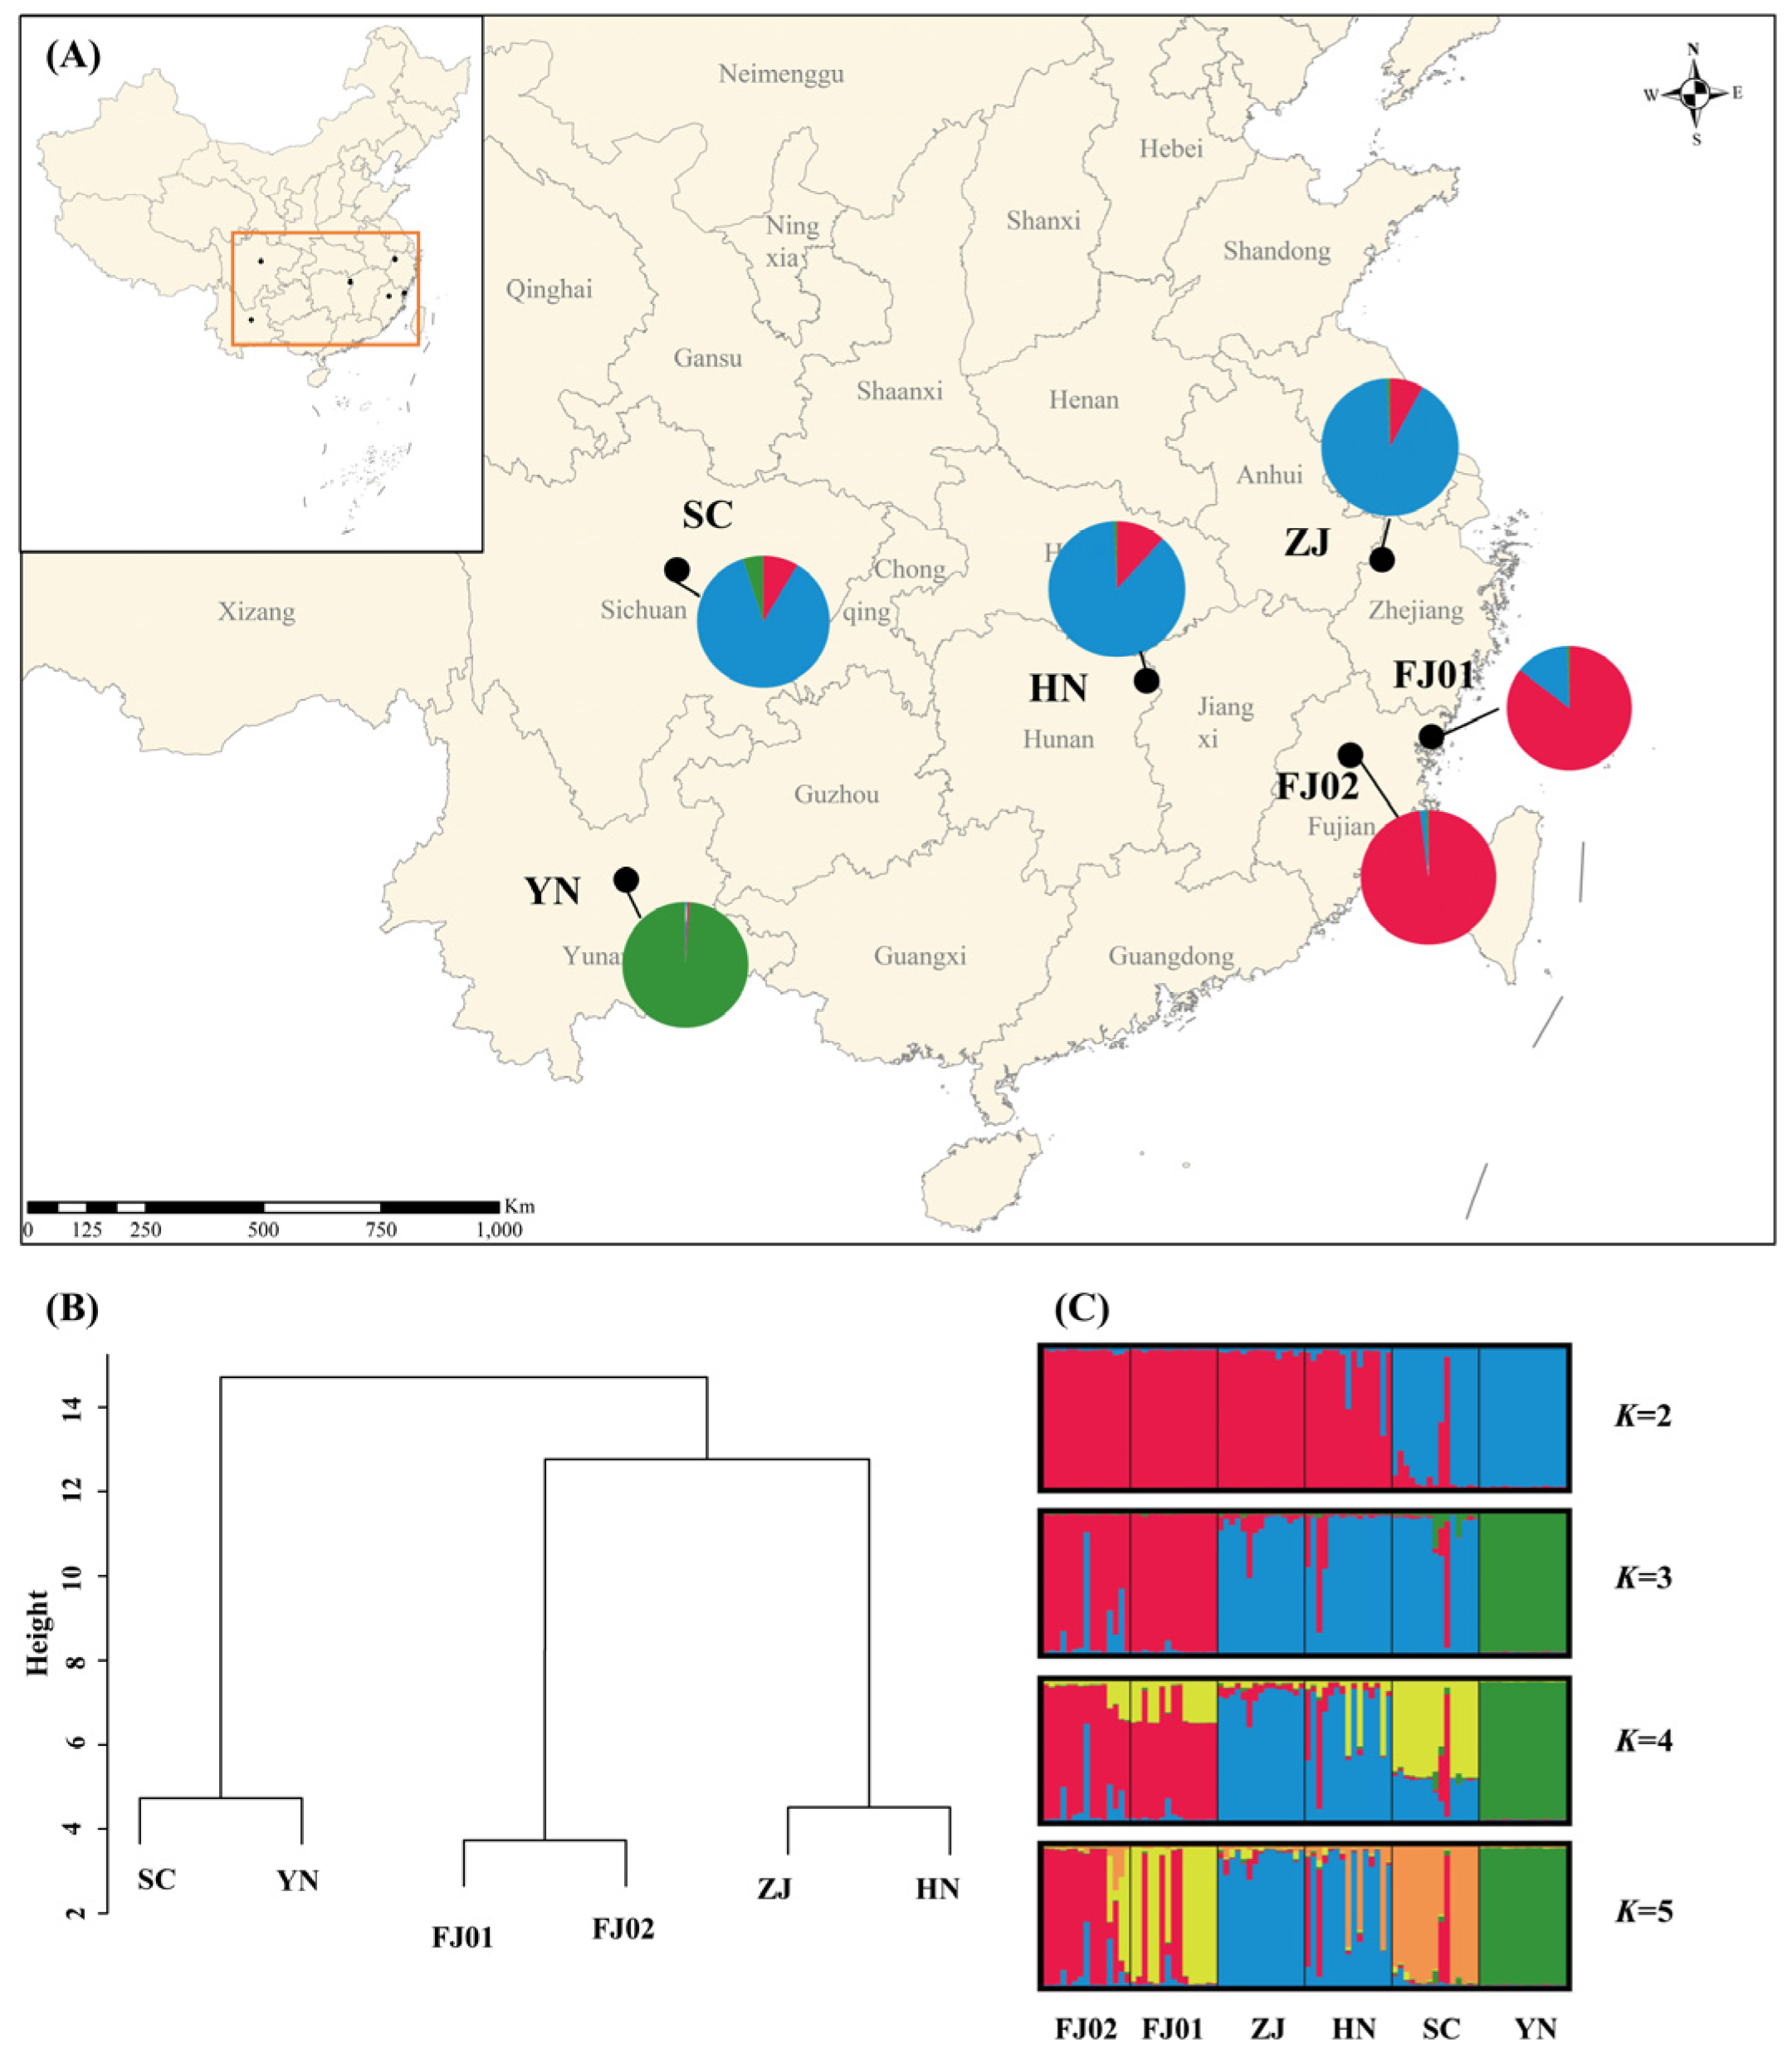
2.3. Genetic Diversity and Population Structure
2.4. Mantel Test and QST–FST Comparisons
3. Results
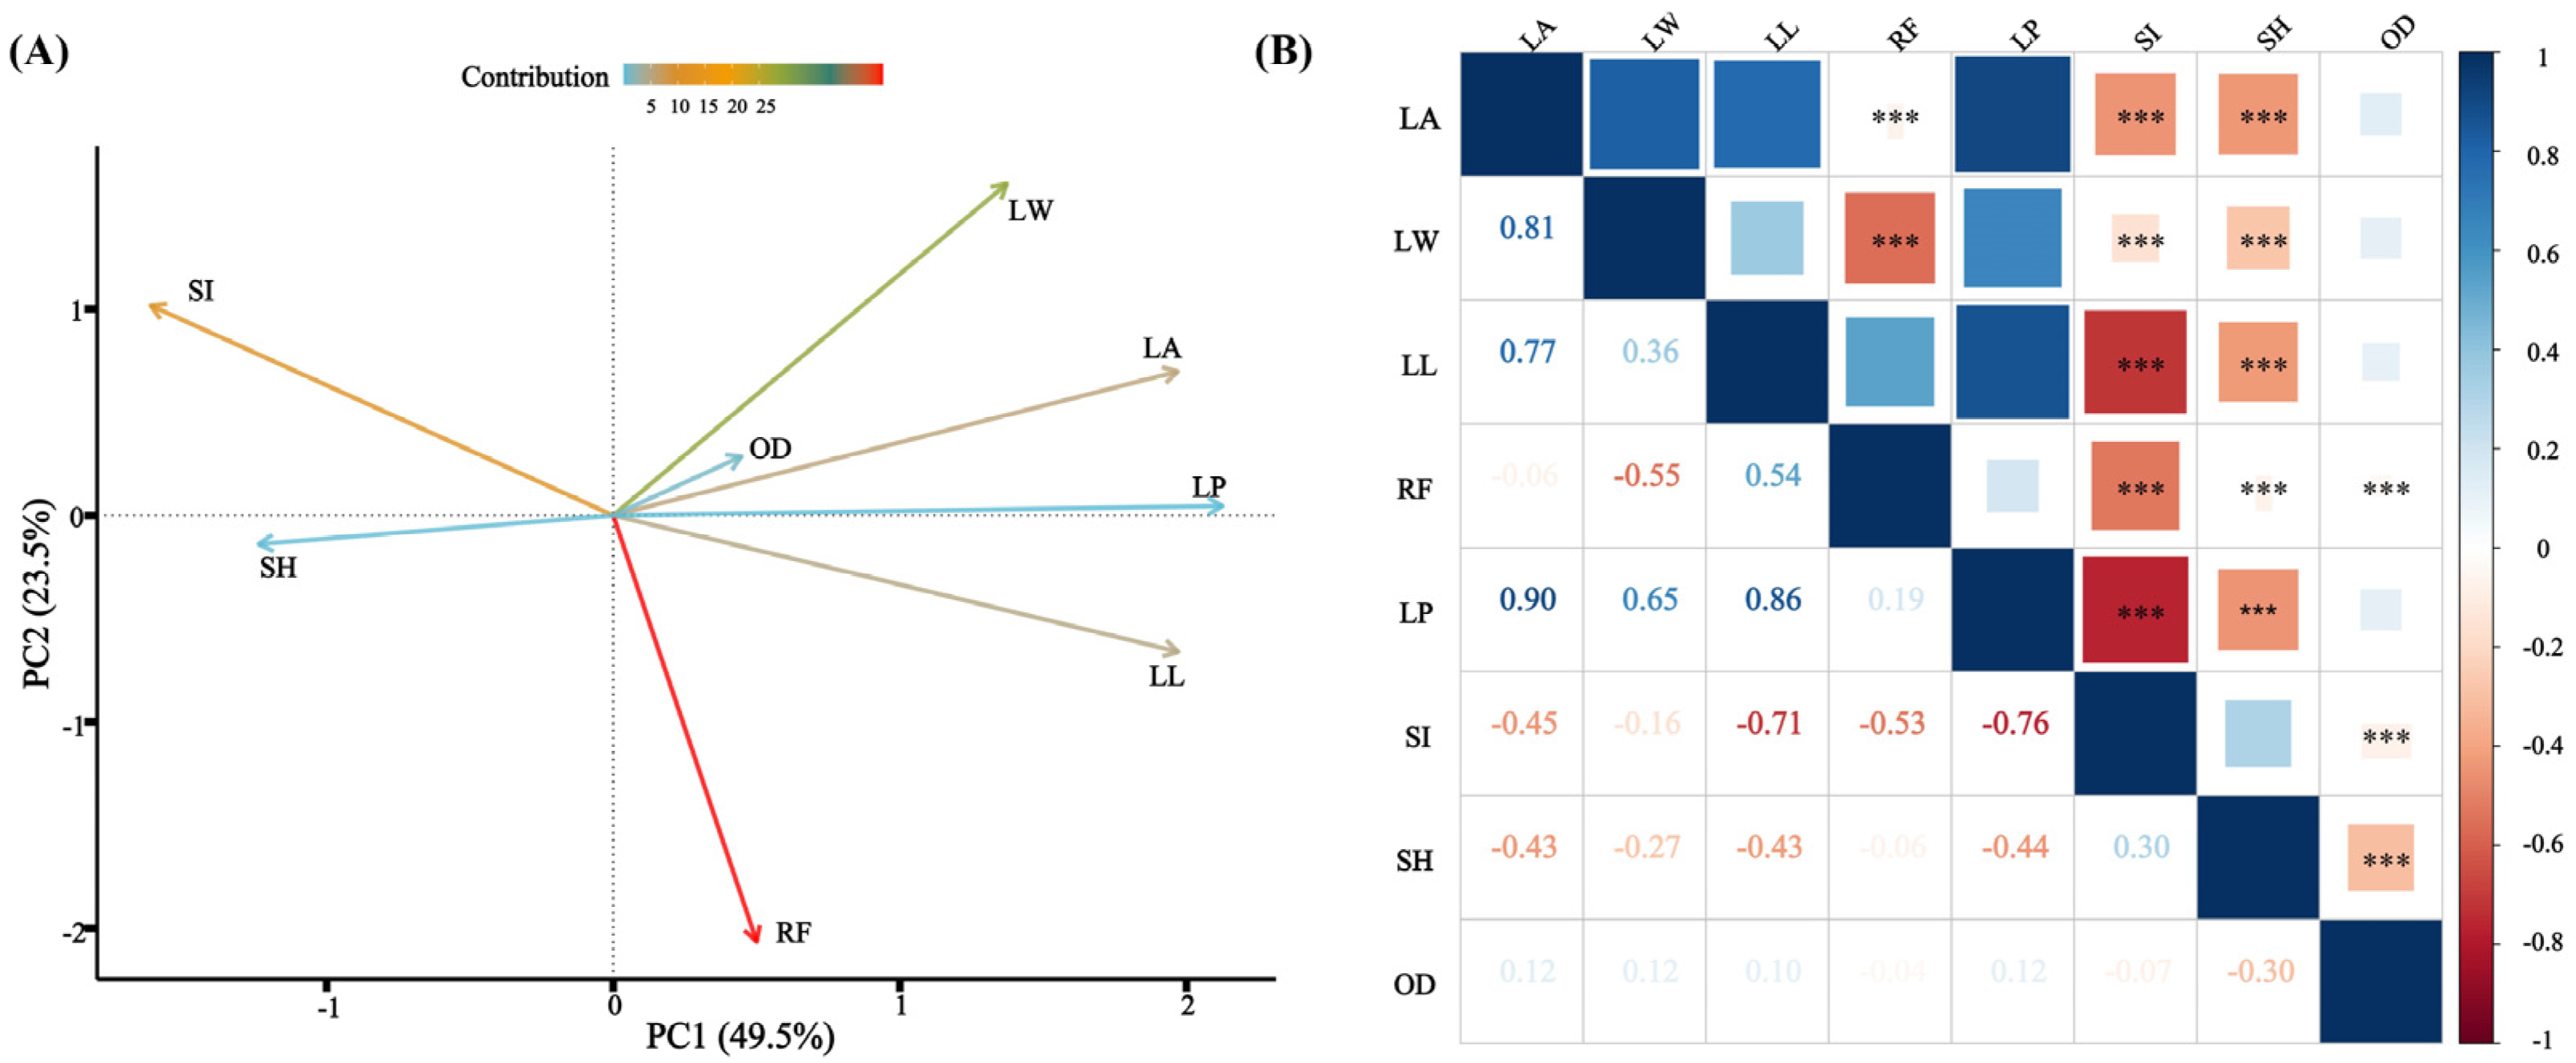
3.1. Phenotypic Variation
3.2. Correlations of Phenotypic Traits with Environmental Factors
3.3. Genetic Diversity and Population Structure
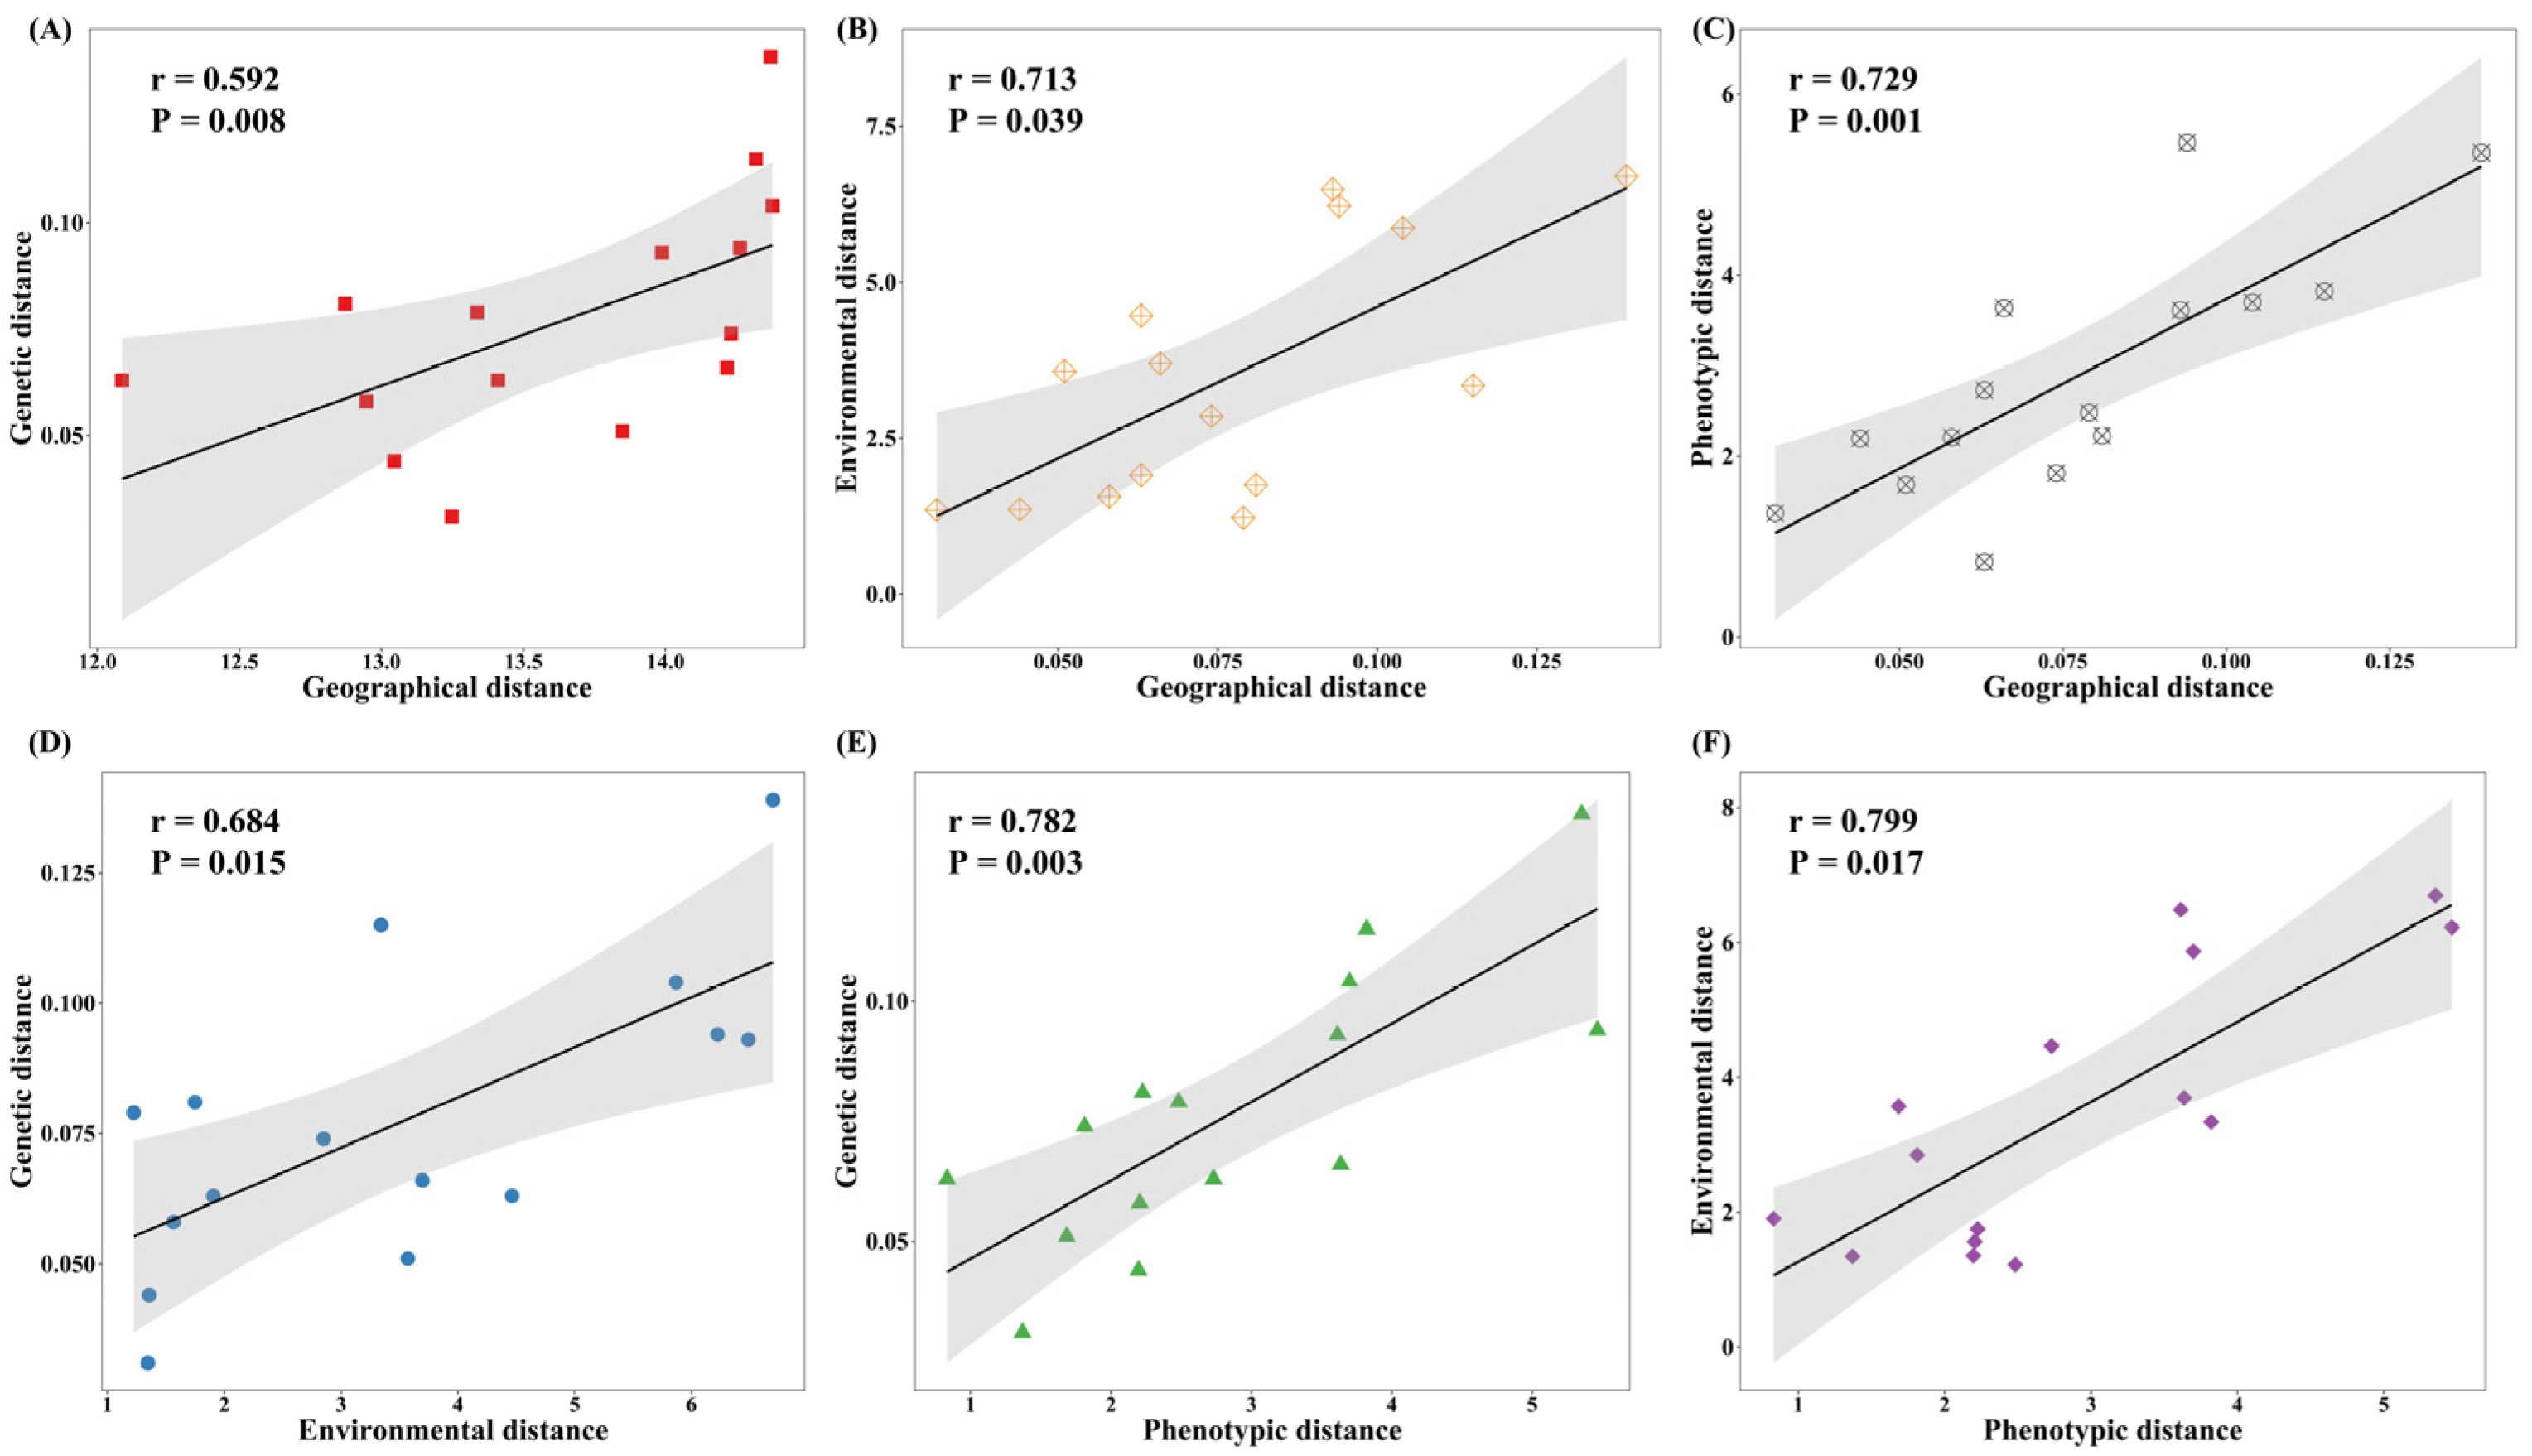
3.4. Mantel Test and QST–FST Comparisons
4. Discussion
4.1. Geographical Variation
4.2. Effects of Environment on Geographical Variation
4.3. Conservation and Breeding Strategy
5. Conclusions
Supplementary Materials
Author Contributions
Funding
Data Availability Statement
Conflicts of Interest
References
- Walther, G.R.; Post, E.; Convey, P.; Menzel, A.; Parmesan, C.; Beebee, T.J.; Fromentin, J.M.; Hoegh-Guldberg, O.; Bairlein, F. Ecological responses to recent climate change. Nature 2002, 416, 389–395. [Google Scholar] [CrossRef] [PubMed]
- Sang, Y.; Long, Z.; Dan, X.; Feng, J.; Shi, T.; Jia, C.; Zhang, X.; Lai, Q.; Yang, G.; Zhang, H.; et al. Genomic insights into local adaptation and future climate-induced vulnerability of a keystone forest tree in East Asia. Nat. Commun. 2022, 13, 6541. [Google Scholar] [CrossRef] [PubMed]
- Aitken, S.N.; Yeaman, S.; Holliday, J.A.; Wang, T.; Curtis-McLane, S. Adaptation, migration or extirpation: Climate change outcomes for tree populations. Evol. Appl. 2008, 1, 95–111. [Google Scholar] [CrossRef]
- Sork, V.L. Genomic Studies of Local Adaptation in Natural Plant Populations. J. Hered. 2017, 109, 3–15. [Google Scholar] [CrossRef]
- Gao, J.; Liu, Z.L.; Zhao, W.; Tomlinson, K.W.; Xia, S.W.; Zeng, Q.Y.; Wang, X.R.; Chen, J. Combined genotype and phenotype analyses reveal patterns of genomic adaptation to local environments in the subtropical oak Quercus acutissima. J. Syst. Evol. 2021, 59, 541–556. [Google Scholar] [CrossRef]
- Hayashi, Y. Taxonomical and Phytogeographical Study of Japanese Conifers; Norin-Shuppan: Tokyo, Japan, 1960. [Google Scholar]
- Wang, J.; Liu, J.; Huang, Y.; Yang, J. The origin and natural distribution of Cryptomeria. J. Sichuan For. Sci. Technol. 2007, 28, 92–94. [Google Scholar]
- Mo, D.; Wu, Q.; Lin, N.; Zhuo, Y. Carbon and nitrogen storage and their allocation pattern in Cryptomeria fortunei plantations in southeastern Guangxi of South China. Chin. J. Ecol. 2012, 4, 794–799. [Google Scholar]
- Zhao, H.; Shuai, W.; Li, J.; Wu, F.; Yang, W.; Tan, B. Distribution Characteristics of Several Typical Plantation Intercept Rainfall in West China Rain Screen Area. J. Soil Water Conserv. 2014, 28, 94–100. [Google Scholar]
- Tsumura, Y. Cryptomeria. In Wild Crop Relatives: Genomic and Breeding Resources: Forest Trees; Kole, C., Ed.; Springer: Berlin/Heidelberg, Germany, 2011; pp. 49–63. [Google Scholar]
- Murai, S. Major Forestry Tree Species in the Tohoku Region and Their Varietal Problems; Kokudo Saiken Zourin Gijutsu Kouenshu: Aomori, Japan, 1947; pp. 131–151. [Google Scholar]
- Yasue, M.; Ogiyama, K.; Suto, S.; Tsukahara, H.; Miyahara, F.; Ohba, K. Geographical differentiation of natural Cryptomeria stands analyzed by diterpene hydrocarbon constituents of individual trees. J. Jpn For. Soc. 1987, 69, 152–156. [Google Scholar]
- Kimura, M.K.; Kabeya, D.; Saito, T.; Moriguchi, Y.; Uchiyama, K.; Migita, C.; Chiba, Y.; Tsumura, Y. Effects of genetic and environmental factors on clonal reproduction in old-growth natural populations of Cryptomeria japonica. For. Ecol. Manag. 2013, 304, 10–19. [Google Scholar] [CrossRef]
- Tsumura, Y.; Kado, T.; Takahashi, T.; Tani, N.; Ujino-Ihara, T.; Iwata, H. Genome scan to detect genetic structure and adaptive genes of natural populations of Cryptomeria japonica. Genetics 2007, 176, 2393–2403. [Google Scholar] [CrossRef]
- Tsumura, Y.; Uchiyama, K.; Moriguchi, Y.; Kimura, M.K.; Ueno, S.; Ujino-Ihara, T. Genetic Differentiation and Evolutionary Adaptation in Cryptomeria japonica. G3 Genes Genomes Genet. 2014, 4, 2389–2402. [Google Scholar] [CrossRef]
- Moriguchi, N.; Uchiyama, K.; Miyagi, R.; Moritsuka, E.; Takahashi, A.; Tamura, K.; Tsumura, Y.; Teshima, K.M.; Tachida, H.; Kusumi, J. Inferring the demographic history of Japanese cedar, Cryptomeria japonica, using amplicon sequencing. Heredity 2019, 123, 371–383. [Google Scholar] [CrossRef]
- Cai, M.; Wen, Y.; Uchiyama, K.; Onuma, Y.; Tsumura, Y. Population Genetic Diversity and Structure of Ancient Tree Populations of Cryptomeria japonica var. sinensis Based on RAD-seq Data. Forests 2020, 11, 1192. [Google Scholar] [CrossRef]
- Li, X.Y.; Wang, M.Q.; Yuan, M.L.; Ueno, S.; Wu, X.T.; Cai, M.Y.; Tsumura, Y.; Wen, Y.F. Genetic differentiation and population evolution history of Cryptomeria, a relict plant in East Asia. For. Sci. 2022, 58, 66–78. [Google Scholar]
- Parmesan, C. Ecological and evolutionary responses to recent climate change. Annu. Rev. Ecol. Evol. Syst. 2006, 37, 637–669. [Google Scholar] [CrossRef]
- Guo, W.; He, H.; Li, X.; Zeng, W. Greater Greening Trend in the Loess Plateau of China Inferred from Long-Term Remote Sensing Data: Patterns, Causes and Implications. Forests 2022, 13, 1630. [Google Scholar] [CrossRef]
- Sun, Y.; Sun, Y.; Yao, S.; Akram, M.A.; Hu, W.; Dong, L.; Li, H.; Wei, M.; Gong, H.; Xie, S.; et al. Impact of climate change on plant species richness across drylands in China: From past to present and into the future. Ecol. Indic. 2021, 132, 108288. [Google Scholar] [CrossRef]
- Leinonen, T.; McCairns, R.; O’Hara, R.; Merilä, J. QST-FST comparisons: Evolutionary and ecological insights from genomic heterogeneity. Nat. Rev. Genet. 2013, 14, 179–190. [Google Scholar] [CrossRef]
- Zhang, J. The Analysis on Genetic Diversity of Superior Cryptomehia Fortunei Resources and Screening of Hybrid Parent. Master’s Thesis, Zhejiang Agriculture and Forestry University, Hangzhou, China, 2014. [Google Scholar]
- Tani, N.; Takahashi, T.; Iwata, H.; Mukai, Y.; Ujino-Ihara, T.; Matsumoto, A.; Yoshimura, K.; Yoshimaru, H.; Murai, M.; Nagasaka, K.; et al. A consensus linkage map for sugi (Cryptomeria japonica) from two pedigrees, based on microsatellites and expressed sequence tags. Genetics 2003, 165, 1551–1568. [Google Scholar] [CrossRef]
- Moriguchi, Y.; Iwata, H.; Ujino-Ihara, T.; Yoshimura, K.; Taira, H.; Tsumura, Y. Development and characterization of microsatellite markers for Cryptomeria japonica D. Don. Theor. Appl. Genet. 2003, 106, 751–758. [Google Scholar] [CrossRef] [PubMed]
- Moriguchi, Y.; Ueno, S.; Higuchi, Y.; Miyajima, D.; Itoo, S.; Futamura, N.; Shinohara, K.; Tsumura, Y. Establishment of a microsatellite panel covering the sugi (Cryptomeria japonica) genome, and its application for localization of a male-sterile gene (ms-2). Mol. Breed. 2014, 33, 315–325. [Google Scholar] [CrossRef]
- Van, O.C.; Hutchinson, W.F.; Wills, D.P.M.; Shipley, P. Micro-checker: Software for identifying and correcting genotyping errors in microsatellite data. Mol. Ecol. Resour. 2004, 4, 535–538. [Google Scholar] [CrossRef]
- Hulce, D.; Li, X.; Snyder-Leiby, T.; Liu, C.J. GeneMarker® Genotyping Software: Tools to Increase the Statistical Power of DNA Fragment Analysis. J. Biomol. Tech. 2011, 22, S35–S36. [Google Scholar]
- Peakall, R.; Smouse, P.E. GenAlEx 6.5: Genetic analysis in Excel. Population genetic software for teaching and research—an update. Bioinformatics 2012, 28, 2537–2539. [Google Scholar] [CrossRef]
- Rousset, F. GENEPOP’007: A complete re-implementation of the genepop software for Windows and Linux. Mol. Ecol. Res. 2008, 8, 103–106. [Google Scholar] [CrossRef]
- Weir, B.S.; Cockerham, C.C. Estimating F-statistics for the analysis of population structure. Evolution 1984, 38, 1358–1370. [Google Scholar] [CrossRef]
- Excoffier, L.; Laval, G.; Schneider, S. Arlequin (version 3.0): An integrated software package for population genetics data analysis. Evol. Bioinform. Online 2005, 1, 47–50. [Google Scholar] [CrossRef]
- Pritchard, J.K.; Stephens, M.; Donnelly, P. Inference of Population Structure Using Multilocus Genotype Data. Genetics 2000, 155, 945–959. [Google Scholar] [CrossRef]
- Earl, D.A. STRUCTURE HARVESTER: A website and program for visualizing STRUCTURE output and implementing the Evanno method. Conserv. Genet. Resour. 2012, 4, 359–361. [Google Scholar] [CrossRef]
- Evanno, G.; Regnaut, S.; Goudet, J. Detecting the number of clusters of individuals using the software STRUCTURE: A simulation study. Mol. Ecol. 2005, 14, 2611–2620. [Google Scholar] [CrossRef] [PubMed]
- Jakobsson, M.; Rosenberg, N.A. CLUMPP: A cluster matching and permutation program for dealing with label switching and multimodality in analysis of population structure. Bioinformatics 2007, 23, 1801–1806. [Google Scholar] [CrossRef] [PubMed]
- Rosenberg, N.A. DISTRUCT: A program for the graphical display of population structure. Mol. Ecol. Notes 2004, 4, 137–138. [Google Scholar] [CrossRef]
- Endler, J.A. Natural Selection in the Wild; Princeton University Press: Princeton, NJ, USA, 1986; p. 358. [Google Scholar]
- Leimu, R.; Fischer, M. A meta-analysis of local adaptation in plants. PLoS ONE 2008, 3, e4010. [Google Scholar] [CrossRef]
- Savolainen, O.; Pyhäjärvi, T.; Knürr, T. Gene flow and local adaptation in trees. Annu. Rev. Ecol. Evol. Syst. 2007, 38, 595–619. [Google Scholar] [CrossRef]
- Marin, S.; Gibert, A.; Archambeau, J.; Bonhomme, V.; Lascoste, M.; Pujol, B. Potential adaptive divergence between subspecies and populations of snapdragon plants inferred from QST-FST comparisons. Mol. Ecol. 2020, 29, 3010–3021. [Google Scholar] [CrossRef] [PubMed]
- Cao, D.M.; Zhang, Y.H.; Cheng, X.Q.; Xiang, X.; Zhang, L.; Hu, J. Genetic Variation of Leaf Phenotypic Traits in Different Populations of Populus cathayana. For. Sci. 2021, 57, 56–67. [Google Scholar]
- Yamazaki, T. Cryptomeriaceae in Flora of Japan. In Pteridophyta and Gymnospermae; Iwatsuki, K., Yamazaki, T., Boufford, D.E., Ohba, H., Eds.; Kodansha: Tokyo, Japan, 1995; Volume I, p. 264. [Google Scholar]
- Dai, M.J.; Li, X.Y.; Wang, M.Q.; Wen, Y.F. Potential suitable area of Cryptomeria japonica var. sinensis and the influence of climate change on its distribution. J. Northwest For. Univ. 2022, 37, 26–33+128. [Google Scholar]

| Pop | Sample Size | Geographic Region | Latitude (°N) | Longitude (°E) | Elevation (m) | Na | Ne | I | Ho | He | FIS |
|---|---|---|---|---|---|---|---|---|---|---|---|
| FJ01 | 15 | Fujian | 26.87 | 119.94 | 204 | 4.214 | 2.722 | 0.997 | 0.495 | 0.511 | 0.00 * |
| FJ02 | 15 | Fujian | 26.74 | 118.16 | 866 | 4.214 | 2.601 | 1.010 | 0.509 | 0.534 | 0.02 ** |
| ZJ | 15 | Zhejiang | 30.34 | 119.44 | 601 | 3.786 | 2.369 | 0.903 | 0.560 | 0.505 | −0.09 |
| HN | 15 | Hunan | 28.58 | 113.95 | 731 | 4.286 | 2.869 | 1.040 | 0.495 | 0.555 | 0.06 *** |
| SC | 15 | Sichuan | 31.03 | 103.61 | 892 | 4.214 | 2.742 | 0.964 | 0.475 | 0.495 | 0.01 * |
| YN | 15 | Yunnan | 25.10 | 102.63 | 2094 | 3.214 | 2.609 | 0.891 | 0.614 | 0.493 | −0.25 |
| Total | 90 | - | - | - | - | 3.988 | 2.652 | 0.968 | 0.525 | 0.516 | −0.035 |
| Phenotypic Traits | Descriptive Parameters | Geographical Populations | Total | QST | |||||
|---|---|---|---|---|---|---|---|---|---|
| FJ01 | FJ02 | ZJ | HN | SC | YN | ||||
| Sample Size | 15 | 15 | 15 | 15 | 15 | 15 | 90 | ||
| LA (mm2) | Mean | 27.73 | 29.00 | 40.97 | 43.07 | 57.40 | 61.33 | 43.25 | 0.425 |
| CV | 28.72 | 26.15 | 18.02 | 13.51 | 31.63 | 31.80 | 40.88 | ||
| LW (mm) | Mean | 3.65 | 3.43 | 4.75 | 3.97 | 4.88 | 5.30 | 4.33 | 0.244 |
| CV | 18.79 | 20.20 | 18.98 | 16.14 | 25.93 | 25.01 | 27.05 | ||
| LL (mm) | Mean | 9.84 | 11.24 | 11.96 | 14.47 | 14.87 | 15.15 | 12.92 | 0.316 |
| CV | 16.92 | 33.78 | 13.14 | 11.56 | 10.62 | 15.48 | 23.25 | ||
| LP (mm) | Mean | 22.08 | 25.20 | 29.31 | 32.04 | 35.20 | 37.70 | 30.25 | 0.339 |
| CV | 22.04 | 28.80 | 18.81 | 8.92 | 15.72 | 22.05 | 26.51 | ||
| RF | Mean | 2.75 | 3.52 | 2.58 | 3.78 | 3.21 | 2.96 | 3.13 | - |
| CV | 16.97 | 47.30 | 18.02 | 26.55 | 22.73 | 20.55 | 31.99 | ||
| SI | Mean | 0.75 | 0.65 | 0.63 | 0.54 | 0.58 | 0.55 | 0.62 | - |
| CV | 19.67 | 34.33 | 21.31 | 13.06 | 14.16 | 17.65 | 24.64 | ||
| SH | Mean | 2.00 | 2.00 | 1.77 | 1.50 | 1.43 | 1.07 | 1.63 | - |
| CV | 0.00 | 0.00 | 24.35 | 33.90 | 35.16 | 23.79 | 29.78 | ||
| OD | Mean | 1.47 | 1.33 | 1.43 | 1.40 | 1.40 | 2.00 | 1.51 | - |
| CV | 34.60 | 35.96 | 35.16 | 35.59 | 35.59 | 0.00 | 33.30 | ||
| Total Mean | 19.71 | 28.32 | 20.98 | 19.90 | 23.94 | 19.54 | 29.67 | 0.331 | |
| Phenotypic Traits | Variance Component | d.f. | SS. | MS. | F |
|---|---|---|---|---|---|
| LA (mm2) | Among populations | 5 | 29,289.183 | 5857.837 | 38.234 *** |
| Within populations | 174 | 26,658.567 | 153.210 | ||
| LW (mm) | Among populations | 5 | 84.971 | 16.994 | 18.445 *** |
| Within populations | 174 | 160.314 | 0.921 | ||
| LL (mm) | Among populations | 5 | 732.612 | 146.522 | 28.869 *** |
| Within populations | 174 | 883.136 | 5.075 | ||
| RF | Among populations | 5 | 31.503 | 6.301 | 7.395 *** |
| Within populations | 174 | 148.255 | 0.852 | ||
| LP (mm) | Among populations | 5 | 5289.210 | 1057.842 | 29.574 *** |
| Within populations | 174 | 6223.798 | 35.769 | ||
| SI | Among populations | 5 | 0.927 | 0.185 | 10.028 *** |
| Within populations | 174 | 3.215 | 0.018 | ||
| SH | Among populations | 5 | 19.961 | 3.992 | 31.432 *** |
| Within populations | 174 | 22.100 | 0.127 | ||
| OD | Among populations | 5 | 9.094 | 1.819 | 8.816 *** |
| Within populations | 174 | 35.900 | 0.206 |
| Phenotypic Traits | Bioclimatic Variables | |||||||
|---|---|---|---|---|---|---|---|---|
| Bio2 | Bio3 | Bio5 | Bio12 | Bio14 | Bio17 | Bio19 | Elevation | |
| LA | 0.575 | 0.564 | −0.747 | −0.863 * | −0.904 * | −0.820 * | −0.902 * | 0.752 |
| LW | 0.549 | 0.526 | −0.821 * | −0.875 * | −0.852 * | −0.782 | −0.855 * | 0.666 |
| LL | 0.485 | 0.425 | −0.572 | −0.680 | −0.705 | −0.583 | −0.694 | 0.692 |
| RF | −0.062 | −0.116 | 0.263 | 0.306 | 0.206 | 0.280 | 0.234 | 0.070 |
| LP | 0.590 | 0.538 | −0.735 | −0.798 | −0.813 * | −0.700 | −0.801 | 0.777 |
| SI | −0.461 | −0.338 | 0.543 | 0.513 | 0.491 | 0.335 | 0.465 | −0.658 |
| SH | −0.706 | −0.663 | 0.715 | 0.898 * | 0.822 * | 0.734 | 0.816 * | −0.825 * |
| OD | 0.930 ** | 0.927 ** | −0.757 | −0.905 * | −0.698 | −0.696 | −0.686 | 0.843 * |
| Source | df | SS | Variance Components | Percentage of Variation (%) | p |
|---|---|---|---|---|---|
| Among groups | 2 | 56.078 | 0.259 | 6.12% | <0.001 |
| Among populations within groups | 3 | 37.483 | 0.294 | 6.94% | <0.001 |
| Within populations | 174 | 640.667 | 3.682 | 86.95% | <0.001 |
| Total | 179 | 734.228 | 4.235 | ||
| FST | 0.130 |
Disclaimer/Publisher’s Note: The statements, opinions and data contained in all publications are solely those of the individual author(s) and contributor(s) and not of MDPI and/or the editor(s). MDPI and/or the editor(s) disclaim responsibility for any injury to people or property resulting from any ideas, methods, instructions or products referred to in the content. |
© 2023 by the authors. Licensee MDPI, Basel, Switzerland. This article is an open access article distributed under the terms and conditions of the Creative Commons Attribution (CC BY) license (https://creativecommons.org/licenses/by/4.0/).
Share and Cite
Li, X.; Dai, M.; Wang, M.; Wu, X.; Cai, M.; Tao, Y.; Huang, J.; Wen, Y. Geographical Variation Reveals Strong Genetic Differentiation in Cryptomeria japonica var. sinensis. Forests 2023, 14, 1826. https://doi.org/10.3390/f14091826
Li X, Dai M, Wang M, Wu X, Cai M, Tao Y, Huang J, Wen Y. Geographical Variation Reveals Strong Genetic Differentiation in Cryptomeria japonica var. sinensis. Forests. 2023; 14(9):1826. https://doi.org/10.3390/f14091826
Chicago/Turabian StyleLi, Xinyu, Minjun Dai, Minqiu Wang, Xingtong Wu, Mengying Cai, Yiling Tao, Jiadi Huang, and Yafeng Wen. 2023. "Geographical Variation Reveals Strong Genetic Differentiation in Cryptomeria japonica var. sinensis" Forests 14, no. 9: 1826. https://doi.org/10.3390/f14091826
APA StyleLi, X., Dai, M., Wang, M., Wu, X., Cai, M., Tao, Y., Huang, J., & Wen, Y. (2023). Geographical Variation Reveals Strong Genetic Differentiation in Cryptomeria japonica var. sinensis. Forests, 14(9), 1826. https://doi.org/10.3390/f14091826