
Reevaluating Near-Infrared Reflectance as a Tool for the Study of Plant Water Status in Holm Oak (Quercus ilex subsp. rotundifolia)

 ,
,  ,
,  ,
,  ,
,
Abstract
:1. Introduction
2. Materials and Methods
2.1. Plant Material and Experimental Conditions
2.2. Leaf Thickness
2.3. Leaf Spectral Reflectance
2.4. Statistical Analysis
3. Results
4. Discussion
5. Conclusions
Supplementary Materials
Author Contributions
Funding
Data Availability Statement
Conflicts of Interest
References
- Peguero-Pina, J.J.; Vilagrosa, A.; Alonso-Forn, D.; Ferrio, J.P.; Sancho-Knapik, D.; Gil-Pelegrín, E. Living in Drylands: Functional Adaptations of Trees and Shrubs to Cope with High Temperatures and Water Scarcity. Forests 2020, 11, 1028. [Google Scholar] [CrossRef]
- Jones, H.G. Monitoring plant and soil water status: Established and novel methods revisited and their relevance to studies of drought tolerance. J. Exp. Bot. 2007, 58, 119–130. [Google Scholar] [CrossRef]
- Passioura, J.B. Water in the Soil-Plant-Atmosphere Continuum. In Physiological Plant Ecology II. Encyclopedia of Plant Physiology; Lange, O.L., Nobel, P.S., Osmond, C.B., Ziegler, H., Eds.; Springer: Berlin/Heidelberg, Germany, 1982; Volume 12/B, pp. 5–33. [Google Scholar] [CrossRef]
- Sperry, J.S.; Stiller, V.; Hacke, U.G. Xylem Hydraulics and the Soil–Plant–Atmosphere Continuum: Opportunities and Unresolved Issues. Agron. J. 2003, 95, 1362–1370. [Google Scholar] [CrossRef]
- Peguero-Pina, J.J.; Mendoza-Herrer, Ó.; Gil-Pelegrín, E.; Sancho-Knapik, D. Cavitation Limits the Recovery of Gas Exchange after Severe Drought Stress in Holm Oak (Quercus ilex L.). Forests 2018, 9, 443. [Google Scholar] [CrossRef]
- Canny, M.J.; Huang, C.X. Leaf water content and palisade cell size. New Phytol. 2006, 170, 75–85. [Google Scholar] [CrossRef]
- Teulat, B.; Monneveux, P.; Wery, J.; Borries, C.; Souyris, I.; Charrier, A. Relationships between Relative Water Content and Growth Parameters Under Water Stress in Barley: A QTL Study. New Phytol. 1997, 137, 99–107. [Google Scholar] [CrossRef]
- Sancho-Knapik, D.; Gómez Álvarez-Arenas, T.; Peguero-Pina, J.J.; Fernández, V.; Gil-Pelegrín, E. Relationship between ultrasonic properties and structural changes in the mesophyll during leaf dehydration. J. Exp. Bot. 2011, 62, 3637–3645. [Google Scholar] [CrossRef] [PubMed]
- Scoffoni, C.; Vuong, C.; Diep, S.; Cochard, H.; Sack, L. Leaf Shrinkage with Dehydration: Coordination with Hydraulic Vulnerability and Drought Tolerance. Plant Physiol. 2014, 164, 1772–1788. [Google Scholar] [CrossRef] [PubMed]
- Sapes, G.; Sala, A. Relative water content consistently predicts drought mortality risk in seedling populations with different morphology, physiology and times to death. Plant Cell Environ. 2021, 44, 3322–3335. [Google Scholar] [CrossRef] [PubMed]
- Sancho-Knapik, D.; Gómez Álvarez-Arenas, T.; Peguero-Pina, J.J.; Gil-Pelegrín, E. Air-coupled broadband ultrasonic spectroscopy as a new non-invasive and non-contact method for the determination of leaf water status. J. Exp. Bot. 2010, 61, 1385–1391. [Google Scholar] [CrossRef]
- Alonso-Forn, D.; Peguero-Pina, J.J.; Ferrio, J.P.; Mencuccini, M.; Mendoza-Herrer, Ó.; Sancho-Knapik, D.; Gil-Pelegrín, E. Contrasting functional strategies following severe drought in two Mediterranean oaks with different leaf habit: Quercus faginea and Quercus ilex subsp. rotundifolia. Tree Physiol. 2021, 41, 371–387. [Google Scholar] [CrossRef]
- Sancho-Knapik, D.; Mendoza-Herrer, Ó.; Alonso-Forn, D.; Saz, M.A.; Martín-Sánchez, R.; dos Santos Silva, J.V.; Ogee, J.; Peguero-Pina, J.J.; Gil-Pelegrín, E.; Ferrio, J.P. Vapor pressure deficit constrains transpiration and photosynthesis in holm oak: A comparison of three methods during summer drought. Agric. For. Meteorol. 2022, 327, 109218. [Google Scholar] [CrossRef]
- Peguero-Pina, J.J.; Morales, F.; Flexas, J.; Gil-Pelegrín, E.; Moya, I. Photochemistry, remotely sensed physiological reflectance index and de-epoxidation state of the xanthophyll cycle in Quercus coccifera under intense drought. Oecologia 2008, 156, 1–11. [Google Scholar] [CrossRef] [PubMed]
- Sancho-Knapik, D.; Mendoza-Herrer, Ó.; Gil-Pelegrín, E.; Peguero-Pina, J.J. Chl Fluorescence Parameters and Leaf Reflectance Indices Allow Monitoring Changes in the Physiological Status of Quercus ilex L. under Progressive Water Deficit. Forests 2018, 9, 400. [Google Scholar] [CrossRef]
- Sancho-Knapik, D.; Medrano, H.; Peguero-Pina, J.J.; Mencuccini, M.; Fariñas, M.D.; Álvarez-Arenas, T.G.; Gil-Pelegrín, E. The Application of Leaf Ultrasonic Resonance to Vitis vinifera L. Suggests the Existence of a Diurnal Osmotic Adjustment Subjected to Photosynthesis. Front. Plant Sci. 2016, 7, 1601. [Google Scholar] [CrossRef] [PubMed]
- Álvarez-Arenas, T.E.G.; Sancho-Knapik, D.; Peguero-Pina, J.J.; Gil-Pelegrín, E. Surface Density of the Spongy and Palisade Parenchyma Layers of Leaves Extracted from Wideband Ultrasonic Resonance Spectra. Front. Plant Sci. 2020, 11, 695. [Google Scholar] [CrossRef] [PubMed]
- Fariñas, M.D.; Sancho-Knapik, D.; Peguero-Pina, J.J.; Gil-Pelegrín, E.; Gómez Álvarez-Arenas, T.E. Contact-less, non-resonant and high-frequency ultrasonic technique: Towards a universal tool for plant leaf study. Comput. Electron. Agric. 2022, 199, 107160. [Google Scholar] [CrossRef]
- Sancho-Knapik, D.; Gismero, J.; Asensio, A.; Peguero-Pina, J.J.; Fernández, V.; Álvarez-Arenas, T.E.G.; Gil-Pelegrín, E. Microwave L-band (1730 MHz) accurately estimates the relative water content in poplar leaves. A comparison with a near infrared water index (R1300/R1450). Agric. For. Meteorol. 2011, 151, 827–832. [Google Scholar] [CrossRef]
- Carter, G.A. Primary and secondary effects of water content on the spectral reflectance of leaves. Am. J. Bot. 1991, 78, 916–924. [Google Scholar] [CrossRef]
- Carter, G.A.; McCain, D.G. Relationship of leaf spectral reflectance to chloroplast water content determined using NMR microscopy. Remote Sens. Environ. 1993, 46, 305–310. [Google Scholar] [CrossRef]
- Peñuelas, J.; Filella, I.; Biel, C.; Serrano, L.; Save, R. The reflectance at the 950–970 nm region as indicator of plant water status. Int. J. Remote Sens. 1993, 14, 1887–1905. [Google Scholar] [CrossRef]
- Sims, D.A.; Gamon, J.A. Estimation of vegetation water content and photosynthetic tissue area from spectral reflectance: A comparison of indices based on liquid water and chlorophyll absorption features. Remote Sens. Environ. 2003, 84, 526–537. [Google Scholar] [CrossRef]
- Seelig, H.D.; Adams, W.W.; Hoehn, A.; Stodieck, L.S.; Klaus, D.M.; Emery, W.J. Extraneous variables and their influence on reflectance-based measurements of leaf water content. Irrigat. Sci. 2008, 26, 407–414. [Google Scholar] [CrossRef]
- Seelig, H.D.; Hoehn, A.; Stodieck, L.S.; Klaus, D.M.; Adams, W.W.; Emery, W.J. The assessment of leaf water content using leaf reflectance ratios in the visible, near-, and short-wave-infrared. Int. J. Remote Sens. 2008, 29, 3701–3713. [Google Scholar] [CrossRef]
- Wu, C.; Niu, Z.; Tang, Q.; Huang, W. Predicting vegetation water content in wheat using normalized difference water indices derived from ground measurements. J. Plant Res. 2009, 122, 317–326. [Google Scholar] [CrossRef] [PubMed]
- Seelig, H.D.; Hoehn, A.; Stodieck, L.S.; Klaus, D.M.; Adams, W.W., III; Emery, W.J. Plant water parameters and the remote sensing R1300/R1450 leaf water index: Controlled condition dynamics during the development of water deficit stress. Irrigat. Sci. 2009, 27, 357–365. [Google Scholar] [CrossRef]
- Rock, B.N.; Vogelmann, J.E.; Williams, D.L.; Vogelmann, A.F.; Hoshizaki, T. Remote detection of forest damage. Bioscience 1986, 36, 439–445. [Google Scholar] [CrossRef]
- Watt, M.S.; Leonardo, E.M.C.; Estarija, H.J.C.; Massam, P.; de Silva, D.; O’Neill, R.; Lane, D.; McDougal, R.; Buddenbaum, H.; Zarco-Tejada, P.J. Long-term effects of water stress on hyperspectral remote sensing indicators in young radiata pine. For. Ecol. Manag. 2021, 502, 119707. [Google Scholar] [CrossRef]
- Hunt, E.R.; Rock, B.N.; Nobel, P.S. Measurement of leaf relative water content by infrared reflectance. Remote Sens. Environ. 1987, 22, 429–435. [Google Scholar] [CrossRef]
- Hunt, E.R.; Rock, B.N. Detection of changes in leaf water content using Near- and Middle-Infrared reflectances. Remote Sens. Environ. 1989, 30, 43–54. [Google Scholar] [CrossRef]
- Gil-Pelegrín, E.; Saz, M.A.; Cuadrat, J.M.; Peguero-Pina, J.J.; Sancho-Knapik, D. Oaks under Mediterranean type climates: Functional response to summer aridity. In Oaks Physiological Ecology. Exploring the Functional Diversity of Genus Quercus L.; Gil-Pelegrín, E., Peguero-Pina, J.J., Sancho-Knapik, D., Eds.; Tree Physiology, Volume 7; Springer: Berlin/Heidelberg, Germany, 2017; pp. 137–193. [Google Scholar] [CrossRef]
- Peguero-Pina, J.J.; Sisó, S.; Flexas, J.; Galmés, J.; García-Nogales, A.; Niinemets, Ü.; Sancho-Knapik, D.; Saz, M.Á.; Gil-Pelegrín, E. Cell-level anatomical characteristics explain high mesophyll conductance and photosynthetic capacity in sclerophyllous Mediterranean oaks. New Phytol. 2017, 214, 585–596. [Google Scholar] [CrossRef] [PubMed]
- Peguero-Pina, J.J.; Sancho-Knapik, D.; Barrón, E.; Camarero, J.J.; Vilagrosa, A.; Gil-Pelegrín, E. Morphological and physiological divergences within Quercus ilex support the existence of different ecotypes depending on climatic dryness. Ann. Bot. 2014, 114, 301–313. [Google Scholar] [CrossRef]
- Oliach, D.; Vidale, E.; Brenko, A.; Marois, O.; Andrighetto, N.; Stara, K.; Martínez de Aragón, J.; Colinas, C.; Bonet, J.A. Truffle Market Evolution: An Application of the Delphi Method. Forests 2021, 12, 1174. [Google Scholar] [CrossRef]
- Mauri, P.; Manzanera, J. Protocol of Somatic Embryogenesis: Holm Oak (Quercus ilex L.). In Protocol for Somatic Embryogenesis in Woody Plants; Jain, S.M., Gupta, P.K., Eds.; Forestry Sciences, Volume 77; Springer: Berlin/Heidelberg, Germany, 2005; pp. 469–482. [Google Scholar] [CrossRef]
- Zimmermann, D.; Reuss, R.; Westhoff, M.; Gebner, P.; Bauer, W.; Bamberg, E.; Bentrup, F.W.; Zimmermann, U. A novel, non-invasive, online-monitoring, versatile and easy plant-based probe for measuring leaf water status. J. Exp. Bot. 2008, 59, 3157–3167. [Google Scholar] [CrossRef] [PubMed]
- R Core Team. R: A Language and Environment for Statistical Computing; R Foundation for Statistical Computing: Vienna, Austria, 2022; Available online: https://www.R-project.org/ (accessed on 5 September 2023).
- Wickham, H.; Averick, M.; Bryan, J.; Chang, W.; McGowan, L.D.; François, R.; Grolemund, G.; Hayes, A.; Henry, L.; Hester, J.; et al. Welcome to the tidyverse. J. Open Source Softw. 2019, 4, 1686. [Google Scholar] [CrossRef]
- Kuhn, M. Building Predictive Models in R Using the caret Package. J. Stat. Softw. 2008, 28, 1–26. [Google Scholar] [CrossRef]
- Büntgen, U.; Egli, S.; Schneider, L.; von Arx, G.; Rigling, A.; Camarero, J.J.; Sangüesa-Barreda, G.; Fischer, C.R.; Oliach, D.; Bonet, J.A.; et al. Long-term irrigation effects on Spanish holm oak growth and its black truffle symbiont. Agric. Ecosyst. Environ. 2015, 202, 148–159. [Google Scholar] [CrossRef]
- Piñuela, Y.; Alday, J.G.; Oliach, D.; Castaño, C.; Bolaño, F.; Colinas, C.; Bonet, J.A. White mulch and irrigation increase black truffle soil mycelium when competing with summer truffle in young truffle orchards. Mycorrhiza 2021, 31, 371–382. [Google Scholar] [CrossRef] [PubMed]

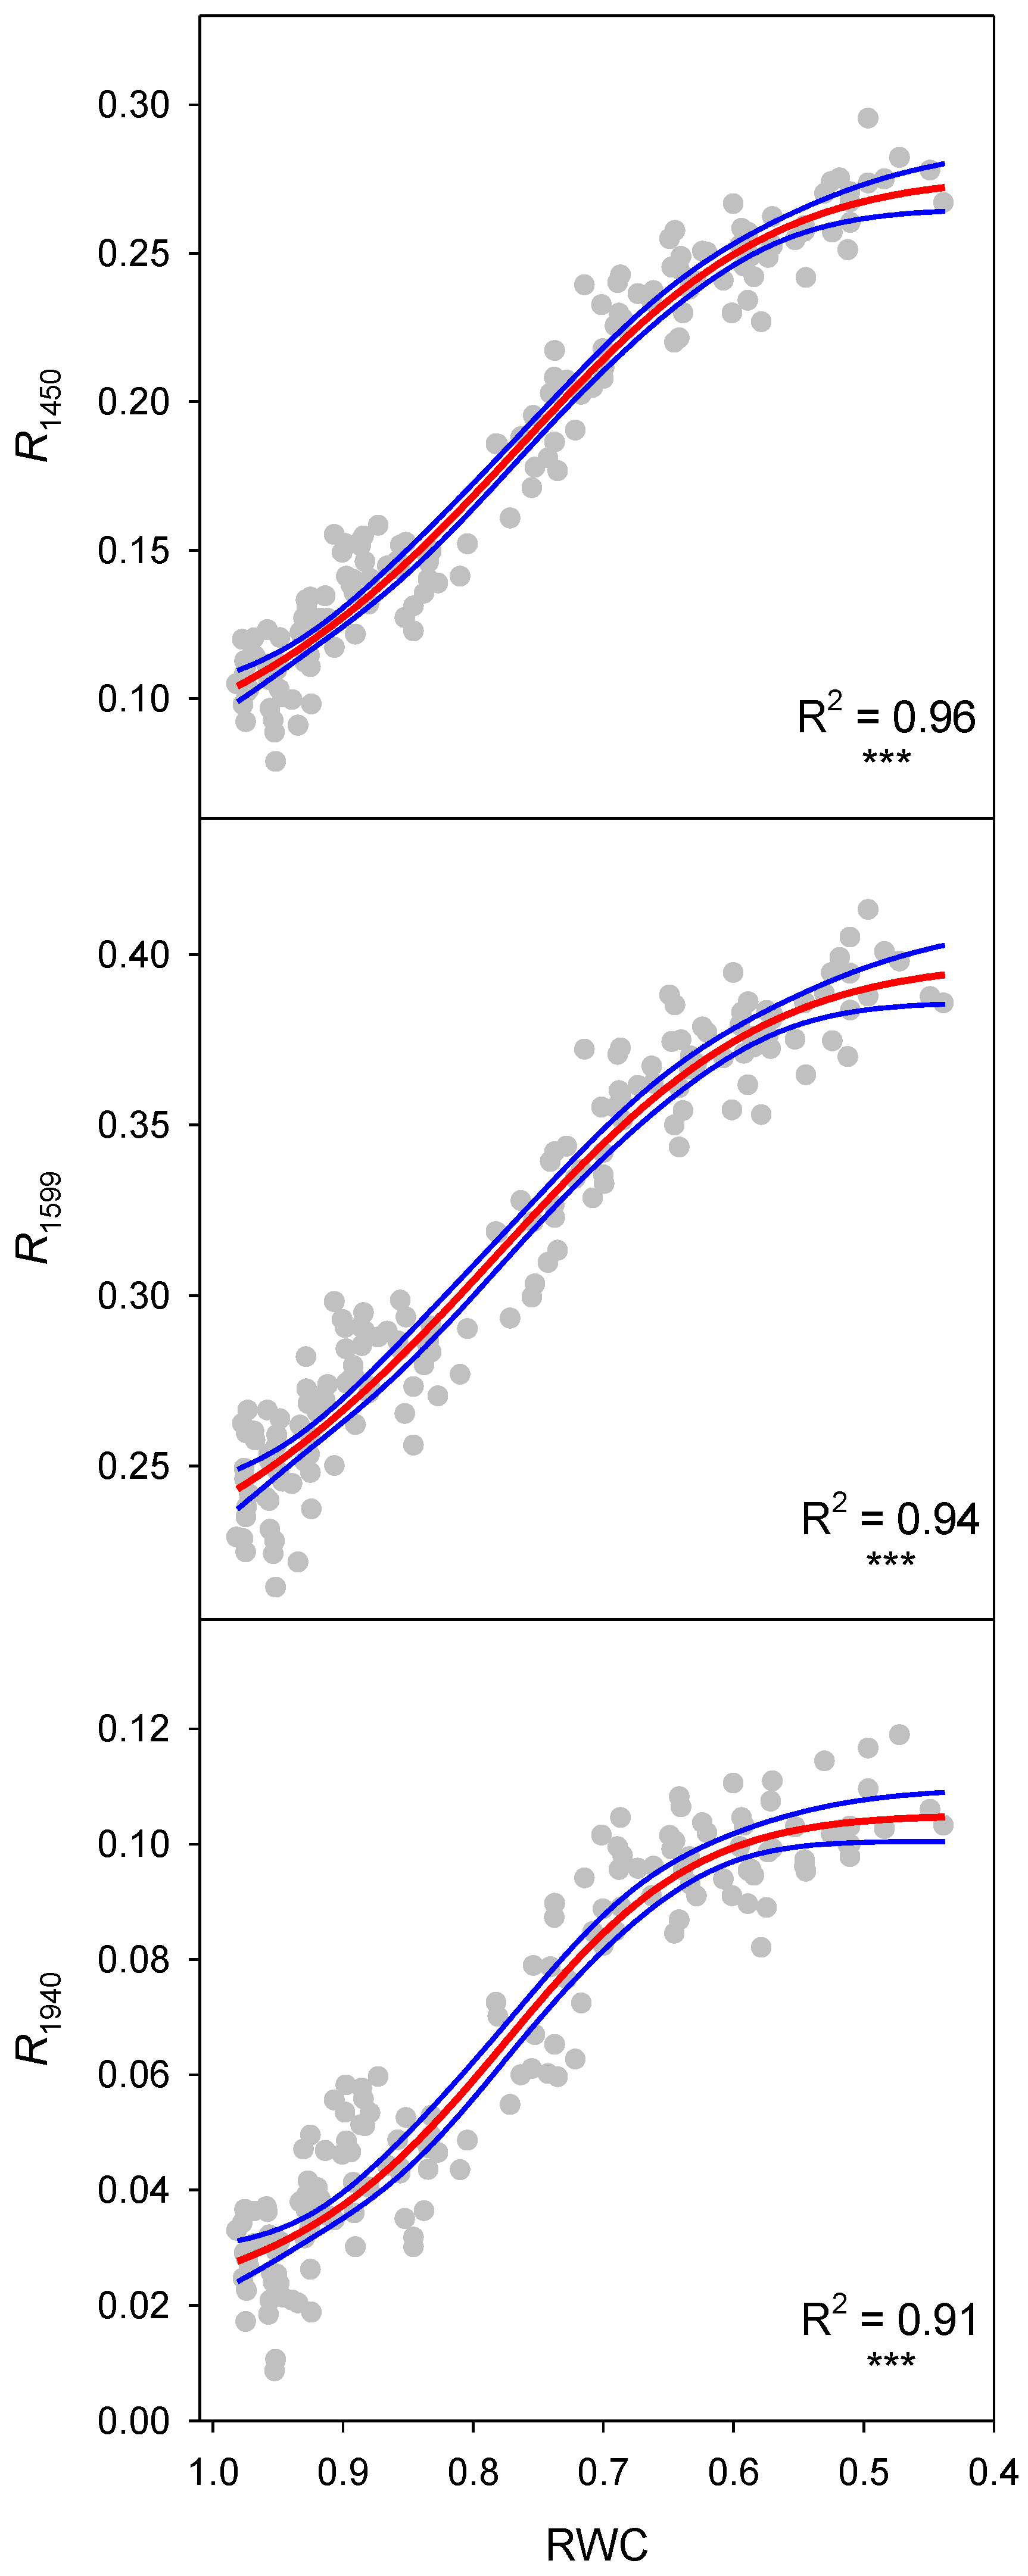
| Reflectance Index | n | F Ratio | p-Value | R2 | S.E. of Est. |
|---|---|---|---|---|---|
| R1450 | 160 | 1112 | <0.0001 | 0.96 | 0.0129 |
| R1599 | 160 | 766 | <0.0001 | 0.94 | 0.0139 |
| R1940 | 160 | 557 | <0.0001 | 0.91 | 0.0091 |
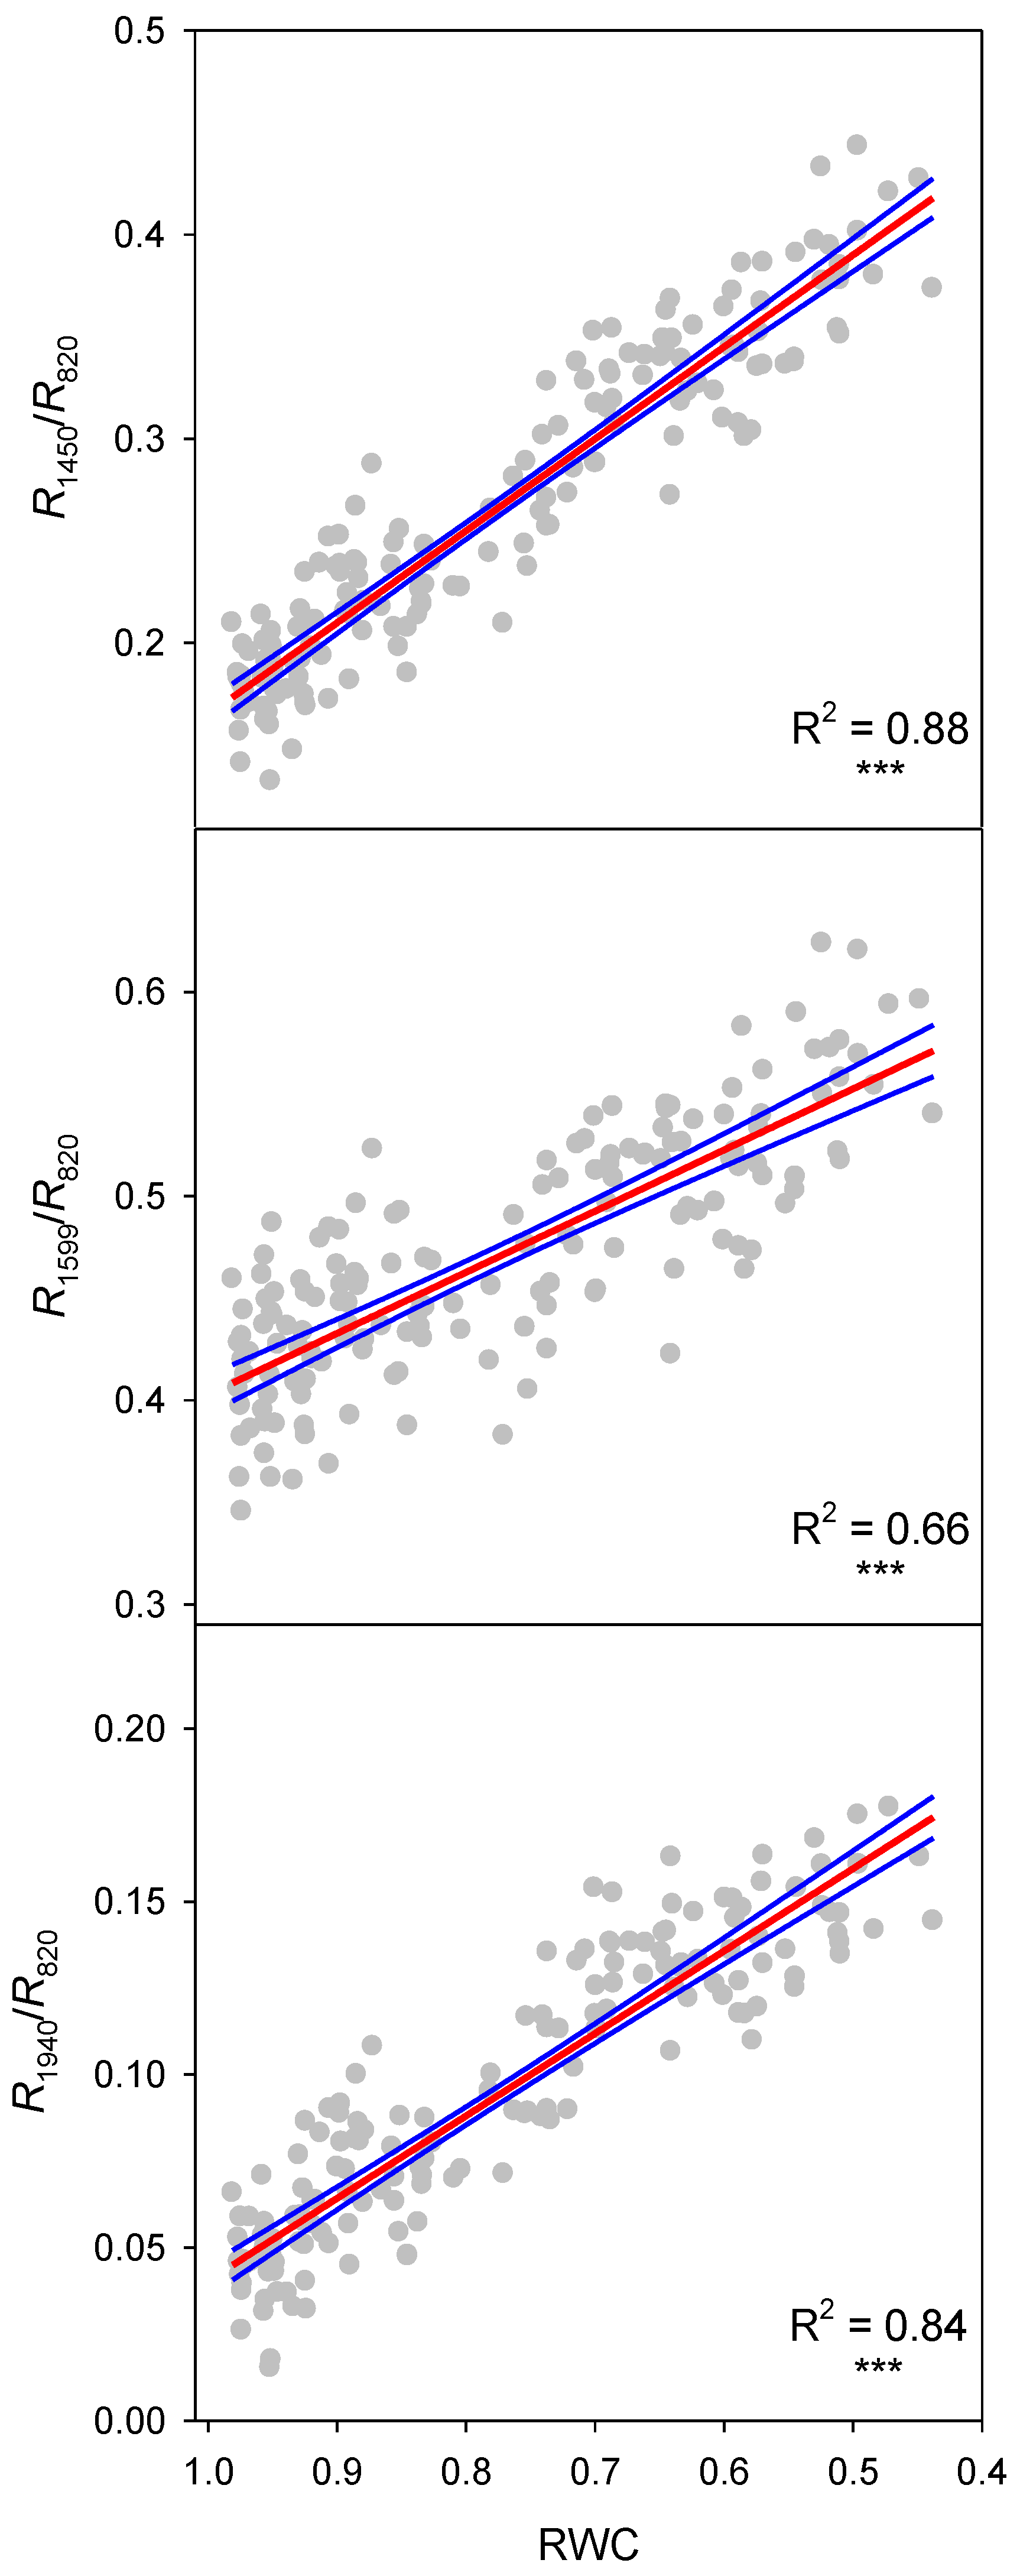
| R1450/R820 | 160 | 1200 | <0.0001 | 0.88 | 0.0259 |
| R1599/R820 | 160 | 301 | <0.0001 | 0.66 | 0.0343 |
| R1940/R820 | 160 | 833 | <0.0001 | 0.84 | 0.0164 |
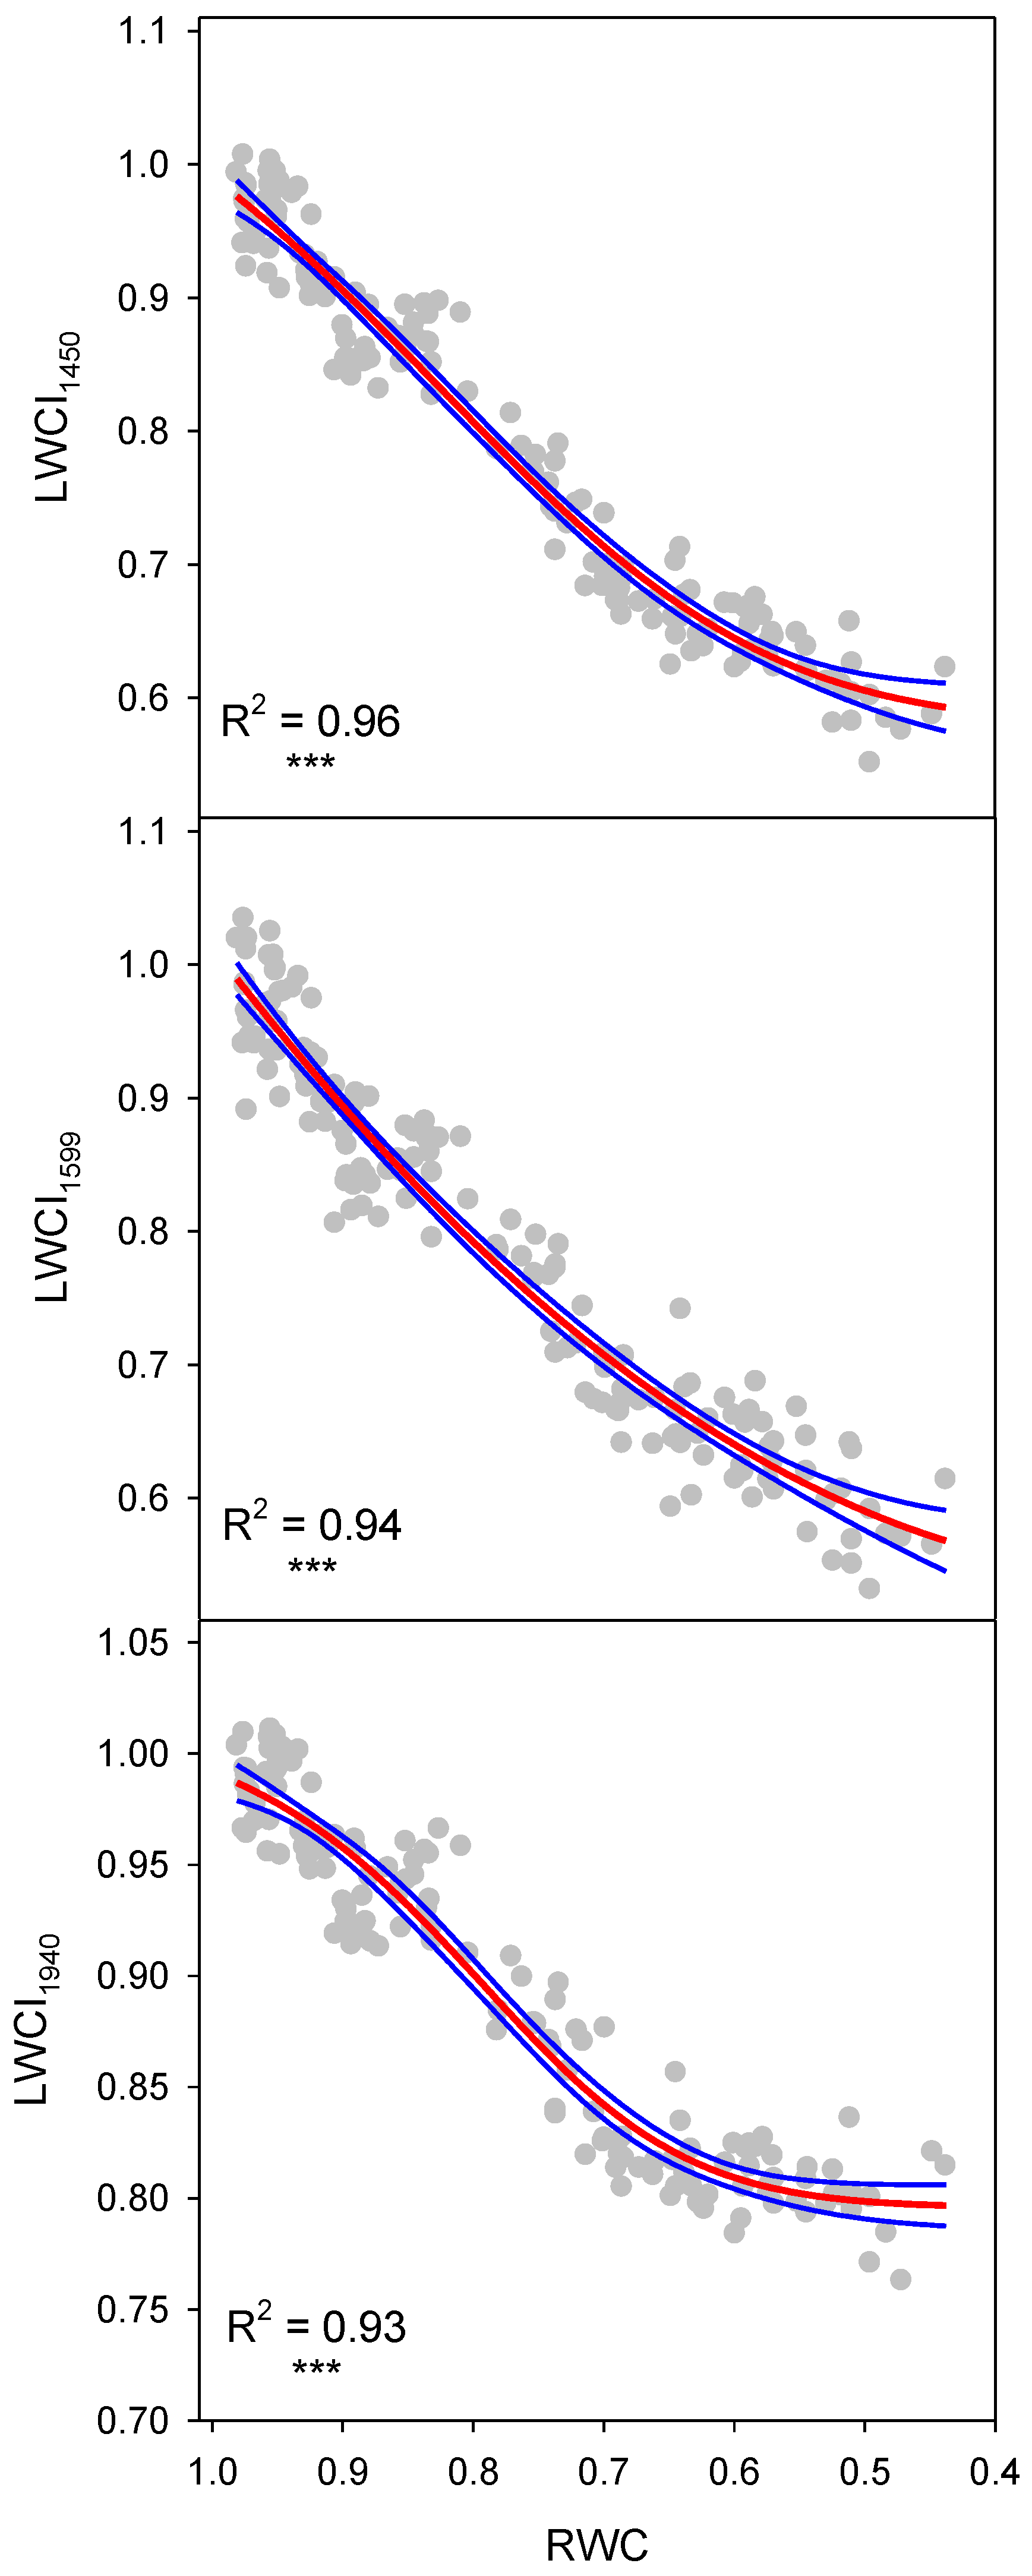
| LWCI1450 | 160 | 1213 | <0.0001 | 0.96 | 0.0273 |
| LWCI1599 | 160 | 1191 | <0.0001 | 0.94 | 0.0345 |
| LWCI1940 | 160 | 718 | <0.0001 | 0.93 | 0.0194 |
| Reflectance Index | n | F Ratio Slope | p-Value Slope | F Ratio Intercept | p-Value Intercept |
|---|---|---|---|---|---|
| R1450 | 16 | 0.36 | 0.9856 | 3.04 | 0.0004 |
| R1599 | 16 | 0.42 | 0.9703 | 4.67 | 0.0000 |
| R1940 | 16 | 0.33 | 0.9910 | 3.35 | 0.0001 |
| R1450/R820 | 16 | 0.74 | 0.7358 | 4.77 | 0.0000 |
| R1599/R820 | 16 | 1.26 | 0.2406 | 4.94 | 0.0000 |
| R1940/R820 | 16 | 0.61 | 0.8643 | 4.87 | 0.0000 |
| LWCI1450 | 16 | 0.36 | 0.9867 | 0.78 | 0.6938 |
| LWCI1599 | 16 | 0.32 | 0.9925 | 0.65 | 0.8267 |
| LWCI1940 | 16 | 0.54 | 0.9102 | 1.18 | 0.2949 |
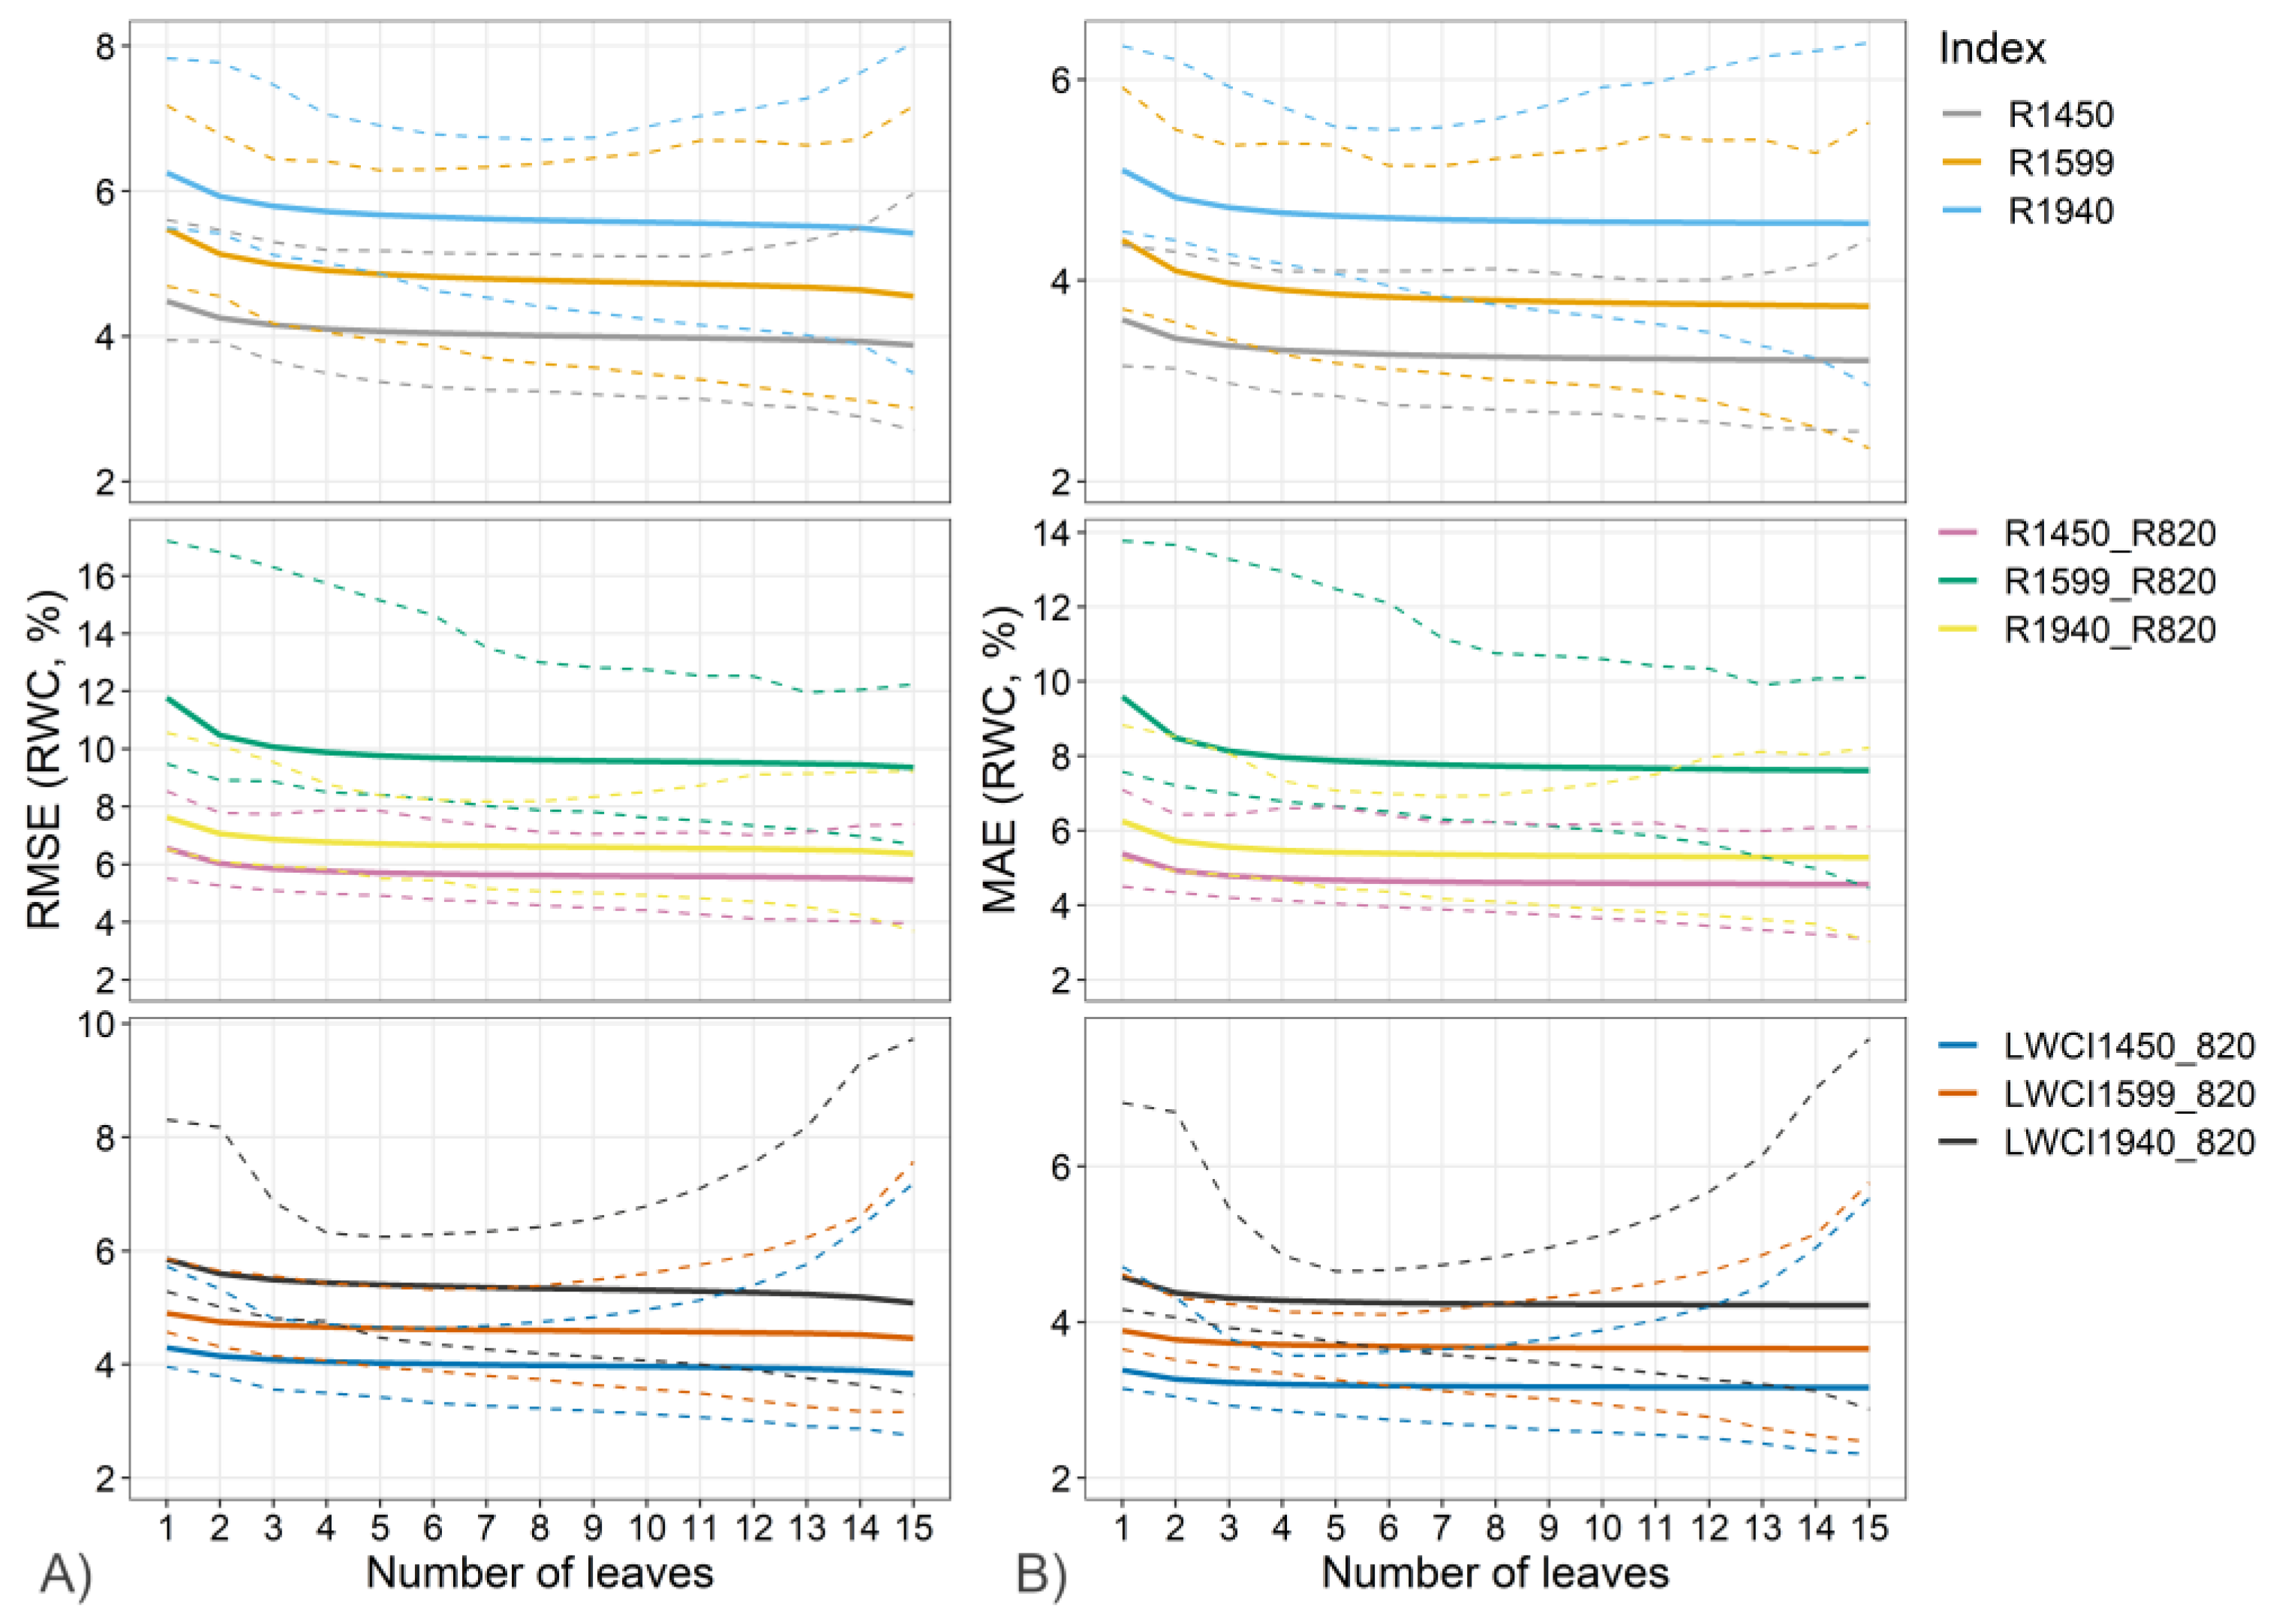
| Index | N cal | N val | R2 | RMSE | MAE |
|---|---|---|---|---|---|
| R1450 | 60 | 100 | 0.94 [0.93 0.96] | 4.0 [3.4 4.9] | 3.3 [2.8 3.8] |
| R1599 | 60 | 100 | 0.92 [0.90 0.94] | 4.8 [3.9 6.1] | 3.8 [3.1 4.9] |
| R1940 | 60 | 100 | 0.89 [0.87 0.91] | 5.6 [4.7 6.6] | 4.6 [4.0 5.4] |
| R1450/R820 | 60 | 100 | 0.89 [0.86 0.91] | 5.7 [4.8 7.2] | 4.6 [4.0 6.2] |
| R1599/R820 | 60 | 100 | 0.67 [0.60 0.75] | 9.7 [8.3 13.5] | 7.8 [6.5 11.0] |
| R1940/R820 | 60 | 100 | 0.84 [0.81 0.89] | 6.7 [5.5 8.2] | 5.4 [4.4 7.0] |
| LWCI1450 | 60 | 100 | 0.94 [0.93 0.96] | 4.0 [3.3 4.5] | 3.2 [2.8 3.5] |
| LWCI1599 | 60 | 100 | 0.92 [0.91 0.94] | 4.6 [3.9 5.2] | 3.7 [3.2 4.1] |
| LWCI1940 | 60 | 100 | 0.90 [0.87 0.93] | 5.4 [4.4 6.2] | 4.2 [3.7 4.7] |
Disclaimer/Publisher’s Note: The statements, opinions and data contained in all publications are solely those of the individual author(s) and contributor(s) and not of MDPI and/or the editor(s). MDPI and/or the editor(s) disclaim responsibility for any injury to people or property resulting from any ideas, methods, instructions or products referred to in the content. |
© 2023 by the authors. Licensee MDPI, Basel, Switzerland. This article is an open access article distributed under the terms and conditions of the Creative Commons Attribution (CC BY) license (https://creativecommons.org/licenses/by/4.0/).
Share and Cite
Peguero-Pina, J.J.; Sancho-Knapik, D.; Ferrio, J.P.; López-Ballesteros, A.; Ruiz-Llata, M.; Gil-Pelegrín, E. Reevaluating Near-Infrared Reflectance as a Tool for the Study of Plant Water Status in Holm Oak (Quercus ilex subsp. rotundifolia). Forests 2023, 14, 1825. https://doi.org/10.3390/f14091825
Peguero-Pina JJ, Sancho-Knapik D, Ferrio JP, López-Ballesteros A, Ruiz-Llata M, Gil-Pelegrín E. Reevaluating Near-Infrared Reflectance as a Tool for the Study of Plant Water Status in Holm Oak (Quercus ilex subsp. rotundifolia). Forests. 2023; 14(9):1825. https://doi.org/10.3390/f14091825
Chicago/Turabian StylePeguero-Pina, José Javier, Domingo Sancho-Knapik, Juan Pedro Ferrio, Ana López-Ballesteros, Marta Ruiz-Llata, and Eustaquio Gil-Pelegrín. 2023. "Reevaluating Near-Infrared Reflectance as a Tool for the Study of Plant Water Status in Holm Oak (Quercus ilex subsp. rotundifolia)" Forests 14, no. 9: 1825. https://doi.org/10.3390/f14091825
APA StylePeguero-Pina, J. J., Sancho-Knapik, D., Ferrio, J. P., López-Ballesteros, A., Ruiz-Llata, M., & Gil-Pelegrín, E. (2023). Reevaluating Near-Infrared Reflectance as a Tool for the Study of Plant Water Status in Holm Oak (Quercus ilex subsp. rotundifolia). Forests, 14(9), 1825. https://doi.org/10.3390/f14091825